New cathinone-derived designer drugs 3-bromomethcathinone ... · FMC phase I and phase II...
36
Aus der Abteilung Experimentelle und Klinische Toxikologie Universität des Saarlandes Homburg/Saar Leiter: Prof. Dr. Dr. h.c. Hans H. Maurer New cathinone-derived designer drugs 3-bromomethcathinone and 3- fluoromethcathinone: studies on their metabolism in rat urine and human liver microsomes using GC-MS and LC-high-resolution MS and their detectability in urine Dissertation zur Erlangung des Grades eines Doktors der Medizin der Medizinischen Fakultät der UNIVERSITÄT DES SAARLANDES 2012 vorgelegt von Christian Vollmar geboren am 29.11.1985 in Zweibrücken
Transcript of New cathinone-derived designer drugs 3-bromomethcathinone ... · FMC phase I and phase II...

Aus der Abteilung Experimentelle und Klinische Toxikologie Universität des Saarlandes
Homburg/Saar Leiter: Prof. Dr. Dr. h.c. Hans H. Maurer
New cathinone-derived designer drugs 3-bromomethcathinone and 3-fluoromethcathinone: studies on their metabolism in rat urine and human
liver microsomes using GC-MS and LC-high-resolution MS and their detectability in urine
Dissertation zur Erlangung des Grades eines Doktors der Medizin der Medizinischen Fakultät der UNIVERSITÄT DES SAARLANDES
2012
vorgelegt von
Christian Vollmar
geboren am 29.11.1985 in Zweibrücken

Teile dieser Doktorarbeit sind Gegenstand folgender Publikation:
M. R. Meyer, C. Vollmar, A. E. Schwaninger, and H. H. Maurer: New cathinone-derived designer drugs 3-bromomethcathinone and
3-fluoromethcathinone: studies on their metabolism in rat urine and human liver microsomes using GC-MS and LC-high-resolution MS and their detectability
in urine: J Mass Spectrom, 2012:47, 253-262

Table of contents
1 ZUSAMMENFASSUNG .................................................................. 1
2 SUMMARY ................................................................................... 2
3 INTRODUCTION ............................................................................ 3 3.1 Chemical characterization of 3-‐BMC and 3-‐FMC ...................................................................... 3 3.2 Effects of 3-‐BMC and 3-‐FMC ............................................................................................................. 4 3.3 Former publications on 3-‐BMC and 3-‐FMC ................................................................................ 5 3.4 Aim of the present work ................................................................................................................... 6
4 EXPERIMENTAL PROCEDURES / MATERIAL AND METHODS .......... 7 4.1 Chemicals and reagents .................................................................................................................... 7 4.2 Urine samples ...................................................................................................................................... 7 4.3 Sample preparation ........................................................................................................................... 7 4.3.1 Sample preparation for identification of phase I metabolites by GC-‐MS and LC-‐HRMS . 7 4.3.2 Sample preparation for identification of phase II metabolites by HR-‐ESI-‐MS .................... 8 4.3.3 Sample preparation for systematic toxicological analysis (STA) by GC-‐MS ........................ 8
4.4 Enzymatic Part ..................................................................................................................................... 9 4.4.1 Microsomal Incubations ............................................................................................................................. 9 4.4.2 Initial screening studies .............................................................................................................................. 9 4.4.3 Kinetic studies ................................................................................................................................................. 9 4.4.4 Calculation of relative activity factors, contributions, and percentages of net clearance
........................................................................................................................................................................................ 10 4.5 GC-‐MS / LC-‐HRMS settings ............................................................................................................ 11 4.5.1 GC-‐MS apparatus for identification oft the Phase I metabolites ............................................ 11 4.5.2 GC-‐MS apparatus and procedure for STA ........................................................................................ 11 4.5.3 LC-‐HRMS apparatus for identification of Phase I and II metabolites and for
microsomal incubations ..................................................................................................................................... 12
5 RESULTS AND DISCUSSION ......................................................... 13 5.1 Identification of the Phase I metabolites by GC-‐MS ............................................................. 13 5.1.1 3-‐Bromomethcathinone .......................................................................................................................... 13 5.1.2 3-‐Fluoromethcathinone ........................................................................................................................... 16
5.2 HR-‐ESI-‐MS Results ........................................................................................................................... 20

5.2.1 Confirmation of the Phase I metabolites by HR-‐ESI-‐MS ............................................................ 20 5.2.2 Identification of the Phase II metabolites by HR-‐ESI-‐MS .......................................................... 20
5.3 Proposed metabolic pathways .................................................................................................... 21 5.3.1 3-‐Bromomethcathinone .......................................................................................................................... 21 5.3.2 3-‐Fluoromethcathinone ........................................................................................................................... 22
5.4 Toxicological detection of 3-‐BMC and 3-‐FMC by GC-‐MS or LC-‐MSn ................................. 22 5.5 Enzymatic part .................................................................................................................................. 23 5.5.1 Initial CYP screening ................................................................................................................................. 23 5.5.2 Kinetic studies .............................................................................................................................................. 25
6.1 In vivo vs. in vitro Phase I metabolism – the role of ADH .................................................... 26 6.2 Phase II metabolism ....................................................................................................................... 27 6.3 Possible CYP interactions ............................................................................................................. 27 6.4 Prove of intake ................................................................................................................................. 27
7 REFERENCES ............................................................................... 28
8 ABBREVIATIONS ......................................................................... 31
9 DANKSAGUNG ........................................................................... 32

1 ZUSAMMENFASSUNG
1
1 ZUSAMMENFASSUNG
3-Bromomethcathinon (3-BMC) und 3-Fluoromethcathinon (3-FMC) sind zwei neue
Designerdrogen die zu den Neuerscheinungen der letzten Jahre auf dem weltweiten
Drogenmarkt zählen und u.a. 2009 in Israel beschlagnahmt wurden. Beide Substanzen finden
Verwendung als sogenannte „Recreational Drugs“, können über das Internet als sogenannte
„Badesalze“ oder „Düngemittel“ bezogen werden und traten auch in Deutschland auf.
Ziel dieser Studie ist die Identifizierung der Phase I und Phase II Metabolite in Rattenurin
sowie menschlichen Lebermikrosomen unter Verwendung von Gaschromatographie-
Massenspektrometrie (GC-MS) oder Flüssig-Chromatographie-Hochauflösender-
Massenspektrometrie (LC-HRMS) Techniken. Nach Extraktion der Urinproben, jeweils mit
und ohne Konjugatspaltung, erfolgte die Auftrennung und Identifikation der Metaboliten
mittels GC-MS und LC-HRMS. Die nachgewiesenen Hauptschritte im Stoffwechsel waren
demnach die N-Demethylierung, die Reduktion der Ketogruppe zum korrespondierenden
Alkohol, die Hydroxylierung des aromatischen Ringsystems und Kombinationen dieser
Schritte. Bezüglich 3-Bromomethcathinon war N-Demethyl-dihydro-3-bromomethcathinon
der Hauptmetabolit in vivo, für 3-Fluoromethcathinon waren dies Hydroxy-3-
fluoromethcathinon und N-Demethyl-dihydro-3-fluoromethcathinon. Die
Elementarzusammensetzung der identifizierten Metabolite wurden mittels LC-HRMS
verifiziert. Auch wurden die korrespondierenden Phase II Metaboliten unter Verwendung der
LC-HRMS identifiziert.
Die beiden Substanzen konnten in der sogenannten „Systematisch toxikologischen Analyse“
(STA) - nach Verabreichung einer von Konsumenten vermutlich gebräuchlichen Dosis an die
Ratten - im Urin nachgewiesen werden.
Schlussendlich war ein weiteres Ziel dieser Arbeit die Identifizierung der menschlichen
Cytochrom P450 Isoenzyme, welche die wichtigsten Stoffwechselschritte katalysieren. Dies
ermöglicht Schlussfolgerungen bezüglich Medikamenteninteraktionen oder genetischen
Variationen, die für Konsumenten von Stoffgemischen, welche diese Designerdrogen
enthalten, von Bedeutung sein können. Den Cytochrom P-450 (CYP) Enzym-basierten
Kinetikstudien zufolge war CYP2B6 für die N-Demethylierung von sowohl 3-
Bromomethcathinon als auch von 3-Fluoromethcathinon das in vivo wichtigste Enzym.

2 SUMMARY
2
2 SUMMARY
Among the substances of abuse that appeared during the last years on the worldwide drug
market are 3-bromomethcathinone (3-BMC) and 3-fluoromethcathinone (3-FMC), two new
designer drugs, which were seized 2009 in Israel among others. Both substances, used as
recreational drugs, can be purchased online as so called “bath salts” or “plant feeders” and
appeared also in Germany. The aim of the presented study was to identify the 3-BMC and 3-
FMC phase I and phase II metabolites in rat urine and human liver microsomes using gas
chromatography-mass spectrometry (GC-MS) or liquid chromatography-high resolution mass
spectrometry (LC-HRMS) techniques. Rat urine samples were extracted with and without
enzymatic cleavage of the conjugates. Separation and identification of the metabolites was
executed via GC-MS and LC-HRMS. The main metabolic steps were N-demethylation,
reduction of the keto group to the corresponding alcohol, hydroxylation of the aromatic
system and combinations of these steps. For 3-BMC, the main in vivo metabolites were N-
demethyl-dihydro-3-BMC, for 3-FMC hydroxy-3-FMC and N-demethyl-dihydro-3-FMC.
LC-HRMS verified the elemental composition of the metabolites postulated by GC-MS
interpretation. The corresponding Phase II metabolites were also identified using the LC-
HRMS analysis approach. Additionally, both compounds could be detected according to the
standard systematic toxicological analysis (STA) in rat urine after administration of a
suspected recreational dose to rats.
Another aim was the identification of the human cytochrome P450 (CYP) isoenzymes
catalyzing the main metabolic step allowing conclusions on drug-drug interactions or genetic
variations gathering importance for humans consuming drugs containing these designer drugs.
According to the CYP enzyme kinetic studies, CYP2B6 was the most relevant enzyme for
both the N-demethylation of 3-BMC and 3-FMC.

3 INTRODUCTION
3
3 INTRODUCTION
In recent years, many new substances appeared on the drugs of abuse market. Among these
compounds were new cathinone derivates that are synthesized and sold via the internet to a
worldwide customer base as so called new “legal highs”, declared as “plant feeders” or “bath
salts”.
The added ingredients of the compounds sold online are caffeine, lidocaine, procaine, or often
even unknown [1].
Another problem is the use of trivial names for these substances of abuse, so called “street
names”, leading to the risk of misinterpretation because of names sounding too similar, e.g.
“Mephedrone” (4-Methylmethcathinone), “Methedrone” (4-Methoxymethcathinone),
“Flephedrone” (4-Fluoromethcathinone) or “Fluphedrone” (3-Fluoromethcathinone) [2].
Last but not least, due to the fact that the producers can not be controlled and are not subject
of any restriction, ingredients get replaced or new agents are added but the compound is still
sold under the identical name, as it is discussed in several online forums, e.g. for the
compound “charge+” that will also be discussed later because of its agent 3-FMC [3].
In conclusion, the risks for health and possible addiction can not be estimated and seem to be
very high as, in the worst case, a recreational user of these online-sold drugs of abuse is
consuming an unknown amount of a compound of unknown main agent with unknown added
substances.
In 2009, several of these psychoactive substances were seized by the Israeli police, among
others 3-BMC and 3-FMC (fluphedrone). Samples were sent to our institute with request for
further research.
3.1 Chemical characterization of 3-‐BMC and 3-‐FMC
3-BMC and 3-FMC are synthetic derivates of cathinone, a natural stimulant with effects
similar to amphetamine, which can be synthesized and also extracted from fresh leaves of
Catha Edulis [4].
The only difference concerning the chemical structure of both substances lies within the
different ring-substituting heteroatom in ring position three, which is bromine in the case of 3-
BMC and fluorine for 3-FMC as depicted in Fig. 1.
As these substances are cathinone derivates, a characteristic keto-group can be found in beta
position. The alpha carbon is the chiral center of the two analytes.

4
The molecular formula for 3-BMC is C10H12BrNO with a nominal molecular mass of 242
g/mol, according to the natural appearance of the two isotopes 79Br, accounting for 50.69%
and 81Br, making up 49.31% of the natural bromine appearance, leading to a molecular
weight of 241 Da or 243 Da, respectively. The IUPAC name of 3-BMC is 1-(3-
bromophenyl)-2-(methylamino)propan-1-one.
Concerning 3-FMC, the molecular formula is C10H12FNO with a nominal molecular mass of
181 g/mol and 1-(3-fluorophenyl)-2-(methylamino)propan-1-one as IUPAC name.
Figure 1. Chemical structure of 3-bromomethcathinone (left) and 3-fluoromethcathinone (right); numbering according to the IUPAC nomenclature (blue), alpha-beta numbering in relation to functional group (red)
3.2 Effects of 3-‐BMC and 3-‐FMC
Except for 3-BMC, for which was shown to act as a serotonin and norepinephrine reuptake
inhibitor [5] with more intense antidepressant than stimulating properties [6], there is no
scientific knowledge about the effects of 3-BMC and 3-FMC on the human organism after
consumption.
Due to their chemical similarity to mephedrone (4-methylmethcathinone), the most popular of
the cathinone derivates [7], and according to users’ reports found in online forums, both
should cause similar stimulant and empathogenic effects as mephedrone [8].
In a study published by Winstock et al. [9], mephedrone consumers indicated the most
prevalent effects: increased energy, euphoria, talkativeness, urge to move and do things,
empathy, bruxism, body sweats, no appetite for food, heart racing, feeling restless or anxious,
increased sexual desire, forgetting things, overheating, tremor in extremities, blurred vision
and improved concentration. Described withdrawal effects were tiredness, insomnia at end of
session, nasal congestion, inability to concentrate, irritability, lost memory of mephedrone
session, depression, being in an emotional state and anxiety.

5
Trip reports which can be found in numerous online forums revealed that 3-BMC and 3-FMC
seem to be consumed orally, smoked, nasal inhaled or injected intravenously [8].
These compounds are scheduled in Israel, Australia, New Zealand and other countries, but not
in Germany (so far -03/2012).
They are still available via the internet, e.g. as part of a compound named “Charge+” or as
agent in capsules named “Lift”, “Sub Coca Dragon”, “High Spirit” or “Neo Dove 2” [2,10].
Fig. 2 shows pictures of “Charge+” and “Lift”, two recreational drugs whose main agent is 3-
FMC.
Figure 2. Seized “Charge+“ (left) and online bought capsules called “Lift“ (right); both containing 3-FMC
3.3 Former publications on 3-‐BMC and 3-‐FMC
As mentioned above, 3-BMC was already object of research in a study showing 3-BMC’s
ability to inhibit the reuptake of serotonin and norepinephrine by Foley and Cozzi [5, 6].
Archer published GC-MS and NMR data on the three fluoromethcathinone isomers 2-FMC,
3-FMC and 4-FMC. He identified 3-FMC as the agent of “Lift”, “Sub Coca Dragon”, “High
Spirit” and “Neo Dove 2” by using the NMR technique which is able to distinguish between
the three isomers because of differences in the values in the aromatic region of the 1H NMR
spectra whereas the GC-MS technique was not able to differentiate the isomers due to similar
fragmentation and retention times [2].
Westpfahl et al. presented GC-MS data of 3-FMC and some of its derivatives as well as NMR

6
data by analyzing and identifying 3-FMC as main agent of an in 2009 in Baden Württemberg
(Germany) seized compound named “Charge+” [10].
A Phase I metabolism study was operated by Pawlik et al. using rabbit liver slices, indicating
N-demethylation and ring-hydroxylation as the first metabolic steps [11].
3.4 Aim of the present work
In clinical and forensic toxicology, screening for and determination of drugs (of abuse) is an
important task. Sophisticated general screening procedures allow detection of a series of drug
classes in one step [12,13].
The aim of this study was to identify the phase I and phase II metabolites of 3-BMC and 3-
FMC in rat urine as well as in human liver microsomes by GC-MS and LC-HRMS.
Additionally, the aim of the work was to identify the human CYP isoenzymes responsible for
the main metabolic steps of these compounds.
Finally, targets for detectability and identification of 3-BMC and 3-FMC in urine by the
standard systematic toxicological analysis (STA) using GC-MS or LC-MSn should be defined
to detect an intake of 3-BMC and 3-FMC.

4 EXPERIMENTAL PROCEDURES / MATERIAL AND METHODS
7
4 EXPERIMENTAL PROCEDURES / MATERIAL AND METHODS
4.1 Chemicals and reagents
3-BMC and 3-FMC were provided by the analytical laboratory oft he DIFS Israel Police for
research purposes. Isolute HCX cartridges (130 mg, 3 mL) were obtained from Biotage
(Uppsala, Sweden). NADP+ was obtained from Biomol (Hamburg, Germany), and isocitrate
and isocitrate dehydrogenase from Sigma (Taufkirchen, Germany). All other chemicals and
reagents were obtained from E. Merck, Darmstadt (Germany) and were of analytical grade.
The following microsomes were from Gentest and delivered by NatuTec (Frankfurt/Main,
Germany): baculovirus-infected insect cell microsomes (Supersomes), containing 1 nmol/mL
of human cDNA-expressed CYP1A2, CYP2A6, CYP2B6, CYP2C8, CYP2C9, CYP2C19,
CYP2D6, CYP2E1 (2 nmol/mL), CYP3A4, or CYP3A5 and pooled human liver microsomes
(pHLM, 20 mg microsomal protein/mL, 400 pmol total CYP/mg protein). After delivery, the
microsomes were thawed at 37°C, aliquoted, snap-frozen in liquid nitrogen, and stored at -
80°C until use.
4.2 Urine samples
The investigations were performed using urine of male rats (Wistar, Charles River, Sulzfleck,
Germany) for toxicological diagnostic reasons according to the corresponding German law
(http://www.gesetze-im-internet.de/tierschg/). They were administered in an aqueous
suspension by gastric intubation of a single 20mg/kg body mass dose of 3-BMC or 3-FMC for
identification oft the metabolites and a single 1 mg/kg body mass dose each for toxicological
analysis. The rats were housed in metabolism cages for 24 h, having water ad libitum. Urine
was collected separately from the faeces over a 24-h period. All samples were directly
analyzed and then stored at -20°C. Blank urine samples were collected before drug
administration to check whether the samples were free of interfering compounds.
4.3 Sample preparation
4.3.1 Sample preparation for identification of phase I metabolites by GC-‐MS and LC-‐HRMS
A 2.5 mL portion of urine was adjusted to pH 5.2 with acetic acid (1 M, approximately 50 µl)
and incubated at 56°C for 1.5 h with 50 µl of a mixture (100 000 Fishman units/mL) of
glucuronidase (EC No. 3.2.1.31, E. Merck, Darmstadt, Germany) and arylsulfatase (EC No.
4 EXPERIMENTAL PROCEDURES / MATERIAL AND METHODS
8
3.1.6.1, E. Merck, Darmstadt, Germany), from Helix Pomatia L. The urine sample was then
diluted with 2.5 mL of water and loaded on a HCX cartridge, previously conditioned with
1 mL of methanol and 1 mL of water. After passage of the sample, the cartridge was washed
with 1 mL of water, 1 mL of 0.01 M hydrochloric acid, and again with 1 mL of water. The
retained non-basic compounds were first eluted into a 1.5 mL reaction vial with 1 mL of
methanol (fraction 1), whereas the basic compounds were eluted in a second step into a
different vial with 1 mL of a freshly prepared mixture of methanol/aqueous ammonia 32%
(98:2 v/v, fraction 2). The eluates were gently evaporated to dryness under a stream of
nitrogen at 56°C and reconstituted in 50 µL of acetonitrile for LC-HRMS. A 10 µL aliquot
was injected into the LC (only underivatized) or 1 µL into GC.
4.3.2 Sample preparation for identification of phase II metabolites by HR-‐ESI-‐MS
For elucidating the formation of glucuronides and sulfates, 200 µL of urine was mixed with
200 µL of acetonitrile for protein precipitation, centrifuged at 14.000g for 5 min and the
supernatant was transferred into an autosampler vial. A 10 µL aliquot of this solution was
injected into the LC system.
4.3.3 Sample preparation for systematic toxicological analysis (STA) by GC-‐MS
Systematic toxicological analysis procedure (hydrolysis, extraction and microwave-assisted
acetylation) for urine was used according to published procedures [12,14]. Briefly, the samples
(5 mL) were divided into two aliquots, and one part was submitted to acid hydrolysis.
Thereafter, the sample was adjusted to pH 8-9 and the other aliquot of untreated urine was
added. This mixture was extracted with a dichloromethane-isopropanol-ethyl acetate mixture
(1:1:3 v/v/v) and the organic layer was evaporated to dryness. The residue was acetylated
with an acetic anhydride-pyridine mixture under microwave irradiation. After evaporation of
the derivatization mixture, the residue was dissolved in 100 µL of methanol, and 2 µL was
injected into the GC-MS system.
4 EXPERIMENTAL PROCEDURES / MATERIAL AND METHODS
9
4.4 Enzymatic Part
4.4.1 Microsomal Incubations
Microsomal incubations were performed at 37°C with 250 µM 3-BMC/3-FMC with
CYP1A2, CYP2A6, CYP2B6, CYP2C8, CYP2C9, CYP2C19, CYP2D6, CYP2E1, CYP3A4,
or CYP3A5 for 30 min. Besides enzymes and substrate, incubation mixtures (final volume: 50
µL) consisted of 90 mM phosphate buffer (pH 7.4), 5 mM Mg2+, 5 mM isocitrate, 1.2 mM
NADP+, 0.5 U/mL isocitrate dehydrogenase, and 200 U/mL superoxide dismutase. For
incubations with CYP2A6 or CYP2C9, phosphate buffer was replaced with 45 mM and 90
mM Tris-buffer, respectively, according to the Gentest manual. Reactions were started by
addition of the ice-cold microsomes and stopped with 50 µL of an ice-cold mixture of
acetonitrile with 0.1% formic acid, containing the internal standard (metamfepramone, 10
µM). The solution was centrifuged for 2 min at 14000 g, 50 µL oft he supernatant phase was
transferred to an autosampler vial and injected into the LC-HRMS apparatus for analysis, and
LC-HRMS conditions were chosen as described below.
4.4.2 Initial screening studies
Incubations were performed with 250 µM of 3-BMC or 3-FMC and 50 pmol/mL of CYP1A2,
CYP2A6, CYP2B6, CYP2C8, CYP2C9, CYP2C19, CYP2D6, CYP2E1, CYP3A4, or
CYP3A5 for 60 min.
4.4.3 Kinetic studies
Kinetic constants of N-demethylation were derived from incubations with an incubation time
of 10 min 30 pmol/mL (P450s) protein concentration. Incubation time and enzyme
concentration were chosen to be within a linear range of metabolite formation. The substrate
concentrations were used as provided in Table 1.
Enzyme kinetic constants were estimated by non-linear curve-fitting using GraphPad Prism
5.00 software (San Diego, CA). The Michaelis-Menten equation (Eqn (1)) was used to
calculate apparent Km and Vmax values for single-enzyme systems.
][][max
SKSVV
m +
×= (1)

4 EXPERIMENTAL PROCEDURES / MATERIAL AND METHODS
10
Eadie-Hofstee plots were used to check for biphasic kinetics [15]. If the Eadie-Hofstee plot
indicated biphasic kinetics, equation (1) and the alternative equation (2) for a two site binding
model were applied to the respective data. If equation (2) was found to fit the data
significantly better (F-test, p < 0.05), biphasic kinetics were assumed.
Table 1. Substrate concentrations used for microsomal incubations [µM]
3-FMC
3-BMC
CYP2B6 CYP2D6 CYP2C19 CYP2B6 CYP2D6 25 1 1 75 1 75 10 10 125 10
125 25 75 250 25 250 75 125 500 75 500 125 250 750 125 750 250 500 1000 250
1000 500 750 1500 500 1500 750 1000
1000 1500
4.4.4 Calculation of relative activity factors, contributions, and percentages of net
clearance
The relative activity factor (RAF) approach [16-18] was used to account for differences in
functional levels of redox partners between the two enzyme sources. The turnover rates (TR)
of CYP2C19 (probe substrate (PS) S-mephenytoin), CYP2D6 (PS bufuralol) and CYP2B6
(PS 7-ethoxy-4-trifluoromethylcoumarin) in insect cell microsomes (ICM) and HLM were
taken from the supplier's data sheets. The RAFs were calculated according to equation (3).
][][
][][
2,
2max,
1,
1max,
SKSV
SKSV
Vmm +
×+
+
×=
RAFenzyme =TRPS in HLM TRPS in ICM
(2)
(3)
4 EXPERIMENTAL PROCEDURES / MATERIAL AND METHODS
11
The enzyme velocities Venyzme (see equation (1)) for the respective metabolic reactions were
calculated at different substrate concentrations and were then multiplied with the
corresponding RAF leading to a value, which is defined as 'contribution'. The Vmax and the
Km values (equation (1)) were obtained from the incubations with cDNA-expressed P450s.
From these corrected activities (contributions) the percentages of net clearance by a particular
P450 at a certain substrate concentration can be calculated according to equation (5):
4.5 GC-‐MS / LC-‐HRMS settings
4.5.1 GC-‐MS apparatus for identification oft the Phase I metabolites
The extracts were analyzed using a Hewlett Packard (HP, Agilent, Waldbronn, Germany)
5890 Series II GC combined with an HP 5972 MSD mass spectrometer and an HP MS
ChemStation (DOS series) with HP G1034C software Version C03.00. The GC conditions
were as follows: splitless injection mode; column, HP-1 capillary (12m x 0.2mm I.D.), cross-
linked methyl silicone, 330 nm film thickness; injection port temperature, 280 °C; carrier gas,
helium; flow rate, 1 mL/min; column temperature, programmed from 100 °C to 310 °C at 15
°/min, initial time 3 min, final time 8 min. The MS conditions were as follows: full-scan
mode, m/z 50-550 u; EI mode, ionization energy, 70 eV; ion source temperature, 220 °C;
capillary direct interface, heated at 280 °C.
4.5.2 GC-‐MS apparatus and procedure for STA
An HP 5890 Series II gas chromatograph combined with an HP 5972A MSD mass
spectrometer was used. The GC conditions were the same as fort he metabolism studies with
the exception of temperature, which was programmed from 100 °C to 310 °C at 30 °/min. The
enzymeenzymeenzyme VRAFoncontributi ×=
100[%] ×=∑ enzyme
enyzmeenyzme oncontributi
oncontributiclearance
(4)
(5)

4 EXPERIMENTAL PROCEDURES / MATERIAL AND METHODS
12
MS conditions were as follows: full-scan mode, m/z 50-550 u; EI mode, ionization energy, 70
eV; ion source temperature, 220 °C; capillary direct interface, heated at 260 °C.
For toxicological detection of acetylated drugs and their metabolites, mass chromatography
was used with the selected ions m/z 58, 86, and 183 for 3-BMC and m/z 58, 86, 95, and 123
for 3-FMC. Generation of the mass chromatograms could be started by clicking the
corresponding pull-down menu, which executes the user-defined macros [12,13,19]. The identity
of the peaks in the mass chromatograms was confirmed by computerized comparison of the
mass spectra underlying the peaks (after background subtraction) with reference spectra
recorded during this study [20].
In addition, the full-scan data files acquired by the GC-MS system were evaluated by
automated mass spectral deconvolution and identification system (AMDIS)
(http://chemdata.nist.gov/mass-spc/amdis/) in simple mode. The used target library was a
modified version of the Maurer/Pfleger/Weber MPW_2011 library [20], from which all mass
spectra of silylated and perfluoroacetylated compounds had been eliminated and the spectra of
(acetylated) 3-BMC and 3-FMC and its metabolites were added using the “build one library”
option contained in the AMDIS main program. According to Meyer et al. [19], the used
deconvolution parameter settings were as follows: width 32, adjacent peak subtraction two,
resolution high, sensitivity very high, and shape requirements low. The minimum match
factor was set to 50.
4.5.3 LC-‐HRMS apparatus for identification of Phase I and II metabolites and for
microsomal incubations
3-BMC, 3-FMC and their metabolites were analyzed using a ThermoFisher Scientific (TF,
Dreieich, Germany) Accela LC system consisting of a degasser, a quaternary pump and a
HTC PAL autosampler (CTC Analytics AG, Zwingen, Switzerland), coupled to a TF
Exactive system equipped with a heated electrospray ionization II source. The LC conditions
were as follows: Grace Davis Discovery Science (Waukegan, Il) C18/cation exchange column
(150mm x 4.6 mm, 5 µM ) and gradient elution with 50 mM aqueous ammonium formate
buffer containing 0.1% (V/v) formic acid as Mobile Phase A and acetonitrile containing 0.1%
(v/v) formic acid as mobile Phase B. The gradient and flow rate were programmed as follows:
0-4 min 98% A to 40% A at 500 µL/min, 4-7 min hold 10% A at 1000 µL/min and 7-10 min
hold 98% A at 750 µL/min. Injection volume was 10 µL.
The MS conditions were as follows: positive scan mode from m/z 50 to 800 (MS [1],
resolution 100 000 at 1 Hz) sheath gas, nitrogen at a flow rate of 18 AU; heater temperature,

5 RESULTS AND DISCUSSION
13
350 °C; spray voltage, 4.00 kV; ion transfer capillary temperature, 250 °C; capillary voltage,
25 V; tube lens voltage, 85 V; skimmer voltage, 22 V; maximum injection time, 250 ms;
Higher-energy collision dissociation (HCD) at 25 eV (MS [2], positive scan mode from m/z
50 to 1000, resolution 50 000 at 2 Hz). The instrument was mass calibrated prior to analysis
infusing a Positive Mode Cal Mix provided by Supelco (Bellefonte, PA) at a flow rate of 5
µL/min using a syringe pump.
5 RESULTS AND DISCUSSION
5.1 Identification of the Phase I metabolites by GC-‐MS
The urinary metabolites of the substances were identified by full-scan EI MS after GC
separation. The postulated structures of the metabolites were deduced from the fragments
detected in the EI mode, which were interpreted in correlation to those of the parent
compound according to the fragmentation rules described by, e.g. McLafferty and Turecek
and Smith and Bush [21-23]. The gas chromatographic retention indices (RI) were determined
according to de-Zeeuw et al [24]. Structures and predominant fragmentation patterns of 3-
BMC (Mass Spectrum 1) as well as of its acetylated metabolites are shown in Fig. 3; those of
3-FMC (Mass Spectrum 1) are shown in Fig. 4(a) and 4(b).
In the following, important fragmentation patterns of the EI mass Spectra of 3-BMC, 3-FMC
and their derivatized metabolites will be discussed in relation to the postulated metabolite
structures depicted in Fig. 3 for 3-BMC and Fig. 4(a) and 4(b) for 3-FMC. The numbers of
the corresponding mass spectra are given in brackets.
5.1.1 3-‐Bromomethcathinone
The underivatized and the acetylated spectra of 3-BMC and 3-FMC show several similarities,
assumed due to their structural similarity illustrated in the introduction part of this work.
Cleavage between Position 1 and 2 leads to the immonium ion m/z 58, represented by the base
peak in the spectrum of 3-BMC (Fig. 3, no. 1). There was also a strong peak of m/z 56, which
was described by Archer appearing also in a pyrolysis product upon injection [2]. The
bromophenyl and the bromobenzyl-oxy ions are represented by the signals at m/z 155/157 and
m/z 183/185, respectively. The benzyl ring is represented by the m/z 76 (Spectra 1, 2 and 3) or
m/z 77 (Spectrum 4), depending on the moiety in the beta position. In the spectrum of
acetylated 3-BMC, a base peak of m/z 58 and an abundant m/z 100 represent the imminium

5 RESULTS AND DISCUSSION
14
part of the molecule, and the unchanged bromobenzyl-oxo moiety is represented by the ions
at m/z 76, 155/157 and 183/185.
However, most metabolite spectra contained an m/z 86 base peak, resulting from N-
demethylation and derivatization by acetylation. Spectra 4 and 5 show a shift of m/z 59 (m/z
313/315 to 254/256 and m/z 371/373 to 312/314) as a result of a loss of acetic acid in beta
position, which is in line with the fragmentation patterns. Spectrum 4 shows signals at m/z 77,
155/157 and 183/185, indicating an unchanged bromophenyl moiety; hence, the loss of acetic
acid can be explained by a reduced and acetylated beta-keto moiety.
According to Spectrum 5, it can be deduced that these compounds contain, besides a reduced
beta-keto moiety, a hydroxyl group in the aromatic ring system. Alpha cleavage leads to m/z
285/287 and finally to m/z 201/203 and m/z 241/243 induced by a twice loss of an acetyl
group bound to a hydroxyl moiety (shift of m/z 42).

5 RESULTS AND DISCUSSION
15
Figure 3. EI mass spectra, gas chromatographic retention indices (RI), proposed structures and predominant fragmentation patterns of 3-BMC and its metabolites arranged according to their RI.
5 RESULTS AND DISCUSSION
16
5.1.2 3-‐Fluoromethcathinone
The EI spectrum of the underivatized 3-FMC was identical to the spectrum recorded by
Archer [2] (Fig. 4 (a), spectrum 1). Alpha cleavage between position 1 and 2 results in an
immonium ion m/z 58 representing the base peak of the spectrum. As discussed for 3-BMC,
an ion m/z 56 was also observed in the mass chromatogram of 3-FMC. Further prominent ions
are the fluorophenyl cation at m/z 95 and the fluorobenzyloxy cation at m/z 123. After a
phenyl bond cleavage, an ion at m/z 109 is formed [25]. In analogy to the underivatized
compound, the spectrum of the acetylated 3-FMC (Fig. 4(a), no. 3) contains the ions m/z 75,
95 and 123. The alpha cleavage between Position 1 and 2 forms an imminium ion m/z 100;
this m/z 100 ion forms after loss of the acetyl moiety the imminium ion m/z 58, which also
represents the base peak of the spectrum. Cleavage of the acetyl moiety forms the ion at m/z
180, and fortunately the M+. ion m/z 223 is more dominant than in the spectrum of the parent
compound. It can be concluded that the ions m/z 100 and 58 represent an unchanged acetyl
immonium moiety, as presented in Spectra 3 (Fig. 4 (a)) and 6, 7, 8, 9 (Fig. 4 (b)).
Spectra 7, 8 and 9 in Fig. 4(b) show signals at m/z 111 and 139. The shift of 16 units (m/z 95
to 111 and m/z 123 to 139) indicates the introduction of a hydroxyl group in the fluorophenyl
moiety. The exact position of the hydroxyl group cannot be deduced from the fragmentation
patterns. According to RI and the fragmentation patterns, it can be concluded that the
metabolite represented in Spectrum 7 (Fig. 4 (b)) contains a free hydroxyl group, whereas
there is an acetylated hydroxyl group at the fluorophenyl moiety of spectrum 8 (Fig. 4 (b)),
leading to a M+. of m/z 281 with a shift of 43 (m/z 281 to 238) in Spectrum 8 (Fig. 4 (b)).
According to spectra 4, 5 (Fig. 4 (a)), 6 and 9 (Fig. 4 (b)) it can be deduced that the beta-keto
group was reduced to a hydroxyl moiety, which has been derivatized by acetylation. This
results in a shift of 59 (m/z 253 to 194 in spectra 4 and 5 (Fig. 4 (a)); to m/z 208 in spectrum 6
(Fig. 4 (b))) and a shift of 101 (to m/z 224 in spectrum 9 (Fig. 4 (b))) caused by elimination of
acetic acid (m/z 59 and an additional acetyl group (m/z 42). This metabolic reaction also
introduces a further chiral center at the beta carbon, leading to diastereomers represented by
two signals with spectra 4 and 5 (Fig. 4 (b)).
Metabolites represented by spectra 6 and 9 (Fig. 4 (b)) were only detected once probably due
to their very low abundance or insufficient separation. However, it is not possible to
determine which diastereomer belongs to which spectrum according to the fragmentation
patterns. Alpha cleavage between position 1 and 2 leads to an ion of m/z 166 in spectra 4, 5
(Fig. 4 (a)) and 6 (Fig. 4 (b)), and the abundant m/z 86 in spectra 2,4 and 5 (Fig. 4 (a)) is a
consequence of N-demethylation and acetylation. The ion at m/z 152 is also a consequence of

5 RESULTS AND DISCUSSION
17
this N-acetyl moiety, as recognized in spectrum 2 (Fig. 4 (a)) and in a combination with the
loss of acetic acid in spectra 4 and 5 (Fig. 4 (a)).

5 RESULTS AND DISCUSSION
18
Figure 4 (a). EI mass spectra, gas chromatographic retention indices (RI), proposed structures and predominant fragmentation patterns of 3-FMC and its metabolites arranged according to their RI.

5 RESULTS AND DISCUSSION
19
Figure 4 (b). EI mass spectra, gas chromatographic retention indices (RI), proposed structures and predominant fragmentation patterns of 3-FMC and its metabolites arranged according to their RI.

5 RESULTS AND DISCUSSION
20
5.2 HR-‐ESI-‐MS Results
5.2.1 Confirmation of the Phase I metabolites by HR-‐ESI-‐MS
The calculated and measured molecular weights of the underivatized metabolites are shown in
Table 2.
The elemental composition of all metabolites of 3-BMC and 3-FMC identified by GC-MS
should be verified using the HR-ESI-MS. In addition, N-oxides that can be considered as
precursors of the respective N-dealkyl compounds were detected and confirmed by
characteristic fragments after HCD fragmentation, corresponding to the unchanged parent
compound. It is obvious that this N-oxide was not detectable by GC-MS due to its thermal
degradation when introduced into the GC. The calculated and measured molecular weights as
well as the mass error can be found in Table 2.
Table 2. Calculated and measured exact masses and their delta values in ppm of the phase I metabolites of 3-BMC and 3-FMC using HR-ESI-MS (MS [1] scan without HCD fragmentation) Metabolite Modus Calculated Mass Measured Mass delta (ppm)
3-79BMC MS [1] 242.0175 242.0174 -0.302
3-81BMC MS [1] 244.0154 244.0153 -0.642
3-79BMC-M (N-demethyl-) MS [1] 228.0018 228.0018 -0.014
3-81BMC-M (N-demethyl-) MS [1] 229.9998 229.9996 -0.507
3-79BMC-M (N-demethyl-dihydro-) MS [1] 230.0175 230.0175 0.204
3-81BMC-M (N-demethyl-dihydro-) MS [1] 232.0154 232.0152 -0.718
3-79BMC-M (N-demethyl-dihydro-HO-) MS [1] 246.0124 246.0123 -0.479
3-81BMC-M (N-demethyl-dihydro-HO-) MS [1] 248.0103 248.0101 -0.771
3-FMC MS [1] 182.0975 182.0978 +1.489
3-FMC-M (N-demethyl-) MS [1] 168.0819 168.0819 -0.052
3-FMC-M (N-demethyl-dihydro-) MS [1] 170.0975 170.0977 0.889
3-FMC-M (dihydro-) MS [1] 184.1132 184.1130 -0.754
3-FMC-M (HO-) MS [1] 198.0924 198.0924 -0.068
3-FMC-M (dihydro-HO-) MS [1] 200.1081 200.1081 0.183
5.2.2 Identification of the Phase II metabolites by HR-‐ESI-‐MS
Phase II metabolites (glucuronides or sulfates) were identified using reconstructed ion
chromatograms of the calculated HR protonated molecular ions of conjugates of the identified

5 RESULTS AND DISCUSSION
21
Phase I metabolites. The formation of the aglyca could be confirmed by comparing the
corresponding MS spectra after HCD fragmentation with the MS spectra of the Phase I
metabolites. Using this approach, 3-BMC-M (N-demethyl-dihydro-) glucuronide and 3-FMC-
M (dihydro-) glucuronide could be detected at concentrations much lower than those of the
unconjugated phase I metabolites. This was confirmed by comparison of the signals of the
Phase I metabolites with and without conjugate cleavage. No sulfate conjugates were detected
in the rat urine samples, although they are expected to be formed in humans. This will be
referred to below.
5.3 Proposed metabolic pathways
From the metabolites earlier described, the following metabolic pathways can be deduced:
5.3.1 3-‐Bromomethcathinone
As depicted in Fig. 5, 3-BMC N-demethylation was observed (No. 2, 4 and 5) followed by
reduction of the ketone moiety (4, 5) and adjacent ring hydroxylation (5). Metabolite 4 was
also excreted as glucuronic acid conjugate (4G).
As contrast to 3-FMC, 3-BMC could not be detected in rat urine.
Figure 5. Proposed scheme for the Phase I and II metabolism of 3-BMC in rats (metabolite numbers correspond to the spectra numbers in Fig. 3)
5 RESULTS AND DISCUSSION
22
5.3.2 3-‐Fluoromethcathinone
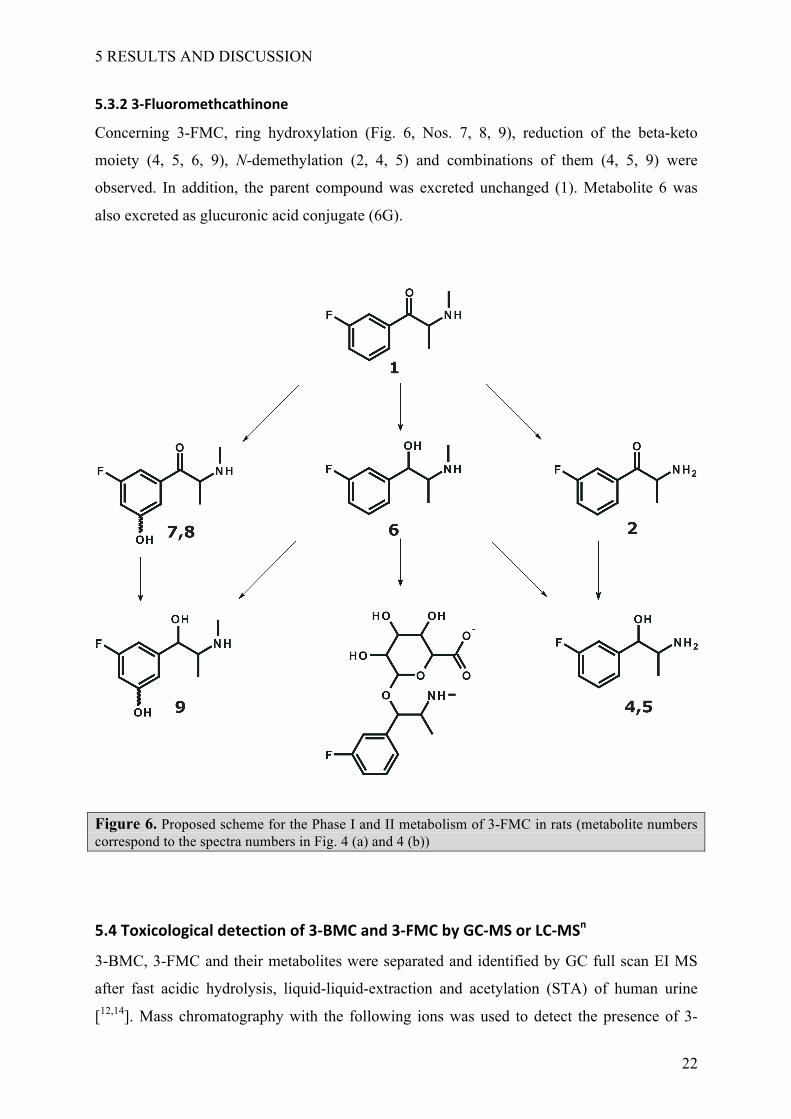
Concerning 3-FMC, ring hydroxylation (Fig. 6, Nos. 7, 8, 9), reduction of the beta-keto
moiety (4, 5, 6, 9), N-demethylation (2, 4, 5) and combinations of them (4, 5, 9) were
observed. In addition, the parent compound was excreted unchanged (1). Metabolite 6 was
also excreted as glucuronic acid conjugate (6G).
Figure 6. Proposed scheme for the Phase I and II metabolism of 3-FMC in rats (metabolite numbers correspond to the spectra numbers in Fig. 4 (a) and 4 (b))
5.4 Toxicological detection of 3-‐BMC and 3-‐FMC by GC-‐MS or LC-‐MSn
3-BMC, 3-FMC and their metabolites were separated and identified by GC full scan EI MS
after fast acidic hydrolysis, liquid-liquid-extraction and acetylation (STA) of human urine
[12,14]. Mass chromatography with the following ions was used to detect the presence of 3-

5 RESULTS AND DISCUSSION
23
BMC metabolites: m/z 58, 86 and 183. For detection of 3-FMC, the following ions were used:
m/z 58, 86, 95 and 123. The most abundant metabolites of 3-BMC and 3-FMC in rat urine
samples were the respective dihydro-metabolites. The identity of the peaks indicated by the
selected mass chromatogram was confirmed by computerized comparison of the underlying
full-scan mass spectrum with reference spectra recorded during this study. In addition, the
full-scan data files acquired by the GC-MS system were evaluated by AMDIS, allowing the
detection of 3-BMC and 3-FMC in prepared urine samples using the previously described
procedure [19]. Also, using the previously described LC-MSn procedure, 3-BMC and 3-FMC
metabolites and the parent compound 3-FMC were detectable [26].
5.5 Enzymatic part
5.5.1 Initial CYP screening
The initial screening studies with the ten most abundant human hepatic CYPs were used to
identify their ability for catalyzing the formation of the main metabolite in vitro. According to
the supplier’s advice, the incubation conditions chosen were adequate to make a statement on
the general involvement of a particular CYP enzyme. The main metabolic step observed in in
vitro incubations with recombinant CYPs was the N-demethylation of both 3-BMC and 3-
FMC.
As shown in Fig. 7, CYP2D6, CYP2B6, CYP2C19, CYP1A2, CYP2E1 and CYP3A4
catalyzed the formation of N-demethyl-3-BMC, whereas CYP2B6, CYP2D6, CYP2C19,
CYP2E1 and CYP3A4 were mainly capable to catalyze the demethylation of 3-FMC
metabolite formation.

5 RESULTS AND DISCUSSION
24
Figure 7. Relative amount of N-demethyl-3-FMC (upper part) and N-demethyl-3-BMC (lower part) formed after incubation of 250 µM each (37°C, 30 min) using the ten most important recombinant CYP isoenzymes (50 pmol/mL, each) as enzyme source.

5 RESULTS AND DISCUSSION
25
5.5.2 Kinetic studies
The kinetic parameters could not be determined for all P450s capable of catalyzing the
monitored N-demethylation of both substances.
Concerning 3-BMC, the kinetic profiles of CYP2D6, CYP2B6, and HLM best fit into
Michaelis-Menten kinetics, as shown in Fig. 8.
Figure 8. Enzyme kinetic plots for N-demethyl 3-BMC formation catalyzed by CYP2B6 (left) and CYP2D6 (right). Data points represent means and ranges (error bars) of duplicate measurements.
For 3-FMC, CYP2D6 and CYP2C19 revealed classic hyperbolic Michaelis-Menten kinetics
as shown in Fig. 9, whereas CYP2B6 and HLM fitted statistically better into a biphasic
kinetic model.
Figure 9. Enzyme kinetic plots for N-demethyl 3-FMC formation catalyzed by CYP2B6 (left), CYP2C19 (middle) and CYP2D6 (right). Data points represent means and ranges (error bars) of duplicate measurements.

5 RESULTS AND DISCUSSION
26
For 3-FMC, CYP2E1 and CYP3A4, and for 3-BMC, CYP2C19, CYP1A2, CYP2E1 and
CYP3A4 activities were too low for calculation of kinetic parameters. The Km values,
representing the in vitro affinity of the particular P450s substrates that showed sufficient
activity, are listed in Table 3.
Table 3. Calculated Km values (µM)
Enzyme KM for N-demethyl-3-FMC formation
KM for N-demethyl-3-BMC formation
CYP2B6 283a 350 CYP2D6 12 18
CYP2C19 76 not determined aKm1
The net clearances for particular P450s at the two substrates concentrations 1 µM and 10 µM
were calculated to be, for 3-BMC, 60% / 70% and 40% / 30% for CYP2B6 and CYP2D6,
respectively, and for 3-FMC, 92% / 96%, 6% / 3% and 2% / 1% for CYP2B6, CYP2D6 and
CYP2C19, respectively. In conclusion, the net clearance data indicated that CYP2B6 was
responsible for the main part of the total 3-BMC and 3-FMC CYP-dependent clearance,
becoming even more important at higher substrate concentrations.
Comparing 3-BMC and 3-FMC kinetics, it turns out that 3-FMC metabolism underlies a
partly biphasic kinetic by HLM and CYP2B6, whereas the 3-BMC data entirely showed
classic Michaelis-Menten kinetics.
6.1 In vivo vs. in vitro Phase I metabolism – the role of ADH
Concerning 3-FMC, we can compare the Phase I metabolism in rats and the CYP-incubation
data of human CYP enzymes to the phase I metabolism deduced from rabbit liver slice
incubations by Pawlik et al. [11]. In both cases, N-demethylation and ring hydroxylation were
initial steps.
Comparing our in vivo to our in vitro Phase I metabolism data is pointing out an interesting
difference:
The results of the incubations with recombinant CYPs showed the N-demethylation of both 3-
BMC and 3-FMC as the initial metabolic step in vitro whereas rat urine analysis revealed N-
demethyl-dihydro-3-BMC and hydroxyl-3-FMC followed by N-demethyl-dihydro-3-FMC as
the main metabolites in vivo. However, it should be considered that in vivo the alcohol
5 RESULTS AND DISCUSSION
27
dehydrogenase should have a large impact on 3-BMC and 3-FMC reduction, which of course
is not analyzed in the described in vitro experiments. Co-consumption of ethanol and 3-BMC
or 3-FMC may lead to a prolonged half-life of these drugs of abuse and to increased plasma
concentrations due to a competitive inhibition of the alcohol dehydrogenases by ethanol. The
role of the ADH concerning 3-BMC and 3-BMC should be clarified by further investigations.
6.2 Phase II metabolism
For the Phase II metabolism, 3-BMC-M (dihydro-) glucuronide and 3-FMC-M (dihydro-)
glucuronide could be detected. No sulfate conjugates were detected in the rat urine samples,
although they are expected to be formed in humans. Concerning our screening procedures,
such a difference does not really influence the detectability of both compounds. Using GC-
MS, conjugates are cleaved prior to analysis, and under LC/MSn STA conditions, the MS3
and MS2 spectra of glucuronides and sulfates are expected to be similar.
6.3 Possible CYP interactions
Concerning the kinetic studies, CYP2B6 turned out to be responsible for the main CYP-
dependent clearance for both substances; becoming more important from lower to higher 3-
BMC / 3-FMC concentrations. This is in line with previously published data of N-
demethylation of amphetamine-derived compounds such as 3,4-
methylenedioxymethamphetamine, MDMA and methylbenzodioxoylbutanamine, MBDB
[27,28]. Therefore, it should be taken into account that interaction may be possible between
strong CYP2B6 inhibitors, such as ticlopidine, and the investigated cathinone derivates
leading to increased plasma concentrations and therefore severe side effects after a common
dose. Additionally, genetic polymorphisms might be of relevance in some cases and should be
taken into account in interpreting plasma and urine concentration of the drugs. This question
should be target of further studies.
6.4 Prove of intake
The standard toxicological analysis procedure should be suitable to prove an intake of 3-BMC
as well as 3-FMC.

7 REFERENCES
28
7 REFERENCES
[1] Brandt SD, Sumnall HR, Measham F, Cole J. Analyses of second-generation "legal-
highs" in the UK: initial findings Drug Test Anal 2010, 2, 377, 382
[2] R.P. Archer. Fluoromethcathinone, a new substance of abuse. Forensic Sci Int 2009,
185, 10.
[3] Anonymous Land der Traeume Forum. http://www.land-der-
traeume.de/trip_lesen.php?id=8064
[4] E.E. Balint, G. Falkay, G.A. Balint. Khat - a controversial plant. Wien. Klin.
Wochenschr. 2009, 121, 604.
[5] K.F. Foley, N.V. Cozzi. Inhibition of transport function and desipramine binding at the
human noradrenaline transporter by N-ethylmaleimide and protection by substrate
analogs. Naunyn Schmiedebergs Arch. Pharmacol. 2002, 365, 457.
[6] K.F. Foley, N.V. Cozzi. Novel aminopropiophenones as potential antidepressants. Drug
Development Research 2003, 60, 252.
[7] F. Schifano, A. Albanese, S. Fergus, J.L. Stair, P. Deluca, O. Corazza, Z. Davey, J.
Corkery, H. Siemann, N. Scherbaum, M. Farre', M. Torrens, Z. Demetrovics, A.H.
Ghodse. Mephedrone (4-methylmethcathinone; 'meow meow'): chemical,
pharmacological and clinical issues. Psychopharmacology (Berl) 2011, 214, 593.
[8] AnonymousLand der Traeume Forum. http://www.land-der-traeume.de/forum.php?t=
27073&PHPSESSID=aaa914fd406db6f4232137148dad7d52)
[9] A. Winstock, L. Mitcheson, J. Ramsey, S. Davies, M. Puchnarewicz, J. Marsden.
Mephedrone: use, subjective effects and health risks. Addiction 2011, 106, 1991.
[10] F. Westpfahl, T. Junge, U. Girreser, A. Jacobsen-Bauer, P. Roesner. Badesalz für die
Nase - Fluormethcathinon neu auf dem Drogenmarkt. Toxichem. Krimtech. 2010, 77,
84.
[11] E. Pawlik, G. Plasser, H. Mahler, T. Daldrup. Studies on the phase I metabolism of the
new designer drug 3-fluoromethcathinone using rabbit liver slices. Int. J. Legal Med.
2011,
[12] H.H. Maurer, K. Pfleger, A.A. Weber, Mass Spectral and GC Data of Drugs, Poisons,
Pesticides, Pollutants and their Metabolites, Wiley-VCH, Weinheim, 2011.
[13] H.H. Maurer. Position of chromatographic techniques in screening for detection of
drugs or poisons in clinical and forensic toxicology and/or doping control [review].
Clin. Chem. Lab. Med. 2004, 42, 1310.

7 REFERENCES
29
[14] A.H. Ewald, D. Ehlers, H.H. Maurer. Metabolism and toxicological detection of the
designer drug 4-chloro-2,5-dimethoxyamphetamine in rat urine using gas
chromatography-mass spectrometry. Anal. Bioanal. Chem. 2008, 390, 1837.
[15] S.E. Clarke. In vitro assessment of human cytochrome P450. Xenobiotica 1998, 28,
1167.
[16] C.L. Crespi, V.P. Miller. The use of heterologously expressed drug metabolizing
enzymes-state of the art and prospects for the future. Pharmacol. Ther. 1999, 84, 121.
[17] K. Venkatakrishnan, L.L. von Moltke, Court M.H., J.S. Harmatz, C.L. Crespi, D.J.
Greenblatt. Comparison between cytochrome P450 (CYP) content and relative activity
approaches to scaling from cDNA-expressed CYPs to human liver microsomes: ratios
of accessory proteins as sources of discrepancies between the approaches. Drug Metab.
Dispos. 2000, 28, 1493.
[18] K. Grime, R.J. Riley. The impact of in vitro binding on in vitro-in vivo extrapolations,
projections of metabolic clearance and clinical drug-drug interactions. Curr. Drug
Metab 2006, 7, 251.
[19] M.R. Meyer, F.T. Peters, H.H. Maurer. Automated mass spectral deconvolution and
identification system for GC-MS screening for drugs, poisons, and metabolites in urine.
Clin. Chem. 2010, 56, 575.
[20] H.H. Maurer, K. Pfleger, A.A. Weber, Mass Spectral Library of Drugs, Poisons,
Pesticides, Pollutants and their Metabolites, Wiley-VCH, Weinheim, 2011.
[21] F. Westphal, T. Junge, P. Rosner, G. Fritschi, B. Klein, U. Girreser. Mass spectral and
NMR spectral data of two new designer drugs with an alpha-aminophenone structure:
4'-Methyl-alpha-pyrrolidinohexanophenone and 4'-methyl-alpha-pyrrolidino-butyro-
phenone. Forensic Sci. Int. 2007, 169, 32.
[22] F.W. McLafferty, F. Turecek, Interpretation of Mass Spectra, University Science
Books, Mill Valley, CA, 1993.
[23] R.M. Smith, K.L. Busch, Understanding Mass Spectra - A Basic Approach, Wiley, New
York (NY), 1999.
[24] R.A. de-Zeeuw, J.P. Franke, H.H. Maurer, K. Pfleger, Gas Chromatographic Retention
Indices of Toxicologically Relevant Substances and their Metabolites (Report of the
DFG commission for clinical toxicological analysis, special issue of the TIAFT
bulletin), VCH publishers, Weinheim, 1992.

7 REFERENCES
30
[25] P. Rosner, B. Quednow, U. Girreser, T. Junge. Isomeric fluoro-methoxy-
phenylalkylamines: a new series of controlled-substance analogues (designer drugs).
Forensic Sci. Int. 2005, 148, 143.
[26] D.K. Wissenbach, M.R. Meyer, D. Remane, A.A. Philipp, A.A. Weber, H.H. Maurer.
Drugs of abuse screening in urine as part of a metabolite-based LC-MS(n) screening
concept. Anal. Bioanal. Chem. 2011, 400, 3481.
[27] M.R. Meyer, F.T. Peters, H.H. Maurer. The role of human hepatic cytochrome P450
isozymes in the metabolism of racemic 3,4-methylenedioxy-methamphetamine and its
enantiomers. Drug Metab. Dispos. 2008, 36, 2345.
[28] M.R. Meyer, F.T. Peters, H.H. Maurer. Stereoselective differences in the cytochrome
P450-dependent dealkylation and demethylenation of N-methyl-benzodioxolyl-
butanamine (MBDB, Eden) enantiomers. Biochem. Pharmacol. 2009, 77, 1725.

8 ABBREVIATIONS
31
8 ABBREVIATIONS
3-BMC 3-bromomethcathinone
3-FMC 3-fluoromethcathinone
GC-MS gas chromatography- mass spectrometry
LC-MS liquid chromatography- mass spectrometry
LC-HRMS liquid chromatography- high resolution- mass spectrometry
STA systematic toxicological analysis
IUPAC International Union of Pure and Applied Chemistry
NMR nuclear magnetic resonance spectroscopy
Da Dalton
9 DANKSAGUNG
32
9 DANKSAGUNG
Die Dissertation entstand in der Abteilung für Experimentelle und Klinische Toxikologie der
Medizinischen Fakultät der Universität des Saarlandes.
Ich danke Herrn Prof. Dr. Dr. h.c. Hans H. Maurer für die Aufnahme in seinen Arbeitskreis
sowie für die zur Verfügung gestellten Materialien und Geräte. Bedanken möchte ich mich
auch für die Zuversicht, die Herr Prof. Dr. Dr. h.c. Maurer mich bezüglich dieser Studie
immer hat spüren lassen.
Besonderer Dank gebührt Herrn Dr. Markus R. Meyer für die Überlassung dieses
interessanten Themas, die exzellente Betreuung und Anleitung sowohl während der
experimentellen Phase als auch beim späteren Auswerten und Niederschreiben der Ergebnisse
sowie für seine stete Diskussionsbereitschaft.
Vielen Dank auch an Frau Dr. Andrea Schwaninger für die kompetente Betreuung bei der
Durchführung und Auswertung der Enzym-Versuche.
Ebenfalls möchte ich mich bei allen wissenschaftlichen und technischen Mitarbeitern der
Abteilung für Experimentelle und Klinische Toxikologie für das sehr gute und konstruktive
Arbeitsklima bedanken, allen voran bei Herrn Armin Weber, Herrn Golo M. Meyer, Herrn
Carsten Schröder und Frau Gabriele Ulrich.
Diese Arbeit ist meinen Eltern gewidmet. Sie ermöglichen mir diese Universitätsausbildung
und haben mich in allen Belangen stets unterstützt. Auch meine Geschwister, meine Freundin
und meine Freunde, darunter vor allem Benedikt Müller, haben großen Anteil an der
Fertigstellung dieser Arbeit. Vielen Dank für die wertvolle Unterstützung und Geduld.