NEW BRITAIN PALM OIL LIMITED
44
Meeting the Challenges of Today. Planning the Future. Creating Value for Shareholders. ANNUAL REPORT 2005 NEW BRITAIN PALM OIL LIMITED Annual Report 2006 NEW BRITAIN PALM OIL LIMITED
Transcript of NEW BRITAIN PALM OIL LIMITED

Meeting the Challenges of Today.
Planning the Future.
Creating Value for Shareholders.
ANNUAL REPORT 2005
NEW
BRITAIN
PALM
OIL LIM
ITED A
nnual Re
po
rt 2006
NEW BRITAINPALM OIL LIMITED


New Britain Palm Oil Limited (NBPOL) is Papua New Guinea’s largest oil palm plantation and milling operation.
NBPOL has continued to consolidate its position in the region by expanding its core activities of palm oil production.
NBPOL continues to pursue its ob-jectives of enhancing shareholder value. It also places high value on its social obligations to the com-munity by seeking to achieve the highest standards of environmental management and by working in sen-sitive co-operation with all sectors.
1
2005 REPORT TO SHAREHOLDERS
PORT OF KIMBE AND PALM OIL TERMINAL

Corporate Directory 3
Shareholding Statistics 4
Corporate Practices and Conduct 5
Chairman’s Message 6
Five Year Summary of Growth 7
Operations Review 8-15
Report of the Directors to the Shareholders 16-17
Independent Audit Report to the Members 18-19
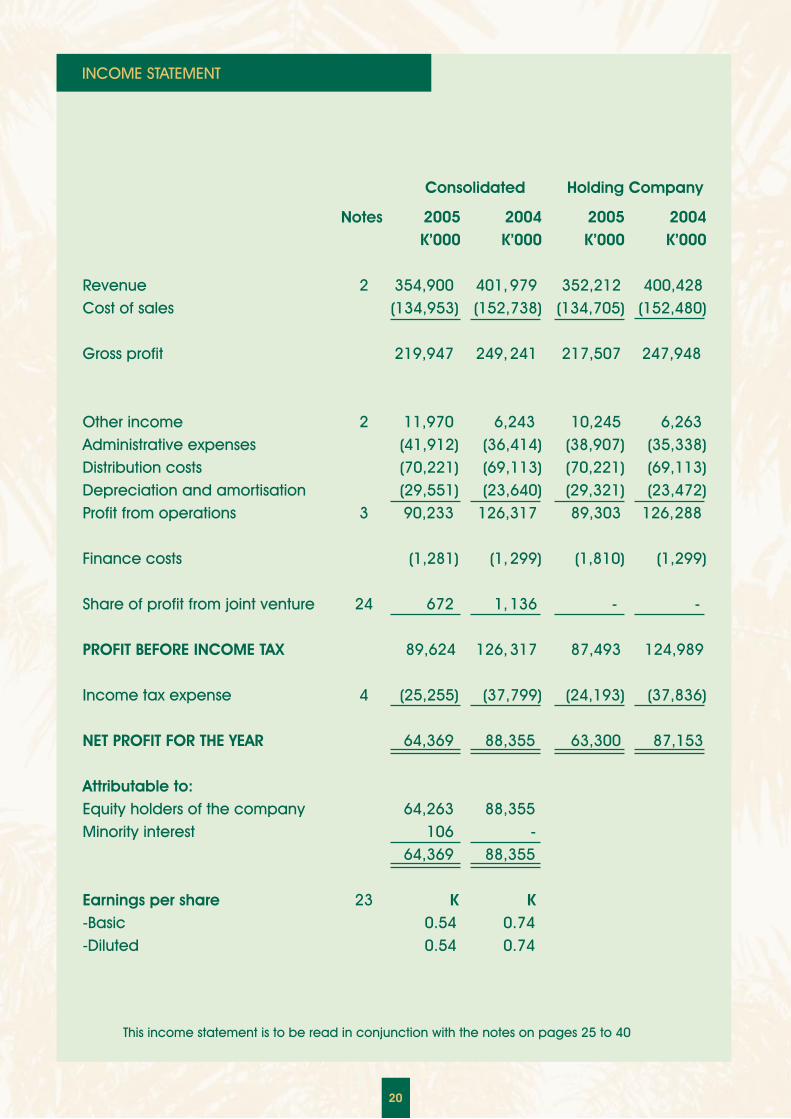
Income Statement 20
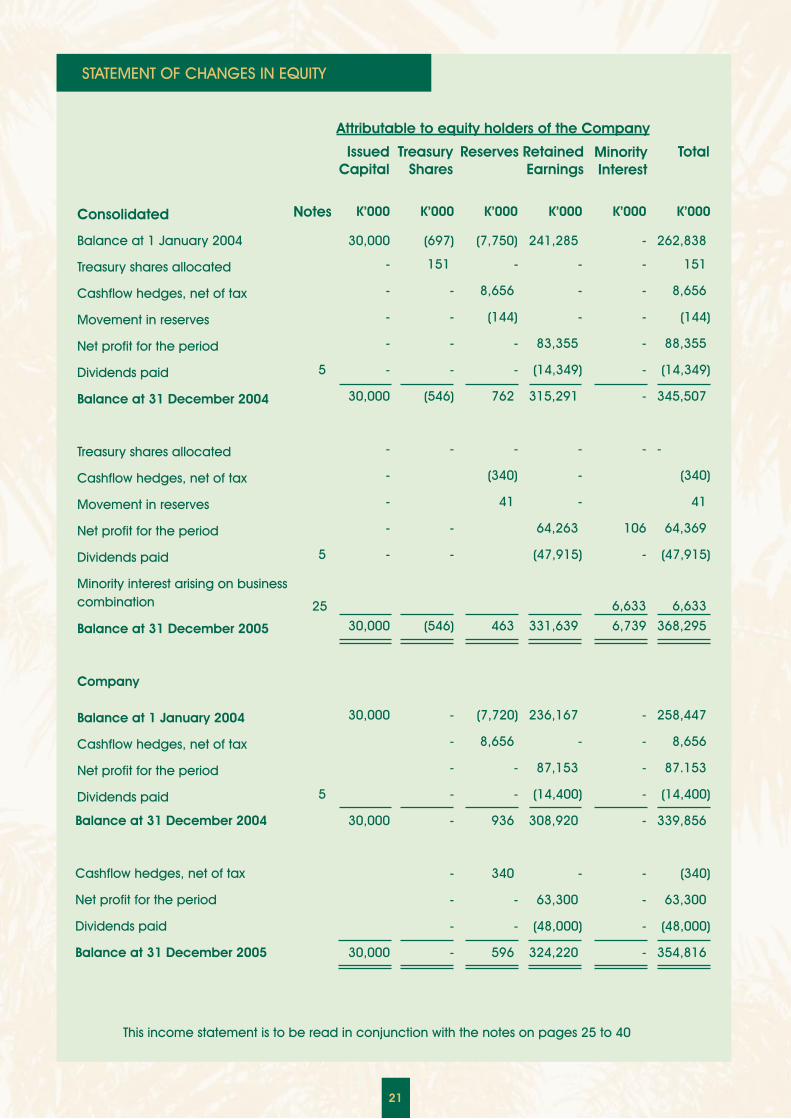
Statement of Changes in Equity 21
Balance Sheet 22
Statement of Cash Flows 23-24
Notes to the Financial Statements 25-40
CONTENTS
2
DAMI SEED EXPORTED WORLDWIDE FROM KIMBE

DIRECTORS (As at 31st December 2005)
Hj Ahamad Mohamad, ChairmanNick Thompson, Managing DirectorTan Sri’ Dr Arshad AyubDato Mohd Ismail Che RusWinifred KamitSheik Sharufuddin Sheik Mohd
SECRETARYHimson Waninara
COUNTRY OF INCORPORATIONPapua New Guinea
REGISTERED OFFICE AND ADDRESS FOR SERVICEc/- Bebere PlantationMosaKIMBEWest New Britain ProvincePapua New GuineaTelephone 985 2177
SHARE REGISTRYPNG Registries LimitedLevel 2, Aon HouseMacgregor StreetPORT MORESBYPapua New GuineaTelephone 321 6377
AUDITORSPriceWaterhouseCoopersLevel 6, Credit HouseCuthbertson StreetPORT MORESBYPapua New Guinea
BANKERSANZ Banking GroupBank of South PacificWestpac Bank
SOLICITORSBlake Dawson Waldron LawyersGadens LawyersSol-Law (Solomon Islands)
STOCK EXCHANGEPort Moresby Stock Exchange
L to R: Tan Sri’ Dr Arshad Ayub, Dato Mohd Ismail Che Rus, Sheik Sharafuddin Sheik Mohd, Hj Ahamad Mohamad, Nick Thompson, Winifred Kamit, Himson Waninara.
CORPORATE DIRECTORY
3

4
ORDINARY FULLY PAID SHARES
1 KULIM (MALAYSIA) BERHAD 86,353,267 71.96% 2 WEST NEW BRITAIN PROVINCIAL GOVERNMENT 18,000,000 15.00% 3 NATIONAL SUPERANNUATION FUND 6,846,288 5.71% 4 POSF LIMITED 556,845 .46% 5 NEW CITY INVEST.MANAGERS LTD 500,000 .42% 5 PETROLEUM RESOURCES MORAN 500,000 .42% 6 MINERAL RESOURCES STAR 494,000 .41% 7 NEW BRITAIN PALM OIL FOUNDATION LIMITED 450,000 .38% 8 PETROLEUM RESOURCES GOBE LTD 362,630 .30% 9 NICHOLAS MARK THOMPSON 317,000 .26%10 IAN ARTHUR DICKSON 276,800 .23% 11 ALAN CHAYTOR 275,000 .23% 12 PNG REGISTRIES LIMITED 246,868 .21% 13 NEW BRITAIN NOMINEES LIMITED 245,935 .20% 14 NASFUND CONTRIBUTORS SAVINGS & LOANS SOC. 200,000 .17%15 COMRADE TRUSTEE SERVICES LIMITED 179,568 .15% 16 MRS BRENDA SENIOR 154,000 .13%17 FRANK J LEWIS 150,000 .13%18 SIR GEORGE CONSTANTINOU 136,700 .11%19 DANIEL ANDRE JURE-LE MANAC’H 124,200 .10%20 PAUL MCLAREN 110,000 .09%
Rank Investor Current Balance
% Issued Capital
TOP 20 INVESTORS REPORT SATURDAY 31 DECEMBER 2005
SHAREHOLDING STATISTICS
Range of Holdings Number of Shares
1 - 1000 981 1001 - 5000 101 5001 - 10000 35 10001 - 100000 64 100001 and Over 23 Total 1,204
DISTRIBUTION OF SHARES
The distribution of shareholders at that date was:

The Directors are aware of the respon-sibility placed on them in terms of Cor-porate Governance and to this end have established committees to deal with issues as they arise. The Directors recognise the need for the highest stan-dards of behaviour and accountability.
AUDIT COMMITTEE
Members:Tan Sri’ Datuk Arshad Ayub (Chairman) Ahamad MohamadWinifred Kamit
OBJECTIVES: To review the integrity of pub-lished financial information. To review the effectiveness of the Company’s internal systems and controls. To provide a link between the board and the Company’s auditors. To act as necessary in any mat-ters relating to the financial affairs of the company where appropriate.
REMUNERATION COMMITTEE
Members:Ahamad Mohamad (Chairman)Tan Sri’ Datuk Arshad AyubWinifred Kamit
Objective To select suitably qualified per-sons to be nominated as Directors to fill vacancies from time to time.
ENVIRONMENT COMMITTEE
In view of the importance that the Com-
pany places on protection of the envi-ronment and the establishment of the best procedures for the protection of the environment, the Board has creat-ed this Committee to ensure full compli-ance with the environmental laws and regulations affecting the Company.
Members:Winifred KamitDato Mohd Ismail Che RusNick Thompson
Objectives To ensure that land manage-ment practices are consistent with the long term productivity of the resource, so that land remains suitable for agri-culture use. To prevent degredation and erosion of any land under Company control. To conserve and maintain the quality of ground and surface water. To manage the impact of de-velopment on such critical habitats as coastal wetlands, estuaries, rivers and streams, to ensure that any pos-sible pollution and its effects are mini-mised. To direct innovative measures to reduce the effects that any industry by-products may have on the environ-ment.
CORPORATE PRACTICES & CONDUCT
5
REGULAR WATER SAMPLING AND MONITORING IS UNDERTAKEN IN LOCAL RIVERS AND STREAMS

It gives me great pleasure to present the thirty ninth Annual Report for New Britain Palm Oil Limited and to inform our share-holders of the company’s continued growth. 2005 was a year in which New Brit-ain Palm Oil Ltd produced its largest ever tonnage of palm oil, divested of Capital Stockbrokers and invested in Guadalcanal Plains Palm Oil Ltd in the Solomon Islands.
The company is positioned to grow at a vigorous pace over the next decade, po-tentially doubling its current capacity and consolidating its position as one of the worlds most productive and dynamic com-panies within the global palm oil industry.
As mentioned last year the company has made a strategic move to invest in the Sol-omon Islands. I am pleased to inform our shareholders that we are on track to meet our schedule and start producing oil in May/June this year. We have been heart-ened by the support we have had from both the government and the community in the Solomon Islands. As detailed in the opera-tions review we have made solid progress in the rehabilitation of the plantations, cre-ating a solid base for further expansion.
Financially, the company’s balance sheet remains very strong with low levels of bor-rowing. The results in 2005 were severely affected by cost increases associated with diesel fuel and international freight. Whilst we achieved our production tar-gets and exceeded these in most cases to produce yet another record crop, our profit of 90 million kina was well below our record 2004 pre-tax profit of 126 million kina. Palm oil prices were lower in 2005 than in 2004. As a result of these factors the net cash generated during the year from normal operations was 113 million kina. From this amount, the Company spent 87 million kina on Capital expendi-ture both in West New Britain and the Sol-omon Islands. The company also repaid 14 million kina of loans and paid a total of 48 million in dividends to shareholders.
While the Company remains in this current growth phase, investing its
earnings in expansion, it is not pos-sible to continue paying the gener-ous dividends as we have in the past.
The company is continuing to expand its operations in Papua New Guinea, consoli-dating our base in West New Britain. In 2005 we developed a further 1,845 hectares of new oil palm estates as well as replanting 1,400 hectares of existing oil palm. The smallholder sector continues to thrive, sup-plying a third of our crop, with payments for fruit reaching 54 million kina for the year. The company continues to provide credit facilities for the smallholders at its own expense, as well as voluntarily fund-ing half of the Oil Palm Industry Corpora-tion’s smallholder extension programmes.
The company has in 2005 made good use of the tax credit arrangements, ob-taining approval to rehabilitate parts of the New Britain Highway at a total cost of K2.6 million. The project continues into 2006 and the decision of the Pap-ua New Guinea government to increase the tax credit rate to 1.5% taxable rev-enue will enable the Company to spend approximately K4 million on both the important national and feeder roads.
The New Britain Palm Oil Foundation con-tinues to fund infrastructure for educa-tion, health and most recently policing. In 2005 the Foundation donated the sum of K395, 531.86 mainly towards the construction of double classrooms. The West New Britain Provincial Government through the Kimbe and Hoskins Sec-ondary School boards contributed the sum of K150,000 towards the construc-tion of 5 of these double-classrooms.
All the many achievements of the past year and the prospects for the com-ing year result from the hard work and commitment of our employees and on behalf of the Shareholders and Board I would like to thank them all.
Ahamad Mohamed ChairmanMarch 6th, 2006
6
CHAIRMAN’S MESSAGE

A FIVE YEAR SUMMARY OF GROWTH
NBPOL has been able to show good growth in the past through its expansion plans as evidenced below:
7
(all amounts in K’000’s)
2005 2004 2003 2002 2001 Financial Performance year 31 Dec Revenue 354,900 392,176 340,099 319,111 206,676 Profit from ordinary activities 90,233 126,317 109,223 101,709 37,289 Profit after tax 64,369 88,355 76,654 68,001 6,844 Cash flow from operating activities 113,042 111,985 118,041 60,732 44,206 Average price cpo (US$ per tonne (cif) 442 471 459 387 297 Average price pko (US$ per tonne (cif) 656 654 467 436 317 At Year End Share Capital 30,000 30,000 30,000 30,000 30,000 Shareholders Equity 368,295 345,507 262,838 247,081 210,807 Working Capital 68,440 112,159 61,764 93,840 42,116 Total Assets 498,039 490,717 446,562 382,360 296,946 General Statistics Earnings per share (toea)* 54 74 63.9 56.7 22.5 Dividends per share (toea)* 40 12 35 20 10 Dividend cover (times) 1.35 6.14 1.83 2.84 2.25 Net asset backing per share (kina)* 3.07 2.88 2.19 2.06 1.76 *adjusted for share split 1999 Production Volumes (tonnes) FFB from Own Plantations 628,572 614,960 552,284 502,533 498,865 FFB from Outgrowers 323,211 288,878 264,967 259,144 265,500 Total FFB processed 951,783 903,839 817,250 761,677 764,365
Primary Products Crude Palm Oil Produced (CPO) 213,189 203,612 185,756 171,117 166,442 Palm Kernels Produced (PK) 54,769 52,834 45,826 44,301 44,831 Oil Palm Seeds (million sold) 12.38 8.00 6.05 3.76 2.89
Own Mature Oil Palm (hectares Dec.) 26,321 25,501 23,564 23,433 21,947 Yield (Palm Produce Tonnes/hectare) 6.7 7.0 6.5 5.9 6.3
Secondary Products PK Processed into: - Palm Kernel Oil (PKO) 21,090 21,527 18,646 18,026 18,645 Palm Kernel Expeller (PKE) 28,322 27,917 23,959 23,375 23,365
CPO Refined 82,427 91,863 75,120 - - Refined Palm Oil Produced (RPO) 78,086 87,873 71,107 - - Fatty Acid Distillate (PFAD) Produced 3,531 3,949 2,896 - -
RPO Fractionated into: - Palm Olein (RPL) 40,309 46,582 32,507 - - Palm Superolein (RPSL) 11,349 6,367 1,472 - - Palm Stearin (RPS) 15,228 17,715 11,933 - -

New Britain Palm Oil Ltd (NBPOL) operates 18 oil palm estates, 4 oil mills, an oil refinery and fractionation plant, oil palm plant breeding and seed production facilities in addition to an integrated oil palm and beef cattle enterprise on the North coast of West New Britain Province.
In 2005 NBPOL acquired an 80% shareholding in Guadalcanal Plains Palm Oil Ltd (GPPOL) situated in Guadalcanal province in the Solomon Islands. GPPOL has a further 3 oil palm estates and an oil mill. The Company’s combined holdings now total 41,040 hectares under oil palm cultivation and in addition purchases from smallholders oil palm fruit grown on a further 23,640 hectares.
NBPOL is also one of the world’s largest producers of oil palm seeds and has joint venture seed production facilities in Colombia, Indonesia and
Malaysia.
SUMMARY
2005 was another record production year for palm oil and also marked the Company’s expansion into the Solomon Islands with the investment in GPPOL. The sale of Capital Stockbrokers to Bank South Pacific for 6.6 million kina was also completed in September, allowing the Company to concentrate on our core plantation operations.
Crude oil production in 2005 reached a record 234,279 metric tonnes, due primarily to an increase in the hectarage of palms in harvest. Oil output in 2006 is set to increase further
to a projected 260,000 metric tonnes, boosted by the projected start in mid-2006 of harvesting and processing operations in GPPOL.
In 2005 commodity prices received for both crude and refined oils declined. The table below compares the average commodity prices over the past 3 years for the company’s oil products:
The price outlook for palm oil remains positive. Forecasts point to a slight decline in world vegetable oil stocks in 2006. World consumption of the major vegetable oils increased by 6% in 2005 and forecasts anticipate another above-average increase in world consumption in 2006. The high cost of mineral oil has stimulated the construction of bio-diesel and bio-energy plants, notably in Europe and SE Asia where the main feedstock is rapeseed oil and palm oil.
Prices of crude mineral oil have recently risen well above those of palm oil, soya oil and rape oil. World production of non-mineral oils and fats reflects only
2005 OPERATIONS IN REVIEW
Prices US$ per tonne cif Europe
2003 2004 2005 ‘04 vs.‘05
Crude Palm Oil $459.09 $471.12 $441.95 -6.2%
Crude Palm Kernel Oil $467.77 $654.55 $655.67 +0.2%
Refined Palm Oil $451.33 $531.87 $474.71 -10.7%
Palm Olein $480.27 $528.27 $506.27 -4.2%
Palm Stearin $454.34 $518.99 $443.16 -14.6%
Palm fatty Acid Distillate $333.80 $418.12 $356.39 -14.8%
8
100,000
140,000
180,000
220,000
200,000
240,000
260,000
120,000
160,000
2001 2002 2003 2004 2005 2006 Forecast
Crude Oil Output

3% of the global crude mineral oil output. It is only a question of time, probably in late 2006/early 2007, until the demand for vegetable oil for fuel usage will significantly reduce stocks of palm oil and other vegetable oils. At the moment it appears that vegetable oils and palm oil in particular, are competitively valued relative to mineral oils.
Despite the record oil production, 2005 was a difficult year for the Company in terms of meeting our financial targets, due in the main to the cost increases associated with high mineral oil prices. Total revenue generated by the company decreased to K355 million kina in 2005. Our budget profit was revised during the year from K110 million to K92 million. The profit of K90.3 was slightly lower than the revised budget due to the late shipment of some of our “December” oil contracts.
There were three main reasons why our results for 2005 were not as good as expected. Firstly we originally budgeted the Kina at 31 US cents, but actual rates received for our exports were on average of 32 US cents. While this may not seem a great difference, however it alone accounts for a reduction in earnings of approximately K13.2 million.
The second reason that directly affected our profit was the price of mineral oil based fuels. This increased our freight costs to export our palm oil to Europe, as well as costing more for the fuel to transport fruit to our mills and palm oil to the wharf. Unfortunately, freight is our largest single cost item and these costs rose on average by some 16% in 2005 that translated into additional costs of US $2.3million or K7.2 million. Additional diesel fuel costs for our truck fleet and power generation plants were responsible for a cost increase of K6.6 million.
We have already taken decisions to reduce the impact of diesel fuel on
our business. As a result in 2006 we will be building a biomass-powered power plant at Kumbango that will significantly reduce our diesel fuel usage for power generation. This centralised power plant will generate 4 megawatts of electricity for use at the refinery, kernel crushing plant and oil mill at Kumbango as well as industrial and domestic use at Mosa.
The third reason was a series of mechanical problems in the refinery that reduced processing capacity for a number of months. This meant that instead of exporting an additional 20,000 tonnes of refined oil products, at higher margins, we had to export crude palm oil (CPO) at lower margins. The total reduction in revenue resulting from this was approximately K3.6 million.
Generally all other costs within Management’s control were under budget, reflecting continuing control and management at all levels of the Company. Costs of imported items were also aided by the strengthening of the Kina. During 2005 the Papua New Guinea economy continued to enjoy relatively low inflation and showed the results of continued fiscal restraint.
During the year Telikom PNG Ltd installed a new satellite communications system at our main office complex. Unfortunately this system has failed to deliver its rated capacity due to the inability of PNG Telikom to satisfactorily complete their work on the system. This, combined with the general erosion of
9
NUMUNDO OIL MILL
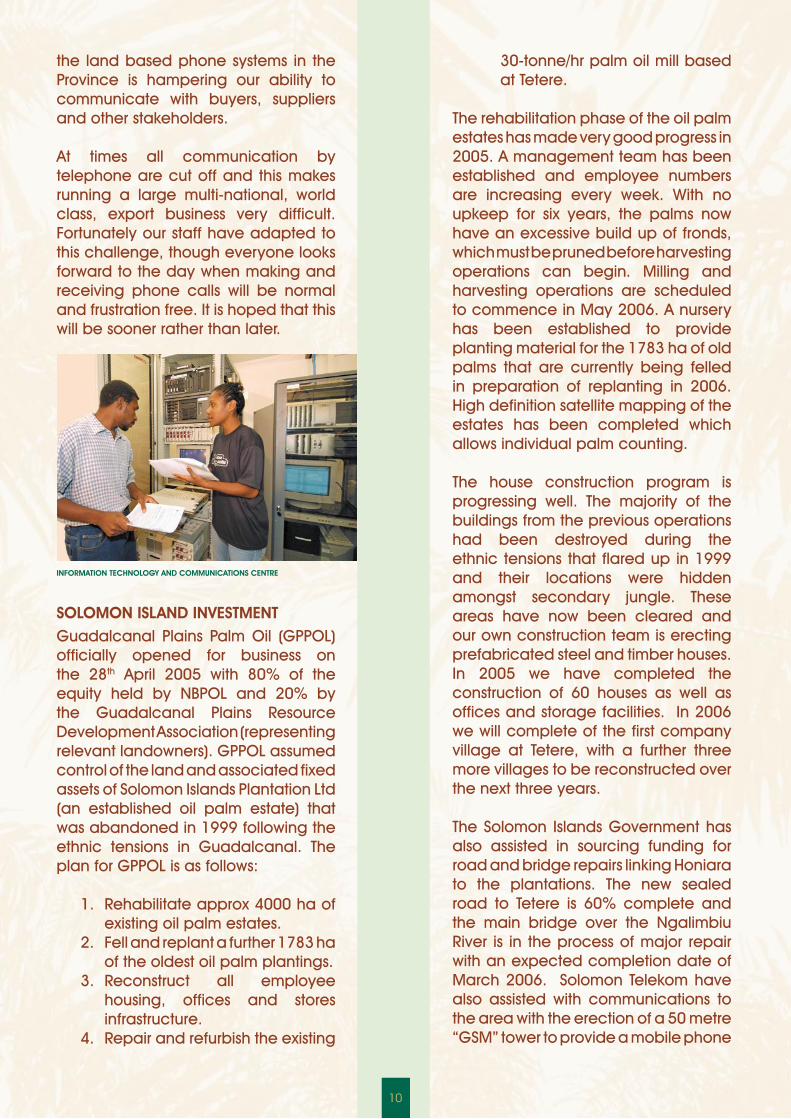
the land based phone systems in the Province is hampering our ability to communicate with buyers, suppliers and other stakeholders.
At times all communication by telephone are cut off and this makes running a large multi-national, world class, export business very difficult. Fortunately our staff have adapted to this challenge, though everyone looks forward to the day when making and receiving phone calls will be normal and frustration free. It is hoped that this will be sooner rather than later.
SOLOMON ISLAND INVESTMENTGuadalcanal Plains Palm Oil (GPPOL) officially opened for business on the 28th April 2005 with 80% of the equity held by NBPOL and 20% by the Guadalcanal Plains Resource Development Association (representing relevant landowners). GPPOL assumed control of the land and associated fixed assets of Solomon Islands Plantation Ltd (an established oil palm estate) that was abandoned in 1999 following the ethnic tensions in Guadalcanal. The plan for GPPOL is as follows:
1. Rehabilitate approx 4000 ha of existing oil palm estates.
2. Fell and replant a further 1783 ha of the oldest oil palm plantings.
3. Reconstruct all employee housing, offices and stores infrastructure.
4. Repair and refurbish the existing
30-tonne/hr palm oil mill based at Tetere.
The rehabilitation phase of the oil palm estates has made very good progress in 2005. A management team has been established and employee numbers are increasing every week. With no upkeep for six years, the palms now have an excessive build up of fronds, which must be pruned before harvesting operations can begin. Milling and harvesting operations are scheduled to commence in May 2006. A nursery has been established to provide planting material for the 1783 ha of old palms that are currently being felled in preparation of replanting in 2006. High definition satellite mapping of the estates has been completed which allows individual palm counting.
The house construction program is progressing well. The majority of the buildings from the previous operations had been destroyed during the ethnic tensions that flared up in 1999 and their locations were hidden amongst secondary jungle. These areas have now been cleared and our own construction team is erecting prefabricated steel and timber houses. In 2005 we have completed the construction of 60 houses as well as offices and storage facilities. In 2006 we will complete of the first company village at Tetere, with a further three more villages to be reconstructed over the next three years.
The Solomon Islands Government has also assisted in sourcing funding for road and bridge repairs linking Honiara to the plantations. The new sealed road to Tetere is 60% complete and the main bridge over the Ngalimbiu River is in the process of major repair with an expected completion date of March 2006. Solomon Telekom have also assisted with communications to the area with the erection of a 50 metre “GSM” tower to provide a mobile phone
10
INFORMATION TECHNOLOGY AND COMMUNICATIONS CENTRE

network and will also be completing the fixed line communication systems in early 2006.
The rehabilitation of the oil mill started in the 2nd quarter of 2005. The first task was to evaluate and refurbish existing machinery where possible. Mechanical and electrical restoration contracts were awarded to a Malaysian based engineering company (CIDAR Engineering) and the first batch of mechanical and electrical supplies arrived in late October. Both mechanical and electrical works are progressing quite satisfactorily with 60% and 75% completion respectively at the end of the year. The mill design is also being modernised with the fruit reception being changed to a conveying and gantry crane system.
It is the intention of the company to expand its operations once the rehabilitation phase is complete and work is ongoing to secure new areas for development. This is proving successful with a further 500 ha of ex rice-farmed land now transferred to GPPOL. There have also been several keen expressions of interest from the landowners in the surrounding area. The plan is for the company to expand its operations to 15,000 hectares. Overall progress so far is very encouraging in all areas and local support has been very positive.
THE LONGTERM TARGET of “30:30”
The Company has set an operating target of 30 tonnes of FFB per hectare
(for fields over 6 years old) at an extraction rate of 30 percent of palm products (e.g. 24% CPO + 6% PK). The “30:30” target will be our benchmark for operational efficiency. In some isolated instances we have already achieved these levels, but not consistently and it is consistency that we are now striving to achieve. Achieving these levels of production will keep NBPOL at the very forefront of the industry, setting production targets well above those achieved in the industry.
So how do we raise our current average FFB yields from 24 tonnes to 30 tonnes per Ha most of the time? Some opportunities are as follows:
• Move towards planting our own high yielding clones
• Continue to invest in plant breeding to produce improved varieties with greater oil yields
• Continue with zero tolerance of crop losses
• Improve our fertiliser programmes in terms of rates, timings and application standards to raise yields
• Maintain high standards of soil and water management
• Maintain high standards in oil palm upkeep
How do we raise our current palm product extraction rates from 28% to 30% most of the time? The following are opportunities where we can improve:
• Maintain high harvesting standards
• Improve smallholder crop quality through agricultural extension services
• Improve palm oil mill process controls and investigate new technologies to improve oil extraction efficiencies
• Efficient transport of crop to the mills at harvest so there is no crop deterioration (more than 24hrs)
• Prompt processing so that crop
11
MOSA HEAD OFFICES

is not left on ramps or cages for more than 4-6 hours
The above points are some of the issues we are currently addressing, if we can achieve the 30:30 target it will ensure the Company remains at the leading edge of the industry.
PALM OIL PRODUCTION IN 2005
Fruit production in 2005 was a record 951,783 tonnes of which 34% was purchased from smallholders. The average fruit yield from the Company’s estates was similar to that achieved in 2004 at 24 tonnes per hectare. In relation to the young age profile of the estates (35% less than 5 years old) and the large proportion of palms that have not reached full yield potential this is an excellent result.
The highest yielding plantations (all those in full maturity) again yielded on average in excess of 7 tonnes of palm product per hectare the highest being in excess of 8.6 tonnes per hectare (Garu Plantation).
The four oil mills maintained performance with the peak crop demanding 100% of plant capacity. The production of 213,189 tonnes of crude palm oil represented an increase of 5% on the previous year. Just under 55,000 tonnes of palm kernel were produced and converted into 21,090 tonnes of palm kernel oil
and just over 28,000 tonnes of palm kernel expeller cake. The overall palm product (CPO and PK) extraction rate to FFB was maintained above 28%. Milling capacity will be increased in 2006 and the expansion of Numundo Oil Mill is underway with completion now expected in May-June.
The refinery continued to receive fresh, good quality CPO resulting in refined products with a free fatty acid content averaging less than 0.05% against specification of 0.1%. The average FFA for exported crude palm oil was 3.52% marginally up on target with unusually heavy rainfall during April a contributing factor. Palm kernel oil quality was again exceptional with an average free fatty acid content of just over 1%, resulting in substantial price premiums for quality.
The overall oil extraction efficiency of the four mills averaged 92.2% up 0.4% from last year against a target of 92.5%. The kernel mill extraction efficiency was 89.3% against a target of 91%. This was slightly lower than previous years and reflected machinery maintenance problems.
The refinery had a number of setbacks following two years of steady improvement. Daily throughput improved to 98% of its rated capacity however substantial production time was lost to fouled oil heaters, that resisted cleaning attempts and premature failure of the vacuum system late in the year. Overall refining loss was kept below the 1% target and product quality was satisfactory.
The fractionation plant was expanded during the year by the addition of a fourth crystalliser vessel to give capacity of 400 tonnes per day on standard palm olein and 200 tonnes per day for superolein; unfortunately a problem with the chiller plant heat exchanger prevented achievement of
12
Age Profile of Oil Palms planted in PNG and Solomon Islands Estates
0-5 yrs 35%
6-10 yrs 24%
16-20 yrs26%
11-15 yrs9%
21+ yrs 6%

the increased capacity. A replacement unit was ordered at the end of 2005 for installation in early 2006.
The main feature on olein production in 2005 was the large increase in demand from local markets within Papua New Guinea where standard olein sales increased to 3,157 tonnes, up 74% from 2004 and superolein to 11, 237 tonnes, (+77%) with potential for further growth in 2006.
Milling costs in 2005 were 4% over budget, but unit costs came just within target as a result of the higher crops. The kernel mill’s costs were 3% above budget despite a sharp increase in fuel costs that make up 75% of production cost. The refinery costs were 10% below budget in total but unit costs were high due to lower production.
OIL PALM RESEARCH AND DEVELOPMENT
In response to the challenging “30:30” target we have set in place a number of long term strategies to help realize this vision. Using an oil palm agronomic database (OMP) high and low yielding areas have been identified and will become testing grounds for new practices and fertilizer strategies. In 2006 there will be a shift to a greater use of phosphate fertilizers, although the overall phosphate budget is still very small and much lower than with most other crops. In addition trials on assisted pollination have been implemented and the next generation of seed palms have been placed in the production line.
Plant Breeding highlights It has been again a busy year for the plant breeding and seed business. A total of 47 breeding trials testing new genetic material continue to have their yield, vegetative growth and bunches recorded and analysed in
detail. A record number of bunches (21,252) were individually collected for individual physical and chemical analysis during the year. Good progress was made with new crossing programs to test the next generation of palms and a further 6 trials testing new genetic varieties will be recorded in 2006. Capacity building continues to ensure there are sufficient resources to manage these trials and a consultant has been engaged to assist in the creation of a biometrics service for the station
PNG Seed Production A total of 12.4 million seeds were sold in 2005. The highest production figure for more than 8 years, representing a return to the pre-Asian crisis days of 1997. Dami seeds were exported to over 30 companies in South East Asia. The bulk of new customers were from the Philippines and Thailand and the direct result of targeted promotions. Dami will continue to expand its customer base in these countries next year as it slowly reduces its dependence on the Indonesia market. A total of 764,000 seeds were delivered to our own nurseries in West New Britain and a further 234,000 seeds to our nursery in the Solomon Islands.
Dami is now using some 2025 seed palms from 8 seed gardens and 12 pisifera sources. Our selection pressure still remains one of the highest in the industry with only 12.5% of the potential seed palms meeting the stringent
13
TISSUE CULTURE LAB

selection criteria. Quality remains the centre of our thinking and the seed unit at Dami recently obtained recognition of its Quality management System when it achieved the prestigious ISO 9001 certification in October to complement the ISO 14001 certification.
The Overseas Joint VenturesDami-Mas Sejahtera has increased its seed capacity and has to date sold just over 8 million seeds. Dami maintains strong links through consultancy visits and technical guidance. The seed production unit in Colombia operated by Murgas and Lowe has again had a successful year.
Agronomy Mapping of all existing plantations has been completed and mapping of new developments is routine. NBPOL now has 18 plantations in New Britain and 3 plantations in the Solomon Islands. The PNG estates have been divided into 386 management units. A soil resource-mapping project has been completed on all these units with the soil being chemically and physically analysed and then mapped according to physical attributes. This information has been passed to all plantation managers. Oil palm tissue and soil sampling has also begun in the Solomon Islands.
Projects in herbicide efficacy screening, chemical control of weeds and cover crop evaluation all continue routinely. The fungal disease called Ganoderma continues to be specifically monitored.
Bio-technology Highlights 2005A total of 82 palms were sampled for tissue culture multiplication with the emphasis shifting towards tenera sampling in order to assist the company to meet the 30:30 challenge. The focus in 2005 has been primarily on re-sampling selected palms that have not
yet been established in culture. Out of 117 palms in the Dura program 67 have produced clones with 52 in the either the field or nursery. This marks the end of the Dura program. Plant Breeding is now evaluating the field planted Dura clones for potential seed palms. Biotech section has progressed well A highlight of this year was the production of pisifera embryoids and the transfer of one pisifera line to the rametry. Contracts and confidentially agreements have been signed with MetaGenetics for the development of a suspension culture technique for the large-scale clonal propagation
ENVIRONMENTAL MANAGEMENT AT NBPOL
The Company has continued with internal environmental monitoring audits that have been complimented by frequent Senior Management visits. In 2005 a total of 119 internal audits were conducted across the company, issuing 233 non-compliance and corrective action requests. Out of these 78% have been successfully completed and the remaining items are minor issues with work in progress. The reduced number of non-conformance and corrective action requests demonstrates the effectiveness of the system.
In addition the first compliance and monitoring visit by the Department Of Environment and Conservation, post
14
DISCUSSING SCIENTIFIC DATA

ISO 14001certification, was completed with no major issues. Construction of a new company environmental laboratory has started. NBPOL has been re audited against the new updated standard ISO14001: 2004. The Company’s Environment Officer is now on the International Register of Certified Auditors (IRCA) in UK and the Company continues to be actively involved with the Roundtable on Sustainable Palm Oil (RSPO).
NUMUNDO BEEF OPERATIONS
The unique integrated beef and oil palm production system at Numundo continued to expand in 2005. The cattle herd comprises of just under 4000 head comprising of 1,700 head of breeding stock, 1,023 calves and 1,271 animals in the feedlot. This intensive operation is managed on an area of only 677 hectares intercropped with oil palm.
The combined revenue of oil palm and cattle provided a highly profitable mix in 2005 with the combined cattle and oil palm operation provided a contribution greater than that of dedicated oil palm.
THE FUTURE: TOWARDS TWO MILLION TONNES
The Company has recently completed a review of the potential land available
in West New Britain for oil palm planting. On these assumptions it is predicted that the company’s production will double in size over the next ten years to approximately two million tonnes of fruit, requiring the construction of 3 new oil mills in West New Britain and a further oil mill in the Solomon Islands. Whilst there remains much uncertainty over the forecast, it is in our view achievable utilising customary land highly suited to oil palm cultivation.
The biggest hurdles will be those associated with protracted and unwieldy procedures for the relevant Incorporated Land Groups to obtain registered title to their land. The government has to seriously address this issue with a much faster and less burdensome method of allowing landowners to voluntarily register their land.
The second biggest hurdle will be that of human resources and whether we can recruit and train the required number of skilled managerial and technical personnel.
Obviously the growth in the Company’s production base will require substantial investment capital. In this regard the Company is ideally placed with a low level of financial gearing allowing us to utilise both debt and retained profits for this purpose.
15
CATTLE GRAZING IN HALFSTAND OIL PALM
Ten Year Fruit Production Forecast
PNG Plantations
SI Plantations
PNG Smallholders
Tonnes Fruit
1,000,000
500,000
0
1,500,000
2,000,000
2,500,000
2006 2008 2010 2012 2014

Your directors take pleasure in present-ing their Annual Report, including the financial statements and consolidated financial statements of the company and its subsidiaries for the year ended 31 December 2005.
ACTIVITIESDuring the period, the group has con-tinued to grow and process oil palm fresh fruit bunches harvested from its own plantations as well as from sur-rounding smallholders in West New Britain, Papua New Guinea. The group also invested and incorporated a new subsidiary in Solomon Island to grow and process oil palm.
The group also has a subsidiary com-pany which maintains a bank of oil palm genetic materials in Australia.
During the year the group diposed of it’s fully owned subsidiary, Capital Stock Brokers Limted to Bank of South Pacific Limited.
RESULTSNet profit attributable to the share-holders was K64,369,000 (2004: K88,355,000). Equity of the group at the year-end totalled K368,295,000 which was an increase of K22,788,000 over the 2004 year-end total of K345,507,000.
DIVIDENDSA final dividend of K0.20 (toea) for the year ended 31 December 2004 and an interim dividend of K0.20 (toea) for the year ended 31 December 2005 were declared and paid during the year.
REPORT OF THE DIRECTORS TO THE SHAREHOLDERS
Hj Ahamad Mohamad N.M. Thompson Tan Sri’ Dr Arshad Ayub Dato Mohd Ismail Che Rus Mrs Winifred Kamit Sheik Sharufuddin Sheik Mohd
REMUNERATION OF DIRECTORSDirector’s remuneration, including the value of benefits, received dur-ing the year, is as follows:
GROUP AND HOLDING COMPANY
19992799999999
19989499999999
2005K’000
2004K’000
EXPELLER TRUCK PASSES KUMBANGO REFINERY
16

REMUNERATION OF EMPLOYEES
INTERESTS REGISTERDetails of directors’ interests in the equity of the company as at the date of this report are as follows:
N.M Thompson 317,000 Fully Paid Ordinary Shares
AUDITORSDetails of amounts paid to the auditors PricewaterhouseCoopers for the audit and other services are shown in note 3 to the financial statements.
DONATIONSThe total amount of donations made by the company and the group is stated in note 3 to the financial statements.
For and on behalf of the Board
Managing Director ChairmanSigned at Mosa, West New Britain6 March 2006
The number of employees (not including directors) whose remuneration, including benefits was within the specified bands was as follows: (2004 figures in parenthesis).
Number Number
17
Band In Kina Band In Kina Band In Kina Number K100,000 - 109,999 3 (1) K110,000 - 119,999 4 (1) K120,000 - 129,999 2 (6) K130,000 - 139,999 2 (2) K140,000 - 149,999 1 (0) K150,000 - 159,999 0 (2) K160,000 - 169,999 2 (2) K180,000 - 189,999 1 (0) K190,000 - 199,999 1 (0) K200,000 - 209,999 1 (1) K210,000 - 219,999 2 (0) K240,000 - 249,999 0 (1) K260,000 - 269,999 0 (2) K270,000 - 279,999 1 (0) K280,000 - 289,999 1 (1) K290,000 - 299,999 1 (0) K300,000 - 309,999 1 (1) K310,000 - 319,999 1 (0) K340,000 - 349,999 1 (1) K360,000 - 369,999 1 (0) K370,000 - 379,999 1 (2) K380,000 - 389,999 0 (1) K390,000 - 399,999 1 (2) K400,000 - 409,999 1 (3) K440,000 - 449,999 2 (0) K450,000 - 459,999 1 (1) K460,000 - 469,999 2 (0) K470,000 - 479,999 0 (2) K490,000 - 499,999 0 (1) K500,000 - 509,999 2 (0) K510,000 - 519,999 1 (0) K520,000 - 529,999 0 (1) K540,000 - 549,999 1 (1) K550,000 - 559,999 0 (1) K600,000 - 609,999 1 (0) K630,000 - 639,999 0 (1) K650,000 - 659,999 1 (0) K660,000 - 699,999 0 (1) K720,000 - 729,999 2 (0) K810,000 - 819,999 0 (1) K870,000 - 879,999 0 (1) K890,000 - 899,999 0 (1) K920,000 - 929,999 1 (0)
REPORT OF THE DIRECTORS TO THE SHAREHOLDERS (contd)

Qualified Audit Opinion
In our opinion,a) the financial report of New Britain Palm Oil Limited:
• gives a true and fair view of the fi-nancial position of New Britain Palm Oil Limited and the New Britain Palm Oil Group at 31 December 2005 and of their performance for the year ended on that date and
• except for non-compliance with IAS 41, is presented in accordance with the Companies Act 1997, Internation-al Financial Reporting Standards and other generally accepted accounting practice in Papua New Guinea
b) proper accounting records have been kept by the company as far as appears from our examination of those records and
c) we have obtained all the information and explanations we have required.
This opinion must be read in conjunc-tion with the qualification paragraph below and the rest of our audit report.
Qualification – non-compliance with IAS 41: Agriculture
As stated in note 1(w), the company has not complied with IAS 41: Agriculture. This standard became applicable for accounting periods commencing on or after 1 January 2003. IAS 41 applies to all agricultural activity and, in sub-stance, requires all biological assets and agricultural produce to be mea-sured at fair value, with changes in fair value reported as part of the profit or loss for the period. The implementation of IAS 41 is likely to have a significant
impact on the carrying amount of the group’s biological assets and its per-formance as reported in the financial statements. The directors have resolved not to adopt IAS 41 for the reasons set out in note 1(w).
Scope
The financial report and directors’ re-sponsibility
The financial report comprises the bal-ance sheet, income statement, state-ment of changes in equity, statement of cash flows, and the accompanying notes to the financial statements for both New Britain Palm Oil Limited (the company) and the New Britain Palm Oil Group (the group) for the year ended 31 December 2005. The group com-prises both the company and the enti-ties it controlled during that year.
The directors of the company are re-sponsible for the preparation and true and fair presentation of the financial report in accordance with the Compa-nies Act 1997. This includes responsibil-ity for the maintenance of adequate accounting records and internal con-trols that are designed to prevent and detect fraud and error and for the ac-counting policies and accounting esti-mates inherent in the financial report.
Audit approach
We conducted an independent audit in order to express an opinion to the members of the company. Our audit was conducted in accordance with International Standards on Auditing, in order to provide reasonable assur-ance as to whether the financial re-port is free of material misstatement. The nature of an audit is influenced by factors such as the use of professional judgement, selective testing, the inher-ent limitations of internal control and the availability of persuasive rather than conclusive evidence. Therefore,
INDEPENDENT AUDIT REPORT
18

an audit cannot guarantee that all material misstatements have been detected.
We performed procedures to as-sess whether in all material respects the financial report presents fairly, in accordance with the Compa-nies Act 1997, International Finan-cial Reporting Standards and other generally accepted accounting practice in Papua New Guinea,a view which is consistent with our un-derstanding of the company’s and the group’s financial position and of their performance as represent-ed by the results of their operations and cash flows.
We formed our audit opinion on the basis of these procedures, which included:
• examining, on a test basis, infor-mation to provide evidence sup-porting the amounts and disclo-sures in the financial report and
• assessing the appropriateness of the accounting policies and disclo-sures used and the reasonableness of significant accounting estimates made by the directors.
We read the other information in the Annual Report to determine whether it contained any material inconsistencies with the financial report.
While we considered the effec-tiveness of management’s internal controls over financial reporting when determining the nature and extent of our procedures, our audit was not designed to provide assur-ance on internal controls.
Our audit did not involve an analy-sis of the prudence of business de-cisions made by directors or man-agement.
Independence
In conducting our audit, we fol-lowed applicable independence requirements of CPA Papua New Guinea and the Companies Act 1997.
PricewaterhouseCoopersBy: SC Beach, PartnerRegistered under the Accountants Act 1996Port Moresby
Date: 6 March 2006
DOCTOR AND PATIENTS AT MOSA CLINIC
19
20
2005 2004 2005 2004K’000 K’000 K’000 K’000
Revenue 2 354,900 401, 979 352,212 400,428Cost of sales (134,953) (152,738) (134,705) (152,480)
Gross profit 219,947 249, 241 217,507 247,948
Other income 2 11,970 6,243 10,245 6,263Administrative expenses (41,912) (36,414) (38,907) (35,338)Distribution costs (70,221) (69,113) (70,221) (69,113)Depreciation and amortisation (29,551) (23,640) (29,321) (23,472)Profit from operations 3 90,233 126,317 89,303 126, 288
Finance costs (1,281) (1, 299) (1,810) (1,299)
Share of profit from joint venture 24 672 1, 136 - -
PROFIT BEFORE INCOME TAX 89,624 126, 317 87,493 124,989
Income tax expense 4 (25,255) (37,799) (24,193) (37,836)
NET PROFIT FOR THE YEAR 64,369 88,355 63,300 87,153
Attributable to:Equity holders of the company 64,263 88,355Minority interest 106 -
64,369 88,355
Earnings per share 23 K K-Basic 0.54 0.74-Diluted 0.54 0.74
Consolidated Holding Company
Notes
This income statement is to be read in conjunction with the notes on pages 25 to 40
INCOME STATEMENT
21
This income statement is to be read in conjunction with the notes on pages 25 to 40
STATEMENT OF CHANGES IN EQUITY
Notes
Attributable to equity holders of the Company
Minority Interest
Retained Earnings
Reserves
Consolidated K’000 K’000 K’000 K’000 K’000 K’000
Balance at 1 January 2004 30,000 (697) (7,750) 241,285 - 262,838
Treasury shares allocated - 151 - - - 151
Cashflow hedges, net of tax - - 8,656 - - 8,656
Movement in reserves - - (144) - - (144)
Net profit for the period - - - 83,355 - 88,355
Dividends paid 5 - - - (14,349) - (14,349)
Balance at 31 December 2004 30,000 (546) 762 315,291 - 345,507
Treasury shares allocated - - - - - -
Cashflow hedges, net of tax - (340) - (340)
Movement in reserves - 41 - 41
Net profit for the period - - 64,263 106 64,369
Dividends paid 5 - - (47,915) - (47,915)
Minority interest arising on business combination
Balance at 31 December 2005 30,000 (546) 463 331,639 6,739 368,295
Company
Balance at 1 January 2004 30,000 - (7,720) 236,167 - 258,447
Cashflow hedges, net of tax - 8,656 - - 8,656
Net profit for the period - - 87,153 - 87.153
Dividends paid 5 - - (14,400) - (14,400)
Balance at 31 December 2004 30,000 - 936 308,920 - 339,856
Cashflow hedges, net of tax - 340 - - (340)
Net profit for the period - - 63,300 - 63,300
Dividends paid - - (48,000) - (48,000)
Balance at 31 December 2005 30,000 - 596 324,220 - 354,816
TreasuryShares
IssuedCapital
Total
25 6,633 6,633
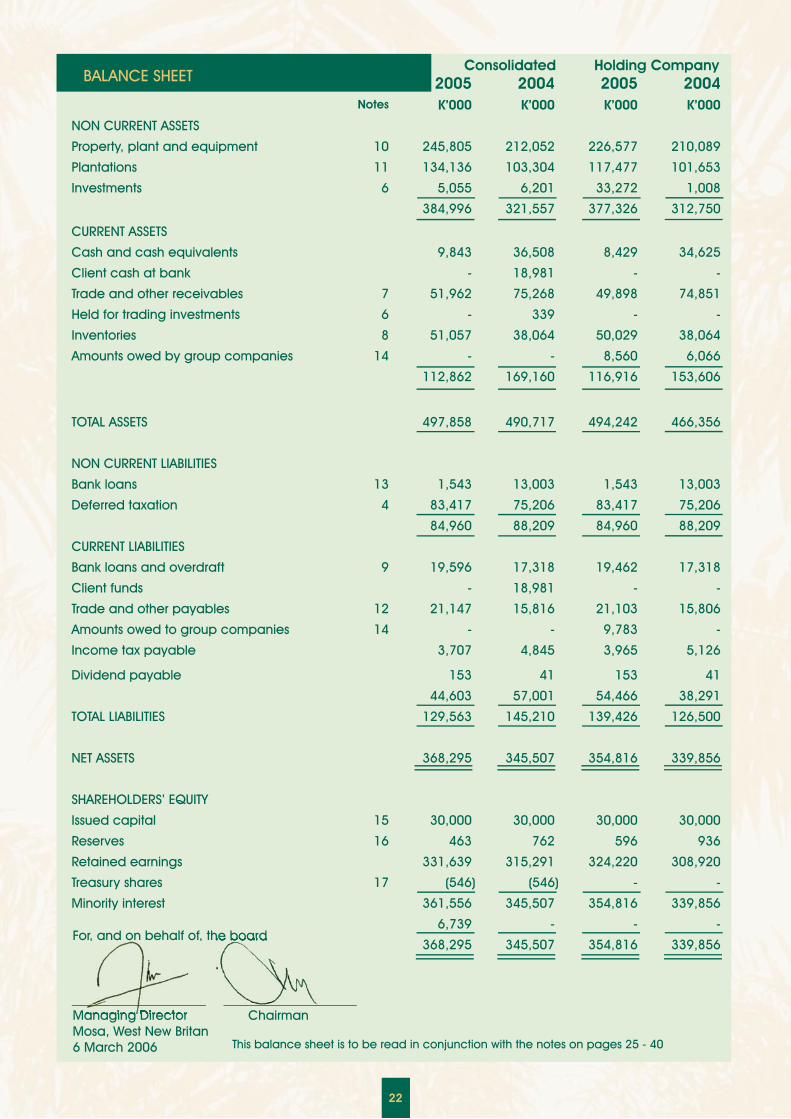
2005 2004 2005 2004Notes K’000 K’000 K’000 K’000
NON CURRENT ASSETS
Property, plant and equipment 10 245,805 212,052 226,577 210,089
Plantations 11 134,136 103,304 117,477 101,653
Investments 6 5,055 6,201 33,272 1,008
384,996 321,557 377,326 312,750
CURRENT ASSETS
Cash and cash equivalents 9,843 36,508 8,429 34,625
Client cash at bank - 18,981 - -
Trade and other receivables 7 51,962 75,268 49,898 74,851
Held for trading investments 6 - 339 - -
Inventories 8 51,057 38,064 50,029 38,064
Amounts owed by group companies 14 - - 8,560 6,066
112,862 169,160 116,916 153,606
TOTAL ASSETS 497,858 490,717 494,242 466,356
NON CURRENT LIABILITIES
Bank loans 13 1,543 13,003 1,543 13,003
Deferred taxation 4 83,417 75,206 83,417 75,206
84,960 88,209 84,960 88,209
CURRENT LIABILITIES
Bank loans and overdraft 9 19,596 17,318 19,462 17,318
Client funds - 18,981 - -
Trade and other payables 12 21,147 15,816 21,103 15,806
Amounts owed to group companies 14 - - 9,783 -
Income tax payable 3,707 4,845 3,965 5,126
Dividend payable 153 41 153 41
44,603 57,001 54,466 38,291
TOTAL LIABILITIES 129,563 145,210 139,426 126,500
NET ASSETS 368,295 345,507 354,816 339,856
SHAREHOLDERS’ EQUITY
Issued capital 15 30,000 30,000 30,000 30,000
Reserves 16 463 762 596 936
Retained earnings 331,639 315,291 324,220 308,920
Treasury shares 17 - -
Minority interest 361,556 345,507 354,816 339,856
6,739 - - -
368,295 345,507 354,816 339,856For, and on behalf of, the board
Managing Director ChairmanMosa, West New Britan6 March 2006 This balance sheet is to be read in conjunction with the notes on pages 25 - 40
22
or, and on behalf of, the board
Managing Director Chairman
or, and on behalf of, the boardor, and on behalf of, the board
BALANCE SHEET
(546) (546)
Consolidated Holding Company

23
STATEMENT OF CASH FLOWS
Consolidated Holding Company 2005 2004 2005 2004 K'000 K'000 K'000 K'000
CASH FLOW FROM OPERATING ACTIVITIES Receipts from customers 378,025 360,981 377,165 364,681
Payments to suppliers and employees (246,050) (225,396) (239,668) (231,163)
Income tax paid (17,895) (21,456) (16,856) (21,456)
Interest paid (1,281) (1,299) (1,810) (1,299)
Interest received 424 777 366 727
Net cash flows from operating activities 113,223 113,607 119,197 111,490
CASH FLOW FROM INVESTING ACTIVITIES Proceeds from sale of investments - 47 - -
Proceeds from sale of subsidiary 4,685 - 6,608 -
Investment in subsidiary - - (33,164) -
Purchase investments - (210) - -
Purchase of property, plant and equipment (57,249) (35,305) (39,669) (35,240)
Plantation development expenditure (30,339) (21,215) (21,964) (19,421)
Net cash used in investing activities (82,903) (56,683) (88,189) (54,661)
CASH FLOW FROM FINANCING ACTIVITIES Proceeds from bank loans 1,543 - 1,543 -
Repayment of bank loans (13,842) (8,621) (13,842) (8,621)
Sale of treasury shares - 151 - -
Dividends paid (47,803) (28,819) (47,888) (28,819)
Net cash used in financing activities (60,102) (37,289) (60,187) (37,440)
NET INCREASE IN CASH AND CASH EQUIVALENT (29,782) 19,635 (29,179) 19,389
Add : Cash and cash equivalents brought forward 32,992 13,357 31,109 11,720
CASH AND CASH EQUIVALENTS CARRIED
FORWARD 3,210 32,992 1,930 31,109
CASH AND CASH EQUIVALENTS COMPRISE Cash and bank balances 3,843 3,788 2,429 2,125
Call deposits 6,000 32,720 6,000 32,500
Bank overdraft (6,633) (3,516) (6,499) (3,516)
3,210 32,992 1,930 31,109
This statement of cash flows is to be read in conjunction with the notes on pages 25 to 40

This statement of cash flows is to be read in conjunction with the notes on pages 25 to 40
2005 2004 2005 2004 K’000 K’000 K’000 K’000
Reported Net Profit after Taxation 64,369 88,355 63,300 87,153
Add/(less) non-cash items:Depreciation and amortisation 29,551 23,640 29,321 23,472Net (profit)/loss on disposal of property, plant and equipment - 17 - -Net loss/(profit) on sale of subsidiary (3,045) - (5,708) -Share of profit from Joint Venture (672) (1,136) - -Add/(less) movements in working capi-tal items:(Decrease)/increase in amounts due from/to related companies - - 7,289 (307)Decrease/(increase) in trade and other debtors
23,306 (31,208) 24,614 (31,035)
(Decrease)/increase in current tax payable (1,138) 7,561 (1,161) 7,842Increase/(decrease) in deferred taxation 8,175 9,484 8,211 9,484Increase in creditors and provisions 5,331 3,337 5,296 3,094Increase/(decrease) in trading securi-ties 339 - - -Increase/(decrease) in inventories (12,993) 13,557 (11,965) 11,787
Net Cash Flow from Operating Activities 113,223 113,607 119,197 111,490
RECONCILIATION OF NET PROFIT AFTER TAXATION TO CASH FLOW FROM OPERATING ACTIVITIES
Consolidated Holding Company
24
STATEMENT OF CASH FLOWS
NOTES TO THE FINANCIAL STATEMENTS
1. STATEMENT OF ACCOUNTING POLICIES
The company is incorporated and do-miciled in Papua New Guinea and all amounts are expressed in Papua New Guinea Kina, the functional currency of the company, rounded to the near-est thousand Kina.
These financial statements are present-ed in accordance with the Papua New Guinea Companies Act 1997 and, ex-cept for non-compliance with IAS 41, comply with applicable International Financial Reporting Standards and other generally accepted accounting practice in Papua New Guinea.
The group financial statements com-prise the consolidated financial state-ments of the company and its subsid-iaries as set out in Note 6.
These consolidated financial state-ments have been approved for issue by the board of directors on 6 March 2006.
(a) Basis of accountingThe financial statements have been prepared on the basis of historical costs and except where stated, do not take into account current valuations of non-current assets.
(b) ConsolidationThe consolidated financial statements include the financial statements of the company and its subsidiaries ac-counted for using the purchase meth-od. These subsidiaries are listed in note 6 to these financial statements. The assets and liabilities of the self-sustain-ing overseas controlled entities, Dami Australia Pty Limited and Guadalcanal Plains Palm Oil Limited are translated
at exchange rates existing at balance date and the exchange gain or loss arising on translation is carried directly to a foreign currency translation re-serve. All material inter-company ac-counts and transactions are eliminat-ed on consolidation.
(i) SubsidiariesSubsidiaries are all entities over which the Group has the power to govern the financial and operating policies gen-erally accompanying a shareholding of more than one half of the voting rights. Subsidiaries are fully consolidat-ed from the date on which control is transferred to the Group. They are de-consolidated from the date that con-trol ceases. The accounting policies adopted by subsidiaries are consistent with those of group accounting poli-cies.
Minority interests in the results and equi-ty of subsidiaries are shown separately in the consolidated income statement and balance sheet respectively.
(ii) Joint VentureInvestment in a Joint Venture over which the Group has significant influ-ence is accounted for under theequity method of accounting. The Group share of Joint Venture profits or losses is recognised in the income statement and its share of movement in reserves is recognised in reserves. The cumulative movements are adjust-ed against the carrying amount of the investment.
(c) Segment reportingA business segment is a group of assets and operations engaged in providing products or services that are subject to risks and returns that are different from those of other business segments. A geographical segment is engaged in providing products or services within a particular economic environment that are subject to risks and returns that
25

different from those of segments op-erating in other economic environ-ments.
The Group mainly operates in one geo-graphical segment and all revenue from its principal activity of processing oil palm fresh fruit bunches are derived in Papua New Guinea. Revenue and results from other business and geo-graphical segments are insignificant to the group and separate disclosure of those segmental information is not considered beneficial to the share-holders.
(d) Plantations, property, plant and equipmentPlantation development expenditure and leasehold buildings and services acquired prior to 1 January 1985 and plant and machinery acquired prior to 1 January 1984 are recorded at direc-tors’ valuation. All other property, plant and equipment are recorded at cost less accumulated depreciation. All costs directly relating to plantation de-velopment are capitalised until such time as the oil palms reach maturity, at which point all further costs are ex-pensed and amortisation commenc-es.
Where the carrying value of an item of property, plant and equipment is greater than its recoverable amount the asset is written down to its recover-able amount.
(e) Depreciation and amortisationAll property, plant and equipment as-sets with the exception of capital work in progress, are depreciated on a straight line basis over their estimated useful lives which are as follows:
Profits and losses on disposal of prop-erty, plant and equipment are taken
into account in determining the result for the year.
(f) InventoriesInventories comprise palm produce, nursery and seed stocks, spare parts and consumables and livestock. In-ventories are stated at the lower of cost and net realisable value. Cost includes expenditure incurred in acquiring or producing the stock and bringing it to its existing location and condition.
Inventory of palm produce comprises processed and refined palm oil prod-ucts in tanks awaiting shipment at bal-ance date. No value is ascribed to un-processed fruit or produce in process. Cost comprises the cost of fruit into the production process, together with di-rect materials and labour and an ap-propriate proportion of fixed and vari-able overheads relating to the milling and refining processes.
In respect of nursery and seed stocks, cost includes direct materials and la-bour plus an appropriate proportion of fixed and variable overheads.
In respect of livestock, cost is calculat-ed as the average value of livestock at the beginning of the period plus purchases and natural increases dur-ing the period. Natural increases are valued at the attributable value ac-cepted by the taxation authorities.
Net realisable value is based on es-timated selling price less any further costs expected to be incurred to com-pletion and disposal.
Useful lives (years)Mature oil palm plantations 17Leasehold buildings & services 4 -33Plant & machinery 10 -15Motor vehicles 3 - 5Furniture & equipment 5 -15
1.STATEMENT OF ACCOUNTING POLICIES (Continued)
26
NOTES TO THE FINANCIAL STATEMENTS

(g) InvestmentsThe Group classifies its investments in the following categories: financial as-sets at fair value through income state-ment, loans and receivables, available for sale financial assets and held-to-maturity investments. The classification depends on the purpose for which the investments were acquired. Manage-ment determines the classification of its investments at initial recognition and re-evaluates this designation at every reporting date.
(i) Financial assets at fair value through income statement
This category has two sub-categories: financial assets held for trading, and those designated at fair value through profit or loss at inception. A financial asset is classified in this category if ac-quired principally for the purpose of selling in the short term or if so desig-nated by management. Assets in this category are classified as current as-sets if they are either held for trading or are expected to be realised within 12 months of the balance sheet date.
(ii) Loans and receivables
Loans and receivables are non-deriva-tive financial assets with fixed or deter-minable payments that are not quoted in an active market. They arise when the Group provides money, goods or services directly to a debtor with no in-tention of trading the receivable. They are included in current assets, except for maturities greater than 12 months after the balance sheet date. Loans and receivables are included in trade and other receivables in the balance sheet .
(iii) Available for sale financial assets
Available-for-sale financial assets are
non-derivatives that are either desig-nated in this category or not classified in any of the other categories. They are included in non-current assets un-less management intends to dispose of the investment within 12 months of the balance sheet date.
(iv) Held-to-maturity investments
Held-to-maturity investments are non-derivative financial assets with fixed or determinable payments and fixed ma-turities that the Group’s management has the positive intention and ability to hold to maturity.
Purchases and sales of investments are recognised on trade-date – the date on which the Group commits to purchase or sell the asset. Investments are initially recognised at fair value plus transaction costs for all financial assets not carried at fair value through the income statement. Investments are derecognised when the rights to re-ceive cash flows from the investments have expired or have been transferred and the Group has transferred sub-stantially all risks and rewards of own-ership.
Loans and receivables are carried at amortised cost using the effective in-terest method. Realised and unrealised gains and losses arising from changes in the fair value of the financial assets at fair value through income statement category are included in the income statement in the period in which they arise.
The fair values of quoted investments are based on current bid prices. If the market for a financial asset is not ac-tive (and for unlisted securities), the Group establishes fair value by using valuation techniques.
The Group assesses at each balance sheet date whether there is objective evidence that a financial asset or a group of financial assets is impaired.
27
1.STATEMENT OF ACCOUNTING POLICIES (Continued)
NOTES TO THE FINANCIAL STATEMENTS

(h) Impairment of assetsAssets that have an indefinite useful life are not subject to amortisation and are tested annually for impairment. Assets that are subject to amortisation are reviewed for impairment whenever events or changes in circumstances in-dicate that the carrying amount may not be recoverable. An impairment loss is recognised for the amount by which the asset’s carrying amount exceeds its recoverable amount. The recover-able amount is the higher of an asset’s fair value less costs to sell and value in use. For the purposes of assessing impairment, assets are grouped at the lowest levels for which there are sepa-rately identifiable cash flows.
(i) BorrowingsBorrowings are recognized initially at fair value, net of transaction costs in-curred. Borrowings are subsequently stated at amortised cost; any differ-ence between the proceeds (net of transaction costs) and the redemp-tion value is recognized in the income statement over the period of borrow-ings using the effective interest meth-od.
(j) HedgesDerivative financial instruments are initially recognised at cost and sub-sequently are remeasured at their fair value. All gains and losses relating to highly effective cash flow hedges on palm produce are recognised in the hedge reserve in equity and are trans-ferred to the income statement in the period when the hedged transaction affects the income statement.
(k) Income taxThe company recognises deferred taxes for all deductible and taxable temporary differences between the
value for income tax purposes of as-sets and liabilities at balance date and their corresponding book values, on the basis of the tax rates expected to apply when these differences are extinguished. Deferred tax assets aris-ing from deductible temporary differ-ences and any tax losses carried for-ward are recognised to the extent that it is probable that they can be utilised against future taxable profit.
(l) Foreign currency translationTransactions denominated in a for-eign currency are converted at the exchange rate at the date of the transaction. Assets and liabilities in for-eign currencies are translated to local currency at rates of exchange ruling at balance date. Gains or losses aris-ing from exchange fluctuations are brought to account in the determina-tion of the results for the period.
(m) RevenueSales revenue represents revenue earned from the sales of the group’s products, net of returns, trade allow-ances and duties and taxes paid. Revenue is recognised when there has been a passing of title and risk to the customer, and:
• The produce is in a form suitable for delivery and sale and no further pro-cessing is required;
• The quantity and quality of the prod-uct can be determined with reason-able accuracy;
• The product has been dispatched to the customer and is no longer un-der the physical control of the group (or property in the product has earlier passed to the customer); and
• The selling price can be determined with reasonable accuracy.
28
1.STATEMENT OF ACCOUNTING POLICIES (Continued)
NOTES TO THE FINANCIAL STATEMENTS

(n) Comparative figuresWhere necessary, comparative figures have been adjusted to conform with changes in presentation in the current period.
(o) Cash and cash equivalentsFor the purpose of the statements of cash flows, cash and cash equivalents includes cash on hand and deposits held at call or short term maturity with banks, net of bank overdrafts.
(p) Accounts receivableTrade receivables are recognised at fair value, less provision for impairment. A provision for impairment of trade re-ceivables is established when there is objective evidence that the Group will not be able to collect all amounts due according to the original terms of re-ceivables. The amount of the provision is the difference between the asset’s carrying amount and the present val-ue of estimated future cash flows, dis-counted at the effective interest rate. The amount of the provision is recog-nised in the income statement.
(q) ProvisionsProvisions are recognised when the Group has a present legal or con-structive obligation as a result of past events, it is probable that an outflow of resources will be required to settle the obligation, and a reliable estimate of the amount can be made.
(r) Accounts payable and accrualsLiabilities are recognised for amounts to be paid in the future for the goods and services received, whether billed by the supplier or not.
(s) Dividend distributionDividend distribution to the company’s shareholders is recognised as a liability in the Group’s financial statements in the period in which the dividends are
approved by the company’s share-holders.
(t) Share capitalOrdinary shares are classified as eq-uity. Where any Group company pur-chases the Company’s equity share capital (Treasury shares), the consid-eration paid, including any directly attributable incremental costs (net of income taxes,) is deducted from eq-uity attributable to the Company’s eq-uity holders until the shares are can-celled, reissued or disposed of. Where such shares are subsequently sold or reissued, any consideration received, net of any directly attributable incre-mental transaction costs and the re-lated income tax effects, is included in equity attributable to the Company’s equity holder.
(u) Significant risks and uncertaintiesThe group’s business and the industry in which it operates, makes it vulnerable to changes in world palm oil demand and supply factors, palm oil prices and variations in foreign exchange rates. Such factors have been volatile in the past and can be expected to be volatile in the future. These risks and uncertainties affect the group’s profit-ability from year to year. Although, the group recognises these risks and un-certainties and operates in a manner to mitigate these factors as far as is possible, actual results may differ from management’s expectations.
(v) Critical accounting judgements and estimatesThe preparation of financial statements in accordance with International Fi-nancial Reporting Standards requires management to make estimates and assumptions that affect the amounts reported in the financial statements and accompanying notes. The most significant estimates and assumptions relate to the recoverability of assets and depreciation, provisions and cer-tain liabilities or contingent liabilities. Actual results could differ from those
29
1.STATEMENT OF ACCOUNTING POLICIES (Continued)
NOTES TO THE FINANCIAL STATEMENTS

estimates and may affect amounts re-ported in future periods. Management believes that these estimates are rea-sonable.
(w) Non-compliance with IAS 41IAS 41 Agriculture became applicable for accounting periods commencing on or after 1 January 2003. IAS 41 ap-plies to all agricultural activity and, in substance, requires all biological as-sets and agricultural produce to be measured at fair value. The Directors have resolved not to comply with IAS 41 on the basis that:
• The adoption of IAS 41 and the fair value measurement basis for biologi-cal assets and agricultural produce has not yet become generally ac-cepted practice in the palm oil sector, either in Papua New Guinea or Malay-sia, the country where the parent en-tity is based and where the majority of global palm oil activity takes place
• It is not considered possible to deter-mine variables such as palm oil prices, exchange rates and production yields over the productive life of oil palms with sufficient reliability, particularly in the absence of generally accepted palm oil industry practice,
• Without sufficiently reliable variables, the valuation exercise is affected which in turn can lead to significant fluctuations in accounting valuations and profitability whilst bearing no rela-tion to the company’s actual financial performance by unnecessarily over-stating profit and losses,
• The Directors do not believe that pre-senting the financial statements on the basis of IAS 41 at this time for long term perennial tree crops like oil palm will provide information that is more rel-
evant, useful and understandable to the users of the financial statements than under the current basis of ac-counting.
30
1.STATEMENT OF ACCOUNTING POLICIES (Continued)
NOTES TO THE FINANCIAL STATEMENTS

2. REVENUE
3. OPERATING PROFIT
2005 2004 2005 2004 K’000 K’000 K’000 K’000
Operating revenue
Sales revenue 354,900 401,979 352,212 400,428
354,900 401,979 352,212 400,428
Other Income
Interest 424 777 366 727
Foreign Exchange gain 6,356 5,170 3,849 5,170
Gain on disposal of subsidiary 3,045 - 5,708 -
Other income 2,145 296 322 366
11,970 6,243 10,245 6,263
Operating profit has been deter-mined after charging (crediting)Loss/(gain) on disposal of fixed assets
- 17 - -
Loss/(gain) on disposal of subsid-iary
(3,045) - (5,708) -
Personnel costs 30,271 26,365 29,701 25,667
Donations 2,386 2,754 2,386 2,754
Preliminary costs incurred in relation to the Solomon Islands investment project
- 1,584 - 1,584
Auditors remuneration -Audit 179 176 147 167
- Other services 264 195 264 195
31
Consolidated Holding Company
NOTES TO THE FINANCIAL STATEMENTS

32
Income Tax Expense K’000 K’000
Current tax 16,805 29,934 15,743 29,934
Deferred tax charged to income statement 8,498 8,037 8,498 8,037
Over provision in prior years (48) (172) (48) (135)
25,255 37,799 24,193 37,836
The income tax expense has been calculated as follows:
Profit for the year 126,154 87,493 124,989
Income tax on the profit for the period at
30% 26,887 37,846 26,248 37,497
Tax effect of permanent differences:
Other items (1,584) 125 (2,007) 474
Over provision in prior years (48) (172) (48) (135)
Income tax expense 25,255 37,799 24,193 37,836
Deferred Tax Provision Balance brought forward (75,206) (62,098) (75,206)
Income statement charge/credit (8,498) (8,037) (8,498) (8,037)
Prior year adjustment from temporary differences 239 (1,447) 239 (1,447)
Tax charged/credited to equity 48 (3,624) 48 (3,624)
Balance carried forward (83,417) (75,206) (83,417) (75,206)
This balance comprises the tax effect of: Accruals 150 235 150 235
Hedge liability 259 (99) 259 (99)
Provisions 416 416 416 416
Consumables (29,206) (24,666) (29,206) (24,666)
Stock valuation differentials (2,982) (3,051) (2,982) (3,051)
Prepayments (592) (620) (592) (620)
Unrealised foreign exchange gains (4,456) (8,581) (4,456) (8,581)
Excess tax depreciation (241,647) (214,321) (241,647) (214,321)
(278,058) (250,687) (278,058) (250,687)
Tax Effect at 30% (83,417) (75,206) (83,417) (75,206)
5. DIVIDENDS PAID AND DECLARED
Final - prior year 24,000 - 24,000 -
Interim -current year 23,915 14,349 24,000 14,400
47,915 14,349 48,000 14,400
4. INCOME TAX
89,624
(62,098)
Consolidated Holding Company
K’000 K’000
NOTES TO THE FINANCIAL STATEMENTS

33
2004 Consolidated K'000 Investments - Non current
5,661 Investment in Port Moresby Stock Exchange 540
6,201 Held for Trading Investments - Current Listed equities at market value 339
Total investments 6,540
Holding Company 2005 2004
K'000 K'000 The holding company's investment in subsidiaries and associates comprises: Shares at cost 33,272 1,008
Country of Activities Shareholding
Solomon Guadalcanal Plains Palm Oil Ltd Grow and process oil palm 80 Islands Dami Australia Pty Limited Maintaining oil palm genetic material 100 Australia New Britain Nominees Limited Holding company for treasury shares 100 PNG
7. TRADE AND OTHER RECEIVABLES Consolidated Holding Company
2005 2004 2005 2004 K'000 K'000 K'000 K'000
Trade receivables 42,892 60,197 40,851 59,806 Provision for doubtful debts (416) (416) (416) (416) Other receivables 7,691 14,506 7,691 14,506 Prepayments 1,795 981 1,772 955
51,962 75,268 49,898 74,851
8. INVENTORIES
Palm oil products 19,660 12,168 19,660 12,168 Livestock 334 249 334 249 Produce stocks - 90 - 90 Nursery and seed stocks 103 117 103 117 Stores and sundry stocks 10,879 5,349 9,851 5,349 Spare parts 20,081 20,091 20,081 20,091
51,057 38,064 50,029 38,064
9. BANK LOAN AND OVERDRAFT
Bank loan (note 13) 12,963 13,802 12,963 13,802 Bank overdraft 6,633 3,516 6,499 3,516
19,596 17,318 19,462 17,318
Refer note 13 to the financial statements for details of securities pledged in respect of bank facilities
6. INVESTMENTS
Investment in joint venture at equity value (note 24)
IncorporationPercentage
5,055
5,055
5,055
2005K'000
-
-
NOTES TO THE FINANCIAL STATEMENTS

34
10. PROPERTY, PLANT AND EQUIPMENT Land and
BuildingsPlant and
EquipmentCapital WIP Total
Consolidated K’000 K’000 K’000 K’00031 December 2005Opening net book amount 105,119 68,718 38,215 212,052
Additions 17,956 38,244 40,441 96,641
Disposals/Adjustments (12) (73) - (85)
Transfers - - (39,392) (39,392)
Depreciation (4,193) (19,218) - (23,411)
Closing net book amount 118,870 87,671 39,264 245,805
At cost 152,694 219,106 39,264 411,064
At valuation 13,825 5,649 - 19,474
Accumulated depreciation (47,649) (137,084) - (184,733)
118,870 87,671 39,264 245,805
31 December 2004
Opening net book amount 96,038 56,166 42,854 195,058
Additions 13,288 26,656 35,305 75,249
Disposals/Adjustments (17) - - (17)
Transfers - - (39,944) (39,944)
Depreciation (4,190) (14,104) - (18,294)
Closing net book amount 105,119 68,718 38,215 212,052
At cost 134,750 180,935 38,215 353,900
At valuation 13,825 5,649 - 19,474
Accumulated depreciation (43,456) (117,866) - (161,322)
105,119 68,718 38,215 212,052
Company
31 December 2005
Opening net book amount 103,268 68,606 38,215 210,089
Additions 10,475 28,145 40,441 79,061
Disposals/Adjustment - - - -
Transfers - - (39,392) (39,392)
Depreciation (4,202) (18,979) - (23,181)
Closing net book amount 109,541 77,772 39,264 226,577
At cost 143,367 208,788 39,264 391,419
At valuation 13,825 5,649 - 19,474
Accumulated depreciation (47,651) (136,665) - (184,316)
109,541 77,772 39,264 226,577
31 December 2004
Opening net book amount 94,170 56,081 42,854 193,105
Additions 13,288 26,568 35,240 75,096
Disposals/Adjustments - 36 - 36
Transfers - - (39,879) (39,879)
Depreciation (4,190) (14,079) - (18,269)
Closing net book amount 103,268 68,606 38,215 210,089
At cost 132,892 180,643 38,215 351,750
At valuation 13,825 5,649 - 19,474
Accumulated depreciation (43,449) (117,686) - (161,135)
103,268 68,606 38,215 210,089
NOTES TO THE FINANCIAL STATEMENTS

Mature Immature TotalConsolidated K’000 K’000 K’000
31 December 2005
Opening net book amount 76,385 26,919 103,304
Additions 18,868 36,972 55,840
Disposals/Adjustments - - -
Transfers - (18,868) (18,868)
Depreciation/amortisation (6,140) - (6,140)
Closing net book amount 89,113 45,023 134,136
At cost 133,653 45,023 178,676
At valuation 6,566 - 6,566
Accumulated depreciation (51,106) - (51,106)
89,113 45,023 134,136
31 December 2004
Opening net book amount 57,803 29,632 87,435
Additions 23,928 21,215 45,143
Disposals/Adjustments - - -
Transfers - (23,928) (23,928)
Depreciation/amortisation (5,346) - (5,346)
Closng net book amount 76,385 26,919 103,304
At cost 114,785 26,919 141,704
At valuation 6,566 - 6,566
Accumulated depreciation (44,966) - (44,966)
Company 76,385 26,919 103,304
31 December 2005
Opening net book amount 74,737 26,916 101,653
Additions 18,868 21,964 40,832
Disposals/Adjustments - - -
Transfers - (18,868) (18,868)
Depreciation (6,140) - (6,140)
Closing net book amount 87,465 30,012 117,477
At cost 131,862 30,012 161,874
At valuation 6,566 - 6,566
Accumulated depreciation (50,963) - (50,963)
87,465 30,012 117,477
31 December 2004
Opening net book amount 57,803 29,632 87,435
Additions 22,137 19,421 41,558
Disposals/Adjustments - - -
Transfers - (22,137) (22,137)
Depreciation (5,203) - (5,203)
Closing net book amount 74,737 26,916 101,653
At cost 112,994 26,916 139,910
At valuation 6,566 - 6,566
Accumulated depreciation (44,823) - (44,823)
74,737 26,916 101,653
11. PLANTATIONS
35
NOTES TO THE FINANCIAL STATEMENTS

15. ISSUED CAPITAL
36
Foreign currency translation reserve
Balance brought forward (174) (30) - -
Movement in the year 41 144 - -
Balance carried forward (133) (174) - -
Capital redemption reserve
Balance brought forward and carried forward 17 17 17 17
Hedge reserve
Balance brought forward 129 (8,527) 129 (8,527)
Movement in the year (340) 8,656 (340) 8,656
Balance carried forward (211) 129 (211) 129
Asset valuation reserve
Balance brought and carried forward 790 790 790 790
Total reserves 463 762 596 936
12. TRADE AND OTHER PAYABLES
13. BANK LOAN
14. OWNG TO/FROM GROUP COMPANIES
120 million issued and fully paid shares 30,000 30,000 30,000 30,000
16. RESERVES
All balances owing to or from subsidiary companies have been eliminated on consolidation
Current (note 9) 12,963 13,802 12,963 13,802
Non Current 1,543 13,003 1,543 13,003
Total bank loan 14,506 26,805 14,506 26,805
Consolidated Holding Company2005 2004 2005 2004
K’000 K’000 K’000 K’000
Trade payables 9,998 4,708 9,953 4,708
Accruals 9,573 9,297 9,574 9,287
Clearing accounts 1,576 1,811 1,576 1,811
21,147 15,816 21,103 15,806
The company received a loan of US$13 million from the ANZ Banking Group in 2003, out of which US$8.8 million has been repaid. The remaining balance is payable in quarterly instalments of US$ 1.1 million, with full repayment due by December 2006. Interest is charged at SIBOR plus a margin of 2.50%.
The company received approval for a loan of US$10.1million from ANZ Banking Group in 2005, out of which US$0.5 million has been drawn. The remaining balance will be drawn for the Solomon Island Project in 2006. The loan is payable by December 2016 but no principal repayments are due until 2007. Interest is charged at SIBOR plus margin of 2.00% p.a.
The following securities are provided against facilities offered by ANZ Banking Group, including the above term loans: • Registered equitable mortgage over the assets and undertakings of New Britain Palm Oil Limited. • Registered mortgage leasehold over all state leases comprising all available land and buildings owned by New Britain Palm Oil and its wholly owned subsidiaries. • Cross Guarantee between New Britain Palm Oil Limited and its 100% owned subsidiaries.
NOTES TO THE FINANCIAL STATEMENTS
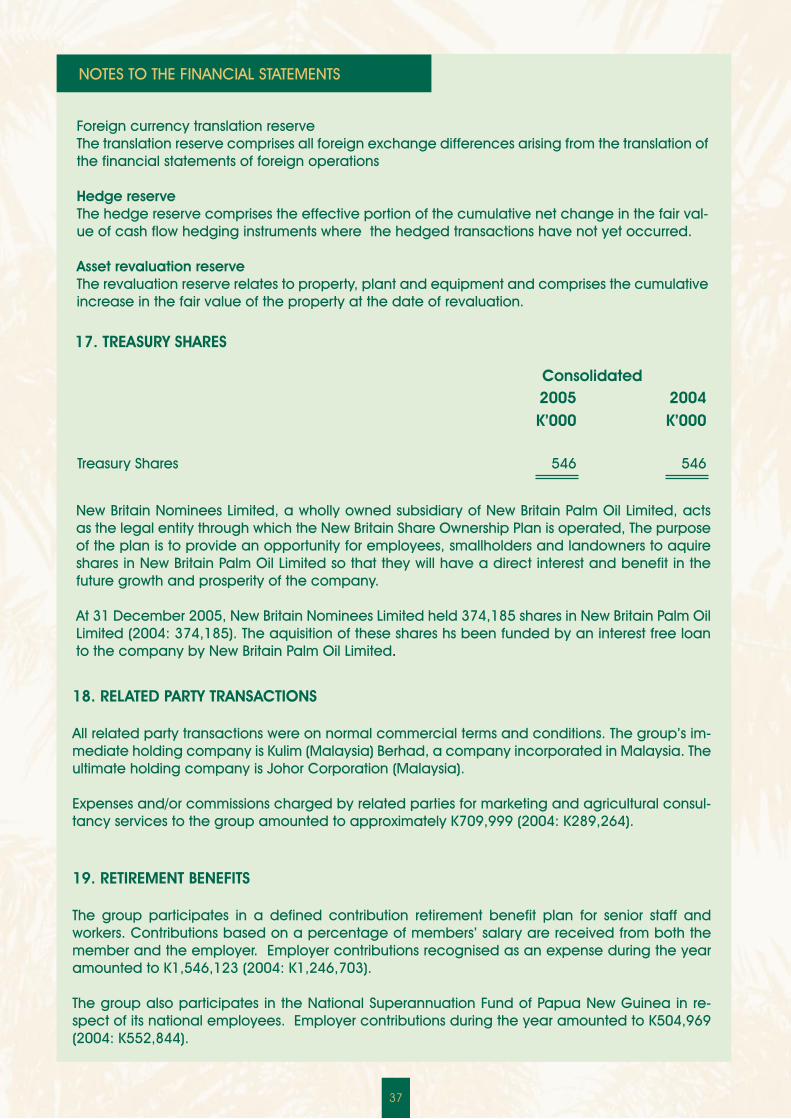
18. RELATED PARTY TRANSACTIONS
All related party transactions were on normal commercial terms and conditions. The group’s im-mediate holding company is Kulim (Malaysia) Berhad, a company incorporated in Malaysia. The ultimate holding company is Johor Corporation (Malaysia).
Expenses and/or commissions charged by related parties for marketing and agricultural consul-tancy services to the group amounted to approximately K709,999 (2004: K289,264).
19. RETIREMENT BENEFITS
The group participates in a defined contribution retirement benefit plan for senior staff and workers. Contributions based on a percentage of members’ salary are received from both the member and the employer. Employer contributions recognised as an expense during the year amounted to K1,546,123 (2004: K1,246,703).
The group also participates in the National Superannuation Fund of Papua New Guinea in re-spect of its national employees. Employer contributions during the year amounted to K504,969 (2004: K552,844).
37
New Britain Nominees Limited, a wholly owned subsidiary of New Britain Palm Oil Limited, acts as the legal entity through which the New Britain Share Ownership Plan is operated, The purpose of the plan is to provide an opportunity for employees, smallholders and landowners to aquire shares in New Britain Palm Oil Limited so that they will have a direct interest and benefit in the future growth and prosperity of the company.
At 31 December 2005, New Britain Nominees Limited held 374,185 shares in New Britain Palm Oil Limited (2004: 374,185). The aquisition of these shares hs been funded by an interest free loan to the company by New Britain Palm Oil Limited.
17. TREASURY SHARES
2005 2004K’000 K’000
Treasury Shares 546 546
Consolidated
Foreign currency translation reserveThe translation reserve comprises all foreign exchange differences arising from the translation of the financial statements of foreign operations
Hedge reserveThe hedge reserve comprises the effective portion of the cumulative net change in the fair val-ue of cash flow hedging instruments where the hedged transactions have not yet occurred.
Asset revaluation reserveThe revaluation reserve relates to property, plant and equipment and comprises the cumulative increase in the fair value of the property at the date of revaluation.
NOTES TO THE FINANCIAL STATEMENTS

21. FINANCIAL INSTRUMENTS
(a) Financial instrumentsThe group’s financial instruments include cash and cash equivalents, receivables, accounts payable, borrowings and commodity hedges.
(b) Financial risk managementThe groups activities expose it to a variety of financial risks, including the effects of changes in market prices, foreign currency exchange rates and interest rates. The group monitors these financial risks and seeks to minimise the potential adverse effects on the financial performance of the group. The group uses derivative financial instruments to hedge the exposure to changes in market prices.
(c) Foreign exchange riskThe group undertakes transactions denominated in foreign currencies from time to time and resulting from these activities, exposures in foreign currencies arise. The group’s sales are predominantly denominated in US dollars and the group also has US dollar denominated loans and other liabilities. It is not the group’s policy to hedge these foreign currency risks.
(d) Interest rate riskThe group has variable rate borrowings that are used to fund ongoing activities, and accordingly the company’s income and cash flows are exposed to changes in market interest rates.
(e) Credit riskThe group has no significant concentrations of credit risk. The group has policies in place to ensure that sales of products and services are made to customers with an appropriate credit history and that limits the amount of credit exposure to any one customer.
(f) Liquidity riskThe group aims to prudently manage liquidity risk by maintaining sufficient cash and other liquid assets or the availability of funding through uncommitted credit facilities.
(g) Fair value estimationCommodity hedges are measured at fair value. The face values less any estimated credit adjustments for all other financial assets and liabilities are assumed to approximate their fair values.
2005 2004 2005 2004
CPO (sell) 47,250 41,500 444 420
CPO (buy) 12,750 9,000 440 427
PKO (sell) - 2,500 - 634
PKO (buy) - 1,000 - 650
RBDOL (sell) - 6,000 - 500
RBDOL (buy) - 6,000 - 500
(a) Hedge commitmentsThe company enters into hedge contracts for the purchase and sale of Malaysian/Sumatra palm oil to guarantee a minimum price for the sale of its own palm oil for which there is no forward market and to close out positions previously taken. The company does not produce Malaysian/Sumatra palm oil. At year end the following outstanding hedge contracts were in place.
As all hedge transactions are regarded as being highly effective, all gains and losses relating to their re-measurement to fair value are recognised in the hedge reserve and are subsequently brought to account in the income statement in the same period as the transactions to which the hedges relate.
(b) Capital commitmentsThe holding company and the group have commitments for future capital expenditure amounting to K22.4m at 31 December 2005 (2004: K9.24m)
Tonnes Average price US$/tonne
20. COMMITMENTS
38
NOTES TO THE FINANCIAL STATEMENTS

The group has a 50% interest in PT Damitama mas Sejahtera, a company established in Indonesia to produce seeds for sale to third parties. The group has contributed seed material as its contribution to the joint venture, and has no further financial commitment. All other development costs have been met by the other joint venture participant.
The joint venture commenced commercial seed production in 2003. The group’s share of the operating result of the joint venture has been recognised in the income statement under equity method of accounting. Its share of movement in reserves is recognised in reserves. The cumulative movements are adjusted against the carrying
2005 2004K’000 K’000
Share of turnover 4,371 1,930Share of other income 201 137Share of expenses (3,900) (931)
672 1,136
Share of total assets 6,180 5,749Share of liabilities (1,125) (88)
5,055 5,661
2005 2004Toea Toea
Basic earnings per share 53.6 73.6Diluted earnings per share 53.6 73.6
24. INTERESTS IN JOINT VENTURES
The number of people employed by the group at year end was 5,979 (2004: 6,430).
The Group share of net assets of the joint venture is represented by:
23. EARNINGS PER SHARE
22. EMPLOYEES
Consolidated
39
NOTES TO THE FINANCIAL STATEMENTS

The Directors attended meetings held during the year 2005 as shown below:
Board Meetings
Name
Ahamad Mohamad 4 4Tan Sri’ Dr. Arshad Ayub 4 4Nicholas Mark Thompson 4 4Dato Mohd Ismail Che Rus 4 3Winifred Kamit 4 3Sheik Sharafuddin Sheik Mohd 4 3
Audit Committee Meetings
Tan Sri’ Dr. Arshad Ayub 1 1Ahamad Mohamad 1 1Winifred Kamit 1 1
Environmental Committee Meetings
Winifred Kamit 1 1Nicholas Mark Thompson 1 1Dato Mohd Ismail Che Rus 1 1
No of Meetings Eligible to Attend
No of Meetings Attended
26. ATTENDANCE AT MEETINGS
Investments in subsidiary During the year, the Group invested K33.1m to acquire an 80% interest in Guadalcanal Plains Palm Oil Limited which has been established to acquire a run down plantation and mill assets in Solomon Islands. The invested funds are being used for the redevelopment of these assets. Minority interest arising on this acquisition is classified separately in the balance sheet.
Disposal of subsidiary During the year, the Group sold its fully owned subsidiary, Capital Stock Brokers Limited to Bank of South Pacific for K6.6m.
25. INVESTMENT AND DISPOSAL OF SUBSIDIARIES
40
NOTES TO THE FINANCIAL STATEMENTS
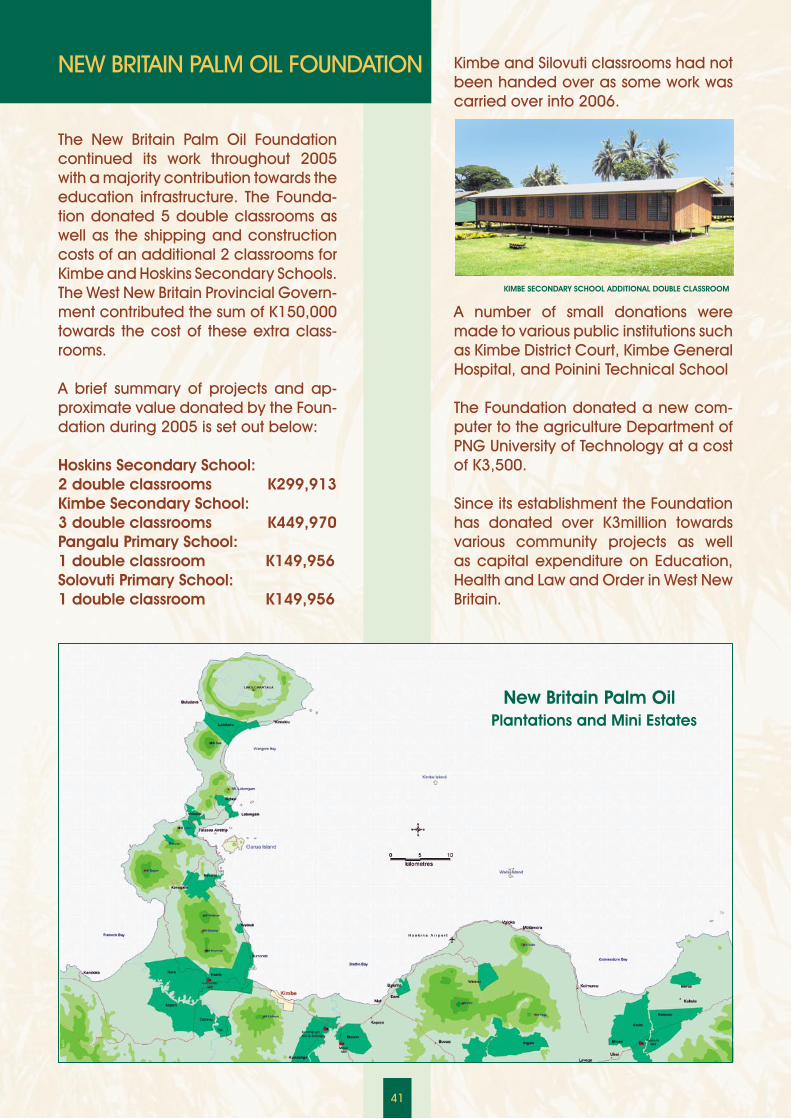
The New Britain Palm Oil Foundation continued its work throughout 2005 with a majority contribution towards the education infrastructure. The Founda-tion donated 5 double classrooms as well as the shipping and construction costs of an additional 2 classrooms for Kimbe and Hoskins Secondary Schools. The West New Britain Provincial Govern-ment contributed the sum of K150,000 towards the cost of these extra class-rooms.
A brief summary of projects and ap-proximate value donated by the Foun-dation during 2005 is set out below: Hoskins Secondary School: 2 double classrooms K299,913Kimbe Secondary School: 3 double classrooms K449,970 Pangalu Primary School: 1 double classroom K149,956Solovuti Primary School: 1 double classroom K149,956
Kimbe and Silovuti classrooms had not been handed over as some work was carried over into 2006.
A number of small donations were made to various public institutions such as Kimbe District Court, Kimbe General Hospital, and Poinini Technical School
The Foundation donated a new com-puter to the agriculture Department of PNG University of Technology at a cost of K3,500.
Since its establishment the Foundation has donated over K3million towards various community projects as well as capital expenditure on Education, Health and Law and Order in West New Britain.
NEW BRITAIN PALM OIL FOUNDATION
KIMBE SECONDARY SCHOOL ADDITIONAL DOUBLE CLASSROOM
41
New Britain Palm OilPlantations and Mini Estates

www.nbpol.com.pg
NEW
BRITAIN
PALM
OIL LIM
ITED A
nnual Re
po
rt 2006
New BritainPalm Oil Limited
PMB KIMBEWest New Britain Province
Papua New Guinea
Phone (675) 985 2177Fax (675) 985 2003
Design & Photography by Richard Dellman/Advantage, Port Moresby