New Approach for Detection of Ultra Trace Amounts of ... oil has a large number of different...
11
International Journal of Science and Research (IJSR) ISSN (Online): 2319-7064 Index Copernicus Value (2013): 6.14 | Impact Factor (2014): 5.611 Volume 5 Issue 1, January 2016 www.ijsr.net Licensed Under Creative Commons Attribution CC BY New Approach for Detection of Ultra Trace Amounts of Organic Compounds as Markers of Predict to Exploration of Petroleum Reservoir by Cloud Point Extraction Combined with UV-VIS Spectrophotometry and GC-MS Techniques Jameel M. Dhabab 1 , Zuhair A. A. Khammas 2 , Ali Jaafar 3 1, 3 Department of Chemistry, College of Science, Al- Mustansyriah University, Baghdad, Iraq 2 Department of Chemistry, College of Science for Women, University of Baghdad, Jadiyriah, Baghdad, Iraq Abstract: This work is an attempt to use what is to recognize the leakage of hydrocarbons as Dienzothiophene (DBT) and N- Ethylcarbazole (CARB) from petroleum reservoir from depth to surface so as to the possibility of using such a phenomenon as proximity indicator for petroleum deposits. The soil and water samples near ofa productive oil wells(Maysan- Iraq) were chosen as a case study. The ultra trace quantities of these hydrocarbon compounds that constitute organic extracted were determined bycloud point extraction (CPE) combined with UV-VIS and GC-MS techniques.The optimization of conditions of CPE was conducted with UV-VIS and using Triton114(TX 114) as non-ionic surfactants. Theseconditions were of 0.4-0.6 mL ofTX-114, equilibration temperature of 65 ºC , incubation time of 20 min and 0.5 MLiCl chosen as the best electrolyte for CPE. Theconditions and statistical analysis ofmeasurement byUV-VIS and GC-MASS techniques to DBT andCARB are λ max at 231 and237nm, concentration range of Beer's law was (0.3-3, µg mL -1 ) ,molar absorptivity of 5.9892x10 4 and5.6523x104 L mol -1 cm -1 ,LOD values were of 0.0021 and 0.251µg mL -1 ,and LOQ values were 0.00693 and 0.8283µg mL -1 respectively. The conditions of separation used for thedetermination ofDBT and CARB by GC-MSwere the same conditions of CPE-UV-VIS. The results indicated that the retention times were of 16.22 and17.88 min, concentration range of 0.01-2,0.05-2 µg mL -1 ) for DBT and CARB respectively. LODvalue ofDBTwas 0.0074 µg mL -1 , whileforCARBwas0.00388 µg mL - 1 .Analysis of hydrocarbons compounds concentrations in organic extract showed that the amounts of these compounds were different. For example, the concentration of DBT in Maysan Governorate near Halfaya well(1000m) was of 1.1953 µg mL -1 ,while it has a value of 0.4802 µg mL -1 at 750 m and 0.163 µg mL -1 at 500 m. The experimental results of this study indicated that the analysis of hydrocarbons which extracted from soil and water samples can be used to predict or the Remote sensing for the presence of petroleum accumulation or indicator of pollution. Keywords: Crude Oil, Dibezothiophene, N-Ethyl carbazole, cloud point extraction, UV-VIS, GC-MS, Triton X-114 1. Introduction Petroleum (Crude oil) represents a complex mixture containing both organic and inorganic chemical species, hydrocarbons, hetro organic compounds, and metals [1]. Crude oil has a large number of different hydrocarbons; the most commonly found species are aromatic hydrocarbons, alkanes (paraffins), cycloalkanes (naphthenes), or more complicated compounds like asphaltenes [2, 3]. Each petroleum variety has a unique mixture of chemicals, which define its chemical and physical properties, like colour, density and viscosity [4, 5]. Polycyclic aromatic hydrocarbons (PAHs) are a group of compounds whose carcinogenic and/or mutagenic effects are well known. These substances can be produced in anthropogenic and natural processes and they can be found in many different types of samples, both environmental and biological. For this reason, their monitoring and detection has become an important and difficult problem and this has led to develop a new analytical methods with improving selectivity and sensitivity [6, 7]. Many of organic markers based on aromatic and aliphatichydrocarbons are well suited for the characterization of oil families and estimation of source faces, degree of preservation, thermal maturity level, and migration. On the other hand hetero compounds (nitrogen, oxygen, and sulphur, NSO compounds) that make up a small portion of most crude oils have specific implications in petroleum exploration, because their greater structural diversity results in greater variations of their chemical and physical properties [5]. Consequently, hetero PAHs compounds can provide useful geochemical clues that trace petroleum compounds back to their biological precursors [8]. Organic nitrogen and sulphate compounds occur in crude oils in very small amounts, with an average content about 0.l%by weight [9]. Most nitrogen and sulphate compounds in petroleum are in heterocyclic aromatic structures and are concentrated in the large molecular weight and high boiling point fractions [5, 10]. The presence of these compounds in crude oils and rocks source have been reported to show great promise as a good geochemical parameters that might play a significant path in exploration and production for crude oil [11]. Estimation of organic pollutants identities and their low concentrations in surface water, waste water, sediments, and Paper ID: NOV152647 562
Transcript of New Approach for Detection of Ultra Trace Amounts of ... oil has a large number of different...

International Journal of Science and Research (IJSR) ISSN (Online): 2319-7064
Index Copernicus Value (2013): 6.14 | Impact Factor (2014): 5.611
Volume 5 Issue 1, January 2016 www.ijsr.net
Licensed Under Creative Commons Attribution CC BY
New Approach for Detection of Ultra Trace Amounts of Organic Compounds as Markers of
Predict to Exploration of Petroleum Reservoir by Cloud Point Extraction Combined with UV-VIS
Spectrophotometry and GC-MS Techniques
Jameel M. Dhabab1, Zuhair A. A. Khammas2, Ali Jaafar3
1, 3Department of Chemistry, College of Science, Al- Mustansyriah University, Baghdad, Iraq
2Department of Chemistry, College of Science for Women, University of Baghdad, Jadiyriah, Baghdad, Iraq
Abstract: This work is an attempt to use what is to recognize the leakage of hydrocarbons as Dienzothiophene (DBT) and N-Ethylcarbazole (CARB) from petroleum reservoir from depth to surface so as to the possibility of using such a phenomenon as proximity indicator for petroleum deposits. The soil and water samples near ofa productive oil wells(Maysan- Iraq) were chosen as a case study. The ultra trace quantities of these hydrocarbon compounds that constitute organic extracted were determined bycloud point extraction (CPE) combined with UV-VIS and GC-MS techniques.The optimization of conditions of CPE was conducted with UV-VIS and using Triton114(TX 114) as non-ionic surfactants. Theseconditions were of 0.4-0.6 mL ofTX-114, equilibration temperature of 65 ºC , incubation time of 20 min and 0.5 MLiCl chosen as the best electrolyte for CPE. Theconditions and statistical analysis ofmeasurement byUV-VIS and GC-MASS techniques to DBT andCARB are λmax at 231 and237nm, concentration range of Beer's law was (0.3-3, µg mL-1) ,molar absorptivity of 5.9892x10⁴ and5.6523x104 L mol-1cm-1,LOD values were of 0.0021 and 0.251µg mL-1,and LOQ values were 0.00693 and 0.8283µg mL-1 respectively. The conditions of separation used for thedetermination ofDBT and CARB by GC-MSwere the same conditions of CPE-UV-VIS. The results indicated that the retention times were of 16.22 and17.88 min, concentration range of 0.01-2,0.05-2 µg mL-1) for DBT and CARB respectively. LODvalue ofDBTwas 0.0074 µg mL-1, whileforCARBwas0.00388 µg mL-
1.Analysis of hydrocarbons compounds concentrations in organic extract showed that the amounts of these compounds were different. For example, the concentration of DBT in Maysan Governorate near Halfaya well(1000m) was of 1.1953 µg mL-1,while it has a value of 0.4802 µg mL-1 at 750 m and 0.163 µg mL-1 at 500 m. The experimental results of this study indicated that the analysis of hydrocarbons which extracted from soil and water samples can be used to predict or the Remote sensing for the presence of petroleum accumulation or indicator of pollution. Keywords: Crude Oil, Dibezothiophene, N-Ethyl carbazole, cloud point extraction, UV-VIS, GC-MS, Triton X-114 1. Introduction Petroleum (Crude oil) represents a complex mixture containing both organic and inorganic chemical species, hydrocarbons, hetro organic compounds, and metals [1]. Crude oil has a large number of different hydrocarbons; the most commonly found species are aromatic hydrocarbons, alkanes (paraffins), cycloalkanes (naphthenes), or more complicated compounds like asphaltenes [2, 3]. Each petroleum variety has a unique mixture of chemicals, which define its chemical and physical properties, like colour, density and viscosity [4, 5]. Polycyclic aromatic hydrocarbons (PAHs) are a group of compounds whose carcinogenic and/or mutagenic effects are well known. These substances can be produced in anthropogenic and natural processes and they can be found in many different types of samples, both environmental and biological. For this reason, their monitoring and detection has become an important and difficult problem and this has led to develop a new analytical methods with improving selectivity and sensitivity [6, 7]. Many of organic markers based on aromatic and aliphatichydrocarbons are well suited for the
characterization of oil families and estimation of source faces, degree of preservation, thermal maturity level, and migration. On the other hand hetero compounds (nitrogen, oxygen, and sulphur, NSO compounds) that make up a small portion of most crude oils have specific implications in petroleum exploration, because their greater structural diversity results in greater variations of their chemical and physical properties [5]. Consequently, hetero PAHs compounds can provide useful geochemical clues that trace petroleum compounds back to their biological precursors [8]. Organic nitrogen and sulphate compounds occur in crude oils in very small amounts, with an average content about 0.l%by weight [9]. Most nitrogen and sulphate compounds in petroleum are in heterocyclic aromatic structures and are concentrated in the large molecular weight and high boiling point fractions [5, 10]. The presence of these compounds in crude oils and rocks source have been reported to show great promise as a good geochemical parameters that might play a significant path in exploration and production for crude oil [11]. Estimation of organic pollutants identities and their low concentrations in surface water, waste water, sediments, and
Paper ID: NOV152647 562

International Journal of Science and Research (IJSR) ISSN (Online): 2319-7064
Index Copernicus Value (2013): 6.14 | Impact Factor (2014): 5.611
Volume 5 Issue 1, January 2016 www.ijsr.net
Licensed Under Creative Commons Attribution CC BY
soil is an important and difficult topic in environmental analysis. Although many man-made organic chemicals have been detected in the aquatic environment and soil, petroleum hydrocarbons including PAHs represent some of the most common pollutants found in water from the industrial process where petroleum products are used widely [12, 13]. The preconcentration and extraction of these compounds from water and soil can be carried out by means of liquid-liquid extraction (LLE) and solid-phase extraction (SPE) techniques. LLE is a very useful technique, it has been used in the US Environmental Protection Agency (EPA) [14, 15]. However, it is a longtime consuming and requires large amounts of solvent. SPE is a less time consuming method, but it still requires more organic solvents for the elution step. Recently, PAH extraction with surfactants based on the cloud-point phenomenon named as cloud point extraction (CPE) has been proposed [16, 17]. The use of this approach offers some advantages for the extraction of PAHs compared with traditional solvent extraction ability to concentrate PAHs with high recoveries, high preconcentration factors, safety, low cost benefits, and very small amounts of the relatively nonflammable and nonvolatile surfactant are required; suited with micellar orhydroorganic mobile phase, etc. [18].
..The aim of this study isthe possibility of obtaining data for the concentration of such organic compounds and how it relates to the leaking of oil components and therefore potentially be used as indicators of the presence of petroleum, which helps to petroleum exploration or identified it as environmental contaminants. 2. Experimental 2.1 Apparatus UV-Vis Spectrophotometer equipped with 10 mm quartz cellwas used for the scanning of the absorption spectra and absorbance measurements for the target analytes throughout this study . The shaking water bath SW23 microprocessor with PlO temperature control (JULABO GmbH, Germany) was employed during the course of CPE experiments. A Shimadzu GCMS-QP2010 Ultra, CARY 100 Conc. Australia Double beam was used in this study. GC Column used was the Inert Cap 1MS (Thickness 0.25um, Length 30m, Internal Diameter 0.25mm , injection temperature was 250ºC ,injection mode was splitless, pressure was 100 kPa, column flow was 1.33mL/min, ion source temperature was 200 ºC, interface temperature was 280 ºC, ionization mode was EI, start was 35.00 m/z and ending was 500.00 m/z .
The oven temperature programmed as 100 ºC for 3min, 200 ºC for 3min, and 250 ºC for 3min . 2.2Chemicals All of the materials and reagents which used in this work are of high purity. The HPLC gradewater were used in the preparation of the solutions and double distilled water for washing glass wares .The PAHs (dibezothiophen and N-ethylcarbazol) were supplied by Sigma-Aldrich. Triton X-114 obtained from Sigma Ultra UK. HPLC-grade acetonitrile obtained from HiMedia. Sodium chloride, lithium chloride and potassium chloride were obtained from Fluka (Germany). 2.3 Preparation of Samples 2.3.1 Soil Samples Clay samples were taken at different depths of different Wells column samples were cutting samples, which is about gestures close to the surface and the depths were of 250, 500, 750, 1000 m, another type of soil which got from the banks of marsh. These clay samples were mixed, dried in oven and milled to precise sizes 50 micron.10 g of clay was accurately weight and taken as a test sample.The extraction of samples was carried out by soxhlet method with 250 mL methylene chloride for 8 hours.The extracted solution was concentrated in rotary evaporator to less than 1 mL, and the volume was collected and completed to 10 mL with distilled water. This sample solution was subjected to thegeneral CPE procedure. 2.3.2 Water Samples Water sample were collected in polyethylene containers which previously cleaned with diluted chromic acid to remove materials and other contaminants according to APHA [19]. These containers were finally washed with distilled water and filled until use. In the site, the containers were rinsed well with marsh water before filling them with test samples. The containers were then marked and sealed lock immediately. The collected water samples were filtered through 0.45μm Wattmann filter paper and of each sample stored in refrigerator at (0-4oC) until use. Each water sample was subjected to the general CPE procedure. 2.3.3 Sites of the Sampling Allsoil and water samples were collected from four different sites located at Maysan Governorate in the south of Iraq as follows and indicated in Figure 1. 1-Marsh ofOm nia'aj. 2- Marsh ofAl-Disyme. 3-Trocar beside petro china company and. 4- Halfaya oil wells
Paper ID: NOV152647 563

International Journal of Science and Research (IJSR) ISSN (Online): 2319-7064
Index Copernicus Value (2013): 6.14 | Impact Factor (2014): 5.611
Volume 5 Issue 1, January 2016 www.ijsr.net
Licensed Under Creative Commons Attribution CC BY
Figure 1: Map of the study area including sampling locations (Maysan-Iraq)
2.4 General CPE Procedure To an aliquot of 10 mL of a solution containing known amount of DBT orCARB standard (0.3-3 ppm) or sample solution were taken into a series of 10 mL graduated centrifugal tubes, 0.5M of lithium chloride was added and 0.6 mL of 10% (v/v) Triton X-114 were added and diluted to mark with water. The content of each tube was transferred to water bath at 65°C for 20 min to form cloudy solution. The separation of the phases was accelerated by centrifuging at 3500 rpm for 20 min, if the weather was hot we can enhance the separation with sudden cooling with ice. After decantation of aqueous phase, the surfactant-rich phase that remained adhered to the tube was dissolved with a 1.0 mL of ethanol and the absorbance of each solution containing the analyte was measured spectrophotometrically by UV-VIS at specificλmax. 3. Results and Discussion 3.1Optimization of CPE Conditions All of the parameters that impact on the CPE methodology
such as,type of surfactant, amount of surfactant, equilibration temperature(T), incubation time (Et), and the type of electrolyte for the extraction processes were optimized by one-factor-a-time (OFAT) procedure for improving the recovery of extraction, sensitivity and detection limit for the determination of each compounds [20, 21] 3.1.1 Effect of Surfactant Type In this study, four types of non-ionic surfactants,such as TX-114, TX-100, Tween-80, Tween-20 were tested. The experiments were conducted with 10 mL solution containing of μg mL-1 of each target analytes and % of each surfactant followed the general CPE procedure. The results are depicted in Figures 2 and 3. It can seen that the best recovery was obtained with TX-114 for both DBT and CARB compared to the rest of studied surfactants. It is worth mentioning the surfactant of Tween-type has shown that the cloudy layer formation needs very higher cloud point temperature than the Triton-type which it is inevitably led to dissociation of target analytes and hence poor recovery obtained. Thus the TX-114 was selected throughout this study.
Paper ID: NOV152647 564

International Journal of Science and Research (IJSR) ISSN (Online): 2319-7064
Index Copernicus Value (2013): 6.14 | Impact Factor (2014): 5.611
Volume 5 Issue 1, January 2016 www.ijsr.net
Licensed Under Creative Commons Attribution CC BY
3.1.2 Effect of TX-114 Amount It is known that a successful cloud point procedure should maximize the extraction efficiency by minimizing the phase volume ratio which improve its enrichment capability and hence the percent recovery. Thus the effect of TX-114 amount on the percent recovery of each target analyte was carried out with 10 mL solution containing μg mL-1 of DBT and CARB anddifferent volumes of 10% (v/v) Triton X-114 ranging from 0.1-0.8 mL , keeping other conditions constant. The recovery percentage of each analyte was shown in Figure 4. It was shown that the percent recoveries
increase significantly and reached maximum at 0.6 and 0.4 mL of 10% TX-114 for BDT and CARB respectively and then decrease thereafter due to the increment in overall volumes and viscosity of surfactant-rich phase leading to poor recovery. At low amount of surfactant the recovery was also poor , perhaps due to the insufficiently of micelles formation entrapping the target analyte quantitatively. Therefore, the optimum volume at 0.6 and 0.4 mL of 10% TX-114 were chosen as optimal for BDT and CARB respectively.
Figure 4: Relation between volume of surfactant and recovery for each of DBT and CARB
3.1.3 Effect of Temperature Since the extraction by CPE is carried out under thermal conditions for the phases separation, an equilibrium temperature plays very important role in CPE process to ensure phases separation and complete extraction of an analyte. Thus effect of temperature was examined at previously optimized conditions and varied from 40 ᴼC to 75 ᴼC at min in a search of optimum value and the results
showed in Figure 5. The findings revealed that the optimum temperature for the extraction of both target organic compounds was of 60 ºC. This gave maximum percent recovery, indicating a good quantitative extraction for both analytes. At higher temperature than optimal , the recovery decreases perhaps due to the gradually thermal decomposition of the compounds. Thus 60 ºC at min was selected as operating equilibrium temperature in this study.
Figure 5: Effect of temperature on recovery of DBT and CARB
3.1.4 Effect of Time The effect of incubation time also important parameter for improving the extraction by CPE process and ultimately obtaining the best recovery [22]. The time of incubation was varied from 5-30 min at other optimum parameters as shown in Figure 6. It can be seen that optimum heating time to
achieve maximum recoveries was 15 min for both extraction of target analytes, indicating the better thermodynamic equilibria for CP formation with smaller volume , higher viscosity of surfactant-rich phase and better partition of each analyte between two phases.
Paper ID: NOV152647 565
International Journal of Science and Research (IJSR) ISSN (Online): 2319-7064
Index Copernicus Value (2013): 6.14 | Impact Factor (2014): 5.611
Volume 5 Issue 1, January 2016 www.ijsr.net
Licensed Under Creative Commons Attribution CC BY
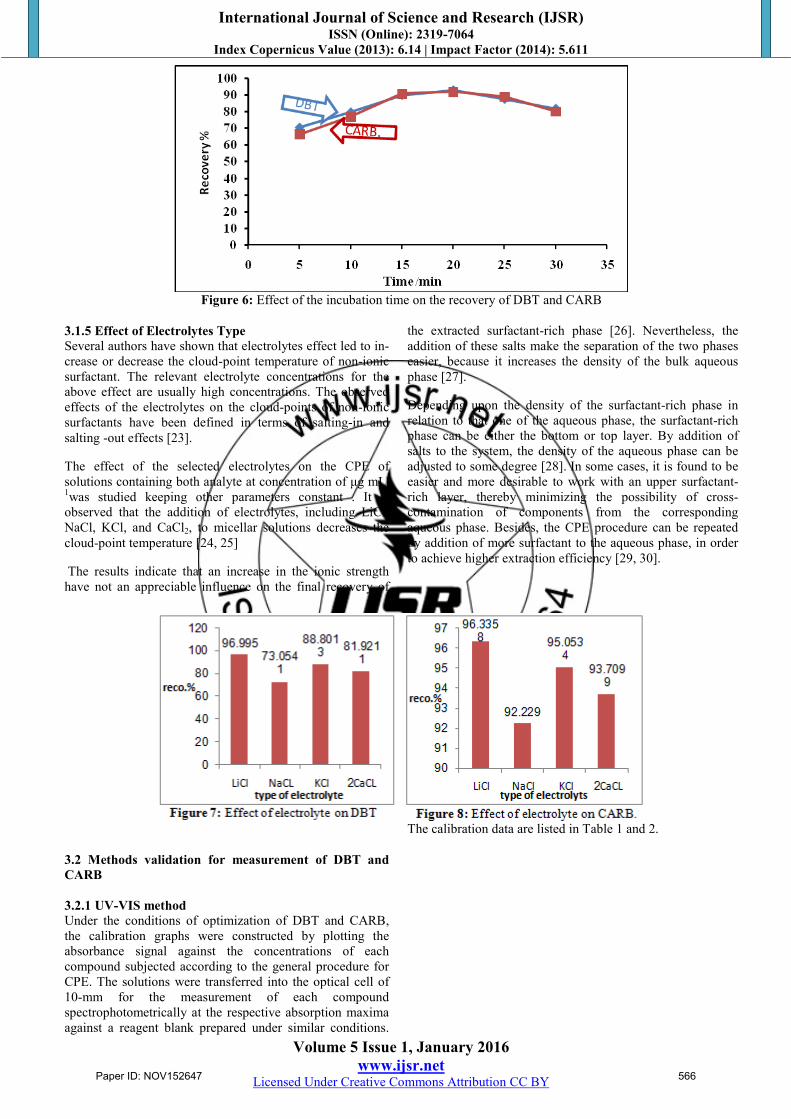
Figure 6: Effect of the incubation time on the recovery of DBT and CARB
3.1.5 Effect of Electrolytes Type Several authors have shown that electrolytes effect led to in-crease or decrease the cloud-point temperature of non-ionic surfactant. The relevant electrolyte concentrations for the above effect are usually high concentrations. The observed effects of the electrolytes on the cloud-points of non-ionic surfactants have been defined in terms of salting-in and salting -out effects [23].
The effect of the selected electrolytes on the CPE of solutions containing both analyte at concentration of μg mL-
1was studied keeping other parameters constant . It is observed that the addition of electrolytes, including LiCl, NaCl, KCl, and CaCl2, to micellar solutions decreases the cloud-point temperature [24, 25]
The results indicate that an increase in the ionic strength have not an appreciable influence on the final recovery of
the extracted surfactant-rich phase [26]. Nevertheless, the addition of these salts make the separation of the two phases easier, because it increases the density of the bulk aqueous phase [27].
Depending upon the density of the surfactant-rich phase in relation to that one of the aqueous phase, the surfactant-rich phase can be either the bottom or top layer. By addition of salts to the system, the density of the aqueous phase can be adjusted to some degree [28]. In some cases, it is found to be easier and more desirable to work with an upper surfactant-rich layer, thereby minimizing the possibility of cross-contamination of components from the corresponding aqueous phase. Besides, the CPE procedure can be repeated by addition of more surfactant to the aqueous phase, in order to achieve higher extraction efficiency [29, 30].
3.2 Methods validation for measurement of DBT and CARB 3.2.1 UV-VIS method Under the conditions of optimization of DBT and CARB, the calibration graphs were constructed by plotting the absorbance signal against the concentrations of each compound subjected according to the general procedure for CPE. The solutions were transferred into the optical cell of 10-mm for the measurement of each compound spectrophotometrically at the respective absorption maxima against a reagent blank prepared under similar conditions.
The calibration data are listed in Table 1 and 2.
Paper ID: NOV152647 566

International Journal of Science and Research (IJSR) ISSN (Online): 2319-7064
Index Copernicus Value (2013): 6.14 | Impact Factor (2014): 5.611
Volume 5 Issue 1, January 2016 www.ijsr.net
Licensed Under Creative Commons Attribution CC BY
Table 1: Statistical calculations of calibration curve of DBT by UV
Parameters Value λ max (nm) 231
Regression equation y=bx +a Y=0.3045x-0.0098 Correlation coefficient (r) 0.999959
Linearity percentage (r2 %) 0.9992 Dynamic range µg.mL-1 0.3 – 3
Molar absorptivity ε (L.mol-1.cm-1) Ɛ=(A/b×c ppm )×m.wt.×1000
5.9892x10⁴
Slop b ( mL.µg-1) 0.3045 Intercept a ( a = y – bx) 0.0098
Standard deviation Sd (n=5)at 1 µg.mL-1
2x10⁻⁴
Percentage Relative standard deviation RSD %
4x10⁻⁵
Limit of detection LOD (µg.mL-1) 2.1x10⁻³
Limit of quantitation LOQ (µg.mL-1)
6.93x10⁻³
Sandells sensitivity (mg.cm-2) 3.0721x10⁻³
Preconcentration factor 250 enrichment factor 29.23
Distribution ratio D 31.287
Table 2: statistical calculations of calibration curve of CARB by UV
Parameters Value λ max nm 237
Regression equation y=bx +a Y=0.3275x-0.0031 Correlation coefficient (r) 0.999949
Linearity percentage (r2 %) 0.9999 Dynamic range µg.mL-1 ( 0.3 – 3 ) µg.mL-1
Molar absorptivity ε (L.mol-1.cm-
1) Ɛ=(A/b×c ppm )×m.wt.×1000 5.6523x10⁴
Slop b ( mL.µg-1) 0.3275 Intercept a ( a = y - bx) 0.0031
Standard deviation Sd (n=5)at1 µg.mL-1
3.2x10⁻⁵
Percentage Relative standard deviation RSD %
9.846x10⁻³
Limit of detection LOD (µg.mL-1) 0.251 Limit of quantitation LOQ
(µg.mL-1) 0.8283
Sandells sensitivity (mg.cm-2) 3.0783x10⁻³
Preconcentration factor 166.7 Enrichment factor 35.98 Distribution ratio 30.04
Table 2 statistical calculations of calibration curve of CARB by UV
3.2.2 GC-MS method The retention time of two compounds is 16.22 min to DBT and 17.88min to CARB. Calibration curves five-points (0.08 to 2 µg.ml-1), procedural blank, check standard and sample duplicates were carried out for every set of samples (table3 and figure9). the relative standard deviation (RSD) values of 0.6250 was showed acceptable to response factors of the five-point calibration curve for individual compounds.
Figure 9: chromotogram of standard DBT and CARB by GC
Paper ID: NOV152647 567

International Journal of Science and Research (IJSR) ISSN (Online): 2319-7064
Index Copernicus Value (2013): 6.14 | Impact Factor (2014): 5.611
Volume 5 Issue 1, January 2016 www.ijsr.net
Licensed Under Creative Commons Attribution CC BY
Table 3: Statistical calculations of DBT calibration curve by GC
Value Parameters no.
y= 52885 x - 355.55
Regression equation y=bx +a 1
0.9985 Correlation coefficient (r) 2 99.71 Linearity percentage (r2 %) 3
0.01 – 2 µg.mL-1
Dynamic range µg.mL-1 4
52885 Slop b ( mL.µg-1) 5 355.55 Intercept a ( a = y - bx) 6
3.451 x 10² Standard deviation Sd (n=3)at 1 µg.mL-1 7 0.6250 Percentage Relative standard deviation RSD% 8
0.74 x10⁻² Limit of detection LOD (µg.mL-1) 9 2.442 x10⁻² Limit of quantitation LOQ (µg.mL-1) 10
Table 4: Statistical calculations of CARB calibration curve by GC
Value Parameters no. y= 149278x – 556.11 Regression equation y=bx +a 1
0.9997 Correlation coefficient (r) 2 99.96 Linearity percentage (r2 %) 3
0.005 –2 µg.mL-1 Dynamic range µg.mL-1 4 24974 Slop b ( mL.µg-1) 5 2834.2 Intercept a ( a = y - bx) 6 0.201 Standard deviation Sd (n=5)at 1
µg.mL-1 7
7.0402x10⁻⁴ Percentage Relative standard deviation RSD%
8
0.388x10⁻² Limit of detection LOD (µg.mL-1) 9 1.2x10⁻² Limit of quantitation LOQ (µg.mL-1) 10
3.2.3-Chromatogram for Selected Samples Containing DBT and CARB
Figure 10: Sample 9/DBT and CARB
Figure 11: Sample 15/ Dibenzothiophene and 9-Ethylcarbazole
Figure 12: Sample 22/ Dibenzothiophene and 9-Ethylcarbazole
Paper ID: NOV152647 568

International Journal of Science and Research (IJSR) ISSN (Online): 2319-7064
Index Copernicus Value (2013): 6.14 | Impact Factor (2014): 5.611
Volume 5 Issue 1, January 2016 www.ijsr.net
Licensed Under Creative Commons Attribution CC BY
Figure 13: Sample 27/Dibenzothiophene and 9-Ethylcarbazole
3.2.4 Mass Spectrum of DBT and CARB in Samples Mass spectra represent a very important result to prove the relation between the peak and the target compound from the library of device, and without it can't consider the peak as an
evidence, especially when the compound is in complex matrix, but combining between chromatogram and spectrum to get clear view about the target analyte as shown in Figures 16 and 17.
40 50 60 70 80 90 100 110 120 130 140 150 160 170 180 190 2000.0
5.0
(x1,000)184
139 1529279696339 11350 158126 134
S
Figure 16 Mass spectrum of DBT (Library; IS=62)
40 50 60 70 80 90 100 110 120 130 140 150 160 170 180 190 200 210 220 230 2400.0
5.0
(x1,000)180
195
152 166140 17863 9739 9075 11351 127
N
Figure 17 Mass spectrum of CARB (Library; IS=58)
3.3Results of Applications by UV-VIS Spectrophotometry after CPE
Paper ID: NOV152647 569

International Journal of Science and Research (IJSR) ISSN (Online): 2319-7064
Index Copernicus Value (2013): 6.14 | Impact Factor (2014): 5.611
Volume 5 Issue 1, January 2016 www.ijsr.net
Licensed Under Creative Commons Attribution CC BY
Table 5: results of UV-VIS technique Name DBT CARB λ max 231 nm 237 nm
Samples name, no and depth Abs. nm Conc. µg.mL-1 Abs. nm Conc. µg.mL-1 1 HF002-M001H/halfaya well 250m nd Nd nd 2 HF002-M001H/halfaya well 500m nd nd nd nd 3 HF002-M001H/halfaya well 750m nd nd nd nd 4 HF002-M001H/halfaya well 1000m 0.3737 1.1953 nd nd 5 HF060-M067ML/halfaya well 250m nd nd nd nd 6 HF060-M067ML/halfaya well500m nd nd nd nd 7 HF060-M067ML/halfaya well 750m nd nd nd nd 8 HF060-M067ML/halfya well 1000m nd nd nd nd 9 HF007-JK007/ halfya well 250m nd nd nd nd 10 HF007-JK007/ halfya well 500m nd nd nd nd 11 HF007-JK007/ halfya well 750m 0.1560 0.4802 nd nd 12 HF007-JK007/ halfya well 1000m 0.1713 0.5304 nd nd 13 HF007-N007/ halfya well 250m nd nd nd nd 14 HF007-N007/ halfya well 500m nd nd nd nd 15 HF007-N007/ halfya well 750m nd nd nd nd 16 HF007-N007/ halfya well 1000m 0.171 0.5297 nd nd 17 Om nia'aj marsh/soil nd nd nd nd 18 Om nia'aj marsh/water 0.1305 0.3966 nd nd 19 Om nia'aj marsh/soil nd nd nd nd 20 Om nia'aj marsh/water nd nd nd nd 21 Om nia'aj marsh/soil nd nd nd nd 22 Om nia'aj marsh/water nd nd nd nd 23 Desaym marsh/soil nd nd nd nd 24 Desaym marsh/water nd nd nd nd 25 Desaym marsh/soil nd nd nd nd 26 Desaym marsh/water nd nd nd nd 27 Petro china trocar/soil nd nd nd nd 28 Petro china trocar/water nd nd nd nd 29 Petro china trocar/soil 0.1059 0.3158 nd nd 30 Petro china trocar/water nd nd nd nd
3.4 Results of Application by GC-MS after CPE
Table 6: Results of GC-MS Technique
Name DBT CARB RT/min 6.75 min 14.46 min
Sample name,no. and depth Peak area Conc./ µg.mL-1 Peak area Conc./ µg.mL-1 1 HF002-M001H/halfaya well 250m nd nd nd nd 2 HF002-M001H/halfaya well 500m nd nd nd nd 3 HF002-M001H/halfaya well 750m 7883 0.155782 nd nd 4 HF002-M001H/halfaya well 1000m 64055 1.217936 nd nd 5 HF060-M067ML/halfaya well 250m nd nd nd nd 6 HF060-M067ML/halfaya well500m nd nd nd nd 7 HF060-M067ML/halfaya well 750m nd nd nd nd 8 HF060-M067ML/halfya well 1000m nd nd nd nd 9 HF007-JK007/ halfya well 250m nd nd nd nd 10 HF007-JK007/ halfya well 500m nd nd nd nd 11 HF007-JK007/ halfya well 750m 24569 0.471297 1100 0 .011094 12 HF007-JK007/ halfya well 1000m 29384 0.562344 1952 0 .016802 13 HF007-N007/ halfya well 250m nd nd nd nd 14 HF007-N007/ halfya well 500m 8296 0.163592 nd nd 15 HF007-N007/ halfya well 750m nd nd nd nd 16 HF007-N007/ halfya well 1000m 28330 0.542414 nd nd 17 Om nia'aj marsh/soil nd nd nd nd 18 Om nia'aj marsh/water 19653 0.378341 763 0.008837 19 Om nia'aj marsh/soil nd nd nd nd 20 Om nia'aj marsh/water nd nd nd nd 21 Om nia'aj marsh/soil nd nd nd nd 22 Om nia'aj marsh/water 6205 0.124053 1135 0.011329 23 Desaym marsh/soil 8339 0.164405 nd nd 24 Desaym marsh/water 8870 0.174445 nd nd 25 Desaym marsh/soil nd nd nd nd
Paper ID: NOV152647 570
International Journal of Science and Research (IJSR) ISSN (Online): 2319-7064
Index Copernicus Value (2013): 6.14 | Impact Factor (2014): 5.611
Volume 5 Issue 1, January 2016 www.ijsr.net
Licensed Under Creative Commons Attribution CC BY
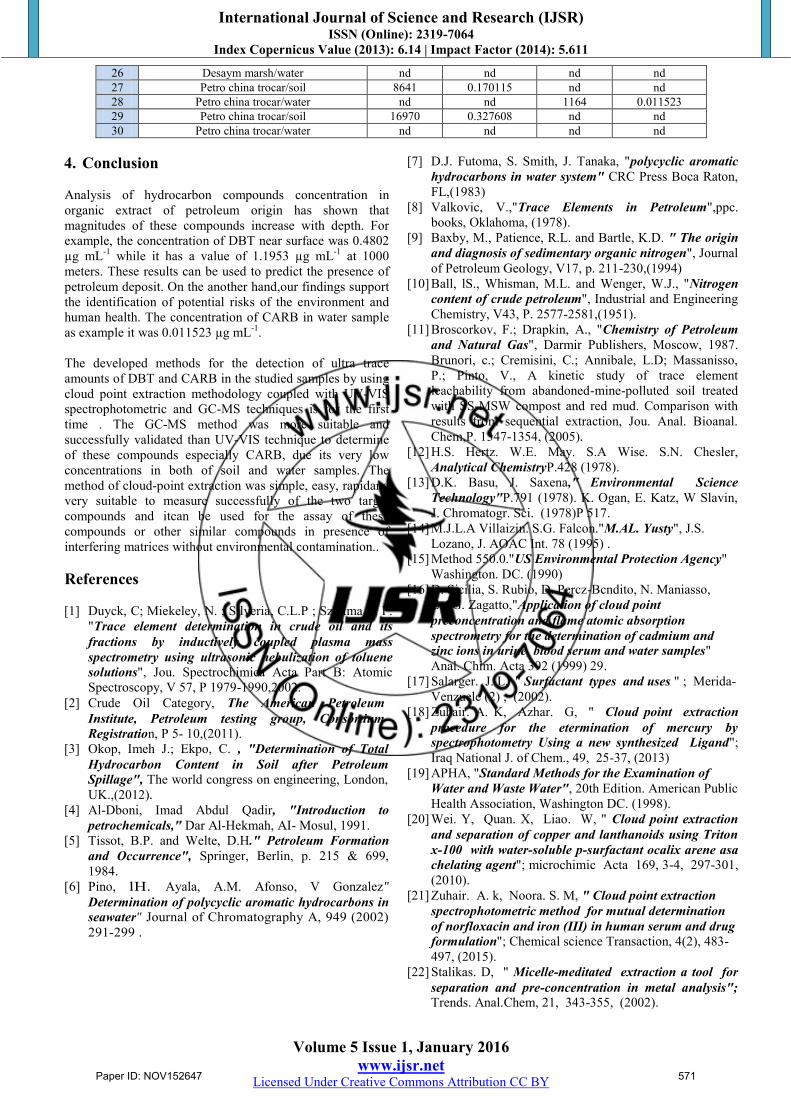
26 Desaym marsh/water nd nd nd nd 27 Petro china trocar/soil 8641 0.170115 nd nd 28 Petro china trocar/water nd nd 1164 0.011523 29 Petro china trocar/soil 16970 0.327608 nd nd 30 Petro china trocar/water nd nd nd nd
4. Conclusion Analysis of hydrocarbon compounds concentration in organic extract of petroleum origin has shown that magnitudes of these compounds increase with depth. For example, the concentration of DBT near surface was 0.4802 µg mL-1 while it has a value of 1.1953 µg mL-1 at 1000 meters. These results can be used to predict the presence of petroleum deposit. On the another hand,our findings support the identification of potential risks of the environment and human health. The concentration of CARB in water sample as example it was 0.011523 µg mL-1. The developed methods for the detection of ultra trace amounts of DBT and CARB in the studied samples by using cloud point extraction methodology coupled with UV-VIS spectrophotometric and GC-MS techniques is for the first time . The GC-MS method was more suitable and successfully validated than UV-VIS technique to determine of these compounds especially CARB, due its very low concentrations in both of soil and water samples. The method of cloud-point extraction was simple, easy, rapidand very suitable to measure successfully of the two target compounds and itcan be used for the assay of these compounds or other similar compounds in presence of interfering matrices without environmental contamination.. References [1] Duyck, C; Miekeley, N. ; Silveria, C.L.P ; Sza tma ri, P.
"Trace element determination in crude oil and its fractions by inductively coupled plasma mass spectrometry using ultrasonic nebulization of toluene solutions", Jou. Spectrochimica Acta Part B: Atomic Spectroscopy, V 57, P 1979-1990,2002.
[2] Crude Oil Category, The American Petroleum Institute, Petroleum testing group, Consortium Registration, P 5- 10,(2011).
[3] Okop, Imeh J.; Ekpo, C. , "Determination of Total Hydrocarbon Content in Soil after Petroleum Spillage", The world congress on engineering, London, UK.,(2012).
[4] Al-Dboni, Imad Abdul Qadir, "Introduction to petrochemicals," Dar Al-Hekmah, AI- Mosul, 1991.
[5] Tissot, B.P. and Welte, D.H." Petroleum Formation and Occurrence", Springer, Berlin, p. 215 & 699, 1984.
[6] Pino, lH. Ayala, A.M. Afonso, V Gonzalez" Determination of polycyclic aromatic hydrocarbons in seawater" Journal of Chromatography A, 949 (2002) 291-299 .
[7] D.J. Futoma, S. Smith, J. Tanaka, "polycyclic aromatic hydrocarbons in water system" CRC Press Boca Raton, FL,(1983)
[8] Valkovic, V.,"Trace Elements in Petroleum",ppc. books, Oklahoma, (1978).
[9] Baxby, M., Patience, R.L. and Bartle, K.D. " The origin and diagnosis of sedimentary organic nitrogen", Journal of Petroleum Geology, V17, p. 211-230,(1994)
[10] Ball, lS., Whisman, M.L. and Wenger, W.J., "Nitrogen content of crude petroleum", Industrial and Engineering Chemistry, V43, P. 2577-2581,(1951).
[11] Broscorkov, F.; Drapkin, A., "Chemistry of Petroleum and Natural Gas", Darmir Publishers, Moscow, 1987. Brunori, c.; Cremisini, C.; Annibale, L.D; Massanisso, P.; Pinto, V., A kinetic study of trace element leachability from abandoned-mine-polluted soil treated with SS-MSW compost and red mud. Comparison with results from sequential extraction, Jou. Anal. Bioanal. Chem,P. 1347-1354, (2005).
[12] H.S. Hertz. W.E. May. S.A Wise. S.N. Chesler, Analytical ChemistryP.428 (1978).
[13] D.K. Basu, J. Saxena," Environmental Science Technology"P.791 (1978). K. Ogan, E. Katz, W Slavin, J. Chromatogr. Sci. (1978)P 517.
[14] M.J.L.A Villaizin. S.G. Falcon."M.AL. Yusty", J.S. Lozano, J. AOAC Int. 78 (1995) .
[15] Method 550.0."US Environmental Protection Agency" Washington. DC. (1990)
[16] D. Sicilia, S. Rubio, D. Percz-Bcndito, N. Maniasso, E.AG. Zagatto,"Application of cloud point preconcentration and flame atomic absorption spectrometry for the determination of cadmium and zinc ions in urine, blood serum and water samples" Anal. Chim. Acta 392 (1999) 29.
[17] Salarger. J. L, " Surfactant types and uses " ; Merida-Venzuele (2) , (2002).
[18] Zuhair. A. K, Azhar. G, " Cloud point extraction procedure for the etermination of mercury by spectrophotometry Using a new synthesized Ligand"; Iraq National J. of Chem., 49, 25-37, (2013)
[19] APHA, "Standard Methods for the Examination of Water and Waste Water", 20th Edition. American Public Health Association, Washington DC. (1998).
[20] Wei. Y, Quan. X, Liao. W, " Cloud point extraction and separation of copper and lanthanoids using Triton x-100 with water-soluble p-surfactant ocalix arene asa chelating agent"; microchimic Acta 169, 3-4, 297-301, (2010).
[21] Zuhair. A. k, Noora. S. M, " Cloud point extraction spectrophotometric method for mutual determination of norfloxacin and iron (III) in human serum and drug formulation"; Chemical science Transaction, 4(2), 483-497, (2015).
[22] Stalikas. D, " Micelle-meditated extraction a tool for separation and pre-concentration in metal analysis"; Trends. Anal.Chem, 21, 343-355, (2002).
Paper ID: NOV152647 571

International Journal of Science and Research (IJSR) ISSN (Online): 2319-7064
Index Copernicus Value (2013): 6.14 | Impact Factor (2014): 5.611
Volume 5 Issue 1, January 2016 www.ijsr.net
Licensed Under Creative Commons Attribution CC BY
[23] H. Schott, AE. Royce, S.K. Han, J." Colloid Interface Sci." 98 (1984) 196.
[24] Yasinda. O, Okky. D. P, Muhamad. I, Amir. M. M, " The analytical Application of cloud point extraction: A simple spectrophotometric method for selenium determination in kangkong"; Internal J. of pharm. and pharm. sci., 5,(2013).
[25] Wu. H, Zhao. G. Y, Du. L. M, " determination of ofloxacin and gatifloxacin by mixed micelle-mediated cloud point extraction –fluorimetry combined methodology"; Spec. Acta a mol Biomol Spectrosc. , 75, 1624-1628, (2010).
[26] Pzirkowska. E, Wesolowski. M, " Extraction techniques for analysis of venlafaxine and its metabolites in biological matrices"; Psychiatry pol, 47, 909-919, (2013).
[27] WL. Hinze, E. Pramauro, CRC "micellar liquid chromatography retention mechanism"Anal. Chem". 24 (1993) 133.
[28] G. Stangl, R. Niessner," cloud point extraction of napropamide and thiabendazole from water and soil "Micro chemistry Acta 113 (1994) 1
[29] A Schwarz, G.e. Terstappen, AH. Futerman, "Isolation of Gangliosides by Cloud-Point Extraction With a Nonionic Detergent" Anal. Bio- chem. 254 (1997) 221.
[30] Faraone. A, Gardner. J. S, Nagao. M, " Shape fluctuation of a spherical surfactant shell in amicroemulsion"; NIST center for neutron research, (2007).
Paper ID: NOV152647 572