
NEUROPHYSIOLOGY Copyright © 2018 Multiplexed oscillations … · (80 to 150 Hz) frequencies...
13
Tingley et al., Sci. Adv. 2018; 4 : eaar3230 1 August 2018 SCIENCE ADVANCES | RESEARCH ARTICLE 1 of 12 NEUROPHYSIOLOGY Multiplexed oscillations and phase rate coding in the basal forebrain David Tingley 1,2 , Andrew S. Alexander 2,3 , Laleh K. Quinn 2 , Andrea A. Chiba 2 , Douglas Nitz 2 * Complex behaviors demand temporal coordination among functionally distinct brain regions. The basal forebrain’s afferent and efferent structure suggests a capacity for mediating this coordination at a large scale. During perform- ance of a spatial orientation task, synaptic activity in this region was dominated by four amplitude-independent oscillations temporally organized by the phase of the slowest, a theta-frequency rhythm. Oscillation amplitudes were also organized by task epoch and positively correlated to the task-related modulation of individual neuron firing rates. For many neurons, spiking was temporally organized through phase precession against theta band field potential oscillations. Theta phase precession advanced in parallel to task progression, rather than absolute spatial location or time. Together, the findings reveal a process by which associative brain regions can integrate independent oscillatory inputs and transform them into sequence-specific, rate-coded outputs that are adaptive to the pace with which organisms interact with their environment. INTRODUCTION Encoding and passage of information via rhythmic electrical activity patterns in the brain provide an efficient means by which to trans- mit information, one complementary to encoding of information in spike rates. The brain appears to take advantage of neural os- cillations in information transfer, and these mechanisms may be dysfunctional in neurological disorders such as schizophrenia and autism (1–5). Oscillations in action potential discharge in connected brain re- gions are often highly coherent across narrow frequency ranges in relation to specific cognitive processes such as attention (6, 7). Yet, prominent neural oscillations occur at a number of different fre- quencies (8–11), and it remains to be determined how they are or- ganized and decoded within a single recipient system. For “associative” brain regions integrating a wide array of inputs, it is unclear whether and in what form coordination of different oscillatory inputs is achieved. Equally, it is unclear how oscillatory input amplitudes may be translated into other forms of neural information, such as rate-coded sequences of cell assemblies (12). Valuable clues as to how these processes might occur may be found in telecommunications where communication across a net- work of devices must be accomplished along bandwidth-limited pathways (13, 14). Here, multiplexing of different sources of infor- mation through distinct oscillatory frequencies [frequency-division multiplexing (FDM)] or through distinct timing within a predeter- mined clock cycle [time-division multiplexing (TDM)] both provide powerful means by which to process independent information sources (15). Yet, critical questions remain as to whether specific informa- tion transmission models, such as TDM and FDM, are applicable to brain networks and whether robust evidence for their utilization is found during performance of complex tasks. With regard to these questions, the mammalian basal forebrain (BF) represents an excellent test case with which to consider how oscillatory inputs may be integrated and transformed into sequenced ensemble firing rate patterns. First, the BF receives afferents from a remarkably wide array of cortical and subcortical brain regions (16, 17), many of which exhibit oscillatory spiking activity across a wide range of frequency bands (18–25). Second, individual BF neurons exhibit stimulus-induced oscillatory spiking in vitro (26). Thus, at least some BF synaptic inputs, whether intrinsic or ex- trinsic in source, are likely to be organized as oscillations and there- fore to be observed in recordings of local field potentials (LFPs). Third, BF ensembles generate robust sequences of rate-coded out- put that strongly correlate with specific epochs of tasks requiring stimulus detection and encoding, decision-making, and outcome evaluation (27). Fourth, these BF neuron ensembles operate as cell assemblies in vivo (28), indicating the capacity for integration of oscillations at both the cellular and network levels. Finally, BF outputs reach a wide array of targets, implying a role in coordi- nating activity patterns among widely separated brain regions based on the integrated activity from an equally wide array of afferents (29–32). In this study, we examined LFP and multiple single-neuron re- cordings in BF in the context of a spatial orientation task taking place within a large circular arena. Over an approximately 5-s period on each trial, the animal proceeded through a series of epochs involv- ing (i) scanning from the center of the arena for an expected light stimulus at one of many perimeter locations, (ii) locomotion to the perceived location of the perimeter light source and indication of its location via a nosepoke, and (iii) return to the arena center for po- tential food reward. Consistent with a role for BF in integration and transformation of oscillatory inputs to rate-coded spike sequenc- es, we found highly distinct and reliable peaks in BF LFP oscilla- tions in different frequency ranges and over different task epochs. Many BF neurons fired with phase locking to one or more oscillatory components of the LFP. LFP oscillation amplitudes were also cor- related with epoch-specific spike rates of BF neurons. Furthermore, for large subsets of BF neurons, task-related spiking was temporally organized through phase precession of spikes against theta-frequency (6 to 10 Hz) LFP oscillations. Together, the data reveal a complex role for neural oscillations in determining how BF integrates its in- puts and coordinates responsiveness in efferent target regions such as the cortex. 1 New York University (NYU) Neuroscience Institute, School of Medicine, NYU, New York, NY 10016, USA. 2 Department of Cognitive Science, University of California, San Diego, San Diego, CA 92093–0515, USA. 3 Department of Psychological and Brain Science, Boston University, Boston, MA 02215, USA. *Corresponding author. Email: [email protected] Copyright © 2018 The Authors, some rights reserved; exclusive licensee American Association for the Advancement of Science. No claim to original U.S. Government Works. Distributed under a Creative Commons Attribution NonCommercial License 4.0 (CC BY-NC). on April 22, 2020 http://advances.sciencemag.org/ Downloaded from
Transcript of NEUROPHYSIOLOGY Copyright © 2018 Multiplexed oscillations … · (80 to 150 Hz) frequencies...

Tingley et al., Sci. Adv. 2018; 4 : eaar3230 1 August 2018
S C I E N C E A D V A N C E S | R E S E A R C H A R T I C L E
1 of 12
N E U R O P H Y S I O L O G Y
Multiplexed oscillations and phase rate coding in the basal forebrainDavid Tingley1,2, Andrew S. Alexander2,3, Laleh K. Quinn2, Andrea A. Chiba2, Douglas Nitz2*
Complex behaviors demand temporal coordination among functionally distinct brain regions. The basal forebrain’s afferent and efferent structure suggests a capacity for mediating this coordination at a large scale. During performance of a spatial orientation task, synaptic activity in this region was dominated by four amplitudeindependent oscillations temporally organized by the phase of the slowest, a thetafrequency rhythm. Oscillation amplitudes were also organized by task epoch and positively correlated to the taskrelated modulation of individual neuron firing rates. For many neurons, spiking was temporally organized through phase precession against theta band field potential oscillations. Theta phase precession advanced in parallel to task progression, rather than absolute spatial location or time. Together, the findings reveal a process by which associative brain regions can integrate independent oscillatory inputs and transform them into sequencespecific, ratecoded outputs that are adaptive to the pace with which organisms interact with their environment.
INTRODUCTIONEncoding and passage of information via rhythmic electrical activity patterns in the brain provide an efficient means by which to trans-mit information, one complementary to encoding of information in spike rates. The brain appears to take advantage of neural os-cillations in information transfer, and these mechanisms may be dysfunctional in neurological disorders such as schizophrenia and autism (1–5).
Oscillations in action potential discharge in connected brain re-gions are often highly coherent across narrow frequency ranges in relation to specific cognitive processes such as attention (6, 7). Yet, prominent neural oscillations occur at a number of different fre-quencies (8–11), and it remains to be determined how they are or-ganized and decoded within a single recipient system. For “associative” brain regions integrating a wide array of inputs, it is unclear whether and in what form coordination of different oscillatory inputs is achieved. Equally, it is unclear how oscillatory input amplitudes may be translated into other forms of neural information, such as rate-coded sequences of cell assemblies (12).
Valuable clues as to how these processes might occur may be found in telecommunications where communication across a net-work of devices must be accomplished along bandwidth-limited pathways (13, 14). Here, multiplexing of different sources of infor-mation through distinct oscillatory frequencies [frequency-division multiplexing (FDM)] or through distinct timing within a predeter-mined clock cycle [time-division multiplexing (TDM)] both provide powerful means by which to process independent information sources (15). Yet, critical questions remain as to whether specific informa-tion transmission models, such as TDM and FDM, are applicable to brain networks and whether robust evidence for their utilization is found during performance of complex tasks.
With regard to these questions, the mammalian basal forebrain (BF) represents an excellent test case with which to consider how oscillatory inputs may be integrated and transformed into sequenced
ensemble firing rate patterns. First, the BF receives afferents from a remarkably wide array of cortical and subcortical brain regions (16, 17), many of which exhibit oscillatory spiking activity across a wide range of frequency bands (18–25). Second, individual BF neurons exhibit stimulus-induced oscillatory spiking in vitro (26). Thus, at least some BF synaptic inputs, whether intrinsic or ex-trinsic in source, are likely to be organized as oscillations and there-fore to be observed in recordings of local field potentials (LFPs). Third, BF ensembles generate robust sequences of rate-coded out-put that strongly correlate with specific epochs of tasks requiring stimulus detection and encoding, decision-making, and outcome evaluation (27). Fourth, these BF neuron ensembles operate as cell assemblies in vivo (28), indicating the capacity for integration of oscillations at both the cellular and network levels. Finally, BF outputs reach a wide array of targets, implying a role in coordi-nating activity patterns among widely separated brain regions based on the integrated activity from an equally wide array of afferents (29–32).
In this study, we examined LFP and multiple single-neuron re-cordings in BF in the context of a spatial orientation task taking place within a large circular arena. Over an approximately 5-s period on each trial, the animal proceeded through a series of epochs involv-ing (i) scanning from the center of the arena for an expected light stimulus at one of many perimeter locations, (ii) locomotion to the perceived location of the perimeter light source and indication of its location via a nosepoke, and (iii) return to the arena center for po-tential food reward. Consistent with a role for BF in integration and transformation of oscillatory inputs to rate-coded spike sequenc-es, we found highly distinct and reliable peaks in BF LFP oscilla-tions in different frequency ranges and over different task epochs. Many BF neurons fired with phase locking to one or more oscillatory components of the LFP. LFP oscillation amplitudes were also cor-related with epoch-specific spike rates of BF neurons. Furthermore, for large subsets of BF neurons, task-related spiking was temporally organized through phase precession of spikes against theta-frequency (6 to 10 Hz) LFP oscillations. Together, the data reveal a complex role for neural oscillations in determining how BF integrates its in-puts and coordinates responsiveness in efferent target regions such as the cortex.
1New York University (NYU) Neuroscience Institute, School of Medicine, NYU, New York, NY 10016, USA. 2Department of Cognitive Science, University of California, San Diego, San Diego, CA 92093–0515, USA. 3Department of Psychological and Brain Science, Boston University, Boston, MA 02215, USA.*Corresponding author. Email: [email protected]
Copyright © 2018 The Authors, some rights reserved; exclusive licensee American Association for the Advancement of Science. No claim to original U.S. Government Works. Distributed under a Creative Commons Attribution NonCommercial License 4.0 (CC BY-NC).
on April 22, 2020
http://advances.sciencemag.org/
Dow
nloaded from

Tingley et al., Sci. Adv. 2018; 4 : eaar3230 1 August 2018
S C I E N C E A D V A N C E S | R E S E A R C H A R T I C L E
2 of 12
RESULTSOutstanding features of BF oscillatory dynamicsFigure S1 depicts BF recording locations in four animals. Single- unit activity and LFPs were localized to BF regions within or bordering the ventral pallidum, substantia innominata, and magnocellular preoptic area, all regions containing cortically projecting neurons (33, 34). Wavelet-based examination of BF LFP power spectra across the full length (~30 min) of recordings revealed prominent oscilla-tions in four distinct frequency bands (Fig. 1A). The higher-frequency oscillations, beta (20 to 35 Hz), gamma (45 to 65 Hz), and hi-gamma (80 to 150 Hz), often occurred as transient events easily visible from raw LFP traces (Fig. 1B). The transient nature of these higher-frequency oscillations produced a “heavy-tailed” power distribution that was evident when examining the kurtosis for each frequency band. Kurtosis in the theta-frequency band (8.9 ± 2.8) was less than half that for the three higher-frequency bands considered (beta, 30.6 ± 1; gamma, 20 ± 2.1; hi-gamma, 30 ± 1.3). All four frequency bands were indepen-dent of each other in their power fluctuations, as indicated by very low off-diagonal values in matrices correlating power at different frequencies to each other (Fig. 1C). Amplitude correlations among all four frequency bands were, in all cases, less than r = 0.08 (fig. S2). The observed features are hallmarks of frequency-division models for multiplexing where different information sources are organized
at different frequencies and with independence in variation of their amplitudes.
Beta, gamma, and hi-gamma oscillatory amplitudes were tem-porally organized across the phases of individual theta waves in all animals (4 to 9 Hz; Fig. 1D and fig. S2). The specific theta phase preferences of each frequency band differed somewhat across ani-mal subjects, suggesting cross-animal variability in the organization of amplitudes relative to theta and/or cross-animal variability in recording electrode placements relative to oscillatory sources. We used Tort’s modulation index (MI) to quantify these phase/amplitude relationships (35). To assess the MI values expected by chance, we compared actual MI values to those obtained when the vectors of theta-frequency oscillation phases were reversed in time relative to the three amplitude vectors for the higher-frequency bands. Time-aligned MI values exceeded control, time-reversed values in 89 to 97% of individual recordings, depending on the frequency band (beta, 89%; gamma, 94%; hi-gamma, 97%; fig. S2). Further-more, MI values were, on average, an order of magnitude higher for the observed as compared to phase-reversed values [fig. S2, F and G; Kolmogorov-Smirnov (KS) test probability values less than P = 3.7 × 10⁻⁹ for all three frequency ranges]. The presence of significant phase/amplitude relationships in all animals suggests that the BF theta rhythm is responsible for sequencing higher-frequency transients
Fig. 1. Beta, gamma, and hi-gamma transients occur within a temporal framework that is referenced to theta. (A) Average power spectral density plots for 36 recordings from four animals. Dark and light transparent shadings represent 1 and 2 SDs, respectively. We calculated the plots using LFP data from the entire recording sessions (~25 to 40 min). Power spectral density plots were also remarkably consistent across recording days in single individuals (fig. S2A). (B) Example of 2-s raw LFP trace (black), and z-scored power at theta (gray; 4 to 9 Hz), beta (orange; 20 to 35 Hz), gamma (blue; 45 to 65 Hz), and hi-gamma (magenta; 80 to 150 Hz) frequency bands. (C) Average power/power correlations for all animals across all frequencies, showing that there are multiple frequency bands that are correlated within a given range but independent from other frequency ranges. Color axis, 0 to 0.5. (D) Phase/amplitude coupling to theta (4 to 9 Hz) frequency. We plotted the average theta wave, aligned by the peaks, across all recordings as the gray line. The colormap represents the average wavelet transform relative to the peak of theta. Beta (20 to 35 Hz) and hi-gamma (80 to 150 Hz) frequencies increase in amplitude during troughs in theta, while gamma power (45 to 60 Hz) increases at the peak of theta oscillations. Orange, blue, and magenta ticks on the average theta wave indicate maximum power for beta, gamma, and hi-gamma frequency bands, respectively. Black vertical bar for theta wave, −2 to +2 V. Values at each frequency are normalized to the highest value at the same frequency. Color axis, 0 to 1.
on April 22, 2020
http://advances.sciencemag.org/
Dow
nloaded from
Tingley et al., Sci. Adv. 2018; 4 : eaar3230 1 August 2018
S C I E N C E A D V A N C E S | R E S E A R C H A R T I C L E
3 of 12
through time. This feature is a hallmark of TDM (15), where differ-ent information sources reach their target according to a temporally ordered sequence. Notably, theta-frequency cycling of LFP oscilla-tory amplitudes in the gamma and hi-gamma frequency ranges is also a property of LFPs recorded in the hippocampus, retrosplenial cortex, and posterior parietal cortex (PPC) (22, 36, 37). This suggests that TDM in the form of theta-frequency organized gamma activity may be an organizing principle across many brain structures and raises the question, for future work, as to whether the BF is key to this organization.
Together, the foregoing analyses of full recording sessions iden-tify distinct, amplitude-independent components of BF LFPs. Inasmuch as LFPs largely reflect patterns in extrinsically and/or intrinsically sourced synaptic inputs to a given region (38), the findings suggest that oscillations in BF synaptic input streams are a critical feature of BF input/output processes. Furthermore, the temporal structuring of amplitudes for the observed oscillations is compatible with both time- and frequency-division models for the processing of indepen-dent information sources.
Note that time- and frequency-division models for decoding and/or integration of separate information sources are not mutually exclusive, and more specifically, both are consistent with phase locking of spiking activity to the phase of ongoing oscillatory in-puts. Accordingly, in the present sample, spiking activity for a large subpopulation of BF neurons was robustly phase-locked to the ob-served LFP frequency bands (Fig. 2, A and B). Across the popula-tion, neurons varied widely with respect to their phase locking to the four major LFP oscillatory frequency bands, with some neurons showing locking to more than one frequency band and some to none. As quantified using the Rayleigh test for uniformity of spike counts by oscillatory phase, far larger proportions of neurons ex-hibited significant phase locking as compared to the proportions observed following multiple shuffles of spike times (Fig. 2, B and C). Variability in phase locking across the population was not related to the basic features of spiking dynamics such as mean firing rate or burstiness (table S1). Together, then, it is clear that both BF oscilla-tory inputs and BF spiking are organized in a manner consistent with at least two models for integration of multiplexed information.
The observation of significant subpopulations of neurons phase- locking to each frequency band (Fig. 2, C and D) also demonstrates that all four of the observed oscillatory LFP components have local influences and are unlikely to solely reflect volume conduction from other brain regions (36, 39). Further support for this contention comes from previous bipolar recording electrode studies demon-strating that the beta and gamma rhythms are local oscillations within BF (10, 40). The proportions of neurons phase-locked to the theta-frequency oscillation was particularly high (>0.4). This feature of the data set stands in stark contrast to the proportion (~0.08) observed for striatal neurons in a recent publication (39) where the relative lack of theta-modulated spiking activity was used to argue that striatal LFP theta oscillations are volume-conducted and exert minimal influence on the neural dynamics in striatum. Further-more, modulation of similar proportions of neurons (0.28 to 0.46) has previously been taken as evidence for the local influence of LFP oscillations (36).
Transformation of oscillatory amplitudes into spike rates as a function of task epoch and oscillatory frequency rangeThe foregoing data suggest a capacity for BF networks to efficiently integrate independently varying sources of oscillatory input to, in
turn, produce spiking output, consistent with the coordination of responsiveness in efferent targets such as the cortex. However, a next critical step was to determine whether and how such a process is actually used during performance of a task involving a behavioral series associated with variation in sensory stimuli, required actions, and cognitive demands. Therefore, LFP and spiking activity relation-ships during a multi-epoch spatial orientation task were analyzed to determine (i) whether LFP oscillations themselves are organized relative to the cognitive demands associated with different epochs of task performance and (ii) whether these signals may be integrated or transformed into other coding regimes as part of BF spiking output.
Animals completed 100 trials of a spatial orientation task where they identified transient light flashes on the perimeter of a circular environment with a nosepoke at the light location (Fig. 3A) (27). Across all trials associated with success in light source identification and reward delivery (~70 per recording), the spiking activity of single neurons followed stereotyped patterning relative to task epoch (Fig. 3B). The characterization of the significance of this spike patterning was the subject of a previous publication that included the analysis of all the spiking data used in the present work (27).
Prominent oscillatory LFP transients occurred at specific epochs of individual trials (Fig. 3, C and D). The timing of these transients was often reliable across animals (fig. S3) and across recordings (Fig. 3E and fig. S3). To determine whether the timing of oscillatory peaks was organized beyond chance levels, we compared the observed variation in oscillatory amplitudes to that observed following ran-dom time shifts of task epoch versus LFP data. For each recording, we used multiple random offsets (100) of task epoch versus oscillatory amplitude vectors. For each frequency at each task epoch, Fig. 3E (right) depicts the proportion of recordings for which the observed mean values for oscillatory amplitudes fell outside the 95th percen-tile of the randomized data distributions. Notably, most of the pre-dominant clusters in this mapping overlap with the major peaks and troughs in oscillatory amplitudes in Fig. 3E (left), including (i) the gamma-range cluster found subsequent to light flash as animals locomoted to the perimeter to execute a nosepoke, (ii) the strong beta-range cluster and hi-gamma depression seen subsequent to nosepoke and during locomotion back to the arena center, (iii) the beta-range cluster found just after reward obtainment, and (iv) theta- frequency amplitude increases associated with locomotion to and from the nosepoke locations at the arena perimeter.
Notably, oscillatory amplitude changes do not parallel the changes in the presence/absence of locomotor or consummatory behavior across task epochs. For example, beta and gamma oscillations peak for only a fraction of the task epochs associated with locomotion, and beta oscillations peaking upon reward obtainment do not persist over the full time period (past epoch 540) during which the animal consumes the reward. Thus, reference to potential artifacts associated with specific motor behaviors cannot explain the independent oscil-latory LFP components identified in Fig. 1. Instead, their distribution across task epochs evidences their relationship to the variations in experience and cognitive processing associated with performance of the task.
The finding that both neural spiking and LFP oscillations follow stereotyped task epoch–specific patterns raises the critical question as to whether a dynamic coupling between LFP oscillation ampli-tudes and single-neuron firing rates is found across task epochs. Direct evidence for this was found in the trial-by-trial correlations
on April 22, 2020
http://advances.sciencemag.org/
Dow
nloaded from
Tingley et al., Sci. Adv. 2018; 4 : eaar3230 1 August 2018
S C I E N C E A D V A N C E S | R E S E A R C H A R T I C L E
4 of 12
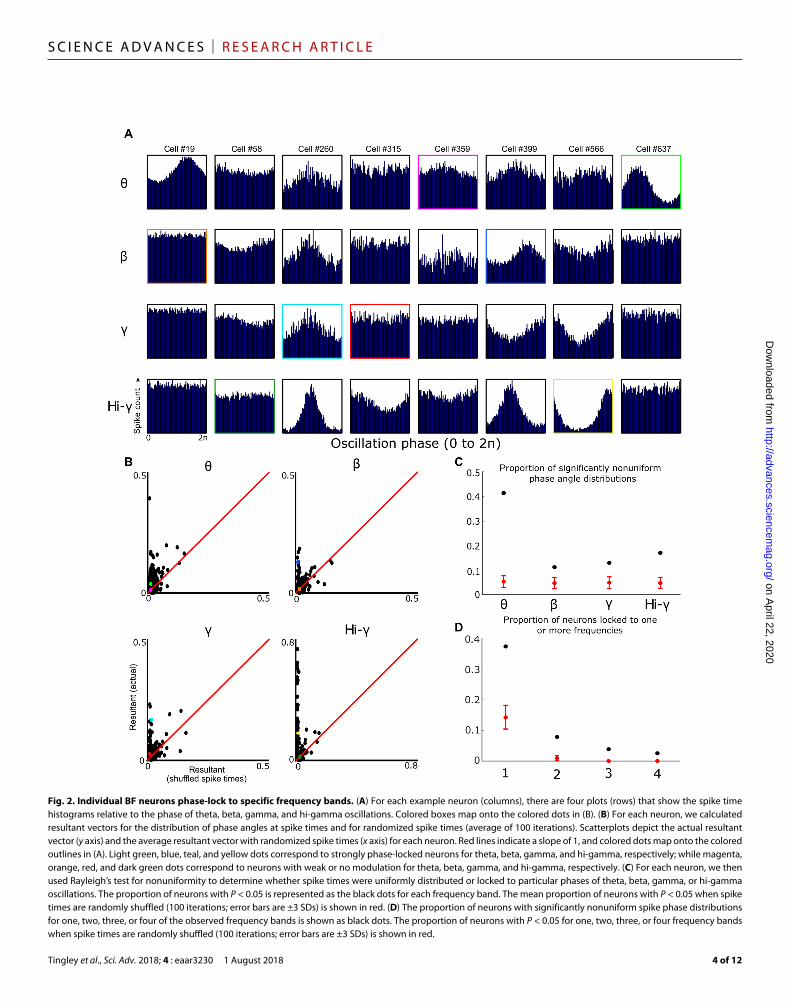
Fig. 2. Individual BF neurons phase-lock to specific frequency bands. (A) For each example neuron (columns), there are four plots (rows) that show the spike time histograms relative to the phase of theta, beta, gamma, and hi-gamma oscillations. Colored boxes map onto the colored dots in (B). (B) For each neuron, we calculated resultant vectors for the distribution of phase angles at spike times and for randomized spike times (average of 100 iterations). Scatterplots depict the actual resultant vector (y axis) and the average resultant vector with randomized spike times (x axis) for each neuron. Red lines indicate a slope of 1, and colored dots map onto the colored outlines in (A). Light green, blue, teal, and yellow dots correspond to strongly phase-locked neurons for theta, beta, gamma, and hi-gamma, respectively; while magenta, orange, red, and dark green dots correspond to neurons with weak or no modulation for theta, beta, gamma, and hi-gamma, respectively. (C) For each neuron, we then used Rayleigh’s test for nonuniformity to determine whether spike times were uniformly distributed or locked to particular phases of theta, beta, gamma, or hi-gamma oscillations. The proportion of neurons with P < 0.05 is represented as the black dots for each frequency band. The mean proportion of neurons with P < 0.05 when spike times are randomly shuffled (100 iterations; error bars are ±3 SDs) is shown in red. (D) The proportion of neurons with significantly nonuniform spike phase distributions for one, two, three, or four of the observed frequency bands is shown as black dots. The proportion of neurons with P < 0.05 for one, two, three, or four frequency bands when spike times are randomly shuffled (100 iterations; error bars are ±3 SDs) is shown in red.
on April 22, 2020
http://advances.sciencemag.org/
Dow
nloaded from

Tingley et al., Sci. Adv. 2018; 4 : eaar3230 1 August 2018
S C I E N C E A D V A N C E S | R E S E A R C H A R T I C L E
5 of 12
between firing rate and oscillation amplitude across the power spec-trum (Fig. 3, E and F). Across trials, the amplitudes of the dominant LFP oscillations at any given task epoch were predictive of the firing rates exhibited by the concurrent population of highly active neu-rons. A total of 84.8% of firing rate/LFP power correlations were significantly reduced (KS tests with a threshold of P < 0.05) when trial order was shuffled, suggesting that the LFP oscillatory strengths directly modulate BF neuron firing rates (that is, BF outputs) in dif-ferent frequency bands (fig. S4). Effectively, the result evidences an integration of oscillatory input strengths and, further, a transforma-tion of this information into rate-coded spiking output. As shown previously, these BF outputs can drive the responsiveness and pat-terning of firing in BF target structures, such as the cortex, in a highly subregion-specific manner (40–42).
A simple feed-forward entrainment of spiking activity could ex-plain the results of the foregoing analyses. In such a model, the in-creased spike rates associated with frequency-specific increases in oscillation strength simply reflect the strength of excitatory rhyth-mic inputs. Alternatively, correlations of task epoch–specific firing to specific LFP oscillatory amplitudes could reflect integration of oscillatory synaptic inputs in the absence of increased rhythmicity in firing. Therefore, we examined the relationship between phase locking (as described in Fig. 2) and power-rate correlations (as de-scribed in Fig. 3F). A total of 56% (438 of 780 neurons) of the BF population are significantly phase-locked to at least one LFP oscil-latory frequency band, while 67% (529 of 780) of the same BF popu-lation have power-rate correlations greater than 0.15 for at least one frequency band. With a simple entrainment model, the degree of
Fig. 3. Neuronal firing is correlated with the oscillation amplitude of specific frequency bands. (A) Example tracking data from a single trial (left) and 24 recordings (right). We detected the head location via two head-mounted light-emitting diodes (LEDs) (black dots). Green, cyan, magenta, and red dots indicate the head location during the light flash, nosepoke, plate cross, and reward location, respectively. (B) Example spike trains from 45 simultaneously recorded BF neurons across a single trial. (C) Raw LFP trace from the same example trial as in Fig. 2B. (D) Wavelet transform of LFP trace in Fig. 2C. Note the gamma and beta transients after the light flash and nosepoke, respectively (color axis, 0 to 1; maximum normalization performed individually for each frequency bin). (E) Left: Average wavelet transform of LFPs recorded during the selective attention task. Changes in LFP power during the task can be observed across all four frequencies: theta (4 to 9 Hz), beta (20 to 35 Hz), gamma (45 to 60 Hz), and hi-gamma (80 to 150 Hz). All frequencies (rows) are individually maximum-normalized (color axis, 0 to 1) to visualize changes across the spectrum of frequencies present. Right: Proportion (color axis, 0 to 1) of recordings with LFP power fluctuations that were significantly different from equal length segments randomly selected from the recording for all frequencies (1 to 150 Hz) and task epochs (1 to 540 Hz). Note that both significant increases and decreases (hi-gamma during return) in power are observed during specific task epochs. KS tests thresholded at P < 0.05. (F) Left: Mean firing rates for 780 BF neurons. Each row is the average firing rate (~70 trials) for a single neuron; the population is sorted by the point of maximum firing during the selective attention task (color axis, 0 to 1; with each maximum normalization per-formed individually for each row/neuron). Right: Neurons with specific firing patterns, relative to epochs of the selective attention task, correlate with specific frequency bands in the LFP (left). For each trial, we correlated the cross-epoch firing rate vector for each neuron (Pearson’s product-moment correlation) with the wavelet transform of the LFP across the same epochs. These correlations are then averaged across trials, generating a matrix where the y axis is the neuron number (1 to 780) and the x axis is the LFP frequency (1 to 150 Hz). The rows of this correlation matrix are then sorted to match the order of (E), maximum-normalized, and smoothed with the nearest 30 neurons (moving window along the y axis; color axis is between 0 and 1). For comparison with correlation values expected by chance, see fig. S4. Black vertical lines [across (E) and (F)] mark the light flash, nosepoke, plate cross, and reward, while the black horizontal lines [across (E) and (F)] mark the neurons with peak firing rates closest to these behaviorally defined events.
on April 22, 2020
http://advances.sciencemag.org/
Dow
nloaded from

Tingley et al., Sci. Adv. 2018; 4 : eaar3230 1 August 2018
S C I E N C E A D V A N C E S | R E S E A R C H A R T I C L E
6 of 12
phase locking (that is, length of the resultant vector) should be di-rectly related (for example, correlated) to the strength of correlation between a neuron’s firing rate and the associated amplitude of LFP oscillations at a given frequency. However, we found only weak re-lationships between resultant lengths quantifying phase locking and power-rate correlation values (Pearson’s correlations for strength of phase locking versus LFP power/firing rate: theta, r = 0.142; beta, r = 0.005; gamma, r = 0.023; hi-gamma, r = −0.034; n = 780). This result strongly suggests that rhythmic entrainment of BF neuron spiking to specific LFP oscillations and transformation of LFP oscillatory am-plitudes into spike rates are two independent coding processes, both of which are observed in the BF neuron populations examined here. The former (entrainment) preserves the rhythmic temporal organi-zation of its synaptic inputs. The latter (transformation of LFP ampli-tudes into spike rates) essentially filters out fine temporal structure but retains information regarding the strength of LFP oscillations.
Taking various categorization approaches leads to the same result. Neurons were clustered into three groups according to either task phase–specific firing (Fig. 3F, left column) or LFP oscillatory ampli-tude versus firing rate correlations (Fig. 3F, right column). In no case did any cluster of neurons show significantly greater phase locking to any of the four frequency bands examined (table S2). This demon-strates that task epoch–associated increases in firing rate, and LFP power versus spike rate correlations, are not well related to the frequency-specific phase locking of BF neurons. Thus, the transformation of LFP oscillatory amplitudes into action potential firing rates is inde-pendent from the degree of phase locking within BF neurons.
Theta phase precession of BF spiking yields spike sequencingThe aforementioned evidence for transformation of oscillatory in-puts into rate-coded outputs does not preclude a temporal organi-zation or sequencing of BF spiking outputs. Combined temporal and rate coding schemes are prominent in the spiking output of other brain systems (43). We therefore examined whether BF output adheres to a precise sequencing of spiking activity at a finer temporal scale. The analysis focused on BF spiking relative to the theta-frequency component of the BF LFP for several reasons. First, in the present data set, the theta rhythm provides a temporal framework against which beta, gamma, and hi-gamma oscillations are organized (Fig. 1D). Second, theta oscillatory activity was present throughout most epochs of the task (Fig. 3E and fig. S4A). Third, modulation of BF spiking according to theta-frequency LFP oscillations was found in greater than 40% of all neurons (Fig. 2C). Finally, the theta rhythm in brain regions such as the hippocampus provides a framework for pre-cisely sequenced activity patterns representing trajectories through space (44–46).
Given the considerations listed above, we examined the possibility that BF output is sequenced relative to LFP theta oscillations in a similar fashion to that of the place-specific firing of hippocampal neurons. To do so, we quantified the dynamic relationship between BF neuron spiking and phases of the ongoing BF LFP theta-frequency oscillation across individual time periods associated with peaks in spike firing. These time periods were defined by rate increases above 50% of the maximum observed spike rate persisting for at least 10 consecutive epochs of the same spatial orientation task de-scribed in Fig. 3A. Spiking activity associated with these discrete task epoch–specific increases in firing often exhibited phase preces-sion relative to the LFP theta rhythm (Fig. 4, A and B). To ensure
that this result was not epiphenomenal to theta phase resets or shifts at specific task epochs, we excluded all BF firing fields that over-lapped with any task epoch with a nonuniform theta phase distribu-tion from the precession analysis. Such instances were relatively rare (Fig. 4C). Thus, a subpopulation of BF neurons exhibits reliable pat-terning of spiking activity relative to phases of theta-frequency oscil-lations across task epochs associated with robust increases in spike rate.
Even for individual neurons, the strength of correlation between theta phase of firing and task epoch progression was variable (Fig. 4D). Across the population of all neurons and all instances of discrete firing rate increases, the proportion of neurons exhibiting phase precession at each task epoch was well above (two to four times) that expected by chance, as assessed through multiple randomiza-tions of phase versus epoch (Fig. 4E). This result was specific to the theta-frequency oscillations of BF LFPs. In analyses wherein we ex-amined the potential for phase precession against beta and gamma rhythms, the number of neurons exhibiting significant correlations was very near that observed following randomization of the oscilla-tory phases associated with each spike (Fig. 4E).
Critically, phase precession of BF neuron spiking to LFP theta oscillations also generated the expected temporal offsets in cross- correlated spiking activity of neuron pairs whose firing peaks relative to task epoch were offset (fig. S5). Thus, phase precession yields precise sequencing among the spike firing times of BF ensembles on the time scale of tens of milliseconds. Such sequencing is coincident with the correlated variation in frequency- and task epoch–specific firing rates and LFP oscillatory amplitudes. Thus, the spike sequencing component of phase precession may, in particular, be supportive of learning processes dependent on the BF (47) in that such temporal sequencing lies at the core of spike timing–dependent plasticity (48).
Notably, phase precession in the BF did not present according to progression through space, as seen for hippocampal neurons in navi-gating animals, nor according to absolute time, as has been seen during rapid eye movement sleep and salient behavioral events (Fig. 5 and fig. S6) (49–51). Instead, significant phase precession was seen in the largest proportion of neurons when the theta phases of individual spikes were mapped against the concurrent progression of the animal through the task epochs associated with prominent spike rate increases. Thus, phase precession was adaptive to trial- to-trial fluctuation in intervals between major task events such as stimulus onset, choice, and reward obtainment. The result implies that, across trials, the theta phase–specific firing of BF ensembles progresses in step with the progression of the animal through epochs of the task.
DISCUSSIONTogether, the foregoing data demonstrate that associative brain re-gions, such as BF, use multiplexing schemes resembling those used in telecommunications to process converging but independent sources of information. Convergence of signals in the cortically projecting BF regions recorded in this work arises from multiple neuromodu-latory, brainstem, hypothalamic, and cortical sources. As such, Heimer and colleagues (52) described the BF as a macrosystem using the term “Perestroika,” in part referring to its potential to restructure these multiple inputs and transmit an integrated response to the cortex. The following is one method by which this anatomically predicted function might be accomplished. Multiple subsystems with distinct behavioral roles and potent oscillatory signals converge on various subpopulations of neurons in the BF (33). Multiplexing these inputs,
on April 22, 2020
http://advances.sciencemag.org/
Dow
nloaded from
Tingley et al., Sci. Adv. 2018; 4 : eaar3230 1 August 2018
S C I E N C E A D V A N C E S | R E S E A R C H A R T I C L E
7 of 12
in both time and frequency, allows for a steady communication stream to the cortex that can, in turn, be demultiplexed by the cor-tex. Subregional differences in outputs across the BF have been dis-tinctly identified (34), with little knowledge of the impact on the defined cortical outputs (17). The demonstrated ability of the BF to provide a temporal framework for the cortex provides a clue as to how the inherent architecture results in a functional organizational structure. Given that the BF regions from which we obtained re-cordings contain multiple adjacent nuclei (with projections that reach most subregions of the cortical mantle) and given inherent difficulties in identifying the specific sources of LFP oscillations, the present study can speak clearly to the issue of temporal dynamics in BF. Nevertheless, the present work is limited with respect to deter-mining which oscillatory components may be associated, or not, with specific input/output circuits.
Across the population of BF neurons, independently varying os-cillatory afferent inputs are integrated to produce both temporal oscillation in spiking outputs and arrhythmic, rate-coded spiking outputs. The correlation between LFP oscillatory amplitudes and firing rates provides critical evidence for naturally occurring trans-formations between temporal coding and rate coding mechanisms for processing and transfer of neural information. Rate-coded spiking output was also organized temporally in the form of specific spike sequences organized through precession of phase-specific firing against the BF LFP’s persistent theta-frequency component (Fig. 4). Unlike higher-frequency oscillations, theta-frequency amplitude in the present data set was related to task epochs associated with running behavior
(that is, the light flash through to reward obtainment periods). As such, the observed theta oscillations may well have been coherent with theta oscillations in the hippocampus. This interpretation is consistent with interconnectivity of our BF recording locations (ventral pallidum and substantia innominata) with the septal nucleus, an important source of hippocampal theta rhythms. It is also consistent with a previous work showing that ventral striatal spiking activity exhibits phase precession against hippocampal theta-frequency oscillations (23). Such phase-specific precision in firing indicates that the theta- frequency LFP oscillations in the present recordings, while quite possibly influenced by volume conduction from the hippocampus, are nevertheless a strong determinant of spiking activity. This fea-ture of the data evidences a strong and local influence on the spiking activity of BF neurons in the ventral pallidum. Similar results have been obtained in examining a role for theta-frequency oscillations in organizing the spiking dynamics of neurons and gamma-frequency LFP oscillations in the basolateral amygdala (25).
Phase precession of spiking across the population was stronger when considered as a function of the animals’ progression through task epochs than when considered as a function of progression through the absolute times or distances associated with firing rate increases (Fig. 5). Thus, the ultimate BF output follows an abstract chunking process that reflects and/or dictates progression through a behavioral task, rather than the absolute time or space within which the task occurs. Accordingly, BF spiking has been causally linked to the tim-ing of specific behaviors (53). More generally, similar time- varying progressions through segmented activity states have been seen in
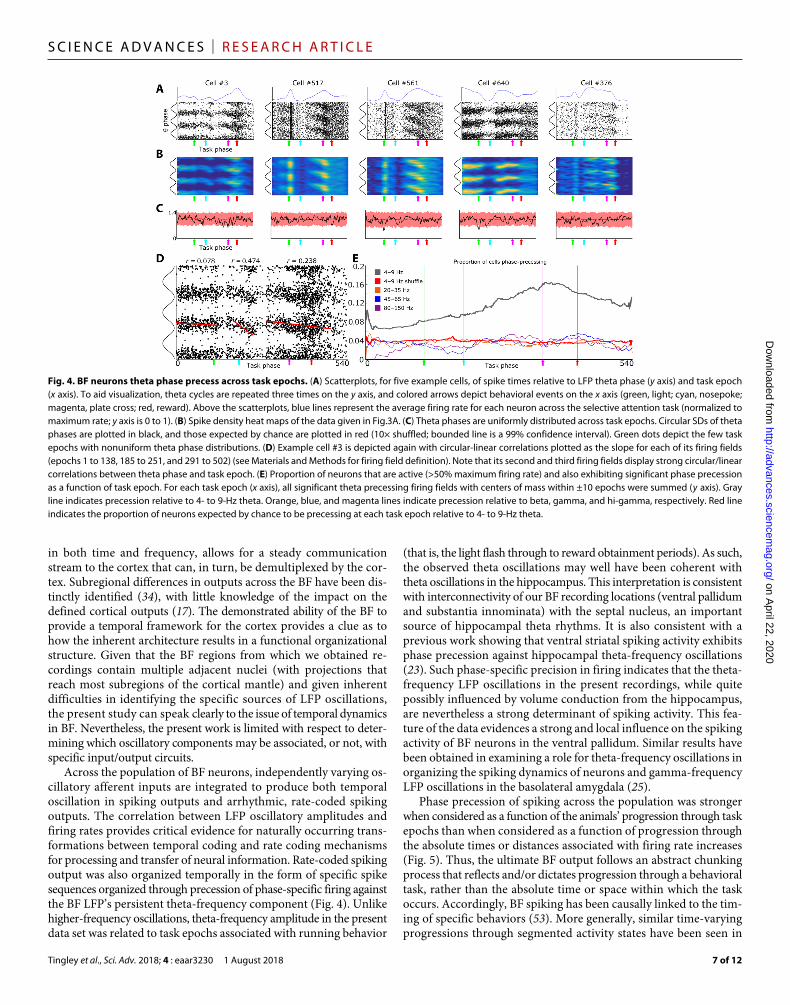
Fig. 4. BF neurons theta phase precess across task epochs. (A) Scatterplots, for five example cells, of spike times relative to LFP theta phase (y axis) and task epoch (x axis). To aid visualization, theta cycles are repeated three times on the y axis, and colored arrows depict behavioral events on the x axis (green, light; cyan, nosepoke; magenta, plate cross; red, reward). Above the scatterplots, blue lines represent the average firing rate for each neuron across the selective attention task (normalized to maximum rate; y axis is 0 to 1). (B) Spike density heat maps of the data given in Fig. 3A. (C) Theta phases are uniformly distributed across task epochs. Circular SDs of theta phases are plotted in black, and those expected by chance are plotted in red (10× shuffled; bounded line is a 99% confidence interval). Green dots depict the few task epochs with nonuniform theta phase distributions. (D) Example cell #3 is depicted again with circular-linear correlations plotted as the slope for each of its firing fields (epochs 1 to 138, 185 to 251, and 291 to 502) (see Materials and Methods for firing field definition). Note that its second and third firing fields display strong circular/linear correlations between theta phase and task epoch. (E) Proportion of neurons that are active (>50% maximum firing rate) and also exhibiting significant phase precession as a function of task epoch. For each task epoch (x axis), all significant theta precessing firing fields with centers of mass within ±10 epochs were summed (y axis). Gray line indicates precession relative to 4- to 9-Hz theta. Orange, blue, and magenta lines indicate precession relative to beta, gamma, and hi-gamma, respectively. Red line indicates the proportion of neurons expected by chance to be precessing at each task epoch relative to 4- to 9-Hz theta.
on April 22, 2020
http://advances.sciencemag.org/
Dow
nloaded from

Tingley et al., Sci. Adv. 2018; 4 : eaar3230 1 August 2018
S C I E N C E A D V A N C E S | R E S E A R C H A R T I C L E
8 of 12
cortical (54, 55) and subcortical structures (56, 57) that integrate mul-tiple sources of information. In this way, processing of information in large-scale networks, such as those in which the BF participates, may proceed with some level of independence from the timing of stimuli and actions. Such a level of abstraction may be a critical prop-erty for the adaptive flexibility observed in mammalian nervous sys-tems and the inflexibility observed with BF damage (58, 59).
Across multiple epochs of the spatial orientation task, BF gener-ated highly specific and varying combinations of oscillatory input, as well as orthogonal combinations of ensemble spiking output. With respect to temporal organization, BF output is a mixture of spiking entrained to LFP oscillations, nonentrained spiking that nevertheless reflects oscillatory input amplitudes, and specific multi-neuron spike sequences that result from phase precession of spiking against the LFP theta rhythm. Together, all of these features of BF neural dynamics are consistent with the implication of BF networks as key to driving the spatiotemporal coordination of cortical activity required to meet a wide range of cognitive demands (11, 41, 60, 61). BF output itself reflects an integration and transformation of oscil-latory synaptic inputs into sequenced firing rate outputs, and this process is highly dynamic with respect to oscillatory frequency and to the evolution of cognitive demands associated with task perform-ance. Furthermore, the BF and its cortically projecting constituents have been known to be vital for normal cognitive function, and its degradation has been linked to neurodegenerative disease, deficits in attention, learning impairments, general dementia, and age-related cognitive decline (62–64). Thus, it is likely that this complex set of dynamics lies at the core of multiple cognitive processes and that its dysfunction may explain why there are such wide-ranging physio-logical and cognitive impairments associated with damage to this region in humans and animals (65–67).
MATERIALS AND METHODSSome of the methods described below are similar to methods used in a previous study (28).
SubjectsAll experimental protocols adhered to the Association for Assessment and Accreditation of Laboratory Animal Care International guide-lines and were approved by the University of California, San Diego Institutional Animal Care and Use Committee and Animal Care Program. Four adult, male Long-Evans rats served as behavioral subjects. Rats were housed individually and kept on a 12-hour light/dark cycle. Before experimentation, the animals were habituated to the colony room and handled daily for a period of 1 to 2 weeks. After this period, animals were placed on food restriction until they reached 85 to 90% free-fed weight. Water was available continuously. Rats were required to reach a minimum weight of 350 g before surgery and subsequent experimentation.
The subjects examined in the present work represent the subset of those included in previous publications (27, 28) whose LFPs were recorded and free of obvious artifact. As such, the data relating spik-ing activity to task epoch was reported in a previous work (27), and the experimental methodology described in those publications was identical to that presented here.
Visuospatial attention taskEach day, animals completed 100 trials of a spatial orientation task in a circular arena with a 1.2-m diameter (Fig. 3A). All analyses pre-sented in this study were conducted on data collected during the performance of this single task. Along the circumference of the arena were 36 light ports, located at 10° intervals and standing 6.5 cm above the arena floor. Animals were trained by approxima-tion to remain in a 25-cm circular region in the center of the arena and scan the arena boundary for a light flash (~150 ms) at a single location. The trial-to-trial probability of a light flash at any given location was defined by a “center” light that is most probable and one of two normal distributions surrounding it (1.25 and 3 SDs). Only one distribution was used on any given recording day, and across days of testing, a single one of these distributions was repeat-edly used such that several neurophysiological recordings could be obtained under asymptotic levels of performance. Once several
Fig. 5. BF phase precession is relative to task epoch progression, not absolute time or spatial location. (A) For each neuron, we compared the firing field with the maximum circular linear correlation (y axis) with the average circular linear correlation when theta epochs were randomly shuffled across spike times (mean of 100 itera-tions; x axis). Circular/linear correlations are consistently larger for actual task phase precession than for theta phase shuffled data. Green dots indicate neurons with P < 0.05 for a one-sample t test between actual and shuffled data (123 of 780 neurons) (B) Rather than task epochs as in Fig. 5A, we used absolute time relative to trial onset as the linear variable for precession (see fig. S6 for example neurons). Green dots indicate neurons with P < 0.05 for a one-sample t test between actual and shuffled data (84 of 780 neurons). (C) Rather than task epochs as in Fig. 5A, we used cumulative distance traveled from the trial start as the linear variable to test for phase precession (see fig. S6 for example neurons). Cumulative distance was calculated as the summed Euclidean distance between each position tracking frame from the start of the trial to the frame at which a spike occurred. Green dots indicate neurons with P < 0.05 for a one-sample t test between actual and shuffled data (89 of 780 neurons).
on April 22, 2020
http://advances.sciencemag.org/
Dow
nloaded from

Tingley et al., Sci. Adv. 2018; 4 : eaar3230 1 August 2018
S C I E N C E A D V A N C E S | R E S E A R C H A R T I C L E
9 of 12
recordings were obtained under one distribution, the other distri-bution was used.
Light flash initiation only occurred when the animal was in the center ring and oriented such that the light would fall within a 120° space surrounding its longitudinal axis. Thus, the flash location was not always directly in front of the animal but always within its field of view. Upon detection of a light flash, animals were required to travel to the arena perimeter and to identify the spatial location of the light flash with a nosepoke. Upon returning to the arena center, animals were rewarded for correct light source identification with half of a piece of sweetened cereal (General Mills). Incorrect identi-fication yielded no reward. Trials associated with failure to travel to the perimeter following light flash (“no-gos”) constituted less than 5% of all trials in any animal once asymptotic performance was reached; these trials were not included in the present work’s analyses.
After the animal exhibited correct performance on >70% of trials across several days of training, recording experiments were initiated. At this point, the subject underwent surgery for the implantation of chronic BF and PPC single-neuron recording wires.
SurgeryRats were implanted with arrays of eight stereotrodes (25-mm tung-sten with polyimide insulation; California Fine Wire) built into custom- fabricated microdrives. These three microdrive arrays were implanted in each animal, with two targeting left and right BF [anteroposterior (AP), 0.2 mm; mediolateral (ML), 2.8 m; ventral (V), 7.0 mm] and one targeting right PPC (AP, −4 mm; ML, 2.5 mm; V, 0.5 mm; three animals) or one targeting right BF and two target-ing left and right PPC (one animal). Dorsal-ventral coordinates were chosen to permit slow movement of the recording wires into the desired BF (V, 8 to 9 mm) and PPC (V, 0.8 to 1.5 mm) target areas across days in which the animal was reintroduced to the task. PPC neurons were analyzed previously and were not examined in the con-text of this study (27).
RecordingsAll electrodes were bundled into custom-built microdrives permit-ting movement in 40-m increments in the dorsal-ventral axis. Signals were amplified at the level of the headstage connection (20×), again at a preamplifier stage (50×), and then to varying degrees, as appro-priate, at the amplifier stage (additional 1 to 15×). LFP signals were generated by referencing one or more of the BF recording wires to a skull screw overlying the cerebellum. LFPs were digitized at 1 kHz and bandpass-filtered between 1 and 450 Hz. Unit signals were bandpass-filtered (450 Hz to 8.8 kHz). Candidate spike waveforms (exceeding an amplitude threshold) were recorded using SortClient (Plexon) at a sampling frequency of 40 kHz. Waveform discrimina-tion into individual units was carried out manually using Plexon’s Offline Sorter software.
The animal’s position within the environment was detected from overhead images of the arena at 60 Hz using Plexon’s CinePlex Studio. Tracking software picked up light from two differently col-ored LEDs clipped to a connector, embedded in the dental acrylic used to fix microdrives to the animal’s skull.
Stereotrode bundles were adjusted across days as necessary to maintain the collection of large numbers of high-amplitude action potential waveforms (as many as 60 per day). Data included in the present set of analyses were, for all individual animals, associated with different depths (minimum of 80-m separation) to greatly
minimize the possibility that single neurons could contribute to the full data set more than once.
Behavioral event analysisPosition tracking data were analyzed using a custom MATLAB (MathWorks) guided user interface. Each trial was closely examined to identify the position point associated with initial movement to the light source and the sharp point of trajectory reversal associated with nosepoke. The time points at which the animal crossed back over the perimeter of the center plate and at which the animal stopped to consume reward were determined through semiautomated analysis of positional data using MATLAB. Trials in which the animal did not make ballistic, direct runs to and from the site of a nosepoke were not included so that trial-to-trial variability in task epoch dura-tions were kept minimal relative to task epoch mean durations.
Time normalization and firing rate calculationTo enable comparison of neuronal activity across all trials and all behavioral epochs, we used a time normalization procedure to align neural data for light onset, nosepoke, center plate return, and stop/reward times. Time normalization was accomplished by identifying the average time between light flash to nosepoke, nosepoke to center return, and center return to stop/reward across all trials and animals. On average, it took the rodent 0.69 s to traverse to the light port after the light flash. Animals took a mean of 1.41 s to return to the plate after nosepoke and 0.54 s to stop to consume reward after having crossed onto the center plate. We divided these periods into ~80- to 90-ms time epochs (that is, bins) for each trial. There were slight deviations from these averages for all animals across trials; thus, the epoch duration was allowed to fluctuate slightly to allow for the be-haviorally significant events to consistently occur at the same epoch. A 1-s period before light flash and after stop/reward was included in each trial to include stimulus expectation and reward consumption time periods, respectively. By this process, we obtained vectors of time-normalized data in which a pre–light flash period comprised epochs 1 to 12, light-flash to nosepoke comprised epochs 13 to 20, nosepoke to center plate return comprised epochs 21 to 36, center plate return to stop/reward comprised epochs 37 to 42, and a post- trial reward period comprised epochs 43 to 54. For further details on this time normalization procedure, see (27).
HistologyAnimals were perfused with 4% paraformaldehyde under deep anes-thesia. Brains were removed, cut into 50-m sections, and Nissl-stained. The point of deepest electrode penetration was used in conjunction with microdrive adjustment records to determine the range of depths sam-pled for any given stereotrode bundle placement. All analyses in the present work correspond to histologically identified recording sites in the ventral pallidum and substantia innominata subregions of the BF.
Amplitude/amplitude modulationThe LFP recorded on a single electrode was used for all recordings from each animal. For each frequency band, 1 to 150 Hz in 1-Hz increments, a bandpass Butterworth filter (order, 3) was used with a 2-Hz frequency range (1 to 3 Hz, 2 to 4 Hz, 3 to 5 Hz, etc.). These signals were then rectified and smoothed using a moving quadratic mean with a window length two times greater than the maximum frequency, leading to the power envelopes for each frequency band. Correlations were then taken for every pairwise combination of
on April 22, 2020
http://advances.sciencemag.org/
Dow
nloaded from

Tingley et al., Sci. Adv. 2018; 4 : eaar3230 1 August 2018
S C I E N C E A D V A N C E S | R E S E A R C H A R T I C L E
10 of 12
frequency band power envelopes from 1 to 150 Hz, resulting in a 150-by-150 element correlation matrix (Fig. 1C and fig. S2C).
Phase/amplitude modulationLFPs were bandpass-filtered for theta frequency (4- to 9-Hz Butter-worth filter; order, 3), and all peaks in the oscillation were identified. These peaks in theta oscillation were then aligned and averaged, generating the average theta oscillation (gray plot in Fig. 1C). The same alignment of peak locations was then used to average wavelet transforms for frequencies from 20 to 150 Hz. This resulted in an average wavelet transform relative to the peaks in theta oscillations (Fig. 1D). To further quantify these phase/amplitude relationships, we used Tort’s MI, which was defined as the Kullback-Leibler dis-tance between the observed amplitude distribution and a uniform distribution divided by the maximal possible entropy (35). Values for this measure range from 0 for a uniform distribution to 1 for a Dirac-like distribution.
LFP “rate mapping”A common procedure with single-unit recording is the discretiza-tion of recorded spikes to time (or space) epochs of a particular size, allowing for a mean firing rate to be calculated for individual epochs, also known as rate mapping. To compare LFP data with single- unit spiking data, we implemented a similar mapping procedure for both data types. For recorded action potentials, a previously described time normalization procedure was used to calculate firing rates across phases of a behavioral task (27). First, the specific moments on each trial associated with light flash, nosepoke, return to the center plate, and stopping to obtain reward were identified. Next, the time intervals between each were determined, and the average of these across trials was calculated. Each time interval was then divided into an equal number of “normalized time” epochs whose durations in absolute time differed slightly across trials. Finally, spike rates for each normalized time epoch were calculated. Note that the number of time epochs for different intervals (for example, light flash to nosepoke versus nosepoke to plate cross) varied according to the average duration of those intervals such that all time epochs were approximately 90 ms in duration.
To compare the LFP data to this time-normalized spiking data, we first applied a continuous one-dimensional wavelet transform to the LFP data, allowing for the separation of fluctuations in power across a wide (1 to 150 Hz) frequency range. Once the wavelet matrix was calculated for each recording, the series of LFP amplitude values occurring between behavioral events for each trial were down-sampled by averaging to a predetermined number of time epochs. This al-lowed for a uniform trial length of 540 bins across all trials for all recordings while preserving the fluctuations in LFP frequency power across epochs of the behavioral task. To avoid loss of transient high- frequency information, the LFP data were mapped onto 540, instead of 54, epochs. All comparisons and correlations between LFP and spiking activity were made after the spiking activity was interpolated from 54 to 540 bins.
Spike/LFP power correlationsFor each neuron, LFP power on each trial (for each frequency band across task epochs) was correlated with the neurons’ firing rate. These correlation values were then averaged across trials, leading to a 150 (1-Hz increments in frequency; 1 to 150 Hz)–by–1 length vector of average correlation values for each neuron. Each vector (corre-
sponding to one neuron) was normalized by its maximum average value and sorted in the same order as the firing rates in Fig. 3F (left). Figure 3F (right) was a smoothed (average of 30 nearest neighbors; y axis) heat map of this matrix (780 neurons by 150 frequency bands). As a control, trial order was shuffled between firing rates and LFP power (fig. S4).
Phase precessionNeuron firing fields were defined as all task epoch sequences where a neuron’s firing rate was greater than 50% of that neuron’s maximum firing rate and longer than 10 consecutive epochs. For each spike time, the theta phase and task epoch were taken. For each firing field, a circular/linear correlation between theta phase and task epoch was taken for all spikes that occurred. As a control, the theta phase for each spike time was randomly selected from the distribution of theta phases within each recording, and the same circular/linear correlation was taken (25 iterations). This led to identical firing fields for each neuron, where the theta phase relation-ship was effectively randomized. A two-sample t test (significance thresholded at P < 0.05) was then used to determine significance between the actual circular-linear correlations and the shuffled circular-linear correlations. To assess how BF neurons phase-precess relative to the ongoing behavior of the animal, the proportion of active (>50% maximum firing rate) and significantly precessing (two-sample t test, P < 0.01) neurons was calculated for each task epoch (Fig. 3F).
For comparison, theta phases for the same spike series were cor-related with both absolute time and cumulative distance relative to trial start. Note that the time normalization procedure resulted in variations in task epoch durations across trials such that progres-sion through epochs differed from progression through absolute time. The same subset of action potential times that were used to calculate precession relative to task epoch was also used for the time and dis-tance calculations. Absolute time is simply the difference in spike time versus trial start time (here, the time of the light flash). For cumulative distance, the summed Euclidean distance traveled from the time of light flash to the time of each spike’s occurrence was determined. Circular/linear correlations between time and theta phase or distance and theta phase were then taken for all spikes within a given firing field.
SUPPLEMENTARY MATERIALSSupplementary material for this article is available at http://advances.sciencemag.org/cgi/content/full/4/8/eaar3230/DC1Fig. S1. Summary of LFP and multiple single-neuron recording sites in BF.Fig. S2. Theta, beta, gamma, and hi-gamma frequencies are observed across multiple recording days and animals.Fig. S3. Average wavelet transform of LFPs during selective attention task.Fig. S4. Firing rate/LFP correlation control.Fig. S5. Cross-correlogram offsets for simultaneously recorded neuron pairs correlate with distance between task epochs associated with maximal firing.Fig. S6. BF neuron theta phase precession relative to task epoch, time, and space.Table S1. Phase-locking strengths do not correlate with burstiness or firing rate.Table S2. Phase-locking resultants do not correlate with task phase–specific firing or power/rate correlations.
REFERENCES AND NOTES 1. C. M. Gray, P. König, A. K. Engel, W. Singer, Oscillatory responses in cat visual cortex
exhibit inter-columnar synchronization which reflects global stimulus properties. Nature 338, 334–337 (1989).
on April 22, 2020
http://advances.sciencemag.org/
Dow
nloaded from

Tingley et al., Sci. Adv. 2018; 4 : eaar3230 1 August 2018
S C I E N C E A D V A N C E S | R E S E A R C H A R T I C L E
11 of 12
2. S. Neuenschwander, W. Singer, Long-range synchronization of oscillatory light responses in the cat retina and lateral geniculate nucleus. Nature 379, 728–732 (1996).
3. P. Fries, A mechanism for cognitive dynamics: Neuronal communication through neuronal coherence. Trends Cogn. Sci. 9, 474–480 (2005).
4. P. J. Uhlhass, W. Singer, Abnormal neural oscillations and synchrony in schizophrenia. Nat. Rev. Neurocsi. 11, 100–113 (2010).
5. N. N. Boutros, R. Lajiness-O’Neill, A. Zillgitt, A. E. Richard, S. M. Bowyer, EEG changes associated with autistic spectrum disorders. Neuropsychiatr. Electrophysiol. 1, 3 (2015).
6. G. G. Gregoriou, S. J. Gotts, H. Zhou, R. Desimone, High-frequency, long-range coupling between prefrontal and visual cortex during attention. Science 324, 1207–1210 (2009).
7. P. Fries, J. H. Reynolds, A. E. Rorie, R. Desimone, Modulation of oscillatory neuronal synchronization by selective visual attention. Science 291, 1560–1563 (2001).
8. G. Buzsaki, A. Draguhn, Neuronal oscillations in cortical networks. Science 304, 1926–1929 (2004).
9. M. M. Churchland, J. P. Cunningham, M. T. Kaufman, J. D. Foster, P. Nuyujukian, S. I. Ryu, K. V. Shenoy, Neural population dynamics during reaching. Nature 487, 51–56 (2012).
10. L. K. Quinn, D. A. Nitz, A. A. Chiba, Learning-dependent dynamics of beta-frequency oscillations in the basal forebrain of rats. Eur. J. Neurosci. 32, 1507–1515 (2010).
11. L. M. Rangel, A. A. Chiba, L. K. Quinn, Theta and beta oscillatory dynamics in the dentate gyrus reveal a shift in network processing state during cue encounters. Front. Syst. Neurosci. 9, 96 (2015).
12. T. Akam, D. M. Kullman, Oscillations and filtering networks support flexible routing of information. Neuron 67, 308–320 (2010).
13. C. E. Shannon, A mathematical theory of communication. Bell Syst. Tech. J. 27, 379–423 (1948).
14. A. J. Viterbi, CDMA: Principles of Spread Spectrum Communication (Addison-Wesley Norwell, 1995).
15. T. Akam, D. M. Kullman, Oscillatory multiplexing of population codes for selective communication in the mammalian brain. Nat. Rev. Neurosci. 15, 111–122 (2014).
16. D. H. Root, R. I. Melendez, L. Zaborszky, T. C. Napier, The ventral pallidum: Subregion-specific functional anatomy and roles in motivated behaviors. Prog. Neurobiol. 130, 29–70 (2015).
17. M. R. Gielow, L. Zaborszky, The input–output relationship of the cholinergic basal forebrain. Cell Rep. 18, 1817–1830 (2017).
18. T. J. Buschman, E. L. Denovellis, C. Diogo, D. Bullock, E. K. Miller, Synchronous oscillatory neural ensembles for rules in the prefrontal cortex. Neuron 76, 838–846 (2012).
19. S. Fujisawa, G. Buzsáki, A 4 Hz oscillation adaptively synchronizes prefrontal, VTA, and hippocampal activities. Neuron 72, 153–165 (2011).
20. M. D. Bevan, C. J. Wilson, Mechanisms underlying spontaneous oscillation and rhythmic firing in rat subthalamic neurons. J. Neurosci. 19, 7617–7628 (1999).
21. W. A. Mackay, A. J. Mendonça, Field potential oscillatory bursts in parietal cortex before and during reach. Brain Res. 704, 167–174 (1995).
22. L. L. Colgin, T. Denninger, M. Fyhn, T. Hafting, T. Bonnevie, O. Jensen, M.-B. Moser, E. I. Moser, Frequency of gamma oscillations routes flow of information in the hippocampus. Nature 462, 353–357 (2009).
23. M. A. A. van der Meer, T. Kalenscher, C. S. Lansink, C. M. A. Pennartz, J. D. Berke, A. D. Redish, Integrating early results on ventral striatal gamma oscillations in the rat. Front. Neurosci. 4, 300 (2010).
24. A. T. Popescu, D. Popa, D. Paré, Coherent gamma oscillations couple the amygdala and striatum during learning. Nat. Neurosci. 12, 801–807 (2009).
25. M. Bocchio, S. Nabavi, M. Capogna, Synaptic plasticity, engrams, and network oscillations in amygdala circuits for storage and retrieval of emotional memories. Neuron 94, 731–743 (2017).
26. A. Khateb, M. Muhlethaler, A. Alons, M. Serafin, L. Mainville, B. E. Jones, Cholinergic nucleus basalis neurons display the capacity for rhythmic bursting activity mediated by low-threshold calcium spikes. Neuroscience 51, 489–494 (1992).
27. D. Tingley, A. S. Alexander, S. Kolbu, V. R. de Sa, A. A. Chiba, D. A. Nitz, Task-phase-specific dynamics of basal forebrain neuronal ensembles. Front. Syst. Neurosci. 8, 174 (2014).
28. D. Tingley, A. S. Alexander, L. K. Quinn, A. A. Chiba, D. A. Nitz, Cell assemblies of the basal forebrain. J. Neurosci. 35, 2992–3000 (2015).
29. W. Muñoz, B. Rudy, Spatiotemporal specificity in cholinergic control of neocortical function. Curr. Opin. Neurobiol. 26, 149–160 (2014).
30. M. P. Kilgard, M. M. Merzenich, Cortical map reorganization enabled by nucleus basalis activity. Science 279, 1714–1718 (1998).
31. L. Zaborszky, R. P. Gaykema, D. J. Swanson, W. E. Cullinan, Cortical input to the basal forebrain. Neuroscience 79, 1051–1078 (1997).
32. M. A. Dimyan, N. M. Weinberger, Basal forebrain stimulation induces discriminative receptive field plasticity in the auditory cortex. Behav. Neurosci. 113, 691–702 (1999).
33. D. S. Zahm, The evolving theory of basal forebrain functional—Anatomical ‘macrosystems’. Neurosci. Biobehav. Rev. 30, 148–172 (2006).
34. L. Zaborszky, A. Csordas, K. Mosca, J. Kim, M. R. Gielow, C. Vadasz, Z. Nadasdy, Neurons in the basal forebrain project to the cortex in a complex topographic organization that reflects corticocortical connectivity patterns: An experimental study based on retrograde tracing and 3D reconstruction. Cereb. Cortex 25, 118–137 (2015).
35. A. B. L. Tort, R. Komorowski, H. Eichenbaum, N. Kopell, Measuring phase-amplitude coupling between neuronal oscillations of different frequencies. J. Neurophysiol. 104, 1195–1210 (2010).
36. A. Sirota, S. Montgomery, S. Fujisawa, Y. Isomura, M. Zugaro, G. Buzsáki, Entrainment of neocortical neurons and gamma oscillations by the hippocampal theta rhythm. Neuron 60, 683–697 (2008).
37. A. Bragin, G. Jando, Z. Nadasdy, J. Hetke, K. Wise, G. Buzsaki, Gamma (40-100 Hz) oscillation in the hippocampus of the behaving rat. J. Neurosci. 15, 47–60 (1995).
38. G. Buzsáki, C. A. Anastassiou, C. Koch, The origin of extracellular fields and currents—EEG, ECoG, LFP and spikes. Nat. Rev. Neurosci. 13, 407–420 (2012).
39. L. Lalla, P. E. Rueda-Orozco, M.-T. Jurado-Parras, A. Brovelli, D. Robbe, Local or not local: Investigating the nature of striatal theta oscillations in behaving rats. eNeuro 4, ENEURO.0128-17.2017 (2017).
40. J. Nair, A. L. Klaassen, J. Poirot, A. Vyssotski, B. Rasch, G. Rainer, Gamma band directional interactions between basal forebrain and visual cortex during wake and sleep states. J. Physiol. 110, 19–28 (2016).
41. L. Golmayo, A. Nuñez, L. Zaborszky, Electrophysiological evidence for the existence of a posterior cortical–prefrontal–basal forebrain circuitry in modulating sensory responses in visual and somatosensory rat cortical areas. Neuroscience 119, 597–609 (2003).
42. M. Goard, Y. Dan, Basal forebrain activation enhances cortical coding of natural scenes. Nat. Neurosci. 12, 1444–1449 (2009).
43. J. Huxter, N. Burgess, J. O’Keefe, Independent rate and temporal coding in hippocampal pyramidal cells. Nature 425, 828–832 (2003).
44. J. O’Keefe, M. L. Recce, Phase relationship between hippocampal place units and the EEG theta rhythm. Hippocampus 3, 317–330 (1993).
45. M. W. Jones, M. A. Wilson, Phase precession of medial prefrontal cortical activity relative to the hippocampal theta rhythm. Hippocampus 15, 867–873 (2005).
46. M. A. A. van der Meer, A. D. Redish, Theta phase precession in rat ventral striatum links place and reward information. J. Neurosci. 31, 2843–2854 (2011).
47. J. M. Conner, A. A. Chiba, M. H. Tuszynski, The basal forebrain cholinergic system is essential for cortical plasticity and functional recovery following brain injury. Neuron 46, 173–179 (2005).
48. Y. Dan, M.-m. Poo, Spike timing-dependent plasticity of neural circuits. Neuron 44, 23–30 (2004).
49. W. E. Skaggs, B. L. McNaughton, M. A. Wilson, C. A. Barnes, Theta phase precession in hippocampal neuronal populations and the compression of temporal sequences. Hippocampus 6, 149–172 (1996).
50. K. D. Harris, J. Csicsvari, H. Hirase, G. Dragoi, G. Buzsáki, Organization of cell assemblies in the hippocampus. Nature 424, 552–556 (2003).
51. P.-P. Lenck-Santini, A. A. Fenton, R. U. Muller, Discharge properties of hippocampal neurons during performance of a jump avoidance task. J. Neurosci. 28, 6773–6786 (2008).
52. L. Heimer, J. de Olmos, G. F. Alheid, L. Zaborszky, “Perestroika” in the basal forebrain: Opening the border between neurology and psychiatry. Prog. Brain Res. 87, 109–150 (1991).
53. J. D. Mayse, G. M. Nelson, I. Avila, M. Gallagher, S.-C. Lin, Basal forebrain neuronal inhibition enables rapid behavioral stopping. Nat. Neurosci. 18, 1501–1508 (2015).
54. E. Seidemann, I. Meilijson, M. Abeles, H. Bergman, E. Vaadia, Simultaneously recorded single units in the frontal cortex go through sequences of discrete and stable states in monkeys performing a delayed localization task. J. Neurosci. 16, 752–768 (1996).
55. L. Mazzucato, A. Fontanini, G. La Camera, Dynamics of multistable states during ongoing and evoked cortical activity. J. Neurosci. 35, 8214–8231 (2015).
56. A. M. Graybeil, The basal ganglia and chunking of action repertoires. Neurobiol. Learn. Mem. 70, 119–136 (1998).
57. A. S. Gupta, M. A. A. van der Meer, D. S. Touretzky, A. D. Redish, Segmentation of spatial experience by hippocampal sequences. Nat. Neurosci. 15, 1032–1039 (2012).
58. A. A. Chiba, D. J. Bucci, P. C. Holland, M. Gallagher, Basal forebrain cholinergic lesions disrupt increments but not decrements in conditioned stimulus processing. J. Neurosci. 15, 7315–7322 (1995).
59. A. C. Roberts, T. W. Robbins B. J. Everitt, J. L. Muir, A specific form of cognitive rigidity following excitotoxic lesions of the basal forebrain in marmosets. Neuroscience 47, 251–264 (1992).
60. T. M. Gill, M. Sarter, B. Givens, Sustained visual attention performance-associated prefrontal neuronal activity: Evidence for cholinergic modulation. J. Neurosci. 20, 4745–4757 (2000).
on April 22, 2020
http://advances.sciencemag.org/
Dow
nloaded from

Tingley et al., Sci. Adv. 2018; 4 : eaar3230 1 August 2018
S C I E N C E A D V A N C E S | R E S E A R C H A R T I C L E
12 of 12
61. D. J. Bucci, P. C. Holland, M. Gallagher, Removal of cholinergic input to rat posterior parietal cortex disrupts incremental processing of conditioned stimuli. J. Neurosci. 18, 8038–8046 (1998).
62. M. G. Baxter, A. A. Chiba, Cognitive functions of the basal forebrain. Curr. Opin. Neurobiol. 2, 178–183 (1999).
63. A. A. Chiba, L. K. Quinn, The basal forebrain and memory, in Learning and Memory: A Comprehensive Reference (Oxford, Elsevier, 2008), pp. 281–302.
64. J. M. Conner, A. Culberson, C. Packowski, A. A. Chiba, M. H. Tuszynski, Lesions of the basal forebrain cholinergic system impair task acquisition and abolish cortical plasticity associated with motor skill learning. Neuron 38, 819–829 (2003).
65. R. Szymusiak, D. McGinty, Sleep-related neuronal discharge in the basal forebrain of cats. Brain Res. 370, 82–92 (1986).
66. J. L. Muir, K. J. Page, D. J. S. Sirinathsinghji, T. W. Robbins, B. J. Everitt, Excitotoxic lesions of basal forebrain cholinergic neurons: Effects on learning, memory and attention. Behav. Brain Res. 57, 123–131 (1993).
67. J. D. Stoehr, S. L. Mobley, D. Roice, R. Brooks, L. M. Baker, R. G. Wiley, G. L. Wenk, The effects of selective cholinergic basal forebrain lesions and aging upon expectancy in the rat. Neurobiol. Learn. Mem. 67, 214–227 (1997).
Acknowledgments Funding: This work was supported by the NSF (award number 0910485). Author contributions: D.N. and D.T. co-wrote most of the manuscript with significant input from A.A.C., A.S.A., and L.K.Q. D.T. carried out all analyses presented in the manuscript. All authors contributed to the design of analyses. D.N., A.S.A., and D.T. were responsible for data collection. Competing interests: The authors declare that they have no competing interests. Data and materials availability: All data needed to evaluate the conclusions in the paper are present in the paper and/or Supplementary Materials. Additional data related to the paper may be requested from the authors.
Submitted 26 October 2017Accepted 19 June 2018Published 1 August 201810.1126/sciadv.aar3230
Citation: D. Tingley, A. S. Alexander, L. K. Quinn, A. A. Chiba, D. Nitz, Multiplexed oscillations and phase rate coding in the basal forebrain. Sci. Adv. 4, eaar3230 (2018).
on April 22, 2020
http://advances.sciencemag.org/
Dow
nloaded from

Multiplexed oscillations and phase rate coding in the basal forebrainDavid Tingley, Andrew S. Alexander, Laleh K. Quinn, Andrea A. Chiba and Douglas Nitz
DOI: 10.1126/sciadv.aar3230 (8), eaar3230.4Sci Adv
ARTICLE TOOLS http://advances.sciencemag.org/content/4/8/eaar3230
MATERIALSSUPPLEMENTARY http://advances.sciencemag.org/content/suppl/2018/07/30/4.8.eaar3230.DC1
REFERENCES
http://advances.sciencemag.org/content/4/8/eaar3230#BIBLThis article cites 65 articles, 14 of which you can access for free
PERMISSIONS http://www.sciencemag.org/help/reprints-and-permissions
Terms of ServiceUse of this article is subject to the
is a registered trademark of AAAS.Science AdvancesYork Avenue NW, Washington, DC 20005. The title (ISSN 2375-2548) is published by the American Association for the Advancement of Science, 1200 NewScience Advances
License 4.0 (CC BY-NC).Science. No claim to original U.S. Government Works. Distributed under a Creative Commons Attribution NonCommercial Copyright © 2018 The Authors, some rights reserved; exclusive licensee American Association for the Advancement of
on April 22, 2020
http://advances.sciencemag.org/
Dow
nloaded from


![NEURurofisiologia - neurophysiology[1]](https://static.fdocuments.net/doc/165x107/5571f1d449795947648bb940/neururofisiologia-neurophysiology1.jpg)