
Neuronal cell death in grasshopper embryos: variable...
14
J. Embryol. exp. Morph. 78, 169-182 (1983) Printed in Great Britain © The Company of Biologists Limited 1983 Neuronal cell death in grasshopper embryos: variable patterns in different species, clutches, and clones By CURTIS M. LOER 1 - 3 , JOHN D. STEEVES 2 AND COREY S. GOODMAN 1 From the Department of Biological Sciences, Stanford University SUMMARY Previous studies showed that cell death plays an important role in adjusting the segment- specific number of ganglionic neurones during grasshopper embryogenesis (Bate, Goodman & Spitzer, 1979; Goodman & Bate, 1981). In every segment, the single midline precursor 3 (MP3) divides once to produce two progeny. In some segments, one or both of these two progeny die; there is a general pattern of cell death of the MP3 progeny across the thoracic and abdominal segments. In the present study we examined the pattern of cell survival versus death of the MP3 progeny in 472 embryos from four different species, from the genetically related offspring within different clutches of the same species and from the genetically identical offspring within isogenic clones of the same species. We find variability in the pattern of cell survival versus death amongst embryos of the same species, clutch and clone, suggesting a significant epigenetic influence on this pattern. However, our results also show significant differences in the pattern of cell death between different genera and species, and between different clones and clutches within a single species, suggesting a genetic influence on this pattern as well. INTRODUCTION Each segmental ganglion in a grasshopper's metameric nervous system con- tains a highly specific pattern of neurones. From segment to segment, this pattern varies; each segment's complement of neurones is tailored to that segment's particular needs. One of the most striking differences between segments is the number of neurones; thoracic ganglia contain about 2000 neurones whereas abdominal ganglia contain about 500 neurones. Each different segmental pattern is produced, however, from a common segmentally repeated set of precursor cells (Bate, 1976; Bate & Grunewald, 1981; Goodman, Bate & Spitzer, 1981; Goodman & Bate, 1981). The differences in cell number arise in two ways: 1 Authors' address: Department of Biological Sciences, Stanford University, Stanford, CA 94305, U.S.A. 2 Author's address: Department of Zoology, University of British Columbia, Vancouver, BC V6T 2A9, Canada. 3 Author's present address: Biology Department B-022, University of California, San Diego, La Jolla, CA 92093, U.S.A.
Transcript of Neuronal cell death in grasshopper embryos: variable...
J. Embryol. exp. Morph. 78, 169-182 (1983)Printed in Great Britain © The Company of Biologists Limited 1983
Neuronal cell death in grasshopper embryos:variable patterns in different species, clutches, and
clones
By CURTIS M. LOER1-3, JOHN D. STEEVES2 AND COREY S.GOODMAN1
From the Department of Biological Sciences, Stanford University
SUMMARYPrevious studies showed that cell death plays an important role in adjusting the segment-
specific number of ganglionic neurones during grasshopper embryogenesis (Bate, Goodman& Spitzer, 1979; Goodman & Bate, 1981). In every segment, the single midline precursor 3(MP3) divides once to produce two progeny. In some segments, one or both of these twoprogeny die; there is a general pattern of cell death of the MP3 progeny across the thoracicand abdominal segments.
In the present study we examined the pattern of cell survival versus death of the MP3progeny in 472 embryos from four different species, from the genetically related offspringwithin different clutches of the same species and from the genetically identical offspring withinisogenic clones of the same species. We find variability in the pattern of cell survival versusdeath amongst embryos of the same species, clutch and clone, suggesting a significantepigenetic influence on this pattern. However, our results also show significant differences inthe pattern of cell death between different genera and species, and between different clonesand clutches within a single species, suggesting a genetic influence on this pattern as well.
INTRODUCTION
Each segmental ganglion in a grasshopper's metameric nervous system con-tains a highly specific pattern of neurones. From segment to segment, this patternvaries; each segment's complement of neurones is tailored to that segment'sparticular needs. One of the most striking differences between segments is thenumber of neurones; thoracic ganglia contain about 2000 neurones whereasabdominal ganglia contain about 500 neurones. Each different segmental patternis produced, however, from a common segmentally repeated set of precursorcells (Bate, 1976; Bate & Grunewald, 1981; Goodman, Bate & Spitzer, 1981;Goodman & Bate, 1981). The differences in cell number arise in two ways:
1 Authors' address: Department of Biological Sciences, Stanford University, Stanford, CA94305, U.S.A.
2 Author's address: Department of Zoology, University of British Columbia, Vancouver,BC V6T 2A9, Canada.
3 Author's present address: Biology Department B-022, University of California, San Diego,La Jolla, CA 92093, U.S.A.
170 C. M. LOER, J. D. STEEVES AND C. S. GOODMAN
differential production of cells by the neuronal precursors and differential deathof the cells produced.
Cell death appears to play the more important role in adjusting cell number;segmental differences are sculpted from a common block rather than constructeddifferently from the outset (Bate, Goodman & Spitzer, 1981; Goodman & Bate,1981; Bate & Goodman, in preparation). This is illustrated by the progeny of oneof the identified neuronal precursor cells, the median neuroblast (MNB). In themetathoracic (T3) segment, the MNB produces about 100 progeny, most ofwhich survive. In the first abdominal segment, the MNB produces about 90progeny, only 45 of which survive; thus cell death accounts for most of thesegment-specific difference in cell number from this NB (Goodman & Bate,1981). At specific stages of embryogenesis, there is massive cell death in theabdominal segments while there is relatively little death in the thoracic segments.Interestingly, many cells destined to die begin their morphological differentia-tion before they die (Bate & Goodman, in preparation). Whether cells in the
ooooooooooooOOOO (oooooooooooooo
N B S©o©oooo©oooo) ©OOO
*©OOOO<1©OOOO
©oooMNB
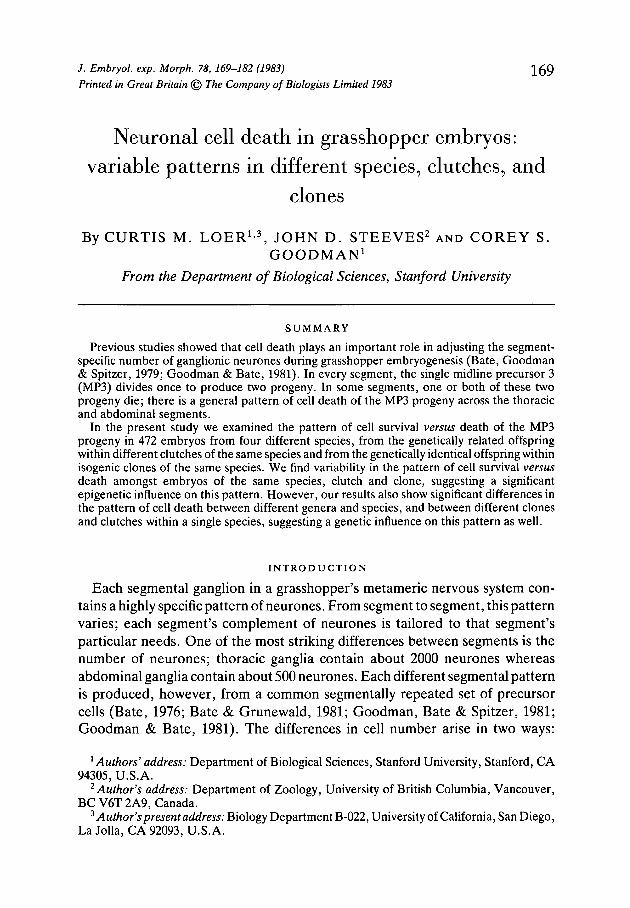
Fig. 1. Schematic diagram of the grasshopper embryo at about 30 %, indicating thebrain (B), the three suboesophageal segments (SI—S3), the three thoracic segments(T1-T3), and the eleven abdominal segments (Al-All) . On the right is a schematicdiagram of the pattern and identification of neuronal precursor cells in each segment.There are two types of precursors: neuroblasts (NBs) and midline precursors (MPs)(Bate, 1976; Bate & Grunewald, 1981). Each segment contains two plates of 30 NBseach, a median neuroblast (MNB), and 7 MPs (MP1, MP2i, MP2r, MP3, MP4,MP5, and MP6). In this paper we examine the two progeny of midline precursor 3(MP3) whose position in the map is indicated by the arrow.
Neuronal cell death in grasshopper embryos 171
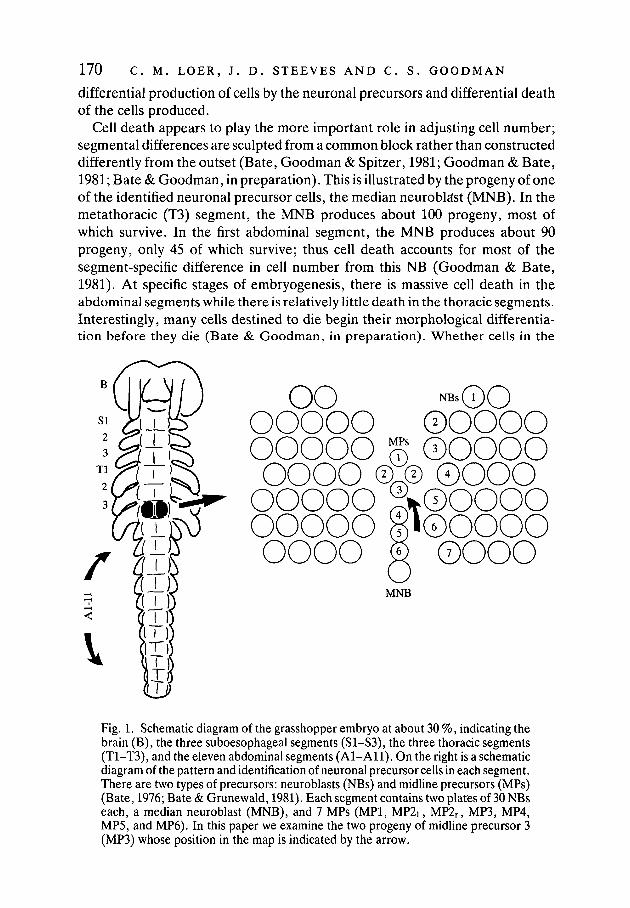
Fig. 2. Morphology of the 'H' cell and 'H cell sib' in the mesothoracic (T2) segmentof a 60 % grasshopper embryo, based on a camera-lucida drawing of cells filled withthe fluorescent dye Lucifer yellow. Anterior is up.
abdominal segments have a programmed commitment to die, or are directed todie by the segmental environment they find themselves in, remains an openquestion (e.g. Whitington et al 1982).
Many neurones destined to die can be individually identified. For example,within the repeated pattern of precursor cells, every segment has a single midlineprecursor 3 (MP3) which divides once to give rise to two progeny (Fig. 1; Good-man, Bate & Spitzer, 1981). In the meso- (T2) and metathoracic (T3) segments,one of these two progeny differentiates into the distinctive 'H' cell; its sibling hasa single anterior axon (Fig. 2). In some of the abdominal segments, one or bothof these two cells dies (Bate, Goodman & Spitzer, 1981). These two neuronesare ideal for studying cell death because they are highly accessible and easilyrecognized from birth simply on the basis of their cell body location. Previous
172 C. M. LOER, J. D. STEEVES AND C. S. GOODMAN
examination of the two MP3 progeny described segmental differences in theirsurvival versus death (Bate, Goodman & Spitzer, 1981). Although there is atrend in the segment-specific differences of survival versus death, the precisepattern varies from embryo to embryo.
In the present study we have been interested in three questions concerning thecell death of the MP3 progeny. First, how much variability in the pattern of celldeath exists from embryo to embryo of the same species? Second, are theresignificant differences in the pattern of cell death between different species andgenera? Third, to what degree is the variable pattern of cell death in animalswithin a species due to genetic versus non-genetic influences? To answer thesequestions, we counted the number of MP3 progeny present (either 0 ,1 , or 2) ineach segment after cell death occurs. We examined 472 embryos from fourdifferent species {Schistocerca americana, S. nitens, S. gregaria, and Melanoplusdiffer entialis). Furthermore, we examined the variable pattern of cell death indifferent clutches of the same species, and in different isogenic clones of the samespecies. Clutches are the offspring of single mated females; clones are theparthenogenetic offspring of single unmated females (Goodman, 1977, 1978;Steeves & Pearson, 1983). Thus, animals within a clutch are genetically related,whereas animals within an isogenic clone are genetically identical. In this paperwe show significant differences in the pattern of cell death between differentgenera and species, and between different genetically related clutches andisogenic clones within a single species. Some of these results have previouslybeen reported (Loer & Goodman, 1981).
MATERIALS AND METHODS
Four different species were used: Schistocerca americana, S. nitens, S.gregaria, and Melanoplus differential. S. americana and S. nitens were obtainedfrom a laboratory colony at Stanford University, S. gregaria was obtained fromUniversity of British Columbia, and M. differential was obtained from ZoeconCorp. Although we do not know the precise number of generations that eachcolony has been bred in the laboratory, the S. nitens and S. gregaria colonies arequite old (well over 50 generations in the laboratory) whereas the S. americanacolony is relatively young (about five generations in the laboratory at the timethese experiments began). We report on 151 embryos of 5. americana, including25 embryos each from four different clutches (S.a. 4, 5, 6, and 7); 125 embryosof S. nitens, including at least 20 embryos each from four different clutches (S.n.1, 4, 5, and 6); 102 embryos of M. differential; and 94 embryos of S. gregariafrom four different isogenic clones (7, 8,10, and 21). The clones were producedparthenogenetically at the University of British Columbia according to themethod of Goodman (1977,1978).
Embryos were examined at 55 %-65 % of development (Bentley, Keshishian,Shankland & Toroian-Raymond, 1979) after cell death of the MP3 progeny
Neuronal cell death in grasshopper embryos 173
I
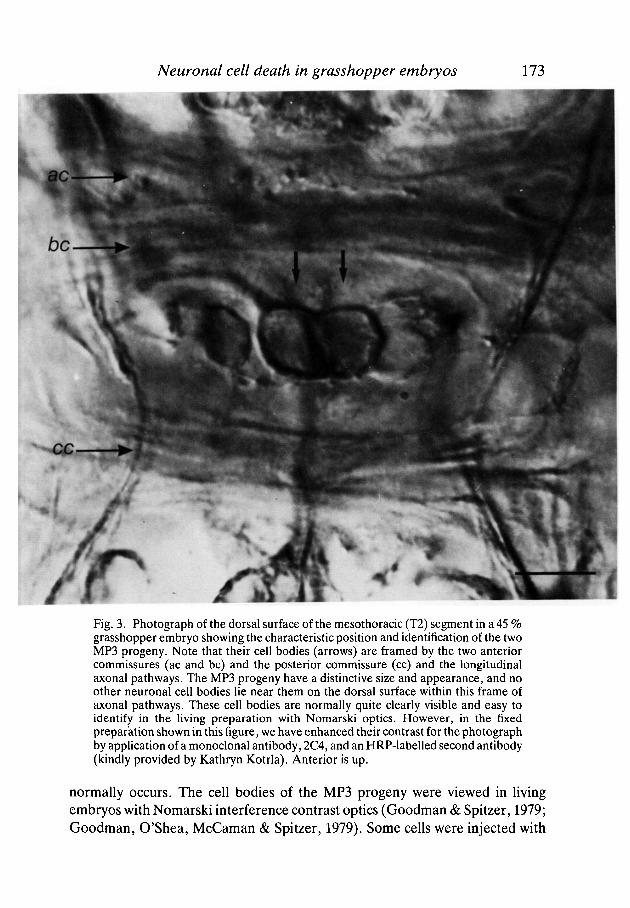
Fig. 3. Photograph of the dorsal surface of the mesothoracic (T2) segment in a 45 %grasshopper embryo showing the characteristic position and identification of the twoMP3 progeny. Note that their cell bodies (arrows) are framed by the two anteriorcommissures (ac and be) and the posterior commissure (cc) and the longitudinalaxonal pathways. The MP3 progeny have a distinctive size and appearance, and noother neuronal cell bodies lie near them on the dorsal surface within this frame ofaxonal pathways. These cell bodies are normally quite clearly visible and easy toidentify in the living preparation with Nomarski optics. However, in the fixedpreparation shown in this figure, we have enhanced their contrast for the photographby application of a monoclonal antibody, 2C4, and an HRP-labelled second antibody(kindly provided by Kathryn Kotrla). Anterior is up.
normally occurs. The cell bodies of the MP3 progeny were viewed in livingembryos with Nomarski interference contrast optics (Goodman & Spitzer, 1979;Goodman, O'Shea, McCaman & Spitzer, 1979). Some cells were injected with
174 C. M. LOER, J. D. STEEVES AND C. S. GOODMAN
the fluorescent dye Lucifer Yellow to examine their morphology. The cell bodiesof the two MP3 progeny are easily recognized after a minimal dissection. Theircell bodies are located on the dorsal surface of the developing ganglion and areframed by the anterior and posterior commissures and the longitudinal axonalpathways (Fig. 3). The MP3 progeny have a distinctive size and appearance, andno other neuronal cell bodies lie near them on the dorsal surface within this frameof axonal pathways.
The MP3 progeny were examined in 14 contiguous segments: S3(suboesophageal segment 3), T1-T3 (pro-, meso-, and metathoracic seg-ments), and A1-A10 (abdominal segments 1-10). Altogether, the embryonicnervous system derives from 17 segmental ganglia (S1-S3, T1-T3, A l - A l l )plus a brain of unknown segmental origin. Each segment was scored ascontaining 0, 1, or 2 MP3 progeny. In the cases in which we see less than twoMP3 progeny, we can rule out the possibility that MP3 has failed to divideor that the progeny have failed to migrate to the dorsal surface because, priorto the period of cell death, we always see two cells in this characteristic positionin each segment (e.g. Fig. 3). Furthermore, after the period of cell death, weoccasionally see the remains of one or two dead cells in the appropriatelocation. The S3, A8, A9, and A10 segments were often difficult to scorebecause of the presence of other cells or tissues obscuring identification of theMP3 progeny. Although a segment was not scored unless we were quite certainabout the presence or absence (and identification) of the MP3 progeny, thesamples from S3, A8, A9, and A10 are nonetheless the least reliable. We haveno doubt that our scoring of the other segments (T1-T3, A1-A7) is absolutelyreliable.
RESULTS
Segmental pattern of MP3 progeny
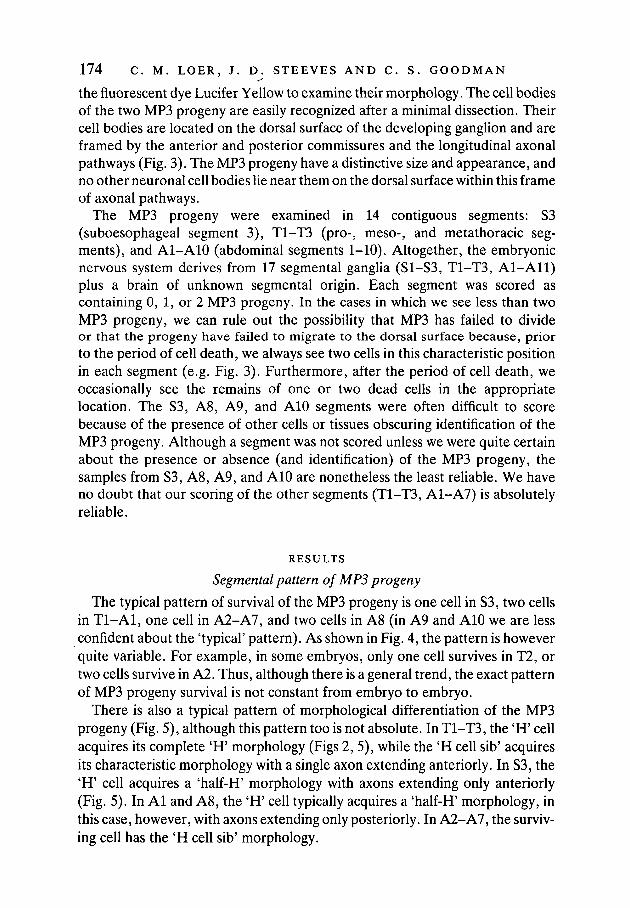
The typical pattern of survival of the MP3 progeny is one cell in S3, two cellsin T l - A l , one cell in A2-A7, and two cells in A8 (in A9 and A10 we are lessconfident about the 'typical' pattern). As shown in Fig. 4, the pattern is howeverquite variable. For example, in some embryos, only one cell survives in T2, ortwo cells survive in A2. Thus, although there is a general trend, the exact patternof MP3 progeny survival is not constant from embryo to embryo.
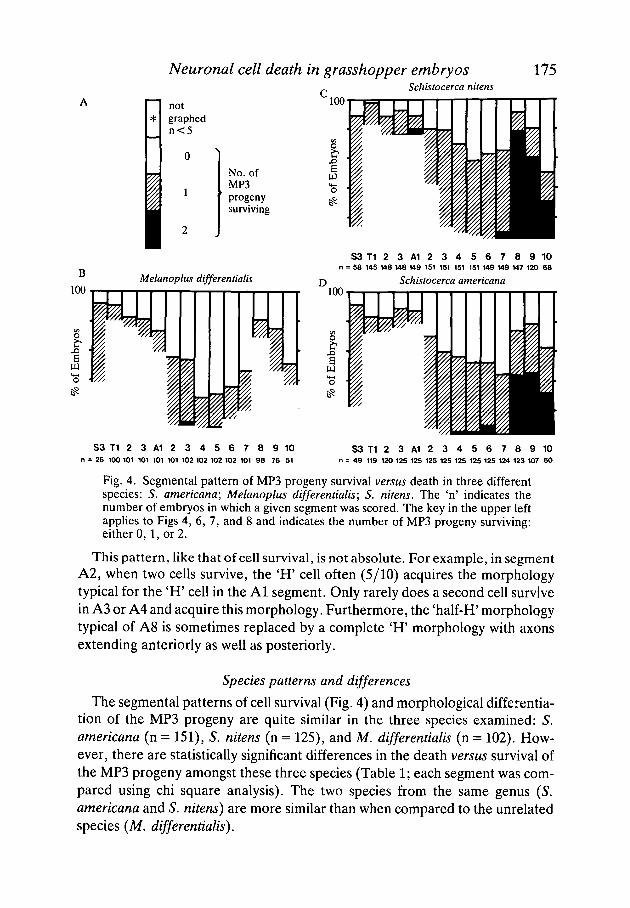
There is also a typical pattern of morphological differentiation of the MP3progeny (Fig. 5), although this pattern too is not absolute. In T1-T3, the 'H' cellacquires its complete 'H' morphology (Figs 2, 5), while the 'H cell sib' acquiresits characteristic morphology with a single axon extending anteriorly. In S3, the'H' cell acquires a 'half-H' morphology with axons extending only anteriorly(Fig. 5). In Al and A8, the 'H' cell typically acquires a 'half-H' morphology, inthis case, however, with axons extending only posteriorly. In A2-A7, the surviv-ing cell has the 'H cell sib' morphology.
Neuronal cell death in grasshopper embryos 175Schistocerca nitens
notgraphedn < 5
0
No. ofMP3progenysurviving
Melanoplus differentialis
S 3 T1 2 3 A1 2 3 4 5 6 7 8 9 10n = 58 145 148 148 149 151 151 151 151 149 149 147 120 68
Schistocerca americana100
S3 T1 2 3 A1 2 3 4 5 6 7 8 9 10n = 26 100 101 101 101 101 102 102 102 102 101 98 76 51
S 3 T1 2 3 A1 2 3 4 5 6 7 8 9 10n = 49 119 120 125 125 125 125 125 125 125 124 123 107 60
Fig. 4. Segmental pattern of MP3 progeny survival versus death in three differentspecies: 5. americana; Melanoplus differentialis; S. nitens. The 'n' indicates thenumber of embryos in which a given segment was scored. The key in the upper leftapplies to Figs 4, 6, 7, and 8 and indicates the number of MP3 progeny surviving:either 0,1, or 2.
This pattern, like that of cell survival, is not absolute. For example, in segmentA2, when two cells survive, the 'H' cell often (5/10) acquires the morphologytypical for the 'H' cell in the Al segment. Only rarely does a second cell survivein A3 or A4 and acquire this morphology. Furthermore, the 'half-H' morphologytypical of A8 is sometimes replaced by a complete 'H' morphology with axonsextending anteriorly as well as posteriorly.
Species patterns and differences
The segmental patterns of cell survival (Fig. 4) and morphological differentia-tion of the MP3 progeny are quite similar in the three species examined: S.americana (n = 151), S. nitens (n = 125), and M. differentialis (n = 102). How-ever, there are statistically significant differences in the death versus survival ofthe MP3 progeny amongst these three species (Table 1; each segment was com-pared using chi square analysis). The two species from the same genus (5.americana and S. nitens) are more similar than when compared to the unrelatedspecies (M. differentialis).
176 C. M. LOER, J. D. STEEVES AND C. S. GOODMAN
S3
T1-T3
Al
A2-A7
A8
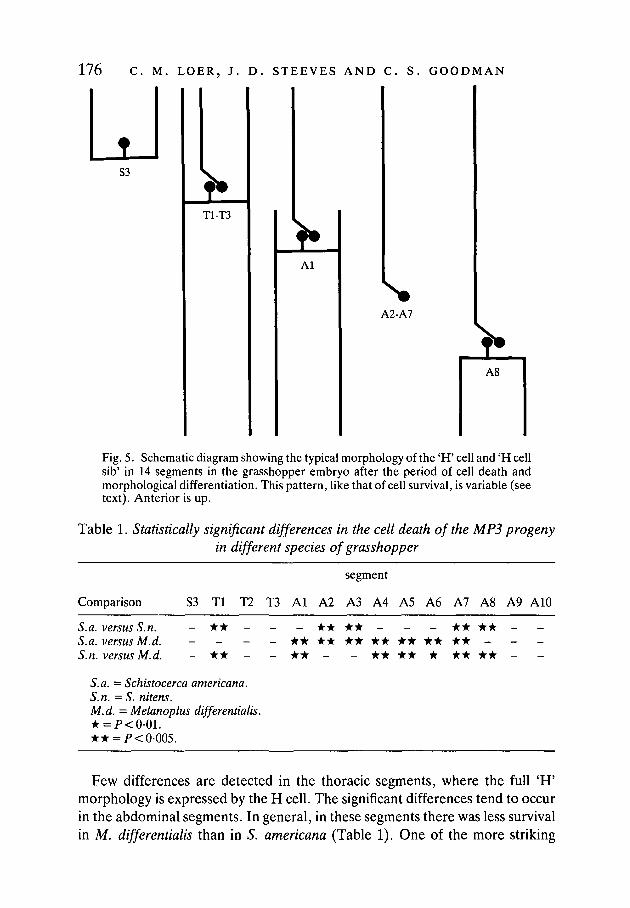
Fig. 5. Schematic diagram showing the typical morphology of the 'H' cell and 'H cellsib' in 14 segments in the grasshopper embryo after the period of cell death andmorphological differentiation. This pattern, like that of cell survival, is variable (seetext). Anterior is up.
Table 1. Statistically significant differences in the cell death of the MP3 progenyin different species of grasshopper
segment
Comparison S3 Tl T2 T3 Al A2 A3 A4 A5 A6 A7 A8 A9 A10
S.a. versus S.n. - * * -S.a. versus M.d. -S.n. versus M.d. - * * - -
- • * • • - - - • • • *• • * * • • • * • • • • • • -* * - - • * * * • * * * •
S.a. = Schistocerca americana.S.n. = S. nitens.M.d. = Melanoplus differentialis.* = P<O01.• * = p<0-005.
Few differences are detected in the thoracic segments, where the full 'H'morphology is expressed by the H cell. The significant differences tend to occurin the abdominal segments. In general, in these segments there was less survivalin M. differentialis than in S. americana (Table 1). One of the more striking
Neuronal cell death in grasshopper embryos 111
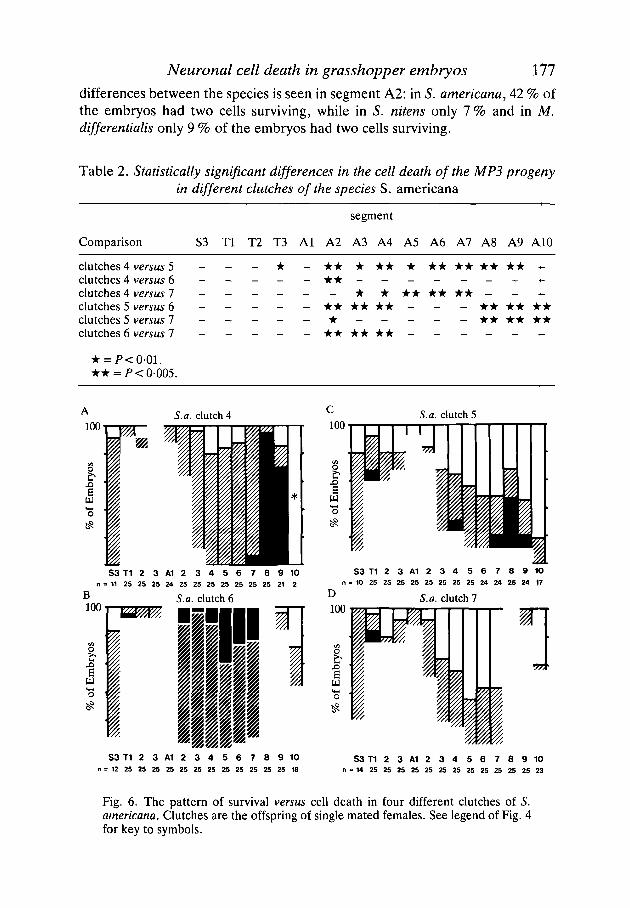
differences between the species is seen in segment A2: in S. americana, 42 % ofthe embryos had two cells surviving, while in S. nitens only 7 % and in M.differentialis only 9 % of the embryos had two cells surviving.
Table 2. Statistically significant differences in the cell death of the MP3 progenyin different clutches of the species S. americana
Comparison
segment
S3 Tl T2 T3 Al A2 A3 A4 A5 A6 A7 A8 A9 A10
clutches 4 versus 5clutches 4 versus 6clutches 4 versus 7clutches 5 versus 6clutches 5 versus 1clutches 6 versus 7
- - - • - * • • * • • • • • • * * • • «-- • • - - - - - -
* • • • • • • * -- • • • • • • - - - • • • • • •- - - - - - - * • • • • •- • • • • • • _ _ - _ _
• * = •005.
S.a. clutch 4 S.a. clutch 5
2 3 A1 2 3 4 5 6 7 8 9 10 S325 25 24 25 25 25 25 25 25 25 21 2 " = 1 0
S.a. clutch 6
T 1 2 3 A 1 2 3 4 5 6 7 8 9 1O
25 25 25 25 25 25 25 25 24 24 25 24 17
S.a. clutch 7
S3 T1n = 12 25
n37T
2 3 A125 25 25 25 25 25 25 25 25 25 25 18
S3T1 2 3A1 2 3 4 5 6 7 8 91014 25 25 25 25 25 25 25 25 25 25 25 25 23
Fig. 6. The pattern of survival versus cell death in four different clutches of 5.americana. Clutches are the offspring of single mated females. See legend of Fig. 4for key to symbols.
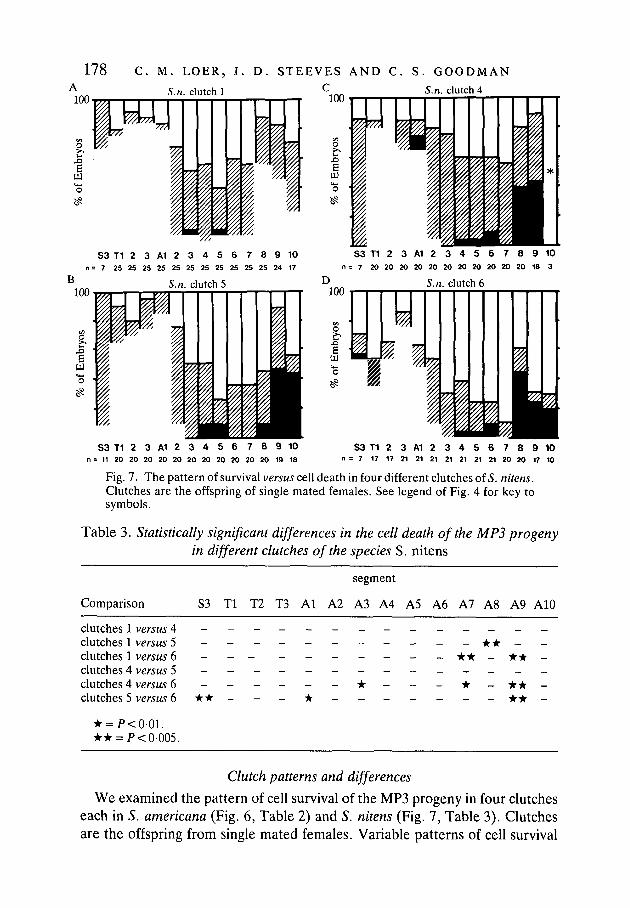
178 C. M. LOER, J. D. STEEVES AND C. S. GOODMANS.n. clutch 4
S3 T1 2 3 A1 2 3 4 5 6 7 8 9 10n= 7 25 25 25 25 25 25 25 25 25 25 25 24 17
S3 T1 2 3 A1 2 3 4 5 6 7 8 9 10n = 7 20 20 20 20 20 20 20 20 20 20 20 18 3
S3 T1 2 3 A1 2 3 4 5 6 7 8 9 10n = 11 20 20 20 20 20 20 20 20 20 20 20 19 18
S3 T1 2 3 A1 2 3 4 5 6 7 8 9 10n = 7 17 17 21 21 21 21 21 21 21 20 20 17 10
Fig. 7. The pattern of survival versus cell death in four different clutches of S. nitens.Clutches are the offspring of single mated females. See legend of Fig. 4 for key tosymbols.
Table 3. Statistically significant differences in the cell death of the MP3 progenyin different clutches of the species S. nitens
Comparison
segment
S3 Tl T2 T3 Al A2 A3 A4 A5 A6 A7 A8 A9 A10
clutches 1 versus 4clutches 1 versus 5clutches 1 versus 6clutches 4 versus 5clutches 4 versus 6clutches 5 versus 6
* = P<0-01.• • = />< 0-005.
- - - - - - - - * • - -- - - _ • • _ * * _
• * - - - • - - - -_ * _ * * _- - - • • -
Clutch patterns and differences
We examined the pattern of cell survival of the MP3 progeny in four clutcheseach in S. americana (Fig. 6, Table 2) and 5. nitens (Fig. 7, Table 3). Clutchesare the offspring from single mated females. Variable patterns of cell survival
Neuronal cell death in grasshopper embryos 179were observed within the offspring of a single clutch. Furthermore, statisticallysignificant differences were detected between clutches of the same species. Oneof the more striking examples of differences between clutches is seen in segmentA2: in clutch 6 only 4 % of the embryos had two cells surviving, while in clutch5 there were two cells surviving in 80 % of the embryos.
It is interesting that more differences were detected between the clutches ofS. americana than S. nitens (Tables 2 versus 3). One possible explanation is basedon the age of these colonies: at the time of these assays, the S. americana colonyhad only been in the laboratory about five generations, whereas the S. nitenscolony had been in the laboratory for over 50 generations. It seems quite possiblethat the inbreeding and/or laboratory selection resulted in greater homogeneityin the S. nitens colony and thus fewer differences between the S. nitens clutches.
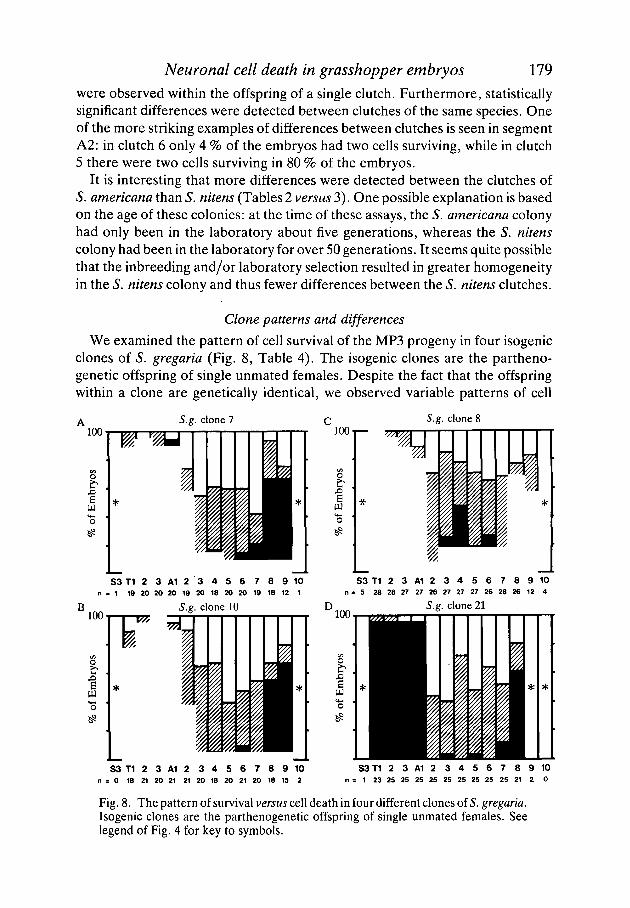
Clone patterns and differences
We examined the pattern of cell survival of the MP3 progeny in four isogenicclones of S. gregaria (Fig. 8, Table 4). The isogenic clones are the partheno-genetic offspring of single unmated females. Despite the fact that the offspringwithin a clone are genetically identical, we observed variable patterns of cell
S.g. clone 7 S.g. clone 8
n = 5 28 28 27 27 26 27 27 27 26 28 26 12 4n . 1 19 20 20 20 19 20 18 20 20 19 18 12 1
S 3 T 1 2 3 A 1 2 3 4 5 6 7 8 9 1 0= 0 18 21 20 21 21 20 18 20 21 20 18 15 2
S3 T1 2 3 A1 2 3 4 5 6 7 8 9 10: 1 23 25 25 25 25 25 25 25 25 25 21 2 0
Fig. 8. The pattern of survival versus cell death in four different clones of 5. gregaria.Isogenic clones are the parthenogenetic offspring of single unmated females. Seelegend of Fig. 4 for key to symbols.
180 C. M. LOER, J. D. STEEVES AND C. S. GOODMAN
Table 4. Statistically significant differences in the cell death of the MP3 progenyin different isogenic clones of the species S. gregaria
segment
Comparison S3 Tl T2 T3 Al A2 A3 A4 A5 A6 A7 A8 A9 A10
clones 8 versus 10 _ _ _ _ _ _ _ * _ _ _ _ _ _clones 8 versus 21 _ _ _ _ _ _ * * * * _ _ _ _ _ _clones 8 versus 7 _ _ _ _ _ * * _ _ _ _ _ _ _ _clones 10 versus 21 - * * - - - - - - - -clones 10 versus 7 _ _ _ _ _ - _ _ - - _ - _ _clones 7 versus 21 _ _ _ _ _ * * - - - - - - - -
* = P<0-01.• • = />< 0-005.
survival within the clones. At the same time, however, we observed statisticallysignificant differences between different clones (Table 4). For example, clone 7had a high survival rate in the A2 segment, whereas clone 8 had an unusually highsurvival rate in A3 and A4. In regard to the small number of significant dif-ferences observed between the difference clones, it may be pertinent to note thatthe colony of S. gregaria had been inbred in the laboratory for over 80 genera-tions prior to the production of these clones. The S. nitens colony, on the otherhand, has been inbred for significantly fewer generations and, interestingly,shows a larger number of significant differences between different clutches.
DISCUSSION
Bate, Goodman & Spitzer (1981) showed a segmental pattern of cell survivalversus death for the two MP3 progeny in segments T2-A6. The results presentedin this paper expand the knowledge of this pattern to other segments (S3-A10),and in particular show that within this general pattern there is considerablevariability from embryo to embryo. The statistically significant differences be-tween different clutches and clones show that there is a genetic influence on theprobability of survival versus death of these two cells. However, the strikingvariability within individual clutches and clones shows that there is also a sig-nificant epigenetic influence on the death of these neurones.
A previous study (Goodman, 1977) using isogenic clones of grasshoppersshowed that duplications and deletions of identified neurones can occur with ahigh degree of genetic control and specificity. The paper speculated:
"The specificity of duplications and deletions could result from either selective celldivision or selective cell death."
The results from our present investigation show how genetic variability in theselective death of identified neurones can lead to such differences in cell number.
Neuronal cell death in grasshopper embryos 181We have shown significant differences in cell death between different genera
and species, and significant differences between the genetically related offspringof different clutches, and between the genetically identical offspring of differentclones. Although variable patterns within clutches and clones indicate that theepigenetic influence is great, nevertheless we have demonstrated that certaindifferences in the pattern of survival versus death are heritable. It is interestingto speculate that these differences in the number of identified neurones betweendifferent clutches and clones may be the raw material on which natural selectionacts to produce the different patterns observed in different populations andspecies.
An interesting question for the future remains: what causes the segment-specific death of the MP3 progeny? Are these segmental differences the resultof (i) segment-specific differences in the intrinsic program of the cells (e.g.studies on the nematode Caenorhabditis elegans; reviewed by Horvitz, Ellis &Sternberg, 1982); (ii) segment-specific differences in the amount or response tosome diffusing hormone or factor (e.g. studies on the moth Manduca sexta;reviewed by Truman & Schwartz, 1982); or (iii) segment-specific differences inthe cellular environment contacted by the growth cones of these cells before theperiod of cell death; or (iv) segment-specific differences in the growth cones ofother cells that contact these cells before the period of cell death? These last twopossibilities can be tested in the grasshopper embryo by cell ablations and othermanipulations in different segments prior to the period of cell death. Whateverthe mechanism underlying the death of the MP3 progeny, its effectiveness isclearly variable from embryo to embryo and its variability is under both geneticand epigenetic control.
This study was the undergraduate honors thesis of C.M.L. in the Department of BiologicalSciences, Stanford University. We thank Kathryn Kotrla and Bill Kristan for criticism of themanuscript. The study was supported by grants from the N.S.F. and McKnight Foundationto C.S.G., and from N.S.E.R.C. to J.D.S.
REFERENCESBATE, C. M. (1976). Embryogenesis of an insect nervous system: I. A map of the thoracic and
abdominal neuroblasts in Locusta migratoria. J. Embryol. exp. Morph. 35, 107-123.BATE, C. M. & GRUNEWALD, E. B. (1981). Embryogenesis of an insect nervous system: II. A
second class of neuron precursor cells and the origin of the intersegmental connective$. J.Embryol. exp. Morph. 61, 317-330.
BATE, C. M., GOODMAN, C. S. &SPITZER, N. C. (1981). Embryonic development of identifiedneurons: segmental differences of the H cell homologues. /. Neurosci. 1,103-106.
BENTLEY, D., KESHISHIAN, H., SHANKLAND, M. & TOROIAN-RAYMOND, A. (1979). Quan-titative staging of embryonic development of the grasshopper, Schistocerca nitens. J. Em-bryol. exp. Morph. 54, 47-74.
GOODMAN, C. S. (1977). Neuron duplications and deletions in locust clones and clutches.Science 197, 1384-1386.
GOODMAN, C. S. (1978). Isogenic grasshoppers: genetic variability in the morphology ofidentified neurons. /. comp. Neurol. 182, 681-706.

182 C. M. LOER, J. D. STEEVES AND C. S. GOODMAN
GOODMAN, C. S. & BATE, M. (1981). Neuronal development in the grasshopper. Trends inNeuroscience. 4, 163-169.
GOODMAN, C. S. & SPITZER, N. C. (1979). Embryonic development of identified neurones:differentiation from neuroblast to neurone. Nature 280, 208-214.
GOODMAN, C. S., BATE, C. M. & SPITZER, N. C. (1981). Embryonic development of identifiedneurons: origins and transformation of the H cell. /. Neurosci. 1, 94-102.
GOODMAN, C. S., O'SHEA, M., MCCAMAN, R. E. & SPITZER, N. C. (1979). Embryonic develop-ment of identified neurons: temporal pattern of morphological and biochemical differentia-tion. Science 204, 219-222.
HORVITZ, H. R., ELLIS, H. M. & STERNBERG, P. W. (1982). Programmed cell death innematode development. Neurosci. Commentaries 1, 56-65.
LOER, C. M. & GOODMAN, C. S. (1981). Variability in the cell death of identified neurons ingrasshopper embryos. Soc. Neurosci. 7, 294.
STEEVES, J. D. & PEARSON, K. G. (1983). Variability in the structure of an identified inter-neurone in isogenic clones of locusts. /. exp. Biol. 103, 47-54.
TRUMAN, J. W. & SCHWARTZ, L. M. (1982). Insect systems for the study of programmedneuronal death. Neurosci. Commentaries 1, 66-72.
WHITINGTON, P., BATE, M., SEIFERT, E., RIDGE, K. & GOODMAN, C. S. (1982). Survival anddifferentiation of identified embryonic neurons in the absence of their target muscles.Science 215, 973-975.
{Accepted 20 July 1983)