Neuro-fuzzy Modeling of Temperature- and Strain-rate ... · Behavior of NiTi Shape Memory Alloys...
22
1 Neuro-fuzzy Modeling of Temperature- and Strain-rate-dependent Behavior of NiTi Shape Memory Alloys for Seismic Applications O. E. OZBULUT AND S. HURLEBAUS * Zachry Department of Civil Engineering, Texas A&M University, 3136 TAMU College Station, TX 77843 ABSTRACT: This paper proposes a neuro-fuzzy model of superelastic NiTi shape memory alloy (SMA) wires for use in seismic applications. First, in order to collect experimental data, uniaxial tensile tests are conducted on superelastic wires in the temperature range of 0 ºC to 40 ºC, and at the loading frequencies of 0.05 Hz to 2 Hz with five different strain amplitudes. Then, an adaptive neuro-fuzzy inference system (ANFIS) is employed to construct a model of SMAs based on experimental input-output data pairs. The fuzzy model employs strain, strain-rate, and temperature as input variables, and provides stress as single output. Gaussian membership functions (MFs) are assigned to each input variables. A total of twelve if-then rules are used to map these MFs to output characteristic. The model obtained from ANFIS training is validated by using an experimental data set that is not used during training. The developed model is capable of simulating behavior of superelastic SMAs at various temperatures and at various loading rates while it remains simple enough to realize numerical simulations. These features of the model make it attractive for numerical studies on vibration control of structures. Key Words: shape memory alloy, superelasticity, fuzzy model, seismic control, bridges, earthquake INTRODUCTION The term smart materials usually refers the materials that have unique and interesting characteristics and can be employed in conventional structural design to improve performance of the structure (Hurlebaus and Gaul, 2006). Shape memory alloys (SMAs) are a smart class of metals that exhibit several extraordinary properties. An SMA has two stable phases: martensite and austenite. Typically, material in the martensite form is stable at low temperatures and high stresses while the austenite (also named parent phase) material is stable at high temperatures and low stresses. SMAs owe their peculiar characteristics to the solid-to-solid transformations between these two phases. The transformations can be temperature-induced (shape memory effect) or stress-induced (superelasticity). Figure 1 illustrates the phase transformations in an SMA material with a change in temperature in the absence of stress. When an SMA in martensetic phase is heated, material starts to transform from twinned/self-accommodated martensite to austenite at a temperature denoted as A s (austenite start) and, completes this transformation when temperature is above A f (austenite finish). A reverse transformation occurs when the material in austenitic phase is cooled below a temperature denoted as M s (martensite start). SMA transforms completely martensite phase if the temperature is below M f (martensite finish) (Duering and Pelton, 1994). Corresponding author e-mail: [email protected]
Transcript of Neuro-fuzzy Modeling of Temperature- and Strain-rate ... · Behavior of NiTi Shape Memory Alloys...

1
Neuro-fuzzy Modeling of Temperature- and Strain-rate-dependent Behavior of NiTi Shape Memory Alloys for Seismic Applications
O. E. OZBULUT AND S. HURLEBAUS* Zachry Department of Civil Engineering, Texas A&M University, 3136 TAMU College Station, TX 77843
ABSTRACT: This paper proposes a neuro-fuzzy model of superelastic NiTi shape memory alloy (SMA) wires for use in seismic applications. First, in order to collect experimental data, uniaxial tensile tests are conducted on superelastic wires in the temperature range of 0 ºC to 40 ºC, and at the loading frequencies of 0.05 Hz to 2 Hz with five different strain amplitudes. Then, an adaptive neuro-fuzzy inference system (ANFIS) is employed to construct a model of SMAs based on experimental input-output data pairs. The fuzzy model employs strain, strain-rate, and temperature as input variables, and provides stress as single output. Gaussian membership functions (MFs) are assigned to each input variables. A total of twelve if-then rules are used to map these MFs to output characteristic. The model obtained from ANFIS training is validated by using an experimental data set that is not used during training. The developed model is capable of simulating behavior of superelastic SMAs at various temperatures and at various loading rates while it remains simple enough to realize numerical simulations. These features of the model make it attractive for numerical studies on vibration control of structures.
Key Words: shape memory alloy, superelasticity, fuzzy model, seismic control, bridges, earthquake
INTRODUCTION
The term smart materials usually refers the materials that have unique and interesting characteristics and can be employed in conventional structural design to improve performance of the structure (Hurlebaus and Gaul, 2006). Shape memory alloys (SMAs) are a smart class of metals that exhibit several extraordinary properties. An SMA has two stable phases: martensite and austenite. Typically, material in the martensite form is stable at low temperatures and high stresses while the austenite (also named parent phase) material is stable at high temperatures and low stresses. SMAs owe their peculiar characteristics to the solid-to-solid transformations between these two phases. The transformations can be temperature-induced (shape memory effect) or stress-induced (superelasticity). Figure 1 illustrates the phase transformations in an SMA material with a change in temperature in the absence of stress. When an SMA in martensetic phase is heated, material starts to transform from twinned/self-accommodated martensite to austenite at a temperature denoted as As (austenite start) and, completes this transformation when temperature is above Af (austenite finish). A reverse transformation occurs when the material in austenitic phase is cooled below a temperature denoted as Ms (martensite start). SMA transforms completely martensite phase if the temperature is below Mf (martensite finish) (Duering and Pelton, 1994). Corresponding author e-mail: [email protected]

2
Superelasticity, which refers the ability of undergoing large elastic deformation, is a unique property of shape memory alloys. A superelastic SMA is initially in its austenite phase, and when it is loaded above a certain stress level it transforms to detwinned martensite which is only stable as a result of an applied stress. Upon unloading the martensite is no longer stable, and if the temperature is above Af, a reverse transformation to the austenite state occurs that results in complete shape recovery and a substantial hysteretic loop (see Figure 1). If the temperature is between Af and As, the material recovers part of the deformations, and if the temperature is below As, the martensite remains deformed during unloading. If the temperature exceeds Md, austenite phase is stabilized, and martensite transformation cannot be stress-induced.
Figure 1. Phase transformations and superelasticity
The self-centering and energy dissipating behavior of superelastic SMAs make them attractive for seismic applications. In the past decade, a considerable number of researchers have investigated SMAs for vibration control of civil structures (Andrawes and Des Roches, 2005; Dolce et al., 2000; Salich et al., 2001; Shook et al., 2008; Torra et al., 2007; Zhang and Zhu, 2007, Ozbulut and Roschke, 2008). Due to the nature of seismic loads, dynamic behavior of the material should be examined when superelastic SMAs are employed as passive vibration control devices. Several research efforts have been carried out to clarify the influence of the strain rate on superelasticity of shape memory alloys (Leo et al., 1993; Schmidt and Lammering, 2004; Tobushi et al., 1998; Wolons et al., 1998). The reason of the rate-dependent behavior is complex coupling between stress, temperature and rate of heat generation during stress induced phase transformations (Azadi et al, 2006). Experimental studies show that high loading frequencies do not allow the material to transfer latent heat to the environment. As a result, the temperature of the material changes and this, in turn, alters the shape of the hysteresis loops and the transformation stresses (Wu et al., 1996). Since SMAs will be exposed to high loading rates when they are used in seismic applications, it is important to take into account these rate effects when modeling the material.
Several researchers proposed the use of SMA as a bridge restrainer or isolation system component (Choi et al., 2007; Johnson et al., 2008; Padgett and DesRoches, 2008; Wilde et al., 2000). In these applications, SMAs will be subjected to ambient temperature changes. Since phase transformations of SMAs are not only dependent on mechanical loading but also on temperature, the effect of temperature change on superelastic behavior of NiTi

3
wires should be considered in such applications. A number of experimental studies have been conducted to investigate the influence of temperature on superelastic SMAs (Brinson et al., 2004; Chen and Song, 2006; Churchill et al., 2009; Dolce and Cardone, 2001; Piedboeuf et al., 1998). It is reported that the critical stress that initiates the phase transformation changes noticeably with temperature. In particular, an increase in temperature corresponds to a linear increase in transformation stress. Also, it is found that the equivalent viscous damping decreases linearly with an increase in the secant stiffness. Therefore, while modeling behavior of SMAs, it is critical to determine and consider the degree to which superelastic properties of SMAs are affected by variations of temperature.
In order to explore all potential applications of SMAs, a reliable model that describes highly complex behavior of the material has been pursued by many researchers. SMA models have been developed by either following a microscopic approach (Levitas et al., 1998; Muller and Seelecke, 2001; Patoor et al., 1998) that aims to describe phenomena in molecular level or a macroscopic approach (Brinson, 1993; Boyd and Lagoudas, 1996; Liang and Rogers, 1990; Auricchio and Lubliner, 1997; Auricchio, 2001) that considers phenomenological characteristics of SMAs. Although there are a significant number of models that employ different theories and principles to capture the behavior of SMAs, only a few of them are suitable and practical for seismic applications. That is because some of the SMA constitutive models are too complicated and numerically expensive to implement into simulations, whereas simplified models do not include loading rate and/or temperature effects that influence considerably the behavior of SMAs (Motahari and Ghassemieh, 2007).
In this study, first, uniaxial tensile tests at various loading rates and ambient temperature are performed in order to evaluate the effects of loading rate and temperature on mechanical behavior of superelastic NiTi wires. After collecting experimental data, an adaptive neuro-fuzzy inference system (ANFIS) is used to model superelastic behavior of NiTi shape memory alloys. ANFIS uses a hybrid learning procedure to adjust a set of rules and parameters of a randomly created fuzzy inference system (FIS) in order to map given inputs to a single-valued output. Here, strain, strain-rate and temperature are the input variables of FIS and stress on the wire is the desired output. It is shown that the developed model can successfully emulate the superelastic behavior of SMAs considering dynamic effects at different temperatures.
EXPERIMENTAL PROCEDURE
Material and Specimen
The material used in this research is NiTi wires with a diameter of 1.5 mm and obtained from SAES Smart Materials. The alloy chemical composition has 55.8% nickel by weight and the balance titanium. The austenite start and finish temperatures are specified by manufacturer as As = -10ºC and Af = 5°C, respectively. The test samples are obtained by cutting the wire into pieces with a length of 305 mm.
4
Experimental Apparatus
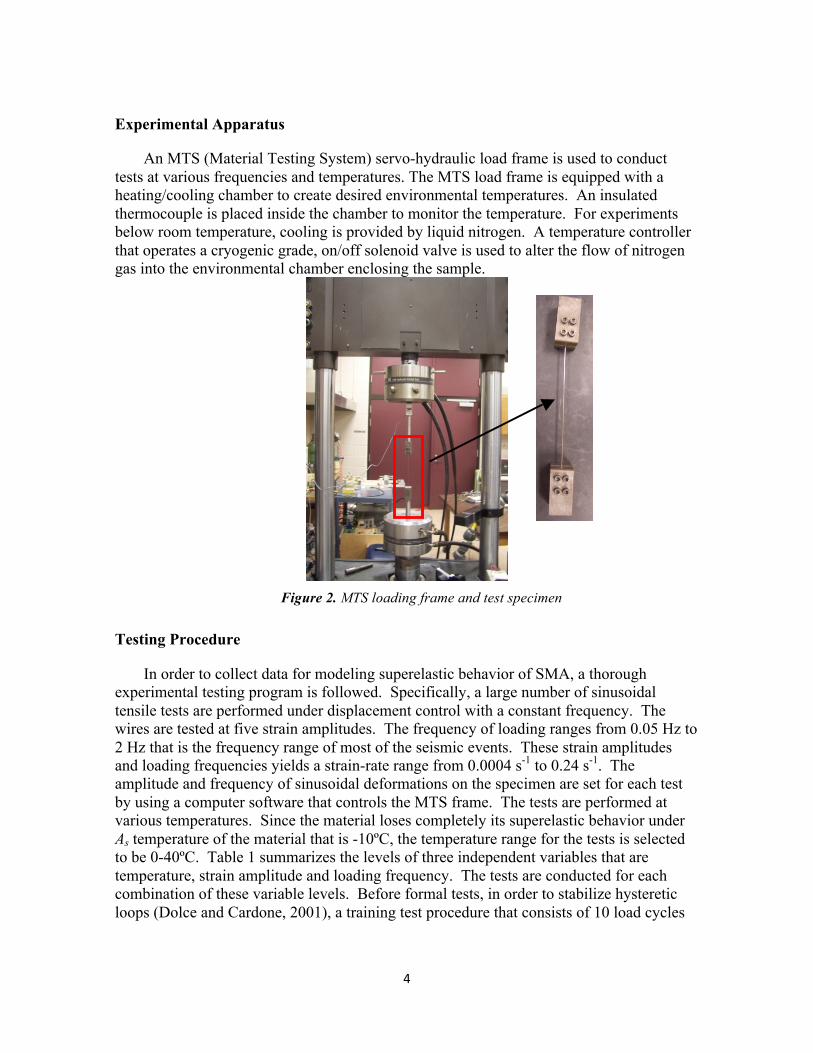
An MTS (Material Testing System) servo-hydraulic load frame is used to conduct tests at various frequencies and temperatures. The MTS load frame is equipped with a heating/cooling chamber to create desired environmental temperatures. An insulated thermocouple is placed inside the chamber to monitor the temperature. For experiments below room temperature, cooling is provided by liquid nitrogen. A temperature controller that operates a cryogenic grade, on/off solenoid valve is used to alter the flow of nitrogen gas into the environmental chamber enclosing the sample.
Figure 2. MTS loading frame and test specimen
Testing Procedure
In order to collect data for modeling superelastic behavior of SMA, a thorough experimental testing program is followed. Specifically, a large number of sinusoidal tensile tests are performed under displacement control with a constant frequency. The wires are tested at five strain amplitudes. The frequency of loading ranges from 0.05 Hz to 2 Hz that is the frequency range of most of the seismic events. These strain amplitudes and loading frequencies yields a strain-rate range from 0.0004 s-1 to 0.24 s-1. The amplitude and frequency of sinusoidal deformations on the specimen are set for each test by using a computer software that controls the MTS frame. The tests are performed at various temperatures. Since the material loses completely its superelastic behavior under As temperature of the material that is -10ºC, the temperature range for the tests is selected to be 0-40ºC. Table 1 summarizes the levels of three independent variables that are temperature, strain amplitude and loading frequency. The tests are conducted for each combination of these variable levels. Before formal tests, in order to stabilize hysteretic loops (Dolce and Cardone, 2001), a training test procedure that consists of 10 load cycles

5
with strain amplitude of 6% at 0.04 Hz and at room temperature is applied to all samples. The tensile tests are conducted for 3 cycles in each case; however, as shown from Figure 3 which illustrates two tests results at different conditions, since the obtained hysteresis loops are stable, only the last cycle is plotted in the figures for the purpose of clarity in the next sections. Table 1. Experimental conditions Variables Temperature 0 ºC 10 ºC 23 ºC 30 ºC 40 ºC Strain amplitude 2% 3% 4% 5% 6% Frequency 0.05 Hz 0.1 Hz 0.5 Hz 1 Hz 1.5 Hz 2 Hz
0 1 2 3 40
100
200
300
400
500
Strain (%)
Stre
ss (M
Pa)
2 Hz - 23 ºC
0 2 4 60
200
400
600
800
Strain (%)
Stre
ss (M
Pa)
1 Hz - 30 ºC
1st cycle2nd cycle3rd cycle
Figure 3. Hysteresis loops of superelastic SMA wires for 1st, 2nd, and 3rd loading cycles.
EXPERIMENTAL RESULTS
Temperature Effects
In this subsection, the temperature dependence of superelastic behavior of NiTi wires is investigated by comparing the experimental tests conducted at different temperatures. Figure 4 shows strain-stress curves of NiTi wires at a particular loading frequency at different temperatures. They are plotted for a maximum strain of 5% since SMA wires significantly lose their superelastic behavior at 6% strain at 0 ºC. It can be observed that at each loading rate, hysteresis loops of SMA shifts upward as temperature increases. Also, it is seen that at 0ºC, SMA wires show completely superelastic behavior at high loading rates (i.e. over 0.5 Hz), whereas there is about 1% residual strain at slower frequencies.
Energy dissipated per cycle, equivalent viscous damping and secant stiffness for each experiment are computed in order to evaluate the test results in a quantitative way.

6
Equivalent viscous damping is computed as dissipated energy per cycle (the area inside the hysteresis loop) divided by the product of 4π and maximum strain energy (the area under a complete cycle). The secant stiffness is calculated as the ratio of the difference between maximum and minimum force on the wire and the difference between maximum and minimum deformation of the wire.
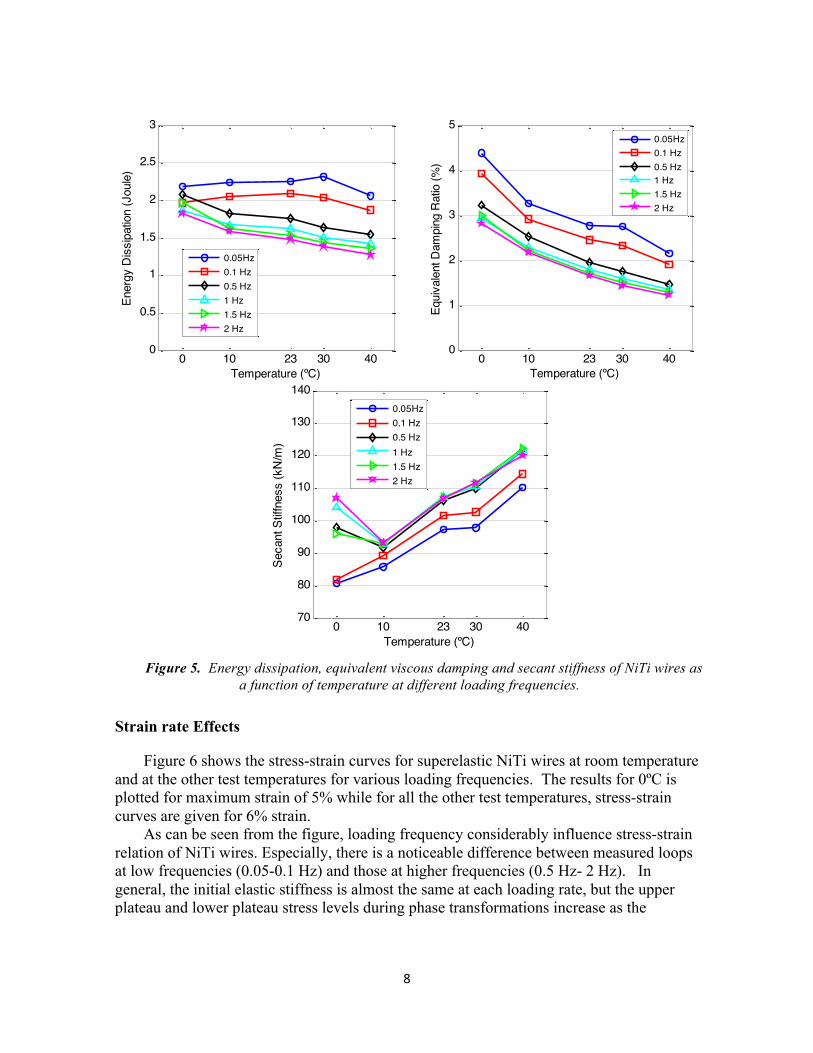
Figure 5 illustrates the variation of energy dissipation with temperature at different loading rates. It can be observed that the energy dissipation decreases as temperature increases, especially at high loading rates (over 0.5 Hz). The maximum decrease is observed to be about 30% for a frequency of 2 Hz. Nevertheless, there is no significant change in dissipated energy with test temperature especially at low frequencies. The dissipated energy only decreases 5% when temperature increases from 0 ºC to 40 ºC for loading frequencies of 0.05 Hz and 0.1 Hz.
The change of equivalent viscous damping and secant stiffness of SMA wires with temperature are given also in Figure 5. As shown from the figure, equivalent viscous damping decreases with increasing temperature. Despite the slight decrease in dissipated energy with temperature, the increase in secant stiffness at higher temperatures, results in higher strain energy per cycle and decreases equivalent viscous damping. As temperature increases from 0 ºC to 40 ºC, equivalent viscous damping reduces 44% and 43% for slowest (0.05 Hz) and highest (2 Hz) loading rates, respectively. It can be seen that secant stiffness increases by about 30% with the increasing temperature at each loading frequency. Furthermore, it is observed that secant stiffness increases considerably at 0 ºC at high loading rates due to significant strain hardening which is a result of the complete transformation to the martensite phase and the further elastic deformation in this phase.

7
0 2 4 60
200
400
600
Strain (%)
Stre
ss (M
Pa)
0.05 Hz
0 ºC10 ºC23 ºC30 ºC40 ºC
0 2 4 60
200
400
600
Strain (%)
Stre
ss (M
Pa)
0.1 Hz
0 ºC10 ºC23 ºC30 ºC40 ºC
0 2 4 60
200
400
600
Strain (%)
Stre
ss (M
Pa)
0.5 Hz
0 ºC10 ºC23 ºC30 ºC40 ºC
0 2 4 60
200
400
600
Strain (%)
Stre
ss (M
Pa)
1 Hz
0 ºC10 ºC23 ºC30 ºC40 ºC
0 2 4 60
200
400
600
Strain (%)
Stre
ss (M
Pa)
1.5 Hz
0 ºC10 ºC23 ºC30 ºC40 ºC
0 2 4 60
200
400
600
Strain (%)
Stre
ss (M
Pa)
2 Hz
0ºC10 ºC23 ºC30 ºC40 ºC
Figure 4. Experimental strain-stress curves of NiTi wires at various temperatures and loading frequencies.
8
0 10 23 30 400
0.5
1
1.5
2
2.5
3
Temperature (ºC)
Ener
gy D
issi
patio
n (J
oule
)
0.05Hz0.1 Hz0.5 Hz1 Hz1.5 Hz2 Hz
0 10 23 30 40
0
1
2
3
4
5
Temperature (ºC)
Equi
vale
nt D
ampi
ng R
atio
(%)
0.05Hz0.1 Hz0.5 Hz1 Hz1.5 Hz2 Hz
0 10 23 30 4070
80
90
100
110
120
130
140
Temperature (ºC)
Seca
nt S
tiffn
ess
(kN
/m)
0.05Hz0.1 Hz0.5 Hz1 Hz1.5 Hz2 Hz
Figure 5. Energy dissipation, equivalent viscous damping and secant stiffness of NiTi wires as
a function of temperature at different loading frequencies.
Strain rate Effects
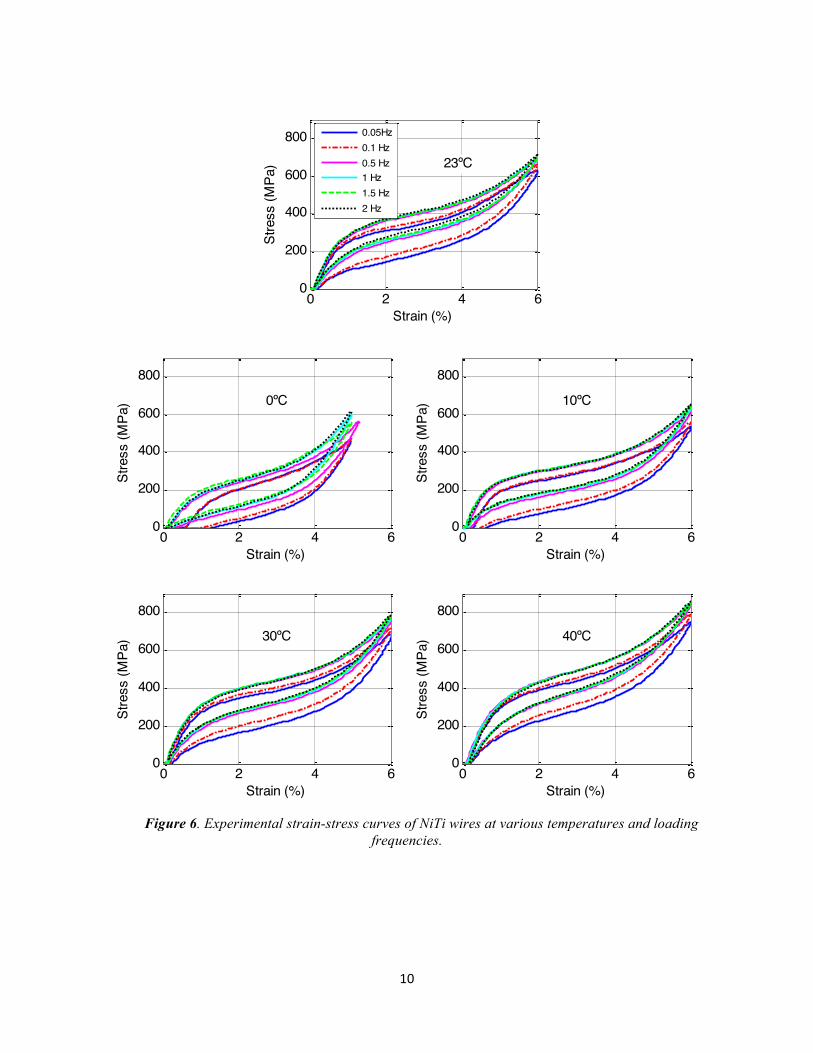
Figure 6 shows the stress-strain curves for superelastic NiTi wires at room temperature and at the other test temperatures for various loading frequencies. The results for 0ºC is plotted for maximum strain of 5% while for all the other test temperatures, stress-strain curves are given for 6% strain.
As can be seen from the figure, loading frequency considerably influence stress-strain relation of NiTi wires. Especially, there is a noticeable difference between measured loops at low frequencies (0.05-0.1 Hz) and those at higher frequencies (0.5 Hz- 2 Hz). In general, the initial elastic stiffness is almost the same at each loading rate, but the upper plateau and lower plateau stress levels during phase transformations increase as the
9
frequency is increased. Since the lower plateau stress level increases more, the hysteresis loop narrows and, as a result, energy dissipation reduces.
When SMAs are used for seismic applications, it is important to evaluate the effects of dynamic loading on damping properties of the material. Figure 7 shows the variation of energy dissipated per cycle, equivalent viscous damping, and secant stiffness with loading frequency at various temperatures using a semi-log axis for frequency. It is observed that dissipated energy decreases between a minimum of 28% for the test temperature of 10ºC and a maximum of 40% for the test temperature of 30ºC when the loading frequency increases from 0.05 Hz to 2 Hz. Similarly, as the frequency increases from 0.05 Hz to 2 Hz, the equivalent viscous damping decreases between 35% and 47% for different test temperatures. This shows higher loading rates markedly affect the material response and its damping capability.
However, the dissipated energy decreases between 12% and 17%, and the equivalent viscous damping decreases between 13% and 17% for different test temperatures, when frequency is increased from 0.5 Hz to 2 Hz. This indicates the effect of loading-rate on the behavior of NiTi wires is more moderate when the loading frequency is increased further than a certain value. Also, secant stiffness increases almost linearly by about 9% with increasing loading frequency at each test temperature.
10
0 2 4 60
200
400
600
800
Strain (%)
Stre
ss (M
Pa) 0ºC
0 2 4 60
200
400
600
800
Strain (%)
Stre
ss (M
Pa) 10ºC
0 2 4 60
200
400
600
800
Strain (%)
Stre
ss (M
Pa) 23ºC
0.05Hz0.1 Hz0.5 Hz1 Hz1.5 Hz2 Hz
0 2 4 60
200
400
600
800
Strain (%)
Stre
ss (M
Pa) 30ºC
0 2 4 60
200
400
600
800
Strain (%)
Stre
ss (M
Pa) 40ºC
Figure 6. Experimental strain-stress curves of NiTi wires at various temperatures and loading
frequencies.

11
0.05 0.1 0.5 1 1.5 20
0.5
1
1.5
2
2.5
3
Frequency (Hz)
Ener
gy D
issi
patio
n (J
oule
)
0ºC10ºC23ºC30ºC40ºC
0.05 0.1 0.5 1 1.5 2
0
1
2
3
4
5
6
Frequency (Hz)
Equi
vale
nt D
ampi
ng R
atio
(%)
0ºC10ºC23ºC30ºC40ºC
0.05 0.1 0.5 1 1.5 2
40
60
80
100
120
140
Frequency (Hz)
Seca
nt S
tiffn
ess
(kN
/m)
0ºC10ºC23ºC30ºC40ºC
Figure 7. Energy dissipation, equivalent viscous damping and secant stiffness of NiTi wires
as a function of loading frequency at different temperatures.
Strain Amplitude Effects
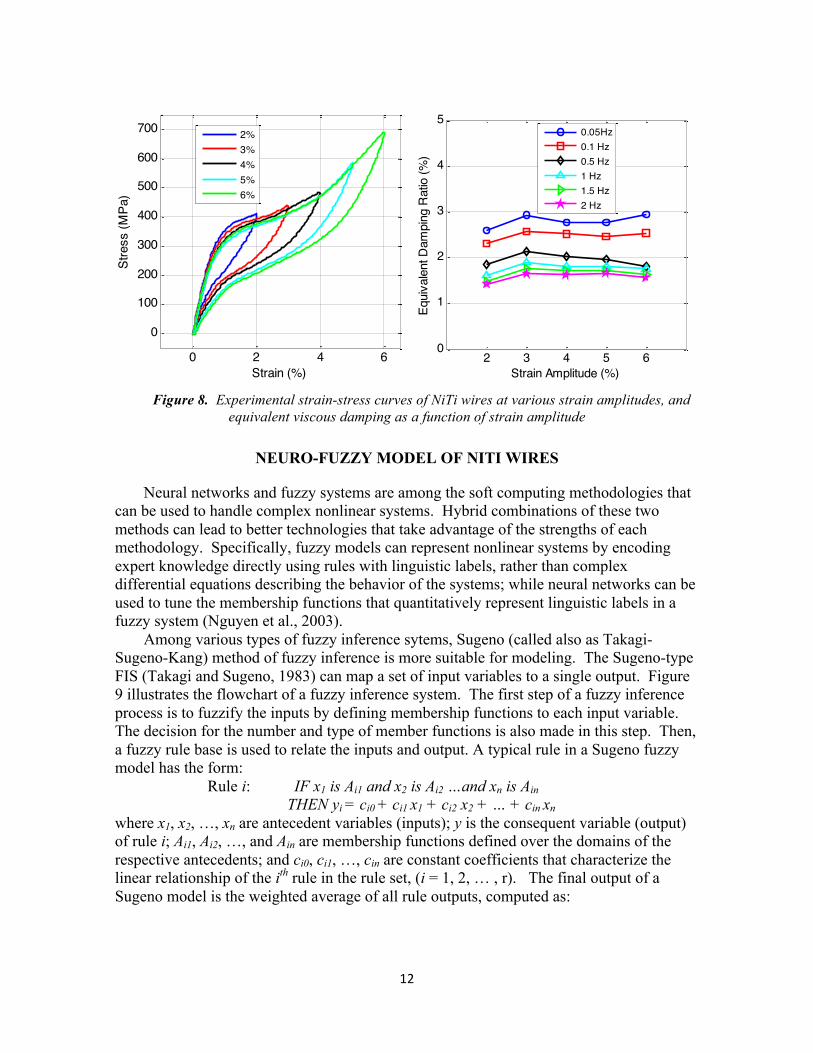
Figure 8 shows the stress-strain curves of NiTi wires for increasing strain amplitudes at 0.1 Hz, and the variation of equivalent viscous damping with strain amplitude. The test results at room temperature are presented in the figure. It is clear that energy dissipation per cycle increases for higher strain amplitudes. However, equivalent viscous damping is usually highest at about 3-4% strain amplitude, and decreases to some extent for larger strain amplitudes. That is due to strain hardening effects at higher level strains as observed in previous studies (Dolce and Cardone, 2001; DesRoches et al., 2004).
12
0 2 4 6
0
100
200
300
400
500
600
700
Strain (%)
Stre
ss (M
Pa)
2%3%4%5%6%
2 3 4 5 6
0
1
2
3
4
5
Strain Amplitude (%)
Equi
vale
nt D
ampi
ng R
atio
(%)
0.05Hz0.1 Hz0.5 Hz1 Hz1.5 Hz2 Hz
Figure 8. Experimental strain-stress curves of NiTi wires at various strain amplitudes, and
equivalent viscous damping as a function of strain amplitude
NEURO-FUZZY MODEL OF NITI WIRES
Neural networks and fuzzy systems are among the soft computing methodologies that can be used to handle complex nonlinear systems. Hybrid combinations of these two methods can lead to better technologies that take advantage of the strengths of each methodology. Specifically, fuzzy models can represent nonlinear systems by encoding expert knowledge directly using rules with linguistic labels, rather than complex differential equations describing the behavior of the systems; while neural networks can be used to tune the membership functions that quantitatively represent linguistic labels in a fuzzy system (Nguyen et al., 2003).
Among various types of fuzzy inference sytems, Sugeno (called also as Takagi-Sugeno-Kang) method of fuzzy inference is more suitable for modeling. The Sugeno-type FIS (Takagi and Sugeno, 1983) can map a set of input variables to a single output. Figure 9 illustrates the flowchart of a fuzzy inference system. The first step of a fuzzy inference process is to fuzzify the inputs by defining membership functions to each input variable. The decision for the number and type of member functions is also made in this step. Then, a fuzzy rule base is used to relate the inputs and output. A typical rule in a Sugeno fuzzy model has the form:
Rule i: IF x1 is Ai1 and x2 is Ai2 …and xn is Ain THEN yi = ci0 + ci1 x1 + ci2 x2 + … + cin xn
where x1, x2, …, xn are antecedent variables (inputs); y is the consequent variable (output) of rule i; Ai1, Ai2, …, and Ain are membership functions defined over the domains of the respective antecedents; and ci0, ci1, …, cin are constant coefficients that characterize the linear relationship of the ith rule in the rule set, (i = 1, 2, … , r). The final output of a Sugeno model is the weighted average of all rule outputs, computed as:

13
∑
∑
=
== r
ii
i
r
ii
w
ywy
1
1 (1)
where wi is the matching degree of the ith rule. Upon defining fuzzy rules, a fuzzy inference engine is employed to evaluate the rules using a fuzzy inference mechanism in order to decide on the output for a given input set. Finally, a defuzzification method is used to obtain a non-fuzzy discrete value.
FUZZIFIER FUZZY INFERENCE ENGINE DEFUZZIFIER
FUZZY RULE BASE
OutputInputs
Figure 9. Flowchart of a fuzzy inference system
The adaptive neuro-fuzzy inference system (ANFIS) is a soft computing approach that combines fuzzy theory and neural networks (Jang et al., 1997). Specifically, ANFIS employs neural network strategies to develop a Sugeno-type FIS whose parameters (membership functions and rules) cannot be predetermined by user’s knowledge. Using a set of input-output data pairs, ANFIS can learn information about the data set and build a model that approximates the real data.
To present the ANFIS architecture, suppose a Sugeno-type fuzzy inference system with two inputs, x1 and x2, and one output, y and a rule base which contains two fuzzy rules as follows:
Rule 1: IF x1 is A11 and x2 is A12 , THEN y1 = c10 + c11 x1 + c12 x2 Rule 2: IF x1 is A21 and x2 is A22 , THEN y2 = c20 + c21 x1 + c22 x2 ANFIS architecture to implement these two rules is shown in Figure 10. In the figure,
a circle indicates a fixed node, while a square represents an adaptive node. There are five layers in an ANFIS architecture. Each node in Layer 1 specifies appropriate fuzzy sets to each antecedent parameter using membership functions. The output of each node in this layer is given by:
O1i = A1i (x1) for i = 1, 2
O1i = A2i -2(x2) for i = 3, 4 (2)
where A1i and A2i are membership functions for fuzzy sets x1 and x2, respectively. Membership functions such as Gaussian, triangular, trapezoidal, etc. can be used to define fuzzy sets.
Layer 2 consists of fuzzy neurons with an aggregation operator such as AND/OR to obtain firing strengths, which represent the degree to which the antecedent part of a fuzzy

14
rule is satisfied. Hence, the outputs of the second layer, O2i, are the products of the
corresponding degrees obtained from Layer 1: O2
i = wi = A1i (x1) × A2i (x2) i = 1, 2 (3) Layer 3 is a normalizer. It contains fixed nodes which compute the ratio of the firing
strengths of the each rule to the sum of the firing strengths of all rules as:
O3i = iw =
∑i
i
i
ww i = 1, 2 (4)
Layer 4 computes the contribution of ith rule towards the final output. Thus, the output of this layer are given by:
O4i = ii yw = )xcxc(cw 2i21i1i0i ++ i = 1, 2
(5)
Layer 5 consists of a single node which computes the overall output by summing all incoming signals. The output of the model is given by:
O5i = y =∑
=
2
1iii yw = 2211 ywyw + =
∑
∑
=
=2
1
2
1
ii
ii
i
w
yw (6)
ANFIS utilizes a hybrid learning technique to adjust the parameters of an initial FIS. In particular, the gradient descent method is used to determine antecedent parameters (the parameters associated with input membership functions Ari), and the least square estimation is used to tune consequent parameters (the parameters of the output, i.e., ci0, ci1, ci2). The detailed information on hybrid learning algorithm is available in Jang (1993).
Layer 1 Layer 2 Layer 3 Layer 4 Layer 5 1w 1w 11fw x1 y x2 2w 2w 22fw
A11
A12
A21
A22
N
N
x1 x2
x1 x2
Π
Π
∑
Figure 10. ANFIS scheme for two-input Sugeno-type fuzzy model

15
In this study, ANFIS is be used to develop a fuzzy model of NiTi wires that considers loading rate and temperature effects. The following subsections explain each step in developing the fuzzy model of superelastic SMAs.
Initial FIS and Data Selection
For modeling complex nonlinear behavior of superelastic SMAs considering temperature and rate effects, it is possible to select various inputs to the model under construction. However, using a large number of inputs both impair the transparency of the model and increase the complexity of computation necessary for building the model (Jang, 1996). Here, strain and strain rate on the wire and temperature are selected as input variables. Then, a Sugeno-type FIS that has three antecedent (input) variables and one output is created (see Figure 11). This initial FIS has random parameters and has no knowledge about behavior of superelastic SMAs.
Data obtained from experimental tensile tests is concatenated to form training, checking and validation data sets for ANFIS simulations. Training and checking data sets are employed in order to tune parameters of initial FIS, and validation data are used to validate the final FIS. Also, employing checking data avoids overfitting of model during training. Since the goal is to obtain a model that captures dynamic behavior of NiTi shape memory alloy wires at different temperatures, the test results at loading frequencies ranging from 0.5 Hz to 2 Hz and at temperatures ranging from 0ºC to 40 ºC are used. Upon concatenation of these data sets, every third data is used for training, and the rest similarly is saved as checking and validation data sets. A fourth-order central difference method is used to calculate strain rate data from measured strain data. Each of training, checking and validation data sets are composed of 17,090 data points. Note that the selected data points should sufficiently cover the universe of discourse of each input variable yet, excessive number of data points should be avoided in order to reduce the time for model construction. More information on setting input/output data sets can be found in Jang (1996) and Buragohain and Mahanta (2008).
Figure 11. Fuzzy inference system with its inputs and output.
ANFIS Training
ANFIS modifies the membership functions and rules of the generic FIS during a procedure called training in order to predict correct stress level for given inputs. Here, different types and numbers of membership functions are used to define each input variable of the initial
x1 = Strain
x2 = Strain rate
x3 = Temperature
y = Stress FUZZY INFERENCE
SYSTEM (FIS)

16
FIS. Then, these parameters are tuned by ANFIS during training to achieve best results. After several trials, three Gaussian membership functions are assigned to strain (A11 (x1), A21 (x1), and A31(x1)) and two Gaussian membership functions are chosen for both strain rate (A12 (x2) and A22 (x2)) and temperature (A13 (x3) and A23 (x3)). The Gaussian membership function is defined as:
A(xi) = ⎟⎟⎠
⎞⎜⎜⎝
⎛ −−2
2
2)(exp
σcx (7)
where c and σ are the parameters that control the shape of the membership function, and x is the antecedent parameter. For the chosen number of membership functions, a total of twelve if-then rules are employed to map input characteristics to a single-valued output. A total of 200 epochs is used to adjust parameters of the membership functions in ANFIS.
Figure 12 shows the membership functions of FIS before and after training with ANFIS. As seen from the figure, initial membership functions for strain and strain rate are considerably adjusted by ANFIS. The plots in Figure 13 show the inputs of the developed FIS together with the experimental and predicted stress. Note that just a part of stress data is shown in order to better evaluate performance of the fuzzy model. It can be seen that ANFIS prediction of stress closely follows experimental training data.
Figure 14 shows variation of stress in NiTi wires versus two input variables of the fuzzy model. The first plot illustrates surface of predicted stress versus strain and strain rate, while the second stress surface is plotted versus strain and temperature. It is clear that stress changes nonlinearly with a variation in any of three input variables. Also, excessive strain hardening at 0 ºC for high strain amplitudes, which is discussed earlier, can be easily observed in the second plot.

17
0 2 4 60
0.5
1
Strain (%)Degr
ee o
f mem
bers
hip Initial MFs for strain
-20 -10 0 10 200
0.5
1
Strain rate (%/s)Degr
ee o
f mem
bers
hip Initial MFs on strain rate
0 10 20 30 400
0.5
1
Temperature (ºC) Degr
ee o
f mem
bers
hip Initial MFs on temperature
0 2 4 60
0.5
1
Strain (%)Degr
ee o
f mem
bers
hip Final MFs for strain
-20 -10 0 10 200
0.5
1
Strain rate (%/s)Degr
ee o
f mem
bers
hip Final MFs on strain rate
0 10 20 30 400
0.5
1
Temperature (ºC) Degr
ee o
f mem
bers
hip Final MFs on temperature
Figure 12. Initial and final membership function of FIS.
2000 4000 6000 8000 10000 12000 14000 160000246
Data Point
Stra
in(%
)
2000 4000 6000 8000 10000 12000 14000 16000-20
0
20
Data Point
Stra
in ra
te (%
/s)
0 2000 4000 6000 8000 10000 12000 14000 160000
20
40
Data Point
Tem
pera
ture
(ºC
)
0.99 1 1.01 1.02 1.03 1.04x 10⁴
0200400600
Data Point
Stre
ss (M
Pa)
Training DataANFIS Prediction
Figure 13. Experimental input data and, measured and predicted stress.

18
-200
20
02
460
200
400
600
Strain rate (%/s)Strain (%)
Stre
ss (M
Pa)
0
2040
02
460
200
400
600
800
Temperature (ºC)Strain (%)
Stre
ss (M
Pa)
Figure 14. Surfaces of stress of the fuzzy model
Model Validation
Model validation is the process of presenting a data set that is not used during training to the developed FIS to see how well the trained FIS is reproducing the experimental data. Here, the developed FIS is validated using validation data set described above. Figure 15 illustrates several strain-stress curves of NiTi wires for both experimental tests and fuzzy model at different temperatures, loading rates and strain amplitudes. In particular, experimental test results obtained for (i) a loading frequency of 1 Hz at 0 ºC and 4% maximum strain, (ii) a loading frequency of 1.5 Hz at 10 ºC and 5% maximum strain, (iii) a loading frequency of 2 Hz at 30 ºC and 6% maximum strain, and (iv) a loading frequency of 0.5 Hz at 40 ºC and 3% maximum strain are compared with the results of fuzzy model. It can be seen that neuro-fuzzy model of NiTi wires successfully reproduce experimental hysteresis loops at each condition.

19
0 1 2 3 4 5
0
100
200
300
400
500
Strain (%)
Stre
ss (M
Pa)
0ºC - 1 Hz
ExperimentalFuzzy Model
0 2 4 6
0
100
200
300
400
500
600
Strain (%)
Stre
ss (M
Pa)
10ºC - 1.5 Hz
ExperimentalFuzzy Model
0 2 4 60
200
400
600
800
Strain (%)
Stre
ss (M
Pa)
30ºC - 2 Hz
ExperimentalFuzzy Model
0 1 2 3 4
0
100
200
300
400
500
600
Strain (%)
Stre
ss (M
Pa)
40ºC - 0.5 Hz
ExperimentalFuzzy Model
Figure 15. Model validation: Hysteresis loops at various conditions for experimental results and ANFIS prediction.
CONCLUSIONS
In order to model temperature- and strain-rate-dependent material behavior of superelastic SMAs, a set of uniaxial tensile tests are conducted on NiTi wires. The tests are performed at various loading frequencies, temperatures and strain amplitudes using an MTS servo-hydraulic load frame. Once experimental data is obtained, a neuro-fuzzy technique is employed to model highly complex behavior of SMAs. Specifically, a fuzzy model with three inputs (strain, strain rate and temperature) and a single output (stress) is created. The initial arbitrary parameters of the fuzzy model are adjusted by ANFIS in order to successfully map given inputs to correct stress value. It is shown that the model can satisfactorily predict strain-stress loops of superelastic SMAs for given loading frequency and temperature. Since the developed model has the ability of simulating material response at dynamic loading rates and at different temperatures, the model can be easily implemented into simulation in order to investigate all potentialities of SMAs for seismic applications. More information on the implementation of the developed model to numerical simulations can be found in Ozbulut and Hurlebaus (2009).
20
ACKNOWLEDGEMENTS
The authors wish to thank SAES Smart Materials for generously providing NiTi wires that are used in this research.
REFERENCES
Andrawes, B. and DesRoches, R. 2005. “Unseating Prevention for Multiple Frame Bridges Using Superelastic Devices,” Smart Materials and Structures, 14:60-67.
Auricchio, F. 2001. “A Robust Integration-Algorithm for a Finite-Strain Shape Memory-Alloy Superelastic Model,” International Journal of Plasticity, 17(7):971-990.
Auricchio, F. and Lubliner, J. 1997. “A Uniaxial Model for Shape-Memory Alloys,” International Journal of Solids and Structures, 34:3601-3618.
Azadi, B., Rajapakse, R.K.N.D. and Maijer, D.M. 2006. “One-dimensional Thermomechanical Model for Dynamic Pseudoelastic Response of Shape Memory Alloys,” Smart Materials and Structures, 15:996-1008.
Boyd, J.G. and Lagoudas, D.C. 1996. “Thermodynamical Constitutive Model for Shape Memory Materials. Part I. The Monolithic Shape Memory Alloy,” International Journal of Plasticity, 12(6): 805–842.
Brinson, L.C. 1993. “One-dimensional Constitutive Behavior of Shape Memory Alloys: Thermomechanical Derivation with Non-Constant Material Functions and Redefined Martensite Internal Variable,” Journal of Intelligent Material Systems and Structures, 4:229–241.
Brinson, L.C., Schmidt, I. and Lammering R. 2004. “Stress-Induced Transformation Behavior of a Polycrystalline NiTi Shape Memory Alloy: Micro and Macromechanical Investigations via in Situ Optical Microscopy,” Journal of the Mechanics and Physics of Solids, 52:1549-1571
Buragohain, M. and Mahanta, C. 2008, “A novel approach for ANFIS modelling based on full factorial design,” Applied Soft Computing, 8(1):609-625.
Chen, W. and Song, B. 2006. “Temperature Dependence of a NiTi Shape Memory Alloy’s Superelastic Behavior at a High Strain Rate,” Journal of Mechanics of Materials and Structures, 1(2):339-356.
Choi, E., Nam, T.H. and Cho, B.S. 2007. “A New Concept of Isolation Bearings for Highway Steel Bridges Using Shape Memory Alloys,” Canadian Journal of Civil Engineering 2007; 32:957-967.
Churchill, C.B., Shaw, J.A. and Iadicola M.A. 2009. “Tips and tricks for characterizing shape memory alloy wire: part 2—fundamental isothermal responses,” Experimental Techniques, 33(1):51-62
Duerig, T.W. and Pelton, A.R. 1994. “Ti-Ni Shape Memory Alloys,” Materials Properties Handbook Titanium Alloys ASM International, Ohio, 1035-1048.
DesRoches, R., McCormick, C. and Delemont, M. 2004. “Cyclic Properties of Superelastic Shape Memory Alloy Wires and Bars,” Journal of Structural Engineering, 130(1), 38-46.
Dolce, M., Cardone, D. and Marnetto, R. 2000. “Implementation and Testing of Passive Control Devices Based on Shape Memory Alloys,” Earthquake Engineering and Structural Dynamics, 29:945-968.
Dolce, M. and Cardone, D. 2001. “Mechanical Behavior of Shape Memory Alloys for Seismic Applications 2. Austenite NiTi Wires Subjected to Tension,” International Journal of Mechanical Sciences, 43:2657-2677.

21
Duerig, T.W., Pelton, A.R.. 1994. “Ti–Ni shape memory alloys”. Materials properties handbook titanium alloys. ASM International. Materials Park, Ohio.
Hurlebaus, S. and Gaul L. 2006. “Smart Structure Dynamics,” Mechanical Systems and Signal Processing, 20:255–281
Jang, J.S.R., Sun, C. and Mizutani, E. 1997. “Neuro-fuzzy and Soft Computing: A Computational Approach to Learning and Machine Intelligence,” Prentice Hall, Upper Saddle River, NJ.
Jang, J.S.R. 1993. “ANFIS: Adaptive-Network-Based Fuzzy Inference System,” IEEE Trans Syst, Man, Cybernet, 23(3):665–85.
Jang, J.S.R. 1996. “Input Selection for ANFIS Learning,” Proceedings of the IEEE International Conference on Fuzzy Systems, 2:1493-1499.
Johnson, R., Padgett, J.E., Maragakis, M.E., DesRoches, R, and Saiidi, M.S. 2008. “Large Scale Testing of Nitinol Shape Memory Alloy Devices for Retrofitting of Bridges,” Smart Materials and Structures, 17:1-10.
Liang, C., Rogers, C. A. 1990. “One-Dimensional Thermo Mechanical Constitutive Relations for Shape Memory Material,” Journal of Intelligent Material Systems and Structures, 1:207–234.
Leo, P.H., Shield, T.W. and Bruno O.P. 1993. “Transient Heat Transfer Effects on the Pseudoelastic Behavior of Shape-Memory Wires,” Acta Metallurgica Materialia, 41:2477–2485.
Levitas, V.I., Idesman, A.V., Stein, E., Spielfeld, J. and Hornbogen, E. 1998. “A Simple Micromechanical Model for Pseudoelastic Behavior of CuZnAl Alloy,” Journal of Intelligent Material Systems and Structures, 5:324-334.
Motahari, S.A. and Ghassemieh, M. 2007. “Multilinear One-dimensional Shape Memory Material Model for Use in Structural Engineering Applications,” Engineering Structures, 29: 904-913.
Muller, I. and Seelecke, S. 2001. “Thermodynamic aspects of shape memory alloys,” Mathematical and Computer Modelling, 34(12-13):1307–1355.
Nguyen, H.T., Nadipuram, R.P., Walker, C.L. and Walker, E.A. 2003. “A First Course in Fuzzy and Neural Control,” Chaoman & Hall/CRC, Boca Raton, FL.
Ozbulut, O.E. and Hurlebaus, S. 2009. “Evaluation of the performance of a sliding-type base isolation system with a NiTi shape memory alloy device considering temperature effects,” Engineering Structures, doi:10.1016/j.engstruct.2009.09.010.
Ozbulut, O. E. and Roschke, P. 2008. “Optimization of Multiple Shape Memory Alloy Devices by a Genetic Algortihm for Seismic Response of a Tall Structure,” Proceedings of the 18th Analysis and Computation Specialty Conference (A&C), Vancouver, BC, Canada, April, 2008
Padgett, J. E. and DesRoches, R. 2008. "Seismic Performance of a Passive Control Technology for Bridges using Shape Memory Alloys," Proceedings of the 18th Analysis and Computation Specialty Conference (A&C), Vancouver, BC, Canada, April, 2008.
Patoor, E., Eberhardt, A. and Berveiller, M. 1998. “Micromechanical Modeling of Shape Memory Alloys Behavior,” Arch. Mech, 40:775–794.
Piedboeuf, M.C., Gauvin, R. and Thomas, M. 1998. “Damping Behavior of Shape Memory Alloys: Strain Amplitude, Frequency, and Temperature Effects,” Journal of Sound and Vibration 1998; 214(5):885-901.
Salich, J., Hou, Z., and Noori, M. 2001. “Vibration Suppression of Structures Using Passive Shape Memory Alloy Energy Dissipation Devices,” Journal of Intelligent Material Systems and Structures, 12:671-680.
Schmidt, I and Lammering R. 2004. “The Damping Behaviour of Superelastic NiTi Components,” Materials Science and Engineering A, 378:70-75.
Shook, D.A., Roschke, P.N. and Ozbulut O.E. 2008. “Superelastic Semi-Active Damping of a Base-Isolated Structure,” Structural Control and Health Monitoring, 15:746-768.

22
Takagi, T., and Sugeno, M. 1983. “Derivation of fuzzy control rules from human operator’s control actions,” Proc. of the IFAC Symp. on Fuzzy Information, Knowledge Representation and Decision Analysis, 55-60.
Torra, V., Isalgue, A., Martorell, F., Terriault, P. and Lovey, F.C. 2007. “Built in Dampers for Family Homes via SMA: An ANSYS Computation Scheme Based on Mesoscopic and Microscopic Experimental Analyses,” Engineering Structures, 29(8):1889-1902.
Tobushi, H., Shimeno, Y., Hachisuka, T. and Tanaka, K. 1998. “Influence of Strain Rate on Superelastic Properties of TiNi Shape Memory Alloy,” Mechanics of Materials, 30(2):141-150.
Zhang, Y. and Zhu, S. 2007. “A Shape Memory Alloy-based Reusable Hysteretic Damper for Seismic Hazard Mitigation,” Smart Materials and Structures, 16:1603-1613.
Wilde, K., Gardoni, P., Fujino, Y. 2000. “Base Isolation System with Shape Memory Alloy Device for Elevated Highway Bridges,” Engineering Structures, 22:222-229.
Wolons, D., Gandhi, F. and Malovrah, B. 1998. “Experimental Investigation of the Pseudoelastic Hysteresis Damping Characteristics of Shape Memory Alloy Wires,” Journal of Intelligent Material Systems and Structures, 9:116-126.
Wu, K., Yang, F., Pu, Z. and Shi, J. 1996. “The Effect of Strain Rate on Detwinning and Superelastic Behavior of Niti Shape Memory Alloys,” Journal of Intelligent Material Systems and Structures, 7:138-144.


![Investigation on Crack Tip Transformation in NiTi Alloys ... · transformation zone by numerical studies [21–26] which are mainly based on phenomenological approaches and on theory](https://static.fdocuments.net/doc/165x107/5f2ad1ca8bb490554b704428/investigation-on-crack-tip-transformation-in-niti-alloys-transformation-zone.jpg)