Neural Network Based Classification and Diagnosis of Brain Hemorrhages
19
K.V.Ramana M.Tech & Raghu.B.Korrapati Ph.D International Journal of Artificial Intelligence and Expert Systems (IJAE), Volume (1): Issue (2) 7 Neural Network Based Classification and Diagnosis of Brain Hemorrhages K.V.Ramana M.Tech [email protected] Associate Professor/ CSE Department Jawaharlal Nehru Technological University Kakinada,533003,India. Raghu.B.Korrapati Ph.D [email protected] Commissioner on Higher Education, South Carolina,29055,USA. Abstract The classification and diagnosis of brain hemorrhages has work out into a great importance diligence in early detection of hemorrhages which reduce the death rates. The purpose of this research was to detect brain hemorrhages and classify them and provide the patient with correct diagnosis. A possible solution to this social problem is to utilize predictive techniques such as sparse component analysis, artificial neural networks to develop a method for detection and classification. In this study we considered a perceptron based feed forward neural network for early detection of hemorrhages. This paper attempts to spot on consider and talk about Computer Aided Diagnosis (CAD) that chiefly necessitated in clinical diagnosis without human act. This paper introduces a Region Severance Algorithm (RSA) for detection and location of hemorrhages and an algorithm for finding threshold band. In this paper different data sets (CT images) are taken from various machines and the results obtained by applying our algorithm and those results were compared with domain expert. Further researches were challenged to originate different models in study of hemorrhages caused by hyper tension or by existing tumor in the brain. Keywords: Brain hemorrhages, CAD system, Region Severance Algorithm. 1. INTRODUCTION Image processing and analysis is a prevalently used technological tool for the medical investigations and their diagnostics. Image processing[1] and followed by its scrutiny is a very important step in developing tools as medical probes and diagnostics. In summary, image processing process comprises of important set of sequential phases that entail the regime of medical diagnostics. As such, it leads to improve the accuracy of the diagnosis and accurate fixation configuration for surgical operations. Medical diagnosis is one of the most important areas [2] in which image processing procedures are fruitfully applied. Brain Hemorrhage is a condition caused due to a sudden stroke to a person after blood leaks out from the blood vessels in the brain. This situation occurs due to the breakage in the wall of blood vessel. The blood spills out of the blood vessel and enters the area, where vital tissues and cells
-
Upload
waqas-tariq -
Category
Education
-
view
138 -
download
1
Transcript of Neural Network Based Classification and Diagnosis of Brain Hemorrhages

K.V.Ramana M.Tech & Raghu.B.Korrapati Ph.D
International Journal of Artificial Intelligence and Expert Systems (IJAE), Volume (1): Issue (2) 7
Neural Network Based Classification and Diagnosis of Brain Hemorrhages
K.V.Ramana M.Tech [email protected] Associate Professor/ CSE Department Jawaharlal Nehru Technological University Kakinada,533003,India.
Raghu.B.Korrapati Ph.D [email protected] Commissioner on Higher Education, South Carolina,29055,USA.
Abstract The classification and diagnosis of brain hemorrhages has work out into a great importance diligence in early detection of hemorrhages which reduce the death rates. The purpose of this research was to detect brain hemorrhages and classify them and provide the patient with correct diagnosis. A possible solution to this social problem is to utilize predictive techniques such as sparse component analysis, artificial neural networks to develop a method for detection and classification. In this study we considered a perceptron based feed forward neural network for early detection of hemorrhages. This paper attempts to spot on consider and talk about Computer Aided Diagnosis (CAD) that chiefly necessitated in clinical diagnosis without human act. This paper introduces a Region Severance Algorithm (RSA) for detection and location of hemorrhages and an algorithm for finding threshold band. In this paper different data sets (CT images) are taken from various machines and the results obtained by applying our algorithm and those results were compared with domain expert. Further researches were challenged to originate different models in study of hemorrhages caused by hyper tension or by existing tumor in the brain.
Keywords: Brain hemorrhages, CAD system, Region Severance Algorithm.
1. INTRODUCTION Image processing and analysis is a prevalently used technological tool for the medical investigations and their diagnostics. Image processing[1] and followed by its scrutiny is a very important step in developing tools as medical probes and diagnostics. In summary, image processing process comprises of important set of sequential phases that entail the regime of medical diagnostics. As such, it leads to improve the accuracy of the diagnosis and accurate fixation configuration for surgical operations. Medical diagnosis is one of the most important areas [2] in which image processing procedures are fruitfully applied.
Brain Hemorrhage is a condition caused due to a sudden stroke to a person after blood leaks out from the blood vessels in the brain. This situation occurs due to the breakage in the wall of blood vessel. The blood spills out of the blood vessel and enters the area, where vital tissues and cells

K.V.Ramana M.Tech & Raghu.B.Korrapati Ph.D
International Journal of Artificial Intelligence and Expert Systems (IJAE), Volume (1): Issue (2) 8
of brain reside. Blood spills over Brain tissues those tissues and cells; this in turn causes the patient to become seriously ill and needs immediate medication/treatment. There are mainly four types of Brain Hemorrhages. They are Epi-dural Hemorrhages (EDH), Sub-dural Hemorrhages (SDH), Intra-cerebral Hemorrhages (ICH), and Intra-ventricular Hemorrhages (IVH). Epi-dural Hemorrhage, involves bleeding between the skull and the Dura matter, and it is most commonly related to traffic accidents, and much frequently encountered than SDH. A subdural hemorrhage(SDH) is caused [3] by bleeding, that takes place due to the rupture of one or more of the blood vessels (typically veins) that travel in the subdural space, located between the surface of the brain and the a thin layer of tissue that separates the brain from the skull. The main cause of Intracerebral Hemorrhage is Hypertension.
Computed Tomography (CT) is a non invasive technique to give [5] CT images of each part of the human being body. CT scans use the radiation as X-rays which is detected by a series of sensors that feed [4] information into a powerful computer. Because of the sensitivity of the sensors and the computer reconstruction, a CT scan can show the actual structure of the brain, blood vessels, and other tissues within skull. CT is the most preferable imaging system since it can work over unconscious patients in the emergency room [6]. Because of the unstable vital signs, Magnetic resonance imaging (MRI) is not possible in majority of unconscious patients.
The CT scan of a brain image contains little information which requires more computations in retrieving the region of interest. CT images are digital images, in which each pixel is expressed by its corresponding gray value. The background region of a CT Brain image has a very low gray value, for X-ray hasn’t been absorbed in this part. Thus, the boundary of object can be identified [7] in CT brain images usually based on the change of gray value. Images collected from multiple configurations (angles) are posed to systematic analysis. Information from these images is used to detect the abnormalities. Detection and diagnosis of Brain Hemorrhages is one of the emerging fields of technologies in the row of efficient strategies through which a classified computer based system is designed.
A detection system which is anticipated to be effective in increasing patients life span used over a large number of patients who would be likely to have hemorrhage (ie., approximately one lakh patients suffer from hemorrhages annually and two- third of them are successfully diagnosed and the rest one third are not diagnosed) would be of significant influence in the field of Medical Diagnostic Automated. The procedure that is usually adopted over the globe for the analysis of images is bound to involve high risk of biased variants, which independently depend on the experience and skill of the Domain Expert. A Domain Expert (e.g., a medical practitioner) is one who is having widespread, accessible knowledge that is pre-arranged for its utility in practice, and is turned to the certain particular problems in hand. For example, at the time of solving regular cases, the specialist physician known as Expert physician makes use [8] of instant non-analytic responses. Non-analytic reasoning refers to a specific procedure, where one considers as whole (such as a medical case), rather than thinking about each characteristic of problem. As diagnostic errors are common in daily clinical practice, some of the errors can mislead the Domain Experts, which result in false-planning of treatment. This indirectly can affect the patient’s survival.
Diagnostic errors account for a substantial portion of all medical errors, and strategy for their avoidance [9] have been explored. Hence, an effort is needed to minimize this kind of errors and prevent them. To ease out the Domain Experts to for their arriving at a more objective oriented decision regarding diagnosis, efforts are a foot to develop [10] computer-based systems. The objective of this research is to develop a CAD system that identifies Different types of Hemorrhages and classify them to help in the management of patients suffering from head injury or acute neurological disturbance in an emergency. In emergent conditions, expert radiologists may not be readily available to provide the required crucial image interpretation. Therefore, it is the duty of the clinicians to interpret the information from the images. If the clinician is not best suited for the task, then false treatment planning may take place. It is therefore believed that CAD may become useful in these situations.
K.V.Ramana M.Tech & Raghu.B.Korrapati Ph.D
International Journal of Artificial Intelligence and Expert Systems (IJAE), Volume (1): Issue (2) 9
2. METHODOLOGY
2.1. CAD system The CAD system is much helpful for diagnosis and treatment. It is important to reduce [11] the expert’s workload. With the use of CAD system by radiologist’s for digital medical imaging, the demand for well-organized medical imaging data storage and retrieval techniques has increased [12]. Data tests and clinical practices exhibit [11] that the database is very useful for this Computer-aided diagnosis system (CAD) system. The typical structural design of a CAD system comprises four main modules for image pre-processing, description of regions of interest (ROI), mining and selection [13] of features and classification of the preferred ROI. With the introduction of computer-aided diagnosis system (CAD) the work load of radiologists has been drastically reduced. The conventional approach is to partition an image into a set of regions and to distinguish the image by a combination of the attributes of its regions. [11], with the use of Computer-aided diagnosis system (CAD) by radiologists for digital medical imaging, the demand for well-organized medical Imaging data storage and retrieval [12] techniques has improved.
2.2 Procedure
The present computer based Brain Hemorrhage Diagnostic Tool is built upon a fundamental aspect of ‘Automation’ in medical diagnostic activity research. A possible consensus reached between the medical diagnostic experts researchers working in the fields of medical diagnosis and the computer professionals, the drive is bound to evolve an automated, time saving economical method of hemorrhage diagnosis , which is free from any risk, further, the process represents a non-invasive diagnostic tool for the detection of brain Hemorrhage. During the processing of automation of CT scan, several procedures are adopted on the essential image, viz., the skull removal, gray matter removal, horns detection, hemorrhage detection etc. Images, the whole gamut of heuristic divisions are divided such that hemorrhage can be easily determined whether hemorrhage occurred and if so, how to locate it. This feature of localization of hemorrhage consists one of the important features which are given as input component of information to the ‘perception’ process. An overview of the proposed PC based automated Brain Hemorrhage Diagnostic method presented in block diagram shown in figure 1 gives how the classification of image can be done. According to the figure 1 a set of images are taken and in that vital and outmoded are separated. The vital images are considered and location and shape of hemorrhage is identified, with the shape of hemorrhage we define the type of hemorrhages which was discussed in third phase. The entire Methodology is divided into three phases.
2.2.1 Phase1: Fixing the number of required images
The first phase is image processing which directs to abstract characteristics from the normal or atypical structure. The intention of pre-processing is to mend the eminence of the information through the application of methods which can suppress the noise, and modulate the edges of image structures and distinction. Detection and diagnosis of Brain Hemorrhages, is one of the emerging fields of technologies involving complex strategies through which a classified computer based system is designed. Images collected from multiple configurations are passed to systematic analysis. Information from these images is used to detect the abnormalities.

K.V.Ramana M.Tech & Raghu.B.Korrapati Ph.D
International Journal of Artificial Intelligence and Expert Systems (IJAE), Volume (1): Issue (2) 10
Figure1. Block diagram showing to classify the images.
2.2.2 Phase2: Abnormality Identification
The second phase is the excavation of the medical images characteristics, in other terms; the step is also the functioning of the quantization of image characteristics. The objective of this step is to quantize the characteristics that have snatched by computer in the first step. Once the features have been drawn out, selection of a split of the toughest feature is crucial, directing at improving classification precision and reducing the whole complexity. The analysis of the indication, such as the volume, compactness or shape of the pathological alters regions, is the most value demonstration in iconography for the doctor conclusions that they have made. A region severance algorithm is introduced here to detect and locate the hemorrhage.
K.V.Ramana M.Tech & Raghu.B.Korrapati Ph.D
International Journal of Artificial Intelligence and Expert Systems (IJAE), Volume (1): Issue (2) 11
Region Severance Algorithm (RSA): Let be input image matrix of m n size. Let be an estimated image matrix of p q dimensions Assuming that for all Where T is the threshold value and i ranges from 1 to m and j ranges from 1 to n Source images usually have multi-modal [14] distributions, which are difficult to model for diagnosis. However, the consistency of the estimator, can be obtained using threshold value T as
Upon repeated (iterative) application of the above steps, unwanted Regions can be eliminated from the resultant image Z. Apply the techniques like Filtering and masking helps to remove Noise from the image. Infact unwanted noise, which can cause difficulty in processing.
Noise over Image will be eliminated [15] by applying any one of the various filtering techniques such as Median filtering, Order-Statistic Filter, Mode Filtering. After applying these techniques the resultant image reveals the existence of abnormalities. The features which are required for classify the hemorrhage can be extracted.
The main goal of this phase is to identify the hemorrhage which is present in the encephalic region. Region Severance Algorithm (RSA) is applied on the images which are obtained from the first phase of the automation process. In this phase, the threshold band is taken as a parameter for the detection of hemorrhage. Application of Region Severance Algorithm on Brain CT image:
The CT image consists of regions like skull, gray matter, white matter and abnormal regions like blood clots, accumulated solvents, fats etc. But our main focused is on encephalic region which lies inside the skull. In order to get the encephalic region, skull portion should be excluded [16]. Therefore, our first step is to isolate Skull region from encephalic region in the image. Elimination of skull region from the image: The skull is in white color, whose threshold is of maximum in a gray scale map. Hence, we simply treat those pixels with maximum intensity as the skull. The interior region refers to the brain content inside the skull. The process of boundary detection is carried out to eliminate the skull region. Consequently, that the Boundary contains points with maximum intensity, which belongs to the skull. Note that there are two other regions that are also in white color. These two regions belong to the hard machine surfaces of CT scan device. Remove grey matter: Most of the content inside the skull is gray matter [17]. The hemorrhage part of grey matter should be separated. The resultant image contains horns and the hemorrhage part. If the

K.V.Ramana M.Tech & Raghu.B.Korrapati Ph.D
International Journal of Artificial Intelligence and Expert Systems (IJAE), Volume (1): Issue (2) 12
pixel intensity lies between grey level threshold values, then it is considered as the pixel which is present in grey matter. We extract all those pixels whose grey level falls in that range. Detection of Hemorrhage: From the intermediate image, which is obtained from the previous step, hemorrhage can be detected. A Specific threshold is taken for the hemorrhage region. If the pixel intensity in the image lies between the identified gray level threshold bands, then it is considered as the pixel which belongs to hemorrhage region. We extract all the pixels which are present in that range and group them, which form the hemorrhage region.Therefore, upon the application of Region Severance Algorithm on CT image, a group of images which pertain to the abnormal region (as the hemorrhage affected part) is accessed. Detecting Horns: In order to find the location of hemorrhage, identification of horns is important. Therefore there is a great need for the detection of horns. Specific threshold band is considered for the design of horn pixel. If the pixel intensity in the image lies between these grey level threshold bands, then it is considered as the pixel which belongs to the horns. We extract all the pixels which are present in that range and place the pixels in to the intermediate image. Location of the hemorrhage: The image which is obtained after the application of Region Severance Algorithm is divided into four equal parts. The relative density of the hemorrhage region in each part is compare with the other parts of the hemorrhage region. The part with maximum relative density value specifies the exact location of the hemorrhage. 2.2.3 Algorithm to find the Threshold band A sample of ‘n’ images is taken from each machine.(‘n’ varies in the case of finding the band for Hemorrhage, water content, fat content).In our case, n= 15 for finding the water content, n=6 for finding the fat content. n= ~40 for finding the Hemorrhage Threshold,
1. The desired region is separated manually using MATLABROI.
2. Hemorrhage region is subtracted from the separated image. To subtract the hemorrhage region, we change the hemorrhage pixels to zero. (This step is carried out only in the case of finding the threshold band for water and fat contents around the hemorrhage but not strictly for finding the threshold range for hemorrhage region).
3. For the resultant image, minimum and maximum values of the pixel intensity in the image
are found. Let the values be Zmin and Zmax.
4. These values are tabulated in a separate table.
5. Mean value for Zmin and Zmax is found which is treated as threshold range.
Zfmin = (∑Zmin)/n Zfmax = (∑Zmax)/n
Where ‘n’ is the number of samples. Therefore, Threshold band = (Zfmin, Zfmax); Using this Threshold band we extract the desired region.

K.V.Ramana M.Tech & Raghu.B.Korrapati Ph.D
International Journal of Artificial Intelligence and Expert Systems (IJAE), Volume (1): Issue (2) 13
The same procedure is applied for finding the Threshold band for Hemorrhage, water content and fat content. Find water content and fat content around hemorrhage: Water and fat contents are separated using Threshold band which is taken from the table. It is known that Water and fat content is present around the hemorrhage. Water region can be taken as the region which is dark in color around the hemorrhage and the fat region is the region which is very dark in color. To procedure to extract water and fat content is given in the above algorithm. Therefore the resultant images are the images which are left with water and fat content. Shape of the Hemorrhage affected region: A hierarchy of steps involved to determine the shape of the hemorrhage. 1) Reading the Input Image. 2) Converting the image to grayscale (if necessary). Input image can be an RGB image also. If the image is RGB image, it has to be converted to gray scale for performing necessary operations. 3) Edge detection techniques are applied on the image which is finally converted to Gray scale. Commonly used edge detection techniques are Canny Edge Detection, Sobel Edge Detection and Prewitt Edge Detection etc. The output of this method is a binary image, which is a matrix constituted elements of Boolean values. If a pixel value is 1 it signifies an edge. The most general method used is the Canny Edge Detection. The Canny method uses two thresholds to detect strong and weak edges. It includes the weak edges in the output, only if they are connected to strong edges. As a result, the method is more robust to noise predominantly it is likely to detect true weak edges. 4) The Connected components from a binary image that have fewer than N pixels are removed to produce another binary image N, which can be any integral value (for our method N=30). 5) Further, the background of the image is filled with holes as per the necessity. A hole is a set of background pixels that cannot be reached by filling in the background from the edge of the image. 6) Labeling is carried over the connected components in the Binary image. The output of this step produces a matrix, which is of same size as input Binary Image. But it contains the labels for the connected objects in Input Image. Several automated operations can be done on the output of the image. 7) Several properties of regions such as Volume, Centroid, Area, Convex Area, and Eccentricity etc. are measured for finding the shape of the hemorrhage. The information regarding the properties we need properties like cancroids, Area, Perimeter would be useful. 8) The Total size of the cancroids and the boundaries of the pertinent regions are calculated. 9) The minimum and maximum values are evaluated using the following formula.
10) The required value is estimated from the formula given by.
conc=

K.V.Ramana M.Tech & Raghu.B.Korrapati Ph.D
International Journal of Artificial Intelligence and Expert Systems (IJAE), Volume (1): Issue (2) 14
11) If the value obtained in the previous step lies between 1.05 and 0.95 then we consider that the shape is convex. If the value obtained in the previous step lies between 0.5 and 0.25 then we consider that shape is convex. 2.3.4 Phase3 Classification of brain hemorrhages The final step in the diagnosis process is to classify the hemorrhage with the help of a neural network, whose inputs are location and shape. The values of the inputs to the neural network are obtained from the above steps.
. If the shape of the hemorrhage is concave and the location of the hemorrhage is near to
skull (Fronto parietal region or perieto occipital region) then the hemorrhage is Sub-Dural hemorrhage.
If the shape of the hemorrhage is convex or bi-convex and the location of the
hemorrhage is near to skull (parietal region) then the hemorrhage is Epi-Dural hemorrhage. If the shape of the hemorrhage is irregular and the location of the hemorrhage is on the
ventricles then the hemorrhage is Intra-Ventricular hemorrhage . If the shape of the hemorrhage is homogeneous (not mandatory) and the location of the
hemorrhage is in parietal region or in occipital region or temporal or frontal region then the hemorrhage is Intra-Cranial hemorrhage.
If the shape of the hemorrhage is concave and the hemorrhage is present in the frontal
and parietal regions then the hemorrhage is Sub-Arachanoid hemorrhage.
We take pixel intensity as the main supporting evidence for the diagnosis process. As image is represented by matrix consisting different values which represent pixel intensities. Therefore, considering pixel intensity as the main supporting evidence generates exact results.
It is known that CT was slightly better for showing [18] hemorrhagic components; documenting 77% of hemorrhages compared with 71% for MR. The appearance of the contusions on MR were variable, depending on the T1- and T2-weighting of the images and the constituents of the contusions, such as edema, hemorrhage, and encephalemalacia. CT is very effective for evaluating acute head trauma, but MR is recommended for documenting brain contusions during the sub acute and chronic stages of head injuries. CT has remained the primary imaging method in acute head trauma because of its sensitivity in detecting acute intracranial hemorrhage and its rapid scanning capability. MR has not made much impact in this area primarily for three reasons: first, acute hemorrhage may be iso intense and difficult to see on the MR images; second, these patients require various support equipment, much of which cannot be taken into the magnet room; and third, MR imaging requires more time, and time is a critical factor in patients with intracranial hemorrhage. CT overcomes all these problems over MRI Therefore CT are used extensively. Domain-Expert Diagnosis:
Normal Brain: (Inferences obtained from the slices starting from the base skull to hyperital cortex).
I. The Size, Shape and position of the ventricular system are within normal limit. II. Sulsi, Sylvian fissures and basal systems are normal. III. Subarachnoid areas are normal. IV. No evidence of midline shift. V. No-evidence of intracranial-extra cranial fluid collections.(Collections can be blood or
anything). VI. Cellar and Para-cellar regions are normal.
VII. Bony structures shows normal.

K.V.Ramana M.Tech & Raghu.B.Korrapati Ph.D
International Journal of Artificial Intelligence and Expert Systems (IJAE), Volume (1): Issue (2) 15
VIII. No Evidence of Bony injury.
For Hemorrhagic CT image:
I. Examination of midline shift in CT image. II. Examination of Sulsi, Sylvian fissures, basal systems. III. Examination for the fractures in the bony window. IV. Examination of subarachnoid areas.
RESULTS AND DISCUSSIONS All the outputs which are generated are for the images which are taken for SIEMENS -SPEED PRO MACHINE.
Figure 2: Training graph
Above figure shows a training graph shows the resultant graph drawn out of the training process of the perceptron. It is noticed that graph is drawn for 100 epochs and the performance is 0.0215
Figure 3: Essential and Non Essential Images.
The above figure shows that the classifier has successfully separated the images into two separate groups’ namely ‘VITAL’ and ‘OUTMODED’ images.
K.V.Ramana M.Tech & Raghu.B.Korrapati Ph.D
International Journal of Artificial Intelligence and Expert Systems (IJAE), Volume (1): Issue (2) 16
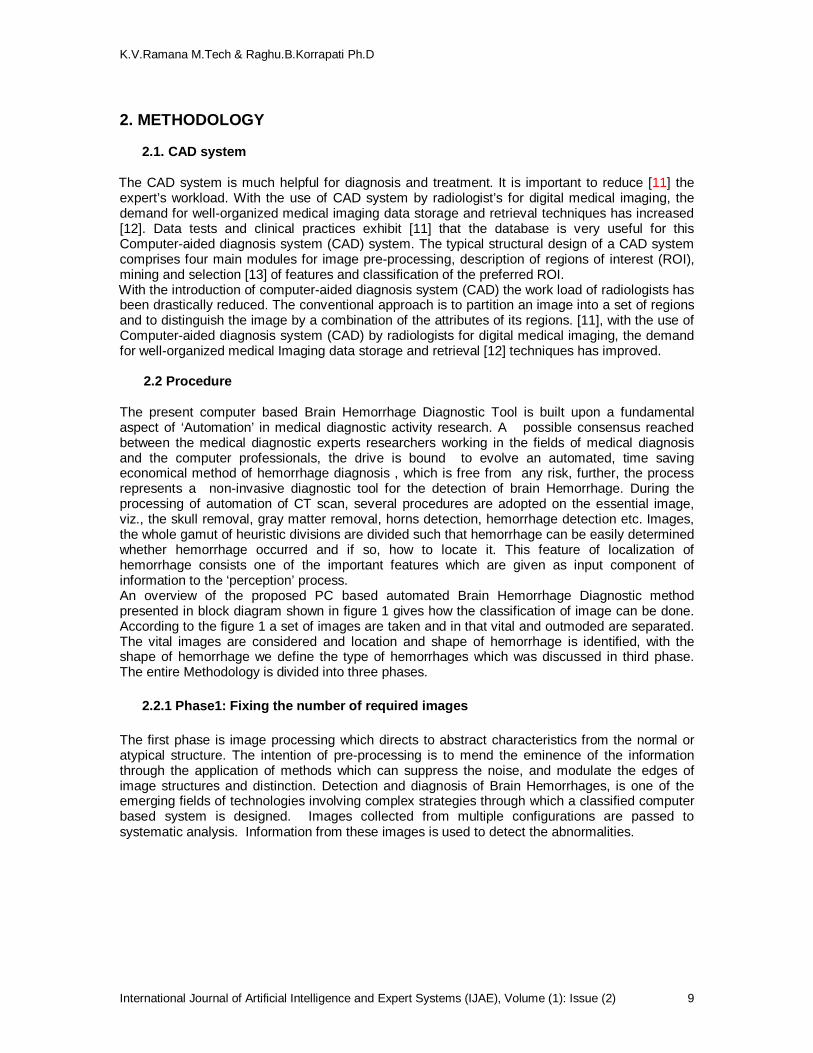
Phase 2: In the second phase, the VITAL images are exported for further analysis. Since, the CT image consists of regions like skull, gray matter, white matter, abnormal region like blood clots, hemorrhages etc. From these regions, unwanted regions like skull region, gray matter region should be separated since our region of interest is Hemorrhage region. Figure 4: Patient image
Figure: 4.shows the input image which contain regions like skull, gray matter, abnormal regions
like hemorrhage.
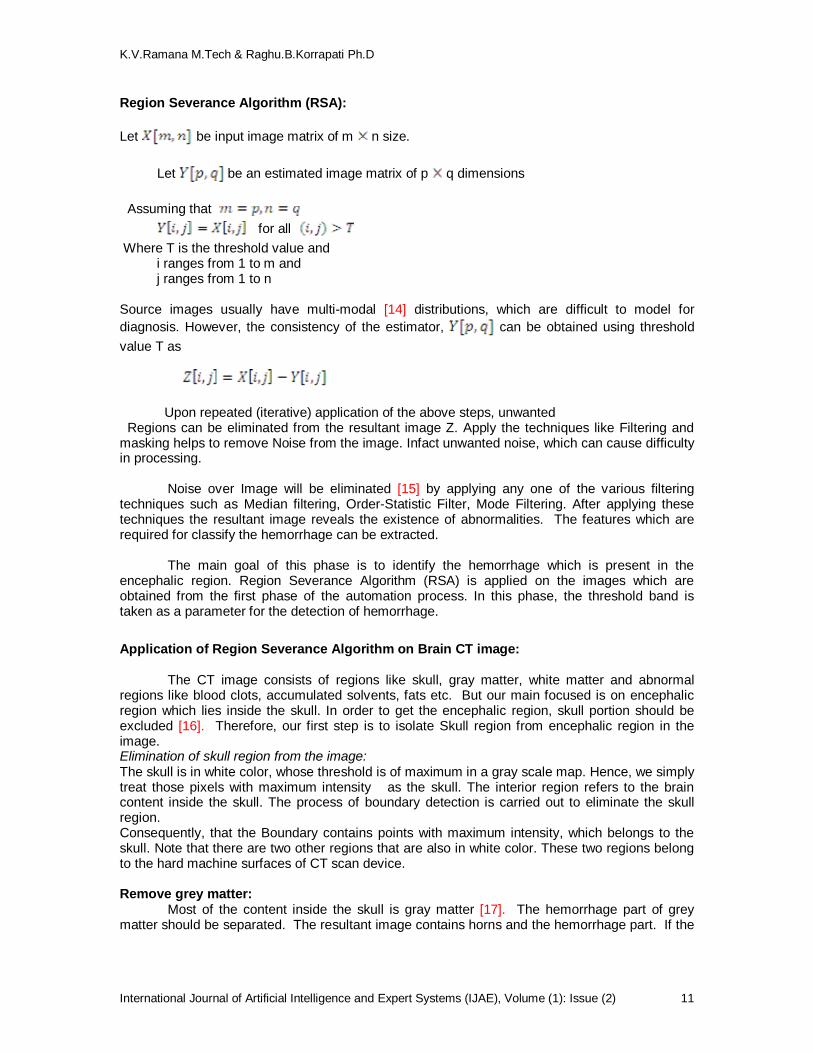
Figure 5: Skull removed image
The above figure shows the resultant image which is obtained after the execution of first step in second phase which is skull removing process.
K.V.Ramana M.Tech & Raghu.B.Korrapati Ph.D
International Journal of Artificial Intelligence and Expert Systems (IJAE), Volume (1): Issue (2) 17
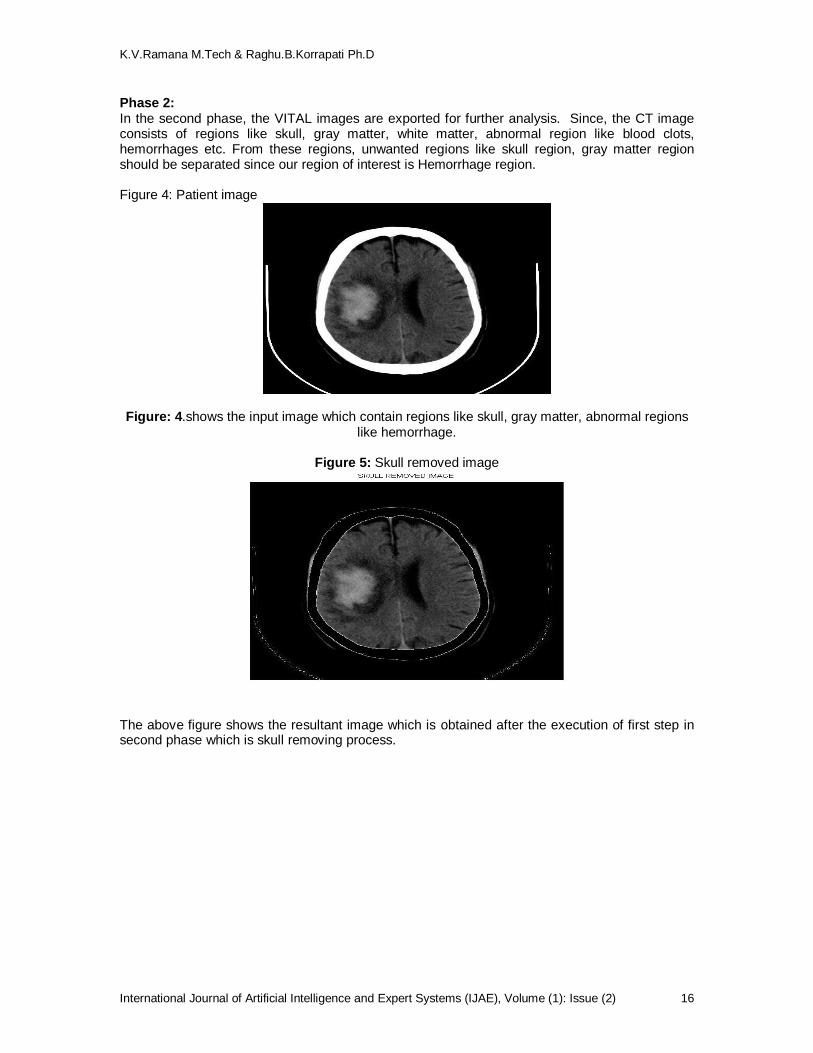
Figure 6: Grey matter removed image
The above window shows the resultant window after removal of gray matter.
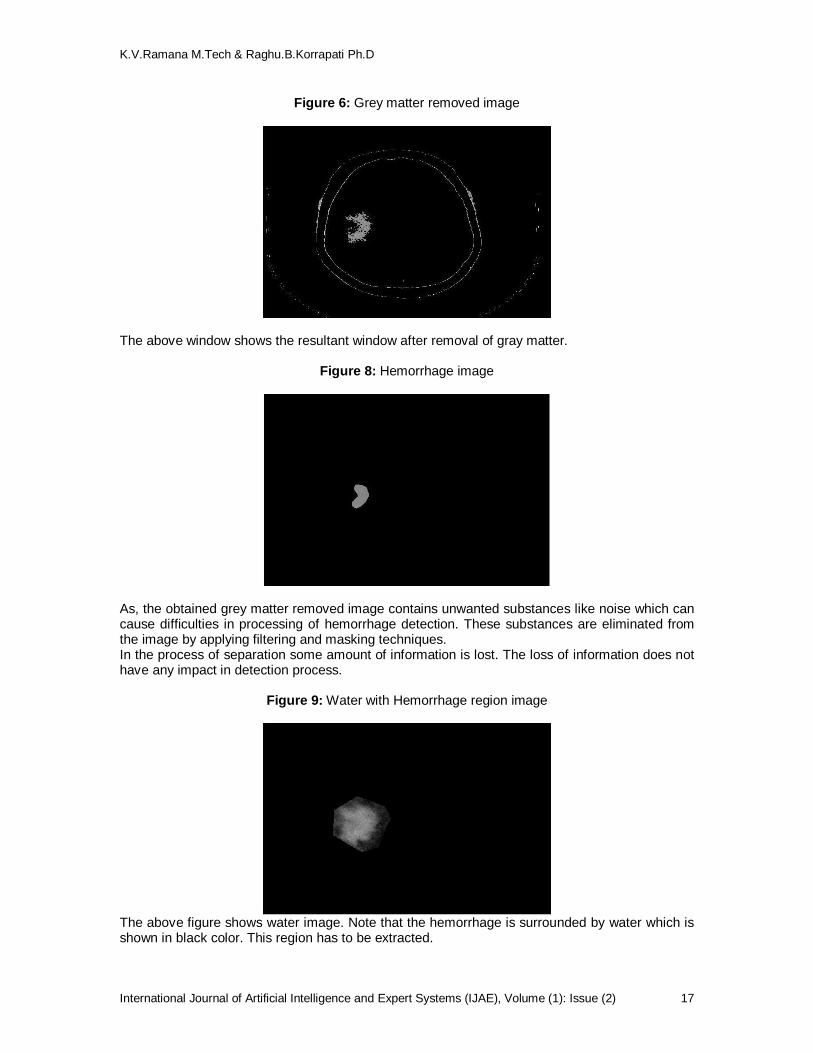
Figure 8: Hemorrhage image
As, the obtained grey matter removed image contains unwanted substances like noise which can cause difficulties in processing of hemorrhage detection. These substances are eliminated from the image by applying filtering and masking techniques. In the process of separation some amount of information is lost. The loss of information does not have any impact in detection process.
Figure 9: Water with Hemorrhage region image
The above figure shows water image. Note that the hemorrhage is surrounded by water which is shown in black color. This region has to be extracted.

K.V.Ramana M.Tech & Raghu.B.Korrapati Ph.D
International Journal of Artificial Intelligence and Expert Systems (IJAE), Volume (1): Issue (2) 18
Figure 10: Water image
The above figure shows the water region which is extracted from the image which is obtained from the previous step. Note that this is the region which is around hemorrhage region. Figure 11: Hemorrhage with horns
The above figure shows the location of the horns along with hemorrhage. Hemorrhage can be located at any one of the lobes [areas] Frontal Lobe, Occipital Lobe, parietal lobe, Temporal Lobe. Detection of horns is mandatory for finding the Location of hemorrhage. Figure 12: segmented image
The above figure shows division of image into four equal parts which is useful for finding the location of hemorrhage. Please note that horns are located in each and every part.

K.V.Ramana M.Tech & Raghu.B.Korrapati Ph.D
International Journal of Artificial Intelligence and Expert Systems (IJAE), Volume (1): Issue (2) 19
Figure 13: Shape of hemorrhage
The above figure shows that shape of the hemorrhage and clearly displays that shape is concave. Phase 3: Finally, based on location and shape, hemorrhage is classified into different type with the help of Artificial Neural Network. OUTPUTS FOR IVH:
Figure 14: IVH IMAGE
The above figure shows the input image which is representing Intra Ventricular Hemorrhage
FIGURE 15: Output after extracting the hemorrhage.
The above figure shows the output after extracting the hemorrhage.

K.V.Ramana M.Tech & Raghu.B.Korrapati Ph.D
International Journal of Artificial Intelligence and Expert Systems (IJAE), Volume (1): Issue (2) 20
OUTPUT FOR EDH: Figure 16: EDH IMAGE
The above figure shows the input image which is representing Epi-Dural Hemorrhage
Figure 17: After removing skull and gray matter.
The above figure shows the skull removed image for Epi-Dural Hemorrhage.
FIGURE 18: Output after extracting the hemorrhage
The above figure shows the output after extracting the hemorrhage.
K.V.Ramana M.Tech & Raghu.B.Korrapati Ph.D
International Journal of Artificial Intelligence and Expert Systems (IJAE), Volume (1): Issue (2) 21
OUTPUTS FOR SDH:
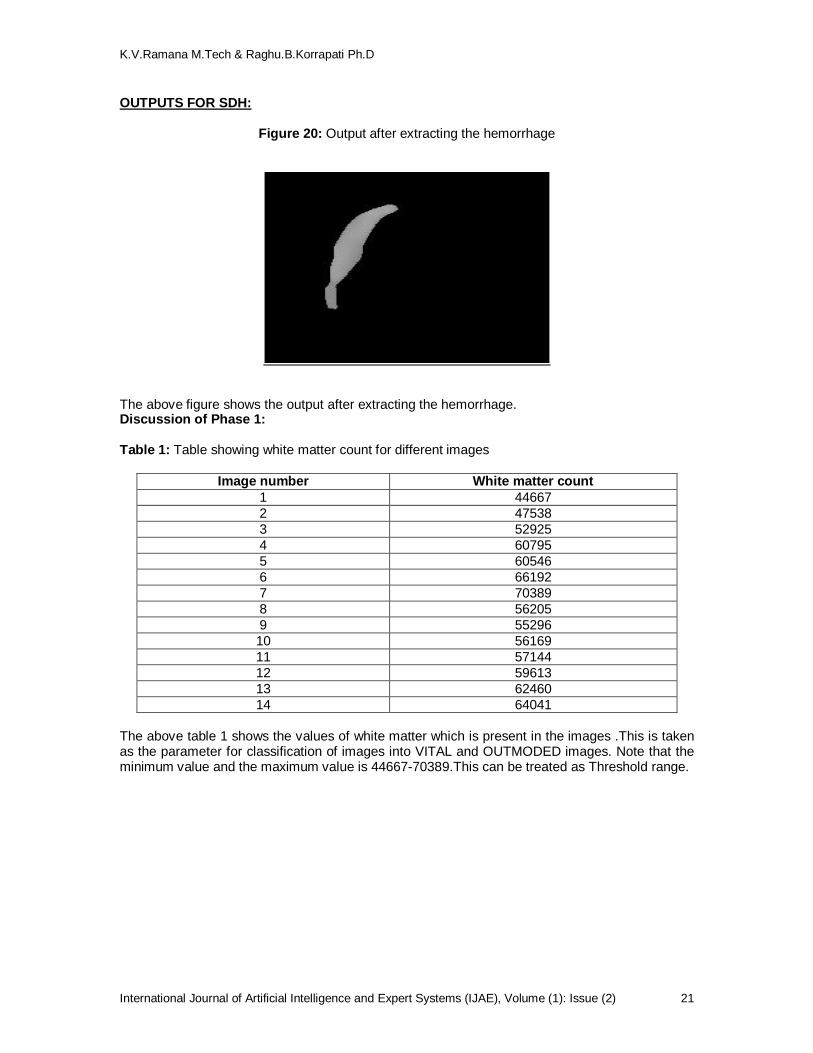
Figure 20: Output after extracting the hemorrhage
The above figure shows the output after extracting the hemorrhage. Discussion of Phase 1:
Table 1: Table showing white matter count for different images
Image number White matter count 1 44667 2 47538 3 52925 4 60795 5 60546 6 66192 7 70389 8 56205 9 55296 10 56169 11 57144 12 59613 13 62460 14 64041
The above table 1 shows the values of white matter which is present in the images .This is taken as the parameter for classification of images into VITAL and OUTMODED images. Note that the minimum value and the maximum value is 44667-70389.This can be treated as Threshold range.

K.V.Ramana M.Tech & Raghu.B.Korrapati Ph.D
International Journal of Artificial Intelligence and Expert Systems (IJAE), Volume (1): Issue (2) 22
Table 2: Table for evaluating white matter threshold band for different ranges
Extracted threshold value Observed Threshold band
Min Max Extracted images
1000 5000 - - - 5000 10000 - - - 10000 20000 - - - 20000 40000 - - - 40000 50000 44667 - - 43500 70500 44667 70443 90 44000 71000 44667 70443 90 44500 71500 44667 71244 92 45000 72000 44667 70443 90 45500 72500 44667 44667 90
The above table 2 shows the exact number of images that are present in the specific range. The minimum and maximum values of the white matter which are present in the taken specific range are also displayed. This table is used for obtaining the exact Threshold band for the white matter. DISCUSSION OF PHASE 2 Table 4: Patient wise details which are classified by domain experts:
Patient Number Total number of Images
Vital Images Out Moded Images
1 17 9 8 2 19 13 5 3 20 9 11 4 14 10 4 5 18 11 7 6 24 13 11 7 18 12 6 8 13 8 5 9 11 8 3 10 18 11 7 11 19 11 8 12 18 11 7 13 13 8 5 14 13 4 9 15 14 9 5 16 22 10 12 17 21 9 11 18 22 12 10 19 12 4 8 20 21 9 11
The above table 4 shows the number of vital images and outmoded images of each patient of a single machine.

K.V.Ramana M.Tech & Raghu.B.Korrapati Ph.D
International Journal of Artificial Intelligence and Expert Systems (IJAE), Volume (1): Issue (2) 23
Table 5: Table for validating threshold band water content
Image number Minimum Value Maximum Value Average threshold value
1 8 49 29 3 16 55 36 5 1 37 19 6 2 50 26 7 15 91 53
17 7 73 40 18 1 71 36 33 17 44 31 47 8 57 33 48 1 75 38
The above table 5 shows the minimum and maximum values of water content around hemorrhage for different patients. Average threshold is calculated from both minimum and maximum values. The lowest value and highest value gives the threshold band for hemorrhage which is 19 to 40 in our case. Table 6: Efficiency calculation
The above table shows that a total of a specific set of images of different sizes such as 25, 52, 78, 92 are taken as training dataset size. For each training data set size, values of fields such as VITAL, OUTMODED images are found and tabulated. The table also shows the values of efficiency which is calculated from the number of VITAL Images and the number of domain expert identified images which are suggested by the domain expert.
Figure 21: Efficiency of neural network for different data set sizes
The above graph shows the values of efficiency which is calculated from the number of extracted
Classification by our classifier
Efficiency (In %)
Training data set
size Vital Outmoded 25 22 3 88.00 52 47 4 90.03 78 71 6 91.02 92 83 9 90.22

K.V.Ramana M.Tech & Raghu.B.Korrapati Ph.D
International Journal of Artificial Intelligence and Expert Systems (IJAE), Volume (1): Issue (2) 24
images and the number of domain expert identified images (which are suggested by the domain experts).From the graph, in a set of 25 images the network is 90% efficient. 3. Conclusions & Future work After employing neural network based methodology; the results indicate that the system uses a classification approach and has an accuracy of 90% classification when evaluated against a specialist recommended medical referral decision. The input dataset to the trained Artificial Neural Network obtained from CT scanned images. The results of this at various phases could study could potentially useful to develop further detection and classification system for medical community in terms of predicting patients who are likely to have brain hemorrhages. Recommendations for Further Study:
1. Study of Severity with aging of the hemorrhages, 2. Analysis of the concept of Fat content and water content can be used in failure of Liver
function, 3. Application of Neural network system to be extended on MRI Images, 4. Application of other artificial intelligence techniques such as Bayesian Networks to solve
medical diagnosis in brain hemorrhages, 5. Classification algorithm can be improved using Water Content and Fat Content, 6. Application of Data Mining Techniques such as Clustering can be studied. 7. Study about Arterial content and venal content can be carried out, 8. Study of hemorrhage caused by hyper tension or by existing tumor in the brain can be
studied using Neural network, and 9. Profiling techniques can be used for finding the location of hemorrhage.
The social problem this research addressed is to provide an initial attempt for detection
and classification of brain hemorrhages using Artificial Neural Networks. This may potentially useful for employing telemedicine detection systems.
4. References [1] S. Kucheryavski, Chemmetr. Intlgnt. Lab. Sys, 88,100(2007) [2] P.E.Krupinski, S.Warfield, Guest Editorial Validation in Med. Img. Prcssng, J. Med. Imag., 25(11),405(2006).
[3] http://www.freepatentsonline.com/5839438.html.
[4] R. S.Cicala ,The brain disorders, McGraw-Hill Professional,1999, Ed: 1, pp 1-23
[5] E. D. Seletchi, O. G. Duliu, Image processing and data analysis in computed tomography,
Rom. Journ. Phys., Vol. 52, No. 5, 2007, pp. 667–675.
[6] http://www.lycos.com/info/artificial-neural-network.html.
[7] http://en.wikipedia.org/wiki/Digital_image_processing.
[8] Levien de Braal et.al, Analyzing and Predicting Images Through a Neural Network Approach,Proceedings of the 4th International Conference on Visualization in Biomedical Computing, Vol. 1131,1996, pp 253 – 258.
K.V.Ramana M.Tech & Raghu.B.Korrapati Ph.D
International Journal of Artificial Intelligence and Expert Systems (IJAE), Volume (1): Issue (2) 25
[9] M.Sílvia et.al., Diagnostic errors and reflective practice in medicine,journal of evalution in clinical practice, Vol. 13, Issue1, 2007, pp.138-145.
[10] http://www.freepatentsonline.com/5839438.html.
[11] F.peng, K.Yuan, S.Fen, IEEE-BMEI, international conference held at Sanya, Hainan, China on May 28-30, 2, 208(2008). [12] M.Guld, C.Thies, B.Fischer, T.Lehmann, Intnl. J. Med. Informatics, 76(2), 252(2007). [13] W.L.Zhang, X.Z.Wang, Proceed. VI Intnl. Conf. Machine Learning and Cybernetics held at Hong Kong, during 19-22 Aug,2,1155(2007). [14] G. S.Uttreshwar, A.A. Ghatol, Hepatitis B Diagnosis Using Logical Inference and Self- Organizing Map, journ. Of .computer science,Vol. 4, Issue12, 2008, pp. 1042-1050. [15] M.Sonka, Knowledge-Based Approaches to Quantitative Medical Image Analysis and Image- Based Decision Making, Springer Berlin Heidelberg, Vol 5059, June 07, 2008,pp 3-5. [16] K.Abe, J.Bisceglio, T.J.Peters, A.Russell, D.R.Ferguson and T.Sakkalis, 3-D Quant. Of Intracerebral Brain Hemorrhage, JF 198 [17] T.S.Subashini et.al. Breast Mass Classification Based On Cytological Patterns Using RBFNN And SVM, Vol. 36, Issue 3, Part 1, April 2009, pp 5284-5290. [18] C.S. Pattichis, A.G. Constantinides, Medical Imaging With Neural Networks, IEEE Workshop on Neural Networks for Signal Processing, Erimioni, Sep 1994, pp. 431-440, (1997).