Neural network-aided prediction of post-cracking tensile ...
16
Neural network-aided prediction of post-cracking tensile strength of fibre-reinforced concrete T. Ikumi a,b,⇑ , E. Galeote c , P. Pujadas b , A. de la Fuente c , R.D. López-Carreño d a Smart Engineering Ltd, C/Jordi Girona, 1-3, Parc UPC – K2M, Barcelona 08034, Spain b Department of Project and Construction Engineering, School of Industrial Engineering of Barcelona (ETSEIB), Technical University of Catalonia-BarcelonaTech, Barcelona, Spain c Department of Civil and Environmental Engineering, Barcelona Tech, Polytechnic University of Catalonia, UPC, Jordi Girona 1-3, 08034 Barcelona, Spain d Independent Researcher, 08036 Barcelona, Spain article info Article history: Received 7 April 2021 Accepted 10 July 2021 Keywords: Artificial neural network Fibre-reinforced concrete Residual strength Tensile strength abstract Structural fibres are an effective method to improve concrete post-cracking tensile strength (f ctR ). Currently, the characterization of this property is mainly performed experimentally. This is a source of uncertainties at design stages, which hinders the development of new fibre type and/or optimization of those currently existing. This paper presents a multilayer perceptron neural network to predict f ctR of fibre-reinforced concrete (FRC) subjected to the Barcelona Test. The optimal architecture of the predic- tor is obtained by evaluating 9216 configurations of input dimension and number of hidden layers and neurons. The generalization performance is assessed using repeated random sub-sampling validation with 50 iterations. The final model can predict with high accuracy the f ctR of FRC for different cracking stages. A parametric analysis is performed to prove coherence between the results predicted by the model and the established understanding of the FRC behaviour. Finally, numerical expressions are pro- vided as an alternative tool to traditional testing to predict the residual strength of the Barcelona Test for pre-design and quality control purposes based on fibre dosage, concrete strength, specimen type and height and fibre geometric characteristics. These type of approaches are found to be necessary for boosting the development of the FRC technology. Ó 2021 The Author(s). Published by Elsevier Ltd. This is an open access article under the CC BY-NC-ND license (http://creativecommons.org/licenses/by-nc-nd/4.0/). 1. Introduction According to design specifications, structural elements must present a certain degree of ductility at failure regime, which is pro- vided by a minimum amount of reinforcement. This reinforcement has traditionally consisted of steel rebars strategically placed to resist the external forces where the load-derived stresses produce the most unfavourable effects. However, developments in materi- als technology and advanced research have proved that fibres may also be used to replace partially or totally rebar reinforcement and provide the required ductility to the structure [1-4]. Nowadays, fibre-reinforced concrete (FRC) has become one of the most relevant innovations in the field of concrete technology and a competitive material in many types of structures [5-10]. The addition of short, discrete fibres provides enhanced properties to this composite cement-based material [5,6]. In the hardened state, fibres modify the non-linear structural behaviour of concrete in tension reducing the opening of cracks and counteracting its propagation. The bridging effect of the fibres increases the post- cracking residual strength of the material. Moreover, due to the debonding and pull-out mechanisms of the fibres, a greater amount of energy is dissipated, this leading to important increases in toughness [6]. To consider this enhanced behaviour during structural design, it is key to characterize the post-cracking residual tensile strength (f ctR ) of the material. Currently, this property is solely determined by different experimental methods, such as three- and four-point bending tests by means of which the flexural tensile performance is characterized. However, the high scatter of the results due to the small fracture surface area (frequently over 20%) [11,12] and the requirement of heavy specimens that are difficult to transport and set up [13] has encouraged developing alternative methods such as the Barcelona test [14]. This test is meant to indirectly determine the tensile properties of FRC using a double punch test configuration, which can be used to assess the residual strength and as complementary method for the systematic quality control [15-17]. https://doi.org/10.1016/j.compstruc.2021.106640 0045-7949/Ó 2021 The Author(s). Published by Elsevier Ltd. This is an open access article under the CC BY-NC-ND license (http://creativecommons.org/licenses/by-nc-nd/4.0/). ⇑ Corresponding author at: Department of Project and Construction Engineering, School of Industrial Engineering of Barcelona (ETSEIB), Technical University of Catalonia-BarcelonaTech, Av. Diagonal 647, 08028 Barcelona, Spain. E-mail address: [email protected] (T. Ikumi). Computers and Structures 256 (2021) 106640 Contents lists available at ScienceDirect Computers and Structures journal homepage: www.elsevier.com/locate/compstruc
Transcript of Neural network-aided prediction of post-cracking tensile ...
Computers and Structures 256 (2021) 106640
Contents lists available at ScienceDirect
Computers and Structures
journal homepage: www.elsevier .com/locate /compstruc
Neural network-aided prediction of post-cracking tensile strength offibre-reinforced concrete
https://doi.org/10.1016/j.compstruc.2021.1066400045-7949/� 2021 The Author(s). Published by Elsevier Ltd.This is an open access article under the CC BY-NC-ND license (http://creativecommons.org/licenses/by-nc-nd/4.0/).
⇑ Corresponding author at: Department of Project and Construction Engineering,School of Industrial Engineering of Barcelona (ETSEIB), Technical University ofCatalonia-BarcelonaTech, Av. Diagonal 647, 08028 Barcelona, Spain.
E-mail address: [email protected] (T. Ikumi).
T. Ikumi a,b,⇑, E. Galeote c, P. Pujadas b, A. de la Fuente c, R.D. López-Carreño d
a Smart Engineering Ltd, C/Jordi Girona, 1-3, Parc UPC – K2M, Barcelona 08034, SpainbDepartment of Project and Construction Engineering, School of Industrial Engineering of Barcelona (ETSEIB), Technical University of Catalonia-BarcelonaTech, Barcelona, SpaincDepartment of Civil and Environmental Engineering, Barcelona Tech, Polytechnic University of Catalonia, UPC, Jordi Girona 1-3, 08034 Barcelona, Spaind Independent Researcher, 08036 Barcelona, Spain
a r t i c l e i n f o a b s t r a c t
Article history:Received 7 April 2021Accepted 10 July 2021
Keywords:Artificial neural networkFibre-reinforced concreteResidual strengthTensile strength
Structural fibres are an effective method to improve concrete post-cracking tensile strength (fctR).Currently, the characterization of this property is mainly performed experimentally. This is a source ofuncertainties at design stages, which hinders the development of new fibre type and/or optimizationof those currently existing. This paper presents a multilayer perceptron neural network to predict fctRof fibre-reinforced concrete (FRC) subjected to the Barcelona Test. The optimal architecture of the predic-tor is obtained by evaluating 9216 configurations of input dimension and number of hidden layers andneurons. The generalization performance is assessed using repeated random sub-sampling validationwith 50 iterations. The final model can predict with high accuracy the fctR of FRC for different crackingstages. A parametric analysis is performed to prove coherence between the results predicted by themodel and the established understanding of the FRC behaviour. Finally, numerical expressions are pro-vided as an alternative tool to traditional testing to predict the residual strength of the Barcelona Testfor pre-design and quality control purposes based on fibre dosage, concrete strength, specimen typeand height and fibre geometric characteristics. These type of approaches are found to be necessary forboosting the development of the FRC technology.� 2021 The Author(s). Published by Elsevier Ltd. This is an open access article under the CC BY-NC-ND
license (http://creativecommons.org/licenses/by-nc-nd/4.0/).
1. Introduction
According to design specifications, structural elements mustpresent a certain degree of ductility at failure regime, which is pro-vided by a minimum amount of reinforcement. This reinforcementhas traditionally consisted of steel rebars strategically placed toresist the external forces where the load-derived stresses producethe most unfavourable effects. However, developments in materi-als technology and advanced research have proved that fibresmay also be used to replace partially or totally rebar reinforcementand provide the required ductility to the structure [1-4].
Nowadays, fibre-reinforced concrete (FRC) has become one ofthe most relevant innovations in the field of concrete technologyand a competitive material in many types of structures [5-10].The addition of short, discrete fibres provides enhanced propertiesto this composite cement-based material [5,6]. In the hardened
state, fibres modify the non-linear structural behaviour of concretein tension reducing the opening of cracks and counteracting itspropagation. The bridging effect of the fibres increases the post-cracking residual strength of the material. Moreover, due to thedebonding and pull-out mechanisms of the fibres, a greateramount of energy is dissipated, this leading to important increasesin toughness [6].
To consider this enhanced behaviour during structural design, itis key to characterize the post-cracking residual tensile strength(fctR) of the material. Currently, this property is solely determinedby different experimental methods, such as three- and four-pointbending tests by means of which the flexural tensile performanceis characterized. However, the high scatter of the results due tothe small fracture surface area (frequently over 20%) [11,12] andthe requirement of heavy specimens that are difficult to transportand set up [13] has encouraged developing alternative methodssuch as the Barcelona test [14]. This test is meant to indirectlydetermine the tensile properties of FRC using a double punch testconfiguration, which can be used to assess the residual strengthand as complementary method for the systematic quality control[15-17].

T. Ikumi, E. Galeote, P. Pujadas et al. Computers and Structures 256 (2021) 106640
The research performed so far has established a common under-standing on how different mix design parameters influence thepost-cracking performance of FRC. Results reported indicate that,given a certain type of fibre, the number of fibres effectively cross-ing a crack and the bond and strength properties of the fibres usedare the main factors determining the residual strength of the mate-rial [6-8]. Unfortunately, the current understanding of this phe-nomenon has not allowed the development of quantitativeanalytical methods to estimate this property. This can be attribu-ted to the large number of different parameters influencing theresidual strength of FRC, its nonlinear relationship and the lackof a comprehensive set of data.
During the last decade, researchers of the Polytechnic Univer-sity of Catalonia (UPC) have been gathering a database of 350 spec-imens tested by the Barcelona test during material characterizationwithin the context of structural applications of FRC in Spain and/orresearch projects performed in the university. This dataset opensup the possibility to apply advanced data-driven methods basedon artificial intelligence to develop new numerical models ableto predict the residual strength of FRC and reveal insights on thecomplex influence of each parameter.
Machine learning algorithms and, particularly, neural networkshave been getting increasing attention in civil engineering applica-tions during the last decade [18-20]. Neural networks are a super-vised learning algorithm based on an interconnected system ofnodes, called neurons, each of which can make simple mathemat-ical decisions [21-23]. Organized in three basic architectural com-ponents (input layers, hidden and output layers) the network istrained to understand the relationship between a given set ofinputs and the desired output. The mathematical framework of thistechnology usually outperforms the prediction power of traditionalregression approaches when it comes to understand input–outputrelationship in complex systems. Moreover, the full data-drivenapproach provides a different perspective to the researchers andoften highlights unseen patterns that remained unnoticed as thesemight confront the current established understanding of thephenomenon.
Table 1 summarizes the main applications of machine learningalgorithms for FRC property estimation developed during the last15 years. For each study, Table 1 describes the type of fibresemployed, the AI algorithms adopted and the property or parame-ter estimated by the model. Regarding the material, the data usedfor most applications comes from results obtained with steel fibrereinforced concrete (SFRC). Despite some studies compare a largevariety of machine learning algorithms, Artificial Neural Networks(ANN) prevail as the most common estimator, followed by SupportVector Machine (SVM) and ensemble methods (Random Forest,AdaBoost, Gradient Boost, and others). Finally, Table 1 highlightsan important limitation of the current models. Even though theimprovement of post-crack (or peak) response of the material isthe main property sought after with fibre addition, very few ofthe models reviewed are oriented to assess post-cracking beha-viour, which is the design and cost governing variable. Instead,most models aim to predict the compressive (fc), pre-crack tensile(ft) of shear (V) strength of the material. Amongst the few studiesidentified addressing post-crack behaviour [34,38], none allowsdirect residual strength prediction. Moreover, the models trainedare treated as black boxes, which does not allow practitionersthe use of these predictors for design and quality control purposesof FRC mixes and structures.
This paper makes use of the above-mentioned database todevelop a multilayer perceptron (MLP) neural network to estimatethe post-cracking residual strength of FRC obtained through theBarcelona test. Different configurations of input dimension, num-ber of hidden layers and number of neurons in each layer weretrained and evaluated to identify the optimal architecture of the
2
predictor. Feature selection is performed by computing all possibleattribute combinations. For each attribute subset, MLP with 1 and2 hidden layers were evaluated. The generalization performancewas assessed and compared using repeated random sub-sampling validation, this also known as Monte Carlo cross-validation [55], with a total of 50 iterations. Considering the num-ber of MLP configurations tested, a total of 460,800 trainings wereperformed to optimize the performance of the final model. Suchexhaustive approaches are not often adopted in machine learningapplications due to the large computational cost associated. How-ever, it provided a valuable set of results that enabled a compre-hensive assessment of aspects related to feature relevance, inputdimension and hidden layers configuration on the networkperformance.
The final model selected is fully presented and equations areprovided to predict the residual strengths of FRC obtained from
the Barcelona test (f 2mmctR , f 3mm
ctR , f 4mmctR ). Finally, a parametric study is
performed to quantify the robustness of the model and confrontthe insights derived with the established understanding of thephenomenon. Again, an exhaustive approach is adopted involvingall possible combinations between the input parameters of thefinal model.
2. General overview of the post-cracking characterization test
The residual tensile strength of FRC can be determined accord-ing with different types of tests. Bending tests are the most widelyused methods to determine the tensile strength of FRC, these beingmuch simpler and better candidates than uniaxial tensile tests[56]. Indeed, the constitutive laws for FRC defined in most of thenational and international codes and guidelines [11] are based onthe results of flexural tests according to three- and four-pointbending configurations, whether notched or unnotched. However,the high scatter of the results in bending tests [57] as a result ofthe small fracture surface area still represents one of the majordrawbacks. This has encouraged developing alternative methodssuch as the Barcelona test [14], which can be used to assess theindirect tensile residual strength of FRC and also as complementarymethod for the systematic quality control [15].
The Barcelona test is an indirect test to determine the tensileproperties of FRC using a double punch test configuration. Accord-ing to the specifications of the Spanish standard UNE 83515, thetest is performed on cylindrical FRC specimens using an exten-someter chain to measure the Total Circumferential Opening Dis-placement (TCOD). The test was subsequently simplified bydefining an analytical correlation between the TCOD and the verti-cal displacement [58] to use the latter as the control variable whileomitting the use of the extensometer chain. Further researchrevealed that cylindrical specimens can be replaced by cubic spec-imens of 150 mm of side without the necessity of the chain (Fig. 1),having this type of sample the advantage of providing informationabout the orientation and contribution of the fibres when tested ineach of the three spatial directions [59]. Additional research wasconducted to develop a multilinear constitutive model based onthe Barcelona test according with an analytical deduction describ-ing the kinematic and mechanic fracture mechanism with prede-fined strain values [60].
In comparison to bending tests, the Barcelona test states a goodalternative to determine the post-cracking behaviour of FRC giventhat it can be conducted with minimum equipment on conven-tional compressive jacks and its lower material consumption canbe used to increase the number of tests to reduce the scatter. Inthis line, additional research on the Barcelona test was conductedwith the aim of orienting its use as an alternative method to thebending test in terms of quality control by developing correlations

Table 1Summary of machine learning models developed for FRC property estimation.
Type of fibres AI Algorithm Parameter estimated Ref.
Steel Synthetic Glass Natural ANN Decision Tree Ensemble SVM Genetic Other fc ft V Post-cracking Other
� � � � � � [24]� � � � � � [20]� � � [25]� � � � [26]� � � � � � [27]� � � � [28]� � � � � [29]� � � [30]� � � [31]� � � [32]� � � � � � [33]� � � � � � [34]� � � � [35]
� � � � � [36]� � � � [37]� � � � � � [38]
� � � [39]� � � � � [40]� � � � � � [41]� � � [42]� � � � � � [43]
� � � [44]� � � � [45]� � � [46]� � � � � [47]
� � � � [48]� � � � � � � [49]� � � [50]� � � [51]� � � � � [52]� � � [53]� � � � � � � [54]
Fig. 1. Cylindrical and cubic specimen test setup and cracking patterns.
T. Ikumi, E. Galeote, P. Pujadas et al. Computers and Structures 256 (2021) 106640
3
T. Ikumi, E. Galeote, P. Pujadas et al. Computers and Structures 256 (2021) 106640
between both characterization methods [15,61]. The extensiveresearch and published results out of using the Barcelona test asa characterization method [62-68] together with novel results ofrecent experimental programs, constitutes a comprehensive data-base for developing advanced data-driven learning models.
3. Data collection
The dataset comprises 350 specimens tested through the Barce-lona test at the Polytechnic University of Catalonia (UPC) duringmaterial characterization within the context of structural applica-tions of FRC and/or research projects. Different dosages weredesigned orienting the composition of the granular skeleton toachieve a proper compatibility between the concrete matrix andthe fibres to reach target performances. In terms of compressivestrength, the concretes used can be classified from conventionalto high-performance concrete, although specific values of com-pressive strength or further details concerning the concrete mix-ture proportions, casting procedure or time of curing were notreported in all cases.
The database includes a large variety of concretes mixes, cover-ing various ranges of compressive strength (fc) of the mixes, con-
Fig. 2. Distribution of input pa
4
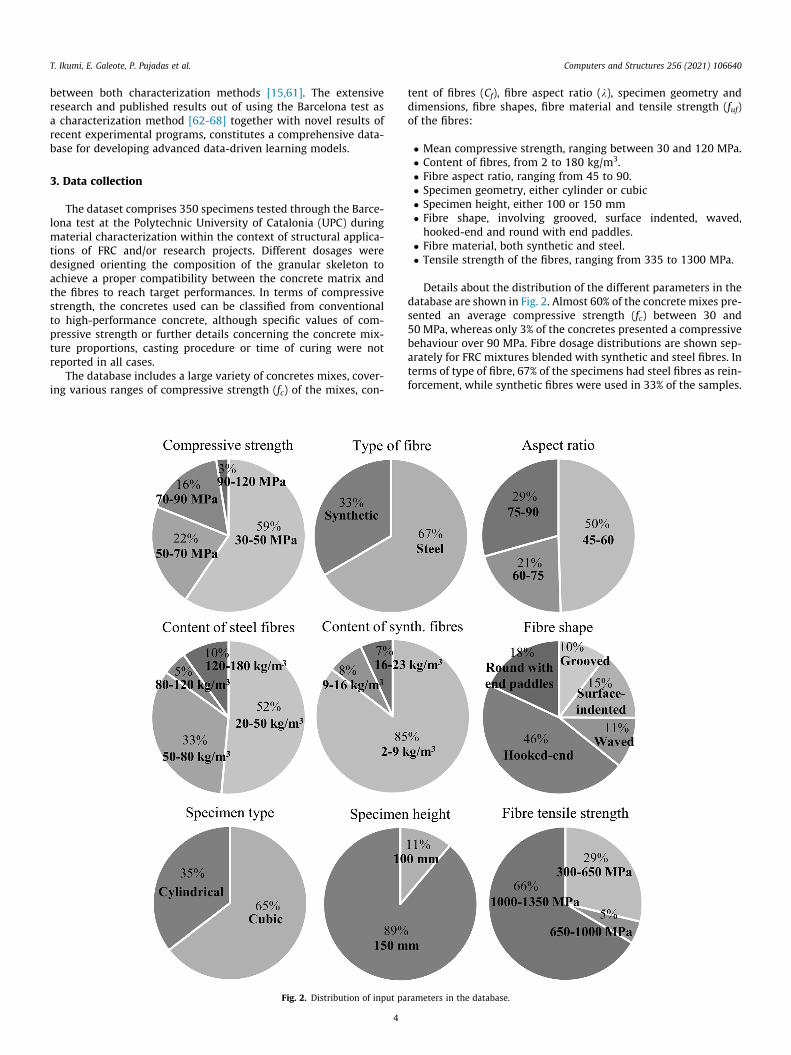
tent of fibres (Cf), fibre aspect ratio (k), specimen geometry anddimensions, fibre shapes, fibre material and tensile strength (fuf)of the fibres:
� Mean compressive strength, ranging between 30 and 120 MPa.� Content of fibres, from 2 to 180 kg/m3.� Fibre aspect ratio, ranging from 45 to 90.� Specimen geometry, either cylinder or cubic� Specimen height, either 100 or 150 mm� Fibre shape, involving grooved, surface indented, waved,hooked-end and round with end paddles.
� Fibre material, both synthetic and steel.� Tensile strength of the fibres, ranging from 335 to 1300 MPa.
Details about the distribution of the different parameters in thedatabase are shown in Fig. 2. Almost 60% of the concrete mixes pre-sented an average compressive strength (fc) between 30 and50 MPa, whereas only 3% of the concretes presented a compressivebehaviour over 90 MPa. Fibre dosage distributions are shown sep-arately for FRC mixtures blended with synthetic and steel fibres. Interms of type of fibre, 67% of the specimens had steel fibres as rein-forcement, while synthetic fibres were used in 33% of the samples.
rameters in the database.

Fig. 3. Distribution of the residual strength variables f 2mmctR , f 3mm
ctR and f 4mmctR .
T. Ikumi, E. Galeote, P. Pujadas et al. Computers and Structures 256 (2021) 106640
It must be remarked that hooked-end fibres represent the 46% ofthe fibres used since this type of anchorage has proven to lead tothe required matrix-fibre bond capacity in case of demandingstructural applications.
Besides the input parameters described, the database includesthree variables representative of the FRC post-cracking perfor-mance measured during the Barcelona Test. These are the residualtensile strengths obtained for a vertical displacement of 2 mm, 3
and 4 mm during the execution of the test (f 2mmctR , f 3mm
ctR and f 4mmctR ,
respectively). Fig. 3 depicts the distribution of the measured fctR,the boxes gathering the first and third quartiles, with an additionalline along the second quartile marking the median. The cross inside
Fig. 4. MLP default architectu
5
the box represents the mean of the distribution. Minimums andmaximums strengths obtained outside the first and third quartilesare depicted with whiskers.
Finally, it is important to highlight that the observationsincluded in the database have not been pre-processed to eliminatethe inherent scatter of the Barcelona Test (for instance, by averag-ing all results from the same mixture composition and testing con-dition). In any real test, scatter owe to different sources is expectedto occur. In the case of FRC elements, the chief sources of scattermay be classified in the three groups [69]: (1) precision of theequipment and of the set-up used in the test; (2) production pro-cess of the samples (i.e., tolerances of the geometry), and (3),intrinsic scatter of the material caused by the random distributionand orientation of the fibres within the matrix. In this regard, thelatter source of variability exists even if the production and thetesting procedures are kept absolutely constant as the position ofthe fibres would always vary slightly from one specimen to theother. For the database adopted in this study, the measures ofresidual strengths present an average inherent scatter of 13%.
4. Optimization of the network configuration
4.1. Methodology
This section describes the methodology adopted to find a com-petent neural network architecture to predict accurately the resid-
ual strengths f 2mmctR , f 3mm
ctR and f 4mmctR . The size of the database allows
exhaustive approaches that are not usually applicable in mostmachine learning applications. Despite these approaches beingcomputationally expensive, these generate a lot of data that notonly enable the identification of the optimal network configurationbut also might provide useful insights about the physical phe-nomenon studied.
re with all input features.

Table 2Other training parameters.
Training parameter Value
Maximum number of epochs to train 500Performance goal 0Maximum validation failures 6Minimum performance gradient 1.00E�10Marquardt adjustment parameter 0.001Decrease factor for Marquardt adjustment parameter 0.1Increase factor for Marquardt adjustment parameter 10Maximum value for Marquardt adjustment parameter 1.00E+10
Fig. 5. Outline of the repeated random subsampling validation adopted for each of the 9216 MLP configurations evaluated.
T. Ikumi, E. Galeote, P. Pujadas et al. Computers and Structures 256 (2021) 106640
The estimators adopted for this task are different configurationsof multilayer perceptrons (MLP), all coded in the Matlab environ-ment (R-2019a). This supervised learning algorithm learns a func-tion f �ð Þ : R1:16 ! R
3 from the labelled dataset described inSection 3, where 1:16 refers to the input dimension range exploredand 3 is the number of outputs predicted. Fig. 4 presents thedefault architecture of the MLP adopted, with successive layersfeeding into one another in the forward direction from all inputfeatures to outputs. Neurons in hidden layers adopt hyperbolic tan-gent sigmoid transfer functions (Tansig) while the output layeradopts a linear transfer function (Purelin). Notice that while thereis no communication between neurons of the same layer, all nodesin one layer are fully interconnected to those of the next layer.
From this default architecture, different configurations of inputdimension, number of hidden layers and number of neurons ineach layer were trained and evaluated on unseen data. Variableselection is an important step in building accurate and reliable pre-diction models [70-72]. Removing noisy features can help themodel focus on the relevant patterns, besides simplifying themodel and reducing the computational cost. Due to the low num-ber of features, an exhaustive approach is adopted by computingall possible attribute combinations (511 subsets). For each attri-bute subset, MLP with 1 and 2 hidden layers were evaluated. Thenumber of neurons in each layer ranged from 1 to n, n being theinput dimension of the attribute subset. This criterion was adoptedto reduce the number of trainings and is in line with the commonlyrelied rule-of-thumb that states that the optimal size of the hiddenlayer is usually between the size of the input and size of the outputlayers [73]. In total, 9216 MLP configurations were trained, 2304with 1 hidden layer and 6912 with 2 hidden layers.
The generalization performance was assessed and comparedusing repeated random sub-sampling validation, also known asMonte Carlo cross-validation [55]. This approach was adopted overa simpler train-test split, as the size of the database would resultinto a high variance outcome, which would be insufficient for bothperformance assessment and for procedure comparison purposes.Moreover, when dealing with small datasets, it is appropriate toadopt resampling methods to extract all possible information con-tained in the data. The repeated random sub-sampling validationallows the systematic evaluation of the model capacity for predict-ing the outcome on random unseen splits of the dataset (Fig. 5). Ineach random sampling, 80% of the observations were used fortraining and the other 20% for testing. A total of 50 iterations(rounds) were evaluated. This provides a sound population of per-formance measures (PIi) that allows the determination of the aver-age predictive performance over all surrogate models (PI) and theselection of the appropriate model for this task.
6
Considering the number of MLP configurations tested, a totalof 460,800 trainings were performed. The Matlab training func-tion ‘‘trainbr” was adopted for all simulations to improve themodel generalization. This is a Bayesian Regularization methodthat follows the Levenberg-Marquardt algorithm to update theweight and bias values. For each training, the initial values ofweights and biases were assigned according to Nguyen-Widrowalgorithm [74] with a fixed seed for the random number genera-tor across experiments. Other training parameters are listed inTable 2.
4.2. Results
The comprehensive approach adopted to seek for the optimalnetwork configuration provided a large amount of data thatenables the study of several aspects related to feature relevanceand network architecture.
Fig. 6 shows the performance of all configurations trained onunseen data. The performance indicator depicted is the coefficientof determination (R2). R2 quantifies the proportion of the variance
in the target residual strengths (f 2mmctR , f 3mm
ctR , f 4mmctR ) that is predictable
from the ANN configuration adopted and is estimated as indicated
in Eq. (1). In this equation, yi and y�refer to the predicted outputs
and their mean while ti refers to the corresponding target values.The values represented in Fig. 6 correspond to the average R2 ofthe 3 outputs provided by the model over the series of 50 randomsplits of the dataset performed. Results below a precision of 0.45are discarded in the figure as these represent a very low proportionof outcomes (0.98%) and its representation hinder the visualizationof the main results.
R2 ¼ 1�P
i yi � tið Þ2P
i yi � y�� �2 ð1Þ

Fig. 6. Average coefficients of determination (R2) for the 9216 network configura-tions evaluated.
T. Ikumi, E. Galeote, P. Pujadas et al. Computers and Structures 256 (2021) 106640
The distribution depicted in Fig. 6 suggests the presence of sev-eral patterns related to the specific input features considered andnetwork architecture adopted. The following sections analyse bothaspects in detail.
Fig. 7. Effects of the input features
7
4.2.1. Effects of the input layer configuration: Feature selectionFig. 7 presents the effect of each input feature on the network
performance. Each subplot highlights in orange the R2 valuesobtained in networks with a particular input feature while resultsobtained without this variable are depicted in black. All subplotsincorporate horizontal dotted lines with the average values of bothseries adopting the same colour code. Finally, subplots arearranged based on the feature relevance measured by the distancebetween both dotted lines.
Fig. 7 identifies 3 key input features (fibre dosage, specimen typeand concrete compressive strength) that maximize the average per-formance of the network. The consideration of the fibre dosage isclearly the input feature that shows the strongest effect on the net-work performance, with an average increase from 0.603 to 0.742,while both the specimen type and concrete compressive strengthinclusion increases the model performance from 0.658 to 0.703and 0.661 to 0.700, respectively. The consideration of the geomet-ric and mechanical properties of the fibre (fibre diameter, length,shape, and strength) lead to an average improvement of the deter-mination coefficient between 0.013 and 0.027. Finally, the resultssuggest minor benefits from considering fibre type or specimenheight as input features as the average precisions amongst all con-figurations assessed are almost identical independently of thesevariables.
on the network performance.

Fig. 8. Effects of the number of input features on the network performance.Fig. 9. Effect of the number of hidden layers on the network performance.
T. Ikumi, E. Galeote, P. Pujadas et al. Computers and Structures 256 (2021) 106640
Based on the results presented in Fig. 7, it is important to clarifythat the low relevance detected for some input features does notnecessarily mean that these variables are not relevant to the resid-ual strength of concrete. Instead, it indicates that these featuresprovide redundant information, which is already covered by theother input parameters. Feature selection should be performedbased on the prediction capacity, and not on the influence on thetarget variable. This is the case, for instance, of the variable fibretype. The information provided by this variable (metallic or syn-thetic) can be probably deduced from other features such as the fi-bre dosage (each type of fibre has a range of dosages upon whichthe production of the concrete is feasible) or other fibre character-istics. Another important aspect to consider is that the low rele-vance of a feature refers to the average of all combinationsassessed. However, for a certain model (a single marker in the fig-ure) the importance of an input feature might be significant andthus, it should be considered in the network.
Fig. 8 represents the effect of the number of input features onthe network performance. Fig. 8 includes a boxplot for each inputdimension assessed (from 1 to 9). The box sets the first and thirdquartiles while the cross inside the box represents the mean ofthe distribution. Minimums and maximums R2 obtained with eachinput dimension outside the first and third quartiles are depictedwith whiskers. The relation between number of input featuresand R2 allows confirms a rapid increase of model precision alongwith the input dimension. The mean R2 shows a sustainedimprovement even at high input dimensions. However, the maxi-mum performance obtained by a particular model configurationtends to stabilize at around 0.80 for networks with 4 or more inputfeatures.
4.2.2. Effects of the hidden layer(s) configurationDifferent configurations of hidden layers (number of layers and
neurons comprising each layer) were explored to understand theeffect of these parameters and to optimize the feed forward backpropagation neural network architecture.
Fig. 9 highlights in orange the results corresponding to the con-figurations with 2 hidden layers while the black markers identifythe configurations with 1 hidden layer. Unlike some input featurespresented in Fig. 7, where black and orange markers depict differ-ent behaviours, markers in Fig. 9 are distributed throughout allranges of the performance domain. Additionally, Fig. 9 includesin dotted lines the R2 average for both number of hidden layers.The average of the results with 2 hidden layers was determinedconsidering the maximum performance for each input and first
8
hidden layer configuration. By this way, both average values com-pared correspond to the same number of configurations assessed.The average R2 obtained with 2 hidden layers (0.675) is onlyslightly above the obtained with 1 hidden layer (0.662). Theseresults show a minor performance difference from adding addi-tional hidden layers for this particular application.
The effect of the size of the hidden layer(s) cannot be compre-hensively analysed here as the number of neurons for each layerand feature combination explored was limited to the size of theinput layer.
4.3. Final model
The optimal ANN configuration (input features and networkarchitecture) is selected based on the general performance indica-tor (PI) described in Eq. (2). This indicator takes into account boththe value and variability of the model accuracy over the differentdata splits performed by subtracting the normalized standard devi-ation (rk) obtained for a model configuration k to the correspond-ing standardized coefficient of determination (R2
k). The
standardization of each R2k and rk is performed by subtracting
the arithmetic mean (lðR2k Þand lðrkÞ, respectively) and divide it
by the standard deviation of the population (rðR2k Þand rðrkÞ, respec-
tively). The optimal configuration selected maximizes the value ofthe indicator (PI). This assumes that the performance measuredwith the surrogate models is representative of the performanceof the final model, which was trained with all samples.
PIk ¼R2k � lðR2k ÞrðR2k Þ
� rk � lðrkÞrðrkÞ
ð2Þ
Fig. 10 shows the optimal ANN selected, this corresponding tothe configuration that maximizes the mean R2 value of the testset (0.81) while minimizing the standard deviation of this perfor-mance criterion (0.034). As it can be seen, the final network incor-porates 4 and 3 neurons in the first and second hidden layer,respectively, and disregard the original input features fibre typeand fibre strength.
Then, the ANN optimal configuration selected was trained on alldata to obtain the final predictive model. Fig. 11 depicts the corre-lation between the measured residual strengths obtained duringthe Barcelona Test and the predicted outcomes. The final model
yields predictive accuracies of 0.87, 0.86 and 0.83 (R2) for f 2mmctR ,
f 3mmctR and f 4mm
ctR , respectively.

Fig. 10. ANN optimal configuration.
T. Ikumi, E. Galeote, P. Pujadas et al. Computers and Structures 256 (2021) 106640
These values should not be confronted against a R2 = 1 to assessthe quality of the model, since this degree of precision on this taskis unachievable with the current dataset. As described in Section 3,the dataset has inherent noise or irreducible error attributed to thevariability of the Barcelona test itself, which is not captured by anyinput feature. Part of this noise is shown in Fig. 11. Markers linedhorizontally despite belonging to the same experimental program(identical mix design and fibre and specimen characteristics) pro-vided different residual strengths. In this case, the model is unableto reproduce the inherent noise of the test and thus, predicts anaverage value for all cases. To indirectly visualize this noise,Fig. 11 includes in dotted lines the mean coefficient of variationof the measured residual strength within each experimental pro-gram. Considering all factors mentioned, the current modelobtained is found capable to predict with high accuracy the resid-ual strength at any point of the post-cracking stage.
The numerical matrices of the input layer weights (W1), firsthidden layer (W2) and second hidden layer (W3) together withthe corresponding biases (B1, B2 and B3) of the optimal ANN con-
W1 ¼
�1:439 �0:282 �0:303 0:235 0:060 �0:060 0:278 �0:278 0:597 �0:452 0:304 0:366 �0:126�0:165 �0:024 0:142 1:135 0:081 �0:081 0:211 �0:211 �0:506 �0:348 �0:210 �0:164 0:110�1:679 0:124 �0:402 �0:132 �0:026 0:026 0:184 �0:184 0:191 0:227 0:244 0:461 �0:439�1:477 0:726 0:173 �0:753 �0:212 0:212 0:192 �0:192 �1:153 0:092 0:283 0:095 0:254
8>>><>>>:
9>>>=>>>;
ð3Þ
figuration are shown in Eqs. (3)–(6).
W2 ¼0:4818 �0:0983 �1:1402 0:29941:3330 �1:2125 �1:0432 1:0805�0:0973 0:1731 �0:2310 0:0083
8><>:
9>=>;
ð4Þ
9
W3 ¼�0:6084 �1:3488 0:2554�0:6409 �1:4388 �0:1862�0:8418 �1:3569 0:0352
8><>:
9>=>;
ð5Þ
B1 ¼
�0:22970:3724�0:22820:1428
8>>><>>>:
9>>>=>>>;B2 ¼
0:3696�0:2479�0:2180
8><>:
9>=>;B3 ¼
�0:2422�0:3699�0:2995
8><>:
9>=>;
ð6Þ
Eq. (7) can be directly used to predict the residual strengths
obtained from the Barcelona test (f 2mmctR , f 3mm
ctR , f 4mmctR ). In this equation,
the terms xn and yn correspond to the normalized input and outputvalues obtained from the Matlab function MAPMINMAX. Sincetraining set data has been pre-processed to scale inputs and targetswithin the range [�1,1], whenever the net is used with new inputs,these should be converted as well with the minimum and maxi-mums that were considered during the training. Eq. (8) showsthe transformation parameters required to normalize the input
values (imin, imax) while Eq. (9) indicates the parameters requiredto convert the normalized outputs back into the same units thatwere used for the original targets (tmin, tmax).
yn ¼ B3þW3
� tansig B2þW2 � tansig B1þW1 � xnð Þð Þ where tansig xð Þ¼ 2=ð1þ e�2xÞ � 1
ð7Þ

Fig. 11. Measured vs predicted residual strengths (a) f 2mmctR , (b) f 3mm
ctR and (c) f 4mmctR .
T. Ikumi, E. Galeote, P. Pujadas et al. Computers and Structures 256 (2021) 106640
imin ¼
33:7350:552000000000
8>>>>>>>>>>>>>>>>>>>>>>>>>><>>>>>>>>>>>>>>>>>>>>>>>>>>:
9>>>>>>>>>>>>>>>>>>>>>>>>>>=>>>>>>>>>>>>>>>>>>>>>>>>>>;
imax ¼
80:57601:0580111111111
8>>>>>>>>>>>>>>>>>>>>>>>>>><>>>>>>>>>>>>>>>>>>>>>>>>>>:
9>>>>>>>>>>>>>>>>>>>>>>>>>>=>>>>>>>>>>>>>>>>>>>>>>>>>>;
ð8Þ
10
tmin ¼0:40420:35240:2933
8><>:
9>=>;tmax ¼
3:15002:90642:6240
8><>:
9>=>;
ð9Þ
5. Parametric study on the residual strength
A parametric study is performed to test the robustness of theresults provided by the optimal ANN configuration and confrontthe insights derived with the established understanding of thephenomenon. Table 3 specifies the ranges evaluated for each inputparameter of the network. Different ranges are defined for applica-tions with synthetic and metallic fibres to assess realistic scenariosfound in practice.
An exhaustive test is performed involving all possible combina-tions between the input parameters indicated in Table 3. Thisresults in a total of 7500 and 5000 permutations for syntheticand metallic fibres, respectively. In each case, the residual

Table 3Ranges of parameters adopted in the parametric analysis.
Inputparameter
Range Synthetic fibres Range metallic fibres
Fibre dosage[kg/m3]
[2,4,6,8,10] [20,35,50,65,80]
Comp. strength[MPa]
[30,40,50,60,70] [30,40,50,60,70]
Fibre Ø [mm] [0.6,0.7,0.8,0.9,1] [0.6,0.7,0.8,0.9,1]Fibre length
[mm][35,40,45,50,55] [35,40,45,50,55]
Specimen type [Cylindric, cubic] [Cylindric, cubic]Specimen height
[mm][100,150] [100,150]
Fibre shape [Grooved, surfaceindented, Waved]
[End-hook, Round with endpaddles]
Fig. 12. Correlation between residual stren
T. Ikumi, E. Galeote, P. Pujadas et al. Computers and Structures 256 (2021) 106640
11
strengths predicted (f 2mmctR , f 3mm
ctR , f 4mmctR ) are saved and further anal-
ysed in the following sections. The analysis of the results presented
here focuses on the residual strength f 2mmctR as all outputs predicted
(f 2mmctR , f 3mm
ctR , f 4mmctR ) are linearly correlated with determination coeffi-
cients over 0.94. Fig. 12 presents the linear correlations betweenthe different residual strengths predicted for both synthetic andmetallic fibres.
Some values predicted resulted in negative strengths, which hasno physical meaning. Instead, these should be interpreted as nullvalues. Despite the ranges of the parameters are established basedon the dataset described in Section 3, certain permutationsexplored during this parametric study were not covered duringtraining. The negative results obtained come from this new distri-bution of inputs. Future improvements of the model should con-sider replacing the linear transfer function (Purelin) of the outputlayer with a Rectified Linear Unit (ReLU) to avoid negative predic-tions when unseen distributions are evaluated.
gths for metallic and synthetic fibres.

Fig. 13. Influence of fibre content on a) synthetic and b) metallic fibres.
T. Ikumi, E. Galeote, P. Pujadas et al. Computers and Structures 256 (2021) 106640
5.1. Effect of fibre dosage
Fig. 13 reports the influence of synthetic and metallic fibredosage on the residual strength of FRC according to the final modeldeveloped. Each box sets the first and third quartiles, with an addi-tional line along the second quartile marking the median. The crossinside the box represents the mean of the distribution. Minimums
and maximums f 2mmctR obtained are depicted with whiskers. As
explained in Section 5, negative values should be interpreted asnull. Fig. 13 reveals an increase of post-cracking strength withthe fibre dosage, both for synthetic and metallic fibres. Thesetrends have been extensively reported in previous studies [75-81] and are explained by the increasing the number of fibres bridg-ing the cracked surface [82-87].
While the variability of the results does not significantly changefor different contents of synthetic fibres, the use of different con-tents of metallic fibres has a great influence on the variability ofthe results. In this regard, even though increasing the content offibres generally leads to a smaller variability [69,88], the differenttypes of fibres (i.e., anchorage type and range of tensile strength)used in the analysis led to an increase of the variability regardlessof the content of fibres.
5.2. Effect of the concrete strength
Several studies [3,79,80] have shown that the use of fibresbarely affects the compressive strength of concrete given that this
Fig. 14. Influence of compressive strength
12
property mainly depends on the concrete matrix. However, theresults reported by other authors [78,89] reveal that increasingfibre content improves the compressive strength of FRC as fibresextend the micro and macro cracking stages.
The results obtained by the ANN developed allow stating thatincreasing the compressive strength of concrete generally leadsto greater residual strengths (Fig. 14). For synthetic fibres, theincrease of post-cracking performance with the compressivestrength is minor whereas metallic fibres depict a major increaseof performance for strengths above 50 MPa. In the case of syntheticfibres, despite showing this minor average influence, the amplitudeof the interquartile range (IQR) is reduced with the increase ofcompressive strength, indicating a lower scatter of the results.
Metal fibre reinforced concretes with fc = 70 MPa present thesmallest interquartile range, this leading to a more reduced vari-ability of the 50% of the closest results to the median value. Theseresults are in line with those studies suggesting that increasing thecompressive strength may affect the post-cracking performance[90]. This effect can be attributed to an improvement of the adher-ence and the interface between the fibre and the concrete matrixdue to lower w=c ratios [91] and the reduction of voids [92] in highstrength mixtures. Such characteristics lead to a greater pull-outresistance of the fibres [93,94] and an increased residual strengthof FRC. Additionally, the reduction of the w/c ratio might triggergreater shrinkage values [95] that increase the confinementpressure of the fibre and improve the bond properties at thefibre–matrix interface.
on a) synthetic and b) metallic fibres.

Fig. 15. Influence of specimen type and height on residual strength.
T. Ikumi, E. Galeote, P. Pujadas et al. Computers and Structures 256 (2021) 106640
5.3. Effect of the specimen type and height
Fig. 15a and b exhibit the influence of the specimen shape(cylinder or cubic) and specimen size (100 or 150 mm) on thepost-cracking performance of FRC according to the neural networkdeveloped. Results reported in Fig. 15a indicate an important roleof specimen shape on the residual strength predicted. Tests per-formed on cylinder shaped specimens tend to achieve higher resid-ual strengths than cubic samples for both steel and synthetic fibreconfigurations. No studies were found in the literature against or inline with this outcome. However, the authors believe that theseresults might be influenced by the fact that some cubic specimenstested in the dataset were cut from rectangular beams for flexuraltests. In these cases, cubic specimens cut might present some pref-erential orientation of the fibres that might affect the performanceduring the Barcelona test. Further studies are needed to validatethis statement.
On the other hand, Fig. 15b shows opposing trends regardingthe size effect for synthetic and metallic fibres. For synthetic fibres,increasing the specimen size from 100 to 150 mm reduces thepost-cracking performance of the material while for metallic fibresan improvement of residual strength is depicted. Similarly to theprevious case, no studies were found in the literature addressingthis particular phenomenon for the Barcelona test.
Previous studies conducted on beams under flexure have shownthat the residual strength of FRC decreases with the increase ofspecimen dimension [92,96-98] as a result of the size effect in con-crete. In FRC, the greater strength of smaller elements may also beattributed to an increasing number of fibres oriented in a perpen-dicular direction to the cracked surface when reducing the dimen-sion of the element [83]. In this line, previous authors [99,100]state that the reduction of the specimen dimension amplifies thewall-effect, which reorients the fibres towards a certain direction.
Besides the effect of the distribution and orientation of thefibres, the classical theories of the deterministic size effect (lawof Bazant and the Weibull’s statistical approach) generally providean explanation to this phenomenon. Nonetheless, the studiesabovementioned contrast with the results here presented, proba-bly given that the Barcelona test presents a different fracturemechanism (combination of fracture modes I and II) if comparedto the flexural test.
5.4. Effect of fibre geometric characteristics (Ø and length)
The influence of the diameter and the length of the fibre on theestimated results of the post-cracking strength of FRC obtainedthrough the ANN for synthetic and metallic fibres are shown inFig. 16 and Fig. 17, respectively. Results presented in Fig. 16 show
13
no significant effect of the diameter of the fibre on the residualstrength of FRC. The interquartile range presents a similar magni-tude regardless of the diameter of the fibre for both metallic andsynthetic reinforcement, which indicates that this parameterbarely affects the distribution of the results nor their variability.
Fig. 17 reveals an increase of residual strength of FRC with theincrease of fibre length for both synthetic and metallic reinforce-ment, which is in line with the results reported by previousauthors [75,101]. This can be attributed to an enhancement ofthe bonding area between the fibre and the matrix [101–103],leading also to a greater pull-out capacity. Even though increasingthe length of the fibres makes the number of fibres decrease whenblended in the same volume fraction, previous studies [103] havereported that the number of fibres crossing the crack surface doesnot significantly change in such situation. In this case, although thenumber of longer fibres decreases when compared to shorter ones,the greater length also increases the likelihood of longer fibres tobe present at the crack surface.
In the case of synthetic fibres, although longer fibres lead togreater post-cracking strengths, it also triggers a greater variabilityof the results. However, the predicted results of the ANN for metal-lic fibres present a greater variability for shorter fibres. It should benoticed how the interquartile range of shorter fibres presents itsmaximummagnitude for short metallic fibres, while its magnitudedecreases for longer fibres.
Several studies [69,88] confirm that greater contents of fibresreduce the variability of the results given that the number of fibresat the cracked section increases and, hence, also does its homo-geneity. The database used for training and validating the ANNincludes a large variety of types of fibres and contents. Under suchsituation, the difference of variability between the results reportedin previous studies and the variability shown in Fig. 17 could beattributed to the use of different contents of fibres for a single typeand length of fibre for the prediction of the results when trainingand validating the ANN.
6. Conclusions
Successful applications have promoted the use of FRC as analternative reinforcement in several types of structures. The grow-ing use of FRC as a construction material highlights the necessityfor new design and quality control methods combining practicalityand economy with efficiency and reliability. With that purpose inmind, this paper presents a successful implementation of a multi-layer perceptron (MLP) network to determine the post-crackingtensile strength of FRC, which is the governing design parameterfor structural components.

Fig. 16. Influence of fibre diameter on the residual strength of a) synthetic and b) metallic FRC.
Fig. 17. Influence of fibre length on the residual strength of a) synthetic and b) metallic FRC.
T. Ikumi, E. Galeote, P. Pujadas et al. Computers and Structures 256 (2021) 106640
In order to prove the capacity of the aforementioned technol-ogy, a novel database of 350 Barcelona Test specimens was usedto perform an exhaustive and comprehensive analysis to find acompetent neural network architecture. The analysis includedthe evaluation of 9216 different MLP configurations with a totalof 460,800 trainings performed. From this analysis, the followingoutcomes can be concluded:
� The final ANNmodel selected derived from the current database
yields predictive accuracies (R2) of 0.87, 0.86 and 0.83 for f 2mmctR ,
f 3mmctR and f 4mm
ctR , respectively.� Analytical expressions associated with the final model are pro-vided to directly predict the residual strengths based on fibredosage, concrete strength, specimen type and height and fibregeometric characteristics. These expressions are oriented topre-design for those frequent cases in which no characteriza-tion tests results are available or for reinforcement optimizationpurposes.
� The comprehensive parametric analysis performed proved thecoherence between the results predicted by the model andthe established understanding of the FRC behaviour.
All the analyses performed indicates that machine learningtechniques can play a substantial role in the FRC post-crackingstrength assessment. The developed ANN model can be a compet-itive and valuable alternative tool to traditional testing or linealestimation models with acceptable accuracy for design and qualitycontrol purposes, replacing time and resource-consuming labora-tory tests.
14
Despite the remarkable contribution of this manuscript withinthe field of the design and control of FRC, the successful applicationof MLP methods for this purpose requires thorough research. Theperformance and range of applicability of machine learning modelsis highly reliant on the amount, variety and quality of availabledata. Future research perspectives on those lines of action arelisted below:
� Incorporate the results of new tests to improve the reliability ofthe dataset and cover additional domains of materials and typeof fibres. Respect to the latter, further results on FRCs withmacro-synthetic fibres would enhance the predictability capac-ity of the proposed approach.
� Current input features considered are unable to capture thesource of variability on the residual tensile strength of speci-mens from identical mix design and both fibre and specimencharacteristics. The advancement of wireless sensor technolo-gies for the monitoring of the concrete setting process repre-sents a true asset for data generation that could provide themissing features to boost model performance. This can beextended further by considering this technology for machinelearning applications in several FRC areas such as creep, fatigueor durability and service-life assessment.
� Similar applications of the ANN model presented in thisresearch may help in the prediction of the behaviour of FRC,for which the development of ANN based on alternative testsis strongly recommended. In this line, models based on newANN may help on the design of new mixes and types of fibres.
T. Ikumi, E. Galeote, P. Pujadas et al. Computers and Structures 256 (2021) 106640
Declaration of Competing Interest
The authors declare that they have no known competing finan-cial interests or personal relationships that could have appearedto influence the work reported in this paper.
Acknowledgements
T. Ikumi is supported by the Torres Quevedo programmePTQ2018-009877 sponsored by the Spanish Ministry of Scienceand Innovation. The authors also express their gratitude to thesame Spanish Ministry for the financial support received underthe scope of the project CREEF (PID2019-108978RB-C32).
References
[1] Caratelli A, Meda A, Rinaldi Z, Romualdi P. Structural behaviour of precasttunnel segments in fiber reinforced concrete. Tunn Undergr Sp Technol2011;26:284–91.
[2] Caratelli A, Meda A, Rinaldi Z. Design according to MC2010 of a fibre-reinforced concrete tunnel in Monte Lirio, Panama. Struct Concr2012;13:166–73.
[3] Liao L, de la Fuente A, Cavalaro S, Aguado A. Design of FRC tunnel segmentsconsidering the ductility requirements of the Model Code 2010. Tunn UndergrSp Technol 2015;47:200–10. https://doi.org/10.1016/j.tust.2015.01.006.
[4] Di Carlo F, Meda A, Rinaldi Z. Design procedure for precast fibre-reinforcedconcrete segments in tunnel lining construction. Struct Concr2016;17:747–59.
[5] Dougherty M. A review of neural networks applied to transport. Transp ResPart C 1995;3:247–60. https://doi.org/10.1016/0968-090X(95)00009-8.
[6] Pujadas P, Blanco A, Cavalaro S, Aguado A. Synthetic fibres as the onlyreinforcement for flat suspended slabs: experimental investigation andnumerical simulation. Constr Build Mater 2014;57:92–104.
[7] Buratti N, Mazzotti C, Savoia M. Post-cracking behaviour of steel and macro-synthetic fibre-reinforced concretes. Constr Build Mater 2011;25:2713–22.
[8] Blanco A, Pujadas P, de la Fuente A, Cavalaro SHP, Aguado A. Influence of thetype of fibre on the structural response and design of FRC slabs. J Struct Eng2016;142:04016054. https://doi.org/10.1061/(ASCE)ST.1943-541X.0001515.
[9] de la Fuente A, Blanco A, Armengou J, Aguado A. Sustainability based-approach to determine the concrete type and reinforcement configuration ofTBM tunnels linings Case study: extension line to Barcelona Airport T1. TunnUndergr Sp Technol 2017;61:179–88. https://doi.org/10.1016/j.tust.2016.10.008.
[10] de la Fuente A, Pujadas P, Blanco A, Aguado A. Experiences in Barcelona withthe use of fibres in segmental linings. Tunn Undergr Sp Technol2012;27:60–71.
[11] Blanco A, Pujadas P, de la Fuente A, Cavalaro S, Aguado A. Application ofconstitutive models in European codes to RC–FRC. Constr Build Mater2013;40:246–59. https://doi.org/10.1016/j.conbuildmat.2012.09.096.
[12] de Montaignac R, Massicotte B, Charron J-P, Nour A. Design of SFRC structuralelements: postcracking tensile strength measurement. Mater Struct 2012;45(4):609622.
[13] Parmentier B, Vandewalle L, Van Rickstal F. Dispersion of the mechanicalproperties of FRC investigated by different bending tests. In: Proc. of the FibSymposium ‘‘Tailor Made Concrete Structures’’, 1922 May; 2008. Amsterdam,Netherlands, p. 507512.
[14] Molins C, Aguado A, Saludes S. Double Punch Test to control the energydissipation in tension of FRC (Barcelona test). Mater Struct 2009;42:415–25.
[15] Galeote E, Blanco A, Cavalaro SHP, de la Fuente A. Correlation between theBarcelona test and the bending test in fibre reinforced concrete. Constr BuildMater 2017;152:529–38. https://doi.org/10.1016/j.conbuildmat.2017.07.028.
[16] Martinelli P, Colombo M, Pujadas P, de la Fuente A, Cavalaro S, di Prisco M.Characterization tests for predicting the mechanical performance of SFRCfloors: identification of fibre distribution and orientation effects. Mater Struct2021;54(1):3.
[17] Martinelli P, Colombo M, de la Fuente A, Cavalaro S, Pujadas P, di Prisco M.Characterization tests for predicting the mechanical performance of SFRCfloors: design considerations. Mater Struct 2021;54(1):2.
[18] Abuodeh OR, Abdalla JA, Hawileh RA. Prediction of shear strength andbehavior of RC beams strengthened with externally bonded FRP sheets usingmachine learning techniques. Compos Struct 2020;234:111698.
[19] Abuodeh OR, Abdalla JA, Hawileh RA. Assessment of compressive strength ofUltra-high Performance Concrete using deep machine learning techniques.Appl Soft Comput 2020;95:106552.
[20] Solhmirzaei R, Salehi H, Kodur V, Naser MZ. Machine learning framework forpredicting failure mode and shear capacity of ultra high performanceconcrete beams. Eng Struct 2020;224:111221.
[21] LeCun Y, Bengio Y, Hinton G. Deep learning. Nature 2015;521:436–44.[22] Goodfellow I, Bengio Y, Courville A. Deep learning (adaptive computation and
machine learning series). Cambridge, MA, USA: MIT Press; 2016. p. 267–309.
15
[23] Aggarwal CC. Neural networks and deep learning: a textbook. 1st ed. Cham,Switzerland: Springer; 2018. p. 53–103.
[24] Kang MC, Yoo DY, Gupta R. Machine learning-based prediction forcompressive and flexural strengths of steel fiber-reinforced concrete. ConstrBuild Mater 2021;266:. https://doi.org/10.1016/j.conbuildmat.2020.121117121117.
[25] Sarveghadi M, Gandomi AH, Bolandi H, Alavi AH. Development of predictionmodels for shear strength of SFRCB using a machine learning approach.Neural Comput Appl 2019;31(7):2085–94.
[26] Olalusi OB, Awoyera PO. Shear capacity prediction of slender reinforcedconcrete structures with steel fibers using machine learning. Eng Struct2021;227:111470.
[27] Behnood A, Verian KP, Gharehveran MM. Evaluation of the splitting tensilestrength in plain and steel fiber-reinforced concrete based on thecompressive strength. Constr Build Mater 2015;98:519–29.
[28] Lu S, Koopialipoor M, Asteris PG, Bahri M, Armaghani DJ. A novel featureselection approach based on tree models for evaluating the punching shearcapacity of steel fiber-reinforced concrete flat slabs. Materials 2020;13(17):3902.
[29] Huang Y, Zhang J, Ann FT, Ma G. Intelligent mixture design of steel fibrereinforced concrete using a support vector regression and firefly algorithmbased multi-objective optimization model. Constr Build Mater2020;260:120457.
[30] Abambres M, Lantsoght Eva Ol. ANN-based shear capacity of steel fiber-reinforced concrete beams without stirrups. Fibers 2019:7(10):88.
[31] Adhikary BB, Mutsuyoshi H. Prediction of shear strength of steel fiber RCbeams using neural networks. Constr Build Mater 2006;20(9):801–11.
[32] Altun F, Kisi Ö, Aydin K. Predicting the compressive strength of steel fiberadded lightweight concrete using neural network. Comput Mater Sci 2008;42(2):259–65.
[33] Tavakoli HR, Omran OL, Shiade MF, Kutanei SS. Prediction of combined effectsof fibers and nanosilica on the mechanical properties of self-compactingconcrete using artificial neural network. Lat Am J Solids Stru 2014;11(11):1906–23.
[34] Tavakoli HR, Omran OL, Kutanei SS, Shiade MF. Prediction of energyabsorption capability in fiber reinforced self-compacting concretecontaining nano-silica particles using artificial neural network. Lat Am JSolids Stru 2014;11(6):966–79.
[35] Qu D, Cai X, Chang W. Evaluating the effects of steel fibers on mechanicalproperties of ultra-high performance concrete using artificial neuralnetworks. Appl Sci 2018;8(7):1120.
[36] Sultana N, Hossain SMZ, Alam MdS, Al Abtah MA. Soft computing approachesfor comparative prediction of the mechanical properties of jute fiberreinforced concrete. Adv Eng Softw 2020;149:102887.
[37] Ahmadi M, Kheyroddin A, Dalvand A, Kioumarsi M. New empirical approachfor determining nominal shear capacity of steel fiber reinforced concretebeams. Constr Build Mater 2020;234:117293.
[38] Mashhadban H, Kutanaei SS, Sayarinejad MA. Prediction and modeling ofmechanical properties in fiber reinforced self-compacting concrete usingparticle swarm optimization algorithm and artificial neural network. ConstrBuild Mater 2016;119:277–87.
[39] Uysal M, Tanyildizi H. Estimation of compressive strength of self compactingconcrete containing polypropylene fiber and mineral additives exposed tohigh temperature using artificial neural network. Constr Build Mater 2012;27(1):404–14.
[40] Ashrafi HR, Jalal M, Garmsiri K. Prediction of load–displacement curve ofconcrete reinforced by composite fibers (steel and polymeric) using artificialneural network. Expert Syst Appl 2010;37(12):7663–8.
[41] Nili M, Azarioon A, Danesh A, Dehimi A. Experimental study and modeling offiber volume effects on frost resistance of fiber reinforced concrete. Int J CivEng 2018;16(3):263–72.
[42] Sharifi Y, Moghbeli A. Shear capacity assessment of steel fiber reinforcedconcrete beams using artificial neural network. Innov Infrastruct Solut2021;6(2):1–19.
[43] Hodhod H, Abdeen MAM. Simulation and prediction for the effect of naturaland steel fibers on the performance of concrete using experimental analysesand artificial neural networks numerical modeling. KSCE J Civ Eng 2011;15(8):1373–80.
[44] Liu J-C, Zhang Z. Neural network models to predict explosive spalling of PPfiber reinforced concrete under heating. J Build Eng 2020;32:101472.
[45] Yaseen ZM, Tran MT, Kim S, Bakhshpoori T, Deo RC. Shear strength predictionof steel fiber reinforced concrete beam using hybrid intelligence models: anew approach. Eng Struct 2018;177:244–55.
[46] Hossain KMA, Gladson LR, Anwar MS. Modeling shear strength of medium-toultra-high-strength steel fiber-reinforced concrete beams using artificialneural network. Neural Comput Appl 2017;28(1):1119–30.
[47] Keshtegar B, Bagheri M, Yaseen ZM. Shear strength of steel fiber-unconfinedreinforced concrete beam simulation: application of novel intelligent model.Compos Struct 2019;212:230–42.
[48] Sangeetha P, Shanmugapriya M. Artificial neural network applications in fiberreinforced concrete. J Phys: Conf Ser IOP Publ 2020:012113.
[49] Chaabene WB, Nehdi ML. Novel soft computing hybrid model for predictingshear strength and failure mode of SFRC beams with superior accuracy.Compos Part C: Open Access 2020;3:100070.

T. Ikumi, E. Galeote, P. Pujadas et al. Computers and Structures 256 (2021) 106640
[50] Haripriya S, Khan MI, Swetha D, Alok G, Bhaskar B, Kumar PS, Kumar TP.Prediction of compressive strength with the variation of steel fiber in theconcrete by using ANN. IOP Conf Ser: Mater Sci Eng IOP Publ 2020:012035.
[51] Paul SC, Panda B, Liu J, Zhu H, Kumar H, Bordoloi S, et al. Assessment offlexural and splitting strength of fiber-reinforced concrete using artificialintelligence. Adv Civ Eng Mater 2019;8(1):385–99.
[52] Mahmoud TE, Elnady A, Elkafrawy M, Abdeltawab S. Prediction of shearbehavior of fiber reinforced concrete beams using artificial neural networks. JInt Soc Sci Eng 2019;1(1):13–24.
[53] Al-Musawy AA. Determination of shear strength of steel fiber RC beams:application of data-intelligence models. Front Struct Civil Eng 2019;13(3):667–73.
[54] Rahman J, Ahmed KS, Khan NI, Islam K, Magalathu S. Data-driven shearstrength prediction of steel fiber reinforced concrete beams using machinelearning approach. Eng Struct 2021;233:111743.
[55] Xu QS, Liang YZ. Monte Carlo cross validation. Chemom Intell Lab Syst2001;56:1–11.
[56] di Prisco M, Plizzari G, Vandewalle L. Fibre reinforced concrete: new designperspectives. Mater Struct 2009;42:1261–81.
[57] Conforti A, Minelli F, Plizzari GA, Tiberti G. Comparing test methods for themechanical characterization of fibre reinforced concrete. Struct Concr2018;19:656–69.
[58] Pujadas P, Blanco A, Cavalaro S, de la Fuente A, Aguado A. New analyticalmodel to generalize the Barcelona Test using axial displacement. J Civ EngManag 2013;19:259–71. https://doi.org/10.3846/13923730.2012.756425.
[59] Pujadas P, Blanco A, Cavalaro SHP, de la Fuente A, Aguado A. Multidirectionaldouble punch test to assess the post-cracking behaviour and fibre orientationof FRC. Constr Build Mater 2014;58:214–24.
[60] Blanco A, Pujadas P, Cavalaro S, de la Fuente A, Aguado A. Constitutive modelfor fibre reinforced concrete based on the Barcelona test. Cem Concr Compos2014;53:327–40.
[61] Carmona S, Molins C, Aguado A. Correlation between bending test andBarcelona tests to determine FRC properties. Constr Build Mater2018;181:673–86.
[62] Carmona S, Aguado A, Molins C. Generalization of the Barcelona test for thetoughness control of FRC. Mater Struct 2012;45:1053–69.
[63] Segura-Castillo L, Cavalaro SHP, Goodier C, Aguado A, Austin S. Fibredistribution and tensile response anisotropy in sprayed fibre reinforcedconcrete. Mater Struct 2018;51:29. https://doi.org/10.1617/s11527-018-1156-5.
[64] Pujadas P, Blanco A, Cavalaro S, de la Fuente A, Aguado A. Fibre distribution inmacro-synthetic fibre reinforced concrete slab-panels. Constr Build Mater2014;64:496–503. https://doi.org/10.1016/j.conbuildmat.2014.04.067.
[65] Choumanidis D, Badogiannis E, Nomikos P, Sofianos A. Barcelona test for theevaluation of the mechanical properties of single and hybrid FRC, exposed toelevated temperature. Constr Build Mater 2017;138:296–305.
[66] Liao L, de la Fuente A, Cavalaro S, Aguado A. Design procedure andexperimental study on fibre reinforced concrete segmental rings for verticalshafts. Mater Des 2016;92:590–601. https://doi.org/10.1016/j.matdes.2015.12.061.
[67] Liu X, Yan M, Galobardes I, Sikora K. Assessing the potential of functionallygraded concrete using fibre reinforced and recycled aggregate concrete.Constr Build Mater 2018;171:793–801. https://doi.org/10.1016/j.conbuildmat.2018.03.202.
[68] Galobardes I, Silva CL, Figueiredo A, Cavalaro SHP, Goodier C. Alternativequality control of steel fibre reinforced sprayed concrete (SFRSC). Constr BuildMater 2019;223:1008–15. https://doi.org/10.1016/j.conbuildmat.2019.08.003.
[69] Cavalaro SHP, Aguado A. Intrinsic scatter of FRC: an alternative philosophy toestimate characteristic values. Mater Struct 2015;48:3537–55.
[70] Blum A, Langley P. Selection of relevant features and examples in machinelearning. Artif Intell 1997;97(1–2):245–71.
[71] Koller D, Sahami M. Toward optimal feature selection. In: 13th InternationalConference on Machine Learning; 1996, p. 284–92.
[72] Guyon I, Elisseeff A. An introduction to variable and feature selection. J MachLearn Res 2003;3:1157–82.
[73] Gnana Sheela K, Deepa SN. Review on methods to fix number of hiddenneurons in neural networks. Math Probl Eng 2013:425740.
[74] Nguyen D, Widrow B. Improving the learning speed of 2-layer neuralnetworks by choosing initial values of the adaptive weights. In: 1990 IJCNNinternational joint conference on neural networks; 1990, p. 21–6.
[75] Michels J, Christen R, Waldmann D. Experimental and numericalinvestigation on postcracking behavior of steel fibre reinforced concrete.Eng Fract Mech 2013;98:326–49. https://doi.org/10.1016/j.engfracmech.2012.11.004.
[76] Barros JAO. Post-cracking behaviour of steel fibre reinforced concrete. MaterStruct 2004;38:47–56. https://doi.org/10.1617/14058.
[77] Soutsos MN, Le TT, Lampropoulos AP. Flexural performance of fibre reinforcedconcrete made with steel and synthetic fibres. Constr Build Mater2012;36:704–10.
16
[78] Wu Z, Shi C, He W, Wu L. Effects of steel fibre content and shape onmechanical properties of ultra high performance concrete. Constr Build Mater2016;103:8–14.
[79] Yoo DY, Yoon YS, Banthia N. Flexural response of steel-fibre-reinforcedconcrete beams: effects of strength, fibre content, and strain-rate. Cem ConcrCompos 2015;64:84–92. https://doi.org/10.1016/j.cemconcomp.2015.10.001.
[80] Yoo DY, Kim S, Park GJ, Park JJ, Kim SW. Effects of fibre shape, aspect ratio, andvolume fraction on flexural behavior of ultra-high-performance fibre-reinforced cement composites. Compos Struct 2017;174:375–88.
[81] Yoo DY, Lee JH, Yoon YS. Effect of fibre content on mechanical and fractureproperties of ultra high performance fibre reinforced cementitiouscomposites. Compos Struct 2013;106:742–53. https://doi.org/10.1016/j.compstruct.2013.07.033.
[82] Abrishambaf A, Pimentel M, Nunes S. Influence of fibre orientation on thetensile behaviour of ultra-high performance fibre reinforced cementitiouscomposites. Cem Concr Res 2017;97:28–40. https://doi.org/10.1016/j.cemconres.2017.03.007.
[83] Zerbino R, Tobes JM, Bossio ME, Giaccio G. On the orientation of fibres instructural members fabricated with self compacting fibre reinforced concrete.Cem Concr Compos 2012;34:191–200. https://doi.org/10.1016/j.cemconcomp.2011.09.005.
[84] ZhouB,UchidaY. Influence of flowability, casting timeand formworkgeometryon fibre orientation and mechanical properties of UHPFRC. Cem Concr Res2017;95:164–77. https://doi.org/10.1016/j.cemconres.2017.02.017.
[85] Abrishambaf A, Barros J, Cunha FNM. Assessment of fibre orientation anddistribution in steel fibre reinforced self-compacting concrete panels. In: 8thRILEM Int Symp. Fibre Reinf. Concr. BEFIB 2012. p. 1–12.
[86] Lameiras R, Barros JAO, Azenha M. Influence of casting condition on theanisotropy of the fracture properties of Steel Fibre Reinforced Self-Compacting Concrete (SFRSCC). Cem Concr Compos 2015;59:60–76.
[87] Alberti MG, Enfedaque A, Gálvez JC, Agrawal V. Reliability of polyolefin fibrereinforced concrete beyond laboratory sizes and construction procedures.Compos Struct 2016;140:506–24. https://doi.org/10.1016/j.compstruct.2015.12.068.
[88] Bernard ES, Xu GG. Influence of fibre count on variability in post-crackperformance of fibre reinforced concrete. Mater Struct 2017;50:169.
[89] Simões T, Costa H, Dias-da-Costa D, Júlio E. Influence of fibres on themechanical behaviour of fibre reinforced concrete matrixes. Constr BuildMater 2017;137:548–56.
[90] Yoo DY, Park JJ, Kim SW. Fibre pullout behavior of HPFRCC: effects of matrixstrength and fibre type. Compos Struct 2017;174:263–76.
[91] Lawler JS, Zampini D, Shah SP. Microfibre and macrofibre hybrid fibre-reinforced concrete. J Mater Civ Eng 2005;17:595–604.
[92] Yoo DY, Banthia N, Kang ST, Yoon YS. Size effect in ultra-high-performanceconcrete beams. Eng Fract Mech 2016;157:86–106.
[93] Abu-Lebdeh T, Hamoush S, Heard W, Zornig B. Effect of matrix strength onpullout behavior of steel fibre reinforced very-high strength concretecomposites. Constr Build Mater 2011;25:39–46. https://doi.org/10.1016/j.conbuildmat.2010.06.059.
[94] Abdallah S, Fan M. Anchorage mechanisms of novel geometrical hooked-endsteel fibres. Mater Struct 2017;50:139. https://doi.org/10.1617/s11527-016-0991-5.
[95] Hossain AB, Weiss J. Assessing residual stress development and stressrelaxation in restrained concrete ring specimens. Cem Concr Compos2004;26:531–40.
[96] Nguyen DL, Kim DJ, Ryu GS, Koh KT. Size effect on flexural behavior of ultra-high-performance hybrid fibre-reinforced concrete. Compos Part B Eng2013;45:1104–16. https://doi.org/10.1016/j.compositesb.2012.07.012.
[97] Yoo DY, Banthia N, Yang JM, Yoon YS. Size effect in normal- and high-strengthamorphous metallic and steel fibre reinforced concrete beams. Constr BuildMater 2016;121:676–85. https://doi.org/10.1016/j.conbuildmat.2016.06.040.
[98] Galeote E, Blanco A, de la Fuente A. Design-oriented approach to determineFRC constitutive law parameters considering the size effect. Compos Struct2020;239:112036.
[99] Prisco M, Felicetti R, Lamperti MGL, Menotti G. On size effect in tension ofSFRC thin plates. In: Fram. - Fifth Int Conf Fract Mech Concr Concr Struct. p.1075–82.
[100] Alberti MG, Enfedaque A, Gálvez JC. Fracture mechanics of polyolefin fibrereinforced concrete: Study of the influence of the concrete properties, castingprocedures, the fibre length and specimen size. Eng Fract Mech2016;154:225–44.
[101] Yoo DY, Zi G, Kang ST, Yoon YS. Biaxial flexural behavior of ultra-high-performance fibre-reinforced concrete with different fibre lengths andplacement methods. Cem Concr Compos 2015;63:51–66.
[102] Tiberti G, Germano F, Mudadu A, Plizzari GA. An overview of the flexuralpost-cracking behavior of steel fibre reinforced concrete. Struct Concr2018;19:695–718.
[103] Yoo DY, Kang ST, Yoon YS. Effect of fibre length and placement method onflexural behavior, tension-softening curve, and fibre distributioncharacteristics of UHPFRC. Constr Build Mater 2014;64:67–81.


![A Simplified Model for Analysis of Unreinforced …all the possible failure modes in masonry such as tensile cracking, shear sliding, and diagonal tension cracking [1, 3, 12, 13],](https://static.fdocuments.net/doc/165x107/5e927f021b0bc068346f4a8c/a-simplified-model-for-analysis-of-unreinforced-all-the-possible-failure-modes-in.jpg)