NEURAL CONTROL OF MOVEMENT: ENGINEERING THE …€¦ · NEURAL CONTROL OF MOVEMENT: ENGINEERING THE...
23
NEURAL CONTROL OF MOVEMENT: ENGINEERING THE RHYTHMS OF THE BRAIN Madeleine Lowery School of Electrical and Electronic Engineering Centre for Biomedical Engineering University College Dublin
Transcript of NEURAL CONTROL OF MOVEMENT: ENGINEERING THE …€¦ · NEURAL CONTROL OF MOVEMENT: ENGINEERING THE...
NEURAL CONTROL OF MOVEMENT:
ENGINEERING THE RHYTHMS OF
THE BRAIN
Madeleine Lowery School of Electrical and Electronic Engineering
Centre for Biomedical Engineering
University College Dublin

2nd most common
neurological disorder
1-3 % of the population
over 65
7 million individuals
worldwide
Parkinson’s disease
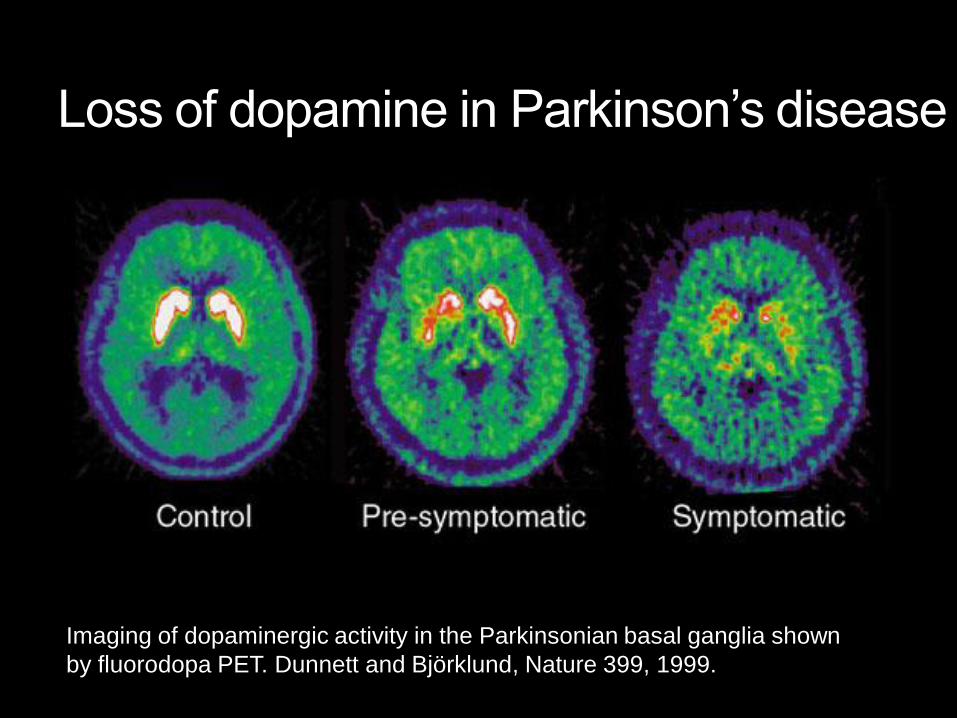
Loss of dopamine in Parkinson’s disease
Imaging of dopaminergic activity in the Parkinsonian basal ganglia shown
by fluorodopa PET. Dunnett and Björklund, Nature 399, 1999.
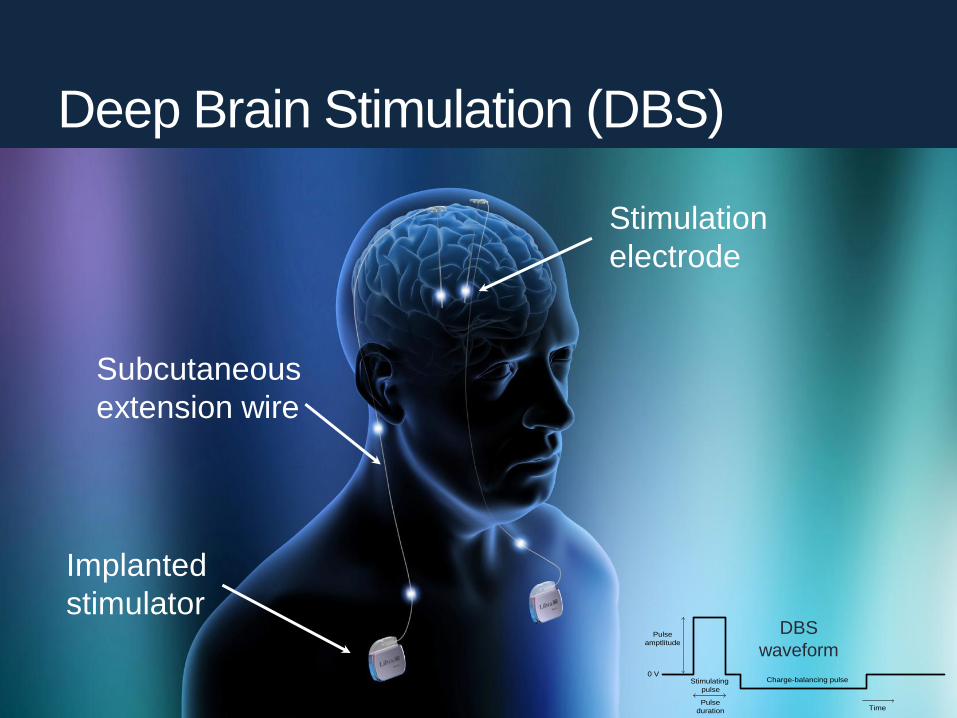
Deep Brain Stimulation (DBS)
Stimulation
electrode
Subcutaneous
extension wire
Implanted
stimulator
0 V
Pulse
duration
Pulse
amptlitude
Charge-balancing pulse
Time
Stimulating
pulse
DBS
waveform
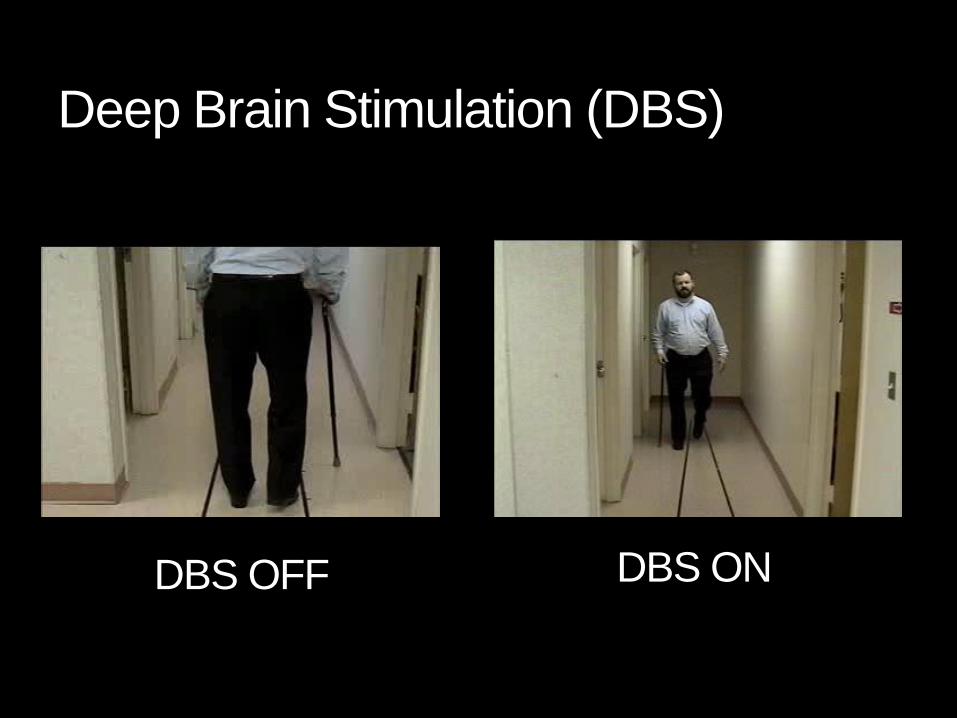
Deep Brain Stimulation (DBS)
DBS OFF DBS ON
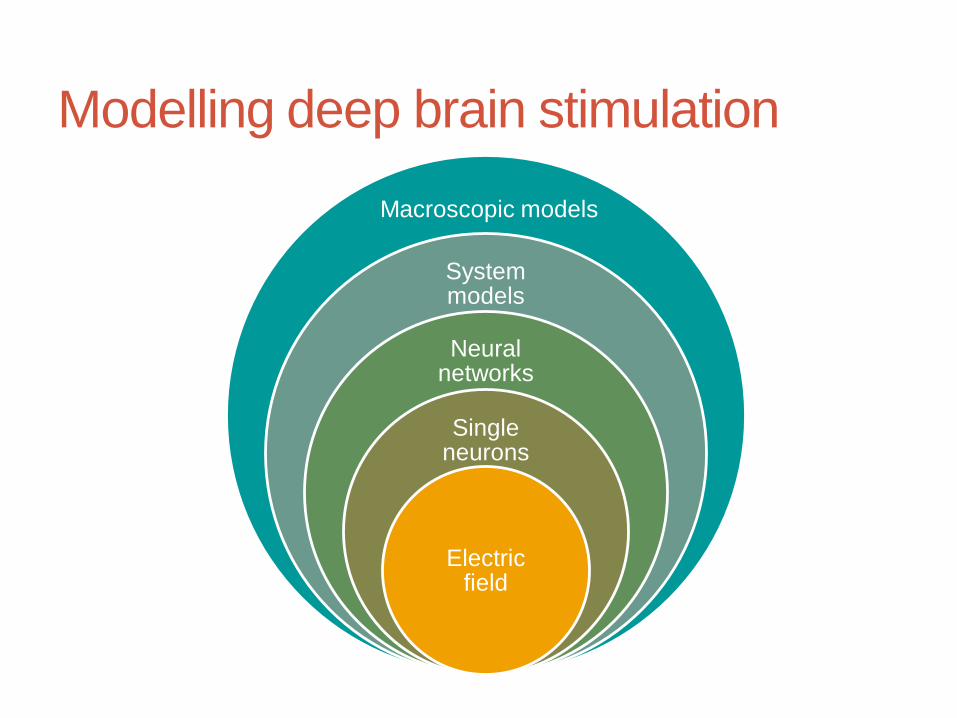
Modelling deep brain stimulation
System models
Neural networks
Single neurons
Electric field
Macroscopic models

Skull
Scalp
Grey and
white matter
brain tissue
Cerebrospinal
fluid
Electrode
Electric field effects
Nerves
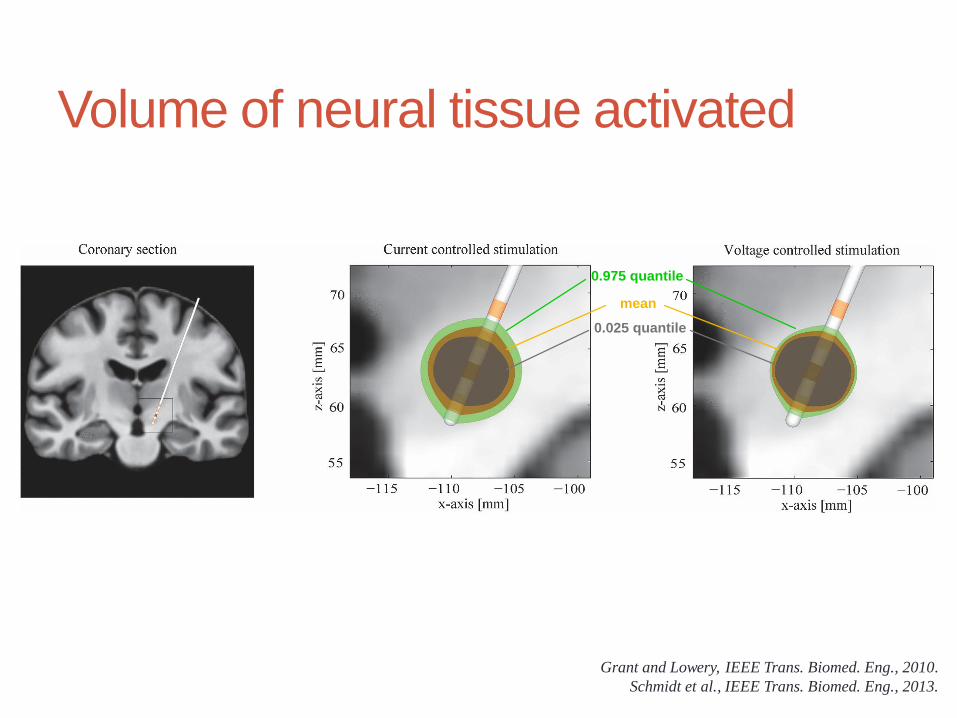
Volume of neural tissue activated
Grant and Lowery, IEEE Trans. Biomed. Eng., 2010.
Schmidt et al., IEEE Trans. Biomed. Eng., 2013.
0.975 quantile
0.025 quantile
mean
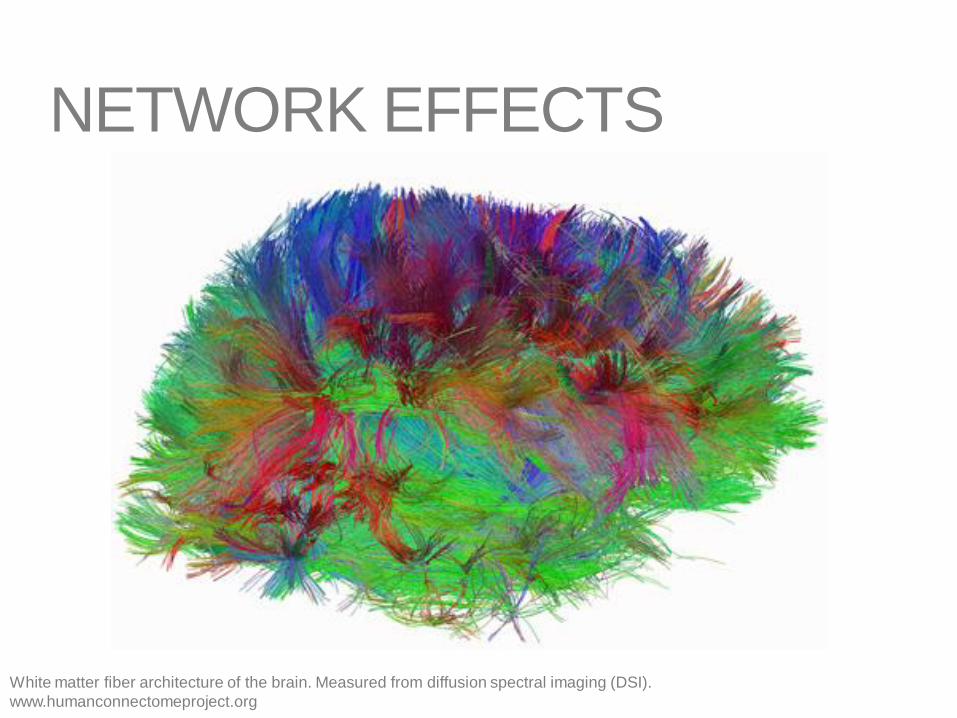
NETWORK EFFECTS
White matter fiber architecture of the brain. Measured from diffusion spectral imaging (DSI).
www.humanconnectomeproject.org
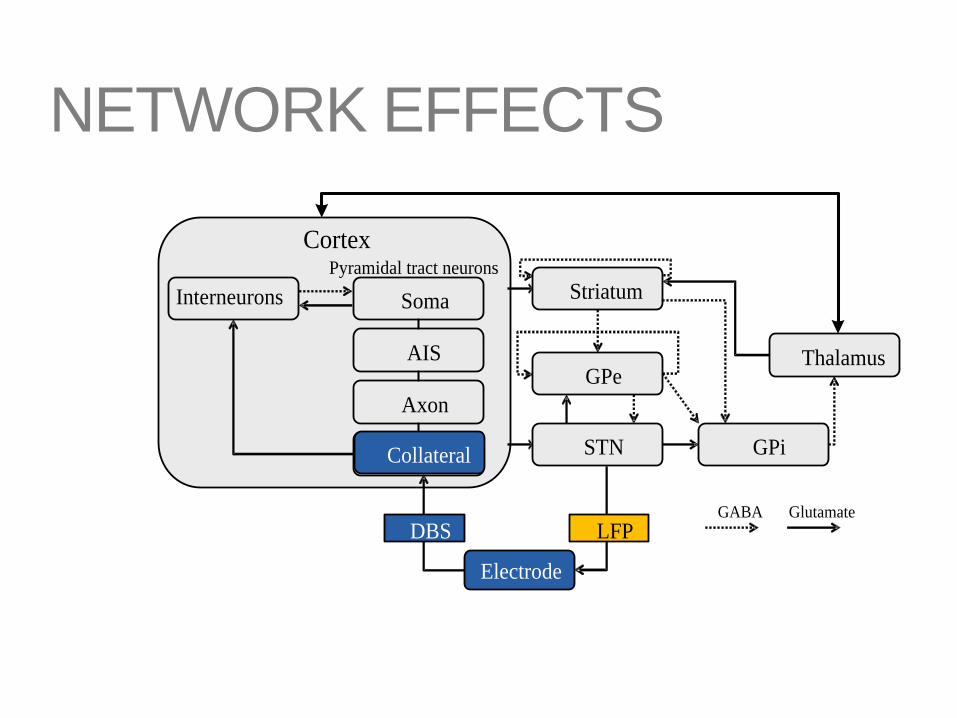
NETWORK EFFECTS
STN
GPe
Cortex
GPi
Thalamus
Striatum
GABA Glutamate
Collateral
Axon
AIS
SomaInterneurons
Pyramidal tract neurons
Collateral
Electrode
DBS LFP
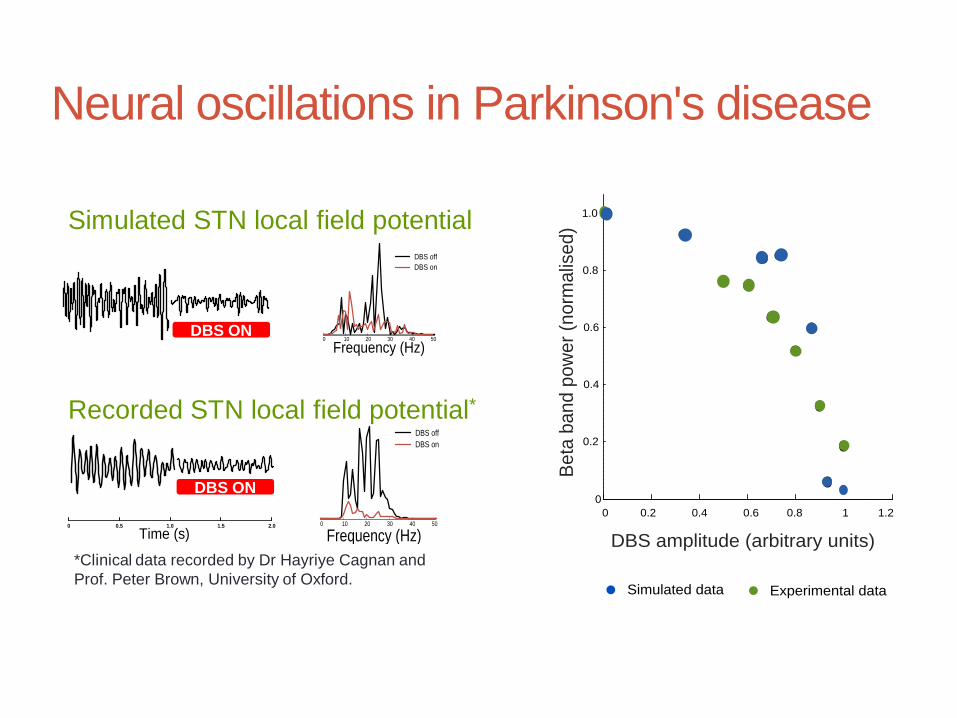
Neural oscillations in Parkinson's disease
*Clinical data recorded by Dr Hayriye Cagnan and
Prof. Peter Brown, University of Oxford.
0 10 20 30 40 50
DBS off
DBS on
Frequency (Hz)Time (s)0 0.5 1.0 1.5 2.0
Recorded STN local field potential*
Simulated STN local field potential
DBS ON 0 10 20 30 40 50
DBS off
DBS on
Frequency (Hz)
DBS ON
Be
ta b
an
d p
ow
er
(no
rma
lise
d)
0 0.2 0.4 0.6 0.8 1 1.2
0
0.2
0.4
0.6
0.8
1.0
DBS amplitude (arbitrary units)
Simulated data Experimental data
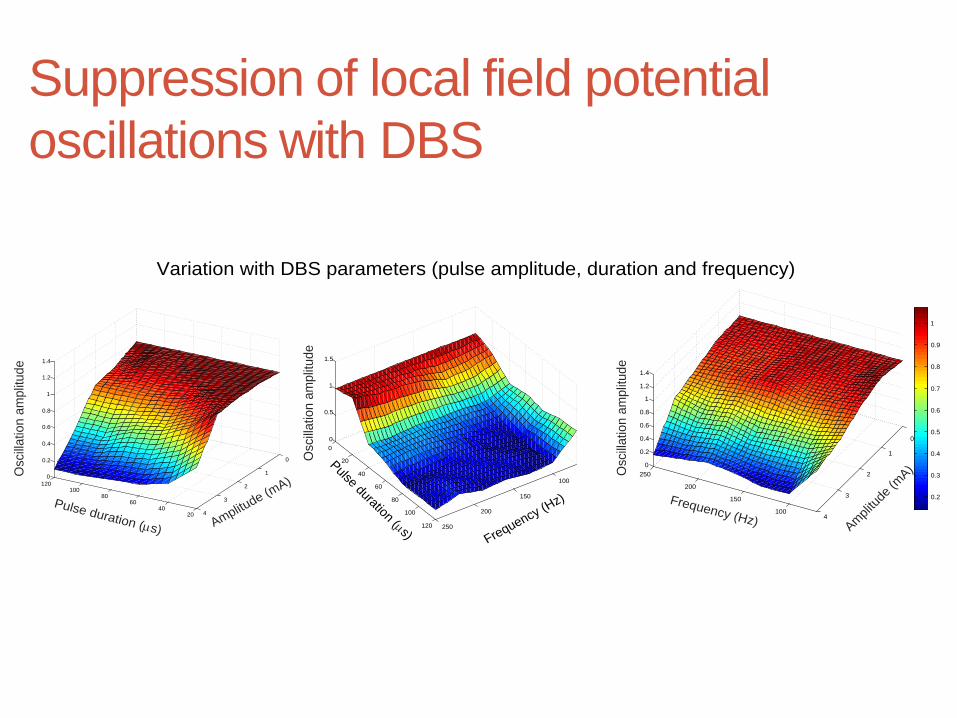
Suppression of local field potential
oscillations with DBS
2040
6080
100120
0
1
2
3
4
0
0.2
0.4
0.6
0.8
1
1.2
1.4
Amplitude (m
A)
Pulse duration (ms)
Oscill
atio
n a
mp
litu
de
100
150
200
250
0
20
40
60
80
100
120
0
0.5
1
1.5
Frequency (Hz)
Pulse duration (ms)
100
150
200
250
0
1
2
3
4
0
0.2
0.4
0.6
0.8
1
1.2
1.4
Ampl
itude
(mA)
Frequency (Hz)
0.2
0.3
0.4
0.5
0.6
0.7
0.8
0.9
1
Oscill
atio
n a
mp
litu
de
Oscill
atio
n a
mp
litu
de
Variation with DBS parameters (pulse amplitude, duration and frequency)
Suppression of low-frequency oscillations with high-frequency ‘dither’
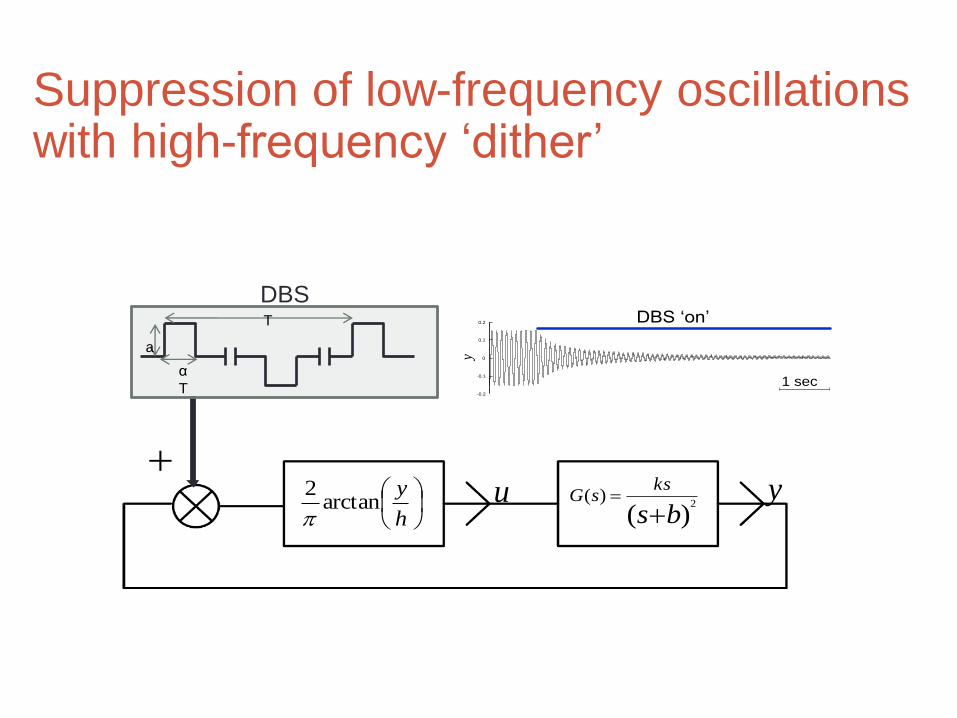
Suppression of low-frequency oscillations with high-frequency ‘dither’
h
yarctan
2
)(2
)(
bs
kssG
a
α
T
T
u y
-0.2
-0.1
0
0.1
0.2
1 sec
DBS ‘on’
y
DBS

Comparison with Clinical Data
1Clinical patient data from Benabid et al., The Lancet, 337:403 406, 1991.
Clinical data1 (measured limb tremor)
Model predictions
Comparison with clinical data
Davidson, et al., IEEE Trans. Biomed. Eng. (2014; 2015)
Clinical LFP data (recorded at DBS electrode)
Model prediction
0 100 200 3000
5
10
0 100 200 3000
5
10
0 100 200 3000
5
10
0 100 200 3000
5
10
Frequency of Stimulation (Hz)
Patient A Patient B
Patient C Patient D
DB
S a
mp
litu
de
fo
r tr
em
or
su
pp
ressio
n (
mA
)
0 1 2 30
0.2
0.4
0.6
0.8
1
0 1 2 3 4 50
0.2
0.4
0.6
0.8
1
0 1 2 30
0.2
0.4
0.6
0.8
1
0 1 2 3 4 50
0.2
0.4
0.6
0.8
1
Amplitude of stimulation (V)
Patient #1
R2= 0.959
Patient #3
R2= 0.783
Patient #2
R2= 0.687
Patient #4
R2= 0.987
Be
ta (
15
-30
Hz)
LF
P p
ow
er
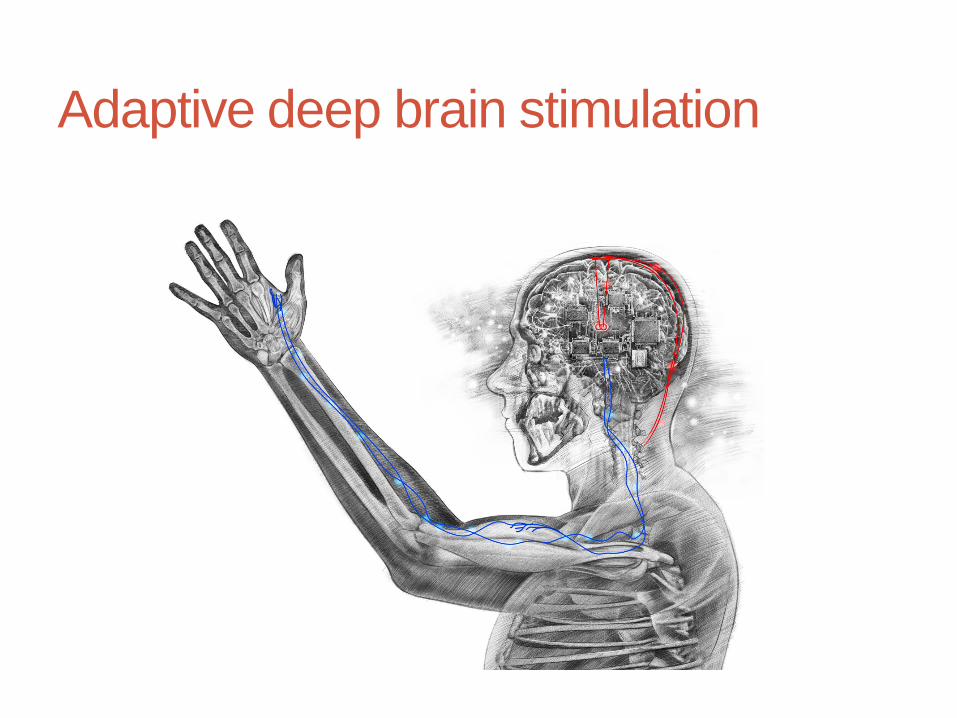
Adaptive deep brain stimulation
EMG signal
Muscle force
and tremor
Local field
potential
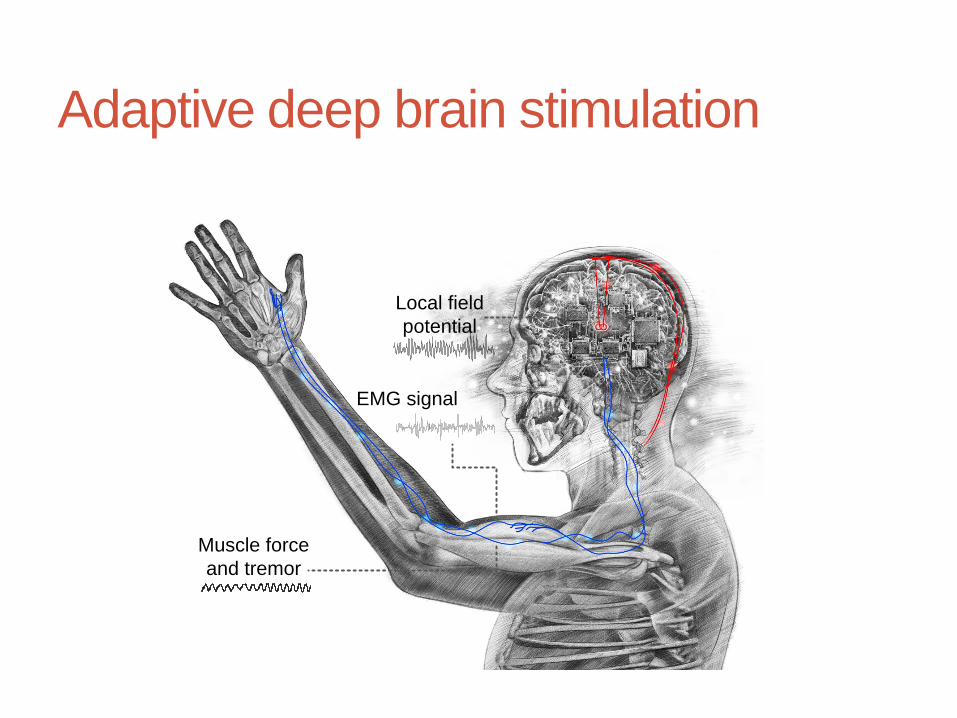
Adaptive deep brain stimulation
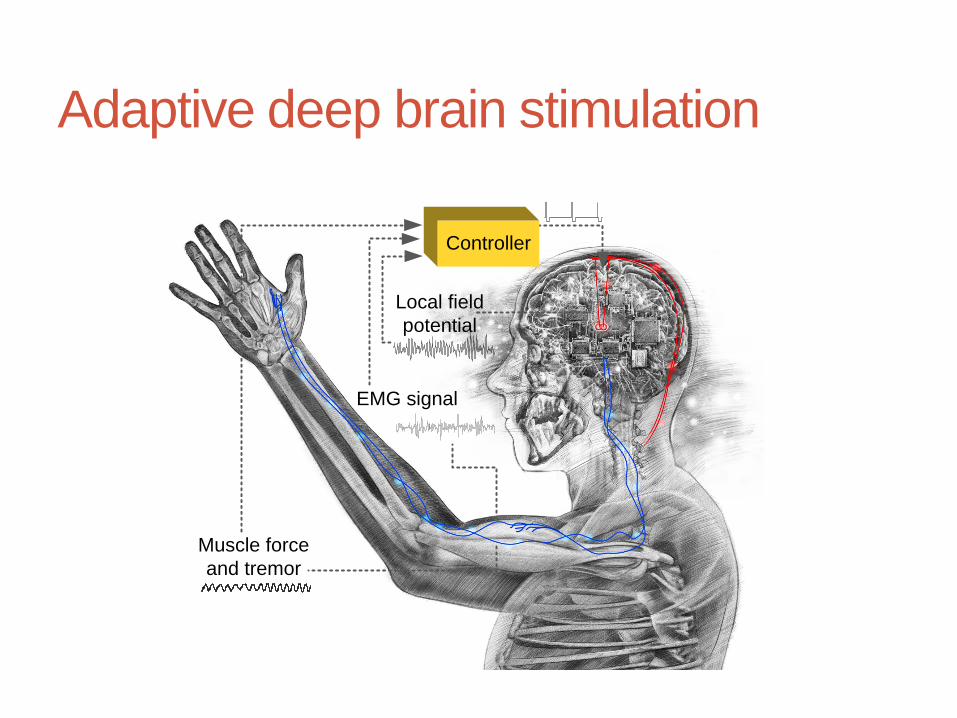
Local field
potential
EMG signal
Muscle force
and tremor
Controller
Adaptive deep brain stimulation
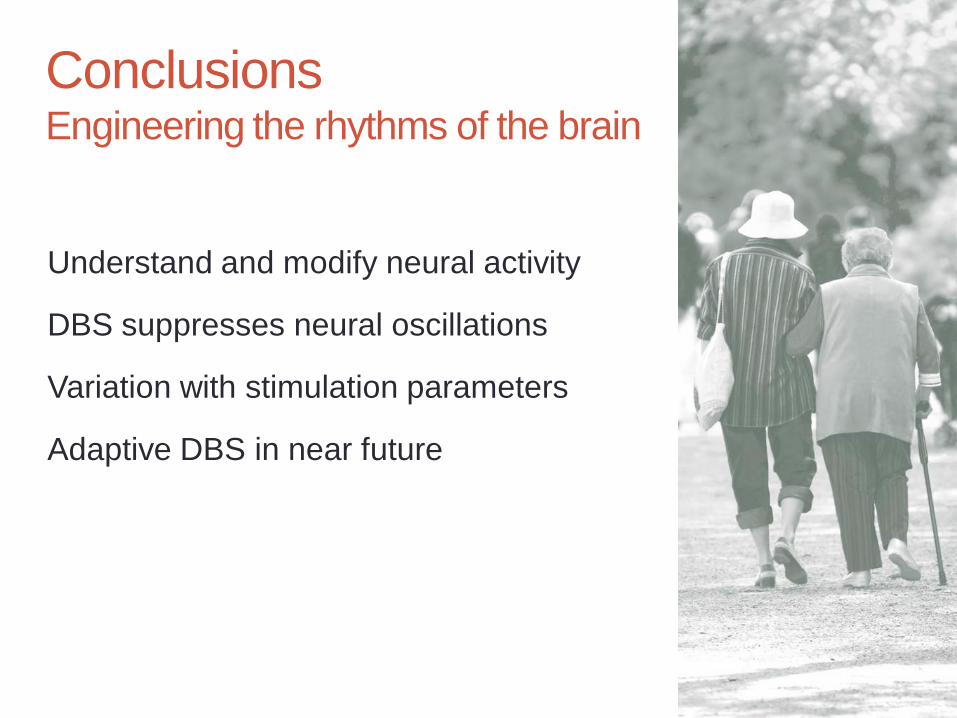
Conclusions Engineering the rhythms of the brain
Understand and modify neural activity
DBS suppresses neural oscillations
Variation with stimulation parameters
Adaptive DBS in near future
Acknowledgements
Collaborators
Dr Hayriye Cagnan and Prof. Peter Brown, University of Oxford.
Dr Christian Schmidt and Prof. Ursula Van Rienen, University of Rostock.
UCD Neuromuscular Systems and Neural Engineering Lab
Prof. Annraoi de Paor
Dr Peadar Grant
Dr Guiyeom Kang
Dr Clare Davidson
Eleanor Dunn
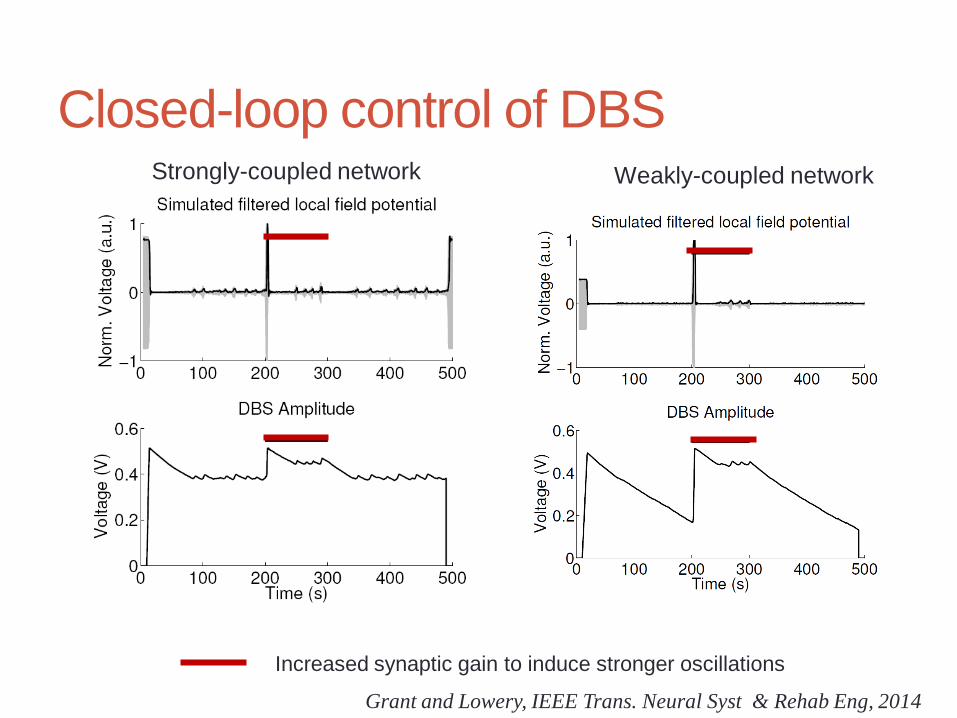
Closed-loop control of DBS Weakly-coupled network Strongly-coupled network
Increased synaptic gain to induce stronger oscillations
Grant and Lowery, IEEE Trans. Neural Syst & Rehab Eng, 2014
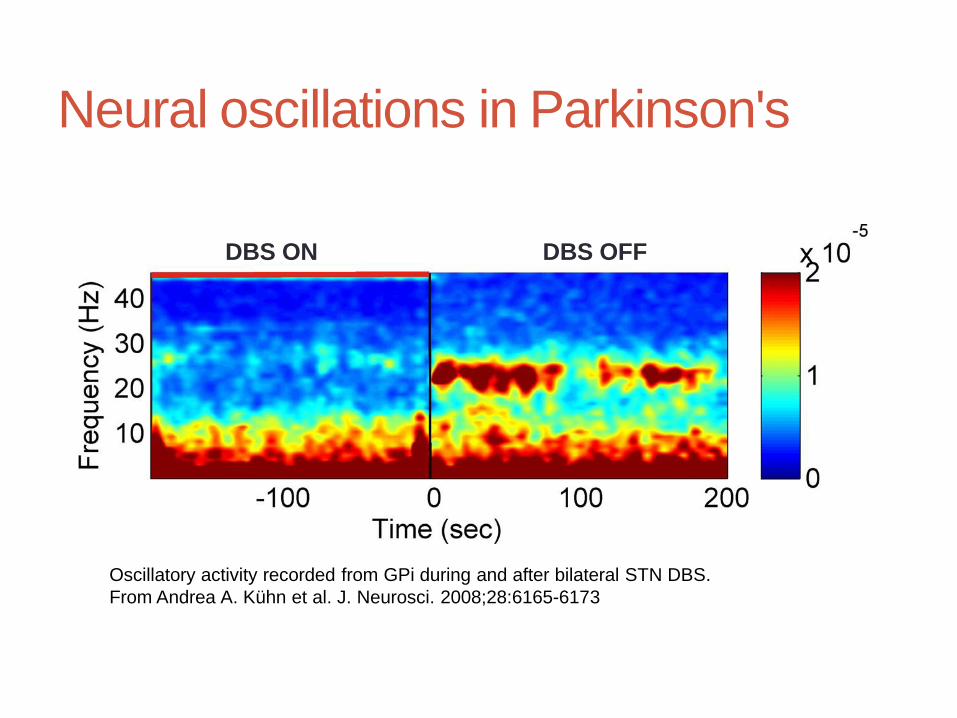
Neural oscillations in Parkinson's
Oscillatory activity recorded from GPi during and after bilateral STN DBS.
From Andrea A. Kühn et al. J. Neurosci. 2008;28:6165-6173
DBS ON DBS OFF
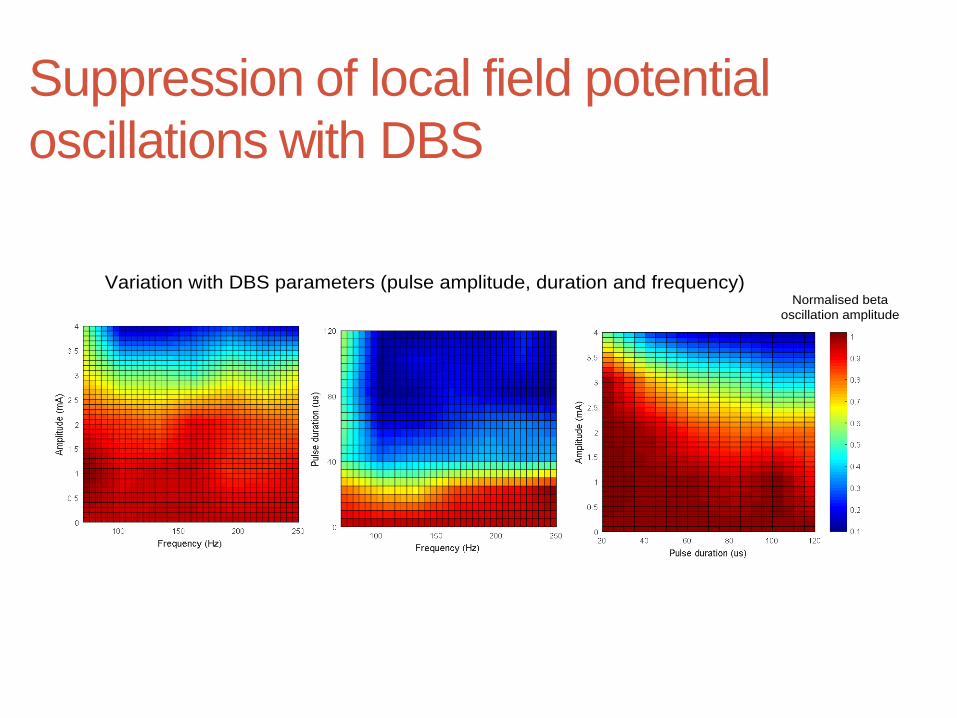
Suppression of local field potential
oscillations with DBS
Normalised beta
oscillation amplitude
Variation with DBS parameters (pulse amplitude, duration and frequency)