
Neural Circuits Mediating Voluntary and Involuntary...
66
Neural Circuits Mediating Voluntary and Involuntary Attention by Ayelet Nina Landau A dissertation submitted in partial satisfaction of the requirements for the degree of Doctor of Philosophy in Psychology in the The Graduate Division of the University of California, Berkeley Committee in charge: Professor Lynn C. Robertson, Chair Professor William Prinzmetal Professor Michael A. Silver Professor Richard Ivry Spring 2010
-
Upload
truongtram -
Category
Documents
-
view
227 -
download
1
Transcript of Neural Circuits Mediating Voluntary and Involuntary...

Neural Circuits Mediating Voluntary and Involuntary Attention
by
Ayelet Nina Landau
A dissertation submitted in partial satisfaction of the
requirements for the degree of
Doctor of Philosophy
in
Psychology
in the
The Graduate Division
of the
University of California, Berkeley
Committee in charge:
Professor Lynn C. Robertson, Chair
Professor William Prinzmetal
Professor Michael A. Silver
Professor Richard Ivry
Spring 2010
The dissertation of Ayelet Nina Landau is approved:
Chair ______________________________________________ Date _____________
______________________________________________ Date _____________
______________________________________________ Date _____________
______________________________________________ Date _____________
University of California, Berkeley
Spring 2010

Neural Circuits Mediating Voluntary and Involuntary Attention
© 2009
Ayelet N. Landau
1
Abstract
Neural circuits mediating voluntary and involuntary attention
by Ayelet Nina Landau
Doctor of Philosophy in Psychology
University of California, Berkeley
Chair: Lynn C. Robertson
Spatial attention is the capacity to prioritize part of the environment for processing over
other parts. It can be employed in an internally guided manner, advancing current behavioral
goals (i.e., voluntary spatial attention), or it can be captured by salient stimuli in the environment
(i.e., involuntary attention). This thesis presents a series of studies investigating neural indices of
voluntary and involuntary attention as well as aspects of neural circuits related to spatial
attention. The first study used electroencephalography (EEG) to provide evidence that sustained
spatial attention on a location generates increased coupling between the hemispheres and
acceleration of interhemispheric communication. In the second study, EEG was used to measure
indices of voluntary and involuntary attention. Using identical stimulus conditions in a spatial
cueing paradigm, we found a physiological marker for voluntary attention that is not present for
involuntary attention. In the final study we utilized fMRI coherency to measure network
dynamics mediating the two types of attention. We found that voluntary attention acts to reduce
coupling between regions engaged in spatial attention. In addition we find a hemispheric
asymmetry in degrees of coupling such that both types of attention produce greater coupling in
the right hemisphere compared to the left hemisphere. Together these studies developed indices
of voluntary and involuntary attention and begin to describe the physiological mechanisms that
mediate attention.

i

ii
Table of Contents

iii
List of Figures
iv
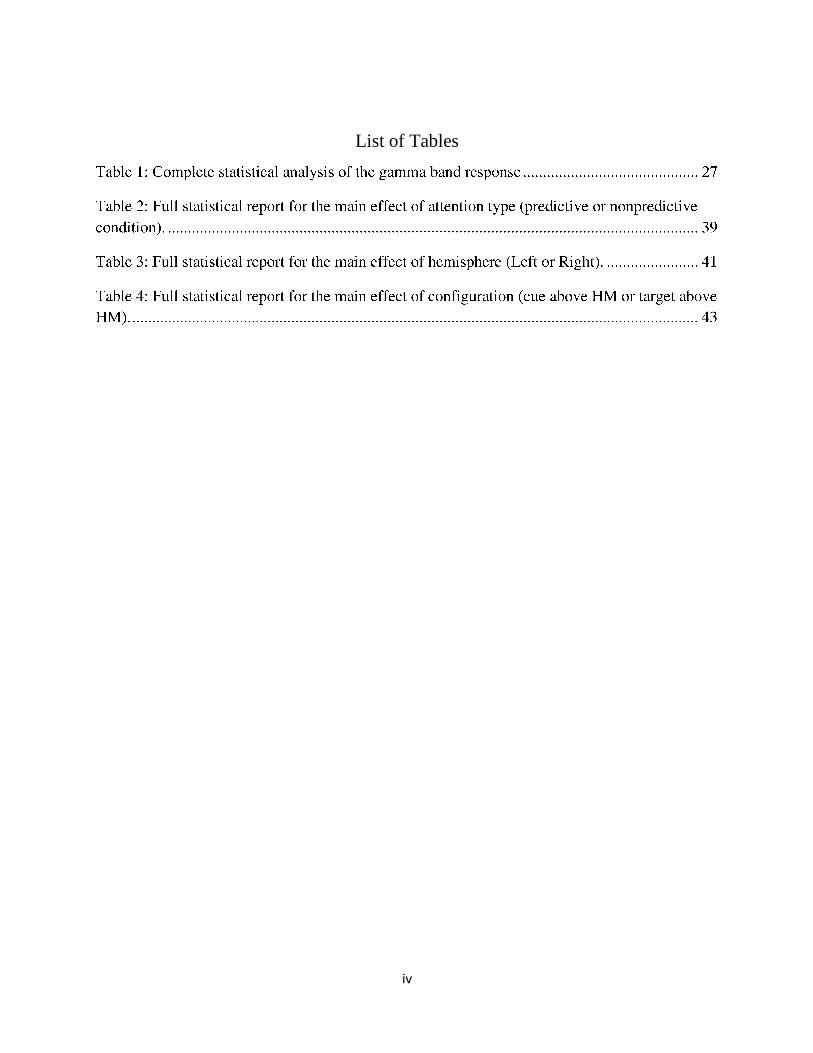
List of Tables

v
Acknowledgements
In the sciences some would argue that the dissertation as a document is a symbolic
milestone rather than a tome of unique content to be cited and read for prosperity. It marks the
completion of a considerable project however the content of this project will likely be most
referred to in its peer reviewed publication form. Nonetheless the one thing that a dissertation
allows its writer to do, which is unique and indispensable, is to pause in appreciation and
recognition of the people who supported this project and became important parts of ones life
during the years it took to complete it. There are not many venues that allow for this detailed
musing and I intend to use this opportunity to its fullest extent; to acknowledge the people who
accompanied me in this journey.
Professor Lynn Robertson, the committee chair, welcomed me to the program and
provided me with the resources and guidance throughout my grad career. Lynn has never ceased
to remind me that science should be about investigating the theoretical questions that most entice
me. I thank her for allowing me and encouraging me to pursue quests that concerned me most. It
was great honor and great fun to be part of her lab for the past years.
Professor Bill Prinzmetal was a close and constant presence throughout the different
stages of this project. In his person he taught me a deep and important lesson about life in
science. He demonstrated friendship, being a loyal but critical colleague, an enthusiastic
researcher, remembering to have fun and celebrate every stage of the long process of scientific
research. Bill never failed to recognize a learning opportunity and in that has also set an
important example to me. In addition, I would like to thank him for imparting on me his high and
entertaining standard in scientific presentation style.
Professor Michael Silver has provided me with resources and guidance in the magical
mysterious world of fMRI attention research. I thank him for opening the door to his lab, taking
the time to introduce me to new methods and ways of thinking about spatial attention. I also
thank him for imparting the (cautious) optimism and positive attitude during the ebbs and flows
of getting the science going.
I would like to thank Professor Rich Ivry for providing a challenging discussion
throughout the project, a critical reading of my work and for being an enthused collaborator. His
mentorship on projects, external to my mainstream research, was a breeze of fresh air.
I would also like to thank Professor Shlomo Bentin for being an active collaborator
during important transitions in my life.

vi
I thank Silver, Robertson, Prinzmetal Lab members and collaborators: Ariel Rokem,
Thomas Lauritzen, David Bressler, Rachel Denison and Catherina Gratton, Anna Kosovicheva,
Natalia Bilenko, Allie Yamanashi-Leib, Allison Connell, Ani Flevaris, Matt Baggott, Tom
VanVleet, Bryan Alvarez and Francesca Fortenbaugh, Lisa Aziz-Zadeh, Matt Cain -- Thank you
for enduring numerous practice talks. I know I will miss the balance of stimulating discussion
with uncompromising critique you have provided. I also had the great furtune of working with
extremely skilled and motivated research assistant: Nola Kelmfuss, Meriel Owen, Sarah Holtz,
Han Duong, Genevieve Klein, Cassandra LaBuef, Deena Elwan, Aleksey Zvinyatskovskiy
Katharina Volkskening, Karina Sakanaka, Cheryl Shirley and Lara Peirce.
I thank former members of the Robertson lab Alexandra List and Michael Esterman for
their friendship and collaboration. It was tremendously fun. I must add another thank you to
Ariel Rokem, for the great collaboration, for backpacking trips and mushroom picking strolls.
Those too were important breaks from the craft of PhDing.
I thank my family and those who became my family over the last few years: Avigail
Sachs, Miri Lavi-Neeman, Hagar Kotef, Sigalit Landau, Daniel Landau and Ruth Sonntag. A
very special thank you to Ludovica Labruna, for her close friendship. Your energy,
resourcefulness and caring are an inspiration and a source of courage to me.
I would like to mention my daughter Alia Engel who joined me for the very last push of
my graduate career. Thank you for making me take a walk in the fresh air while writing this
work. May you witness many exciting discoveries about the brain during your life time.
Last, the one person whose impact on these past years of graduate work is beyond
imagination -- Amir Engel. Thank you for being an inspiration, a gifted story teller and a caring
and loving partner to all adventures domestic or wild.

1
1. Introduction
When whales feed around midday off the northern California coast, the feast commonly
attracts many other species hoping that the large mammal may drop some goods off their lunch
table. Typically, if you were to seek the sights of the majestic whales, you would be advised to
follow the presence of birds hovering over the water as well as seals swimming close to the
surface. The birds, if you will, could serve as a spatial cue which, if carefully followed, may
allow you to luck out and catch a glimpse of a whales fluke as it traverses the water. Given your
heightened state of voluntary attention, you will be able to see that fluke even if it only appears
for a very short time and at a considerable distance. Alternatively, some whale watchers simply
stumble upon the glorious feast only to notice a whale‟s presence by its visible spout emerging
behind the boat‟s stern. The latter would certainly be a very salient event (with an extremely
salient odor) that would capture involuntary attention. This thesis presents a series of studies
investigating neural indices of voluntary and involuntary attention as captured by this example
well as aspects of neural circuits related to the two different types of spatial attention.
In the first study (Chapter 2), the case of sustained voluntary spatial attention will be
examined, focusing on attentional modulation of interhemispheric coordination. The
investigation of attention circuits in the brain has traditionally focused on a “fronto-parietal
network” for spatial attention, but only brief reference has been made regarding how these
networks share information between the two hemispheres under different attention states
(Buschman and Miller, 2007a; Buschman and Miller, 2007b; Corbetta and Shulman, 2002;
Esterman et al., 2008; Serences and Yantis, 2007). In this study, electrophysiological evidence is
provided demonstrating that spatial attention to a lateralized stimulus integrates neural responses
between the two hemispheres through stronger neural coherence and acceleration of callosal
transfer time.
In Chapters 3 and 4, I will turn to the distinction between voluntary and involuntary
attention. Recently, Prinzmetal, McCool, and Park (Prinzmetal et al., 2005) provided a
theoretical framework suggesting that voluntary and involuntary attention are separate systems
with unique and dissociated consequences for human performance. Specifically, Prinzmetal and
colleagues used the Posner cueing task (Posner, 1978, 1980) to collect evidence supporting this
framework. In this cueing paradigm. participants are required to respond to lateralized targets
while fixating at the center of a display (attention without eye movements, or covert attention).
Before a target appears on the screen, a peripheral cue (e.g. a rectangle on one side of the
display) can appear either in the same location as the subsequent target (cued trials) or in a
different location as the subsequent target (uncued trials).

2
Using different versions of this task, Prinzmetal et al. (2005) designed experiments
measuring either RT or accuracy effects. In addition, using this paradigm allowed the
manipulation of voluntary and involuntary attention. For involuntary attention, the cue location
was random with respect to the target location (50% cued trials), while for voluntary attention
the cue location was informative with respect to target location (e.g., 80% cued trials). Using this
design, they found that while both voluntary and involuntary attention accelerate response speed
in trials for which the target appeared in the cued location, only voluntary attention enhanced the
accuracy of performance in the cued location compared to the uncued location. From these
findings, a theoretical distinction was made between perceptual enhancement, which is achieved
by voluntary attention, and response selection, which is the consequence of involuntary capture
of attention. This theoretical framework generates clear predictions in terms of neural
manifestations of voluntary and involuntary attention. Conveniently, the use of peripheral cues
that are identical for both voluntary and involuntary attention allow for a very clean comparison
of the two types of attention when using physiological measures since only the proportion of trial
types, which are otherwise identical, governs which type of attention is probed.
One of the predictions that follows the theoretical separation of voluntary and involuntary
attention is that the two types of attention will present with different physiological markers, even
if the stimulus conditions are identical. Chapter 3 provides confirmation of this prediction
(Landau et al., 2007). Electroencephalograms were recorded in a cueing paradigm for cue and
target onsets, and a spectral analysis was performed on the data. Responses in the gamma band
(30 - 50 Hz) propagating from anterior central to posterior lateral scalp sites were linked to
voluntary shifts of attention but not to the involuntary capture of attention. The presence of
increased gamma responses for the voluntary allocation of attention, and its absence in cases of
involuntary capture, suggest that the neural mechanisms governing these two types of attention
are different. Despite the confirmatory evidence provided by EEG for the distinction between
voluntary and involuntary attention, these results leave the specific dynamics producing these
distinct physiological patterns unknown. A step towards unraveling those dynamics is presented
in Chapter 4.
Chapter 4 visits the possibility of characterizing voluntary and involuntary attention
networks in the brain. The challenge of brain networks for directing attention was introduced to
the field in a seminal review by Marcel Mesulam almost three decades ago (Mesulam, 1981).
Mesulam outlined "the network approach" as an intermediary stance between two polar views on
the organization of functions in the brain. On the one hand, the equipotentiality view holds that
functions are distributed over the entire brain. On the other hand, the centrist view asserts that
brain functions are localized in dedicated and segregated centers. While the details of the
network approach presented by Mesulam might not be of particular interest here, the fact that
such an approach was conceived in the context of the organization of attention in the brain is no
surprise. One could argue that it is precisely the challenge presented by the curious dissociation
of attention from any well-characterized system or modality which gives rise to this idea. In

3
order to support this view, Mesulam and others (Mesulam, 1981; Posner and Petersen, 1990)
relentlessly tried to put the pieces of the "attention network" puzzle together, identifying possible
components of the system as well as potential interactions among regions that bear relevance to
intact attentional performance. In order to do so, evidence from animal models, human patient
work, and human electroencephalography converged on a preliminary notion of the relevant
neural substrates and consequences of attention.
The development of new methods to measure and perturb brain activity in humans
presents exciting new opportunities to obtain evidence on how the brain mediates allocation of
attention. Functional magnetic resonance imaging (fMRI) and positron emission tomography
(PET) allow measurement of the responses of brain regions that are active during an attention
task. Neuroimaging studies of attention (Corbetta and Shulman, 2002; Kincade, 2005; Mayer et
al., 2004; Posner, 1980; Serences and Yantis, 2006; Serences and Yantis, 2007) adopted the
previously coined term "network" in their investigations of attention in the brain. Importantly
however, with few exceptions (Bressler et al., 2008; Lauritzen et al., in press, 2009), most of
these studies did not examine the circuitry per se or address questions of coupling between
regions directly but merely inferred those from patterns of co-activation during attention tasks
(Corbetta and Shulman, 2002; Fan et al., 2007; Kincade, 2005; Mayer et al., 2004). It is
important to realize that the co-occurrence of neural responses in different parts of the brain
during an attention task does not indicate anything about the degree of coupling between the
signals measured in different parts of the brain.
Transcranial magnetic stimulation (TMS) is another method that has been utilized in the
investigation of spatial attention. When stimulating a brain region with TMS, its role in intact
performance can be inferred by virtue of the behaviors disrupted by the stimulation. In addition,
this method allows the identification of critical times in the processing stream during which a
targeted region in the brain is necessary. Therefore, researchers using this method can reveal
which regions and when those regions are indispensable for proper attentional allocation.
Recently, several studies have investigated the unique roles of FEF and posterior parietal cortices
in visual spatial attention using this approach (Chambers and Mattingley, 2005; Ellison et al.,
2007; Grosbras and Paus, 2003; Grosbras and Paus, 2002; Koch et al., 2005; Muggleton et al.,
2003; Muggleton et al., 2006; O'Shea and Walsh, 2004; Pourtois et al., 2001; Silvanto et al.,
2006). In addition to providing converging evidence about the engagement of these regions in
processes of spatial attention, the use of TMS allows causal inferences about their role in the
processes under investigation. Additional information regarding network dynamics is provided
by studies performing concurrent TMS and fMRI. This novel approach allows a measure of
long-range effects of stimulation on a given region (Ruff et al., 2008; Ruff et al., 2006). For
instance, using this approach, Ruff et al. (2006, 2008) were able to measure distinct attention
effects in extrastriate cortices following FEF stimulation compared to IPS stimulation. While the
effects of FEF stimulation on attentional modulation in visual cortex were independent of the
visual inputs, the pattern was different when IPS TMS was performed. The effects of IPS
4
stimulation on attentional modulation in the visual cortex depended on the presence of a visual
stimulus. Although TMS has proven to be an important method, it has a number of limitations.
First, the spatial extent of the stimulation is coarse, limiting it to the examination of larger
regions and regions that are positioned with sufficient distance from other parts of a postulated
network. Second, stimulation can only be applied to very few brain regions at a time, limiting the
ability to investigate different parts of a network within one study and within one subject. Last,
performance on a cognitive task might be the result of multiple regions working together. Some
of these regions might be unique in their contribution, while others might be seemingly
redundant but nonetheless active. The latter form of contribution to performance would go
undetected using TMS and would result in an incomplete depiction of the network (Chambers
and Mattingley, 2005).
The recent development of multivariate analysis methods of fMRI data circumvent some
of these shortcomings (Friston and Buchel, 2000; Goebel et al., 2003; Kayser et al., 2009;
Roebroeck et al., 2005; Sun et al., 2004, 2005). In essence, these methods provide a
quantification of coupling between different brain responses and at times temporal information
about the nature of inter-regional interactions. The combination of high spatial resolution and
whole brain coverage make for extremely rich datasets. Given the appropriate experimental
design, and computational power, these methods have the potential to allow a variety of
questions on network dynamics to be addressed in a comprehensive way. In the last chapter of
this dissertation, I will present such an investigation. Participants performed the cueing task in
the fMRI scanner. Functional localizers were used that allowed the identification of regions that
have previously been implicated in the research of spatial attention. The study reveals
interregional connections whose strength of coupling was altered by the attention type probed.
By and large, voluntary attention resulted in a decrease in intrahemispheric coupling compared to
involuntary attention. In addition, the right hemisphere was associated with greater coupling for
both voluntary and involuntary attention. A post-cue procedure demonstrated that these effects
were task selective and not due to differences in display conditions.
5
2. Spatial Attention Increases Interhemispheric Coupling.
2.1 Introduction
Recent investigations of spatial attention in cognitive neuroscience have focused on
networks that control top-down attentional allocation. Specifically, a great deal of research has
revealed a “fronto-parietal network” for spatial attention, but only brief reference has been made
to how (or when) these networks share information between the two hemispheres under different
attention states (Buschman and Miller, 2007a; Buschman and Miller, 2007b; Corbetta and
Shulman, 2002; Esterman et al., 2008; Serences and Yantis, 2007). In the present study, we
provide electrophysiological evidence that spatial attention to a lateralized stimulus integrates
neural responses between the two hemispheres through stronger neural coherence and
acceleration of callosal transfer time.
We presented a single face in one visual field or the other and directly investigated
transfer from the contralateral stimulated hemisphere to the ipsilateral unstimulated hemisphere
under conditions for which the stimulus was either attended or ignored. In the “attend” condition,
participants reported whether the lateralized stimulus (a face) was upright or not. In the “ignore”
condition, participants reported whether a symbol at fixation was an X or not, and thus could
ignore the face. The same stimuli were shown in the two conditions.
Using ERP recordings, we quantified interhemispheric transfer time (IHTT) when the
face was attended vs. ignored as well as differences in coupling between the hemispheres under
the two attentional conditions (interhemispheric coherence). IHTT was measured by comparing
the peak latency of the visual evoked response from contralateral and ipsilateral scalp locations
produced by the same lateralized face stimulus (Saron and Davidson, 1989). Most research
measuring electrophysiological measures of IHTT has focused on structural callosal differences
between different populations (e.g., (Endrass et al., 2002). In the present study, we used this
measure to compare interhemispheric coupling and transfer speed in different attentional
conditions.

6
2.2 Methods
Participants: Fourteen undergraduates from the Research Participant Pool at the
University of California, Berkeley were recruited to participate in the experiment for class credit.
The participants all had normal or corrected to normal vision. All provided written consent as
approved by the Committee for the Protection of Human Subjects at the University of California,
Berkeley.
Procedure: IHTT was measured for a given lateralized face in two different attention
conditions: participants were either instructed to make a judgment about the face (attend-face) or
the symbol at fixation (ignore-face) in separate blocks. Stimuli were the same in both attention
conditions. Each trial started with the onset of a fixation symbol (e.g. '*', '~', '|','x') at the center of
the screen. Following 450-600 msec, a face appeared to the left or right of the symbol (Figure
1a). Participants were instructed to respond at the end of the trial (after the offset of both the
lateralized stimulus and fixation) using a button press. The next trial started 950 ms to 1850 ms
following the button press.
The symbols used were presented in Arial font 18 point size and subtended
approximately 0.3 degrees visual angle. The face stimulus was one of ten grayscale faces
subtending 2.17 by 3.8 degrees, centered on the horizontal meridian, presented at 1.45 degrees
eccentricity, and viewed at a distance of 100 cm. In addition to explicitly instructing participants
to refrain from eye movements, stimulus placement and size were chosen to be easily perceived
to ensure that participants could perform the task without the need to move their eyes. In order to
motivate participants to allocate spatial attention to the location of the lateralized stimuli
throughout a block of trials (in the attend-face condition), the position of the face stimuli was
100% predictable: they appeared in the RVF or in the LVF for entire blocks. Faces were chosen
because they produce a clear electrophysiological marker in the ERP over posterior scalp
electrodes (N170 component(Carmel and Bentin, 2002) that is distinct from an earlier perceptual
marker (P1 component, (Mangun and Hillyard, 1991). Task instructions were blocked: in the
attend-face condition, participants reported whether the face was inverted or not on each trial. In
the ignore-face condition, participants reported whether the central symbol was an „x‟ or not.
Inverted faces and „x‟s appeared on only 10% of trials and were excluded from the EEG
analyses. Responses were delivered through key presses at the end of a trial. There was a total of
twelve blocks consisting of 60 trials each, resulting in 150 trials per condition. Eight of the
subjects started with the attend-face blocks, and the remaining participants started with the
ignore-face blocks. At the beginning of the experimental session and before switching to the
second task, participants performed ten practice trials to familiarize them with the task and to
train them on maintaining fixation. Within each task, the visual field of the lateralized face
alternated between blocks. Emphasis was placed on accuracy and not on reaction times
(responses were prompted by the ending of the trial). All participants performed above 98%
correct for both attend-fixation and attend-face trials. Importantly, the onsets of the symbol and

7
the lateralized face were temporally jittered, allowing clear assignment of the evoked response to
the face in order to quantify IHTT in both attend and ignore conditions.
EEG acquisition and analysis: EEG was recorded using a Biosemi Active Two system at
a sampling rate of 512 Hz from 64 electrode sites. Additionally, horizontal electrooculographic
(EOG) signals were recorded at the left and right external canthi, and vertical EOG signals were
recorded below the right eye. Both scalp and EOG electrodes were referenced off line to the tip
of the nose. Preprocessing of the data was done in Brain Vision Analyzer. Trials with eye
movements or blinks were removed from the data using an amplitude criterion of ±75µV or
lower on the EOG channels (the criterion was adjusted for each participant to ensure the
exclusion of artifacts). 4.6% of trials were rejected due to horizontal eye movements. The rate of
fixation breaks was not significantly different for attend-face compared to ignore-face blocks
[t(13) = 0.144 p=0.88]1. EEG time series were segmented into epochs from 100 ms before cue
onset to 1000 ms after cue onset for correctly performed trials. These segments were then
exported to EEGLAB (Delorme and Makeig, 2004) for coherency analysis. In order to quantify
effects in the P1 and N170 components, the data were band pass filtered to 1.5 - 17 Hz, and
average peak amplitude and latency were extracted for time windows of 80-120 msec (P1) and
150-220 msec (N170), for each participant in each condition. The results of statistical tests for all
ERP analyses as well as coherency measures are reported for sites PO7/8 and P7/8 for both P1
and N170 components.
1 In addition, the waveforms at the EOG channels did not significantly differ between the attend-face and
ignore-face tasks [F(1,13) < 1] nor did the task factor interact with the side of presentation [F(1,13)<1].

8
Figure 1: Trial procedure and IHTT measures
(A) On each trial, participants reported whether the face was inverted or not (attend-face) or
reported whether the fixation symbol was an „x‟ or not (ignore-face). (B) IHTT for P1 and N170
components. Error bars signify the standard error of the difference between the two attention
conditions.
9
2.3 Results
N170 Latency - IHTT: To characterize N170 latency and the interhemispheric transfer
time, a three-way, repeated measures ANOVA with Hemisphere (left or right), Visual Field (VF;
left or right), and Task (attend-face or ignore-face) as within-subject factors was performed. As
predicted, the interaction of Hemisphere and VF was significant [F(1,13) = 29.47, p<0.01],
indicating that the contralateral N170 response preceded the ipsilateral response (Figure 1B).
Importantly, there was a three-way interaction among Hemisphere, VF and Task, indicating that
the time difference between ipsilateral and contralateral response latency was different for the
two task manipulations [F(1,13) = 6.63, p<0.05]. Specifically, the IHTT of the N170 component
was significantly larger when the face stimuli were ignored compared to when they were
attended.
N170 Amplitude: To evaluate N170 amplitude, a three-way ANOVA with Hemisphere
(left or right), VF (left or right), and Task (attend-face or ignore-face) as within-subject factors
was performed. There was a main effect of Task [F(1,13) = 13.57, p <0.01], indicating that the
N170 was more pronounced during the attend-face condition (-8.67μV) than the ignore-face
condition (-7.49μV). There was also a significant Hemisphere by VF interaction [F(1,13) =
18.38, p <0.01] indicating that responses in the hemisphere contralateral to the stimulus (-8.87
μV) were more pronounced than those in the hemisphere ipsilateral to the stimulus (7.26 μV). In
addition, there was a significant interaction between Task and VF [F(1,13) = 6.14, p <0.05]. The
effect of task on the N170 was larger when the faces appeared on the left compared to the right
side of fixation (2.26 μV difference between the tasks when faces appeared on the left compared
to 0.1 μV difference between the tasks when faces appeared on the right). The three-way
interaction of Hemisphere by VF by Task [F(1,13) = 19.77, p <0.01] indicates that the attention
effect was largest in the left hemisphere for faces appearing on the left side.
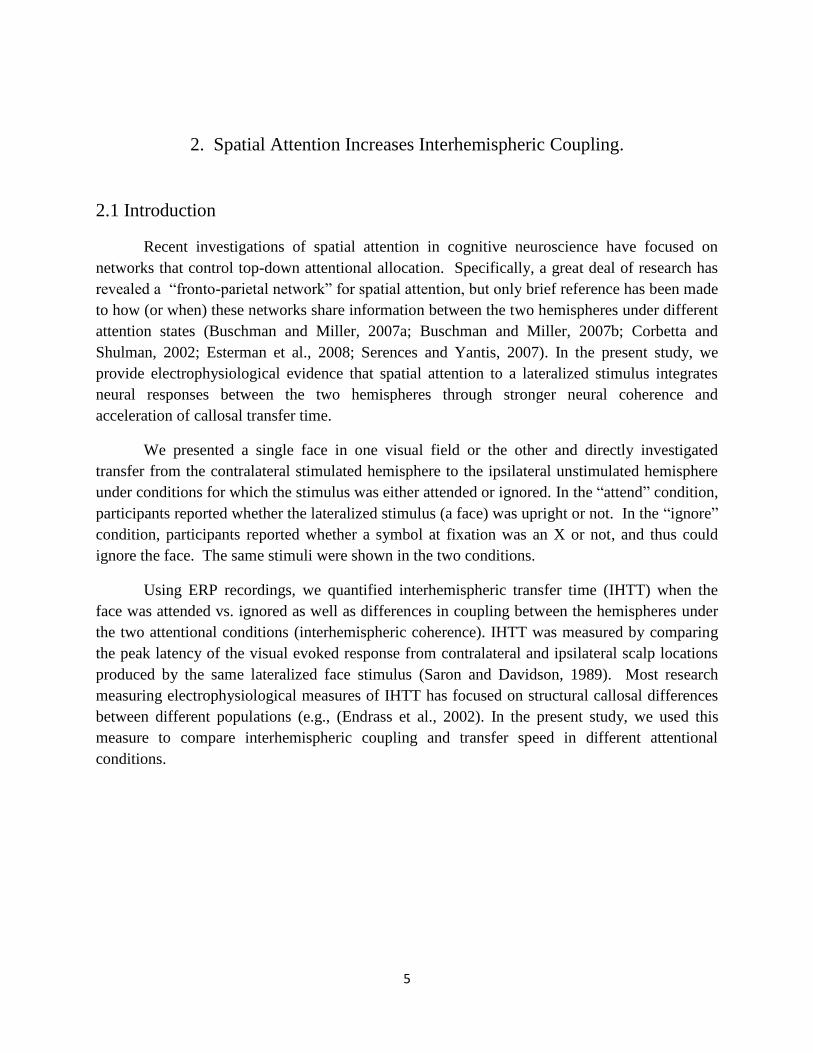
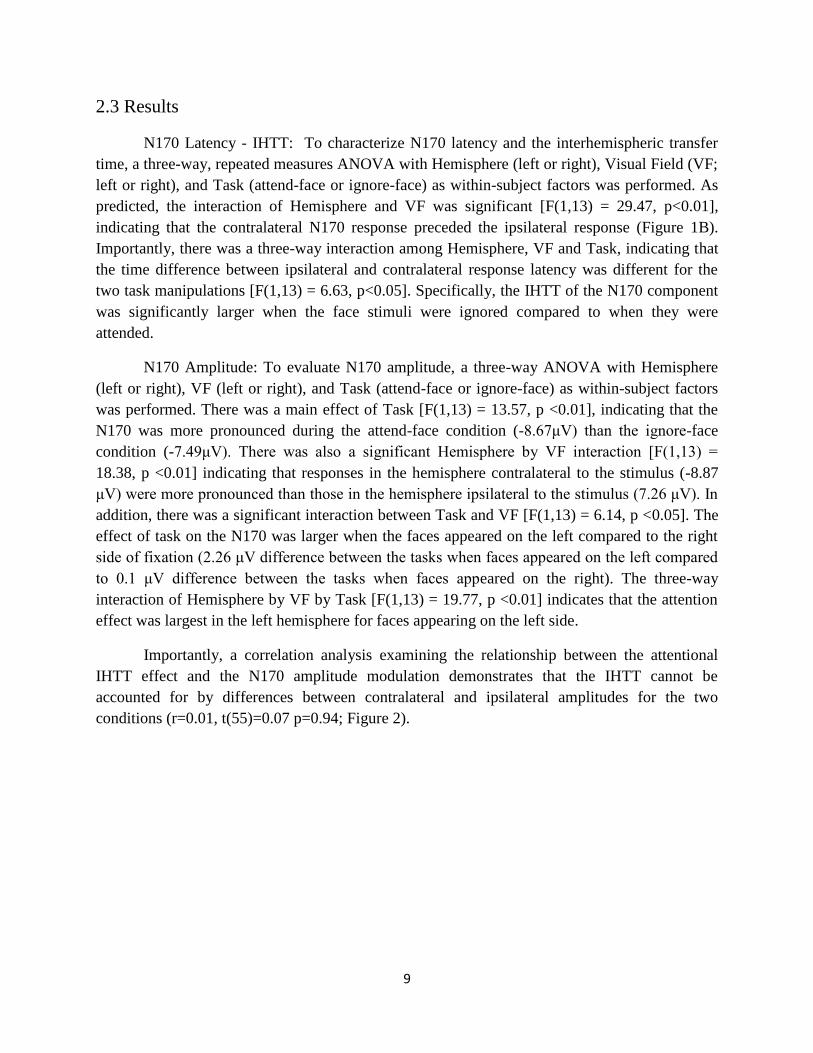
Importantly, a correlation analysis examining the relationship between the attentional
IHTT effect and the N170 amplitude modulation demonstrates that the IHTT cannot be
accounted for by differences between contralateral and ipsilateral amplitudes for the two
conditions (r=0.01, t(55)=0.07 p=0.94; Figure 2).
10
Figure 2: Latency differences between contralateral and ipsilateral response as a function
of peak amplitude differences between contralateral and ipsilateral response.
Scatter plot of amplitude interhemispheric difference (computed by the subtraction of ipsilateral
amplitude from contralateral amplitude) and peak latency difference (IHTT) for each participant,
in each attention condition and each visual field condition (total of 56 points)
P1 Latency - IHTT: An analysis similar to that performed for the N170 was conducted to
characterize P1 latency. An ANOVA with Hemisphere (left or right), Task (attend-face or
ignore-face), and VF (left or right) as within-subject factors was performed. As expected, for the
P1 there was a Hemisphere and VF interaction [F(1,13) = 8.25, p<0.05], indicating a
contralateral bias in the visual response. In addition, there was a significant interaction between
Hemisphere and Task [F(1,13) = 12.15 p<0.01]. Specifically, the response over the right
hemisphere was faster in the attend-face condition, while the response over the left hemisphere
was faster in the ignore-face condition. This finding is consistent with perceptual biases in the
literature (Ivry and Robertson, 1998; i.e., right hemisphere bias for faces and global processing,
left hemisphere bias for objects and local processing). While mean transfer time for the P1
response was slightly faster for attend-face (7.7 msec) compared to ignore-face (11.5 msec), in
contrast to the N170, this effect was not significant in the broad-band ERP analysis [F<1].
P1 Amplitude: To characterize P1 amplitude, an ANOVA with Hemisphere (left or right),
Task (attend-face or ignore-face), and VF (left or right) as within-subject factors was performed.
There was only a main effect of Task, indicating that the P1 amplitude was modulated by the
attention condition [F(1,13) = 4.88, p<0.05]. Specifically, the P1 response to a face during the
attend-face condition was larger than the P1 response during the ignore-face condition. No other
effects reached or approached significant levels. The standard depiction of wave forms for the
different conditions can be seen in Figure 3.

11
Figure 3: ERPs elicited from contralateral and ipsilateral stimuli in Experiment 1
ERP waveforms for attend-face and ignore-face trials, averaged for ipsilateral and contralateral
posterior recording sites. Shaded areas signify the standard error of the difference between the
two conditions. Both P1 and N170 amplitude modulation due to attention is measured (as
reported in the results).
Frequency analysis of IHTT: In order to further examine attentional modulation of the
ERP components, an additional analysis was performed on different frequency bands of the ERP
signal. The frequency band analysis was performed as in Nalcaci, Basar-Eroglu, and Stadler
(1999). Each epoch of a given segmented trial was bandpass filtered in frequency bands 0.5-4, 4-
8, 8-15, 15-20, and 20-32 Hz prior to averaging and computation of peak latency. As seen in
Figure 4, most of the interhemispheric transfer time acceleration due to attention was carried by
lower frequencies (< 8 Hz). For the N170 component, both frequency ranges 0.5-4 Hz and 4-8
Hz showed a significant acceleration in the attend-face compared to the ignore-face condition
[t(13)=-2.611, p<0.05 and t(13)= -2.48, p<0.05 respectively]. For the P1 component, the
frequency band 4–8 Hz showed a significant acceleration in the attend-face compared to the
ignore-face condition [t(13)=-3.1, p<0.01], and the remaining frequency bands did not show a
significant effect of attention [t(13)<1 for the statistical tests performed for each remaining
frequency band].

12
Figure 4: Band pass analysis of the P1 and N1 ERP components in Experiment 1
IHTT attention effects, calculated as the difference in transfer time between the attend-face
task and the ignore-face task for each of the displayed frequency bands.
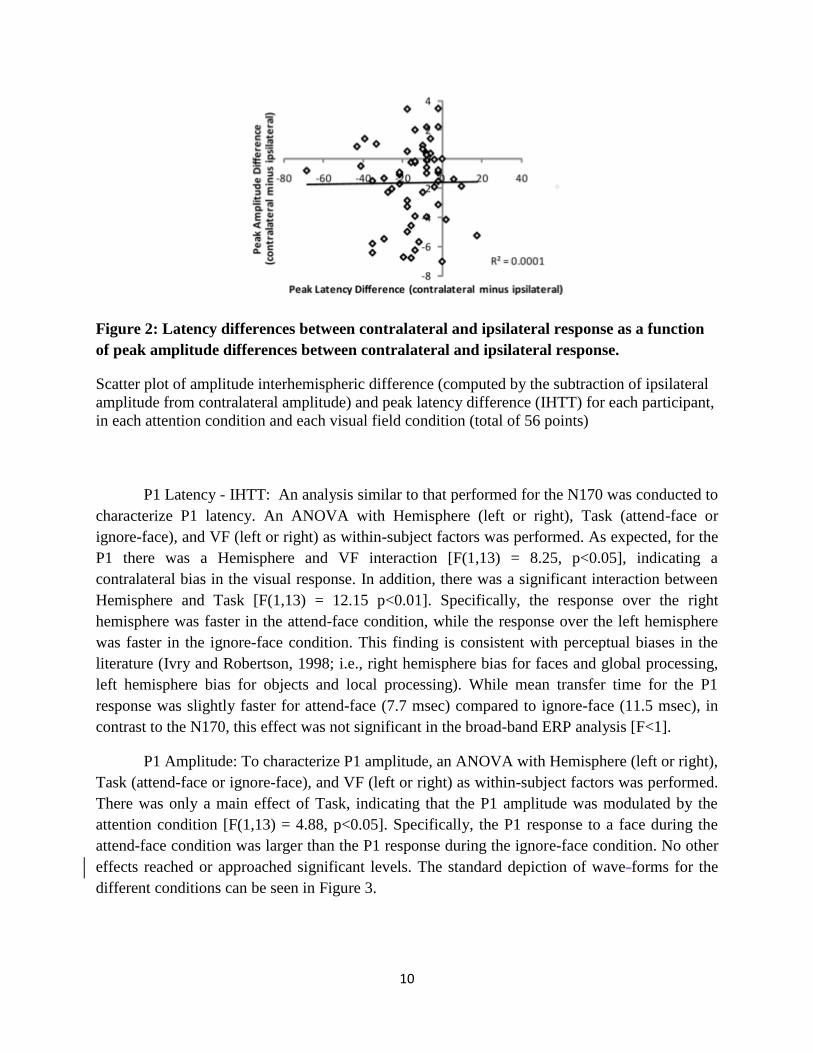
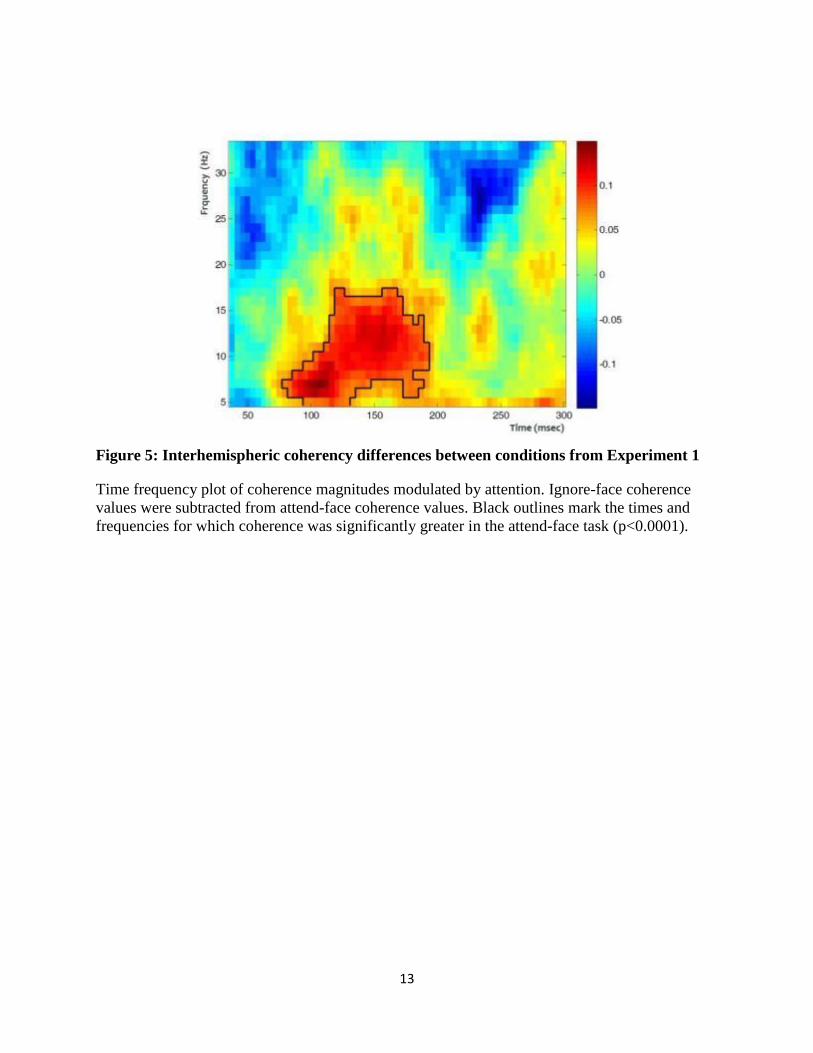
Interhemispheric coherence: To test whether attention increased coupling of the two
hemispheres, we analyzed event-related phase coherence between responses over homologous
posterior sites (PO7/8 and P7/8). Coherence is a spectral measure assessing coupling between
two time series (Brillinger, 2001). In the present study, coherence was computed between time
series recorded simultaneously at two homologous scalp sites. Interhemispheric coherence was
quantified for single segmented trial epochs, and coherency magnitudes were then averaged over
the different trials for each condition. Statistical significance was established using a permutation
test (Nichols and Holmes, 2002), and results are presented in Figure 5. A significant increase in
interhemispheric coherence occurred 80 – 200 msec after the onset of an attended face compared
to coherence associated with an ignored face. The attentional coherence modulation was most
marked in lower frequencies up to approximately 15 Hz. The relationship between
interhemispheric coupling, as measured with coherence, and interhemispheric amplitude
modulations is demonstrated in Figure 6. The attentional modulation of the interhemispheric
coupling cannot be explained by the interhemispheric amplitude modulation (r = 0.24, t(27)
=1.26 p = 0.2 and r = 0.17, t(27) = 0.88, p=0.4 for N170 and P1, respectively). In addition, a
similar analysis demonstrated that the coherence effects and latency effects are not significantly
correlated [r = 0.12, t(13)<1 and r=0.1, t(13)<1 for N170 and P1 components, respectively;
Figure 7].
13
Figure 5: Interhemispheric coherency differences between conditions from Experiment 1
Time frequency plot of coherence magnitudes modulated by attention. Ignore-face coherence
values were subtracted from attend-face coherence values. Black outlines mark the times and
frequencies for which coherence was significantly greater in the attend-face task (p<0.0001).

Figure 6
Scatter plot of the Coherence attention effect
(computed by the subtraction of ignore-face
from attend-face coherence) and Amplitude
attention effects (computed as: [attend-face
(contralateral amplitude - ipsilateral
amplitude)] - [ignore-face (contralateral
amplitude - ipsilateral amplitude)]) for N170
(a) and for P1 (b) components.
Figure 7
Scatter plot of the Coherence attention
effect (computed as the subtraction of
ignore-face from attend-face coherence) and
Latency attention effects (computed as:
[Attend face (contralateral latency -
ipsilateral latency)] - [Ignore face
(contralateral latency - ipsilateral latency)])
for N170 (a) and for P1 (b) components.

13
2.4 Discussion
The present study reveals converging evidence for greater interhemispheric cooperation
when voluntary sustained spatial attention is directed to a lateralized stimulus. Temporal
differences between contralateral and ipsilateral evoked responses to a lateralized face are
smaller when the lateralized face is attended compared to when it is ignored. In line with
previous work on attentional modulation of ERPs (Hillyard et al., 1998), attention does not affect
the initial latency of the contralateral response, indicating that the speed of the geniculostriate
transmission is not affected by deployment of attention to the lateralized stimulus. These results
constrain the interpretation of our findings to attentional accelereation of cortico-cortical cross
talk between the hemispheres.
Previous ERP studies reporting P1 and N1 attentional modulation have typically been
limited to amplitude measures and reported no marked latency effects (Di Russo et al., 2003;
Wijers et al., 1997). There is an important difference between these studies and the present one.
Namely, in previous studies, participants reported lateralized targets only if they appeared on the
attended side. When a lateralized stimulus appeared on the ignored side, participants were not
required to do anything. It is possible that IHTT modulations were not found due to the fact that
while participants were not required to report the unattended stimuli, they defaulted to processing
it and even attending to it in the absence of a defined task during those trials. In the present
study, attention was controlled in both attend-face and ignore-face (attend-fixation) conditions.
In the attend-face condition, attention was allocated to the face stimulus that evoked a response,
while in the ignore-face condition, attention was directed away from the face stimulus and to the
central fixation point. This task design facilitated comparison of the ignored and attended visual
onset, a comparison not present in previous studies.
In addition, our findings demonstrate that the effects of spatial attention on
interhemispheric interactions go beyond the mere acceleration of callosal transfer. Attending to a
lateralized face is also accompanied by an increase in the coupling between responses in the two
hemispheres. The results also indicate that the hemisphere receiving no direct sensory input
shares information processing with the stimulated hemisphere more rapidly and interactively
when attention is directed to the location of the stimulus. While ample data support fronto-
parietal circuits for spatial attention (Buschman and Miller, 2007a; Buschman and Miller, 2007b;
Corbetta and Shulman, 2002; Esterman et al., 2008; Serences and Yantis, 2007), the present
findings demonstrate that spatial attention also modulates the functional connectivity between
these circuits.
Finally, these findings address a question that has been debated in the hemispheric
lateralization literature for decades, namely, how attention influences hemispheric
communication (Banich, 1998). Here we used physiological measures to demonstrate that
hemispheric coherence and transfer time are indeed modulated depending on whether a single,
lateralized stimulus is attended or not.

14
3. Different Effects of Voluntary and Involuntary Attention on EEG Activity in the
Gamma-band.
3.1 Introduction
Behavioral evidence suggests that spatial attention can be summoned in at least two
ways. One is goal directed and engages top down control mechanisms, while the other is
automatic and independent of the task. The former is often referred to as endogenous or
voluntary attention (Posner 1978) and the latter as exogenous or involuntary attention (Jonides
1981).
Ample evidence, using the spatial-cueing paradigm (Posner 1978), Figure 8a), indicates
that for both voluntary and involuntary attention, targets are detected and discriminated faster at
a validly-cued location compared to invalidly-cued locations (the “validity effect”). It is often
assumed that both forms of attention enhance perceptual processing similarly and are controlled
by the same neural mechanisms (Gazzaniga et al. 1998). However, behavioral evidence indicates
that voluntary and involuntary attention might have different time courses and consequences
(Müller and Rabbitt 1989; Berger et al. 2005).
In the present study a cueing task was combined with electrophysiological measures, to
compare voluntary and involuntary attention in identical stimulus-conditions. Previous work
coupling electrophysiology with cueing paradigms mostly focused on Event-Related Potentials
(ERPs). The most consistent finding is an increase in early sensory potentials (P1 component)
elicited by a cued target compared to an uncued target (Mangun and Hillyard 1991; Hopfinger
and Ries 2005). Later components may also be modulated, but the results are less consistent.
While some authors reported greater N1 on valid trials (Luck et al. 1994) others found the
reverse (greater N1 on invalid trials, (Hopfinger and Ries 2005). Hopfinger and West (2006)
measured interactions between voluntary and involuntary attention manipulating the two types of
attention concurrently. They found that although mutually affecting each other, voluntary and
involuntary attention act on different stages of processing. However, in the procedure they used,
the voluntary and involuntary cues were visually different, and were presented at different times
in a given trial. Voluntary and involuntary attention effects have seldom been directly compared
under equal stimulus conditions within the same ERP study. Studies that attempted this
comparison, revealed no marked differences in the amplitudes of either P1 or N1 (Doallo et al.
2005).
Recent work in both animals and humans examined the spectral content of the EEG
signal (Gruber et al. 1999; Fries et al. 2001; Vidal et al. 2006; Fan et al. 2007) suggesting that
activity in the gamma range (>30Hz, Tallon-Baudry, and Bertrand, 1999) is modulated by

15
attention. We therefore focused on the gamma-band response as it relates to voluntary and
involuntary attention. Whereas ERPs did not distinguish voluntary from involuntary attention,
we report clear differences between these two attention systems in the gamma-band.
3.2 Materials and Methods:
Task and Procedures – Participants performed an easy face-discrimination task under
conditions of voluntary and involuntary attention conditions. As shown in Figure 8a, one of two
faces was presented immediately after a cue-offset, either to the left or to the right of fixation,
and the participants reported which face had been presented by pressing one of two keys. A
peripheral cue preceded the target face in both voluntary and involuntary conditions. Voluntary
attention was measured in the predictive-cue-condition. In this condition the face appeared more
often in the cued location (70% valid) than the uncued location. Involuntary attention was
measured in the nonpredictive-cue-condition. In this condition the cue location was unrelated to
target location. Both conditions included target-absent trials, which allowed evaluation of cue-
related activity in isolation of a target face. A third key was used to report the absence of a target.
The only difference between the attention conditions was the proportion of valid, invalid, and
cue-only trials. This design enabled examination of the physiological time course of cue and
target processing for voluntary and involuntary attention without confounding physical stimulus
parameters. The predictive-cue-condition consisted of six 100-trial blocks separated by breaks.
The nonpredictive-cue-condition consisted of five 112-trial blocks (see figure 8a). Each
participant completed one cue-condition before starting the other cue-condition, and cue-
conditions were counterbalanced between subjects. Each cue-condition began with a short
practice block (20 trials).
Note that in the predictive cue-condition the participant was encouraged to utilize the cue
when it appeared, and anticipate the probable location of the target. In the nonpredictive cue-
condition participants were instructed to ignore the cues as they are independent of target
location. Here, predictive and nonpredictive cue-conditions were used as operational variables
for voluntary and involuntary attention. With a predictive cue voluntary attention would be
allocated when the cue appears. With a nonpredictive cue voluntary attention will not be
allocated until the target appears.
Stimuli - Stimuli were presented on a 20” monitor. Seen from 155 cm, the visual angle of
each cueing square was 2.2°, and they were centered 2.7° from a 0.4° fixation cross. Faces
appeared centered in one of the squares and were 2.4° wide.

16
Figure 8: Trial procedure from and RT data from Experiment 2
a) After 1s of fixation a cue (one rectangle changed to red, denoted by the dotted rectangle) was
displayed for 250 ms, followed by one of two face targets displayed for 300 ms or a blank
screen. Bellow the illustration are the probabilities (and trial numbers) of each trial-type (valid,
invalid, cue-only) in the different cue-conditions (predictive and nonpredictive). Participants
indicated by a key press which face appeared or whether no face appeared. b) Reaction time
performance.

17
Participants - Sixteen undergraduates participated in the experiment for class credit. All
participants had normal or corrected-to-normal visual acuity. Participants gave informed
consent as approved by the UC-Berkeley IRB.
EEG acquisition and processing - EEG was recorded using a Biosemi Active-Two
system at a sampling rate of 256 Hz from 64 sites of a modified 10-20 system montage.
Horizontal electrooculographic (EOG) signals were recorded at the left and right external canthi,
and vertical EOGs were recorded below the right eye. All electrodes were referenced off line to
the tip of the nose. Preprocessing of the data was done in Brain Vision Analyzer. Trials with eye-
movement or blinks were removed from the data using an amplitude criterion of ±150µv or
lower. Ongoing EEG was segmented into epochs from 200 ms before cue onset to 1000 ms after
cue onset of correctly performed trials. These data were then exported to EEGLAB (Matlab
Toolbox; Delorme and Makeig 2004) for spectral analysis.
EEG spectral analysis - To measure the power at each frequency band and time point, the
data were processed using the “timef” function of EEGLAB (Delorme and Makeig 2004). For
each experimental condition, approximately 60 randomly-selected EEG epochs were convolved
with Gaussian-windowed sinusoidal wavelets of two-cycle duration. At each frequency band, the
mean spectral energy of the pre-stimulus baseline (from -200 to -50 ms, excluding the last 50ms
of fixation in which fixation changed color) was subtracted from the pre- and post-stimulus time-
frequency energy. The absolute power measure was converted to decibels (dB; 10 * log (µV2).
Baseline levels in the two attention conditions were equivalent as revealed by a planned paired t-
test [t(15)=1.05, p=0.92]. The resulting time-frequency maps were averaged across trials for each
subject to form the event-related spectral perturbation (Makeig, 1993). The individual subject
maps were averaged to create grand average ERSP maps (figure 10).
For statistical analysis an unbiased time by frequency range of maximal gamma-band
response was selected from the averaged data for cue-related responses and target-related
responses separately (Yuval-Greenberg 2007). The average power within these regions for each
condition was then used as the dependent variable in an ANOVA with repeated factors. Due to
the wide scalp distribution the data were collapsed for analysis into three groups (anterior,
central and posterior) in each hemisphere (Gruber et al. 1999; see Figure 9).

18
Figure 9: A schematic of the cap used for Experiment 2
A schematic of the sites grouped for the spectral analysis statistics. Anterior, central and
posterior groups outlined in dashed, gray and black lines respectively.
ERP analysis: Segmented data was averaged separately for each condition. Averaged
waveforms were band pass filtered (0.8 Hz-17 Hz 24db/oct as in Zion-Golumbic and Bentin
2006) and baseline corrected from 100 ms pre-cue-onset. For each participant the P1 peak was
determined as local maximum between 80-150 ms post target onset and the peak of the N170
face selective component (Bentin et al. 1996) was determined as local minimum between 130-
220 ms. Amplitudes of these components at sites P8, PO8 and P10 over the right hemisphere and
the homologue sites over the left were included in the analysis. ANOVA with repeated measures
with factors cue-condition (predictive, nonpredictive), hemisphere (left, right), site (P7/8, PO7/8,
P9/10), target-side (Left, Right) and Validity (Valid, Invalid) were manipulated as within subject
variables and were performed on P1 and N170 amplitudes separately.
3.3 Results:
3.3.1 Performance: Overall, discrimination of targets was faster for valid than invalid trials (Figure 8b). The
validity effect was greater in the predictive than nonpredictive cue-condition. These results were
supported by a two-way ANOVA conducted for target-present trials. Overall, responses were
slightly faster in the predictive than the nonpredictive cue-condition. However this difference
was not significant [F(1,15)=3.32, p=0.09]. The validity effect was significant [F(1,15)=30.29,
p<0.001], and interacted with cue-condition [F(1,15)=15.91, p<0.01]. This interaction indicated

19
that validity effects were larger in the predictive-cues-condition than in the nonpredictive-cue-
condition. Planned paired comparisons indicated that in both cue-conditions the validity effect
was significant [t(15)= 5.14, p<0.001) for predictive and t(15)= 3.4, p<0.01 for nonpredictive].
For target absent trials, performance was identical for the two cue-conditions (636 ms in both).
The percent correct for valid and invalid trials following predictive cues were 94.7% and
92.4% respectively. The corresponding accuracy rates following nonpredictive cues were 95.2%
and 93%. ANOVA showed a main effect of validity in error rates [difference=2.25%,
F(1,15)=17.3, p<0.01] and no interaction with cue-condition [F<1].

20
Figure 10: Spectral analysis data from Experiment 2
Time (x-axis)/frequency (y-axis) plots for nonpredictive (left column) and predictive (right
column) conditions. (a) Data from cue-only trials. Cue onsets at zero -- marked by an arrow. (b)
Data from target-present trials (valid and invalid in the first and second rows respectively).
Target onsets at zero -- marked by an arrow. Dark rectangles mark the time/frequency window
used in the statistical analysis.
21
3.3.2 Spectral analysis: Activity in the gamma range (defined here as 30-70 Hz) was averaged for the temporal
window from 150 to 225 ms post-cue-onset to measure cue-related activity and from 150 to 225
ms post-target-onset to measure target related-activity (figure 10, time-frequency window
selection process as described in the methods section).
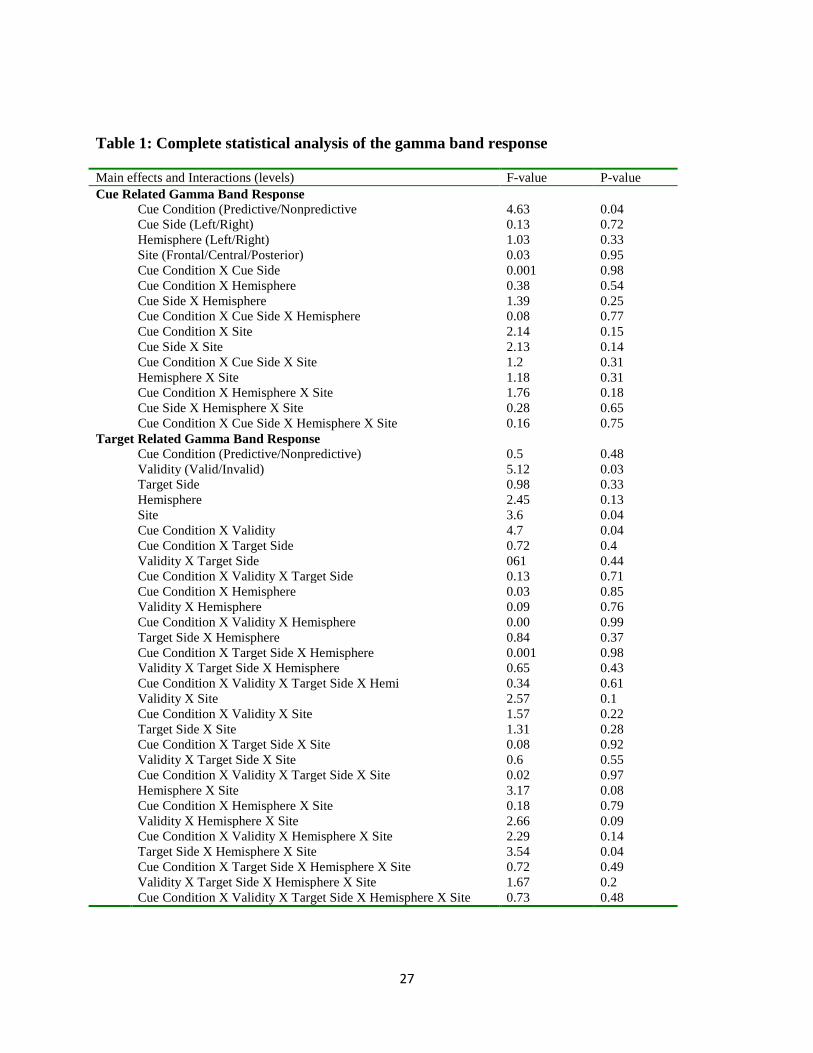
Cue-Related Activity: Analysis of target-absent trials showed that gamma-band power to
cues was higher in the predictive than in the nonpredictive cue-condition (Figure 10a). This
observation was supported by an ANOVA with cue-condition (predictive, nonpredictive), cue-
side (left, right), hemisphere (left, right), and site (posterior, central, anterior). The main effect of
cue-condition was significant [F(1,15)=4.63, p<0.05] while the effects of all other factors were
not (for the complete statistical analysis, see Table 1).
Target-Related Activity: The gamma activity elicited in the predictive-cue-condition by
invalid targets was higher than that elicited by valid targets. In the nonpredictive cue-condition,
the gamma elicited by both target types (valid and invalid) was similar (Figure 10b). An
ANOVA with cue-condition (predictive, nonpredictive), validity (valid, invalid), target-side (left,
right), hemisphere (left, right), and site (posterior, central, anterior) as within subject factors
showed a main effect of validity [F(1,15)=5.12, p<0.05], which interacted with cue-condition
[F(1,15)=4.7, p<0.05]. Paired planned comparisons showed that in the predictive-cue-condition
gamma-band response was significantly greater on invalid then valid trials [F(1,15)=5.20,
p<0.05]. In the nonpredictive-cue-condition this was not the case [F(1,15)=3.51, p=0.08]. The
trend in the non predictive case could be due to a number of factors2. Importantly, the significant
interaction reflects the reliable differences in gamma activity between valid and invalid
conditions for predictive and nonpredictive conditions.
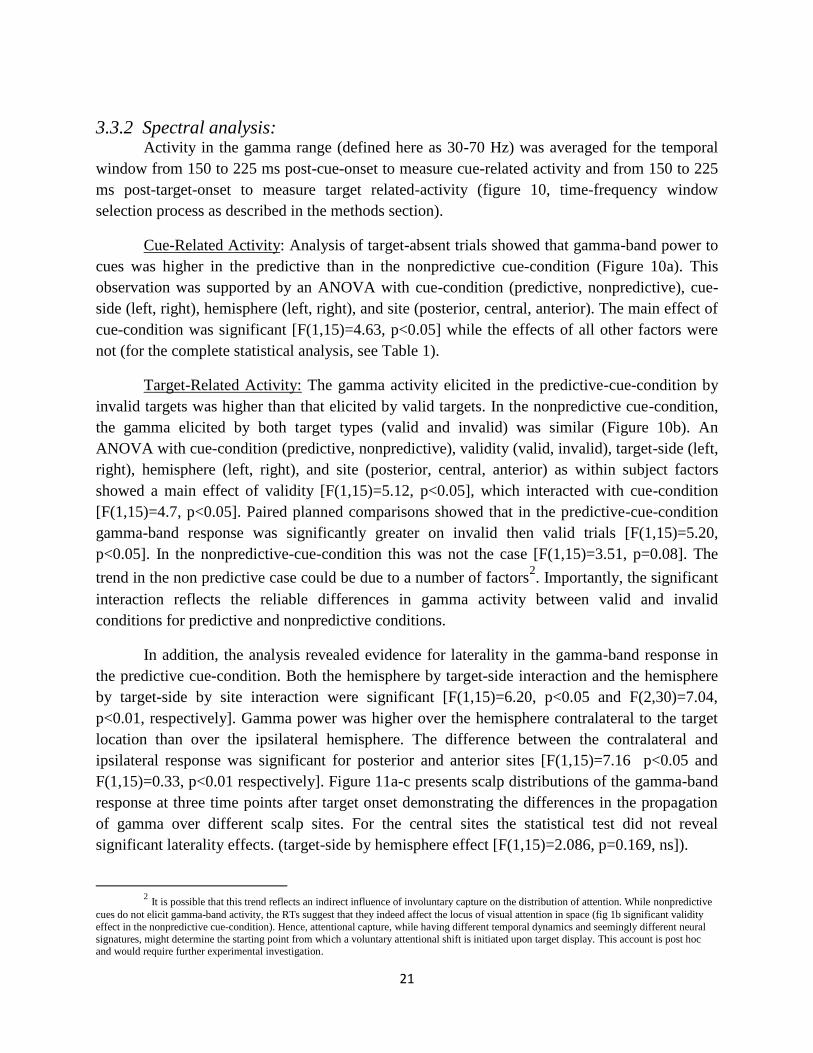
In addition, the analysis revealed evidence for laterality in the gamma-band response in
the predictive cue-condition. Both the hemisphere by target-side interaction and the hemisphere
by target-side by site interaction were significant [F(1,15)=6.20, p<0.05 and F(2,30)=7.04,
p<0.01, respectively]. Gamma power was higher over the hemisphere contralateral to the target
location than over the ipsilateral hemisphere. The difference between the contralateral and
ipsilateral response was significant for posterior and anterior sites [F(1,15)=7.16 p<0.05 and
F(1,15)=0.33, p<0.01 respectively]. Figure 11a-c presents scalp distributions of the gamma-band
response at three time points after target onset demonstrating the differences in the propagation
of gamma over different scalp sites. For the central sites the statistical test did not reveal
significant laterality effects. (target-side by hemisphere effect [F(1,15)=2.086, p=0.169, ns]).
2 It is possible that this trend reflects an indirect influence of involuntary capture on the distribution of attention. While nonpredictive
cues do not elicit gamma-band activity, the RTs suggest that they indeed affect the locus of visual attention in space (fig 1b significant validity
effect in the nonpredictive cue-condition). Hence, attentional capture, while having different temporal dynamics and seemingly different neural
signatures, might determine the starting point from which a voluntary attentional shift is initiated upon target display. This account is post hoc and would require further experimental investigation.
22
Figure 11: The scalp distribution of the gamma-band activity from Experiment 2
(a-c) The scalp distributions of gamma-band activity at 141ms, 198ms and 236ms on invalid
trials in the predictive cue-condition. Frequencies 30-70 Hz were collapsed, and scales changed
in order to emphasize differences in activity between different sites.
3.3.3 ERPs: P1 and N170 components did not differ between predictive and nonpredictive cue-
conditions (F<1 for all relevant comparisons for both P1 and N170 components). Both
components showed maximal response for sites located contralateral to the target side
(hemisphere by target-side significant interaction: F(1,15)=8.16, P<0.05 for P1 and
F(1,15)=8.67, p<0.05 for N170). Consistent with previous reports in the literature (Mangun and
Hillyard 1991; Hopfinger and Ries 2005), for both attention conditions the P1 component was
larger for valid conditions compared to invalid conditions when the target was presented in the
contralateral visual field (Figure 12). This effect was supported by a significant hemisphere by

23
target side by validity interaction [F(1,15)=17.142, p<0.01]. For the N170 no such validity effect
was found (hemisphere by target-side by validity: F(1,15)=1.23, ns p=0.28, ns).
Figure 12: ERPs elicited for the different conditions from Experiment 2
ERP waveforms to voluntary and involuntary cue-conditions (a and b respectively) at
contralateral-to-target channels (P7/8, PO7/8, P9/10 collapsed over side). Cue only trials were
subtracted from target present trials and wave forms were baseline corrected from 100 ms pre
target onset to produce this figure.
3.4 Discussion:
The present findings demonstrate that voluntary and involuntary attention have different
effects on gamma-band response whereas both affect RT similarly. These effects were
manifested in two stages. The first was in response to the cue: only voluntary attention induced
gamma-band increases to the cue alone (predictive-cue-condition). The second was in response
to targets: gamma-band increased whenever a voluntary shift of attention was required to a target
or not. These patterns of gamma-response and the way they relate to voluntary and involuntary
attention are detailed bellow.
Replicating many past studies, valid targets were detected faster than invalid targets
regardless of the cue‟s predictive value. This is evidence that abrupt onsets of peripheral stimuli
captured the observer‟s attention reflexively. When the cue was predictive, however, participants
also oriented voluntarily to the cued location, which led to enhanced validity effects. Since the

24
addition of voluntary attention was the only difference between the two conditions, the higher
the gamma power elicited by the predictive relative to nonpredictive cues reflects EEG activity
associated with voluntary attention3.
Responses to the targets differed depending on whether the cue was predictive or
nonpredictive. In the nonpredictive condition, when the target appeared, a voluntary attention
shift to the target was required to carry out the discrimination task (for both valid and invalid
trials). EEG response in those trials revealed that after a target appears in the nonpredictive
condition, there was an increase in the gamma-band response (Figure 10b). Hence for the
nonpredictive cue-condition, response to the targets was supporting the correspondence between
gamma-band response and voluntary shifts of attention.
In the predictive cue-condition, on valid trials, the cue summoned voluntary attention and
there was no additional shift required to the target. In these trials, there was less gamma-band
response because participants had already shifted their attention to the cued location. In contrast,
in invalid trials, while a shift of attention has occurred to the predictive cue, attention has shifted
to the wrong location and an additional shift of attention was required when the target appears.
Examining the EEG response in these trials revealed a marked increase in gamma-band response
on invalid trials. Once again, EEG response in the gamma-band seems to mirror the voluntary
shift of spatial attention.
Previous investigations in the spectral domain of the EEG signals have suggested diverse
roles for gamma activity which include perception, higher cognitive functions such as memory
and object representation (Herrmann et al. 2004; Zion-Golumbic and Bentin 2006). Tallon-
Baudry et al. (1999) have extensively examined the role of gamma-band activity in perceptual
binding. In initial studies gamma activity was measured to stimuli requiring perceptual
integration to form a visible object. However, since the object requiring binding was also the
object of attention, it was unclear whether the factor eliciting the increases in induced gamma in
these studies was perceptual binding, attentional selection or some combination of the two
(Tallon-Baudry et al. 2005).
Recent work has shown that gamma-band response can be related to selective attention.
Gruber et al. (1999) have reported increases in gamma-band activity at parieto-occipital sites
contralateral to attended movement, and recently Vidal et al. (2006) have dissociated between
the response to visual grouping and focused attention. In this study however participants were
requested to selectively attend to a subset of the stimuli in a display for later report of the items
orientation, a task involving a memory component in addition to the selective attention
components. Fan et al. (2007) have recently reported increases in gamma-band response to a
peripheral predictive cue, as we found here. The authors term this effect a spatial-orienting
effect. However in their study it is unclear whether these increases are due to the peripheral
3 The time course of the voluntary attention EEG modulation found here is consistent with previous work
measuring SSVEPs in response to an attentional cue in a sustained attention paradigm (Müller et al, 1998).
25
sensory stimulation, the exogenous capture of attention by the peripheral cue or the voluntary
deployment of attention to the cued location (cues were 100% predictive).
Our data ruled out a sensory interpretation for these findings and suggested that increases
in gamma-band response were related to voluntary rather than involuntary deployment of
attention. Because mechanisms of selection and perceptual organization are thought to be highly
interactive, perceptual binding and attention are difficult to tease apart. In the present study we
circumvented this problem by observing the effects of voluntary and involuntary attention on
gamma-band activity in the absence of sensory differences between these two attention
conditions. It might be the case that the neural mechanisms that support voluntary shifts of
attention are also involved in perceptual binding (Treisman and Gelade 1980), however these
questions await further investigation.
In contrast to gamma, ERPs did not discriminate between voluntary and involuntary
attention. Similar to previous studies (Mangun and Hillyard 1991; Hopfinger and Ries 2005) we
found evidence for early sensory processing for validly cued compared to invalidly cued
locations (indicated by a larger P1-component on valid trials). However, this difference was
largely unaffected by cue predictability (Doallo et al. 2005). This dissociation between higher
frequency responses in the gamma-band range and the low frequency responses in ERPs suggest
that high- and low-frequency EEG activity reflect different cognitive mechanisms.
Our findings in the gamma-band response relate to previous findings from single unit
recordings. In monkey V4, gamma activity correlates with attentional selection (Fries et al.
2001). Recordings in this study were limited to the extra-striate regions. Our data are
complementary to the animal work, as they reveal contralateral responses to predictive cues and
attended targets that initially appear in anterior regions and then propagate to posterior regions
(figure 11). Such contralateral fronto-parietal distribution is consistent with evidence from both
fMRI studies in humans and investigations in animals showing the relevance of cortical regions
such as the frontal eye fields (FEF) in selective voluntary attention (Corbetta 1998; Buschman
and Miller 2007).
EEG Activity in the alpha-band has been shown to be modulated by sustained voluntary
attention (Worden et al. 2000, Thut et al, 2006). These modulations typically take 400ms to
develop after the onset of a spatial cue. It is possible that alpha-band and gamma-band-responses
interact, and future studies could address this issue using longer cue target intervals than those
used here. The present study was designed to allow a direct comparison between voluntary and
involuntary attention requiring relatively short cue-to-target intervals.
The differences in neural response between voluntary and involuntary attention
conditions fit well with the hypothesis that they involve different mechanisms and suggest how
these two types of attention may affect performance and perceptual processing. Previous support
for this hypothesis can be found in both behavioral and imaging work. RT studies showed that
26
involuntary attention effects dissipate rapidly and reverse at long cue-target SOAs while the
effects of voluntary attention on performance are sustained (Berger et al. 2005). Prinzmetal et al.
(2005) suggest that there are several cases where voluntary attention affects accuracy while
involuntary attention does not within identical stimulus conditions. fMRI studies also report
differences between voluntary and involuntary attention, mostly in dorsal regions (Kincade et al.
2005). A recent study by Esterman and colleagues (Esterman et al., 2008) demonstrated that
BOLD response to faces in the fusiform face area (Kanwisher et al. 1997) increased when a
target face was presented at a cued location compared to an uncued location, but only if the cues
were predictive of target location. The current EEG study provides insight to the temporal
dynamics of voluntary and involuntary attention and reveals that gamma-band response reflects
voluntary shifts of attention. The discovery of a unique marker of voluntary attention that is
absent for involuntary attention contributes to the theoretical distinction between these two
attention systems and suggests that there are distinct neural mechanisms mediating the two types
of attention.
27
Table 1: Complete statistical analysis of the gamma band response
Main effects and Interactions (levels) F-value P-value
Cue Related Gamma Band Response
Cue Condition (Predictive/Nonpredictive 4.63 0.04
Cue Side (Left/Right) 0.13 0.72
Hemisphere (Left/Right) 1.03 0.33
Site (Frontal/Central/Posterior) 0.03 0.95
Cue Condition X Cue Side 0.001 0.98
Cue Condition X Hemisphere 0.38 0.54
Cue Side X Hemisphere 1.39 0.25
Cue Condition X Cue Side X Hemisphere 0.08 0.77
Cue Condition X Site 2.14 0.15
Cue Side X Site 2.13 0.14
Cue Condition X Cue Side X Site 1.2 0.31
Hemisphere X Site 1.18 0.31
Cue Condition X Hemisphere X Site 1.76 0.18
Cue Side X Hemisphere X Site 0.28 0.65
Cue Condition X Cue Side X Hemisphere X Site 0.16 0.75
Target Related Gamma Band Response
Cue Condition (Predictive/Nonpredictive) 0.5 0.48
Validity (Valid/Invalid) 5.12 0.03
Target Side 0.98 0.33
Hemisphere 2.45 0.13
Site 3.6 0.04
Cue Condition X Validity 4.7 0.04
Cue Condition X Target Side 0.72 0.4
Validity X Target Side 061 0.44
Cue Condition X Validity X Target Side 0.13 0.71
Cue Condition X Hemisphere 0.03 0.85
Validity X Hemisphere 0.09 0.76
Cue Condition X Validity X Hemisphere 0.00 0.99
Target Side X Hemisphere 0.84 0.37
Cue Condition X Target Side X Hemisphere 0.001 0.98
Validity X Target Side X Hemisphere 0.65 0.43
Cue Condition X Validity X Target Side X Hemi 0.34 0.61
Validity X Site 2.57 0.1
Cue Condition X Validity X Site 1.57 0.22
Target Side X Site 1.31 0.28
Cue Condition X Target Side X Site 0.08 0.92
Validity X Target Side X Site 0.6 0.55
Cue Condition X Validity X Target Side X Site 0.02 0.97
Hemisphere X Site 3.17 0.08
Cue Condition X Hemisphere X Site 0.18 0.79
Validity X Hemisphere X Site 2.66 0.09
Cue Condition X Validity X Hemisphere X Site 2.29 0.14
Target Side X Hemisphere X Site 3.54 0.04
Cue Condition X Target Side X Hemisphere X Site 0.72 0.49
Validity X Target Side X Hemisphere X Site 1.67 0.2
Cue Condition X Validity X Target Side X Hemisphere X Site 0.73 0.48

28
4. Effects of Voluntary and Involuntary attention on intrahemispheric functional
connectivity
4.1 Introduction
The question of the functional organization of spatial attention is an old problem in the
field of psychology (Helmholtz, 1925; Wundt, 1912/1973, 1902). Spatial attention is the capacity
to prioritize part of the environment for processing over other parts of the environment. It is a
crucial capacity for dealing with the massive influx of sensory information. Perhaps the
complexity of this problem can be captured by the pattern of deficits of spatial attention in
patients with unilateral neglect. Patients suffering from this syndrome, as its name implies, will
neglect events occurring on the side contralateral to their brain injury. Importantly, these patients
may not have any lateralized sensory loss. However, their fully intact sensory systems can hardly
support daily functioning, since they suffer from an inability to deploy spatial attention to half of
their sensory inputs. This apparent dissociation between sensory capacities and the ability to
select certain portions of the environment for processing poses a challenge in the attempt to
localize the functions supporting spatial attention. This challenge created the need for a new way
of thinking about functional organization in the brain as well as new methods for probing brain
functions.
The conceptual leap in the attempt to characterize attention in the brain arrived about
three decades ago. In a seminal review (Mesulam, 1981), Marcel Mesulam introduced the idea of
"cortical networks for directed attention". Mesulam outlined "the network approach", a novel
approach at that time, to the study of attention, and presented it as an intermediary stance
between two polar views on the organization of functions in the brain. It can be argued that it is
precisely the challenge presented by the curious dissociation of attention from any well-
characterized system or modality which gave rise to this idea.
The development of new methods to measure brain activity presented a plethora of new
opportunities to investigate how the human brain mediates the allocation of attention. Functional
magnetic resonance imaging (fMRI) and positron emission tomography (PET) allowed
measurement of responses of brain regions that are active during an attention task. Neuroimaging
studies of attention (Corbetta and Shulman, 2002; Kincade, 2005; Posner, 1980; Serences and
Yantis, 2006; Serences and Yantis, 2007) adopted the previously coined term "network" in
investigations of attention in the brain. However, most of these studies did not examine the
circuitry per se or address questions of coupling between regions directly but merely inferred
those by virtue of co-activations during attention tasks (Corbetta and Shulman, 2002; Fan et al.,
2007; Kincade, 2005; Mayer et al., 2004).
A primary goal of the present study is to directly address the coupling between different
brain regions that have been previously implicated in voluntary and involuntary attention
29
(Esterman et al., 2008; Kincade, 2005; Mayer et al., 2004). While many candidate regions have
been identified in previous work, most of this work did not assess the network dynamics or the
degree of coupling between regions for voluntary and involuntary attention.
As a first step, the present study focuses on previously identified regions that are engaged
in attention tasks and provides measures of the degree of coupling among these regions for
voluntary and involuntary attention. The regions explored in this study and their purported role
in spatial attention are: (1) IPS1 and IPS2 are regions in the intraparietal sulcus that contain
topographic representations of space (Silver et al., 2005). However, unlike the topographic
representations in early visual cortex, IPS regions have topographic maps that are maximally
responsive to the location of attention rather than the location of a visual stimulus (for a review
see (Silver and Kastner, 2009). (2) The human homologue of the frontal eye fields (FEF) is a
region that traditionally has been thought to control the generation of voluntary eye movements
in monkey (Bruce and Goldberg, 1985) and humans (Connolly et al., 2005). Recently, there is
accumulating evidence that the FEF also contain a neural representation of the current locus of
attention (Connolly et al., 2002; Juan et al., 2004) and that this region is engaged when
participants are performing attentionally demanding tasks (e.g., (Serences and Yantis, 2007). (3)
Areas that may be on the receiving end of attentional modulation, i.e., areas where the
consequences of attentional control can be measured. These regions are the topographically-
organized visual areas (V1, V2, V3, V4, V3AB and V7) as well as the fusiform face area (FFA;
(Kanwisher et al., 1997), an object-selective region that maximally responds to faces,. Both
monkey and fMRI studies have suggested that modulation of this class of regions can be seen
with spatial attention (Esterman, 2008; Gandhi, 1999; Martinez, 1999; Motter, 1993; Tootell,
1998).
To measure functional connectivity we used fMRI coherency analysis (Kayser et al.,
2009; Lauritzen et al., 2009; Sun et al., 2004, 2005). Coherency corresponds to covariation in the
frequency domain. Since the dynamic range of the blood oxygenation level-dependent (BOLD)
signal measured with fMRI is in the lower temporal frequencies, coherency was measured for
these low frequencies (here 0.6-0.14 Hz). Measuring fMRI coherency allows an estimation of the
degree of coupling between regions (coherency magnitude) as well as the temporal order of
activation among regions (derived from coherency phase relationships). The current paper will
focus on the magnitude of coupling among the independently defined regions mentioned above.

30
4.2 Materials and methods:
Participants: Eight neurologically intact subjects (four female) participated in this study.
All had normal or corrected to normal vision. All provided informed consent as approved by the
UC Berkeley Committee for the Protection of Human Subjects.
Behavioral Procedure: There were two scanner sessions each consisting of two
independent localizer scans and twelve experimental scans during performance of the cueing
task. Importantly, for both the cueing task and the localizer scans, the placement and identity of
the stimuli were identical.
Stimuli and Cueing Task: The target stimuli were pictures of a male and a female face.
To increase stimulus similarity and consequently task difficulty, the images were processed to
equate skin tone and hairline. The trial sequence can be seen in Figure 13. The fixation point was
present throughout the trial. Following a display containing only the fixation point, a horizontal
red bar (4.12° visual angle wide; the cue) appeared above the horizontal meridian (HM) for 250
msec. Immediately after the cue offset, a face (4.12° X 5.36° visual angle) appeared below the
HM (for both cue and target, the boundary of the stimulus that was closest to the HM was 0.85°
visual angle from the HM), and participants were required to indicate with a button press
whether the face was male or female. The cues and targets were presented at 5.5° visual angle
eccentricity (measured as the distance from the center of the display to the closer edge of the cue
and target). In addition, on some trials no face appeared, and these trials required a separate
button press (total of three response categories: male/female/no-face). The face could either
appear on the cued side or on the uncued side. The cue and target separation in the displays was
chosen to allow separate measurement of cue and target related activity in topographically-
organized visual cortical areas (Liu et al., 2005).
Block of trials were either predictive or nonpredictive. In the predictive block, the onset
of the cue was 70% predictive of the side in which the target face would appear. In these blocks,
70% of trials were cued, 15% were uncued, and 15% were cue-only trials. In the nonpredictive
blocks, cue side was random with regard to target location. Forty percent of trials in these blocks
were valid, 40% were invalid, and 20% were cue-only trials.
The experiment consisted of two fMRI sessions, each preceded by a short practice
session the day before the fMRI session. In the first fMRI session, the stimulus configuration
was as described above (cue above HM and target below HM), and in the second fMRI session,
the stimulus configuration was reversed (cue below HM and target above HM, all other display
parameters were identical in the two sessions). Each session consisted of three predictive cue
blocks (96 trials per block) and three nonpredictive cue blocks (100 trials per block). Practice

31
sessions consisted of a short version of the entire experiment to be performed in the scanner the
following day with the goal of familiarizing the participant with the appropriate configuration,
training participants to avoid moving their eyes during the trials, and allowing them to reach the
desired performance level (above 90% correct). During the practice sessions, auditory feedback
was given for incorrect responses as well as for breaks of fixation. Eye movements were
monitored manually using a direct video display of the participants eye as in (Prinzmetal et al.,
2005). The experimenter entered their eye movement observation usind a key press on every trial
which in turn triggered feedback when an eye movement occurred.
Pre- and Post-Cue Conditions: Predictive and nonpredictive runs contained identical
stimulation conditions at the level of individual trials and hence provided a useful way of
manipulating voluntary and involuntary attention when comparisons of trial responses are
planned (as will be presented here for the behavioral data). However, when comparing overall
activity for an entire run, these two types of runs differed dramatically in the consistency of
bilateral stimulation compared to unilateral stimulation. In a predictive block, there were more
unilateral stimulation trials (cue and target in the same visual field) compared to a nonpredictive
block. In order to control for this difference, another type of cue was utilized in the design. In
addition to trials in which the cue preceded the target, post cue trials were used (Liu et al., 2005;
Prinzmetal et al., 2008). For each pre-cue run, an identically composed run of post cues was
performed in which the temporal order of target and cue was reversed. This temporal
manipulation created runs that contain the sensory stimulation provided by the pre cues but in the
absence of the attentional component (as confirmed by the behavioral results, see results). The
terminology "cued" and "uncued" trials as well as "predictive" and "nonpredictive" runs were
used with quotation marks to signify that the post cues do not provide the information implied by
those terms. However, this terminology allowed for a clear correspondence with the trial types
and block types in the pre-cue procedure.
FEF and cue response localizer: Participants started the scanner session with a localizer
task designed to activate the Frontal eye fields (FEF) as well as portions of retinotopic areas
responding to the cue stimulus used in the cueing task. For the first scanner session, the cue
stimulus was presented 0.85° above the HM, and for the second session 0.85° below the HM (as
they were in the cueing task for a given session). This localizer consisted of one of five types of
blocks: (1) saccade to stimulus presented on the left, (2) saccade to stimulus presented on the
right, (3) fixate while stimulus was presented on the right, (4) fixate while stimulus was
presented on the left, (5) fixation only. Each block lasted 14.4 seconds (9 TRs) and was repeated
five times in a run. Within each stimulus block, a cue identical to that in the cueing task was
flashed (400 msec on / 860 msec off). During saccade blocks, participants were instructed to
initiate a saccade to the stimulus upon its onset and then immediately saccade back to the
fixation point. During non-saccade blocks (stimulus or fixation only), participants were
instructed to maintain fixation at the center of the display. A fixation cross was present
throughout the run. Between blocks, the fixation symbol was used to indicate whether the next

32
block would be a saccade or a fixate block (black '+' sign indicated fixate, gray 'x' sign indicated
saccade). FEF ROIs were defined by contrasting saccade blocks and fixation blocks. Retinotopic
regions of maximal response to the cue were defined using stimulus blocks (for right and left
separately) contrasted with fixation blocks.
FFA and target response localizer: After the FEF localizer run, participants performed a
localizer run designed to define the fusiform face area (Kanwisher et al., 1997) as well as
retinotopic regions in visual cortex maximally responding to the face targets subsequently used
in the cueing part of the experiment. Faces in the localizer task were the same faces used for the
cueing task and were presented at the same eccentricity (5.5° visual angle). For the first session,
the faces were presented 0.85° below the HM, and for the second session they were presented
0.85° below the HM (as they were in the cueing task for a given session). The localizer run was a
blocked design consisting of five types of blocks: (1) left presented face, (2) right presented face,
(3) left presented house, (4) right presented house, and (5) fixation. House pictures subtended the
same size as the faces (4.12° by 5.36° visual angle). Each block lasted 16 seconds (10 TRs) and
was repeated five times. Within each stimulus block, the stimulus was flashing (300 msec on,
519 msec off). Participants were instructed to fixate and continuously allocate covert attention to
the stimulus throughout the run.
fMRI Data Acquisition: Participants were scanned with a 3T Siemens Trio Scanner at the
UC Berkeley Brain Imaging Center. Functional images were acquired using a gradient echo-
planar imaging sequence sensitive to BOLD contrast (TR = 1600 msec, TE = 24 msec, matrix
size = 96 X 96, FOV = 22.4 X 22.4 cm (resulting in an inplane resolution of 2.3 mm X 2.3 mm X
4 mm voxel size), flip angle = 80°). Each functional volume consisted of 26 4-mm thick slices in
an axial orientation parallel to the anterior commissure - posterior commissure line with a 0.6
mm gap between each pair of slices, providing full coverage of the cerebral hemispheres. The
experimental display was back projected onto a custom screen behind the radiofrequency (RF)
head coil inside the scanner bore and viewed via an angled mirror placed on top of the RF coil.
Responses were made with the right hand using a button box.
fMRI data preprocessing: Each fMRI run began with 4 dummy images which were
discarded to remove artifacts due to incomplete magnetic saturation and to allow the
hemodynamics to attain a steady-state baseline. Head motion was corrected using a 3-D image
registration algorithms (MCFLIRT; (Jenkinson et al., 2002). The time series of each voxel was
then high-pass filtered to remove low-frequency noise and slow drift (Smith et al., 1999; Zarahn
et al., 1997). Finally, each voxel's time series was divided by its mean intensity to convert the
data from arbitrary image intensity units to percentage signal modulation and to compensate for
the decrease in mean image intensity as a function of distance from the RF coil.
Definition of Regions of Interest (ROIs): The boundaries of areas V1, V2, V3, V4,
V3AB, V7, IPS1 and IPS2 were predefined for the participants in this study using well
established retinotopic mapping procedures (Engel et al., 1994) as well as attention mapping

33
procedures described elsewhere (Silver et al., 2005). Those boundaries were imported into the
current study by aligning all sessions to a high-resolution volume anatomy for each subject and
were then restricted to include the relevant portions of the visual areas responsive to the cue and
target stimuli used in this study. Cue-related areas were defined using the contrast of cue
stimulus presentation vs. fixation for each side of the visual field. Target-related areas were
defined using the contrast of target stimulus presentation (both faces and houses from the FFA
localizer) vs. fixation for each side of the visual field. Frontal eye fields were defined by
contrasting both saccade blocks (left and right side) with fixation, and the FFA was defined by
collapsing all face stimuli (left and right side) and contrasting them with all house stimuli
(combined left and right side).
FEF and FFA were selected based on a conjunction of functional and anatomical criteria.
The anatomical criteria were within the fusiform gyrus for FFA and in the vicinity of the junction
of the frontal sulcus and the precentral sulcus for FEF, and the functional criteria were a
significantly greater response to the relevant contrast that remained centered at the same brain
location for a range of different statistical thresholds.
Coherency Analysis: For each experimental run, the average time series from
independently defined ROIs was computed. This resulted in 18 averaged time series for each run
(V1, V2, V3, V4, V7, V3AB, IPS1 IPS2 for cue and for target ROIs and regions FEF and FFA
that do not have cue and target separation). Coherency is defined as:
where <fx(λ)> and <fy(λ)> are the means of the power spectra of segments of time series
x and y at frequency λ, and <fxy(λ)> is the mean of the cross spectrum of segments of x and y
(Sun et al., 2004). Rxy(λ) is a complex quantity. For a given frequency, the absolute value of
coherency corresponds to the magnitude of coupling between x and y. Coherency magnitude
takes a value ranging between 0 and 1, with zero indicating no coupling and 1 indicating perfect
coupling between two time series. The complex argument, or polar angle, of Rxy(λ) defines the
phase relationship between the time series. Dividing these phase values by a given temporal
frequency yields the delay between x and y in units of time (taking positive or negative values,
depending on the direction of the delay between the areas). Thus, coherency analysis allows the
measurement of both the strength of functional coupling between two time series (magnitude) as
well as the direction of signal transmission (phase relations). Compared to correlation-type
analyses of functional connectivity, coherency analysis possesses several advantages that allow
for clearer interpretation of functional connectivity data. The implementation of the coherency
analysis was as in Lauritzen et al. (Lauritzen et al., 2009). Briefly, condition-specific coherency
34
was computed using Welch‟s periodogram-averaging method with a 64-point discrete Fourier
transform (DFT) Hanning window (Sun et al., 2004) and 32-point overlap between windows.
Coherency was analyzed for frequency bands 0.06 – 0.15 Hz. The upper bound on this band was
chosen based on the known properties of the frequency content of fMRI BOLD signals (Cordes
et al., 2001; Sun et al., 2004). Coherency was computed for nine frequency bands centered about
0.068, 0.078, 0.087, 0.097, 0.10, 0.117, 0.127, 0.136, and 0.146 Hz.
4.3 Results
Behavioral Results
Reaction times (RTs) for correct trials, for each condition and each participant, were
analyzed by ANOVA with factors of configuration (cue above the HM or target above the HM),
trial type (target appearing on cued or uncued side), attention type (predictive or nonpredictive
runs), and cue order (pre-cue or post-cue) as within-subject factors. As expected, performance on
the cued side was faster than performance on the uncued side (main effect of trial type: F(1,7) =
16.95, p < 0.01). In addition, there was a significant interaction of attention type and trial type
[F(1,7) = 8.79, p < 0.05], indicating that the difference between cued and uncued reaction times
(cueing effect) was larger when cues were predictive of target location (25 msec) compared to
when cues were nonpredictive of target location (5 msec). The interaction of cue order and trial
type was also significant [F(1,7) = 17.22, p < 0.01], indicating that the cueing effect was larger in
the pre-cue condition (32 msec; t(7) = 19.16, p < 0.01) compared to the post-cue condition (-2
msec; t(7) = 1.05). In addition, there was a significant three-way interaction of attention type,
trial type and cue order [F(1,7) = 9.44, p < 0.05]. This interaction was qualified by a separate
ANOVA for post-cue and pre-cue performance separately.
In the pre-cue procedure there was a significant interaction of trial type and attention type [F(1,7)
= 10.24, p < 0.05]. In the post-cue procedure there was no interaction of trial type and attention
type [F<1 ns] indicating that the temporal manipulation introduced by post cueing was a valid
control for sensory stimulation that has minimal attentional impact on target performance. None
of the remaining factors or interactions was significant. Figure 13E presents the RT data in the
form of cueing effects (RT difference between cued and uncued trials for the different
conditions).

35
Figure 13: Experimental procedure and RT data from Experiment 3
(a) Stimuli used for the face discrimination task and the corresponding response categories. In addition to the two
faces for discrimination, a third response category was used for target-absent trials. Trial procedure for (b) pre-cue
and (c) post-cue conditions. (d) Trial type proportion table. Note that trial proportions were the same for pre-and
post-cue conditions. However, as denoted by the used of quotation marks in the post-cue condition, a target is not
literally cued or uncued, given that the cues appear after the targets. (e) Behavioral data: Cueing effects calculated as
cued RT minus uncued RT in msec. Error bars represent the standard error of the difference between predictive and
nonpredictive performance for pre-cue (9 msec) and post-cue (5 msec) conditions.
36
An additional analysis was performed to establish that both cues in the predictive and in
the nonpredictive runs generated an attention effect that was significant. While voluntary
attention, engaged in the predictive run, produced large behavioral effects, it was important to
confirm that the cue to target spatial separation did not diminish the ability to capture involuntary
attention in the nonpredictive runs. Data from both configurations were combined, and cueing
effects were computed by subtracting cued trial types from uncued trial types. A one sample t-
test was performed for each attention condition separately. Cueing effects for both predictive
(mean 52 msec; t(7) = 4.08 p < 0.01) and nonpredictive blocks (mean 13 msec; t(7) = 2.65 p <
0.05) were significantly different from zero, indicating that the cue-target separation in this
experiment probed both voluntary (predictive runs) and involuntary (nonpredictive runs)
attention.
Imaging data
Coherency magnitudes
Coherency magnitudes for all pairwise combinations of ROIs within hemisphere (V1,
V2, V3, V4, V3A, V7, IPS1, IPS2, FEF, FFA) were calculated for each run separately. This
calculation was performed separately for cue related ROIs and for target related ROIs. For each
of forty-five pairs of ROIs (i.e. connections), an ANOVA with attention type (predictive or
nonpredictive), display configuration (cue above the HM or target above the HM) and
hemisphere (left or right) was performed. A full report of the main effects is presented in Tables
2-4.
Attention Type Effects
Figure 14 displays functional connectivity that was significantly affected by attention
type (voluntary or involuntary). The main finding revealed from this comparison is that
involuntary attention is associated with greater coherency magnitudes relative to voluntary
attention. That is, voluntary attention acts to reduce coupling among different regions within a
hemisphere. The pattern of effects for cue-related and target-related ROIs is similar. However,
there is a quantitative difference in the proportion of connections significantly altered by the
attention type manipulation for cue- and target-related ROIs. For target-related ROIs, there was
only a moderate number of connections affected by attention type (three) compared to cue-
related ROIs (ten). Given that the two attention types primarily differed in the spatial information
carried by the cue (rather than in target processing), this pattern is predicted.
Post cue control: This control was included to determine whether the effect of attention
type could be influenced by differences in display conditions over the course of a run. While the
stimuli for each trial type (cued compared to uncued) are identical, a predictive block contains
more unilateral stimulation (70% cued trials) compared to the nonpredictive block (equal
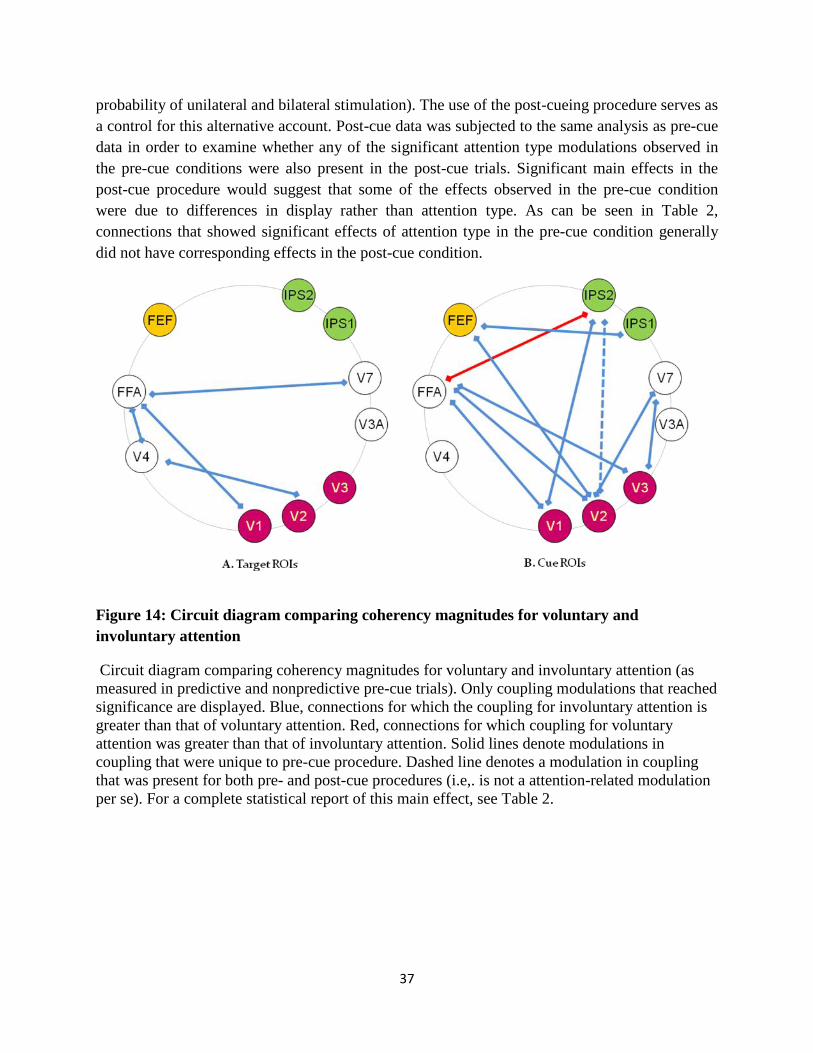
37
probability of unilateral and bilateral stimulation). The use of the post-cueing procedure serves as
a control for this alternative account. Post-cue data was subjected to the same analysis as pre-cue
data in order to examine whether any of the significant attention type modulations observed in
the pre-cue conditions were also present in the post-cue trials. Significant main effects in the
post-cue procedure would suggest that some of the effects observed in the pre-cue condition
were due to differences in display rather than attention type. As can be seen in Table 2,
connections that showed significant effects of attention type in the pre-cue condition generally
did not have corresponding effects in the post-cue condition.
Figure 14: Circuit diagram comparing coherency magnitudes for voluntary and
involuntary attention
Circuit diagram comparing coherency magnitudes for voluntary and involuntary attention (as
measured in predictive and nonpredictive pre-cue trials). Only coupling modulations that reached
significance are displayed. Blue, connections for which the coupling for involuntary attention is
greater than that of voluntary attention. Red, connections for which coupling for voluntary
attention was greater than that of involuntary attention. Solid lines denote modulations in
coupling that were unique to pre-cue procedure. Dashed line denotes a modulation in coupling
that was present for both pre- and post-cue procedures (i.e,. is not a attention-related modulation
per se). For a complete statistical report of this main effect, see Table 2.
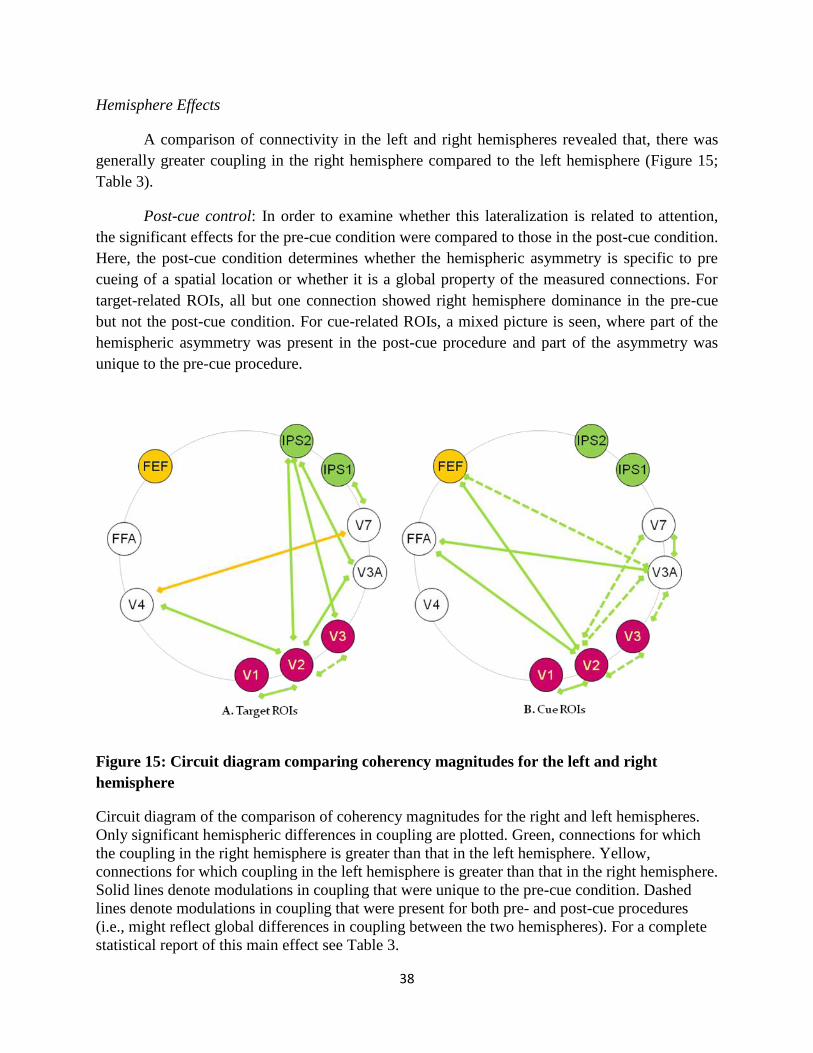
38
Hemisphere Effects
A comparison of connectivity in the left and right hemispheres revealed that, there was
generally greater coupling in the right hemisphere compared to the left hemisphere (Figure 15;
Table 3).
Post-cue control: In order to examine whether this lateralization is related to attention,
the significant effects for the pre-cue condition were compared to those in the post-cue condition.
Here, the post-cue condition determines whether the hemispheric asymmetry is specific to pre
cueing of a spatial location or whether it is a global property of the measured connections. For
target-related ROIs, all but one connection showed right hemisphere dominance in the pre-cue
but not the post-cue condition. For cue-related ROIs, a mixed picture is seen, where part of the
hemispheric asymmetry was present in the post-cue procedure and part of the asymmetry was
unique to the pre-cue procedure.
Figure 15: Circuit diagram comparing coherency magnitudes for the left and right
hemisphere
Circuit diagram of the comparison of coherency magnitudes for the right and left hemispheres.
Only significant hemispheric differences in coupling are plotted. Green, connections for which
the coupling in the right hemisphere is greater than that in the left hemisphere. Yellow,
connections for which coupling in the left hemisphere is greater than that in the right hemisphere.
Solid lines denote modulations in coupling that were unique to the pre-cue condition. Dashed
lines denote modulations in coupling that were present for both pre- and post-cue procedures
(i.e., might reflect global differences in coupling between the two hemispheres). For a complete
statistical report of this main effect see Table 3.

39
Target ROIs Cue ROIs
Pre Cue Procedure Post Cue Procedure Pre Cue Procedure Post Cue Procedure
ROI pair F(1,17) p sig F(1,17) p F(1,17) p sig F(1,17) p
FEF-FFA 2.1164 0.162 1.024 0.358 2.731 0.117 1.024 0.358
FEF-IPS1 0.1797 0.676 0.034 0.860 5.099 0.037 * 0.080 0.789
FEF-IPS2 1.8185 0.193 0.005 0.945 2.676 0.120 0.239 0.646
FEF-V1 0.8934 0.356 0.170 0.697 0.300 0.591 0.001 0.981
FEF-V2 1.1701 0.293 1.978 0.219 3.278 0.088 . 0.949 0.375
FEF-V3A 0.2225 0.643 0.779 0.418 0.927 0.349 7.281 0.043 *
FEF-V3 0.395 0.537 0.513 0.506 0.045 0.834 0.187 0.683
FEF-V4 1.4544 0.243 0.871 0.394 0.856 0.368 0.147 0.717
FEF-V7 0.0082 0.929 0.448 0.533 1.177 0.293 1.332 0.301
FFA-IPS1 1.4796 0.239 0.013 0.913 0.015 0.904 0.059 0.817
FFA-IPS2 1.6931 0.209 0.878 0.392 4.715 0.044 * 1.669 0.253
FFA-V1 6.1435 0.023 * 0.551 0.491 12.864 0.002 ** 0.064 0.810
FFA-V2 2.6038 0.123 1.589 0.263 5.512 0.031 * 0.042 0.846
FFA-V3A 1.6572 0.213 3.440 0.123 0.836 0.374 3.293 0.129
FFA-V3 2.578 0.125 3.607 0.116 7.505 0.014 * 2.205 0.198
FFA-V4 3.3294 0.084 0.242 0.644 0.404 0.534 4.201 0.096
FFA-V7 4.7055 0.043 * 0.382 0.564 0.003 0.957 3.481 0.121
IPS1-IPS2 1.8471 0.190 1.942 0.222 2.570 0.127 9.997 0.025 *
IPS1-V1 0.2239 0.642 0.210 0.666 4.104 0.059 . 1.173 0.328
IPS1-V2 0.0025 0.961 0.013 0.913 2.650 0.122 0.019 0.897
IPS1-V3A 0.9315 0.347 0.014 0.910 3.949 0.063 . 0.002 0.969
IPS1-V3 0.7598 0.394 0.360 0.575 2.633 0.123 0.161 0.705
IPS1-V4 1.1112 0.305 0.087 0.780 0.454 0.510 0.001 0.981
IPS1-V7 2.2605 0.149 1.159 0.331 1.690 0.211 0.044 0.843
IPS2-V1 1.6769 0.211 4.731 0.082 6.014 0.025 * 0.121 0.743
IPS2-V2 1.8943 0.185 0.043 0.844 14.722 0.001 ** 8.474 0.033 *
IPS2-V3A 2.774 0.112 0.061 0.815 0.000 0.986 0.206 0.669
IPS2-V3 3.7566 0.068 1.028 0.357 2.665 0.121 0.209 0.667
IPS2-V4 1.19E-05 0.997 2.158 0.202 0.096 0.761 0.421 0.545

40
Table 2 (continued)
Target ROIs Cue ROIs
Pre Cue Procedure Post Cue Procedure Pre Cue Procedure Post Cue Procedure
ROI pair F(1,17) p sig F(1,17) p F(1,17) p sig F(1,17) p
IPS2-V7 0.2783 0.604 0.154 0.711 1.457 0.244 0.097 0.768
V1-V2 0.0137 0.908 0.032 0.864 0.000 1.000 2.195 0.199
V1-V3A 1.4057 0.250 0.160 0.706 0.031 0.863 0.019 0.896
V1-V3 0.2139 0.649 3.374 0.126 0.089 0.770 5.081 0.074
V1-V4 0.1199 0.733 0.062 0.813 0.024 0.878 0.007 0.935
V1-V7 0.0001 0.993 0.609 0.471 0.739 0.402 0.182 0.688
V2-V3A 0.0051 0.944 0.025 0.880 0.037 0.850 0.696 0.442
V2-V3 1.0647 0.315 0.044 0.842 0.763 0.395 1.388 0.292
V2-V4 4.3754 0.050 * 0.103 0.761 0.000 0.993 0.931 0.379
V2-V7 0.9398 0.345 0.020 0.894 5.409 0.033 * 2.235 0.195
V3A-V3 1.1756 0.292 1.261 0.313 0.000 0.995 0.056 0.823
V3A-V4 1.6332 0.217 0.122 0.741 0.009 0.925 0.000 0.995
V3A-V7 0.0882 0.770 0.128 0.735 3.905 0.065 . 5.053 0.074
V3-V4 1.4997 0.236 0.364 0.573 0.003 0.959 0.045 0.841
V3-V7 1.1612 0.295 0.008 0.931 4.424 0.051 . 0.709 0.438
V4-V7 3.1616 0.091 0.044 0.842 0.111 0.743 1.133 0.336
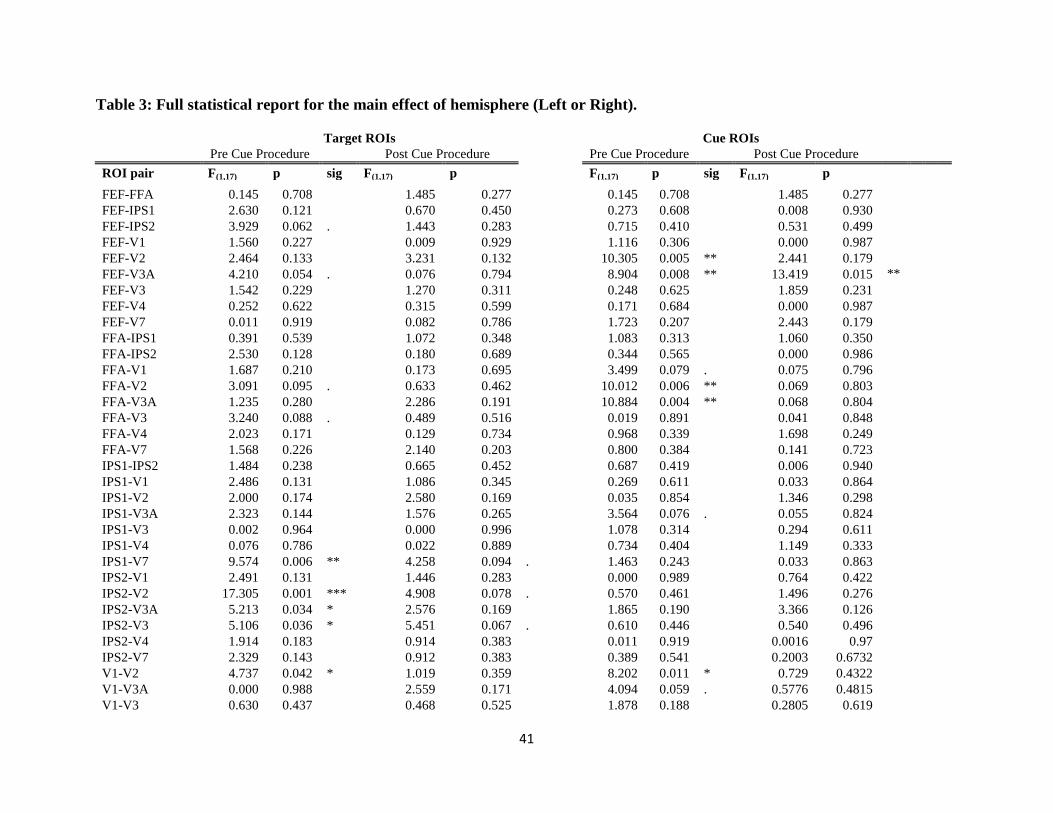
41
Table 3: Full statistical report for the main effect of hemisphere (Left or Right).
Target ROIs Cue ROIs
Pre Cue Procedure Post Cue Procedure Pre Cue Procedure Post Cue Procedure
ROI pair F(1,17) p sig F(1,17) p F(1,17) p sig F(1,17) p
FEF-FFA 0.145 0.708 1.485 0.277 0.145 0.708 1.485 0.277
FEF-IPS1 2.630 0.121 0.670 0.450 0.273 0.608 0.008 0.930
FEF-IPS2 3.929 0.062 . 1.443 0.283 0.715 0.410 0.531 0.499
FEF-V1 1.560 0.227 0.009 0.929 1.116 0.306 0.000 0.987
FEF-V2 2.464 0.133 3.231 0.132 10.305 0.005 ** 2.441 0.179
FEF-V3A 4.210 0.054 . 0.076 0.794 8.904 0.008 ** 13.419 0.015 **
FEF-V3 1.542 0.229 1.270 0.311 0.248 0.625 1.859 0.231
FEF-V4 0.252 0.622 0.315 0.599 0.171 0.684 0.000 0.987
FEF-V7 0.011 0.919 0.082 0.786 1.723 0.207 2.443 0.179
FFA-IPS1 0.391 0.539 1.072 0.348 1.083 0.313 1.060 0.350
FFA-IPS2 2.530 0.128 0.180 0.689 0.344 0.565 0.000 0.986
FFA-V1 1.687 0.210 0.173 0.695 3.499 0.079 . 0.075 0.796
FFA-V2 3.091 0.095 . 0.633 0.462 10.012 0.006 ** 0.069 0.803
FFA-V3A 1.235 0.280 2.286 0.191 10.884 0.004 ** 0.068 0.804
FFA-V3 3.240 0.088 . 0.489 0.516 0.019 0.891 0.041 0.848
FFA-V4 2.023 0.171 0.129 0.734 0.968 0.339 1.698 0.249
FFA-V7 1.568 0.226 2.140 0.203 0.800 0.384 0.141 0.723
IPS1-IPS2 1.484 0.238 0.665 0.452 0.687 0.419 0.006 0.940
IPS1-V1 2.486 0.131 1.086 0.345 0.269 0.611 0.033 0.864
IPS1-V2 2.000 0.174 2.580 0.169 0.035 0.854 1.346 0.298
IPS1-V3A 2.323 0.144 1.576 0.265 3.564 0.076 . 0.055 0.824
IPS1-V3 0.002 0.964 0.000 0.996 1.078 0.314 0.294 0.611
IPS1-V4 0.076 0.786 0.022 0.889 0.734 0.404 1.149 0.333
IPS1-V7 9.574 0.006 ** 4.258 0.094 . 1.463 0.243 0.033 0.863
IPS2-V1 2.491 0.131 1.446 0.283 0.000 0.989 0.764 0.422
IPS2-V2 17.305 0.001 *** 4.908 0.078 . 0.570 0.461 1.496 0.276
IPS2-V3A 5.213 0.034 * 2.576 0.169 1.865 0.190 3.366 0.126
IPS2-V3 5.106 0.036 * 5.451 0.067 . 0.610 0.446 0.540 0.496
IPS2-V4 1.914 0.183 0.914 0.383 0.011 0.919 0.0016 0.97
IPS2-V7 2.329 0.143 0.912 0.383 0.389 0.541 0.2003 0.6732
V1-V2 4.737 0.042 * 1.019 0.359 8.202 0.011 * 0.729 0.4322
V1-V3A 0.000 0.988 2.559 0.171 4.094 0.059 . 0.5776 0.4815
V1-V3 0.630 0.437 0.468 0.525 1.878 0.188 0.2805 0.619

42
Table 3 (continued)
Target ROIs Cue ROIs
Pre Cue Procedure Post Cue Procedure Pre Cue Procedure Post Cue Procedure
ROI pair F(1,17) p sig F(1,17) p F(1,17) p sig F(1,17) p
V1-V4 0.447 0.512 0.076 0.794 0.175 0.681 0.241 0.645
V1-V7 0.624 0.439 0.362 0.574 2.611 0.125 2.157 0.202
V2-V3A 13.667 0.002 ** 1.659 0.254 9.875 0.006 ** 10.974 0.021
V2-V3 72.537 0.000 *** 11.279 0.020 * 23.183 0.000 *** 18.580 0.008
V2-V4 4.638 0.044 * 0.896 0.387 1.691 0.211 1.721 0.247
V2-V7 0.805 0.381 1.703 0.249 15.970 0.001 *** 9.421 0.028 *
V3A-V3 0.001 0.974 0.035 0.859 5.116 0.037 * 9.616 0.027 *
V3A-V4 0.586 0.453 1.740 0.244 0.036 0.852 0.838 0.402
V3A-V7 0.120 0.732 0.096 0.769 6.649 0.020 * 2.538 0.172
V3-V4 0.820 0.377 0.205 0.670 2.486 0.133 0.080 0.788
V3-V7 0.030 0.865 0.387 0.561 2.195 0.157 4.349 0.091
V4-V7 10.942 0.004 ** 0.012 0.916 3.409 0.082 . 0.031 0.866

43
Full statistical report for the main effect of configuration (cue above HM or target above HM).
Target ROIs Cue ROIs
Pre Cue Procedure Post Cue Procedure Pre Cue Procedure Post Cue Procedure
ROI pair F(1,17) p sig F(1,17) p F(1,17) p sig F(1,17) p
FEF-FFA 7.926 0.012 * 0.002 0.967 7.926 0.012 0.002 0.967
FEF-IPS1 0.029 0.868 0.390 0.560 2.663 0.121 0.149 0.715
FEF-IPS2 0.917 0.355 6.483 0.052 . 0.134 0.719 0.022 0.889
FEF-V1 11.623 0.004 ** 0.514 0.505 1.264 0.277 0.112 0.752
FEF-V2 2.151 0.165 0.003 0.959 0.986 0.335 0.125 0.738
FEF-V3A 0.559 0.467 4.067 0.100 . 0.819 0.378 0.365 0.572
FEF-V3 17.242 0.001 *** 1.023 0.358 0.035 0.854 1.978 0.219
FEF-V4 4.929 0.043 * 0.013 0.915 6.446 0.021 1.057 0.351
FEF-V7 0.098 0.759 2.197 0.198 4.949 0.040 0.313 0.600
FFA-IPS1 0.011 0.919 0.276 0.622 0.148 0.705 0.096 0.769
FFA-IPS2 3.176 0.096 . 0.092 0.774 0.063 0.804 0.062 0.813
FFA-V1 5.127 0.040 * 0.280 0.619 2.125 0.163 0.000 0.999
FFA-V2 2.140 0.166 0.016 0.905 0.190 0.668 0.078 0.791
FFA-V3A 0.021 0.886 0.578 0.482 0.015 0.905 0.643 0.459
FFA-V3 12.894 0.003 ** 0.783 0.417 0.017 0.899 4.387 0.090
FFA-V4 0.027 0.872 0.050 0.833 0.000 0.984 0.005 0.949
FFA-V7 1.856 0.195 0.175 0.693 0.077 0.785 0.002 0.964
IPS1-IPS2 1.135 0.305 1.568 0.266 2.381 0.141 0.088 0.779
IPS1-V1 0.345 0.566 0.468 0.524 0.017 0.898 0.233 0.650
IPS1-V2 0.124 0.730 0.381 0.564 0.645 0.433 0.464 0.526
IPS1-V3A 0.005 0.945 0.018 0.899 0.811 0.380 0.082 0.786
IPS1-V3 0.570 0.463 0.060 0.816 0.644 0.433 0.059 0.818
IPS1-V4 1.764 0.205 1.538 0.270 1.889 0.187 0.010 0.924
IPS1-V7 3.497 0.083 . 0.865 0.395 0.112 0.742 0.391 0.559
IPS2-V1 8.096 0.013 * 1.017 0.360 1.089 0.311 0.148 0.716
IPS2-V2 7.394 0.017 * 3.560 0.118 0.007 0.933 0.024 0.883
IPS2-V3A 4.193 0.060 . 0.811 0.409 0.396 0.537 0.102 0.762
IPS2-V3 2.958 0.108 0.142 0.722 1.833 0.194 5.955 0.059
IPS2-V4 5.415 0.035 * 7.451 0.041 * 0.542 0.472 0.001 0.982
IPS2-V7 6.353 0.024 * 2.885 0.150 4.490 0.049 0.742 0.428
V1-V2 0.119 0.735 0.029 0.872 0.749 0.399 0.006 0.941
V1-V3A 0.247 0.627 0.578 0.481 0.070 0.795 0.015 0.907

44
Table 4 (continued)
Target ROIs Cue ROIs
Pre Cue Procedure Post Cue Procedure Pre Cue Procedure Post Cue Procedure
ROI pair F(1,17) p sig F(1,17) p F(1,17) p sig F(1,17) p
V1-V3 7.067 0.019 * 2.884 0.150 4.071 0.060 4.574 0.085
V1-V4 0.279 0.605 2.213 0.197 0.493 0.492 0.457 0.529
V1-V7 2.000 0.179 0.354 0.578 0.000 0.997 0.704 0.440
V2-V3A 0.117 0.737 0.070 0.802 0.262 0.615 0.210 0.666
V2-V3 4.244 0.058 . 0.637 0.461 0.683 0.420 0.325 0.593
V2-V4 3.620 0.078 . 0.005 0.946 0.946 0.344 0.235 0.649
V2-V7 0.063 0.806 0.466 0.525 1.187 0.291 0.266 0.628
V3A-V3 2.737 0.120 0.002 0.966 1.078 0.314 0.079 0.790
V3A-V4 0.204 0.658 2.296 0.190 0.145 0.708 0.001 0.979
V3A-V7 0.032 0.861 0.004 0.954 0.292 0.596 0.382 0.563
V3-V4 73.893 0.000 *** 4.502 0.087 . 8.301 0.010 5.679 0.063
V3-V7 0.413 0.531 0.684 0.446 0.087 0.772 0.022 0.888
V4-V7 0.187 0.672 1.363 0.296 0.138 0.715 0.002 0.964

4.4 Discussion
The studies described here represent a first step towards characterizing network dynamics
mediating voluntary and involuntary attention. The current investigation focused on previously
identified regions in the brain shown to be engaged in attention tasks (Corbetta and Shulman,
2002; Serences and Yantis, 2006). One main finding was that, compared to involuntary attention,
voluntary attention reduced coupling between many pairs of regions within the previously
postulated attention network. Cue and target separation on either side of the horizontal meridian
in the stimulus display allowed separate examination of target and cue regions. This approach
revealed that the differences between voluntary and involuntary attention are more pronounced
for cue-related ROIs than target-related ROIs. Voluntary and involuntary attention showed
similar degrees of coupling within target-related ROIs. This result was consistent with the nature
of the attention manipulation. The voluntary and involuntary conditions differed primarily in the
information carried by the cue. Hence, the cue, and not the target, was the aspect of the task that
either captured involuntary attention (when the cue location was random with respect to target
location) or which also summoned voluntary attention (when the cue was informative). This
pattern of coupling for the two types of attention was not evident in a post-cue procedure,
supporting the conclusion that it can be attributed to differences in attention type rather than
display conditions (i.e. proportion of bilateral compared to unilateral trials).
An important difference between the current investigation and previous studies probing
networks of attention is the temporal scale at which inferences are made. While many studies
investigated spatial attention (mostly voluntary) at the single trial level, the data reported here
provided a comparison of coupling under two continuous states (since the measurement of
coherency is over an entire six minute run). In one state, the system was biased to use the
information carried by the cues and voluntarily summoned visual attention to the cued side. In
the other state, participants did not employ voluntary attention, and the cues only captured
involuntary attention. Despite differences in the temporal scale of analysis, I will cautiously
discuss the present findings in light of previous work.
The finding of reduced coupling in voluntary relative to involuntary attention stands in
contrast to the common intuition about the way voluntary attention operates. For example, a
popular model for brain attention networks suggested by Corbetta and Shulman (Corbetta and
Shulman, 2002) has two main parts that map onto the distinction between top-down attention and
stimulus-driven attention (similar to the current use of the terms voluntary and involuntary
spatial attention). The dorsal network is thought to govern "top-down" attentional control and the
ventral network is thought to be related to stimulus-driven attention. The dorsal network includes
regions such as the FEF and the IPS, while the ventral network is lateralized to the right
hemisphere, including ventral frontal cortex as well as temporal parietal junction areas. In the
right hemisphere, the model postulates an interaction between the ventral and dorsal networks for
attention. In the present study we chose to only examine regions that can be functionally
46
localized, therefore our investigation was focused on the "dorsal" component of the network.
Given that the ventral loci of the postulated attention network are not readily defined
functionally, these regions would require a different approach for investigation (i.e. a seed
analysis where coherency is computed for a time series from a functionally defined region and
individual voxels in other portions of the brain).
Focusing on the "dorsal" component of the model, other researchers have suggested that
spatially selective responses in parietal and occipital as well as frontal attention regions give rise
to a distributed representation of attention maps that are the results of the joint influence of
voluntary and stimulus-driven attention on neural activity (Kastner and Ungerleider, 2003;
Serences and Yantis, 2006; Serences and Yantis, 2007). As previously discussed in the
Introduction, these inferences lack direct evidence and are typically based on the aggregation of
disparate BOLD responses in attention tasks.
While the current approach allowed quantification of relative engagement of the network
in the two attention conditions, we did not present a baseline condition to which we could
compare degrees of voluntary and involuntary attention separately. As a result, we did not make
claims regarding exclusiveness of the network for one system or the other. However, we can
conclude that while this network might be engaged in both types of attention, involuntary
(stimulus-driven) attention is associated with increased levels of coupling in the network. One
could postulate that involuntary capture of attention is a heightened state of stimulus sensitivity,
and that the greater degrees of coupling with involuntary attention are in fact indicating that the
network is cohering with the external stimulus events. In contrast, voluntary attention can be
thought of as a state in which this coupling with external events is reduced by internal goals
directing attention to parts of the external environment and away from other parts of it.
Another possible interpretation of these findings is that a heightened state of coupling
within the dorsal attention network during involuntary attention is the result of an active effort to
ignore the uninformative cues. This account has a clear behavioral prediction. If indeed ignoring
the cues is an active and effortful process, behavioral attention effects (the differences in reaction
times between the cued and uncued trials) should reflect this effort and result in longer RTs in
the cued location. However this was not the case. Significant cueing effects were measured in the
involuntary attention condition albeit smaller than those in the voluntary attention condition.
In a study by Liu and colleagues (Liu et al., 2005), cue and target separation as well as
temporal order manipulation were used in the cueing paradigm to measure involuntary attention
effects in early visual cortical areas. Using an uninformative cue with a short SOA, they found
greater responses in target ROIs of retinotopic cortices when (pre) cue and target were on the
same side compared to the rest of the conditions (uncued pre and post cues and cued post cue).
Liu et al. (2005) report results only from target-related ROIs. In the current study, we found that
the portions of retinotopic cortical areas representing the cue play an important role in
differences in coupling between involuntary and voluntary attention. It is possible that had they

47
measured the cue ROIs as well, those would complete the picture and converge with the findings
reported here.
A few previous studies investigated both voluntary and involuntary attention within the
same event related design (Kincade et al., 2005; Mayer et al., 2004). A common limitation of
these studies is the use of different stimulus displays for voluntary and involuntary attention. For
example, Kincade et al. investigated voluntary attention with a central cue and involuntary
attention using a color singleton appearing prior to target onset. While an effort was made to
keep the two display types similar, they were not visually identical, resulting in a stimulus
confound when comparing neural correlates of voluntary and involuntary attention. In addition,
the temporal lag between the cue and the target in the fMRI session was over two seconds, a
temporal interval that is probably too long for the investigation of involuntary attention (for a
similar approach see (Mayer et al., 2004). At the event level, Kincade et al. found greater
responses in FEF and IPS when voluntary attention was employed compared to involuntary
attention. In addition they found that these dorsal regions were also engaged when involuntary
attention was captured (compared to a neutral cue). As previously discussed, the occurrence of
activity in these regions were merely suggestive of the presence of a network, and differences in
magnitude of univariate response did not provide a clear prediction regarding the amount of
coupling between the regions. However, the excessively long cue-target interval and differences
in the display condition for the two attention types limited interpretation of the magnitude
differences in univariate response.
Bressler et al. (Bressler et al., 2008) recently examined effective connectivity among
dorsal attention regions in a voluntary attention cueing paradigm. Participants had to
discriminate orientation of a grating following an auditory cue that was 75% predictive of grating
location. The use of Granger causality examined the amount of improvement of the prediction of
a given time series when taking into account the information from another time series (Goebel et
al., 2003; Kayser et al., 2009; Roebroeck et al., 2005). Granger causality analysis was performed
at the event level, revealing that including time series from FEF and IPS4 regions improved the
prediction of the time series for early visual areas. This study provided support for the existence
of significant coupling among frontal, parietal and visual areas during voluntary attention. Our
data extend this finding and reveal that involuntary attention produced even greater coupling
between the investigated regions than voluntary attention.
In a recent paper (Lauritzen et al., 2009), fMRI coherency was employed to measure
functional connectivity associated with sustained visual spatial attention. In this study, trained
participants were required to detect the presence of a pre-learned stimulus (attention condition).
fMRI coherency in this condition was contrasted with coherency obtained from a passive
fixation condition, revealing several significant differences in the degree of coupling in visual
cortical areas as well as IPS regions. While it is tempting to compare the current connectivity
4 Importantly Bressler et al did not utilize topographic mapping of parietal attention regions.
48
diagrams to Lauritzen et al.'s data it is important to recognize that the two studies were designed
to investigate different types of attention, under very different trial conditions. First, the type of
attention investigated in Lauritzen et al. and here operate on a different time scales. The
sustained attention task examined in Lauritzen et al. spanned several seconds, while here we
measured attention effects that occur on a time scale of hundreds of milliseconds. Moreover, The
sustained spatial attention examined in Lauritzen et al. isolated attention at a set location while in
the present study both voluntary and involuntary attention include the shift of attention to
different locations. Lauritzen et al. also measured the maintenance of attention in the absence of
visual stimulation, while the present study had both cue and target onsets throughout trials
probing both voluntary and involuntary attention. Last, Lauritzen et al. investigated sustained
spatial attention compared to a passive viewing condition while the present study contrasted two
different types of attention, voluntary compared to involuntary attention. These fundamental
differences make it difficult to compare the two studies.
The present study also provides insights into task-specific hemispheric asymmetries. For
both voluntary and involuntary conditions, there was greater right- compared to left-hemisphere
coupling. For target-related ROIs, this effect was specific to the pre-cueing procedure in which
attention (voluntary and involuntary) was directed prior to target onset. When cues were
presented after the target (post-cue procedure), degrees of coupling within the two hemispheres
were mostly equivalent for target-related ROIs. Interestingly, the conditions for which laterality
effects in the degree of coupling occurred are the conditions exhibiting the greatest behavioral
advantages of spatial attention (cueing effects in both voluntary and involuntary pre-cueing).
Further, the minimal differences in coupling between the hemispheres in the post-cue procedure
suggests that the differences found in the pre-cue procedure cannot be attributed to differences
due to right hemisphere dominance in face processing (Kanwisher et al., 1997). Rather, the
hemispheric difference in target-related ROI coupling is specific to attentional orienting. For
cue-related ROIs, a more mixed set of effects is found. Half of the significant connections
showing hemispheric asymmetry were unique to the pre-cue condition, and half were shared by
both pre- and post-cue conditions, suggesting the existence of global asymmetries between the
hemispheres. These data are consistent with theories suggesting that the right hemisphere plays a
key role in the orienting of spatial attention (Mesulam, 1999) and with studies reporting left
visual field (LVF) advantages in IPS regions (Siman-Tov et al., 2007). In fact, Siman-Tov et al.
hypothesize that LVF advantages might be due to enhanced connectivity within the right
hemisphere (Barnett and Corballis, 2005; de Schotten et al., 2005). The authors imply that
anatomical asymmetries might support this hypothesis. Our data provide evidence supporting
this hypothesis in the form of greater right hemisphere coupling. However, these results also
suggest that the differences in coupling between the hemispheres are at least partly task-related
and not entirely structural. Hemispheric asymmetries in coupling between brain regions provides
a mechanistic account for the fact that right hemisphere lesions more often result in persistent
deficits of spatial attention than left hemisphere lesions (Mesulam, 1999).

49
In conclusion, the present study provides evidence for increased coupling among visual
cortices, IPS regions and FEF regions for involuntary attention compared to voluntary attention.
These findings suggest a new way of thinking about the dynamic interactions of voluntary and
involuntary states of spatial attention. In addition, these results provide evidence that voluntary
attention acts to disrupt a state of heightened synchronization with external events capturing
involuntary attention. Both the voluntary and involuntary orienting measured here were
associated with right hemisphere dominance in coupling of fMRI signals. Since both conditions
share the salient onsets that capture involuntary attention, it is likely that the right hemisphere
dominance is associated with the consequences of involuntary attention capture on target
processing.

50
5. References
Banich MT. The missing link: The role of interhemispheric interaction in attentional processing.
Brain and Cognition, 1998; 36: 128-57.
Barnett KJ, Corballis MC. Speeded right-to-left information transfer: the result of speeded
transmission in right-hemisphere axons? Neuroscience Letters, 2005; 380: 88-92.
Bentin, S., T. Allison, et al. (1996). Electrophysiological studies of face perception in humans.
Journal of Cognitive Neuroscience 8:551-556.
Berger, A., Henik, A., & Rafal, R. (2005). Competition Between Endogenous and Exogenous
Orienting of Visual Attention. Journal of Experimental Psychology: General 134(2):
207-221.
Bressler SL, Tang W, Sylvester CM, Shulman GL, Corbetta M. Top-Down Control of Human
Visual Cortex by Frontal and Parietal Cortex in Anticipatory Visual Spatial Attention.
Journal of Neuroscience, 2008; 28: 10056-61.
Brillinger DR. Time Series: Data Analysis and Theory. Society for Industrial and Applied
Mathematics: Philadelphia., 2001.
Bruce CJ, Goldberg ME. Primate frontal eye fields. I. Single neurons discharging before
saccades. Journal of Neurophysiology, 1985; 53: 603-35.
Buschman TJ, Miller EK. Top-down versus bottom-up control of attention in the prefrontal and
posterior parietal cortices. Science, 2007b; 315: 1860.
Carmel D, Bentin S. Domain specificity versus expertise: factors influencing distinct processing
of faces. Cognition, 2002; 83: 1.
Chambers CD, Mattingley JB. Neurodisruption of selective attention: insights and implications.
Trends in Cognitive Sciences, 2005; 9: 542.
Connolly JD, Goodale MA, Menon RS, Munoz DP. Human fMRI evidence for the neural
correlates of preparatory set. Nature Neuroscience, 2002; 5: 1345.
Corbetta M, Shulman GL. Control of goal-directed and stimulus-driven attention in the brain.
Nature Reviews Neuroscience, 2002; 3: 201-15.
Corbetta, M. (1998). Frontoparietal cortical networks for directing attention and the eye to visual
locations: Identical, independent, or overlapping neural systems? PNAS 95(3): 831-838.
Cordes D, Haughton VM, Arfanakis K, Carew JD, Turski PA, Moritz CH, Quigley MA,
Meyerand ME. Frequencies Contributing to Functional Connectivity in the Cerebral
Cortex in "Resting-state" Data. AJNR Am J Neuroradiol, 2001; 22: 1326-33.
de Schotten MT, Urbanski M, Duffau H, Volle E, Levy R, Dubois B, Bartolomeo P. Direct
Evidence for a Parietal-Frontal Pathway Subserving Spatial Awareness in Humans.
Science, 2005; 309: 2226-8.
Delorme, A. and S. Makeig (2004). EEGLAB: an open source toolbox for analysis of single-trial
EEG dynamics including independent component analysis. Journal of Neuroscience
Methods 134(1): 9.
Di Russo F, Martinez A, Hillyard SA. Source Analysis of Event-related Cortical Activity during
Visuo-spatial Attention. Cerebral Cortex, 2003; 13: 486-99.
Doallo, S., L. Lorenzo-Lopez, et al. (2005). Modulations of the visual N1 component of event-
related potentials by central and peripheral cueing. Clinical Neurophysiology 116(4): 807.
51
Ellison A, Lane AR, Schenk T. (2007) The Interaction of Brain Regions during Visual Search
Processing as Revealed by Transcranial Magnetic Stimulation. Cerebral Cortex,
11:7:606-618.
Endrass T, Mohr B, Rockstroh B. Reduced interhemispheric transmission in schizophrenia
patients: evidence from event-related potentials. Neuroscience Letters, 2002; 320: 57.
Engel SA, Rumelhart DE, Wandell BA, Lee AT, Glover GH, Chichilnisky EJ, Shadlen MN.
(1994) fMRI of human visual cortex. Nature, 369(6481), 525.
Esterman M, Prinzmetal W, DeGutis J, Landau A, Hazeltine E, Verstynen T, Robertson L.
(2008). Voluntary and involuntary attention affect face discrimination differently.
Neuropsychologia, 46: 1032.
Fan, J., J. Byrne, et al. (2007). The Relation of Brain Oscillations to Attentional Networks.
Journal of Neuroscience. 27(23): 6197-6206.
Fries, P., Reynolds JH., Rorie, AE and Desimone R. (2001). Modulation of Oscillatory Neuronal
Synchronization by Selective Visual Attention. Science 291(5508): 1560.
Friston KJ, Buchel C. (2000) Attentional modulation of effective connectivity from V2 to
V5/MT in humans. PNAS, 97: 7591-6.
Gandhi SP, Heeger DJ, Boynton GM. (1999) Spatial attention affects brain activity in human
primary visual cortex. PNAS. 96:6:3314-3319
Gazzaniga, M. S., R. B. Ivry, et al. (1998). Cognitive neuroscience: The biology of the mind.
New York, W.W. Norton: 223.
Goebel R, Roebroeck A, Kim DS, Formisano E. (2003) Investigating directed cortical
interactions in time-resolved fMRI data using vector autoregressive modeling and
Granger causality mapping. Magnetic resonance imaging, 21: 1251-61.
Grosbras MH, Paus T. (2003) Transcranial magnetic stimulation of the human frontal eye field
facilitates visual awareness. European Journal of Neuroscience, 2003; 18: 3121-6.
Gruber, T., M. Müller, et al. (1999). Selective visual-spatial attention alters induced gamma-band
responses in the human EEG. Clinical neurophysiology 110(12): 2074.
Helmholtz, H. von. (1925). Handbuch der physiologischen optik [Treatise on physiological
optics] (Vol. 3). Lancaster, PA: Optical Society of America
Herrmann CS, Munk MHJ, Engel AK (2004). Cognitive functions of gamma-band activity:
memory match and utilization. Trends in Cognitive Sciences 8(8): 347.
Hillyard SA, Vogel EK, Luck SJ. (1998). Sensory gain control (amplification) as a mechanism of
selective attention: electrophysiological and neuroimaging evidence. Philosophical
Transactions of the Royal Society of London. Series B: Biological Sciences; 353: 1257-
70.
Hopfinger, JB and Ries AJ (2005). Automatic Versus Contingent Mechanisms of Sensory-
Driven Neural Biasing and Reflexive Attention. Journal of Cognitive Neuroscience
17(8): 1341-1352.
Hopfinger, JB and West, VM (2006). Interactions between endogenous and exogenous attention
on cortical visual processing NeuroImage 31(2): 774-789.
Jenkinson M, Bannister P, Brady M, Smith S. (2002). Improved Optimization for the Robust and
Accurate Linear Registration and Motion Correction of Brain Images. NeuroImage, 17:
825-41.
Jonides, J. (1981). Voluntary versus automatic control over the mind's eye's movement.
Attention and Performance IX. A. D. B. J. B. Long. Hillsdale, N.J, Erlbaum: 187-204.

52
Juan CH, Shorter-Jacobi SM, Schall JD (2004). Dissociation of spatial attention and saccade
preparation. PNAS, 101: 15541-4.
Kanwisher N, McDermott J, Chun MM. (1997) The Fusiform Face Area: A Module in Human
Extrastriate Cortex Specialized for Face Perception. Journal of Neuroscience. 17: 4302-
11.
Kastner S, Ungerleider LG. (2003) Mechanisms of visual attention in the human cortex. Annual
Reviews of Neuroscience. 23:315-341.
Kayser A, S., Sun F, T. , D'Esposito M. (2009). A comparison of Granger causality and
coherency in fMRI-based analysis of the motor system. Human Brain Mapping. 30:
3475-94.
Kincade, JM, Abrams, RA, Serguei VA, Shulman G L and Corbetta M. (2005). An event-related
functional magnetic resonance imaging study of voluntary and stimulus-driven orienting
of attention. Journal of Neuroscience 25(18): 590-600.
Koch G, Oliveri M, Torriero S, Caltagirone C. (2005) Modulation of excitatory and inhibitory
circuits for visual awareness in the human right parietal cortex. Experimental Brain
Research, 160: 510-6.
Landau AN, Esterman M, Robertson LC, Bentin S, Prinzmetal W. (2007) Different Effects of
Voluntary and Involuntary Attention on EEG Activity in the Gamma Band. Journal of
Neuroscience, 27: 11986-90.
Lauritzen TZ, D‟Esposito M, Heeger DJ, Silver MA. (2009) Top-down flow of visual spatial
attention. Journal of Vision, 9(13):18, 1-14.
Liu T, Pestilli F, Carrasco M. (2005) Transient Attention Enhances Perceptual Performance and
fMRI Response in Human Visual Cortex. Neuron, 45: 469-77.
Luck, SJ, Hillyard SA, Mouloua, M., Woldorff, MG., Clark, VP. and Hawkins, HL. (1994).
Effects of Spatial Cueing on Luminance Detectability: Psychophysical and
Electrophysiological Evidence for Early Selection. Journal of Experimental Psychology:
Human Perception and Performance, 20(4): 887-904.
Makeig, S. (1993). Auditory event-related dynamics of the EEG spectrum and effects of
exposure to tones. Electroencephalography and Clinical Neurophysiology, 86(4): 283.
Mangun, G. R. and S. A. Hillyard (1991). Modulations of Sensory-Evoked Brain Potentials
Indicate Changes in Perceptual Processing During Visual-Spatial Priming. Journal of
Experimental Psychology: Human Perception and Performance, 17(4): 1057-1074.
Martinez A, Anllo-Vento L, Sereno MI, Frank LR, Buxton RB, Dubowitz DJ, Wong EC,
Hinrichs H, Heinze HJ, Hillyard SA. (1999) Involvement of striate and extrastriate visual
cortical areas in spatial attention. Nature Neuroscience, 2: 364-9.
Mayer AR, Dorflinger JM, Rao SM, Seidenberg M. (2004). Neural networks underlying
endogenous and exogenous visual-spatial orienting. NeuroImage, 23: 534-41.
Mesulam MM. (1981). A cortical network for directed attention and unilateral neglect. Annals of
Neurology, 10: 309-25.
Mesulam MM. (1999) Spatial Attention and Neglect: Parietal, Frontal and Cingulate
Contributions to the Mental Representation and Attentional Targeting of Salient
Extrapersonal Events. Philosophical Transactions: Biological Sciences, 354: 1325-46.
Motter BC. (1993). Focal attention produces spatially selective processing in visual cortical areas
V1, V2, and V4 in the presence of competing stimuli. Journal of Neurophysiology, 70:
909-19.

53
Muggleton NG, Juan CH, Cowey A, Walsh V. (2003). Human Frontal Eye Fields and Visual
Search. Journal of Neurophysiology, 89: 3340-3.
Muggleton NG, Postma P, Moutsopoulou K, Nimmo-Smith I, Marcel A, Walsh V. (2006). TMS
over right posterior parietal cortex induces neglect in a scene-based frame of reference.
Neuropsychologia, 44: 1222-9.
Müller, HJ, & Rabbitt, PMA (1989). Reflexive and voluntary orienting of visual attention: Time
course of activation and resistance to interruption. Journal of Experimental Psychology:
Human Perception and Performance, 15: 315-330.
Muller, MM, Teder-Salejervi W. and Hillyard SA. (1998). The time course of cortical facilitatin
during cued shifts of spatial attention. Nature Neuroscience, 1(7): 631-634.
Nichols TE, Holmes AP (2002). Nonparametric permutation tests for functional neuroimaging: a
primer with examples. Human Brain Mapping, 15: 1-25.
O'Shea J, Walsh V. (2004). Visual Awareness: The Eye Fields Have It? Current Biology, 14:
R279.
Posner MI, Petersen SE. (1990). The Attention System of the Human Brain. Annual Review of
Neuroscience, 13: 25-42.
Posner MI. (1980) Orienting of attention. Quarterly Journal of Experimental Psychology, 32: 3-
25.
Posner, MI (1978). Chronometric explorations of mind. Hillsdale, N.J., Erllbaum.
Pourtois G, Vandermeeren Y, Olivier E, de Gelder B. (2001). Event-related TMS over the right
posterior parietal cortex induces ipsilateral visuo-spatial interference. NeuroReport, 12:
2369-74.
Prinzmetal W, Long V, Leonhardt J. (2008). Involuntary attention and brightness contrast.
Perception & Psychophysics, 70: 1139-50.
Prinzmetal, W., C. McCool, et al. (2005). Attention: Reaction Time and Accuracy Reveal
Different Mechanisms. Journal of Experimental Psychology: General 134(1): 73-92.
Roebroeck A, Formisano E, Goebel R. (2005). Mapping directed influence over the brain using
Granger causality and fMRI. NeuroImage, 25: 230-42.
Ruff CC, Bestmann S, Blankenburg F, Bjoertomt O, Josephs O, Weiskopf N, Deichmann R,
Driver J. (2008). Distinct Causal Influences of Parietal Versus Frontal Areas on Human
Visual Cortex: Evidence from Concurrent TMS-fMRI. Cerebral Cortex, 18: 817-27.
Ruff CC, Blankenburg F, Bjoertomt O, Bestmann S, Freeman E, Haynes J-D, Rees G, Josephs
O, Deichmann R, Driver J. (2006). Concurrent TMS-fMRI and Psychophysics Reveal
Frontal Influences on Human Retinotopic Visual Cortex. Current Biology, 16: 1479-88.
Saron CD, Davidson RJ. (1989) Visual evoked potential measures of interhemispheric transfer
time in humans. Behavioral Neuroscience, 103: 15-1.
Serences JT, Yantis S. (2006) Selective visual attention and perceptual coherence. Trends in
Cognitive Sciences, 10: 38-45.
Serences JT, Yantis S. (2007) Spatially selective representations of voluntary and stimulus-
driven attentional priority in human occipital, parietal, and frontal cortex. Cerebral
Cortex, 17: 284.
Silvanto J, Lavie N, Walsh V. (2006) Stimulation of human frontal eye fields modulates
sensitivity of extrastriate visual cortex. Journal of Neurophysiology, 00015.2006.
Silver MA, Kastner S. (2009) Topographic maps in human frontal and parietal cortex. Trends in
Cognitive Sciences, 13: 488-95.

54
Silver MA, Ress D, Heeger DJ. (2005). Topographic Maps of Visual Spatial Attention in Human
Parietal Cortex. Journal of Neurophysiology, 94: 1358-71.
Siman-Tov T, Mendelsohn A, Schonberg T, Avidan G, Podlipsky I, Pessoa L, Gadoth N,
Ungerleider LG, Hendler T. (2007). Bihemispheric leftward bias in a visuospatial
attention-related network. Journal of Neuroscience, 27: 11271.
Smith AM, Lewis BK, Ruttimann UE, Ye FQ, Sinnwell TM, Yang Y, Duyn JH, Frank JA.
(1999) Investigation of Low Frequency Drift in fMRI Signal. NeuroImage, 9: 526-33.
Sun FT, Miller LM, D'Esposito M. (2004) Measuring interregional functional connectivity using
coherence and partial coherence analyses of fMRI data. NeuroImage, 21: 647-58.
Sun FT, Miller LM, D'Esposito M. (2005) Measuring temporal dynamics of functional networks
using phase spectrum of fMRI data. NeuroImage, 28: 227-37.
Tallon-Baudry, C. and O. Bertrand (1999). Oscillatory gamma activity in humans and its role in
object representation. Trends in cognitive sciences, 3(4): 151.
Tallon-Baudry, C., O. Bertrand, et al. (2005). Attention Modulates Gamma-band Oscillations
Differently in the Human Lateral Occipital Cortex and Fusiform Gyrus. Cerebral Cortex
15: 654.
Thut, G., A. Nietzel, et al. (2006). {alpha}-Band Electroencephalographic Activity over
Occipital Cortex Idexes Vosouspatial Attention Bias and Predicts Visual Target
Detection. Journal of Neuroscience. 26(37): 9494-9502.
Treisman, A. M. and G. Gelade (1980). A feature-integration theory of attention. Cognitive
Psychology 12(1): 97-136.
Vidal, JR, M. Chaumon, O‟Regan, K. Tallon-Baudry, C. (2006). Visual Grouping and the
Focusing of Attention Induce Gamma-band Oscillations at Different Frequencies in
Human Magnetoencephalogram Signals. Journal of Cognive Neuroscience. 18(11): 1850-
1862.
Wijers AA, Lange JJ, Mulder G, Mulder LJM. (1997) An ERP study of visual spatial attention
and letter target detection for isoluminant and nonisoluminant stimuli. Psychophysiology,
34: 553-65.
Worden, MS, Foxe, JJ Wang, N, Simpson, GV. (2000). Anticipatory biasing of visuospatial
attention indexed by retinotopically specific alpha-band electroencephalography
increases over occipital cortex. Journal of Neuroscience, 20:RC63(1-6).
Wundt W. (1912/1973) An introduction to psychology. George Allen & Company: London.
Wundt W. (1902) Outlines of psychology. W. Engelman.: Leipzig,
Yuval-Greenberg, S and Deouell, LY (2007). What you see is not (always) What you Hear:
Induced Gamma-band responses Reflect Cross-Modal Interactions in Familiar Object
Recognition. Journal of Neuroscience. 27(5):1090-1096.
Zarahn E, Aguirre GK, D'Esposito M. (1997). Empirical Analyses of BOLD fMRI Statistics.
NeuroImage, 5: 179-97.
Zion-Golumbic, E. and S. Bentin (2006). Dissociated Neural Mechanisms for Face Detection and
Configural Encoding: Evidence from N170 and Induced Gamma-Band Oscillation
Effects. Cerebral Cortex, 17(8):1741-1749.