Network lifetime and stealth time of wireless video sensor intrusion detection systems under...
22
1 1 Network lifetime and stealth time of wireless video sensor intrusion detection systems under risk-based scheduling Prof. Congduc Pham http://www.univ-pau.fr/~cpham Université de Pau, France ISWPC, 2011 Hong-Kong Wednesday, February 23 rd
-
Upload
morris-benson -
Category
Documents
-
view
214 -
download
0
Transcript of Network lifetime and stealth time of wireless video sensor intrusion detection systems under...

Network lifetime and stealth time of wireless video sensor intrusion
detection systems under risk-based scheduling
Prof. Congduc Phamhttp://www.univ-pau.fr/~cpham
Université de Pau, France
ISWPC, 2011Hong-Kong
Wednesday, February 23rd

22
Wireless Video Sensors
Imote2
Multimedia board

33
Surveillance scenario (1)
Randomly deployed video sensors
Not only barrier coverage but general intrusion detection
Most of the time, network in so-called hibernate mode
Most of active sensor nodes in idle mode with low capture speed
Sentry nodes with higher capture speed to quickly detect intrusions

44
Surveillance scenario (2)
Nodes detecting intrusion must alert the rest of the network
1-hop to k-hop alert Network in so-called
alerted mode Capture speed must be
increased Ressources should be
focused on making tracking of intruders easier

55
Surveillance scenario (3)
Network should go back to hibernate mode
Nodes on the intrusion path must keep a high capture speed
Sentry nodes with higher capture speed to quickly detect intrusions

66
Real scene
Don’t miss important events!
Whole understanding of the scene is wrong!!!
What is captured

77
How to meet surveillance app’s criticality
Capture speed can be a « quality » parameter Capture speed for node v should depend on
the app’s criticality and on the level of redundancy for node v
Note that capturing an image does not mean transmitting it
V’s capture speed can increase when as V has more nodes covering its own FoV - coverset

88
RedundancyNode’s cover set
Each node v has a Field of View, FoVv
Coi(v) = set of nodes v’ such as
v’Coi(v)FoVv’ covers FoVv
Co(v)= set of Coi(v)
V4
V1
V2
V3
V
Co(v)={V1,V2,V3,V4}
99
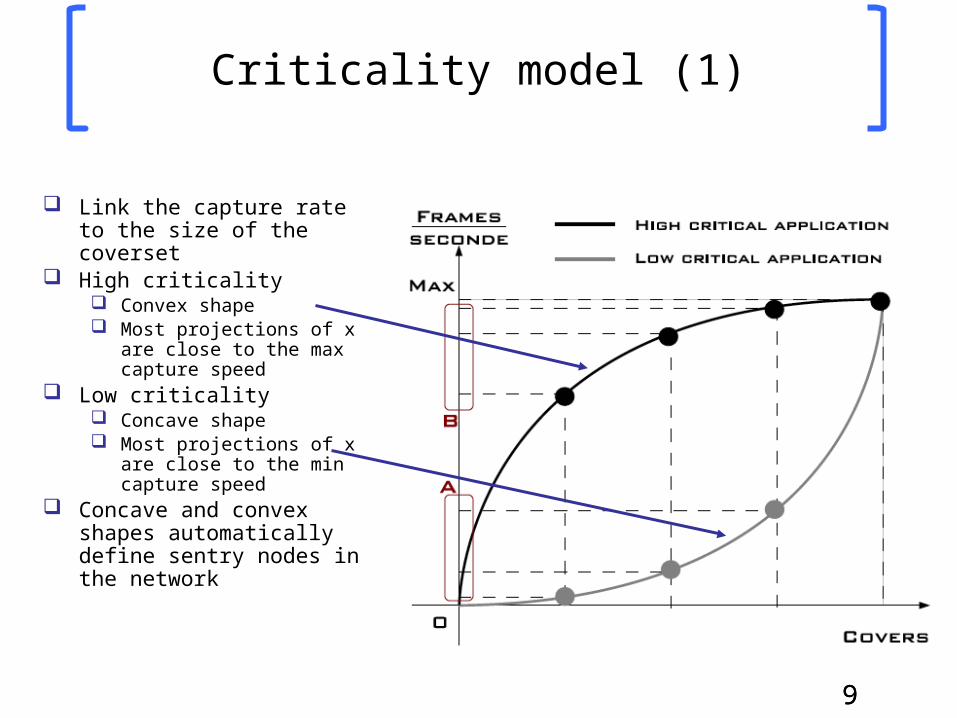
Criticality model (1)
Link the capture rate to the size of the coverset
High criticality Convex shape Most projections of x are
close to the max capture speed
Low criticality Concave shape Most projections of x are
close to the min capture speed
Concave and convex shapes automatically define sentry nodes in the network

1010
Criticality model (2)
r0 can vary in [0,1] BehaVior functions (BV)
defines the capture speed according to r0
r0 < 0.5 Concave shape BV
r0 > 0.5 Convex shape BV
We propose to use Bezier curves to model BV functions

1111
Some typical capture speed
Set maximum capture speed: 6fps or 12fps for instance Nodes with coverset size greater than N capture at the
maximum speed
N=6P2(6,6)
N=12P2(12,3)

1212
How to build an intrusion detection system
Static Prior to deployment, define r° in [0,1] according to
the application’s criticality Risk-based
R0 is set initially low : R°min
Some nodes serve as sentry nodes On intrusion, increase R° to R°max during an given
alert period (Ta) After Ta, go back to R°min
2 variants• R° moves from R°min to R°max in one step
• R° moves from R°min to R°max by reinforcement behavior

1313
Risk-based scheduling in images (1)
R°=R°min=0.1, R°max=0.9, no alert
|Co(vi)|=8
|Co(vj)|=3
8
0.81
fps=0.81
fps=0.14
3
0.14

1414
Risk-based scheduling in images (2)
R°R°=R°max=0.9
|Co(vi)|=8
|Co(vj)|=3
8
2.8
Fps=2.8
3
Fps=1.91.9

1515
Simulation settings
OMNET++ simulation model Video nodes have communication range of
30m and depth of view of 25m, AoV is 36°. 150 sensors in an 75m.75m area.
Battery has 100 units, 1 image = 1 unit of battery consumed.
Max capture rate is 3fps. 12 levels of cover set.
Full coverage is defined as the region initially covered when all nodes are active

1616
mean stealth time (MST)
t0 t1
t1-t0 is the intruder’s stealth timevelocity is set to 5m/s
intrusions starts at t=10swhen an intruder is seen, computes the stealth
time, and starts a new intrusion until end of simulation

1717
mean stealth timestatic scheduling

1818
mean stealth timerisk-based scheduling
Sensor nodes start at 0.1 then increase to 0.9 if alerted (by intruders or neighbors) and stay
alerted for Ta seconds
1300s
450s

1919
mean stealth timew/wo reinforcement
On alert 0.1Ir, then 2 alert msg IrIr+1Until Ir=R°max
Ir=0.6
Reinforcement always increases the network lifetimeMean stealth time is close to the no-reinforcement case, especially when Ta>20s

2020
With reinforcementvarious initial threshold
Ir=0.4Ir=0.5Ir=0.6
Reduce Ir always increases the network lifetimeFor small value of Ta, MST increase is noticeableIt is better to increase Ir than increase Ta.

2121
Sentry nodes
0 <5 <10 <15 >15 0 <5 <10 <15 >15
# of cover sets # intrusion detected

2222
Conclusions
Models the application’s criticality as bezier curves and schedules the video node capture rate according to the redundancy level
With this model, a risk-based scheduling can increase the network lifetime while maintaining a high level of service (mean stealth time)
Reinforcement behavior is beneficial and it is better to keep the alert period low <=20s for instance