Origin-Destination Table Disaggregation Using Fratar Biproportional ...

Bus Passenger Origin-Destination Matrix Estimation
Application to CTA Bus Network
Alex CuiMassachusetts Institute of Technology

2/2/2006 CTA 2
Presentation Outline
Introduction and ObjectivesReview of prior work
Iterative proportional fittingTrip-chaining method of estimating OD matrix
Rail OD matrix estimation for CTACurrent project – bus system OD matrix
Project approachPreliminary resultsRemaining Issues

2/2/2006 CTA 3
IntroductionThe benefit of Origin-Destination matrix:
Service planningOperations analysis
Example: schedulingImpact analysis—before-and after analysis
Traditional way to obtain OD matrix: on-board survey combined with manual boarding and alighting counts The use of Automatically Collected Data (ACD) to get OD matrix
Bigger sample sizeCheaper, since the data are available for other purposes alreadyFaster, and can be done more frequentlyCan be combined with more targeted surveys to get more cost effective results

2/2/2006 CTA 4
Objectives of Research
Long term goal: inter-modal (bus-rail) passenger OD matrix Short term goal: estimate bus passenger OD matrix using available CTA data (Easy to apply procedures)

2/2/2006 CTA 5
Scope of the research
Single bus route applicationNetwork level application

2/2/2006 CTA 6
Relevant prior workPeter Furth: Iterative Proportional Fitting (IPF) method for single bus route OD matrix estimationExample:
DestinationRoute #1 (example)
Stop 1 Stop 2 Stop 3 Stop 4 On count
Stop 1 0 ? ? ? 40
Stop 2 - 0 ? ? 30
Stop 3 - - 0 ? 20
Stop 4 - - - 0 0
Off count 0 30 20 40
Origin

2/2/2006 CTA 7
Relevant prior work
IPF method findingsThe quality of the seed matrix is important to the resulting OD matrix
(Seed matrix contains the information from a small number of trips)
2/2/2006 CTA 8
Relevant prior work (2)
Adam Rahbee and Jinhua Zhao: Trip-Chain Rail Passenger OD Matrix Inference
Network levelBased on AFC data
2/2/2006 CTA 9
Relevant prior work (2)
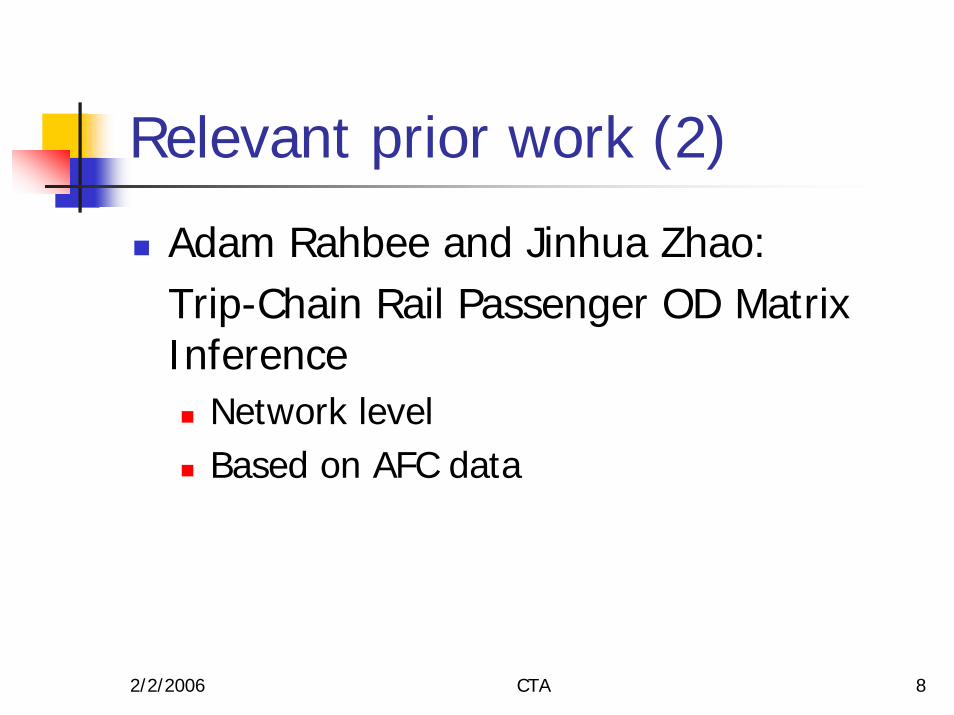
Trip-Chain Rail Network OD Matrix Inference Example:
Day Time Mode Rail Origin Station
Inferred Destination Station
MON 8:22:15 Red Line 87th (Red)
MON 16:00:32 Red Line Lake/State (Red)
Lake/State (Red)
87th (Red)
Passenger
A

2/2/2006 CTA 10
Review of OD Matrix for Rail System
Completed based on Jinhua Zhao’s algorithmHigh inference rate
Results on Sep ’04 Data
Inference Method Number of Rail trips Percentage Contribution
Next Train 864646 33.6%
Last Train of the Day 541809 21.1%AVL 335254 13.0%GIS 36695 1.4%Multi-Swipe and other methods 53457 2.0%
Successful Inference 1831861 71.2%Total 2571140 100.00%

2/2/2006 CTA 11
Bus vs. Rail comparison
Rail Bus
Data available AFC, Entry counts APC, AFC, AVLAFC coverage 91%* (currently almost
100%)About 60%* (currently
about 80% and growing)
APC availability None >15%
Trip origin (Entry point)
Known Need AVL data (or GIS data), 70-80%
match rate
*The percentages are based on 2004 data
2/2/2006 CTA 12
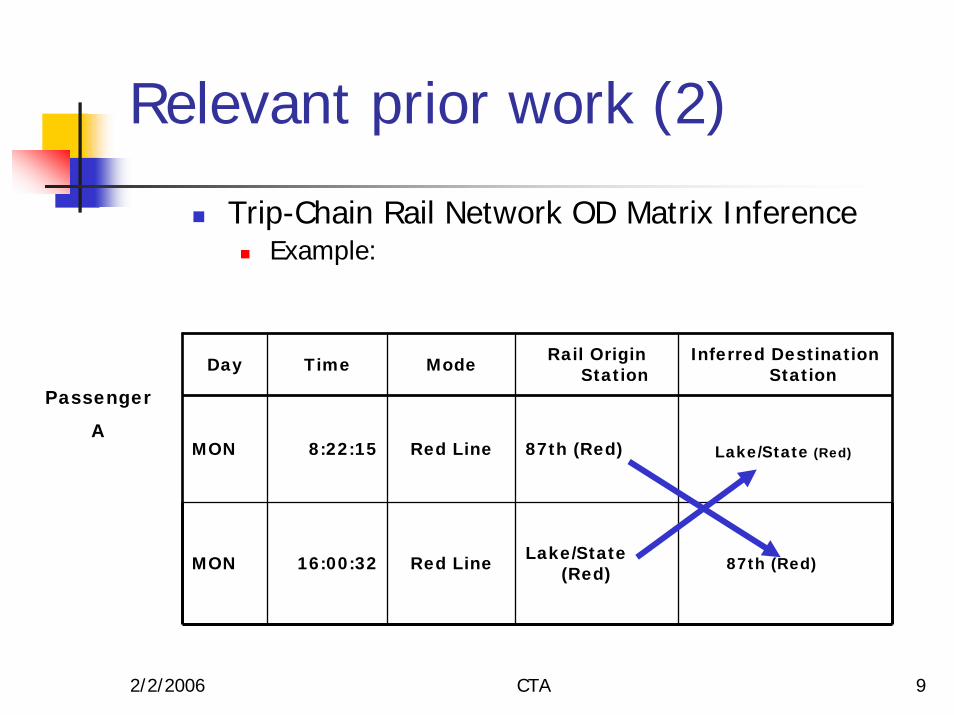
Bus OD Matrix--Data Issues
Issues
APC 1. Under-count passenger boardingsand alightings
2. APC coverage
AFC 1. Does not have location data
2. Only about 60%* of bus passenger trips use farecard
*The percentages are based on 2004 data
2/2/2006 CTA 13
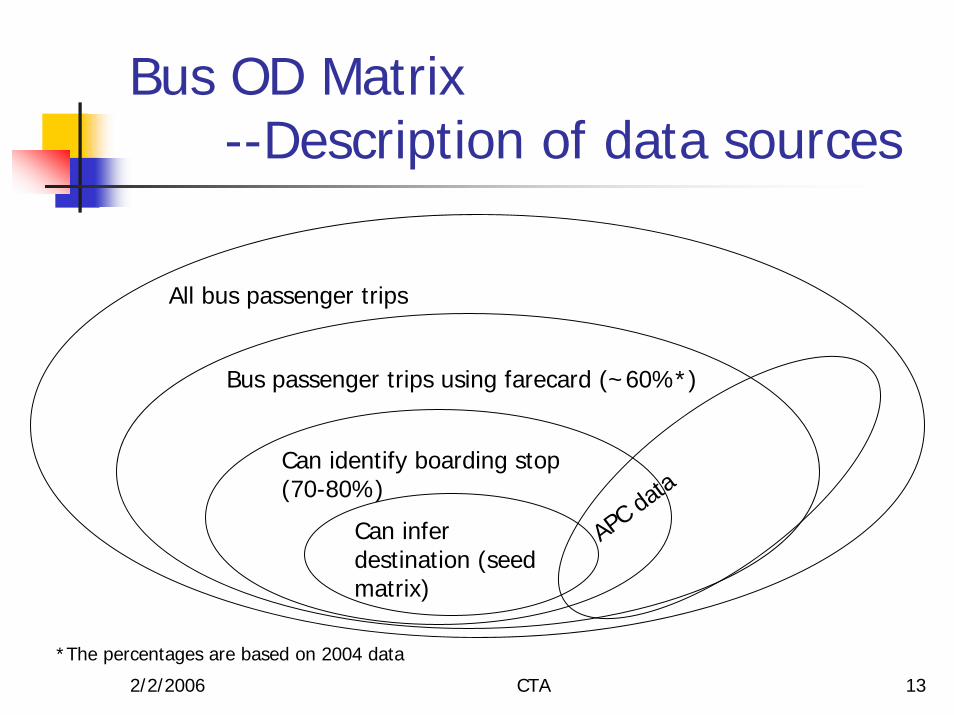
Bus OD Matrix --Description of data sources
All bus passenger trips
Bus passenger trips using farecard (~60%*)
Can identify boarding stop (70-80%)
Can infer destination (seed matrix)
APC da
ta
*The percentages are based on 2004 data
2/2/2006 CTA 14
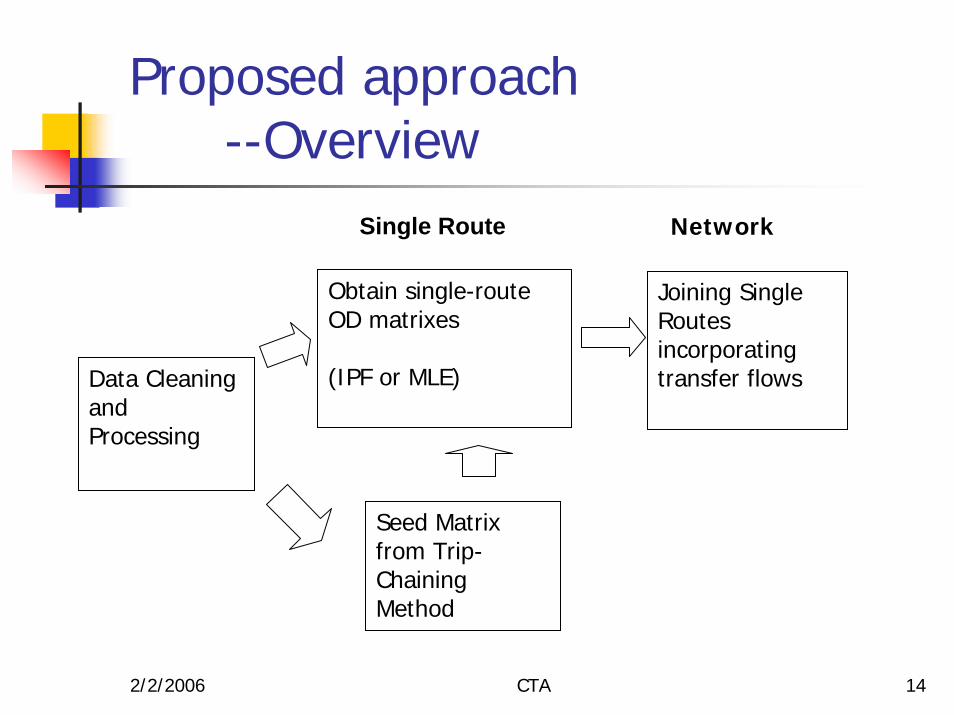
Proposed approach--Overview
Single Route Network
Data Cleaning and Processing
Obtain single-route OD matrixes
(IPF or MLE)
Seed Matrix from Trip-Chaining Method
Joining Single Routes incorporating transfer flows
2/2/2006 CTA 15
Proposed approach--Route-level OD matrix
Seed matrix generation primarily based on AFC dataObtain boarding stop
AVL matchingrail-bus transfer, GISbus-bus transfer, GIS
Trip-chain methodSeed matrix
Iterative Proportional Fitting (IPF) or Maximum Likelihood Estimation (MLE)
These are two techniques to combine APC data with seed matrix to get full OD matrix

2/2/2006 CTA 16
Summary Information on the data used
Overall AFC data (Whole day, all routes):545,000 bus passenger trips using farecardFrom these, 436,000 with boarding stop (~80% identification rate)From these, 244,000 with destinations (~56% inference rate)

2/2/2006 CTA 17
Route 20 Map
2/2/2006 CTA 18
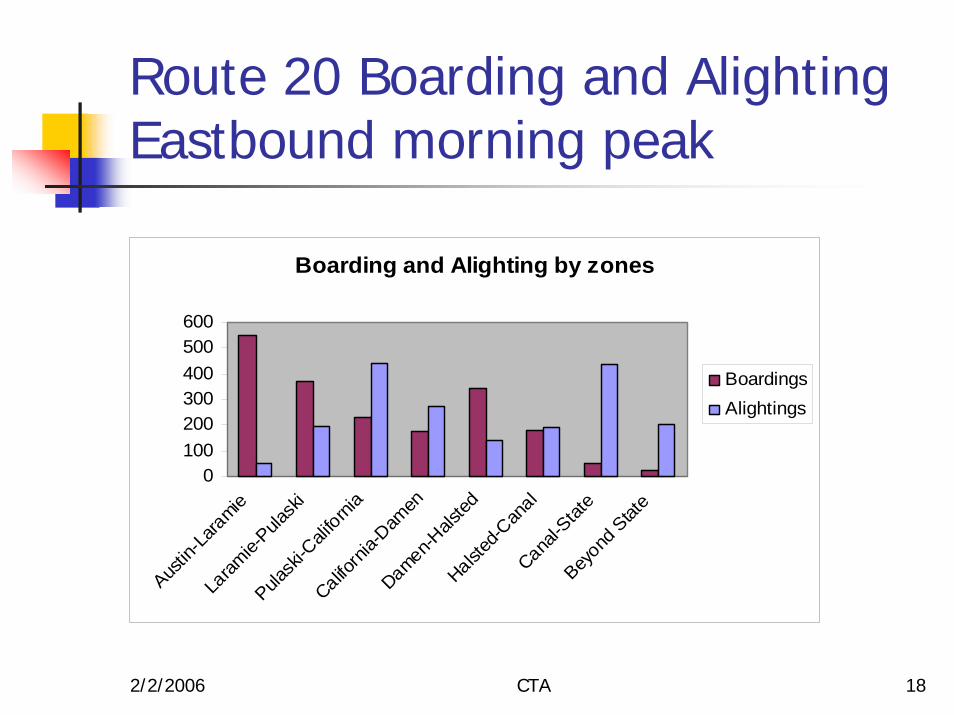
Route 20 Boarding and Alighting Eastbound morning peak
Boarding and Alighting by zones
0100200300400500600
Austin
-Laramie
Laram
ie-Pula
ski
Pulask
i-Cali
fornia
Californi
a-Dam
enDamen-H
alsted
Halsted
-Can
alCana
l-Stat
eBey
ond S
tate
BoardingsAlightings
2/2/2006 CTA 19
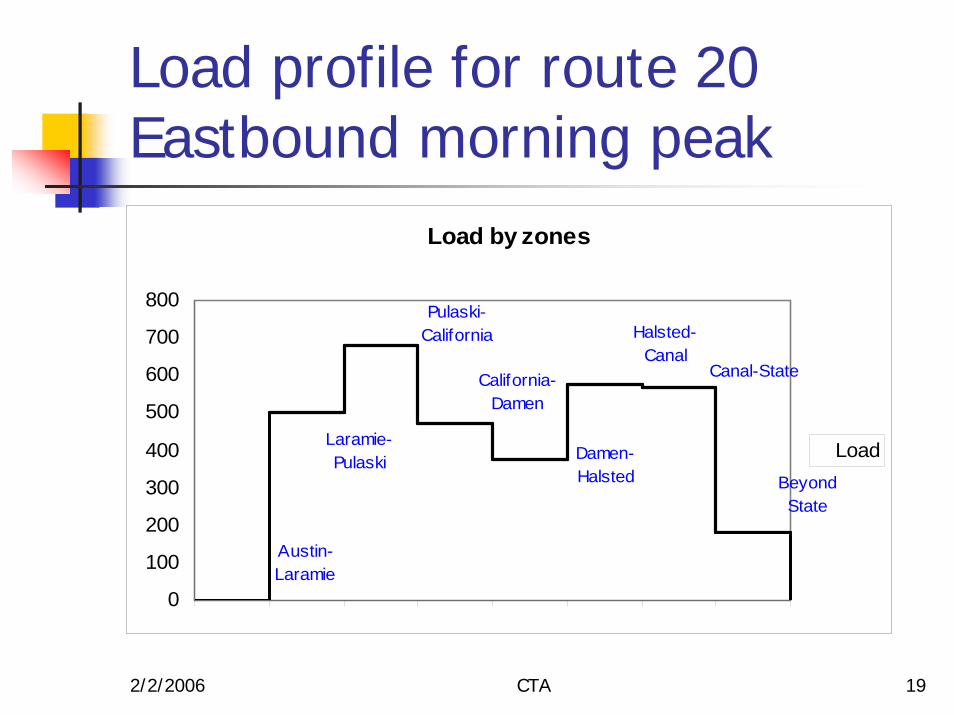
Load profile for route 20 Eastbound morning peak
Load by zones
Halsted-Canal
Austin-Laramie
Laramie-Pulaski
Pulaski-California
California-Damen
Damen-Halsted
Canal-State
Beyond State
0
100
200
300
400
500
600
700
800
Load

2/2/2006 CTA 20
Preliminary Results--#20 Eastbound Morning Peak
To: (East)
Austin-Laramie (1 mile)
Laramie-Pulaski (1.5 mile)
Pulaski-California (1.5 mile)
California-Damen(1 mile)
Damen-Halsted(1.5 mile)
Halsted-Canal (0.5 mile)
Canal-State (0.5 mile)
Beyond State
Austin -Laramie 47 170 155 65 11 30 71 0
Laramie -Pulaski 24 244 72 10 6 13 4
Pulaski -California 40 113 31 13 30 4
California -Damen 24 40 10 101 0
Damen -Halsted 50 123 74 97
Halsted - Canal 7 126 46
Canal - State 18 30
Beyond State 21
From

2/2/2006 CTA 21
Preliminary Results--#20 Westbound Morning Peak
To: (Westbound)
Beyond State
Canal-State (0.5 mile)
Halsted-Canal (0.5 mile)
Damen-Halsted(1.5 mile)
California-Damen(1 mile)
Pulaski-California (1.5 mile)
Laramie-Pulaski (1.5 mile)
Austin-Laramie (1 mile)
Beyond State 45 86 149 180 48 32 80 77
Canal - State 47 130 249 10 7 21 37
Halsted - Canal 2 94 4 13 12 4
Damen - Halsted 15 40 24 43 10
California -Damen 0 84 61 4
Pulaski -California 28 211 105
Laramie - Pulaski 22 87
Austin - Laramie 35
From:
2/2/2006 CTA 22
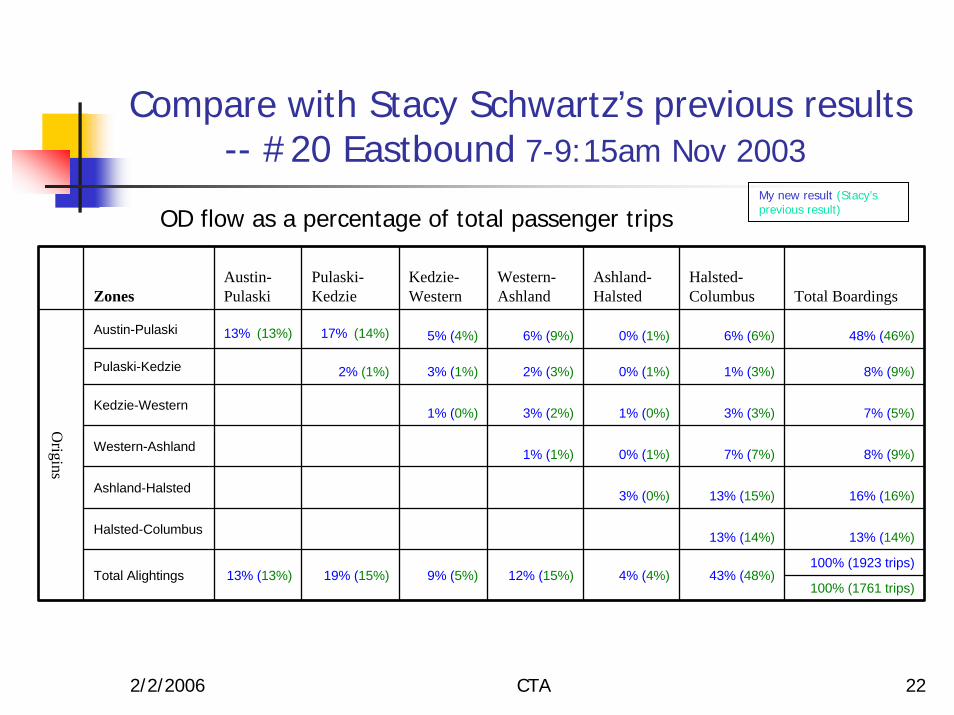
Compare with Stacy Schwartz’s previous results-- #20 Eastbound 7-9:15am Nov 2003
OD flow as a percentage of total passenger trips
ZonesAustin-Pulaski
Pulaski-Kedzie
Kedzie-Western
Western-Ashland
Ashland-Halsted
Halsted-Columbus Total Boardings
Austin-Pulaski 13% (13%) 17% (14%) 5% (4%) 6% (9%) 0% (1%) 6% (6%) 48% (46%)
Pulaski-Kedzie 2% (1%) 3% (1%) 2% (3%) 0% (1%) 1% (3%) 8% (9%)
Kedzie-Western 1% (0%) 3% (2%) 1% (0%) 3% (3%) 7% (5%)
Western-Ashland 1% (1%) 0% (1%) 7% (7%) 8% (9%)
Ashland-Halsted 3% (0%) 13% (15%) 16% (16%)
Halsted-Columbus 13% (14%) 13% (14%)
100% (1923 trips)Total Alightings 13% (13%) 19% (15%) 9% (5%) 12% (15%) 4% (4%) 43% (48%)
100% (1761 trips)
Origins
My new result (Stacy’s previous result)

2/2/2006 CTA 23
Remaining issues (for the following semester)
Formulations and algorithm of Maximum Likelihood Estimation Network level incorporating transfer information
2/2/2006 CTA 24
Thank You