Network efficiency and posterior alpha patterns are ...
10
Washington University School of Medicine Washington University School of Medicine Digital Commons@Becker Digital Commons@Becker Open Access Publications 2017 Network efficiency and posterior alpha patterns are markers of Network efficiency and posterior alpha patterns are markers of recovery from general anesthesia: A high-density recovery from general anesthesia: A high-density electroencephalography study in healthy volunteers electroencephalography study in healthy volunteers Stefanie Blain-Moraes McGill University Vijay Tarnal University of Michigan-Ann Arbor Giancarlo Vanini University of Michigan-Ann Arbor Tarik Bel-Behar University of Michigan-Ann Arbor Ellen Janke University of Michigan-Ann Arbor See next page for additional authors Follow this and additional works at: https://digitalcommons.wustl.edu/open_access_pubs Recommended Citation Recommended Citation Blain-Moraes, Stefanie; Tarnal, Vijay; Vanini, Giancarlo; Bel-Behar, Tarik; Janke, Ellen; Picton, Paul; Golmirzaie, Goodarz; Palanca, Ben J.A.; Avidan, Michael S.; Kelz, Max B.; and Mashour, George A., ,"Network efficiency and posterior alpha patterns are markers of recovery from general anesthesia: A high- density electroencephalography study in healthy volunteers." Frontiers in Human Neuroscience. 11,. 328. (2017). https://digitalcommons.wustl.edu/open_access_pubs/6015 This Open Access Publication is brought to you for free and open access by Digital Commons@Becker. It has been accepted for inclusion in Open Access Publications by an authorized administrator of Digital Commons@Becker. For more information, please contact [email protected].
Transcript of Network efficiency and posterior alpha patterns are ...

Washington University School of Medicine Washington University School of Medicine
Digital Commons@Becker Digital Commons@Becker
Open Access Publications
2017
Network efficiency and posterior alpha patterns are markers of Network efficiency and posterior alpha patterns are markers of
recovery from general anesthesia: A high-density recovery from general anesthesia: A high-density
electroencephalography study in healthy volunteers electroencephalography study in healthy volunteers
Stefanie Blain-Moraes McGill University
Vijay Tarnal University of Michigan-Ann Arbor
Giancarlo Vanini University of Michigan-Ann Arbor
Tarik Bel-Behar University of Michigan-Ann Arbor
Ellen Janke University of Michigan-Ann Arbor
See next page for additional authors Follow this and additional works at: https://digitalcommons.wustl.edu/open_access_pubs
Recommended Citation Recommended Citation Blain-Moraes, Stefanie; Tarnal, Vijay; Vanini, Giancarlo; Bel-Behar, Tarik; Janke, Ellen; Picton, Paul; Golmirzaie, Goodarz; Palanca, Ben J.A.; Avidan, Michael S.; Kelz, Max B.; and Mashour, George A., ,"Network efficiency and posterior alpha patterns are markers of recovery from general anesthesia: A high-density electroencephalography study in healthy volunteers." Frontiers in Human Neuroscience. 11,. 328. (2017). https://digitalcommons.wustl.edu/open_access_pubs/6015
This Open Access Publication is brought to you for free and open access by Digital Commons@Becker. It has been accepted for inclusion in Open Access Publications by an authorized administrator of Digital Commons@Becker. For more information, please contact [email protected].

Authors Authors Stefanie Blain-Moraes, Vijay Tarnal, Giancarlo Vanini, Tarik Bel-Behar, Ellen Janke, Paul Picton, Goodarz Golmirzaie, Ben J.A. Palanca, Michael S. Avidan, Max B. Kelz, and George A. Mashour
This open access publication is available at Digital Commons@Becker: https://digitalcommons.wustl.edu/open_access_pubs/6015

ORIGINAL RESEARCHpublished: 28 June 2017
doi: 10.3389/fnhum.2017.00328
Frontiers in Human Neuroscience | www.frontiersin.org 1 June 2017 | Volume 11 | Article 328
Edited by:
Jamie Sleigh,
University of Auckland, New Zealand
Reviewed by:
Erik Olofsen,
Leiden University, Netherlands
David Liley,
Swinburne University of Technology,
Australia
*Correspondence:
George A. Mashour
†These authors have contributed
equally as senior authors and
co-principal investigators.
Received: 13 February 2017
Accepted: 07 June 2017
Published: 28 June 2017
Citation:
Blain-Moraes S, Tarnal V, Vanini G,
Bel-Behar T, Janke E, Picton P,
Golmirzaie G, Palanca BJA,
Avidan MS, Kelz MB and Mashour GA
(2017) Network Efficiency and
Posterior Alpha Patterns Are Markers
of Recovery from General Anesthesia:
A High-Density
Electroencephalography Study in
Healthy Volunteers.
Front. Hum. Neurosci. 11:328.
doi: 10.3389/fnhum.2017.00328
Network Efficiency and PosteriorAlpha Patterns Are Markers ofRecovery from General Anesthesia:A High-DensityElectroencephalography Study inHealthy VolunteersStefanie Blain-Moraes 1, 2, Vijay Tarnal 2, 3, Giancarlo Vanini 2, 3, Tarik Bel-Behar 2, 3,
Ellen Janke 2, 3, Paul Picton 2, 3, Goodarz Golmirzaie 2, 3, Ben J. A. Palanca 4,
Michael S. Avidan 4†, Max B. Kelz 5 † and George A. Mashour 2, 3, 6*†
1 School of Physical and Occupational Therapy, Faculty of Medicine, McGill University, Montreal, QC, Canada, 2Center for
Consciousness Science, University of Michigan Medical School, Ann Arbor, MI, United States, 3Department of
Anesthesiology, University of Michigan Medical School, Ann Arbor, MI, United States, 4Department of Anesthesiology,
Washington University School of Medicine, St. Louis, MO, United States, 5Department of Anesthesiology, University of
Pennsylvania, Philadelphia, PA, United States, 6Neuroscience Graduate Program, University of Michigan Medical School,
Ann Arbor, MI, United States
Recent studies have investigated local oscillations, long-range connectivity, and global
network patterns to identify neural changes associated with anesthetic-induced
unconsciousness. These studies typically employ anesthetic protocols that either just
cross the threshold of unconsciousness, or induce deep unconsciousness for a brief
period of time—neither of which models general anesthesia for major surgery. To study
neural patterns of unconsciousness and recovery in a clinically-relevant context, we used
a realistic anesthetic regimen to induce and maintain unconsciousness in eight healthy
participants for 3 h. High-density electroencephalogram (EEG) was acquired throughout
and for another 3 h after emergence. Seven epochs of 5-min eyes-closed resting
states were extracted from the data at baseline as well as 30, 60, 90, 120, 150, and
180-min post-emergence. Additionally, 5-min epochs were extracted during induction,
unconsciousness, and immediately prior to recovery of consciousness, for a total of 10
analysis epochs. The EEG data in each epoch were analyzed using source-localized
spectral analysis, phase-lag index, and graph theoretical techniques. Posterior alpha
power was significantly depressed during unconsciousness, and gradually approached
baseline levels over the 3 h recovery period. Phase-lag index did not distinguish
between states of consciousness or stages of recovery. Network efficiency was
significantly depressed and network clustering coefficient was significantly increased
during unconsciousness; these graph theoretical measures returned to baseline during
the 3 h recovery period. Posterior alpha power may be a potential biomarker for normal
recovery of functional brain networks after general anesthesia.
Keywords: consciousness, cognition, general anesthesia, electroencephalography, alpha rhythm, graph theory

Blain-Moraes et al. Network Recovery after Anesthesia
INTRODUCTION
In recent years, the electroencephalographic study of anestheticstate transitions has focused on (1) coherent oscillations (Akejuet al., 2014), (2) functional connectivity (Lee U. et al., 2013), and(3) network analysis (Lee H. et al., 2013; Chennu et al., 2016). Anumber of findings have emerged that appear to distinguish statesof consciousness from anesthetic-induced unconsciousness. Forexample, the shift of alpha power (Berger, 1930) from theoccipital to frontal cortex—a process known as anteriorizationand first posited to be a marker of general anesthesia based onnonhuman primate studies in the 1970s (Tinker et al., 1977)—isassociated with propofol-induced unconsciousness and surgicallevels of sevoflurane anesthesia (John et al., 2001; Purdon et al.,2013; Akeju et al., 2014). Functional disconnection of anteriorand posterior cortical regions—first posited to be an invariantmarker of general anesthesia in 2001 (John et al., 2001)—has beenfound to correlate with propofol-, sevoflurane-, and ketamine-induced unresponsiveness by both electroencephalography(EEG) and functional magnetic resonance imaging (fMRI)(Boveroux et al., 2010; Jordan et al., 2013; Lee U. et al., 2013;Palanca et al., 2015; Bonhomme et al., 2016; Ranft et al., 2016).Finally, graph theoretical network properties—first shown to bemodulated by anesthetics in 2010 (Lee et al., 2010)—have beenshown by both EEG and fMRI investigations to be disruptedduring unconsciousness induced by propofol, dexmedetomidine,and halogenated ethers (Lee et al., 2011; Schröter et al., 2012;Moon et al., 2015; Hashmi et al., 2017).
Although, considerable progress has been made in identifyingchanges in key local oscillations, long-range connectivity, andglobal network patterns, many of the recent high-resolutionneuroimaging studies of anesthetic-induced unconsciousnesshave been conducted in healthy volunteers with protocols thateither (1) just cross the threshold of unconsciousness, or (2)induce more profound unresponsiveness but for a brief period oftime. These conditions do not model general anesthesia for majorsurgery, which has prolonged periods of anesthetic exposureat concentrations far higher than those required to induceunconsciousness. One of the critical limitations of either “longbut light” or “deep but brief” anesthetic protocols in healthyvolunteers is that the recovery process is far more rapid thanmight be observed in the perioperative domain. Furthermore,neither the topography of oscillations nor the topology ofnetworks has typically been studied beyond the initial returnof consciousness. Collectively, these limitations have resulted inincomplete knowledge of the neural correlates of the recoveringbrain after the major perturbation of general anesthesia.
One advantage to the study of healthy volunteers isthe absence of surgical stress, inflammatory burden, orpolypharmacy, which confound neuroscientific insight intothe recovery of consciousness and cognition after generalanesthesia. Thus, what is needed is a protocol with surgically-relevant anesthetic regimens without surgical intervention,followed by neural data acquisition that extends far beyondthe initial return of consciousness. In this study, we report theimplementation of just such a paradigm, in which healthy humanparticipants underwent induction of anesthesia with propofol,
3 h of age-adjusted 1.3 minimum alveolar concentration(MAC) of isoflurane anesthesia, followed by recovery andcontinued high-density EEG acquisition for another 3 h afteremergence. These data were analyzed with source-localizedspectral analysis, functional connectivity, and graph-theoreticalapproaches, testing the hypothesis that the full recovery oflocal and global network function is prolonged after anestheticexposure simulating surgical conditions.
MATERIALS AND METHODS
This study was conducted at the University of MichiganMedical School and approved by the Institutional Board Review(HUM0071578); written informed consent was obtained from allparticipants.
Study PopulationWe analyzed data from eight healthy volunteers (5 males,23–29 year of age) with 128-channel EEG as a subset of theReconstructing Consciousness and Cognition (ReCCognition)study (NCT01911195). The full protocol for this investigation hasbeen published (Maier et al., 2017). Participants were AmericanSociety of Anesthesiologists class 1 physical status, body massindex <30, with Mallampati 1 or 2 airway classifications, and noother factors predictive of difficult airway. We excluded subjectswho were pregnant, had a history of obstructive sleep apnea,reactive airway disease, neuropsychiatric disorders, history orcurrent use of psychotropicmedications, gastroesophageal reflux,cardiac conduction abnormalities, asthma, epilepsy, history ofproblems with anesthesia, family history of problems withanesthesia, and any neurologic or psychiatric history. Pregnancyand illicit drug use were ruled out through both urine and bloodanalyses.
Anesthetic ProtocolInduction and maintenance of general anesthesia with,respectively, propofol and a halogenated ether was chosenbecause of its relevance to routine clinical care. Isoflurane waschosen as the halogenated ether because the associated recoverywould be longer than sevoflurane or desflurane, allowing moreopportunity for the observation of differential recovery ofcognitive and network function. Participants were assessedthroughout the experiment by at least two anesthesiologistsand standard monitors (i.e., oxygen saturation, noninvasiveblood pressure, electrocardiogram, end-tidal carbon dioxide;nasal temperature probe). Participants were pre-oxygenatedwith 100% O2 by face mask and received intravenous propofolat increasing infusion rates over three consecutive 5-minblocks (block 1: 100µg/kg/min, block 2:200µg/kg/min, block3:300µg/kg/min). To assess loss of consciousness, a pre-recordedauditory instruction (i.e., “Squeeze your left/right hand twice,”with left or right randomized) was triggered every 30 s; theonset of anesthetic-induced unconsciousness was defined as theabsence of response to two consecutive commands delivered30 s apart. Isoflurane anesthesia was then administered withair and 40% oxygen at 1.3 age-adjusted minimum alveolarconcentration (i.e., the ED95; Nickalls and Mapleson, 2003) via
Frontiers in Human Neuroscience | www.frontiersin.org 2 June 2017 | Volume 11 | Article 328

Blain-Moraes et al. Network Recovery after Anesthesia
mask inhalation. A laryngeal mask airway was inserted andpositive pressure ventilation was used to maintain tidal volumesat greater than 5 mL/kg and normocapnia (end-tidal carbondioxide targeted to 35–45 mmHg). Surface warming blanketswere applied to maintain normothermia, and phenylephrine wastitrated as needed to maintain mean arterial pressure within 20%of pre-anesthetic values. Ondansetron 4mg was administered30-min prior to discontinuation of isoflurane. After 3 h ofexposure to isoflurane, the anesthetic was discontinued, andparticipant responsiveness was assessed every 30 s using the sameverbal command until the participant regained consciousness;recovery of consciousness (ROC) was defined as two consecutiveresponses to the command. The laryngeal mask airway wasremoved at or before ROC, as determined by the clinicalanesthesia team.
Electroencephalography Data Acquisitionand PreprocessingThe EEG was acquired using a 128-channel system fromElectrical Geodesics, Inc. (Eugene, OR) with all channelsreferenced to the vertex. Electrode impedance was reduced below50 k� prior to data collection and data were sampled at 500 Hz.An investigator experienced in reading electroencephalograms(SBM, TB, or GV) visually monitored the data to ensurecontinued signal integrity throughout the experiment. After theexperiment, the EEGwas bandpass filtered between 0.1 and 50Hzand re-referenced to an average reference. Epochs and channelswith noise or non-physiological artifacts were identified andremoved.
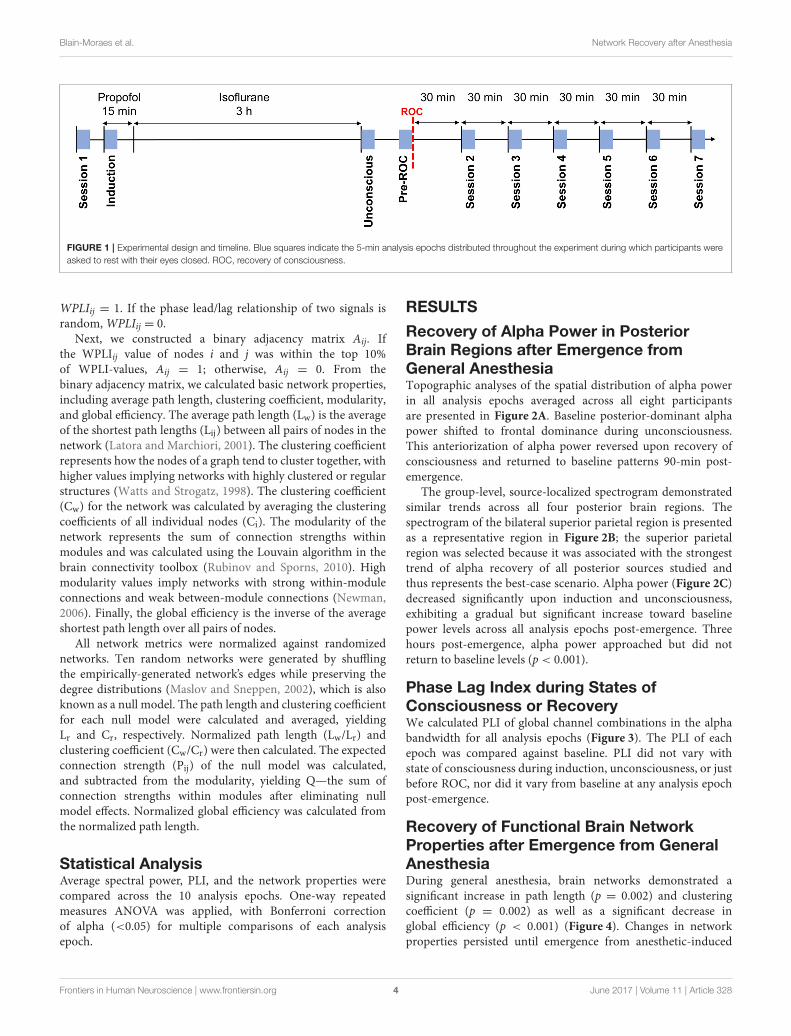
Analysis EpochsDuring the experiment, participants were in a resting state seventimes for 5-min epochs. During these sessions, participants wereinstructed to remain still with their eyes closed while theirEEG was recorded. Participant responsiveness was monitoredwith the same auditory command used for assessment of theanesthetic state transitions, in order to ensure that they remainedawake for the duration of the session. Session 1 occurredprior to the induction of anesthesia. Session 2–7 occurred,respectively, at 30, 60, 90, 120, 150, and 180-min post-ROC.Additionally, three 5-min epochs were extracted during theexposure to anesthesia: (1) “induction”—the first 5-min ofexposure to propofol; (2) “unconscious”—the first 5-min afterthe discontinuation of isoflurane; and (3) “pre-ROC”—the 5-minimmediately preceding ROC (Figure 1). Collectively, these define10 analysis epochs for each participant.
Electroencephalographic AnalysisSource EstimationCortical current source density mapping was calculated using adistributed model consisting of 10,000 current dipoles. Dipolelocations, and orientations were constrained to the corticalarea of the standard brain model of the Montreal NeurologicalInstitute, which was then warped to the geometry of the sensornet using the Brainstorm software package (Tadel et al., 2011).The EEG forward model was computed using a SymmetricBoundary Element Method from the open-source software
OpenMEEG (http://openmeeg.github.io). Cortical current mapswere then computed from the EEG time series through a linearinverse estimate (weighted minimum-norm current estimate)using Brainstorm. Finally, the principal-component currentactivity from within the 68 brain regions defined by the Desikan-Killiany brain atlas were calculated to generate a single time seriesfor each brain region.
Spectral AnalysisSpectrograms were computed in Chronux (http://chronux.org/)(Mitra and Bokil, 2008) using the multitaper method, withwindow lengths of T = 2 s, step size = 0.1 s, time-bandwidthproduct NW = 2, number of tapers K = 3. For each participant,a time series of source-localized activity was generated for fourposterior brain regions (precuneus, cuneus, inferior parietal,superior parietal) where many of the brain’s network hubs arelocalized (Moon et al., 2015). For each brain region, the region-based time series from all participants was used to generategroup-level spectrograms for each analysis epoch.
Functional ConnectivityFunctional connectivity was assessed using Phase Lag Index(PLI), a measure designed to address the problem of volumeconduction by accounting for only nonzero phase lead/lagrelationships (Stam et al., 2007). The instantaneous phase ofeach EEG channel was computed via a Hilbert transform, andthe phase difference 18t between all channel combinations wascalculated. PLI was then calculated as follows:
PLIij =∣
∣〈sign(1ϕt〉∣
∣
Here, the sign() function yields a value of 1 if 18t > 0, avalue of 0 if 18t = 0 and a value of −1 if 18t < 0. Thus,PLI quantifies the degree of phase locking of an instantaneousphase relationship. PLI values range between 0 (no locking)and 1 (perfect locking). Each analysis epoch was divided intonon-overlapping 10 s windows for which the PLI across allchannel combinations was calculated. For each analysis epoch, anaverage PLI matrix was generated across all 10 s windows and theglobal functional connectivity was calculated as the average PLIacross all channel combinations. PLI was calculated across fourfrequency bands: (1) delta (1–4 Hz); (2) theta (4–8 Hz); (3) alpha(8–13 Hz); and (4) beta (13–30 Hz).
Graph-Theoretical AnalysisWe constructed a brain network using the alpha bandwidth (8–13 Hz) of the EEG, which is the most prominent and frequentlystudied bandwidth in spectral analysis. The functional networkwas constructed using the weighted phase lag index (WPLI;Vinck et al., 2011) as follows:
WPLIij =
∣
∣E{ℑ(Cij)}∣
∣
E{∣
∣ℑ(Cij)∣
∣}=
∣
∣E{∣
∣ℑ(
Cij
)∣
∣ sgn(
ℑ(
Cij
))}∣
∣
E{∣
∣ℑ(
Cij
)∣
∣}
where ℑ(Cij) is the imaginary part of cross-spectrum Cij betweentwo signals i and j. If the phases of signal i always lead orlag those of signal j, that is, Pr
{
sgn(
ℑ(
Cij
))
= 1 or − 1}
, then
Frontiers in Human Neuroscience | www.frontiersin.org 3 June 2017 | Volume 11 | Article 328
Blain-Moraes et al. Network Recovery after Anesthesia
FIGURE 1 | Experimental design and timeline. Blue squares indicate the 5-min analysis epochs distributed throughout the experiment during which participants were
asked to rest with their eyes closed. ROC, recovery of consciousness.
WPLIij = 1. If the phase lead/lag relationship of two signals israndom,WPLIij = 0.
Next, we constructed a binary adjacency matrix Aij. Ifthe WPLIij value of nodes i and j was within the top 10%of WPLI-values, Aij = 1; otherwise, Aij = 0. From thebinary adjacency matrix, we calculated basic network properties,including average path length, clustering coefficient, modularity,and global efficiency. The average path length (Lw) is the averageof the shortest path lengths (Lij) between all pairs of nodes in thenetwork (Latora and Marchiori, 2001). The clustering coefficientrepresents how the nodes of a graph tend to cluster together, withhigher values implying networks with highly clustered or regularstructures (Watts and Strogatz, 1998). The clustering coefficient(Cw) for the network was calculated by averaging the clusteringcoefficients of all individual nodes (Ci). The modularity of thenetwork represents the sum of connection strengths withinmodules and was calculated using the Louvain algorithm in thebrain connectivity toolbox (Rubinov and Sporns, 2010). Highmodularity values imply networks with strong within-moduleconnections and weak between-module connections (Newman,2006). Finally, the global efficiency is the inverse of the averageshortest path length over all pairs of nodes.
All network metrics were normalized against randomizednetworks. Ten random networks were generated by shufflingthe empirically-generated network’s edges while preserving thedegree distributions (Maslov and Sneppen, 2002), which is alsoknown as a null model. The path length and clustering coefficientfor each null model were calculated and averaged, yieldingLr and Cr, respectively. Normalized path length (Lw/Lr) andclustering coefficient (Cw/Cr) were then calculated. The expectedconnection strength (Pij) of the null model was calculated,and subtracted from the modularity, yielding Q—the sum ofconnection strengths within modules after eliminating nullmodel effects. Normalized global efficiency was calculated fromthe normalized path length.
Statistical AnalysisAverage spectral power, PLI, and the network properties werecompared across the 10 analysis epochs. One-way repeatedmeasures ANOVA was applied, with Bonferroni correctionof alpha (<0.05) for multiple comparisons of each analysisepoch.
RESULTS
Recovery of Alpha Power in PosteriorBrain Regions after Emergence fromGeneral AnesthesiaTopographic analyses of the spatial distribution of alpha powerin all analysis epochs averaged across all eight participantsare presented in Figure 2A. Baseline posterior-dominant alphapower shifted to frontal dominance during unconsciousness.This anteriorization of alpha power reversed upon recovery ofconsciousness and returned to baseline patterns 90-min post-emergence.
The group-level, source-localized spectrogram demonstratedsimilar trends across all four posterior brain regions. Thespectrogram of the bilateral superior parietal region is presentedas a representative region in Figure 2B; the superior parietalregion was selected because it was associated with the strongesttrend of alpha recovery of all posterior sources studied andthus represents the best-case scenario. Alpha power (Figure 2C)decreased significantly upon induction and unconsciousness,exhibiting a gradual but significant increase toward baselinepower levels across all analysis epochs post-emergence. Threehours post-emergence, alpha power approached but did notreturn to baseline levels (p < 0.001).
Phase Lag Index during States ofConsciousness or RecoveryWe calculated PLI of global channel combinations in the alphabandwidth for all analysis epochs (Figure 3). The PLI of eachepoch was compared against baseline. PLI did not vary withstate of consciousness during induction, unconsciousness, or justbefore ROC, nor did it vary from baseline at any analysis epochpost-emergence.
Recovery of Functional Brain NetworkProperties after Emergence from GeneralAnesthesiaDuring general anesthesia, brain networks demonstrated asignificant increase in path length (p = 0.002) and clusteringcoefficient (p = 0.002) as well as a significant decrease inglobal efficiency (p < 0.001) (Figure 4). Changes in networkproperties persisted until emergence from anesthetic-induced
Frontiers in Human Neuroscience | www.frontiersin.org 4 June 2017 | Volume 11 | Article 328

Blain-Moraes et al. Network Recovery after Anesthesia
FIGURE 2 | Alpha bandwidth topography and power across ten analysis epochs. (A) Topographic mapping of alpha power; (B) Source-localized spectrogram of the
superior parietal region; and (C) Mean alpha power in the superior parietal region (blue) and standard error across all participants (red). Base, Baseline consciousness;
Induct, Induction; Uncons, Unconsciousness; ROC, Recovery of consciousness.
unconsciousness (path length, p = 0.005; clustering coefficient,p = 0.002; global efficiency, p = 0.002). These three networkproperties did not differ significantly from their baseline values30-min after recovery of consciousness.
DISCUSSION
Brain network recovery after a major functional perturbation,such as general anesthesia, is of both clinical and neuroscientificinterest. In this study, we found that global functionalconnectivity patterns using PLI did not distinguish statesof consciousness, which is consistent with our prior findings(Lee H. et al., 2013), but global network efficiency droppedduring unconsciousness and returned to baseline levelsearly in the recovery process. Changes in global efficiencywere defined by inverse changes in path length, collectivelysuggesting that—during general anesthesia—information
transfer across networks is impeded. Depression of networkefficiency and/or surrogates of information transfer havenow been identified across a variety of anesthetic drugs(propofol, sevoflurane, ketamine, dexmedetomidine) withdiverse molecular and neurophysiological profiles (Boverouxet al., 2010; Lee et al., 2011; Schröter et al., 2012; Lee U. et al.,2013; Jordan et al., 2013; Moon et al., 2015; Palanca et al., 2015;Bonhomme et al., 2016; Ranft et al., 2016; Hashmi et al., 2017).The return of source-localized alpha power during recoveryappears to follow a similar trajectory, raising the possibilityof a sensor-level biomarker for functional brain networkrecovery after anesthesia that can be measured in real time andpersonalized based on the initial posterior alpha power.
Graph theory originated with the early work of LeonhardEuler in the eighteenth century and has been used in theneurosciences to assess brain networks for at least a decade(Ferri et al., 2007, 2008; Spoormaker et al., 2010; Mišic and
Frontiers in Human Neuroscience | www.frontiersin.org 5 June 2017 | Volume 11 | Article 328

Blain-Moraes et al. Network Recovery after Anesthesia
Sporns, 2016). In 2010 and 2011, graph theory was first appliedto the study of anesthetic state transitions by our laboratory
FIGURE 3 | Global functional connectivity calculated using phase lag index
(PLI) across all analysis epochs. Error bars represent standard deviation. ROC,
recovery of consciousness.
(Lee et al., 2010, 2011), demonstrating preservation of somenetwork organizational principles during general anesthesia aswell as dissociable network properties of anesthetic induction andrecovery. Graph-theoretical analysis has since been applied toneuroimaging and neurophysiologic recordings during generalanesthesia in both humans and animals. Of note, the firstapplication of graph theory to neuroimaging during anesthesia(isoflurane in rats; propofol in humans) did not identifysignificant changes in path length (a determinant of efficiency;Liang et al., 2012; Schröter et al., 2012). However, a morerecent study of functional networks reconstructed from 128-channel EEG in the alpha bandwidth—a methodology similarto the current study—found significant increases in path lengthassociated with propofol-induced unconsciousness (Chennuet al., 2016). Furthermore, using fMRI, Monti et al also identifieda reversible disruption of path length that returned with theinitial recovery of consciousness (Monti et al., 2013). Our workconfirms that network efficiency is impaired during generalanesthesia, but with an inhaled anesthetic and a clinically-realisticprotocol.
The relationship between graph-theoretical analysis andrecent efforts to assess information transfer within functionalbrain networks during general anesthesia is notable. Propofol,
FIGURE 4 | Brain network properties across the experimental period: (A) path length; (B) clustering coefficient; (C) modularity; and (D) global efficiency. Error bars
represent standard deviation, and *indicates epochs that are significantly different from the baseline (p < 0.05). Base, Baseline consciousness; Induct, Induction;
Uncons, Unconsciousness; ROC, Recovery of consciousness.
Frontiers in Human Neuroscience | www.frontiersin.org 6 June 2017 | Volume 11 | Article 328

Blain-Moraes et al. Network Recovery after Anesthesia
sevoflurane, and ketamine have all been found—by bothneurophysiologic and neuroimaging studies—to disruptconnectivity patterns and surrogates of information transferin frontal-parietal networks (Hudetz and Mashour, 2016). Itis likely that this line of investigation and network analysesare fundamentally related. First, altered connectivity patternsand network reconfigurations leading to inefficiency wouldnaturally result in impaired information transfer. Even in studieswithout information-theoretical measures, increased path lengthand decreased efficiency suggest conditions that might impedeinformation exchange. Second, several lines of evidence supportthe hypothesis that topology shapes information transfer inlarge-scale (spatially) and long-scale (temporally) functionalbrain networks. Past studies of propofol using EEG show thatreversal of directional connectivity in frontal-parietal networksparallels a reversal in the topology of hubs (Lee H. et al., 2013).On a more fundamental level, highly-connected network hubsappear to be sinks for information transfer, while peripheralnodes appear to be sources. This has been established inmathematical and simulation studies as well as empirical studiesin multiple states and species (Moon et al., 2015, 2017).
Although graph analyses and studies of information transferare of neuroscientific interest, they are not currently measurablein real time in the routine clinical setting. The finding that alphapower in the superior parietal lobule returns on a more gradualtime scale might have clinical relevance. In a large randomizedcontrolled trial that assessed the effectiveness of the bispectralindex and end-tidal anesthetic concentration monitoring inpreventing intraoperative awareness and improving post-surgicalrecovery, mean discharge-readiness times in the recovery roomwere approximately 95-min (Mashour et al., 2012). Thus, therecovery of posterior alpha power in the current study parallelsreal-world recovery after surgery and anesthesia. Alpha poweris known to shift from the posterior region to the frontal areaat the point of propofol-induced unconsciousness as well asduring surgical anesthesia with sevoflurane (Purdon et al., 2013;Akeju et al., 2014) and (as shown in this study) isoflurane. Todate, posterior alpha has typically only been measured uponinitial recovery and often only after relatively short exposure.The present findings encourage further study of sensor-levelalpha changes in the posterior region that might serve as amarker for recovery from anesthesia. Further, study of the
relationship of network-level changes and posterior alpha poweris warranted.
Strengths of this study include high-density (128 channel)EEG recording, a clinically-realistic anesthetic regimen, andserial measurement of resting state networks during a prolongedrecovery time. Limitations relate to the poorer spatial resolutionof EEG compared to other neuroimaging modalities, therestriction of analysis to the alpha bandwidth, the inability toassess subcortical structures, and the coarse-grained analysisof networks that does not capture the fine-scale dynamics(spatially and temporally) of spike-level networks. Furthermore,the ostensible recovery of network efficiency just after emergencecould be due to the relatively low number of participants inthe study (n = 8). Alternatively, it might relate to the inherentvariability of emergence from anesthesia that has been identified
experimentally (Lee et al., 2011) and clinically (Chander et al.,2014). Finally, ondansetron was administered for the preventionof nausea and vomiting, and it is possible that this affectedthe EEG-derived network behavior; however, it is unlikely thatthis would significantly distort the far more dominant effects of1.3 age-adjusted minimum alveolar concentration of isofluraneadministered for 3 h.
In conclusion, a clinically-relevant anesthetic protocol andrecovery process demonstrates a significant depression offunctional network efficiency that returns in association withthe recovery of posterior alpha power over a clinically-relevanttimeframe, suggesting a potential biomarker for normal recoveryafter general anesthesia.
AUTHOR CONTRIBUTIONS
MA, MK, and GM conceived of and designed the study; SB, GV,and TB acquired EEG data; VT, EJ, PP, GG, and GM served as theclinical anesthesiologists; SB analyzed data; SB, BP, MA, MK, andGM interpreted the data; SB and GM wrote the manuscript; allauthors contributed to critical review of the manuscript.
FUNDING
Supported by the James S. McDonnell Foundation, St. Louis, MO(GM, MK, and MA); and the Department of Anesthesiology,University of Michigan, Ann Arbor, Michigan.
REFERENCES
Akeju, O., Westover, M. B., Pavone, K. J., Sampson, A. L., Hartnack, K. E.,
Brown, E. N., et al. (2014). Effects of sevoflurane and propofol on frontal
electroencephalogram power and coherence. Anesthesiology 121, 990–998.
doi: 10.1097/ALN.0000000000000436
Berger, H. (1930). Uber das Elektrenkephalogramm des Menschen II. J. Psychol.
Neurol. 40, 160–179.
Bonhomme, V., Vanhaudenhuyse, A., Demertzi, A., Bruno, M.-A., Jaquet,
O., Bahri, M. A., et al. (2016). Resting-state network-specific breakdown
of functional connectivity during ketamine alteration of consciousness
in volunteers. Anesthesiology 125, 873–888. doi: 10.1097/ALN.00000000000
01275
Boveroux, P., Vanhaudenhuyse, A., Bruno, M.-A., Noirhomme, Q., Lauwick,
S., Luxen, A., et al. (2010). Breakdown of within- and between-network
resting state functional magnetic resonance imaging connectivity during
propofol-induced loss of consciousness. Anesthesiology 113, 1038–1053.
doi: 10.1097/ALN.0b013e3181f697f5
Chander, D., García, P. S., MacColl, J. N., Illing, S., and Sleigh, J. W.
(2014). Electroencephalographic variation during end maintenance and
emergence from surgical anesthesia. PLoS ONE 9:e106291. doi: 10.1371/
journal.pone.0106291
Chennu, S., O’Connor, S., Adapa, R., Menon, D. K., and Bekinschtein, T. A.
(2016). Brain connectivity dissociates responsiveness from drug exposure
during propofol-induced transitions of consciousness. PLoS Comput. Biol.
12:e1004669. doi: 10.1371/journal.pcbi.1004669
Ferri, R., Rundo, F., Bruni, O., Terzano, M. G., and Stam, C. J. (2007).
Small-world network organization of functional connectivity of EEG
slow-wave activity during sleep. Clin. Neurophysiol. 118, 449–456.
doi: 10.1016/j.clinph.2006.10.021
Frontiers in Human Neuroscience | www.frontiersin.org 7 June 2017 | Volume 11 | Article 328

Blain-Moraes et al. Network Recovery after Anesthesia
Ferri, R., Rundo, F., Bruni, O., Terzano, M. G., and Stam, C. J. (2008). The
functional connectivity of different EEG bands moves towards small-world
network organization during sleep. Clin. Neurophysiol. 119, 2026–2036.
doi: 10.1016/j.clinph.2008.04.294
Hashmi, J. A., Loggia, M. L., Khan, S., Gao, L. M. D., Kim, J., Napadow, V.,
et al. (2017). Dexmedetomidine disrupts the local and global
efficiencies of large-scale brain networks. Anesthesiology 126, 419–430.
doi: 10.1097/ALN.0000000000001509
Hudetz, A. G., and Mashour, G. A. (2016). Disconnecting consciousness: is
there a common anesthetic end point? Anesth. Analg. 123, 1228–1240.
doi: 10.1213/ANE.0000000000001353
John, E. R., Prichep, L. S., Kox, W., Valdés-Sosa, P., Bosch-Bayard, J., Aubert, E.,
et al. (2001). Invariant reversible QEEG effects of anesthetics. Conscious. Cogn.
10, 165–183. doi: 10.1006/ccog.2001.0507
Jordan, D., Ilg, R., Riedl, V., Schorer, A., Grimberg, S., Neufang, S., et al. (2013).
Simultaneous electroencephalographic and functional magnetic resonance
imaging indicate impaired cortical top–down processing in association
with anesthetic-induced unconsciousness. Anesthesiology 119, 1031–1042.
doi: 10.1097/ALN.0b013e3182a7ca92
Latora, V., and Marchiori, M. (2001). Efficient behavior of small-world networks.
Phys. Rev. Lett. 87:198701. doi: 10.1103/PhysRevLett.87.198701
Lee, H., Mashour, G. A., Noh, G.-J., Kim, S., and Lee, U. (2013). Reconfiguration of
network hub structure after propofol-induced unconsciousness. Anesthesiology
119, 1347–1359. doi: 10.1097/ALN.0b013e3182a8ec8c
Lee, U., Ku, S., Noh, G., Baek, S., Choi, B., and Mashour, G. A. (2013). Disruption
of frontal–parietal communication by ketamine, propofol, and sevoflurane.
Anesthesiology 118, 1264–1275. doi: 10.1097/ALN.0b013e31829103f5
Lee, U., Müller, M., Noh, G.-J., Choi, B., and Mashour, G. A. (2011). Dissociable
network properties of anesthetic state transitions. Anesthesiology 114, 872–881.
doi: 10.1097/ALN.0b013e31821102c9
Lee, U., Oh, G., Kim, S., Noh, G., Choi, B., and Mashour, G. A. (2010). Brain
networks maintain a scale-free organization across consciousness, anesthesia,
and recovery: evidence for adaptive reconfiguration. Anesthesiology 113,
1081–1091. doi: 10.1097/ALN.0b013e3181f229b5
Liang, Z., King, J., and Zhang, N. (2012). Intrinsic organization of the
anesthetized brain. J. Neurosci. Off. J. Soc. Neurosci. 32, 10183–10191.
doi: 10.1523/JNEUROSCI.1020-12.2012
Maier, K. L., McKinstry-Wu, A. R., Palanca, B. J. A., Tarnal, V., Blain-
Moraes, S., Basner, M., et al. (2017). Protocol for the reconstructing
consciousness and cognition (ReCCognition) study. Front. Hum. Neurosci.
11:284. doi: 10.3389/fnhum.2017.00284
Mashour, G. A., Shanks, A., Tremper, K. K., Kheterpal, S., Turner, C.
R., Ramachandran, S. K., et al. (2012). Prevention of intraoperative
awareness with explicit recall in an unselected surgical population: a
randomized comparative effectiveness trial. Anesthesiology 117, 717–725.
doi: 10.1097/ALN.0b013e31826904a6
Maslov, S., and Sneppen, K. (2002). Specificity and stability in topology of protein
networks. Science 296, 910–913. doi: 10.1126/science.1065103
Mišic, B., and Sporns, O. (2016). From regions to connections and networks:
new bridges between brain and behavior. Curr. Opin. Neurobiol. 40, 1–7.
doi: 10.1016/j.conb.2016.05.003
Mitra, P., and Bokil, H. (2008). Observed Brain Dynamics. Oxford, UK: Oxford
University Press.
Monti, M. M., Lutkenhoff, E. S., Rubinov, M., Boveroux, P., Vanhaudenhuyse,
A., Gosseries, O., et al. (2013). Dynamic change of global and local
information processing in propofol-induced loss and recovery of
consciousness. PLoS Comput. Biol. 9:e1003271. doi: 10.1371/journal.pcbi.10
03271
Moon, J.-Y., Kim, J., Ko, T.-W., Kim, M., Iturria-Medina, Y., Choi, J.-H., et al.
(2017). Structure shapes dynamics and directionality in diverse brain networks:
mathematical principles and empirical confirmation in three species. Sci. Rep.
7:46606. doi: 10.1038/srep46606
Moon, J.-Y., Lee, U., Blain-Moraes, S., and Mashour, G. A. (2015). General
relationship of global topology, local dynamics, and directionality in large-
scale brain networks. PLoS Comput. Biol. 11:e1004225. doi: 10.1371/journal.
pcbi.1004225
Newman, M. E. J. (2006). Modularity and community structure in networks. Proc.
Natl. Acad. Sci. U.S.A. 103, 8577–8582. doi: 10.1073/pnas.0601602103
Nickalls, R. W. D., and Mapleson, W. W. (2003). Age-related iso-MAC charts
for isoflurane, sevoflurane and desflurane in man. Br. J. Anaesth. 91, 170–174.
doi: 10.1093/bja/aeg132
Palanca, B. J. A., Mitra, A., Larson-Prior, L., Snyder, A. Z., Avidan, M. S.,
and Raichle, M. E. (2015). Resting-state functional magnetic resonance
imaging correlates of sevoflurane-induced unconsciousness. Anesthesiology
123, 346–356. doi: 10.1097/ALN.0000000000000731
Purdon, P. L., Pierce, E. T., Mukamel, E. A., Prerau, M. J., Walsh, J. L., Wong,
K. F. K., et al. (2013). Electroencephalogram signatures of loss and recovery of
consciousness from propofol. Proc. Natl. Acad. Sci. U.S.A. 110, E1142–E1151.
doi: 10.1073/pnas.1221180110
Ranft, A., Golkowski, D., Kiel, T., Riedl, V., Kohl, P., Rohrer, G., et al.
(2016). Neural correlates of sevoflurane-induced unconsciousness
identified by simultaneous functional magnetic resonance
imaging and electroencephalography. Anesthesiology 125, 861–872.
doi: 10.1097/ALN.0000000000001322
Rubinov, M., and Sporns, O. (2010). Complex network measures of brain
connectivity: uses and interpretations. Neuroimage 52, 1059–1069.
doi: 10.1016/j.neuroimage.2009.10.003
Schröter, M. S., Spoormaker, V. I., Schorer, A., Wohlschläger, A., Czisch, M.,
Kochs, E. F., et al. (2012). Spatiotemporal reconfiguration of large-scale brain
functional networks during propofol-induced loss of consciousness. J. Neurosci.
32, 12832–12840. doi: 10.1523/JNEUROSCI.6046-11.2012
Spoormaker, V. I., Schröter, M. S., Gleiser, P. M., Andrade, K. C., Dresler, M.,
Wehrle, R., et al. (2010). Development of a large-scale functional brain network
during human non-rapid eye movement sleep. J. Neurosci. 30, 11379–11387.
doi: 10.1523/JNEUROSCI.2015-10.2010
Stam, C. J., Nolte, G., and Daffertshofer, A. (2007). Phase lag index: assessment
of functional connectivity from multi channel EEG and MEG with
diminished bias from common sources. Hum. Brain Mapp. 28, 1178–1193.
doi: 10.1002/hbm.20346
Tadel, F., Baillet, S., Mosher, J. C., Pantazis, D., and Leahy, R. M. (2011).
Brainstorm: a user-friendly application for MEG/EEG analysis. Comput. Intell.
Neurosci. 2011:879716. doi: 10.1155/2011/879716
Tinker, J. H., Sharbrough, F. W., and Michenfelder, J. D. (1977). Anterior
shift of the dominant EEG Rhythm during anesthesia in the Java
monkey: correlation with anesthetic potency. Anesthesiology 46, 252–259.
doi: 10.1097/00000542-197704000-00005
Vinck, M., Oostenveld, R., vanWingerden, M., Battaglia, F., and Pennartz, C. M. A.
(2011). An improved index of phase-synchronization for electrophysiological
data in the presence of volume-conduction, noise and sample-size bias.
Neuroimage 55, 1548–1565. doi: 10.1016/j.neuroimage.2011.01.055
Watts, D. J., and Strogatz, S. H. (1998). Collective dynamics of “small-world”
networks. Nature 393, 440–442. doi: 10.1038/30918
Conflict of Interest Statement: The authors declare that the research was
conducted in the absence of any commercial or financial relationships that could
be construed as a potential conflict of interest.
Copyright © 2017 Blain-Moraes, Tarnal, Vanini, Bel-Behar, Janke, Picton,
Golmirzaie, Palanca, Avidan, Kelz and Mashour. This is an open-access article
distributed under the terms of the Creative Commons Attribution License (CC BY).
The use, distribution or reproduction in other forums is permitted, provided the
original author(s) or licensor are credited and that the original publication in this
journal is cited, in accordance with accepted academic practice. No use, distribution
or reproduction is permitted which does not comply with these terms.
Frontiers in Human Neuroscience | www.frontiersin.org 8 June 2017 | Volume 11 | Article 328