
Network Dynamics and Field Evolution: The Growth of ...woodyp/papers/network_dynamics.pdfcommercial...
65
Network Dynamics and Field Evolution: The Growth of Interorganizational Collaboration in the Life Sciences Walter W. Powell Douglas R. White Stanford University UC Irvine and Santa Fe Institute [email protected] [email protected] Kenneth W. Koput Jason Owen-Smith University of Arizona University of Michigan [email protected] [email protected] FINAL VERSION Forthcoming, American Journal of Sociology Acknowledgements: We want to thank the Santa Fe Institute for providing the venue where these ideas were initially discussed and much of the work was done. We are espe- cially grateful to John Padgett, organizer of the States and Markets group at SFI for his support and insights. We have benefited from comments from the audience at seminars given at Illinois, Michigan, MIT, Oxford, Pennsylvania, SFI, Stanford, UC Irvine, UCLA, and the SSRC’s Economic Sociology Workshop at the Bellagio Center. We received very helpful comments from Peter Bearman, Tim Bresnahan, Paul David, Walter Fontana, Mauro Guillen, Heather Haveman, Sanjay Jain, Charles Kadushin, Bruce Kogut, Paul McLean, Jim Moody, Charles Ragin, Spyros Skouras, David Stark, and Brian Uzzi. We are indebted to Duncan Watts for providing access to his unpublished work, and to Mark Newman for sharing software that allowed us to compute the expected size of the largest connected components in our networks. We appreciate very much the excellent research assistance provided by James Bowie, Kjersten Bunker, Kelley Porter, Katya Seryakova, and Laurel Smith-Doerr. We thank Tanya Chamberlain for exceptional help in keeping track of numerous successive versions of the paper. The research was supported by grants from the National Science Foundation (#9710729 and SRS 0097970), the Hewlett Founda- tion, and the EPRIS project at the University of Siena.
Transcript of Network Dynamics and Field Evolution: The Growth of ...woodyp/papers/network_dynamics.pdfcommercial...

Network Dynamics and Field Evolution:
The Growth of Interorganizational Collaboration in the Life Sciences
Walter W. Powell Douglas R. White Stanford University UC Irvine and Santa Fe Institute [email protected] [email protected] Kenneth W. Koput Jason Owen-Smith
University of Arizona University of Michigan [email protected] [email protected]
FINAL VERSION Forthcoming, American Journal of Sociology
Acknowledgements: We want to thank the Santa Fe Institute for providing the venue where these ideas were initially discussed and much of the work was done. We are espe-cially grateful to John Padgett, organizer of the States and Markets group at SFI for his support and insights. We have benefited from comments from the audience at seminars given at Illinois, Michigan, MIT, Oxford, Pennsylvania, SFI, Stanford, UC Irvine, UCLA, and the SSRC’s Economic Sociology Workshop at the Bellagio Center. We received very helpful comments from Peter Bearman, Tim Bresnahan, Paul David, Walter Fontana, Mauro Guillen, Heather Haveman, Sanjay Jain, Charles Kadushin, Bruce Kogut, Paul McLean, Jim Moody, Charles Ragin, Spyros Skouras, David Stark, and Brian Uzzi. We are indebted to Duncan Watts for providing access to his unpublished work, and to Mark Newman for sharing software that allowed us to compute the expected size of the largest connected components in our networks. We appreciate very much the excellent research assistance provided by James Bowie, Kjersten Bunker, Kelley Porter, Katya Seryakova, and Laurel Smith-Doerr. We thank Tanya Chamberlain for exceptional help in keeping track of numerous successive versions of the paper. The research was supported by grants from the National Science Foundation (#9710729 and SRS 0097970), the Hewlett Founda-tion, and the EPRIS project at the University of Siena.

Abstract
We develop and test four alternative logics of attachment – accumulative advan-
tage, homophily, follow-the-trend, and multiconnectivity – to account for both the struc-
ture and dynamics of interorganizational collaboration in the field of biotechnology. The
commercial field of the life sciences is typified by wide dispersion in the sources of basic
knowledge and rapid development of the underlying science, fostering collaboration
among a broad range of institutionally diverse actors. We map the network dynamics of the
field over the period 1988-99. Using multiple novel methods, including analysis of net-
work degree distributions, network visualizations, and multi-probability models to estimate
dyadic attachments, we demonstrate how different rules for affiliation shape network evo-
lution. Commercialization strategies pursued by early corporate entrants are supplanted by
collaborative activities influenced more by universities, research institutes, venture capital,
and small firms. As organizations increase both the number of activities on which they col-
laborate and the diversity of organizations with whom they are linked, cohesive sub-
networks form that are characterized by multiple, independent pathways. These structural
components, in turn, condition the choices and opportunities available to members of a
field, thereby reinforcing an attachment logic based on connections to diverse partners that
are differently linked. The dual analysis of network and institutional evolution provides an
explanation for the decentralized structure of this science-based field.

Table of Contents Abstract Introduction Topology of Large-Scale Networks Field Structuration: Science Meets Commerce Data and Methods Analysis I: Degree Distributions Analysis II: Discrete Time Network Visualization Analysis III: Attachment Bias Conclusion and Implications
Appendix I: Network Visualization in Pajek Endnotes Tables 1-7
References Appendix II: Tables A1-A3 Figures
List of Tables: Table 1 Top Ten Biotechnology Drugs, 2001 Table 2 Patterns of Entry and Exit into the Network Table 3 Variables in Statistical Tables Table 4 Test of Accumulative Advantage: Odds Ratio from McFadden
Model Table 5 Test of Homophily: Odds Ratio from McFadden Model Table 6 Test of Follow-the-Trend: Odds Ratio from McFadden Model Table 7 Test of Multiconnectivity: Odds Ratio from McFadden Model
List of Figures: Figure 1 DBF and University Patents, 1976-99 Figure 2 Distribution of Organizational Forms and Activities Figure 3 Degree Distributions by Type of Partner
Pajek figures 4 1988 Main Component, All Ties 5 1989 Main Component, New Ties 6 1993 Main Component, All Ties 7 1994 Main Component, New Ties 8 1997 Main Component, All Ties 9 1998 Main Component, New Ties 10 1997 All Ties, Main Component, Cohesion 11 1998 New Ties, Main Component, Cohesion

4
Introduction The images of field and network are
common in both contemporary physical and social science. In the physical sciences, fields are organized by information in the form of geometric patterns. The study of the geometry of fields has attracted consid-erable interest in the statistical mechanics of complex networks. Research by physi-cists interested in networks has ranged widely from the cellular level, a network of chemicals connected by pathways of chemical reactions, to scientific collabora-tion networks, linked by coauthorships and co-citations, to the world-wide web, an immense virtual network of websites con-nected by hyperlinks (Albert, Jeong, and Barabási, 1999; Jeong et al, 2000; New-man, 2001; Watts and Strogatz, 1998). Al-bert and Barabási (2002) and Newman (2003) provide excellent overviews of this burgeoning literature on the network topol-ogy of different fields, highlighting key organizing principles that guide interac-tions among the component parts.
In the social sciences, however, analy-ses of fields and networks have been oddly disconnected. We say oddly because the study of the macro dynamics of networks should be central to the understanding of how fields evolve. This lack of connection is rooted in several features of contempo-rary research. There is an abundance of re-search in network analysis on why ties form between two actors and what the con-sequences are of having a particular posi-tion in a network. Salancik (1995) ob-served, however, that most network re-search has taken an individual-level per-spective, and missed out on the opportunity to illuminate the structure of collective ac-tion. McPherson et al (2001) note that there are few studies that employ longitudinal data to analyze networks. Burt (2000) has voiced a similar concern that most studies of network structure are cross-sectional. In
the most comprehensive text on network methods, there is only a paragraph on net-work dynamics in a section on future direc-tions (Wasserman and Faust, 1994). Thus while some progress has been made analyz-ing the dynamics of dyads (e.g., Lincoln et al, 1996; Gulati and Gargiulo, 1998; Stuart, 1998), little attention has been given to the evolution of entire networks.
There are a number of excellent studies of the structuring of specific organizational fields (DiMaggio, 1991; Thornton, 1995; Dezalay and Garth, 1996; Ferguson, 1998; Scott et al, 2000; Hoffman, 2001; Morrill and Owen-Smith, 2002). An organizational field is a community of organizations that engage in common activities and are sub-ject to similar reputational and regulatory pressures (DiMaggio and Powell, 1983). Such fields have been defined as “a net-work, or a configuration, of relations be-tween positions” (Bourdieu, 1992), and as “centers of debates in which competing in-terests negotiate over the interpretation of key issues” (Hoffman, 1999:351). Fields emerge when social, technological, or eco-nomic changes exert pressure on existing relations, and reconfigure models of action and social structures. But despite the rela-tional focus on how different actors and organizations constitute a recognized arena of social and economic activity, studies of fields have not analyzed the interactions of multiple, overlapping networks or the regu-lated reproduction of network ties through time. This linkage between network dy-namics and the evolving structure of fields needs to be made in order to make progress in explaining how the behavior of actors or organizations of one kind or another influ-ence the actions of organizations of another kind.
The goal of this paper is to account for the development and elaboration of the commercial field of biotechnology, show-ing how the formation, dissolution, and re-
5
wiring of network ties over a twelve-year period, from 1988 to 1999, has shaped the opportunity structure of the field.1 By map-ping changing network configurations, we discern how logics of attachment shift over time, and chart multiple influences on the varied participants in the field. Our effort is part of a more general move in the social sciences to analyze momentum, sequences, turning points, and path dependencies (see Abbott, 2001, for an overview). By linking network topology and field dynamics, we consider social change not as an invariant process affecting all participants equally, but as reverberations felt in different ways depending on an organization’s institu-tional status and location in the overall network as that structure evolves over time. Our aim is to illuminate how patterns of interaction emerge, take root, and trans-form, with ramifications for all of the par-ticipants.
We develop arguments concerning how the topology of a network and the rules of attachment among its constituents guide the choice of partners and shape the trajectory of the field. As organizations enter an arena and relationships deepen and expand, sig-nificant structural changes occur. To ana-lyze and understand these emergent net-work structures, we use a triangulation of methods. We first analyze the expansion of the network to see if the process is random or uniform. Prior research suggests that as new organizations join the network, there is an attachment bias of a higher probability of being linked to an organization that al-ready has ties (de Solla Price, 1965, 1980; Barabási, 2002a). We go further and assess whether other attachment processes are op-erative as well. We map the development of the field by drawing network configura-tions to create a framework with which to view network dynamics. Pajek (de Nooy, Mrvar, and Batagelj, forthcoming) is our software package of choice for the repre-
sentation of network dynamics. Pajek al-lows us to analyze the nearly 2,800 nodes in our sample, and to identify cohesive subsets such as multi-connected compo-nents (White and Harary 2001: 12-14). We present a small selection of these network visualizations to highlight both the evolv-ing topology of the field and the processes by which new ties and organizations are added. (The full ‘movie’, with year-to-year representations of the topology and new additions to the network, is available for viewing on the web at http://www-personal.umich.edu/~jdos/paj_mov.html). We then turn to a statistical examination of network formation and dissolution, and assess the effects of alternative mechanisms of at-tachment. Using McFadden’s discrete choice model (McFadden 1973; 1981), a variant of the conditional logit model, we test to see if the basis of attraction is accu-mulative advantage, similarity, follow-the-trend, or diversity.
The Topology of Large-Scale Networks
A variety of researchers in physics and sociology are studying the structure of large-scale networks with the intuition that complex adaptive systems evince organiz-ing principles that are encoded in their to-pology. Large-scale networks typically have characteristic signatures of local structure, such as clustering, and a global structure, such as average distance between nodes. Local and global characteristics of networks help to define network topologies such as small worlds, which are large net-works with both local clustering and rela-tively short global distance. Watts (1999) showed that adding only a handful of re-mote links to a large network where the level of local clustering is high (e.g., friends of friends are friends) is sufficient to create a small-world network. Watts and Strogatz (1998) helped to revitalize the ear-lier line of research introduced by Milgram

6
(1967) and developed by White (1970). The wide appeal of the small-world idea had been portrayed in the arts, in John Guare’s play Six Degrees of Separation, and in the popular Kevin Bacon game, where virtually every Hollywood actor is linked through a few steps. Even a small proportion of randomly distributed ties can knit together diverse clusters of nodes to produce the small world phenomenon. Re-searchers have applied the small-world concept to a wide range of activities, in-cluding scientific collaborations (Newman, 2001) and corporate board interlocks (Kogut and Walker, 2001; Davis, Yoo, and Baker, 2003).
Watts and Strogatz’s (1998) formaliza-tion of the small-world problem lacked any role for network hubs, which are nodes with an unusually large number of ties or edges, in the language of graph theory. This limita-tion was also true for early models of ran-dom networks, in which an equal probability of any given pair of nodes being connected generated only a mild tendency for nodes to differ in their number of edges.2 But re-search on the degree distributions of citation networks, however, has shown highly skewed distributions, with most nodes hav-ing few links, while a handful of nodes have an exceedingly large number of ties. Lotka (1926) and de Solla Price (1965, 1980) showed that for the tails of degree distribu-tions of citation networks, the proportion of nodes with degree k often varies as a func-tion of 1/kα, that is, by the inverse power law P(k) ~ 1/kα, where alpha is the power coeffi-cient. Barabási and Albert (1999:510) and Barabási (2002b:70) popularized the term ‘scale-free’ for such networks, 3 and con-firmed that network growth with preferential attachment according to degree4 predicts a scale-free tail of the degree distribution. The well-connected nodes that newcomers attach to become hubs that create short paths be-tween many pairs of nodes in the network.
Preferential attachment to higher degree leads to a dynamic of rich-get-richer and power-law tails of degree distributions are present in very diverse kinds of networks. In the movie actor network, for example, new actors tend to start their careers in supporting roles accompanying famous ac-tors, and in science, new publications cite well-known papers. Attachment bias in network formation bears strong similarity to the more general phenomenon of accu-mulative advantage (Merton, 1973), in which those who experience early success capture the lion’s share of subsequent re-wards. We use early-starter accumulative advantage and preferential attachments as baseline arguments, since they provide po-tential explanations for growing inequali-ties in the process of network expansion. But not all early entrants turn out to be winners, and some latecomers attain prominence. As the saying goes, the early bird may catch the worm, but it is always the second mouse that eats the cheese. Similarly, Albert and Barabási’s (2002) formalization of a “scale-free” class of networks, where the probability that a new entrant will choose to link to an incumbent node is proportional to the number of links it has already, is elegantly simple but quite possibly overgeneralized. Other attachment processes, or a combination of diverse processes, can produce power law degree distributions. Our analyses test for multi-ple, potential probabilistic biases in the processes of network growth.
We enter the discussion of network dy-namics with data from a field where social, political, economic, and scientific factors loom large in shaping patterns of attach-ment among the participants. In earlier work on the biotechnology industry, Pow-ell, Koput, and Smith-Doerr (1996) found a liability of disconnectedness, in which older, less-linked organizations were the most likely to fail. Certainly, early entrants

7
have more time than later arrivals to estab-lish connections, but Powell et al (1996) found that how connections were estab-lished and what activities were pursued was critical. Biotechnology firms had to both make news and be in on the news, that is, they needed to generate novel contribu-tions to the evolving science as well as have the capability to evaluate what other organizations were doing. The pathway to centrality in the industry network was through research and development collabo-rations. Other routes were either ineffective or much slower in generating centrality. Moreover, in a highly competitive world in which it is not easy to rest on past accom-plishments, firms that do not expand or re-new their networks lose their central posi-tions. At the same time, resource-rich par-ticipants are more capable of altering their positions, by reconfiguring their networks.
Biotechnology is characterized by a high rate of formation and dissolution of linkages. Connections are often forged with a specific goal in mind, such as taking a company public or selling and distributing a new medicine. Once the task is com-pleted, the relationship is ended, and suc-cessful collaborators depart gracefully. There is a good deal of entry and exit into the field, with new entrants joining at par-ticular times when financing is available and novel scientific opportunities can be pursued. The rate at which new nodes ap-pear in the network is, in part, determined by the success that existing nodes have in making progress on a technological fron-tier. Moreover, many of the participants in the field are ‘multi-vocal’, that is, they are capable of performing multiple activities with a variety of constituents (Burt, 1992; Padgett and Ansell, 1993; White, 1985; 1992). But multi-vocality is not distributed evenly, those organizations that are more centrally located in the industry have ac-cess to more sophisticated and diverse col-
laborators, and have developed richer pro-tocols for collaboration (Powell et al, 1996).
To illustrate the questions we are pur-suing, consider a contemporary dance club, where revelers compete to get inside and once inside, may dance in groups or with only one partner or many partners during an evening. The mix of available partners changes as the evening goes on, and di-verse styles of music are played in different rooms. While new partners may be chosen, the imprint of past choices often lingers. Some dancers may be highly sought after and some music may attract more dancers. Or, by way of contrast, consider a much more formal setting, such as an early 20th century Swedish military ball, where the young officers would ride in a horse-drawn carriage around Stockholm in advance of the event with an official dance card, and visit the homes of young women to obtain permission to dance with them from their parents. By the time of the dance, the aspir-ing young officers had filled their dance card and rehearsed their repertoire of con-versation and dance.5 In such settings, an analytically rich set of questions follows: who dances which dance with whom and when? To address these questions, one needs information about the cast of partici-pants, the repertoire of activities per-formed, and the sequences linking partners and activities. As the combinations of part-ners and dances unfold, collective dynam-ics emerge. Individual choices may cumu-late into a cascade, resulting in everyone following similar scripts. Or trends may cluster and find coherence only in small densely connected groups. Choices made early may strongly affect subsequent op-portunities, but path dependence can be offset by a constant flow of new arrivals and departures. The challenge to under-standing any such highly interwoven sys-tem is to relate the behavior and dynamics

8
of the entire structure with the properties of its constituents and their interactions, and to discern what types of actors and rela-tionships are most critical in shaping the evolution of the field at particular points in time.
We assess different sources of attach-ment bias and test to see if these simple rules guide the process of partner selection, and if so, for which participants and at what points in time? We supplement the idea of accumulative advantage with alter-native mechanisms that sociologists have repeatedly found to be important in the formation of social and economic ties and the evolution and replication of social structures. The first alternative to early ad-vantage or rich-get-richer is homophily (McPherson and Smith-Lovin, 1987), a process of social similarity captured best in the phrase, ‘birds of a feather flock to-gether’. A second alternative is based on following the trend, thus the participants observe others and attempt to match their actions to the dominant behavior of the overall population (White, 1981; DiMaggio and Powell, 1983). In this context, action is triggered by a sense of necessity, by a de-sire to keep pace with others by acting ap-propriately (March and Olsen, 1989; 160-2). This pattern may also arise from par-ticipants reacting in similar ways to com-mon exogenous factors.
We contrast arguments based on either rich-get-richer or processes such as homo-phily, and a logic of appropriateness with a model based on multiconnectivity (the mul-tiple linking of partners both directly and through chains of intermediaries) and a preference for diversity. To pursue the dance imagery, homophily suggests that when you select a new partner, he or she is someone with attributes similar to those with whom you have already danced. A rich-get-richer process involves competing for the most popular dancer. Following the
trend entails choosing both a partner and a dance that are comparable to the choices of most other participants.
A preference for diversity, however, suggests a search for novelty, and the incli-nation to move in different communities and interact with heterogeneous partners. Our ideas concerning multiconnectivity involve several intuitions. A cohesive net-work, with plural pathways, means partici-pants are connected through different link-ages. Thus many nodes must be removed to disconnect such a structure, meaning such groupings are more resilient. The more pathways for communication and ex-change, the more rapidly news percolates through the network. In turn, when more knowledge is exchanged, participants at-tend to their network partners more inten-sively (Powell, 1990). The enhanced flow of ideas and skills then becomes an attrac-tion, making the network more appealing to join. Rapid transmission and diverse par-ticipants enhance both the likelihood of recombination and the generation of nov-elty. In the language of organizational learning, diversity entails a preference for exploration over exploitation (March, 1991). Of course, we do not necessarily expect that one mechanism dominates at all time periods and exerts equal gravitational pull on every participant. The very essence of dynamic systems is that they change continually over time. The actors may well play by different rules at different points in time, depending on the experience of their partners and their position in the social structure. Moreover, alternative organizing principles may be dominant at different stages in the formation of the network. Framed more formally, the alternative mechanisms can be stated as:
H1: Network expansion occurs through a process in which the most-connected nodes receive a dispropor-

9
tionate share of new ties (Accumulative Advantage).
H2: Network expansion follows a process in which new partners are cho-sen on the basis of their similarity to previous partners (Homophily).
H3: Network expansion entails herd-like behavior, with participants matching their choices with the domi-nant choices of others, either in mutual response to common exogenous pres-sures or through imitative behavior (Follow-the-trend).
H4: Network expansion reflects a choice of partners that connect to one another through multiple independent paths, which increases reachability and the diversity of actors that are reachable (Multiconnectivity).
Field Structuration: Science Meets Commerce
Our empirical focus is on the commer-cial field of biotechnology, which devel-oped scientifically in university labs in the 1970s, saw the founding of hundreds of small science-based firms in the 1980s, and matured in the 1990s with the release of dozens of new medicines. This field is no-table for its scientific and commercial ad-vances and its diverse cast of organizations, including universities, public research insti-tutes, venture capital firms, large multina-tional pharmaceutical corporations, and smaller dedicated biotech firms (which we refer to as DBFs). Because the sources of scientific leadership are widely dispersed and rapidly developing, and the relevant skills and resources needed to produce new medicines are broadly distributed, the par-ticipants in the field have found it neces-sary to collaborate with one another. The evolving structure of these collaborative ties are the focus of our network study. Concomitant with changes in the network, an elaborate system of private governance
has evolved to orchestrate these interor-ganizational relationships (Powell, 1996), and the internal structure of organizations has changed accordingly, co-evolving with the collaborative network.
In the early years of the industry, from 1975-87, most DBFs were very small start-ups, and deeply reliant on external support out of necessity. No DBF in this period had the necessary skills or resources to bring a new medicine to market; thus they became involved in an elaborate lattice-like struc-ture of relationships with universities and large multinational firms (Powell and Brantley, 1992). The large multinational firms, with well established internal career ladders, lacked closeness to the cutting edge of university science. Lacking a knowledge base in the new field of molecu-lar biology, the large companies were drawn to the startups, which had more ca-pability at basic and translational science (Gambardella, 1995; Galambos and Stur-chio, 1996). This asymmetric distribution of technological, organizational, and finan-cial resources was a key factor in driving early collaborative arrangements in the in-dustry (Orsenigo, 1989; McKelvey, 1996; Hagedoorn and Roijakkers, 2002).
Many commentators at the time argued that these interdependent linkages were fragile and fraught with possibilities of “hold-up”, in which one party could oppor-tunistically hinder the other’s prospects for success.6 Some analysts argued that the field would undergo a “shakeout,” with large pharmaceutical companies asserting dominance and the rate of founding of new firms slowing to a trickle (Sharpe, 1991; Teece, 1986). But as these observers and others came to recognize, a shakeout did not occur, nor did cherry-picking of the most promising firms by larger companies prove viable.7 Instead, the ensuing period saw the give-and-take, mutual forbearance of relational contracting (Macneil, 1978)
10
become institutionalized as a common practice in this rapidly developing field. By the late 1980s, some of the dedicated bio-tech firms had become rather large and formidable organizations in their own right, while many of the big pharmaceuticals cre-ated in-house molecular biology research programs (Henderson and Cockburn, 1996; Zucker and Darby, 1997). So even as mu-tual need declined as a basis for inter-organizational affiliations, the pattern of dense connectivity deepened, suggesting the original motivation of exchanging complementary resources had changed to a broader focus on utilizing innovation net-works to explore new forms of R&D col-laboration and product development (Pow-ell et al, 1996). This is the period we focus on with data from 1988-99. Table 1, which lists the top-selling biotechnology drugs in 2001, illustrates the division of innovative labor that has typified the field. All ten drugs were developed by biotech firms, but only five were marketed by biotech firms, and just four by their originator. In the other five cases, a large pharmaceutical company handled or guided the marketing in return for a hefty share of the earnings. Comparable data from the early 1990s in-dicate that marketing power and control of revenues was dominated overwhelmingly by the pharmaceutical giants (Powell and Brantley, 1996). A notable feature of drug development is that there is no consumer loyalty to a company, and limited brand loyalty as well. Combine these influences with a market structure that has many win-ner-take-most features, and the outcome is a volatile, fast-changing field.
[TABLE 1 HERE] A number of factors undergird the col-
laborative division of labor in the life sci-ences. No single organization has been able to internally master and control all the competencies required to develop a new medicine. The breakneck pace of technical
advance has rendered it difficult for any organization to stay abreast on so many fronts, thus linkages to universities and re-search institutes at the forefront of basic science are necessary (Orsenigo, Pammolli, and Riccaboni, 2001). The high rate of technical renewal is reflected in patent data. Figure 1 shows the brisk rise of life science patenting, and highlights the simi-larities in the technological trajectories of universities and biotech firms.8 Note the parallel climb of university and DBF pat-enting in the mid-1980s, a steady ascent for the next ten years, and a steep increase in the late 1990s. Universities start out ahead and then are passed by DBFs in 1997, but the more important point is the extent to which both become members of a common technological community (Owen-Smith and Powell, 2001a and b). This joint mem-bership in a community greatly increases the frequency of interaction between uni-versities and industry.
[FIGURE 1 HERE] The availability of funding has also in-
creased markedly as biomedicine has be-come a major force in modern society. The total budget of the U.S. National Institutes of Health, a key funder of basic research that allocates approximately 80% of its budget to external research grants to uni-versities and firms, nearly doubled under the Clinton administration, going from $8.9 billion in 1992 to $17.08 billion in 2000. The NIH plays a highly significant role in fostering exploration and variety on the research front. Internal R&D expenditures by biotech and pharmaceutical companies have also ramped up, from $6.54 billion in 1988 to $26.03 billion in 2000.9 Venture capital disbursements, or seed money to biotech startups, have flowed into biotech, but more irregularly as the public equity markets have windows of opportunity when particular technologies are in vogue. As Lerner, Shane, and Tsui (2003) note,

11
unexpected events affecting a single firm – notably the rejection or delay of a drug candidate by the U.S. Food and Drug Ad-ministration, can have pronounced effects on all firms’ stock prices and ability to raise capital. Consequently, venture fund-ing of biotech is rather episodic, reaching $395.5 million in 1988, declining over the next three years, then jumping to $586.4 million in 1992, remaining around the half billion level for next four years, then climbing to $1.1 billion in 1997, and stay-ing above $1 billion in 1998 and 1999.10 Biotech financing by venture capital is also somewhat countercyclical, thus when there was great enthusiasm for internet and tele-com startups, interest in biotech waned. In recent years, with the burst of the internet bubble and a precipitous decline in tele-communications, biomedical support has been on the upswing. Biotech firms that are well positioned in the network with con-nections to basic research funding, indus-trial R&D support, and venture capital fi-nancing, are not only able to obtain money from multiple sources, they also develop the capability to interact with varied par-ticipants. These experiences facilitate or-ganizational learning and expand the scope and depth of an organization’s knowledge base.
The different members of the field have varying catalytic abilities and competen-cies. Some of the participants are quite spe-cialized, while others have a hand in multi-ple activities. Figure 2 provides simple count data to illustrate the relationship be-tween functional activity and organiza-tional form, and suggests how the corre-spondence of activity and form has shifted over time. The top figure emphasizes an overall pattern of expansion in number of ties, and for three of the forms of organiza-tion, a branching out in terms of activity. Growth and diversity go hand-in-hand for DBFs, PROs, and large pharmaceutical
companies. Venture capital growth is nota-ble as well, but as the percentage figure on the bottom reveals, there is a strong co-occurrence of some forms and activities: government specializes in R&D, venture capital in finance. Some organizations, however, are able to shift their attention. While enlarging the number of ties, both dedicated biotech firms and public research organizations broadened their range of ac-tivities as well. The lower figure, which reports the percentage of activity by organ-izational form, illustrates the pattern of specialization by government and VCs, and the diversification by biotech and pharma-ceuticals, while PROs display a trend to-ward a R&D and licensing model. Looking at types of activity, VCs come to dominate finance, as pharmaceuticals master com-mercial ties, while licensing and R&D are pursued by an array of participants.
[FIGURE 2 HERE] Finally, as the field gained coherence,
and the pattern of reliance on collaboration proliferates, institutions emerged to both facilitate and monitor the process. Offices were established on university campuses to promote university technology transfer (Owen-Smith and Powell, 2001a), law firms developed expertise in intellectual property issues in the life sciences, and venture capital firms provided financing, along with management oversight and re-ferrals to a host of related businesses. As these relations thickened and a relational contracting infrastructure grew (Powell, 1996), the reputation of a participant came to loom larger in shaping others’ percep-tions. Robinson and Stuart (2002) argue persuasively that the network structure of the field becomes a “platform for the diffu-sion of information about the transactional integrity” of its participants. Centrality in the network increases the visibility of a participant’s actions and, they demonstrate, reduces the need for more overt, contrac-

12
tual forms of control, such as an equity stake or dominance on the board of direc-tors. We turn now to a discussion of the database we have developed to map the evolving structure of this field.
DATA AND METHODS
Our starting point in developing a sam-ple is BioScan, an independent industry directory, founded in 1988 and published six times a year, which covers a wide range of organizations in the life sciences field.11 Our focus is on dedicated biotech firms (DBFs). We include 482 companies that are independently operated, profit-seeking entities involved in human therapeutic and diagnostic applications of biotechnology. We omit companies involved in veterinary or agricultural biotech, which draw on dif-ferent scientific capabilities and operate in quite different regulatory climates. The sample of DBFs covers both privately-held and publicly-traded firms. We include pub-licly held firms that have minority or ma-jority investments in them by other firms, as long as the company’s stock continues to be independently traded. We exclude or-ganizations that might otherwise qualify as DBFs, but are wholly-owned subsidiaries of pharmaceutical or chemical corpora-tions. Large pharmaceutical corporations, health care companies, hospitals, universi-ties, or research institutes enter our data-base as partners that collaborate with dedi-cated biotech firms. Our rationale for ex-cluding both small subsidiaries and large, diversified chemical, medical, or pharma-ceutical corporations in the primary (DBF) database is that the former do not make de-cisions autonomously, while biotechnology may represent only a minority of the activi-ties of the latter. Their exclusion from the primary sample of DBFs eliminates serious data ambiguities.
The primary sample covers 482 DBFs over the 12-year period, 1988-99. In 1988,
there were 253 firms meeting our sample criteria. During the next 12 years, 229 firms were founded and entered the data-base; 91 (of the 482) exited, due either to failure, departure from the industry, or merger. The database, like the industry, is heavily centered in the U.S., although in recent years there has been considerable expansion in Europe. BioScan reports in-formation on a firm’s ownership, financial history, formal contractual linkages to col-laborators, products, and current research. Firm characteristics reported in BioScan include founding data, employment levels, financial history, and for firms that exit, whether they were acquired or failed. The data on interorganizational agreements cover the time frame and purpose of the relationship. Our database draws on Bio-Scan’s April issue, in which new informa-tion is added for each calendar year. Hence the firm-level and network data are meas-ured during the first months of each year. We define a collaborative tie, or alliance, as any contractual arrangement to exchange or pool resources between a DBF and one or more partner organizations. We treat each agreement as a tie, and code each tie for its purpose (e.g., licensing, R&D, fi-nance, commercialization) and duration. Some ties involve multiple stages of the production process. All such ties include commercialization activities, such as manu-facturing or marketing, hence we code complex agreements as commercial ties. We say a connection, or link, exists when-ever a DBF and partner have one or more ties between them.
We seek to explain the processes that attract two parties to one another, the evolving patterns of tie formation and dis-solution, and the overall structure of the network. We code the dominant forms of partner organizations into six categories, representing those that populate the field: public research organizations (including

13
public and private universities and non-profit research institutes and research hos-pitals); large multinational pharmaceutical corporations (as well as chemical and di-versified health care corporations); gov-ernment institutes (such as the National Cancer Institute or the Institut Pasteur); financial institutions (principally venture capital as well as banks and insurance companies); other biomedical companies (providers of research tools or laboratory equipment); and those DBFs that collabo-rate with other biotech companies. There are more than 2,300 non-DBFs in the part-ner database.
The four types of ties involve different activities, ranging from basic research to finance to licensing intellectual property to sales and marketing. Thus, the matrix of organizational forms and activities is 6 x 4, or 24 possible combinations of partner forms and functional activities of ties. Some of the cells are quite rare, but there are cases in every cell. Some of these ac-tivities involve the exchange or transfer of rights, while others require sustained joint activity. The latter obviously entails more integration of the two parties to a relation-ship. This difference is one reason why we treat the four types of activities separately in most analyses.
Given the differentiation of organiza-tional forms and types of ties, our approach has some limitations. In some, though not all, of our measures, we treat the type of tie or the form of the partner as equally impor-tant. Obviously, this is not altogether real-istic; indeed, if the analyses were based on only a single year of data, this limitation would loom large. The benefit of this as-sumption is that it permits comparisons across time periods. There is also heteroge-neity in the nature of participation of dif-ferent organizational forms for a particular type of activity. At the extreme, an R&D partnership between a global pharmaceuti-
cal company and a DBF may reach the scale of $1 billion dollars, while a DBF’s R&D alliance with a university laboratory may involve as little as one or two hundred thousand dollars. The salience of these limitations recedes as we add more years of observations to the data set. The advan-tages of twelve years of fine-grained data reside in capturing the length of relation-ships, the dissolution of ties to particular partners and the forging of ties to others, as well as the deepening of some ties. Issues of scale are held constant while we exam-ine duration of ties and the extent to which the parties involved in a relationship share other partners in common at specific points in time. This approach allows us to speak to Salancik’s (1995: 348) concern that net-work analysis should show how adding or subtracting a particular interaction in a network changes the coordination among the participants, and either enables or dis-courages interactions between parties.
We do not collect data on the ties among the non-DBF partner organizations. In some cases, such ties would be very sparse or non-existent (e.g., venture capital funding of universities or pharmaceutical companies); in other cases, they are more common (e.g., pharmaceutical support of clinical trials conducted at a university medical center).12 The practical problem is that the data on a network of 2,310 x 2,310 disparate organizations would be very dif-ficult to collect. Thus, we analyze the con-nections that DBFs have to partners, and the portfolio of DBFs with whom each partner is affiliated. To do this we use k-components to identify cohesive subsets of organizations.13 This measure of multicon-nectivity does not require complete data on relations among non-biotech partners, thus allowing us to analyze the total network of nearly 2,800 organizations. Our focus, then, is on cohesion, mediated exclusively by ties with DBFs.
14
Network measures such as the analysis of degree distributions, unlike k-components, require complete data. To this end, in the first and third of the analyses that follow, we separate our database into two parts: the complete one-mode network (482 x 482) of ties among DBFs, where we also have extensive data on the attributes of the 482 biotech firms, and the two-mode network that consists of complete data on the ties of DBFs to non-DBF organizations.
Over the past decade, we have also in-terviewed more than 200 scientists and managers in biotech and pharmaceutical firms, as well as university professors who are actively involved in commercializing basic research. Members of our research group have done participant observations in university technology licensing offices, biotech firms, and large pharmaceutical companies. Students working on the pro-ject have developed a large data set on the founders of biotech companies, and ana-lyzed the careers of scientists who joined biotech companies. In short, while the analyses presented here are based on data derived from industry sources, our intuition about the questions to address are grounded in primary data collection.
Analysis I: Degree Distributions
Research on networks in the graph theoretic and statistical mechanics tradi-tions often utilizes degree distributions as a diagnostic indicator of whether tie-formation in a network (growth or re-placement) is equiprobable (simple ran-dom) for all pairs of nodes or biased pro-portional to existing ties of potential part-ners. The degree of each node is meas-ured as the number of other nodes directly connected to the focal node. Preferential attachment to already connected nodes is referred to as a popularity bias. Unlike the tail of a random bell curve whose distri-bution thins out exponentially as it de-
cays, a distribution generated by a popu-larity bias has a “fat” tail for the relatively greater number of nodes that are highly connected. The fat tail contains the hubs of the network with unusually high con-nectivity.
Different types of degree distributions can be distinguished when plotted on a log-log scale, with log of degree on the x axis and log of the number of nodes with this degree on the y axis. The degree distribution for a network in which the formation of edges is governed by a popularity bias, where nodes with more connections have a higher probability of receiving new attachments, would plot as a straight line on the log-log graph, in-dicative of a power law.14 A power-law degree distribution is not sufficient by itself, however, to identify the actual mechanisms that facilitate tie-formation. A power-law degree distribution can reflect not only preferential attachment by incumbency (degree of attracting node) but preferences for attractiveness, legiti-macy, diversity, or a concatenation of mechanisms and still exhibit a power-law degree distribution. In our study, we test for the existence of a preferential attach-ment process for each year to the next rather than assume its existence. We use multivariate analysis to try to discern specific mechanisms that govern tie-formation and the type of degree distribu-tions that different substantive processes generate. Before we begin that analysis, however, it is useful to examine the de-gree distributions.
In Figure 3, we plot the aggregate de-gree distributions of DBFs on log-log scales for the six types of partners for bio-tech firms: other DBFs; pharmaceutical, chemical, and diversified health-care cor-porations; universities, non-profit research institutes and hospitals; government agen-cies; venture capital firms and other finan-

15
cial entities such as banks; and biomedical companies that supply research tools and instruments. For each of the six plots, the x-axis reflects log-degree (aggregated over all time periods) and the y-axis the log of the number of partners of the plotted form having x degree of attachments to DBFs (also aggregated over all time periods). A power-law distribution, as noted, would plot as a straight line. For a network of sufficient density, an exponential-decay degree distribution, mimicking the results of a simple random process of tie-formation, would form a convex curve that bows to the upper right away from the origin in the log-log plot. An exponential distribution can be statistically rejected from the data presented in Figure 3, along with a simple-random attachment process that would generate degree distributions that decay exponentially.15
The least-squares fitted linear slopes for the log-log plot of the degree distributions in Figure 3 are in the expected range for power-laws, between 1.1 and 2.7, over four decades of variation in degree. Only the left or low-degree half of one of the distribu-tions, that for government agencies, has a slope anywhere near 3, as expected from pure preferential attachment for large net-works (Barabási and Albert 1999, Bollobás and Riordan 2002). This government de-gree distribution is interesting because of the highly pivotal central role of the Na-tional Institutes of Health, which is a key funder of basic research. The NIH is the most active partner in the entire network. That the slopes of the five other distribu-tions are considerably less than 3 may be an indication that processes other that pure preferential attachment are operative.16
Although these degree distributions are aggregate measures over all time periods, they give some hint of growth processes in attachment. The shape of the distributions mimics what would be ex-
pected for tie-formation in the biotech network from a process of preferential attachment to degree, but power-law slopes that are closer to 1 than to 3 sug-gest that other substantive processes are operating. These static snapshots of the degree distributions, however, do indicate the importance of different organizational forms varies with respect to patterns of affiliation. To explore the dynamics of the field and the changing impact of different organizations, we next present a series of force-directed network visualizations, followed by a statistical examination of the actual attachment processes.
Analysis II: Discrete Time Network Visualizations
We utilize Pajek, a freeware package for the analysis and visualization of net-works, to present a series of discrete-time images of the evolution of the biotechnol-ogy network. Pajek employs two powerful minimum energy or ‘spring-embedded’ network drawing algorithms to represent network data in two-dimensional Euclidian space. These algorithms simulate the net-work of collaborations as a system of inter-acting particles, in which organizational nodes repel one another unless network ties act as springs to draw connected nodes closer together. Spring-embedded algo-rithms iteratively locate a representation of the network that minimizes the overall en-ergy of the system, by reducing the dis-tance between connected nodes and maxi-mizing the distance between unconnected nodes. (For more detail concerning Pajek, see the Appendix.)
We generate two sets of images for the time period covered by our database. To simplify the presentations, we include only those organizations in the main com-ponent each year, thereby removing the isolates from this large and expanding net-work.17 The first set of images presents the
16
full collaboration network, while the sec-ond set represents the new ties added each year. Given space constraints, we select a subset of these pictures for inclusion in the paper, but we urge readers to view the complete set at http://www-personal.umich.edu/ ~jdos/paj_mov.html. The visualizations afford a multi-faceted view of network evolution, including growth in the number of participants, changes in the purpose of ties, and the for-mation of new ties.
The Pajek figures are designed to visu-ally reflect our hypothesized models of at-tachment. The graphics cannot adjudicate between the various models, which we do in statistical analyses below, but they do provide suggestive evidence, or existence proofs, if you will. Consider what the full network and new tie visualizations might look like if strong versions of our four mechanisms were operating. After a sketch of these stylized images, we then turn to the data and examine a series of images. If an accumulative advantage process drives attachment, the spring-embedded images would display a preponderance of star-shaped structures attached to large nodes. These stars would be positioned at the cen-ter of the image and continue to grow rap-idly over time as newcomers (triangles) affiliate with the most connected nodes. We scale the size of nodes to represent the number of ties an organization has. Very few small nodes will have numerous new partners, nor will many large nodes be situ-ated on the network’s periphery. In con-trast, if homophily strongly conditions tie formation, then we would anticipate im-ages differentiated into coherent and loosely inter-connected single-color clus-ters. These homophilous clusters should be fairly dense and dominated by characteris-tic organizational forms without necessitat-ing a preponderance of stars tethered to large central nodes. New entrants (pictured
as triangles) would move into the neighborhoods that most closely matched their type and profile.
Were a follow-the-trend logic domi-nant, new ties would be overwhelmingly uniform in color and the predominant color should reproduce the previous year’s pat-tern of affiliation. If, for instance, R&D (red) ties dominated in a prior year, neo-phytes would generally enter the network through this established route and the im-ages would be fields of red. A preference for diversity of partners and pathways im-plies less visual coherence than the other mechanisms. Multiconnectivity coupled with heterogeneous activities would show clusters in which all four colors would be evident in the springs. The nodes at the center of the network should be different colors, reflecting the array of organiza-tional types. Some small nodes should be noticeable at the center of the field, while some large nodes should have few new partners. New entrants should be sprinkled throughout the network. Empirical reality is, of course, more messy than stylized models. We use these thought experiments to make the detailed visualizations of this large database more interpretable to readers not familiar with graphical representations of network dynamics.
Figure 4, showing the main component in 1988, serves as the starting point. The color of the nodes reflects their organiza-tional form, with light blue a dedicated bio-tech firm, yellow a large pharmaceutical, chemical, or diversified medical corpora-tion, brown a government institute or agency. In subsequent years gray nodes become important, reflecting the growing imprint of venture capital. The springs are colored according to the functional activity reflected by a tie, with red a research and development partnership, magenta a licens-ing agreement, green a financial relation-ship, and dark blue indicating an alliance

17
involving one or more stages in the com-mercialization process, ranging from clini-cal trials to manufacturing to sales and marketing. Node size is scaled to standard-ized network degree in the total network, reflecting variation in the extent of degree-connectivity among the organizations. To return to our earlier metaphor of a dance, the representation captures dancers with different identities, who may participate in different types of dances with one or many partners. The size of a node, given the power-law tendencies in the degree distri-butions, reflects, roughly, a rich-get-richer process. In the images that follow, particu-larly the visualizations of new ties, there are several large blue DBF nodes that are clearly the most attractive stars of the net-work. In later years, there are nodes that have multiple linkages for different activi-ties, reflecting a preference for diversity. Looking at the overall population rather than specific nodes, we observe shifts in the dominant activities as well as changes in the composition of the nodes, which il-lustrate the overall trends in the field.
[FIGURE 4 HERE] Several key features stand out for 1988
in Figure 4. The predominant color is blue, and the most active participants are biotech firms, pharmaceutical companies, and sev-eral government agencies. The strong im-pact of commercialization ties is a clear indication of the dominant strategy of mu-tual need that characterized the industry’s early years. Biotech firms lacked the capa-bility to bring novel medicines to market, while large firms trailed behind in under-standing new developments in molecular biology (Gambardella, 1995; Powell and Brantley, 1996; Henderson, Orsenigo, and Pisano, 1999). Finance ties (green) are less prevalent and only a few venture capital firms (gray) are present, providing further evidence that most DBFs supported them-selves by selling their lead product to large
corporations, who subsequently marketed the medicine and pocketed the lion’s share of the revenues. Clustered in the center are red (R&D) and magenta (licensing) ties, which show that DBFs with significant in-tellectual property and strong research ca-pability are highly sought for collaboration. The large multi-connected nodes in the center of the representation are a small group of established, first-generation DBFs, major multinational firms, and gov-ernment institutes (the NIH and the Na-tional Center Institute). In the pullout to the right of the figure, we identify a handful of the largest nodes: NIH, which will serve as an orienting node in the full network fig-ures because of its centrality, and NCI; a group of first-wave biotechs founded in the 1970s and early 1980s – Genentech, Cen-tocor, Amgen, Genzyme, Biogen, and Chi-ron, which became the largest and most visible firms by 1988; and three multina-tional firms – Kodak, Johnson and John-son, and Hoffman La Roche. The close proximity of the Swiss firm Hoffman La Roche to Genentech is interesting because in 1990, the Swiss firm became the major-ity stockholder of Genentech. Kodak and J&J reflect the broad interest in biotech by a range of large firms in different indus-tries. Kodak soon drops out of the center of the field, as does J&J, but the latter returns in the late 1990s by acquiring two compa-nies, first Centocor and then Alza, both es-tablished, well-connected DBFs. Kodak’s subsequent loss of centrality and J&J’s purchase of two incumbent DBFs illus-trates that a first mover, rich-get-richer ac-count does not always hold, even for some of the early very resource-rich participants.
In Figure 5, we present the new ties added in 1989. To return to the dance metaphor, the music has stopped temporar-ily, while new partners are being chosen. We add shape to the presentation, with tri-angles representing new entrants to the

18
network, while circles are the incumbents. Note the very active role of NIH (the larg-est brown node) in forging R&D ties with new entrants, and the appearance of many grey triangles, illustrating the growing in-volvement of venture capital in financing DBFs. Node size continues to be scaled for network degree in the full network, thus graphically representing how network posi-tion in one year may condition the addition of new ties in a subsequent year. The size of the node indicates the importance of rich-get-richer models of attachment. In the initial years, we see visual affirmation of the positive effect of number of previous ties on new tie formation. Note that several large blue DBF nodes are at the center of the new tie network. By contrast to the 1988 picture of the overall network, the dominance of commercialization springs (blue) in 1988 recedes markedly in the 1989 new ties picture. R&D and finance are the main avenues generating growth in the network. Observe that large nodes with just a few ties have little diversity in their partners, while some of the smaller nodes adding many new ties have a wide variety of partners.
[FIGURE 5 HERE] We fast forward to 1993, but encourage
readers to follow the annual changes18 in the on-line version. Figure 6 portrays a large expansion in activity, with green ties (finance) now much more prominent. We also observe a shift in the composition of the most connected participants. Put collo-quially, the music has changed – from commercialization to finance, and accom-panying the shift in the predominant col-laborative activity is both an increase in the number of highly connected nodes (there are roughly three times as many larger nodes as in 1988) and the march-in of gray (venture capital) and orange (universities) nodes. This shift in the primary locus of activity is important on a number of dimen-
sions. Finance, as opposed to commerciali-zation, has a powerful mobilizing effect, enrolling new types of actors (VCs, and subsequently investment banks, pension funds, university endowments, etc.) in fi-nancing the expansion of the field. As we have shown elsewhere, the locus of venture capital-financed biotech startups was ini-tially the Bay Area and Boston, but by the end of the 1990s had spread to a number of key regions in the U.S. and Europe (Pow-ell, Koput, Bowie, and Smith-Doerr, 2002; Owen-Smith et al, 2002). Thus growth in the number of new firms, new partners, and new ideas is enhanced by an increase in financial linkages, signaling the important role of the public equity markets in foster-ing growth. In contrast, commercialization is a more restrictive activity. The ability to manufacture new biomedical products was a relatively scarce skill, as was the ability to market and distribute a new medicine throughout the world. A relatively small number of large firms had these capabili-ties, and it took at least a decade before DBFs developed these skills. Conse-quently, during the first two decades of the field, commercialization ties flowed through a small set of dominant multina-tionals and a handful of established biotech firms. Thus, not only were the number of participants limited, commercialization is a ‘downstream’ activity; indeed, when it in-volves the sale of a new medical product, it is the ‘last dance’ in the product life cycle. Finance, in contrast, is an ‘upstream’ activ-ity, which, in turn, fuels R&D, licensing, and commercialization, and thus enrolls more participants in the industry network.
The organizational composition of the center of the field has shifted as well. Two research universities, MIT and Harvard, along with a handful of leading VC firms are now at the center. The composition of multinational firms shifts from diversified chemical and medical companies to some

19
of the giants of the pharmaceutical sector, e.g., Schering-Plough and Merck. The di-versity of organizational forms at the center of the network is notable in that these var-ied organizations – DBFs, pharmaceuticals, VCs, research universities, and government institutes – operate in distinct selection en-vironments, subject to very different pres-sures and opportunities. Networks an-chored by diverse organizational forms are more robust to both failure and attack (Al-bert, Jeong, and Barabási, 2000). Such di-versely anchored, multiconnected networks are less likely to unravel than networks re-liant on a single form of organization for their cohesiveness.
[FIGURES 6 AND 7 HERE] The picture of new ties in 1994 (Figure
7) reflects growing complexity in the activ-ity sets of the participants. On the right side of the network, finance is very pronounced, and there are many more gray nodes, which are growing in size. But note there are now yellow nodes (which are not triangles, so these are not new entrant pharmaceutical companies) involved in financing smaller biotech firms. On the left side of the figure, we see blue and green ties linked to well-connected DBFs. At the center of the net-work is the NIH, the anchor of R&D activ-ity and the largest node, linked to both small as well as large DBF nodes. The pic-ture of new ties in 1994 illustrates the growing multi-vocality of the industry, with both well-connected DBFs and phar-maceuticals developing the capability to finance younger firms, contribute to basic and clinical science, and commercialize new medicines. The overall picture has shifted from one in which commercializa-tion and rich-get-richer were the dominant scripts to one in which finance is generat-ing much more diversity in activity and there is more heterogeneity in the makeup of the key participants. With greater num-bers of new ties added in 1994, the more
tree-like structure of springs in 1989 has now changed to reflect multiconnectivity, i.e., a more cohesive structure even among the new partnerships.
The density of the field and the number of participants continue to grow throughout the 1990s. The picture of all ties in the main component in 1997 (Figure 8) and 1999 (Figure 10) illustrates a growing number of large nodes, strong expansion of collaborative activity and a reaching out to new entrants, and more varied types of or-ganizations at the center of the figures. In 1997 (Figure 8), we see a very cohesive hub of DBFs, pharmaceuticals, venture capital firms, universities, and the NIH complex. The colors of the ties are less dis-cernable, reflecting the fact that the most active members of the network are now either engaged in multiple activities or connected to DBFs who are. The pharma-ceutical sector underwent a period of con-solidation in the mid to late 1990s, as mergers and acquisitions became common-place. Novartis, formed out of the merger of the two large Swiss firms Sandoz and Ciba Geigy, and Glaxo Wellcome, the product of the acquisition of Burroughs Wellcome by fellow British giant Glaxo, are in the center of the network. Outside the center there are several ‘specialist’ DBFs, one with a very active commerciali-zation portfolio and another with a licens-ing cluster. In the new ties image for 1998 (Figure 9), finance continues to be genera-tive in pulling in new entrants. For the first time, a handful of pharmaceutical giants, bolstered by a round of mergers and acqui-sitions, are central in the new tie network. While the NIH remains in the core, it is no longer clearly the largest node. Many more DBFs are found in the center and on the edges of the new tie network, reflecting the growing presence of second-generation firms who are active in the field. The con-solidation in the pharmaceutical sector is

20
producing a rich-get-richer effect among the largest multinationals, but these ‘survi-vor’ corporations have learned to do more than just commercialize the lead com-pounds of the smaller DBFs. The big mul-tinationals have become multi-vocal. Meanwhile, a combination of DBFs, uni-versities, and government institutes are ac-tive in pulling in new participants.
[FIGURES 8, 9 AND 10 HERE] The full network images for 1997 (Fig-
ure 8) and 1999 (Figure 10) show a notable clustering of financial ties on the right side, with connections to smaller-size DBF nodes. This shift underscores the cyclical nature of venture capital, which involves taking a firm public, ending that relation-ship and moving on to finance new firms. The number of yellow nodes at the center has decreased, as consolidation shrinks the number of big pharmaceutical firms. In turn, the size of each yellow node in-creases, as their portfolio of alliances grows and diversifies. Several universities, notably the UC system19 (primarily UCSF and UCSD) and MIT, are at the center in the 1999 image, and the NIH and NCI re-main central. Recall that the NIH’s budget for R&D grew markedly throughout the 1990s, and it remains hugely important as a funder of basic research, and as a partici-pant in licensing the results of intramural NIH research done. The new tie network in 1998 (Figure 9) is the most expansive yet, with more than 1,100 new ties added in 1998. Multi-vocality is the dominant pat-tern here, as nearly every large node is en-gaged in multiple types of collaborations.
Pajek visualizations, which we use to show the extent of clusterings by type of organizations, type of tie, and network de-gree, can be considered to provide a visual goodness-of-fit test for our hypotheses. As a supplement to the graphics, we provide count data on patterns of entry and exit into the network. We see in Table 2 that the
number of participants, both DBFs and partners, grows every year. But the rate of expansion for total number of ties and new ties outpaces the entry of organizations, suggesting a more connected field. The visualizations afford the opportunity to see the diverse types of organizations that are driving this connectivity. (There is a fall off in new ties and partner entry in 1999, but this may reflect incomplete reporting in 1999 annual reports. As we add more years of data, we will learn whether this is a downturn or undercount.) The rate of tie dissolution grows, then wanes, then heads up, so there is considerable turnover in in-terorganizational relations, reflecting both successful completion of some projects and dissolution due to lack of progress on oth-ers. The general picture is one of a continu-ing flow of new entrants into the field, alongside the forging of new collabora-tions, making for an increasingly dense network. To test our hypotheses, as well as the insights derived from the visualizations, we turn to a more fully specified analysis in which we take organizational variables, network portfolios, and time periods into account.
[TABLE 2 HERE]
Analysis III: Attachment Bias We now turn to a statistical analysis of
attachments between dedicated biotech firms (DBFs) and various partner organiza-tions. For analytic purposes, we distinguish between four categories of relationships:
1. New 1-mode attachments, in which a DBF contracts with another DBF as a partner, and it is the first tie between this dyad.
2. Repeat 1-mode attachments, in which a DBF contracts with a DBF partner and it is not the first tie between this dyad.
3. New 2-mode attachments, in which a DBF contracts with a non-DBF part-

21
ner and it is the first tie between the dyad.
4. Repeat 2-mode attachments, in which a DBF contracts with non-DBF part-ner and it is not the first tie between the dyad.
New attachments expand the structure of the network, whereas repeat ties thicken relations between existing dyads. One-mode attachments create a cooperative structure among competing biotech firms, while two-mode attachments engage differ-ent organizational forms to access re-sources and skills. Each relationship in-volves a focal DBF, a partner to which the attachment occurs, and a set of alternative partners with whom the DBF might have collaborated, but did not. We refer to the set of partners to which the focal DBF might link for a particular observed at-tachment, including the partner to which the connection occurred, as the risk set for that attachment. For new 1-mode attach-ments, the risk set is other DBFs, excluding those to which the focal DBF is currently or has previously attached. For repeat 1-mode attachments, the risk set is, con-versely, those current or prior partners of the attaching DBF. For new 2-mode at-tachments, the risk set is partners other than DBFs, excluding those to which the attaching DBF is currently or has previ-ously been linked. For repeat 2-mode at-tachments, the risk set is, again conversely, all current or prior partners (other than DBFs) of the focal DBF.
MEASURES
We draw upon multiple measures to test each hypothesized mechanism across four classes of ties. We present and define the variables used in our statistical analy-ses, along with appropriate controls, in Ta-ble 3. Our dependent variables are binary indicators of whether an alliance of each of the four types occurs between a DBF and a
partner, given that the DBF and partner are “at risk” of attaching. A DBF may forge connections to more than one partner in any given window of time, as long as alli-ances can be ordered such that a partner for which a linkage occurs at a specific mo-ment is removed from (added to) the risk set for subsequent new (repeat) attach-ments. The predictor variables operational-ize the attachment mechanisms for each of the four hypotheses: accumulative advan-tage, homophily, follow-the-trend, and multiconnectivity. For each observed at-tachment, partner and dyad measures are computed for all partners in the risk set.
Accumulative Advantage is reflected in the network Degree and Experience of both the attaching DBF and partner, which captures both the number of ties and years of experience with collaborations. For re-peat ties, we also include Prior ties and Prior experience of the DBF-partner dyad. We also use New Partner, an indicator of whether a partner has been in the network for less than a year, to capture the effect of being ‘a new kid on the block.’
Homophily is assessed in several ways. We measure the Collaborative distance between the alliance profiles of the DBF and the partner in the attaching dyad. For 1-mode attachments, we measure the Age difference, Size difference, and Governance Similarity between the two DBFs forming the dyad, as well as measuring Co-location. For 2-mode attachments, we lack data to measure partner’s age or size difference, and governance similarity does not apply to non-commercial organizations. We did measure homophily, however, between the attaching DBF and other DBFs in the part-ner’s neighborhood, defined as the set of DBFs to which that partner has direct ties, with the variables Collaborative distance, Age difference, Size difference, Governance similarity, and Co-location, all considered with respect to a partner’s other affiliations.
22
These ‘second order’ measures account for the possibility that connections to partner organizations are conditioned by the prior experience of those partners with other DBFs.
Follow-the-trend is captured by the field-level variable Dominant Trend and the partner variable Dominant Type. Both measures reflect whether firms are engag-ing in activities that are comparable to those of others in the field. Multiconnec-tivity has two facets: cohesion and diver-sity. The former captures the extent to which firms are connected by multiple in-dependent pathways, while the latter re-flects whether firms are engaged in multi-ple types of activities. Cohesion is calcu-lated using the maximum level of k-component for each firm and partner, measured separately as Firm Cohesion and Partner Cohesion, and jointly as Shared Cohesion, which is the maximum level for which both parties share a common k-component, if any.20 For diversity, we use Blau’s (1977) heterogeneity measure, as an index of both the range of activities and multiple types of partners. We measure di-versity in four ways: for a DBF (Firm Tie Diversity), prospectively for a DBF (Pro-spective Tie Diversity, i.e., the diversity of a firm’s collaborative profile if the attach-ment were to occur), for a partner (Partner Tie Diversity) and for the average of a part-ner’s set of partners (Partner’s Partner Tie Diversity). One might think of the last measure as an assessment of the heteroge-neity of the friends of a friend.
The control variables include firm demographics measured at the time of at-tachment, including Age (in years), Size (number of employees), Governance (whether publicly held), and Location, measured by three digit zip code region, or in the case of companies outside the U.S., by the telephone prefix for nation and city. The key partner control is the variable
Form, reflecting the form of organization, and the key dyad control is Type, reflecting the type of activity that is the focus of the collaboration. We also include three time Period variables, which emerged from the discrete-time images as key inflection points in the pattern of affiliation, along with a linear time trend variable, Timeline.
[TABLE 3 HERE]
STATISTICAL METHOD Our challenge is to model a set of bi-
nary indicator variables, each of which a firm can have multiple incidences of, and for each incidence we must update the risk set of alternative partners and the network measures. Consequently, our unit of analy-sis must be the attachment, rather than ei-ther the individual firm or the dyad. Our choice of a statistical model for analyzing attachment bias is based on our unit of analysis, as well as empirical and theoreti-cal considerations. Empirically, the design of our sample defined the population of DBFs and then identified all the partners engaged in alliances with them. Theoreti-cally, our research question asks what mechanisms account for differential (as opposed to simple random) patterns of at-tachment. For these reasons, we use McFadden’s estimator for multi-probability assessments, which is a variant of a condi-tional logit model that takes each event as a unit of analysis, which in our case are at-tachments, and distinguishes between a fo-cal population and a set of alternatives (McFadden, 1973; 1981; also see Maddala, 1986; Ben-Akiva and Lerman, 1989).21 We set up the data so that the focal DBFs are the population and the partners in the risk set for an attachment are the alternatives, thus reflecting the one and two mode net-works in our sample.
We conducted the analyses in three stages. First, we perform overall tests of the four hypotheses, on each type of attach-

23
ment, by applying McFadden’s estimator as follows. For each attachment, the prob-ability of DBF i attaching to partner j , given that DBF i attaches at time t to some partner in the set Ji,t, is specified as a func-tion of partner (X) and dyadic (W) vari-ables:
,
,
, ,, , , ,
, ,
exp( )Pr( 1| 1, , )
exp( )i t
i t
j t ij tij t ij t j t ij t
J j t ij tJ
X Wy y X W
X Wβ γβ γ
+= = =
+∑ ∑
Some of the partner characteristics,
such as collaborative diversity, are not de-fined for partners without ties prior to the attachment. We include these characteris-tics by interacting them with an indicator variable for whether the partner has any prior ties, and include the main effect of this indicator variable in the models. The main effect is always negative, showing that partners with no ties in the prior year are more likely to receive attachments.
Second, we explore the extent to which the mechanisms of differential attachment are contingent on various combinations of: i.) characteristics of the focal, attaching DBF; ii.) the form of a partner; iii.) the type of activity involved in each case; and iv.) combinations involving a partner’s part-ners. We do so by interacting variables rep-resenting each of these categories with measures of the attachment bias mecha-nisms. For instance, to explore how the fo-cal DBF’s attributes (Z) may alter the ‘rules’ of attachment, where those rules are specified in terms of partner and dyadic variables (X,W), we estimate the following specification:
Third, we examine how the sources of
attachment bias shift over time by interact-
ing our measures of the attachment mecha-nisms with: i.) period effects, as indicated in Table 3; and ii.) a linear time trend. These measures give us purchase on how the logics of attachment may change as the overall structure of the network evolves.
We estimate conditional models of at-tachment, continually updating both the risk set of alternative partners and the net-work measures to lessen problems of ob-servation dependence common in dyad-level analyses. Although we define DBFs as our focal population and partners as al-ternatives, both DBFs and partners are vy-ing to connect with one another, and at any point in time a DBF or partner may have a finite capacity for connections.22
We estimate all models using Stata 8/SE. For the 2-mode analyses, two fea-tures are notable. First, for 2-mode new attachments, there are 5,087 events over our time period, with up to 1,600 alterna-tive partners in any given year. Given the number of variables we tested, the size of the data set needed to analyze the full population of new two-mode attachments became cumbersome. Thus, we obtained a random sample of 1,500 2-mode new at-tachments to form the data on which esti-mates were obtained, and for each attach-ment we took a 25% random sample of al-ternative partners. We then repeated the random sampling process and re-estimated the 2-mode new attachment models 10 times as a test of robustness. The results were nearly identical for every sample and with no sample did the pattern of signifi-cance change, thus we present the initial results.
In the 2-mode analyses the comparison of organizations from different sectors (e.g., for-profit corporations, nonprofits, universities, government agencies, and ven-ture capitalists) requires some comment. A nonprofit hospital and a venture capital firm are not substitutes for one another be-

24
cause they provide different resources. Yet, we have included them as alternatives in the risk set for the same attachments. From a practical standpoint, in this example the inclusion assumes that a focal DBF may have discretion as to whether its next alli-ance will be to obtain further funding or to seek clinical evidence of efficacy. We tested the robustness of this assumption on our findings in two ways. First, we strati-fied the 2-mode risk sets by form, so that only organizations of the same form as the partner to which the attachment occurred were included in the risk set. Second, we included interactions of our other variables with a set of indicator variables for organ-izational form. Interestingly, while there was some variation in magnitude of coeffi-cients, the pattern of direction and signifi-cance of predictor variables was constant across partner forms save for two excep-tions: finance ties to venture capitalists and ties of any type to biomedical supply firms. These exceptions are not surprising, as ven-ture capitalists are the most specialized and least multi-vocal partners. (Recall Figure 2, which illustrates that more than 95% of VC collaborations are financial.) Other bio-medical firms provide equipment and re-search tools, thus they represent bilateral exchange relations, and do not participate in the development of new medical prod-ucts in the same, mutual manner as do other participants. Based on these prelimi-nary analyses, we collapsed the 2-mode data across all organizational forms and included interactions for finance ties to venture capitalists and ties of any type to biomedical supply firms when exploring contingencies in the mechanisms for at-tachment bias.
RESULTS
We organize the presentation of results around our four hypothesized rules of at-tachment: accumulative advantage, homo-
phily, follow-the-trend, and multiconnec-tivity. Since we utilize a number of vari-ables to measure each mechanism, to as-sure the relative strength of a logic of at-tachment requires an examination of an ag-gregate pattern of support or falsification. For our purposes, social mechanisms are more strongly supported when the bulk of the effects are in the hypothesized direc-tions and those effects are consistent across all four classes of ties. The full table of re-sults is both elaborate and complicated; it is presented in Appendix II. For the sake of exposition, we have excerpted the results that are the primary tests of each hypothe-sis into a series of four more manageable tables, Tables 4-7. To facilitate interpreta-tion, we present the odds ratios, rather than the coefficients. The odds ratios are ob-tained from the coefficients by exponentia-tion. That is,
iOdds ratio for X exp( )iβ= The odds ratio gives the amount by
which the odds of an attachment being bi-ased towards a partner are multiplied for each unit increase in the level of the inde-pendent variable, X, for that partner.
Accumulative Advantage. The odds ra-
tios for our tests of accumulative advan-tage, hypothesis 1, are presented in Table 4. Note that we employ a both a broad and a narrow reading of accumulative advantage, the latter focusing only on the structural feature of popularity bias. Odds ratios greater than one for the variables partner degree, partner experience, prior ties and prior experience offer support for the ac-cumulative advantage mechanism. For the variable new partner, hypothesis 1 would predict an odds ratio lower than 1. Overall, the evidence does not favor this hypothesis. Only the negative impact of experience is consistent across all four categories of ties. Whether the relevant experience resides with the partner or dyad, this finding indi-

25
cates a preference for novelty. This result runs sharply counter to an accumulative advantage argument. The pattern of results for the other measures of accumulative ad-vantage varies by type of attachment.
[TABLE 4 HERE] For partner degree, we find support for
accumulative advantage only for 1-mode new ties. These linkages have a distinctive pattern, as they are biased to partners with more ties and less time in the network. This result implies that DBFs seek to balance novelty and visibility when they form an alliance with another DBF. For each addi-tional tie, the probability that a new at-tachment will involve a partner with higher degree increases, on average, by 4%. The contingencies reported in Table A2 indicate that the increase is higher if the attaching DBF is younger, and declines as the focal DBF matures. For each year of a partner’s network experience, the differential likeli-hood of attachment decreases by 5%. These findings suggest that as DBFs age, the sali-ence of partner degree decreases, and the importance of partner experience recedes as partners spend more time in the field. Both results emphasize that prospecting for new partners is common, particularly among older DBFs who opt for new part-ners at the expense of more visible ones. In sum, preferential attachment by degree op-erates only for new 1-mode ties among DBFs. For all four classes of ties, partners that are more recent entrants are preferred.
Turn your attention to rows three and four of Table 4. Prior ties and prior experi-ence offer dyad-level ways to operational-ize accumulative advantage that are rele-vant for repeat ties only. As with partner experience, the effects for prior experience refute the accumulative advantage hypothe-sis. A one-year increase in shared partner-ship experience lowers the probability of a repeat tie by 26% and 14% for 1- and 2-mode attachments, respectively. Prior ties
at the dyad level do fit the hypothesis, however. An increase of one common tie ups the likelihood of a repeat connection by 39% and 26% for 1- and 2-mode attach-ments.
Finally, consider the new partner vari-able. Here an accumulative hypothesis pre-dicts a negative effect. The results for re-peat 1-mode ties and new 2-mode ties weigh against the hypothesis. A partner’s arrival in the network for the first year pro-duces a strong bias for both subsequent re-peat 1-mode and new 2-mode attachments, increasing the differential attachment prob-ability 11-fold and by 66%, respectively. Repeat one-mode affiliations reflect spon-sored mobility, where a new DBF is as-sisted by another firm. New two-mode alli-ances are less likely to be pursued with an already popular partner than with a new arrival, suggesting these collaborations fol-low an exploratory logic. Table A2 shows a contingency for this preference for new 2-mode partners to become particularly strong in the mid to late 1990s. The fact that this trend becomes more pronounced over time suggests that rather than being a consequence of a young field, the impor-tance of novelty in partner selection is an enduring feature of an industry character-ized by rapid technical advance.
In our dance hall language, when a DBF finds a young (i.e., often newly-entered) DBF dance partner that has cre-ated a stir on the dance floor, the two part-ners sustain the relationship. New 2-mode partners are also preferred if they are new to the dance floor, but the alliance is less likely to be renewed. These results suggest that well-positioned, veteran DBFs spot up-and-coming newcomers, and escort them into the network. In some cases, these new firms are spinoffs from more established DBFs, which may account for the very strong support for repeat ties with new-comers. In sum, we find scant support for

26
the hypothesis that repeat attachments are influenced by the accumulative advantage of the partner.
Homophily. Table 5 presents the odds ratios for our tests of homophily, hypothe-sis 2. We find evidence for homophily if the odds ratios exceed 1 for co-location and governance similarity (rows 1-3), and if the odds ratios are lower than 1 for the meas-ures of distance and difference (rows 4-9). The results for homophily vary both within and across classes of attachment. For the similarity measures, co-location and pub-lic/private governance, four of the odds ra-tios are significantly supportive, while four run contrary to the hypothesis. For the dis-tance and difference measures, however, only three of the odds ratios offer strong support for the hypothesis, with seventeen contrary. Overall, homophily holds more strongly for new attachments. Homophily is less prevalent for 1-mode repeat ties, and absent in repeat 2-mode attachments.
[TABLE 5 HERE] In the 1-mode case, similarity looms
large with regard to geographic co-location, but not for organizations of similar govern-ance, age and size. Firms located close to one another are twice as likely to collabo-rate, but similarity in organizational age and size decrease the odds of collaboration. Thus, DBFs are more likely to attach to nearby DBFs that differ in age and size. This finding echoes the previous accumula-tive advantage result, with larger, veteran DBFs collaborating with smaller newcom-ers. The contingencies in Table A2 show that the preference for age and size diver-sity moderates somewhat in later years. There is weak evidence for an attachment preference based on similar collaborative profiles and geographic propinquity in the partner’s neighborhood for new 1-mode ties. For repeat 1-mode attachments, diver-sity rather than similarity is the rule with respect to collaborative distance.
Homophily receives some support in new 2-mode attachments, where there is a tendency to involve partners whose neighborhood includes other DBFs with collaborative profiles similar to the focal DBF. A unit decrease in the average Euclidean distance between the collabora-tive profiles of the attaching DBF and other DBFs in the partner’s neighborhood in-creases the likelihood of attachment by 8%. But the pull of diversity is also present, particularly with respect to a partner’s own collaborative profile. Thus, the logic of homophily is attenuated by a preference for diversity in new two-mode partners.
In the tests of homophily as an attach-ment rule for repeat 2-mode attachments, there is a distinct pattern of dissimilarity in terms of demography, location, and col-laborative profile between the attaching DBF and the other DBFs attached to a pro-spective partner. For example, an average difference in age of one year increases the probability of collaboration by 16%. Re-peat two-mode attachments are 87% less likely to occur when the focal DBF is co-located with a partner’s other DBF allies. As was the case with accumulative advan-tage, two-mode tests of homophily also provide strong support for an attachment process driven by novelty and diversity.
Follow-the-trend. The odds ratios pre-
sented in Table 6 test for an attachment bias based on a logic of appropriateness. Hypothesis 3 is supported if the odds ratios exceed 1 for both the dominant trend and the dominant type of the partner. Both variables are measured in percentage point units. To facilitate interpretation, we use a change of 10% to assess the effects of dominant type and trend For dominant type, the odds ratios paint a consistent pic-ture supporting hypothesis 3 for all classes of alliances. For dominant trend, new and repeat attachments offer divergent results,

27
with repeat ties following a logic counter to the overall trend.
[TABLE 6 HERE] New 1-mode ties manifest a strong ten-
dency for DBFs to follow both the domi-nant trend and dominant type of activity. A ten percentage point rise in the dominant type measure increases the differential at-tachment probability by 30%. The same rise in the dominant trend measure in-creases the differential attachment prob-ability 9-fold to 270%. The choice to fol-low the trend is also apparent in new 2-mode ties, both in terms of the dominant trend in the field and the partner’s domi-nant type. The conditional attachment probability is boosted by 30% and 85% for each 10% increase in the type and trend measures. In both classes of repeat ties, fol-lowing the trend is apparent for the domi-nant type of partner, but there is now a strong preference to buck the field’s overall trend. With each 10% increase in the trend measure, repeat 1-mode attachments are nearly 90% less likely to occur in the same category, and repeat 2-mode attachments are 70% less likely.
The follow-the-trend results suggest that “first dances” are conservative, match-ing the pattern on the floor, which signals that norms of propriety condition the logic of attachment. The reverse holds, however, for repeat ties where deeper linkages be-tween already connected dyads offer the occasion to flout the dominant logic. This reinforces findings from tests of homophily where diversity drove repeat ties. The fol-low-the trend results are the first to show a uniform pattern across 1- and 2-mode ties.
Multiconnectivity. Table 7 reports tests
for the multiconnectivity hypothesis. Hy-pothesis 4 predicts positive (greater than 1) effects for all variables. There is consistent support for the cohesion and partner tie di-versity measures across all four classes of
ties. Six out of the eight possible effects of partner and shared cohesion are significant in the predicted direction. Cohesion can be regarded as a strategic window where part-ners evaluate a radar screen of possible fu-ture partners, as opposed to sampling from the entire disparate field. The strength of shared cohesion in shaping two-mode at-tachments illustrates the value of linkages to multiple affiliations as a means to vali-date information. Cohesion entails more than access to information, however. Re-sources, skills, access to personnel, and a host of related benefits are also obtained through partners. The results indicate that as DBFs scan for potential collaborators, a partner’s diversity of ties is a valuable marker of resources and information.
[TABLE 7 HERE] Cohesion influences new 1-mode at-
tachments in terms of both partner and shared cohesion. For each additional level of partner connectivity, the differential probability of a new link jumps by 43%. Similarly, each new independent pathway connecting a dyad (the increment in shared cohesion) increases the differential attach-ment odds by 6%. In addition, new 1-mode affiliations evince a preference for partners that have more varied ties. A 10% increase in partner’s tie diversity raises the differen-tial probability of attachment by 30%.
For repeat 1-mode attachments, partner cohesion continues to provide a positive influence, increasing the condi-tional attachment odds 2.6 times for each additional level of connectivity. Shared co-hesion and partner tie diversity, from which the DBF already benefits, lose their appeal in repeat tie formation. Instead, the coeffi-cients on prospective tie diversity and part-ner’s partner tie diversity turn negative. Relatively typical increases of 1% and 10%, respectively, in these tie diversity measures lower the differential probability of affiliation by 25% and 45% (see Appen-

28
dix 2, Table A1, for means and standard deviations for these measures.) Thus, re-peat 1-mode attachments serve to reinforce rather than expand prior collaborative ac-tivities. These results suggest a different evaluative metric for repeat ties, in which the parties forego increased diversity in fa-vor of more cohesive (and possibly long-term, and deeper) relations. We lack de-tailed data on the content of specific rela-tions, but one might consider that these participants have come to trust one another more and now are bound together in a common fate with respect to a new medical product, or that the information being ex-changed is tacit or sticky, and thus more easily shared in a strong-tie relationship.
Cohesion and partner’s tie diversity positively influence attachment for new 2-mode linkages. The effects of cohesion are quite strong: each increase in the level of cohesion of the partner bumps up the prob-ability that a collaboration will form with this partner by 66%, while each additional path of connectivity for the dyad increases the differential probability of attachment more than 5-fold. There is a bias, however, against partners whose allies have more diverse profiles of collaboration. This pat-tern seems to indicate that DBFs favor at-tachments to partners that are better posi-tioned with more diverse collaborations, while, ignoring contingencies, partners pre-fer attaching to DBFs with more special-ized collaborative profiles. Hence, com-parative judgments about partner diversity reverberate through the network. The nega-tive coefficient of prospective tie diversity might signal a preference for reinforcing the DBF’s prior collaborative profile, rather than filling out the DBF’s “dance card” with different forms of partners for diverse types of activities. A percentage point in-crease in the index of prospective diversity decreases the odds of attachment by 12%.
The results for multiconnectivity in re-peat 2-mode ties demonstrate that shared cohesion of the dyad and the partner’s tie diversity are both sources of positive at-tachment bias. But for these ties, partner cohesion is not a positive bias. The impact of an increase of one pathway of connec-tivity between a DBF and a partner en-hances the differential probability of at-tachment by 90%. A 10% increase in a partner’s tie diversity boosts the probability of a repeat 2-mode tie to the partner by 20%. The prospective tie diversity of a po-tential alliance and the partner tie diversity are both sources of negative bias, by 4-5% for each percentage point increase in the respective index.
The odds ratios for prospective diver-sity, in contrast, run counter to hypothesis 4 for three of the four classes of attachments (all but new 1-mode ties). These results may indicate that diversity does not repre-sent a goal in and of itself. When interac-tion effects are added (see columns 2 and 3 of Tables A2 and A3, for 1- and 2- mode results respectively), the main effects of prospective tie diversity flips the sign for three of the four classes of attachments (all but repeat 1-mode ties).23 Hence, the search for diversity is most operative among firms at low levels of structural cohesion. At higher levels of cohesion, the bias towards diversity recedes in favor of a preference for partnerships with new entrants. Thus, including interactions between diversity and cohesion measures indicates a modifi-cation of hypothesis 4. Those DBFs with higher cohesion, having obtained diversity through indirect k-connectivity, find a di-minished need to increase diversity in new or repeat partners. Cohesion and prospec-tive tie diversity represent all countervail-ing forces at higher levels. If cohesion was the most powerful force, the radar screen of possible partners would become restricted

29
and ossify. The exploration of diversity precludes lock-in.
The process of searching for partners is both dynamic and recursive. Preferential attachment operates through the attractive-ness of shared and partner cohesion, with firms apparently moving up a ladder in terms of the cohesiveness of their net-works. At the lower rungs of the cohesion ladder, there is a preference for expanding diversity by linking to well-connected part-ners. At the higher rungs of the cohesion ladder, firms may forego cohesion, opting to ally with recent entrants to the field. This relationship is suggestive of a systemic pumping action, with the most connected members pushing out in a diastolic search to pull in newcomers, and those less con-nected being pulled inward, in a systolic action, to attach to those with more cohe-sive linkages. The pumping process oper-ates upwardly from the bottom, level by level.
We illustrate this dynamic process with two figures. We return to Pajek visualiza-tions, but now we use them to illustrate the econometric results with respect to the ef-fects of cohesion and diversity. Figure 10 contains all members of the main compo-nent in 1997, with node size scaled to net-work degree and color reflecting levels of connectivity. The red nodes are members of the five component, the cluster with at least five ties to five other members of this group, which is a remarkably cohesive community. The red nodes, not surpris-ingly, tend to be bunched at the center of the figure. Green nodes are members of the 3 and 4 components, with blue nodes in the 1 and 2 components. Note the tiny blue nodes at the center of the figure. These are new entrants to the network, with few con-nections (reflected in their small size which represents low degree), but these nodes have “high quality” links to other well-connected organizations. This pulling in of
newcomers reflects the process of spon-sored mobility we referred to above. Figure 11 portrays new ties in 1998 among mem-bers of the main component. There were 1,121 new ties in 1998, of which 1,074 were forged by members of the main com-ponent. Again, node size is scaled to degree in 1997 and color reflects levels of connec-tivity. There are but 112 organizations in the most cohesive component (red), but these organizations are responsible for 59% of all ties initiated in 1998. Note also that the red nodes are no longer exclusively clustered in the center, but are dispersed. Both the physical placement of the red and green nodes and their links to a large num-ber of small blue triangles (representing new entrants to the network in 1998) reflect the generative role of the most connected organizations. The exploratory role of the “elite” red nodes may well account for the strong confirmation of the follow-the-trend hypothesis. Taken together, the two figures portray the processes of pulling less con-nected organizations into the network, and the very active search undertaken by mem-bers of the most cohesive component.
[FIGURES 10 AND 11 HERE] The odds ratios for partner’s partner tie
diversity also appear to run counter to hy-pothesis 4 for three of the four types of at-tachments. A plausible account of these results is that if a potential partner organi-zation has collaborations with organiza-tions that have even more diversity than the ostensible target partner, that relationship may be foregone in favor of a direct tie with the more ‘attractive,’ distant organiza-tion (i.e., a partner’s partner, or a friend of a friend). Such an interpretation is contrary to hypothesis 4, but does suggest a persis-tence of the preference for diversity. Note too that such calculations about diversity depend on cohesion to facilitate recognition of the types of affiliations that are held by various participants. Overall, the results of

30
table 7 suggest that structural cohesion matters for the formation of multiple classes of ties. This relationship has two components. First, DBFs attach to organi-zations that are also members of their own component, thereby deepening multicon-nectivity in those clusters. Second, bio-technology firms at the top of the cohesion hierarchy also reach out to partners located in more distant components.
There are a number of contingencies that add to the overall pattern of multicon-nectivity. First, the older the focal DBF, the less the 1-mode preference for shared cohe-sion surrounding the dyad. Second, among DBFs in low-cohesion networks, attach-ment is tipped towards partners that in-crease prospective diversity. The higher the firm cohesion, the greater the attachment bias from the partner’s cohesion, but the less the bias from prospective diversity. This latter finding suggests that the pattern of new attachments among those DBFs in high cohesion networks is one of seeking out partners with a diverse portfolio of linkages rather than allying with other bio-techs sequentially to complete the stages of the drug development process. Put differ-ently, high cohesion firms are not trying to balance their dance card of affiliations by having a set of partners for each functional activity. In contrast, low cohesion DBFs are trying to fill out their dance cards and this tendency looms largest in later years. Third, the effect of partner cohesion wanes over time, while that of partner diversity waxes, indicating that the influence of mul-ticonnectivity is shifting from cohesion to diversity. This shift suggests a change in the topology of the network, from a power-law distribution towards a more exponen-tial distribution, with the latter suggesting more distant and random search for new partners.
The results for the multiconnectivity hypotheses are generally positive, with
nine out of twelve relationships supported significantly for partner cohesion, shared cohesion, and partner tie diversity. The re-sults turn negative for prospective tie di-versity and partner’s partner tie diversity. Upon examining the contingencies, how-ever, we were lead to consider that these results indicate a more dynamic, reciprocal view of cohesion and diversity, in which low levels of cohesion trigger a preference for more connected partners, and high lev-els of cohesion permit exploration in the form of search for new alliance prospects.
Conclusions
The tripartite set of analyses we have presented highlight a network structure in which multiconnectivity expands as the cast of participants increases, and, in turn, diversity becomes more important with time. At this point in the evolution of the field, a combinatorial or multi-vocal logic has taken root. Neither money nor market power, or the sheer force of novel ideas dominates the field. Rather, those organiza-tions with diverse portfolios of well-connected collaborators are found in the most cohesive, central positions and have the largest hand in shaping the evolution of the field. This is a field in which the shadow of the future is long, as much re-mains to be learned about the functional aspects of molecular biology and genom-ics. The density of the network and the open scientific trajectory combine to en-hance the importance of the reputation. The pattern of cross-cutting collaborations often results in a partner on one project being a rival on another. The frequent rewiring of attachments means that participants have to learn how to exit from relationships grace-fully so as not to damage future prospects for affiliation. In a system where external sources of knowledge and resources are widely differentiated, a preference for di-

31
versity and affiliation with multi-connected partners has mobilizing consequences.
The three sets of analyses complement one another and provide insight into the dynamics of affiliation in this field. In the simplest terms, over the period 1988-99, the primary activities for which organiza-tions engaged in collaboration shifted from commercialization to finance and R&D. These two activities reinforce one another, as financial support fuels expensive re-search efforts and research progress attracts venture capital. In turn, as a smaller set of more diverse participants became skilled at pursuing multiple tasks, a more complex strategy emerged in which some of the most connected participants engaged in all four types of activity with a diverse set of partners. The force-directed graph draw-ings show a change in both the composition of participants and their activities over time. To return to the analogy of the dance hall, both the music and the dancers shift over time. The early dances are dominated by large multinationals and first-generation biotech firms, collaborating to the tune of commercialization of the lead products of the younger firms, with the bigger pharma-ceutical firms garnering the lion’s share of the revenues. Research progress, strongly supported by the stable presence of the Na-tional Institutes of Health, attracts new par-ticipants to the dance and also enables in-cumbent biotech firms to deepen their product development pipelines and become less tethered to the giant pharmaceutical companies. Research progress attracts ven-ture capital funding, excited by research possibilities. Thus, the music changes from commercialization to R&D partnerships and venture financing. Many of the larger multinationals are pushed to the periphery, and some drop out of the network alto-gether.
Recall that this dynamic field is grow-ing swiftly over this period, adding new
entrants as progress is made along a broad scientific frontier in which no single or-ganization can develop a full range of sci-entific, managerial, and organizational skills. A diverse set of organizations be-come cohesive, central players at the dance – a handful of research universities, key government agencies, a few elite research hospitals, a larger number of biotech firms and a core of multinational giants. The multinationals go through an era of con-solidation, with mergers and acquisitions commonplace, and their numbers are re-duced considerably. Those that survive this period emerge as multi-vocal agents, no longer dancing only to the commercializa-tion beat, but capable of executing R&D partnerships and startup financing. Venture capital remains at the dance, a critical spe-cialist, but a somewhat fickle one that is easily attracted to other scenes, such as in-formation and communications technolo-gies. A small number of first-generation biotech firms grow into reasonably large organizations in their own right, and they do so by having learned how to engage in all forms of collaboration with a heteroge-neous set of partners. Here we see strong affirmation of the finding from previous research that the organizations did not be-come ‘players’ by virtue of being larger, but grew larger precisely because they be-came central players in the field (Powell et al, 1996).
When we consider the rules that guide attachment in this field, we observe that no single rule dominates over all time periods. Aside from the venture capital firms and biomedical supply companies, all of the participants are engaging in multiple activi-ties and these different pursuits are shaped by divergent rules of attachment. The multi-probability models tease out the mechanisms that undergird preferential at-tachment. These results lend the weakest support to the accumulative advantage or

32
rich-get-richer hypothesis. The visualiza-tions also highlight the importance of new connections, and that growth in the net-work is often spurred either by new en-trants or incumbents embarking on new activities. But the Pajek-generated figures suggest something the logit models cannot reveal – a very small core of perhaps one or two dozen organizations are routinely placed in the center, and their node size grows somewhat over the period. These organizations are the ones with the most diverse array of collaborations, suggesting that for this handful of central players, ac-cumulative advantage is fueled by multi-connectivity. Thus, we see a combination of rich-get-richer and multiconnectivity at work for these core participants, and they may well set the pace for the dominant trend in the field. The new tie visualiza-tions do not reveal large nodes at the cen-ter, growing even larger as the field ma-tures. This suggests an open elite, accessi-ble to novelty as the field expands.
The visualizations are somewhat lim-ited in their ability to capture the mecha-nisms of homophily, and here the multi-probability models are much more effective at showing a preference for collaborating with organizations that are geographically proximate. If the unit of analysis is the dyad alone, there is little homophily operat-ing. But when we consider second-order networks and ask about similarity of a class of possible partners compared to the chooser’s existing allies, there are tenden-cies toward replication.
Both the visualizations and the multi-probability models illustrate that as a strat-egy for attachment spreads, it is quickly adopted. Whether this is through learning or imitation, or an indissoluble mixture of the two, we cannot say. But it is neither costless nor easy to follow the trend. Lots of ties are broken, and there is considerable exit from the field as well as the main
component. So even if imitation is com-mon, replication is not easily accom-plished.
The most fundamental attachment bi-ases are to multiconnectivity and diversity, to aligning with varied partners who are more broadly linked or to new entrants who are sponsored by nodes that are well placed. This rule is robust in that it created a field with multiple, non-redundant path-ways that pulled in promising newcomers, while pushing out incumbents that failed to keep pace. This logic of attachment domi-nated in a period of overall expansion, however. One cannot assume these proc-esses hold in all environments.
Speculation about whether this network will consolidate, and perhaps become an obstacle to rather than a catalyst of innova-tion, generates much discussion among in-dustry analysts and members of the scien-tific community. Clearly as long as the technological trajectory continues to gener-ate new discoveries and opportunities, ex-pansion is possible. Unlike some techno-logically advanced fields such as comput-ing or telecommunications, there are few advantages for users in terms of common standards or brand recognition. As yet, no general purpose technology has emerged that would speed consolidation. A pro-longed inability to raise money, due to de-clining research budgets or inhospitable public equity markets, would threaten un-dercapitalized firms and might spur con-solidation. The diversity of institutional forms – public, private, and nonprofit – that are active in the field are located in differ-ent selection environments. This diversity offers some protection against unfavorable economic conditions. Preference for cohe-sion and diversity may well be effective search mechanisms for multiple, alternative solutions to problems in a field where the progress of human know how has been highly uneven. Network cohesion and di-

33
versity obviously have their limits, though these are not topics that have been well re-searched. We have shown in related work that there are declining returns to network experience (Powell et al, 1999). Moreover, repeated shocks to any system – whether in the form of a prolonged downturn in the business cycle, rapid inflation in costs such as in health care, or highly publicized product failures or corporate scandals – can destabilize it and result in a tip in the rules of affiliation and the resulting combinato-rial possibilities. We are adding data now on the period 2000-2003, so we will soon see how stable both the rules of attachment are and the structure of the network is in the face of a period of economic uncer-tainty and decline.
Clearly, some aspects of the life sci-ences are rather idiosyncratic. There are a wide range of diverse forms of organiza-tions that exert influence on the develop-ment of the field. In many other techno-logically advanced industries, universities were critical in early stage discovery ef-forts, but as the technology matured, the importance of basic science receded. In biotech, universities continue to be conse-quential, and career mobility back and forth between university and industry is now commonplace (Owen-Smith and Powell, 2001b; 2004). While the institutional de-mography of the life sciences may be un-usual, the rapid pace of development and the wide dispersion of centers of knowl-edge are more typical of other high-tech fields. The key story, in our view, is less the issue of the nature and distribution of resources and more how these institutional features promoted dense webs of connec-tion that, once in place, influenced both subsequent decisions and the trajectory of the field. With detailed longitudinal data, we show how the topology of a network emerged, and generated novelty in an insti-tutional system that has many conservative
elements. The logics of attachment strongly shaped how both new information and en-trants were integrated into the field. The co-evolution of science and commerce was marked by potent micro-macro linkages that altered the global properties of the field. We have demonstrated how a prefer-ential bias for collaborating with actors that are either more diversely or differently linked reshaped the landscape of biotech-nology.
Appendix I: Network Visualization in
Pajek, by Jason Owen-Smith Pajek, a freeware program for the
analysis of large social networks, offers new opportunities for generating meaning-ful and replicable visualizations of complex network data.24 This appendix offers an overview of the benefits and limitations of the software, while providing a more de-tailed discussion of the steps used to de-velop the images we presented.
Pajek's strengths and limitations both arise from its emphasis on visualizing and manipulating very large networks.25 The most obvious benefit is the significant sim-plification of the analysis of large-scale network structures. As the algorithms are optimized for speed, computationally sim-ple but powerful structural and ego net-work measures are also implemented.26 More important for our purposes than such descriptive measures are Pajek's capacities to generate replicable images of complex networks. When turned to the analysis of discrete time 'pictures' of the evolution of a network, Pajek offers the best approxima-tion of dynamic visualization currently available.
Visualization. Pajek includes a set of network drawing algorithms based on both graph theoretic conceptions of distance in a network and the physical theory of random
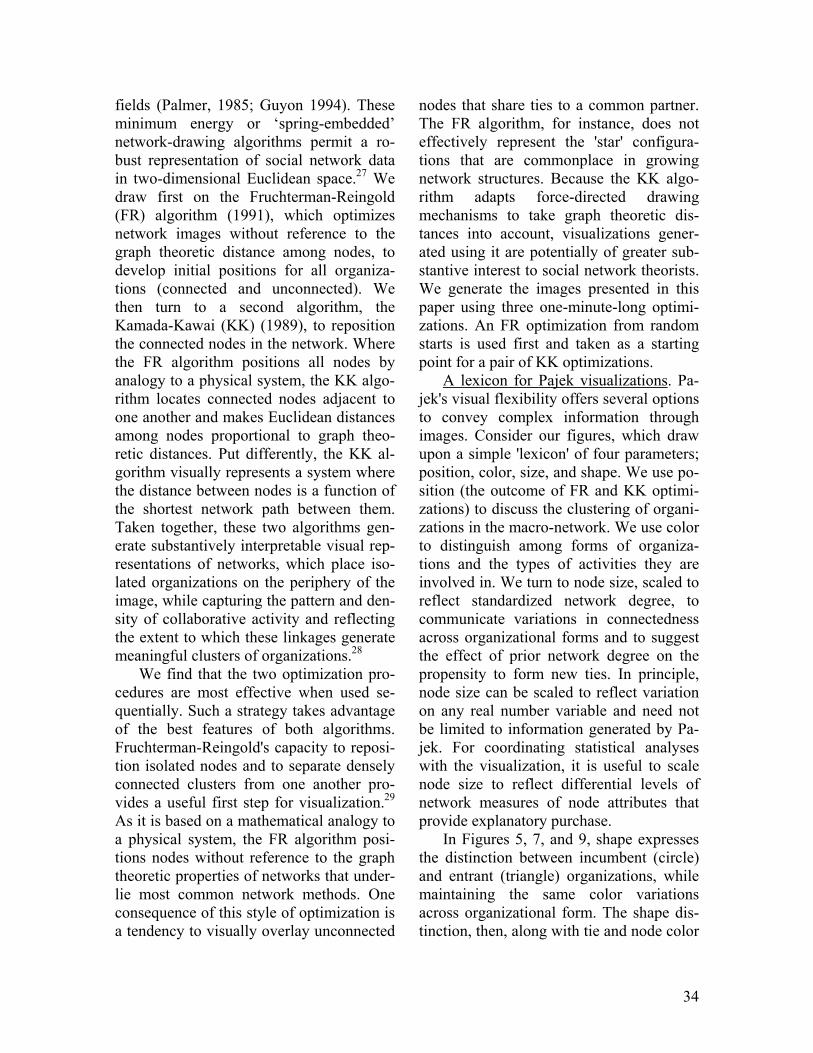
34
fields (Palmer, 1985; Guyon 1994). These minimum energy or ‘spring-embedded’ network-drawing algorithms permit a ro-bust representation of social network data in two-dimensional Euclidean space.27 We draw first on the Fruchterman-Reingold (FR) algorithm (1991), which optimizes network images without reference to the graph theoretic distance among nodes, to develop initial positions for all organiza-tions (connected and unconnected). We then turn to a second algorithm, the Kamada-Kawai (KK) (1989), to reposition the connected nodes in the network. Where the FR algorithm positions all nodes by analogy to a physical system, the KK algo-rithm locates connected nodes adjacent to one another and makes Euclidean distances among nodes proportional to graph theo-retic distances. Put differently, the KK al-gorithm visually represents a system where the distance between nodes is a function of the shortest network path between them. Taken together, these two algorithms gen-erate substantively interpretable visual rep-resentations of networks, which place iso-lated organizations on the periphery of the image, while capturing the pattern and den-sity of collaborative activity and reflecting the extent to which these linkages generate meaningful clusters of organizations.28
We find that the two optimization pro-cedures are most effective when used se-quentially. Such a strategy takes advantage of the best features of both algorithms. Fruchterman-Reingold's capacity to reposi-tion isolated nodes and to separate densely connected clusters from one another pro-vides a useful first step for visualization.29 As it is based on a mathematical analogy to a physical system, the FR algorithm posi-tions nodes without reference to the graph theoretic properties of networks that under-lie most common network methods. One consequence of this style of optimization is a tendency to visually overlay unconnected
nodes that share ties to a common partner. The FR algorithm, for instance, does not effectively represent the 'star' configura-tions that are commonplace in growing network structures. Because the KK algo-rithm adapts force-directed drawing mechanisms to take graph theoretic dis-tances into account, visualizations gener-ated using it are potentially of greater sub-stantive interest to social network theorists. We generate the images presented in this paper using three one-minute-long optimi-zations. An FR optimization from random starts is used first and taken as a starting point for a pair of KK optimizations.
A lexicon for Pajek visualizations. Pa-jek's visual flexibility offers several options to convey complex information through images. Consider our figures, which draw upon a simple 'lexicon' of four parameters; position, color, size, and shape. We use po-sition (the outcome of FR and KK optimi-zations) to discuss the clustering of organi-zations in the macro-network. We use color to distinguish among forms of organiza-tions and the types of activities they are involved in. We turn to node size, scaled to reflect standardized network degree, to communicate variations in connectedness across organizational forms and to suggest the effect of prior network degree on the propensity to form new ties. In principle, node size can be scaled to reflect variation on any real number variable and need not be limited to information generated by Pa-jek. For coordinating statistical analyses with the visualization, it is useful to scale node size to reflect differential levels of network measures of node attributes that provide explanatory purchase.
In Figures 5, 7, and 9, shape expresses the distinction between incumbent (circle) and entrant (triangle) organizations, while maintaining the same color variations across organizational form. The shape dis-tinction, then, along with tie and node color

35
and node position, visually suggests differ-ences in the attachment profiles of entrants and incumbents across organizational forms. Taken together, these four parame-ters offer a wide range of possibilities for exploring data and conveying complex re-sults in network visualizations.
Limitations. Despite the many novel and useful features of Pajek, there are also limitations. Pajek cannot perform most sta-tistical tests of significance, and cannot be used to calculate some commonly used network measures. More importantly, fea-tures of the KK and FR optimization pro-cedures bear upon the interpretation of node position, the comparability, and repli-cability of images. The key difficulty lies in the algorithm's probabilistic optimization procedures. The danger of such procedures is that they may, in repeated trials, con-verge on different local minima rather than finding a global minimum energy by which to position nodes. As a result the position of extreme outlying nodes can shift from optimization to optimization. This variabil-ity occurs most commonly in the location of isolates and nodes with single connec-tions.30 The relative position of nodes to-ward the center of a given network are vastly more stable and reliable. Likewise, the relative position of different compo-nents as positioned in the FR algorithm may vary.
This limitation has several substantive implications. First, standards for the ro-bustness of optimizations cannot be couched in terms of the exact Euclidean position of nodes. We rely instead on the aggregate features of the network and the position of core organizations (note, for instance, our use of the National Institutes of Health, a very well connected node, as a touchstone in the pull out presented in Fig-ure 4). More importantly, the position of nodes cannot be understood in absolute terms. Instead node position must be inter-
preted relative to the position of other nodes in the network. The emphasis on relative position does make it meaningful to consider the coincidence of nodes in close proximity across images.31

36
FOOTNOTES 1 We use the term field rather than industry or popu-lation intentionally. Biotechnology is not a separate industrial sector with well-defined boundaries. Universities, government labs, and nonprofit hospi-tals and research institutes are a critical part of the field; while on the commercial side, both estab-lished pharmaceutical firms and dedicated biotech-nology companies are involved in bringing new medicines to market. Thus, field captures the diver-sity of organizations more aptly than any other term. 2 Even when edges form with equal probability for all pairs of nodes in a network, there is considerable inequality in the distribution of the number of edges for different nodes. The tail of the degree distribu-tion of a simple random process of tie-formation will be truncated, however, by exponential decay in the number of nodes at successively higher degree. The degree distribution of nodes in a highway net-work, for example, tends to be exponential, more like a random network than the degree distribution of nodes in today’s U.S. airlines network, with hubs that jump over many of the nodes connected by spokes. Note that these differences are, in part, a matter of intentional design and not solely a func-tion of geography; there was a time when the airline network was more like a highway network. 3 The meaning of scale-invariant or scale-free for a power law is that the coefficient does not vary from scale to scale as magnitude varies from 1 to 10 to 100,etc. Put differently, for a network with a power-law tail to the degree distribution, there is no characteristic number of edges per node, as in a bell curve-shaped distribution or exponential decay. Barabási’s (2002a) organizing motif is that net-works with power-law degree distributions have a characteristic scale-free signature of self-organizing systems. Analogy is made to the scaling of the fre-quency of earthquakes in relation to their energetic intensity, for example, which tends to follow a power-law. This would imply that there is no typi-cal scale for earthquakes and suggests that the physical mechanism for large earthquakes is the same as that for the small ones. The theme of “the same mechanism” has not been established for so-cial networks, however. 4 Here the actual attachment probability of new nodes with incumbents is P(k) = 1/kα, where alpha is a constant power coefficient. The preferential attachment probability generates a degree distribu-tion in which the frequency of nodes with a given degree d is a function f(d) of 1/dª, where a is the power-law coefficient and can be calculated from
slope of the linear regression line on a log-log plot of d and f(d). 5 We thank Orjan Solvell, Stockholm School of Economics, for the detailed description of the social world of his grandfather, Otto Hammar, and for a photocopy of his grandfather’s 1911 dance card. 6 See Holmstrom and Roberts, 1998, for a useful review of the hold-up problem and discussion of various alternatives to vertical integration as a solu-tion. 7 Hybritech was one of the better known DBFs of the mid-1980s. This San Diego-based firm was purchased in 1986 by the large pharmaceutical company Eli Lilly for $300 million. Within a year, no Hybritech employees remained with Lilly; meanwhile more than 40 firms have been founded by former Hybritech employees (Walcott, 2002). 8 The data are drawn from the NBER patent data-base, using our sample of biotech firms and Owen-Smith’s (2003) sample of U.S. Research 1 universi-ties. 9 Sources: NIH budget, www.nih.gov, 2001; Phar-maceutical R&D spending, Pharmaceutical Manu-facturers of America annual surveys, www.pharma.org. 10 Source: National Science Foundation, Science and Engineering Indicators, 2002. Appendix Table 6-19, p. A6-64. 11 The first volume of BioScan was released in 1987 by the biotech firm Cetus, but coverage was limited as many firms were reluctant to share data with a competitor. Oryx Press issued the first independent directory in 1988. To supplement BioScan, we con-sulted Recombinant Capital as well as including various editions of Genetic Engineering and Bio-technology Related Firms Worldwide, Dun and Bradstreet’s Who Owns Whom?, and Standard and Poor’s. In addition, we utilized annual reports, Se-curities and Exchange Commission filings and, when necessary, made phone calls to companies. 12 Our collaborators Fabio Pammolli and Massimo Riccaboni at the University of Florence have con-structed a large data base on R&D projects in the biomedical field that covers more than 10,000 ex-ternal collaborations among participants in the life sciences throughout the decade of the 1990s. The most frequent type of partnership (approximately 45%) was between a biotech firm and a pharmaceu-tical company. The least common affiliation was between a pharmaceutical company and a public research organization (.05%). 13 We are indebted to James Moody who applied our network data to his algorithm for k-components (Moody and White 2003) as our measure of cohe-sion. A k-component is a potent measure of cohe-
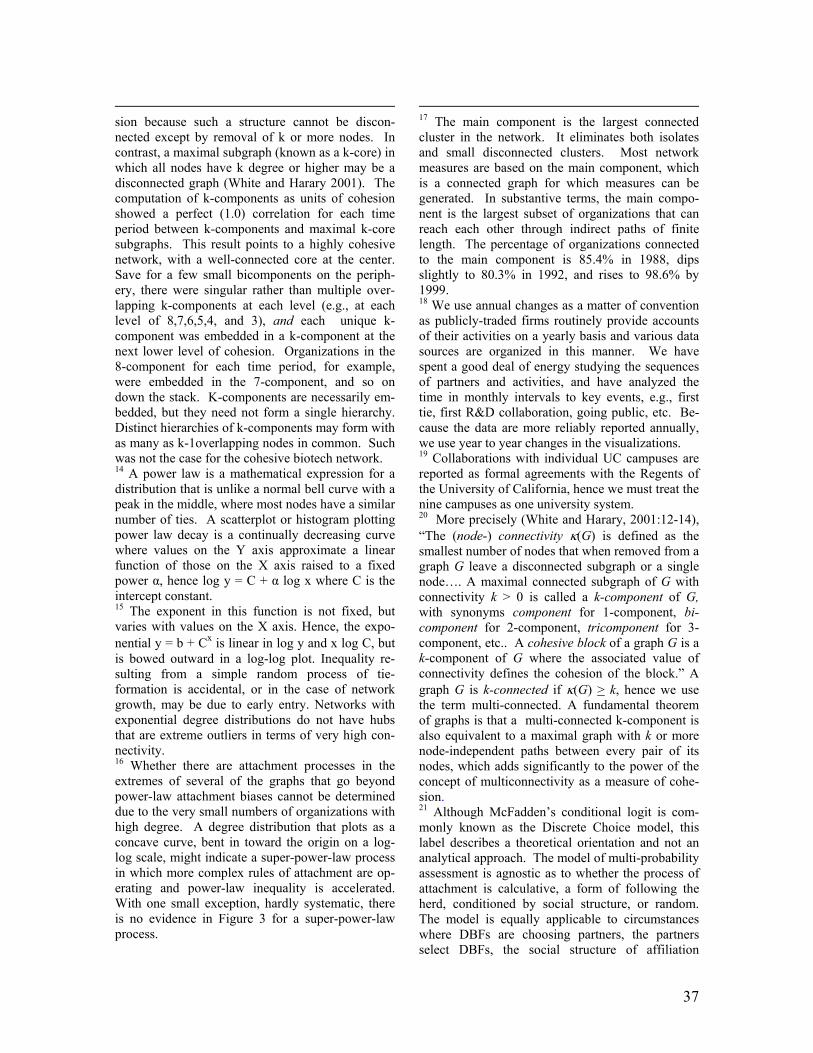
37
sion because such a structure cannot be discon-nected except by removal of k or more nodes. In contrast, a maximal subgraph (known as a k-core) in which all nodes have k degree or higher may be a disconnected graph (White and Harary 2001). The computation of k-components as units of cohesion showed a perfect (1.0) correlation for each time period between k-components and maximal k-core subgraphs. This result points to a highly cohesive network, with a well-connected core at the center. Save for a few small bicomponents on the periph-ery, there were singular rather than multiple over-lapping k-components at each level (e.g., at each level of 8,7,6,5,4, and 3), and each unique k-component was embedded in a k-component at the next lower level of cohesion. Organizations in the 8-component for each time period, for example, were embedded in the 7-component, and so on down the stack. K-components are necessarily em-bedded, but they need not form a single hierarchy. Distinct hierarchies of k-components may form with as many as k-1overlapping nodes in common. Such was not the case for the cohesive biotech network. 14 A power law is a mathematical expression for a distribution that is unlike a normal bell curve with a peak in the middle, where most nodes have a similar number of ties. A scatterplot or histogram plotting power law decay is a continually decreasing curve where values on the Y axis approximate a linear function of those on the X axis raised to a fixed power α, hence log y = C + α log x where C is the intercept constant. 15 The exponent in this function is not fixed, but varies with values on the X axis. Hence, the expo-nential y = b + Cx is linear in log y and x log C, but is bowed outward in a log-log plot. Inequality re-sulting from a simple random process of tie-formation is accidental, or in the case of network growth, may be due to early entry. Networks with exponential degree distributions do not have hubs that are extreme outliers in terms of very high con-nectivity. 16 Whether there are attachment processes in the extremes of several of the graphs that go beyond power-law attachment biases cannot be determined due to the very small numbers of organizations with high degree. A degree distribution that plots as a concave curve, bent in toward the origin on a log-log scale, might indicate a super-power-law process in which more complex rules of attachment are op-erating and power-law inequality is accelerated. With one small exception, hardly systematic, there is no evidence in Figure 3 for a super-power-law process.
17 The main component is the largest connected cluster in the network. It eliminates both isolates and small disconnected clusters. Most network measures are based on the main component, which is a connected graph for which measures can be generated. In substantive terms, the main compo-nent is the largest subset of organizations that can reach each other through indirect paths of finite length. The percentage of organizations connected to the main component is 85.4% in 1988, dips slightly to 80.3% in 1992, and rises to 98.6% by 1999. 18 We use annual changes as a matter of convention as publicly-traded firms routinely provide accounts of their activities on a yearly basis and various data sources are organized in this manner. We have spent a good deal of energy studying the sequences of partners and activities, and have analyzed the time in monthly intervals to key events, e.g., first tie, first R&D collaboration, going public, etc. Be-cause the data are more reliably reported annually, we use year to year changes in the visualizations. 19 Collaborations with individual UC campuses are reported as formal agreements with the Regents of the University of California, hence we must treat the nine campuses as one university system. 20 More precisely (White and Harary, 2001:12-14), “The (node-) connectivity κ(G) is defined as the smallest number of nodes that when removed from a graph G leave a disconnected subgraph or a single node…. A maximal connected subgraph of G with connectivity k > 0 is called a k-component of G, with synonyms component for 1-component, bi-component for 2-component, tricomponent for 3-component, etc.. A cohesive block of a graph G is a k-component of G where the associated value of connectivity defines the cohesion of the block.” A graph G is k-connected if κ(G) > k, hence we use the term multi-connected. A fundamental theorem of graphs is that a multi-connected k-component is also equivalent to a maximal graph with k or more node-independent paths between every pair of its nodes, which adds significantly to the power of the concept of multiconnectivity as a measure of cohe-sion. 21 Although McFadden’s conditional logit is com-monly known as the Discrete Choice model, this label describes a theoretical orientation and not an analytical approach. The model of multi-probability assessment is agnostic as to whether the process of attachment is calculative, a form of following the herd, conditioned by social structure, or random. The model is equally applicable to circumstances where DBFs are choosing partners, the partners select DBFs, the social structure of affiliation

38
matches DBFs and partners, or any combination thereof. McFadden (2001) initially dubbed his es-timator a conditional logit, but has since indicated he prefers the term multinomial logit. His model is more flexible than other conditional “fixed effects” estimators, and more general than standard multi-nomial estimators, converging to each with correct specification of dependent and independent vari-ables. Hence, we refer to it more generally as a multi-probability model. 22 This limitation introduces a form of competitive interdependence in our observations. That is, as-suming that organizations have some finite need or capacity for partners, not all firms may be able to attach to all partners they might otherwise have cho-sen. This interdependence is substantive, rather than statistical, in that it could, in theory, be speci-fied and modeled. Such specification would involve many of the variables we have measured, such as prior degree and experience, but would also require some variables such as financial resources or mana-gerial skill that are not easily available. This form of interdependence is, to varying degrees, present in many applications of McFadden’s estimator. For instance, in the transportation studies (McFadden, 1984), each mode (car, bus, train) was vying for commuters, and not all individuals could choose the same mode, as doing so would crowd buses or jam highways. As a result, we do not believe that our results are compromised by this limitation. Further research into the statistical properties of McFad-den’s estimator in the face of such interdependence does, nevertheless, seem warranted. 23 For this pattern to obtain, it is sufficient to add interaction terms for cohesion (shared cohesion x firm age, firm cohesion x partner cohesion, firm cohesion x prospective diversity). The change in signs is stable with period and timeline effects added to the conditional logit model. Change in the signs of the coefficients do not occur in Tables A2 and A3 for any of the other variables listed in Table 7, with one minor exception. The contingency of combined firm cohesion x prospective diversity, for example, predicts lower attachment, but shifts the prediction for prospective diversity to higher at-tachment. 24 Pajek was developed by Vladimir Batagelj and Andrej Mrvar and is available online at http://vlado.fmf.uni-lj.si/pub/networks/pajek/ . Pajek has been used in a number of disciplines to repre-sent complex network data (Albert, Jeong, & Bara-basi 2000; Batagelj & Mrvar 2000; Moody, 2001; Owen-Smith et. al. 2002; White & Harary 2001). We thank Andrej Mrvar for comments on this Ap-pendix.
25 The program will handle networks of up to 1,000,000 nodes. Due to limitations imposed by the computational capacities of our machines, we have never analyzed a network larger than 250,000 nodes. 26 Consider simple centrality measures. Pajek cal-culates degree, closeness and betweenness measures for large nets, but does not implement more com-plex measures such as information or power central-ity. 27 One algorithm also offers the option to visualize a network as a three dimensional sphere. While such representations are valuable for some analyses, they raise difficulties for two dimensional presentation. Thus, we emphasize two dimensional optimizations here. 28 While the repelling forces of nodes are deter-mined by a constant (though manipulable) factor, the attractive strength of ties can vary with the ob-served value of ties. In this paper, our images are created with constant tie strengths. 29 As implemented in Pajek, the Kamada-Kawai algorithm only alters the position of connected nodes as network distances among unconnected portions of a graph are undefined. By the same to-ken, KK tends to overlap unconnected components, making the visual analysis of network evolution difficult. 30 To test this variation we optimized the same net-work multiple (30) times from random starting points and took the mean and variance of node co-ordinates, finding the least variation in the position of well connected (high degree) nodes. 31 It is possible to generate more strictly comparable images by fixing the position of nodes across visu-alizations. Nevertheless, choosing an analytically appropriate constant position raises a new set of issues and such a strategy limits the package's visual flexibility by fixing one of the four parameters that can convey information.

References Abbott, Andrew. 2001. Time Matters. Chicago:
University of Chicago Press. Albert, Réka and A.L. Barabási. 2002. “Statistical
mechanics of complex networks.” Reviews of Modern Physics T4, 1: 47-97.
Albert, Réka, H. Jeong, and A.L. Barabási. 1999.
“Diameter of the World Wide Web.” Nature 401: 130-31.
__________. 2000. “Error and attack tolerance in
complex networks.” Nature 406: 378-382. Barabási, Albert-László. 2002a. Linked: The New
Science of Networks. Cambridge, MA: Perseus. __________. 2002b. “Emergence of Scaling in
Complex Networks.” Pp. 69-84 in Handbook of Graphs and Networks: From the Genome to the Internet, S. Bornholdt and Schuster, H.G., eds. Berlin: Wiley-VCH.
Barabási, Albert-Lázló and Réka Albert. 1999.
“Emergence of scaling in random networks.” Science 286: 509-12.
Batagelj V., A. Mrvar. 2000. “Drawing Genealo-
gies.” Connections 21 47-57. Ben-Akiva, M. and S.R. Lerman. 1989. Discrete
Choice Analysis. Cambridge, MA: MIT Press. Blau, Peter. 1977. Inequality and Heterogeneity: A
Primitive Theory of Social Structure. New York: Free Press.
Bollobás, Bela, and Oliver Riordan. 2002. “Mathe-
matical Results on Scale-free Random Graphs.” Pp. 1-34 in Handbook of Graphs and Networks: From the Genome to the Internet, S. Bornholdt and H.G. Schuster, eds. Berlin: Wiley-VCH.
Bourdieu, Pierre. 1992. “The Logic of Fields.” Pp.
94-114 in An Invitation to Reflexive Sociology, by P. Bourdieu and L. Wacquant. Chicago: Uni-versity of Chicago Press.
Burt, Ronald S. 1992. Structural Holes. Cambridge,
MA: Harvard University Press.
__________. 2000. “Decay Functions.” Social Net-
works 22: 1-28. Davis, Gerald F., Mina Yoo, and Wayne Baker.
2003. “The Small world of the corporate elite, 1982-2001.” Strategic Organization 1:301-36.
de Nooy, Wouter, Andrej Mrvar and Vladimir
Batagelj. Forthcoming. Exploratory Social Net-work Analysis with Pajek. New York: Cam-bridge University Press.
de Solla Price, Derek J. 1965. “Networks of scien-
tific papers.” Science 149:510-515. __________. 1980. “A general theory of bibliomet-
rics and other cumulative advantage processes.” Journal of the American Informatics Society 27:292-306.
Dezalay, Yves and B.G. Garth. 1996. Dealing in
Virtue. Chicago: University of Chicago Press. DiMaggio, Paul J. 1991. “Constructing an organiza-
tional field as a professional project: U.S. Art Museums, 1920-40.” Pp. 267-92 in The New In-stitutionalism in Organizational Analysis, W. Powell and P.J. DiMaggio, eds. Chicago: Uni-versity of Chicago Press.
DiMaggio, Paul J. and Walter W. Powell. 1983.
“The Iron Cage Revisited: Institutional isomor-phism and collectivity rationality in organiza-tional fields.” American Sociological Review 48: 147-60.
Ferguson, Priscilla Parkhurst. 1998. “A Cultural
Field in the Making: Gastronomy in 19th Cen-tury France.” American Journal of Sociology 104:597-641.
Fruchterman, T., E. Reingold. 1991. “Graph Draw-
ing by Force-Directed Replacement.” Software -- Practice and Experience 21 1129-1164.
Galambos, Louis, J. Sturchio. 1996. “The pharma-
ceutical industry in the twentieth century.” His-tory and Technology 13(2): 83-100.
Gambardella, Alfonso. 1995. Science and Innova-
tion: The U.S. Pharmaceutical Industry During

40
the 1980s. Cambridge, U.K.: Cambridge Uni-versity Press.
Granovetter, Mark. 1973. “The Strength of Weak
Ties.” American Journal of Sociology 78, 6: 1360-80.
__________. 1992. “Problems of Explanation in
Economic Sociology.” Pp. 25-56 in Networks and Organizations, N. Nohria and R. Eccles, eds. Boston: Harvard Business School Press.
Greene, W.H. 2000. Econometric Analysis. Upper
Saddle River, NJ: Prentice Hall. Gulati, Ranjay and Martin Gargiulo. 1998. “Where
do interorganizational networks come from?” American Journal of Sociology 104(5): 1439-93.
Guyon X., 1994. Random Fields on a Network. Ber-
lin: Springer. Hagedoorn, John and Nadine Roijakkers. 2002.
“Small Entrepreneurial Firms and Large Com-panies in Inter-Firm R&D Networks – the Inter-national Biotechnology Industry.” Pp. 223-52 in Strategic Entrepreneurship, ed. By M.A. Hitt et al., Cambridge, MA: Blackwell Publishing.
Hammerle, A. and G. Ronning. 1995. “Panel
Analysis for Qualitative Variables.” In G. Arm-inger, C.C. Clogg, and M.E. Sobel (eds) Hand-book of Statistical Modeling for the Social and Behavioral Sciences. NY: Plenum.
Henderson, Rebecca and Iain Cockburn. 1996.
“Scale, Scope, and Spillovers: The Determi-nants of Research Productivity in Drug Discov-ery.” Rand Journal of Economics 27(1): 32-59.
Henderson Rebecca, Luigi Orsenigo, ang Gary Pis-
ano. 1999. “The Pharmaceutical Industry and the Revolution in Molecular Biology: Interac-tions among Scientific, Institutional, and Organ-izational Change.” Pp. 267-311 in D.C. Mowery and R.R. Nelson (eds.), Sources of Industrial Leadership, New York: Cambridge University Press.
Hoffman, Andrew J. 1999. “Institutional Evolution and Change: Environmentalism and the U.S. Chemical Industry.” Academy of Management Journal 42(4): 351-71.
__________. 2001. From Heresy to Dogma: An In-
stitutional History of Corporate Environmental-ism. Stanford, CA: Stanford University Press.
Holmstrom, Bengt and John Roberts. 1998. “The
Boundaries of the Firm Revisited.” Journal of Economic Perspectives 12: 73-94.
Jeong, Hawoong, B. Tombor, R. Albert, Z. Oltvai,
and A.L. Barabási. 2000. “The large-scale or-ganization of metabolic networks.” Proceedings of the National Academy of Sciences 98 (Jan.): 404-09.
Kamada, T. and S. Kawai. 1989. An Algorithm for
Drawing General Undirected Graphs. Informa-tion Processing Letters 31:7-15.
Kogut, Bruce and Gordon Walker, 2001. “The
Small World of Germany and the Durability of National Networks.” American Sociological Re-view 66(3): 317-35.
Lotka, A. J. 1926. “The Frequency Distribution of
Scientific Productivity.” Journal of the Wash-ington Academy of Science 16:317-323.
Lerner, Josh, H. Shane, and A. Tsui. 2003. “Do Eq-
uity Financing Cycles Matter? Evidence from Biotechnology Alliances.” Journal of Financial Economics 67(3): 411-46..
Lincoln, James, Michael Gerlach, and Christina
Ahmadjian. 1996. “Keiretsu networks and cor-porate performance in Japan.” American Socio-logical Review 61: 67-88.
Macneil, Ian R. 1978. “Contracts: adjustment of
long-term economic relations under classical, neoclassical, and relational contract law.” Northwestern University Law Review 72: 854-905.

41
Maddala, G.S. 1986. Limited Dependent and Quali-tative Variables in Econometrics. Cambridge: Cambridge University Press.
March, James G. 1991. “Exploration and Exploita-
tion in Organizational Learning.” Organization Science 2: 71-87.
March, James G. and Johan P. Olsen. 1989. Redis-
covering Institutions. New York: The Free Press.
McKelvey, Maureen. 1996. Evolutionary Innova-
tions. Oxford, UK: Oxford University Press. McFadden, Daniel. 1973. “Conditional Logit
Analysis of Qualitative Choice Behavior.” Pp. 105-42 in P. Zarembka (ed.), Frontiers in Econometrics. NY: Academic.
__________. 1981. “Econometric Models of Prob-
abilistic Choice.” Pp. 198-272 in C. Manski and D. McFadden (eds.), Structural Analysis of Dis-crete Data: With Econometric Applications. Cambridge, MA: MIT Press.
__________. 1984. “The measurement of urban
travel demand.” Journal of Public Economics 3:303-28.
__________. 2001. “Economic Choices.” American
Economic Review 91:351-78. McPherson, Miller, and L. Smith Lovin. 1987.
“Homophily in Voluntary Organizations.” American Sociological Review 52: 370-79.
McPherson, Miller, L. Smith Lovin, and J. Cook.
2001. “Birds of a Feather: Homophily in Social Networks.” Annual Review of Sociology 27: 415-44.
Merton, Robert K. 1973. “The Normative Structure
of Science.” Pp. 267-78 in his The Sociology of Science. Chicago: University of Chicago Press.
Milgram, Stanley. 1967. “The Small World Prob-
lem.” Psychology Today 2:60-67.
Moody, James. 2001. “Race, School Integration, and Friendship Segregation in America.” American Journal of Sociology 107(3): 679-716.
Moody, James & Douglas R. White. 2003. "Social
Cohesion and Embeddedness: A hierarchical conception of social groups." American Socio-logical Review 68(1): 103-28.
Morrill, Calvin and Jason Owen-Smith. 2002. “The
Emergence of Environmental Conflict Resolu-tion.” Pp. 90-118 in Organizations, Policy, and the Natural Environment, A.J. Hoffman and M. J. Ventresca, eds. Stanford CA: Stanford Uni-versity Press.
Newman, Mark. 2001. “The Structure of Scientific
Collaboration Networks.” Proceedings of the National Academy of Sciences 98 (Jan.): 404-09.
__________. 2003. “The structure and function of
complex networks.” SIAM Review 45: 167-256. Orsenigo L., 1989. The Emergence of Biotechnol-
ogy. New York, St Martin Press. Orsenigo L., F. Pammolli, M. Riccaboni. 2001.
Technological Change and Network Dynamics. Lessons from the Pharmaceutical Industry. Re-search Policy 30 :485-508.
Owen-Smith, Jason and Walter W. Powell. 2001a.
“To Patent or Not: Faculty Decisions and Insti-tutional Success in Academic Patenting.” Jour-nal of Technology Transfer 26(1): 99-114.
__________. 2001b. “Careers and Contradictions:
Faculty Responses to the Transformation of Knowledge and its Uses in the Life Sciences,” in Steven Vallas (ed.) The Transformation of Work, a special issue of Research in the Sociol-ogy of Work. 10:109-140.
__________. 2004. “Knowledge Netwroks in the
Boston Biotechnology Community.” Organiza-tion Science (Jan./Feb.)
Owen-Smith, Jason, M. Riccaboni, F. Pammolli,
and W.W. Powell. 2002. “A Comparison of

42
U.S. and European University-Industry Rela-tions in the Life Sciences.” Management Sci-ence 48,1: 24-43.
Padgett, John F. and Chris Ansell. 1993. “Robust
Action and the Rise of the Medici, 1400-34.” American Journal of Sociology 98: 1259-1319.
Palmer, Edgar N. 1985. Graphical Evolution: An
Introduction to the Theory of Random Graphs. New York: Wiley.
Powell, Walter W. 1990. “Neither Market Nor Hi-
erarchy: Network Forms of Organization.” Re-search in Organizational Behavior 12:295-336.
__________. 1996. “Inter-Organizational Collabo-
ration in the Biotechnology Industry.” Journal of Institutional and Theoretical Economics 120(1): 197-215.
Powell, Walter W. and Peter Brantley. 1992.
“Competitive Cooperation in Biotechnology: Learning Through Networks?” Pp. 366-394 in Networks and Organizations, R. Eccles and N. Nohria, eds. Boston: Harvard University Press.
__________. 1996. “Magic Bullets and Patent
Wars: New Product Development in the Bio-technology Industry.” Pp. 233-60 in Managing Product Development, T. Nishiguchi, ed. New York: Oxford University Press.
Powell, Walter W., K.W. Koput, J.I. Bowie, and L.
Smith-Doerr. 2002. “The Spatial Clustering of Science and Capital: Accounting for Biotech Firm-Venture Capital Relationships.” Regional Studies 36, 3: 291-306.
Powell, Walter W., Kenneth Koput, and Laurel
Smith-Doerr. 1996. Interorganizational Collabo-ration and the Locus of Innovation: Networks of Learning in Biotechnology. Administrative Sci-ence Quarterly 41(1): 116-45.
Powell, Walter W., Kenneth Koput, Laurel Smith-
Doerr, and J. Owen-Smith. 1999. “Network Po-sition and Firm Performance: Organizational
Returns to Collaboration.” Research in the So-ciology of Organizations 16: 129-59, JAI Press.
Robinson, David and Toby E. Stuart. 2002. “Just
How Incomplete Are Incomplete Contracts?” Working paper, Graduate School of Business, Columbia University.
Salancik, Gerald. 1995. “WANTED: A good net-
work theory of organization.” Administrative Science Quarterly 45(1): 1-24.
Scott, W. Richard, Martin Reuf, Peter J. Mendel,
and Carol Caronna. 2000. Institutional Change and Health Care Organizations. Chicago: Uni-versity of Chicago Press.
Sharpe, Margaret. 1991. “Pharmaceuticals and Bio-
technology: Perspectives for the European In-dustry.” In Technology and the Future of Europe, C. Freeman et al, eds. London: Pinter.
Sorenson, Olav and Toby Stuart. 2001. “Syndica-
tion Networks and the Spatial Distribution of Venture Capital Investment.” American Journal of Sociology 106: 1546-88.
Stuart, Toby E. 1998. “Network Positions and Pro-
pensities to Collaborate.” Administrative Sci-ence Quarterly 43: 668-98.
Teece, David. 1986. “Profiting from Technological
Innovation: Implications for Integration, Col-laboration, Licensing and Public Policy.” Re-search Policy 15(6): 185-219.
Thornton, Patricia. 1995. “Accounting for Acquisi-
tion Waves: Evidence from the U.S. College Publishing Industry.” Pp. 199-225 in The Insti-tutional Construction of Organizations, W.R. Scott and S. Christensen, eds. Thousand Oaks, CA: Sage.
Walcott, Susan M. 2002. “Analyzing an Innovative
Environment: San Diego as a Bioscience Beachhead.” Economic Development Quarterly 16(2): 99-114.

43
Wasserman, Stanley and Katherine Faust. 1994. So-cial Network Analysis: Methods and Applica-tions. New York: Cambridge University Press.
Watts, Duncan. 1999. Small Worlds. Princeton:
Princeton University Press. Watts, Duncan and Stephen Strogatz. 1998. “Col-
lective Dynamics of ‘Small-World’ Networks.” Nature 393: 440-2.
White, Douglas R., and Frank Harary. 2001. The
Cohesiveness of Blocks in Social Networks: Node Connectivity and Conditional Density. Sociological Methodology 31(1): 305-59.
White, Harrison. 1970. “Search parameters for the
small world problem.” Social Forces 49: 259-64.
__________. 1981. “Where do markets come
from?” American Journal of Sociology 81: 730-79.
__________. 1985. “Agency as Control.” Pp. x-xx
in Principals and Agents, J. Pratt and R. Zeck-hauser, eds. Boston: Harvard Business School Press.
__________. 1992. Identity and Control. Princeton,
NJ: Princeton University Press. Zucker, Lynne and Michael Darby. 1997. “Present
at the Revolution: Transformation of Technical Identity for a Large Pharmaceutical Firm After the Biotechnological Breakthrough.” Research Policy 26(4): 429-47

44
TABLES Table 1 Top Ten Biotechnology Drugs
PRODUCT INDICATED USE 2001 SALES IN DEVELOPER MARKETER MILLIONS Red blood cell 3,430 Amgen Johnson &
Procrit enhancement Johnson Red blood cell
Epogen enhancement 2,109 Amgen Amgen
Intron Hepatitis C, certain A/Rebetron forms of cancer 1,447 Biogen, ICN Schering-Plough
Restoration of white Neupogen blood cells 1,346 Amgen Amgen
Humulin Diabetes mellitus 1,061 Genentech Lilly
Relapsing multiple Avonex sclerosis 972 Biogen Biogen
B-cell non-Hodgkin's
Rituxan lymphoma 819 IDEC Genentech, IDEC Immunex,
Enbrel Rheumatoid arthritis 762 Immunex American Home Products
Rheumatoid arthritis, Johnson & Remicade Chron's disease 721 MedImmune Johnson
Enzyme replacement Cerezyme therapy 570 Genzyme Genzyme
Source: Standard & Poor's "Biotechnology," May 2002.
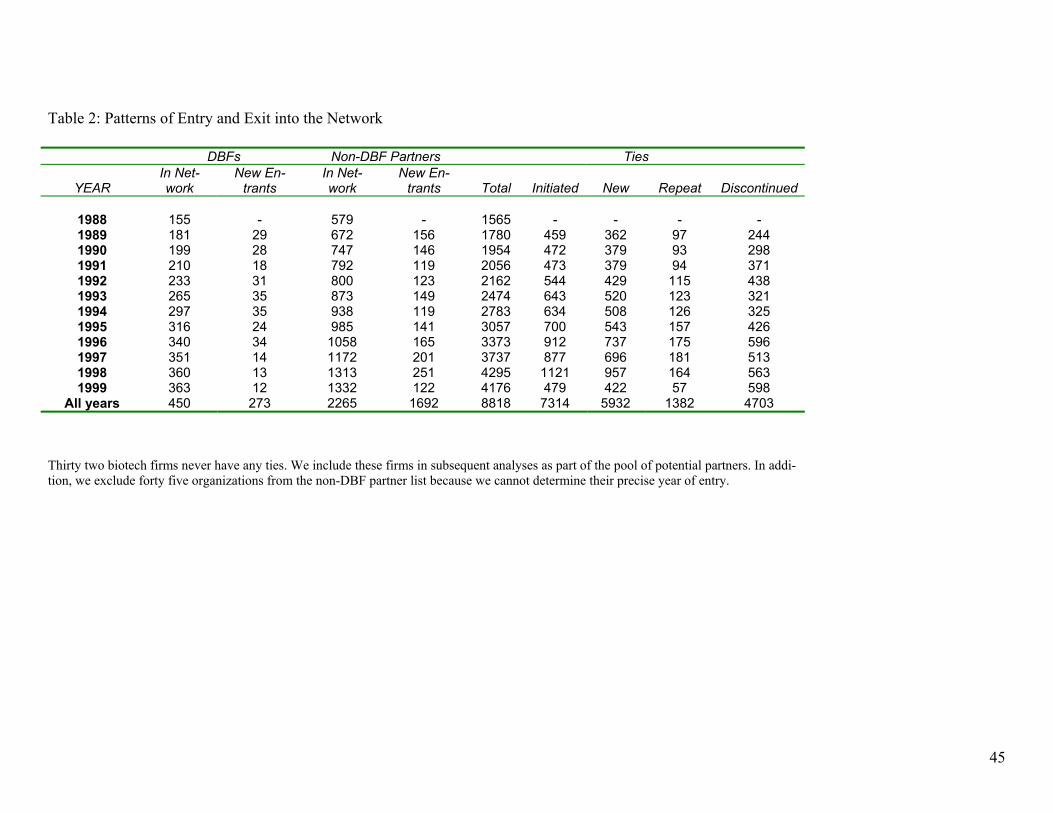
45
Table 2: Patterns of Entry and Exit into the Network
Thirty two biotech firms never have any ties. We include these firms in subsequent analyses as part of the pool of potential partners. In addi-tion, we exclude forty five organizations from the non-DBF partner list because we cannot determine their precise year of entry.
DBFs Non-DBF Partners Ties
YEAR In Net-work
New En-trants
In Net-work
New En-trants Total Initiated New Repeat Discontinued
1988 155 - 579 - 1565 - - - - 1989 181 29 672 156 1780 459 362 97 244 1990 199 28 747 146 1954 472 379 93 298 1991 210 18 792 119 2056 473 379 94 371 1992 233 31 800 123 2162 544 429 115 438 1993 265 35 873 149 2474 643 520 123 321 1994 297 35 938 119 2783 634 508 126 325 1995 316 24 985 141 3057 700 543 157 426 1996 340 34 1058 165 3373 912 737 175 596 1997 351 14 1172 201 3737 877 696 181 513 1998 360 13 1313 251 4295 1121 957 164 563 1999 363 12 1332 122 4176 479 422 57 598
All years 450 273 2265 1692 8818 7314 5932 1382 4703

46
Table 3. Variables in Statistical Tables Variable Label Unit of Observation Description Dependent variables: new attachment computed as a binary indicator of whether an attachment occurs between a DBF and a partner for the first
time repeat attachment computed as a binary indicator of whether an attachment occurs between a DBF and a partner, other than
for the first time Independent variables: Accumulative Advantage Firm Degree DBF the number of ties of the DBF just prior to the attachment Partner Degree Partner the number of ties of the partner just prior to the attachment Firm Experience DBF number of years since inception of DBF’s first tie New Partner Partner indicates whether this is the partner’s first year in the network Partner Experience Partner number of years since inception of partner’s first tie Prior ties Dyad number of prior ties connecting the DBF-partner dyad Prior Experience Dyad duration since first tie connecting the DBF-partner dyad Homophily Collaborative distance Dyad
1-mode: Euclidean distance between the activity-type-by-partner-form profiles of the attaching DBF and partner, just prior to the attachment
Dyad
2-mode: Euclidean distance between the activity-type profiles of the attaching DBF and partner, just prior to the attachment
Age difference Dyad 1-mode: absolute difference in age between the attaching DBF and the partner, at time of attachment Size difference Dyad 1-mode: absolute difference in number of employees between attaching DBF and the partner, at time of
attachment Governance Similarity Dyad 1-mode: dummy variable capturing whether both firms are publicly traded or privately held, at time of at-
tachment Co-location Dyad 1-mode: indicator of whether the attaching DBF and partner are in the same region, at time of attachment. Partner’s Partner Collaborative Distance Partner’s neighbor-
hood average Euclidean distance between activity-type-by-partner-form profiles of attaching DBF and other DBFs attached to the partner
Partner’s Partner Age Difference Partner’s neighbor-hood
average absolute difference in age between the attaching DBF and other DBFs attached to the partner
Partner’s Partner Size Difference Partner’s neighbor-hood
average absolute difference in number of employees between the attaching DBF and other DBFs attached to the partner
Partner’s Partner Governance Similarity Partner’s neighbor-hood
average absolute difference in whether publicly-held between the attaching DBF and other DBFs attached to the partner
Partner’s Partner Co-Location Partner’s neighbor-hood
average of indicator of whether the attaching DBF and other DBFs attached to the partner are in the same three digit zip-code region
Follow-the-trend Dominant Trend
Field percentage of other attachments up to the time of the attachment that are in same activity-type-by-partner-form category
Dominant Type Partner percentage of a partner’s ties that fall into the same activity-type category as the activity type of the at-tachment

47
Multiconnectivity Firm Cohesion DBF the DBF’s maximum value of k for which the DBF is in a k-component, just prior to the attachment Partner Cohesion Partner
the partner’s maximum value of k for which the partner is in a k-component, just prior to the attachment
Shared Cohesion Dyad maximum value k of k-components occupied by both partner and DBF, just prior to attachment Firm Tie Diversity DBF Blau heterogeneity index over DBF’s activity-type-by-partner-form portfolio, just prior to the attachment Partner Tie Diversity Partner 1-mode: Blau heterogeneity index over partner’s activity-type-by-partner-form portfolio, just prior to the
attachment 2-mode: Blau heterogeneity index over the partner’s activity-type portfolio, just prior to the attachment Prospective diversity Dyad change in DBF tie diversity resulting from attachment Partner’s Partner Collaborative Diversity Partner’s neighbor-
hood average tie diversity of other DBFs attached to the partner in terms of activity-type-by-partner-form cate-gories, at time of attachment
Controls Period Field Period= 1: 1989-1993, Period= 2: 1994-1996; Period= 3: 1997-1999 Timeline Field linear time trend, computed as year of observation - 1987 Age DBF duration in years since DBF’s founding or first entry into biotech Size DBF number of employees of DBF Governance DBF indicates whether DBF is publicly or privately held Form Partner 2-mode: indicates form of partner organization, e.g. biomedical corp, university, non-profit, government,
pharmaceutical or other for-profit Type Dyad indicates type of activity or exchange involved in collaboration, e.g. research, financing, licensing, com-
mercialization.
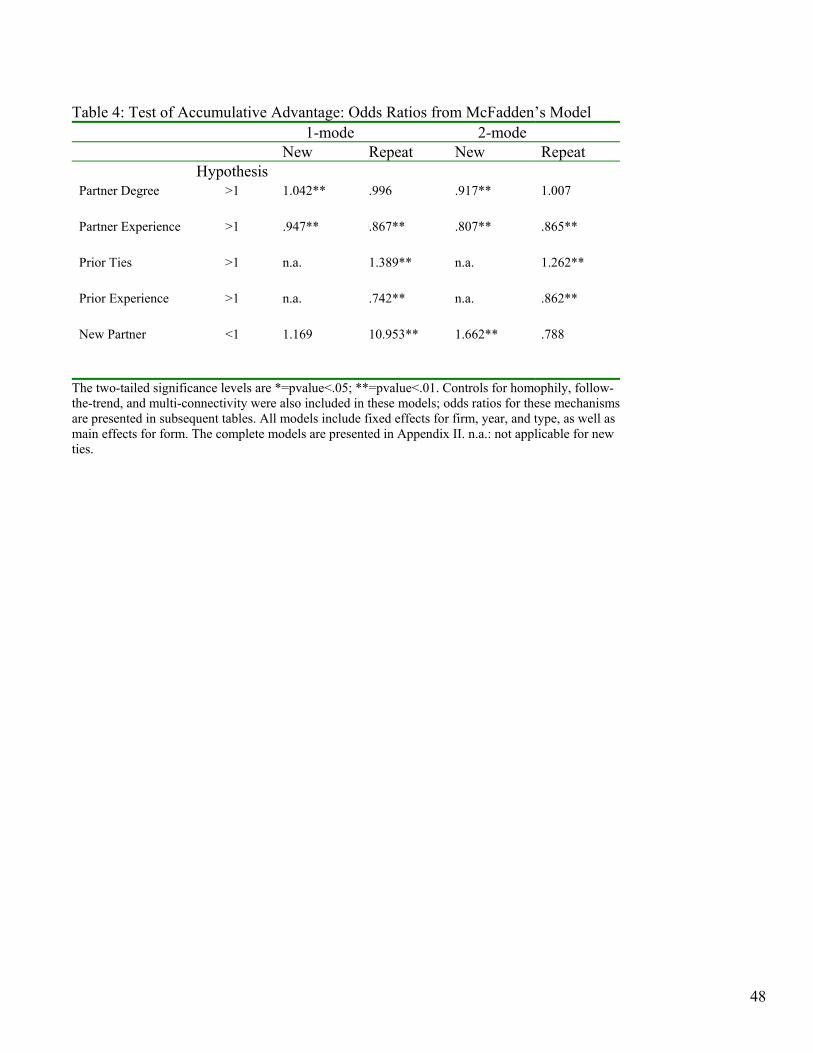
48
Table 4: Test of Accumulative Advantage: Odds Ratios from McFadden’s Model 1-mode 2-mode New Repeat New Repeat Hypothesis Partner Degree >1 1.042**
.996
.917**
1.007
Partner Experience >1 .947**
.867**
.807**
.865**
Prior Ties >1 n.a. 1.389**
n.a. 1.262**
Prior Experience >1 n.a. .742**
n.a. .862**
New Partner <1 1.169
10.953**
1.662**
.788
The two-tailed significance levels are *=pvalue<.05; **=pvalue<.01. Controls for homophily, follow-the-trend, and multi-connectivity were also included in these models; odds ratios for these mechanisms are presented in subsequent tables. All models include fixed effects for firm, year, and type, as well as main effects for form. The complete models are presented in Appendix II. n.a.: not applicable for new ties.

49
Table 5: Test of Homophily: Odds Ratios from McFadden’s Model 1-mode 2-mode New Repeat New Repeat Hypothesis Co-location >1 1.95**
2.091*
n.a. n.a.
Partner’s Partner Co-Location
>1 1.294~
.460
1.098
.129**
Governance Simi-larity
>1 .864
2.037~
n.a. n.a.
Collaborative dis-tance
<1 .973~
1.053~
1.196**
1.017~
Partner’s Partner Collaborative Dis-tance
<1 .997
1.689**
.920**
1.319**
Size difference <1 1.018**
1.001
n.a. n.a.
Partner’s Partner Size Difference
<1 .991
.995**
1.003*
.991
Age difference <1 1.036**
1.137**
n.a. n.a.
Partner’s Partner Age Difference
<1 .980
1.063
1.005
1.161**
The two-tailed significance levels are ~=pvalue<.10; *=pvalue<.05; **=pvalue<.01. Con-trols for accumulative advantage, follow-the-trend, and multi-connectivity were also in-cluded in these models; odds ratios for these mechanisms are presented in prior and subse-quent tables. All models include fixed effects for firm, year, and type, as well as main ef-fects for form. The complete models are presented in Appendix II. Size is divided by 100. n.a.: 2-mode data were not available for computation.

50
Table 6: Test of Follow-the-trend: Odds Ratios from McFadden’s Model 1-mode 2-mode New Repeat New Repeat Hypothesis Dominant Type
>1 1.027**
1.039**
1.025**
1.029**
Dominant Trend
>1 1.251**
.805*
1.064**
.884**
The two-tailed significance levels are *=pvalue<.05; **=pvalue<.01. Controls for accumulative ad-vantage, homophily, and multi-connectivity were also included in these models; odds ratios for these mechanisms are presented in prior and subsequent tables. All models include fixed effects for firm, year, and type, as well as main effects for form. The complete models are presented in Appendix II. Table 7: Test of Multi-connectivity: Odds Ratios from McFadden’s Model 1-mode 2-mode New Repeat New Repeat
Hypothesis Partner Cohesion >1 1.432**
2.589**
1.667**
1.080
Shared Cohesion >1 1.058*
1.103
5.272**
1.905**
Partner Tie Diversity >1 1.025**
1.016
1.037**
1.020**
Prospective Tie Diver-sity
>1 .972
.738**
.883**
.952**
Partner’s Partner Tie Diversity
>1 1.042
.944**
.986**
.959**
The two-tailed significance levels are *=pvalue<.05; **=pvalue<.01. Con-trols for accumulative advantage, homophily, and follow-the-trend were also included in these models; odds ratios for these mechanisms are pre-sented in prior tables. All models include fixed effects for firm, year, and type, as well as main effects for form. The complete models are presented in Appendix II.
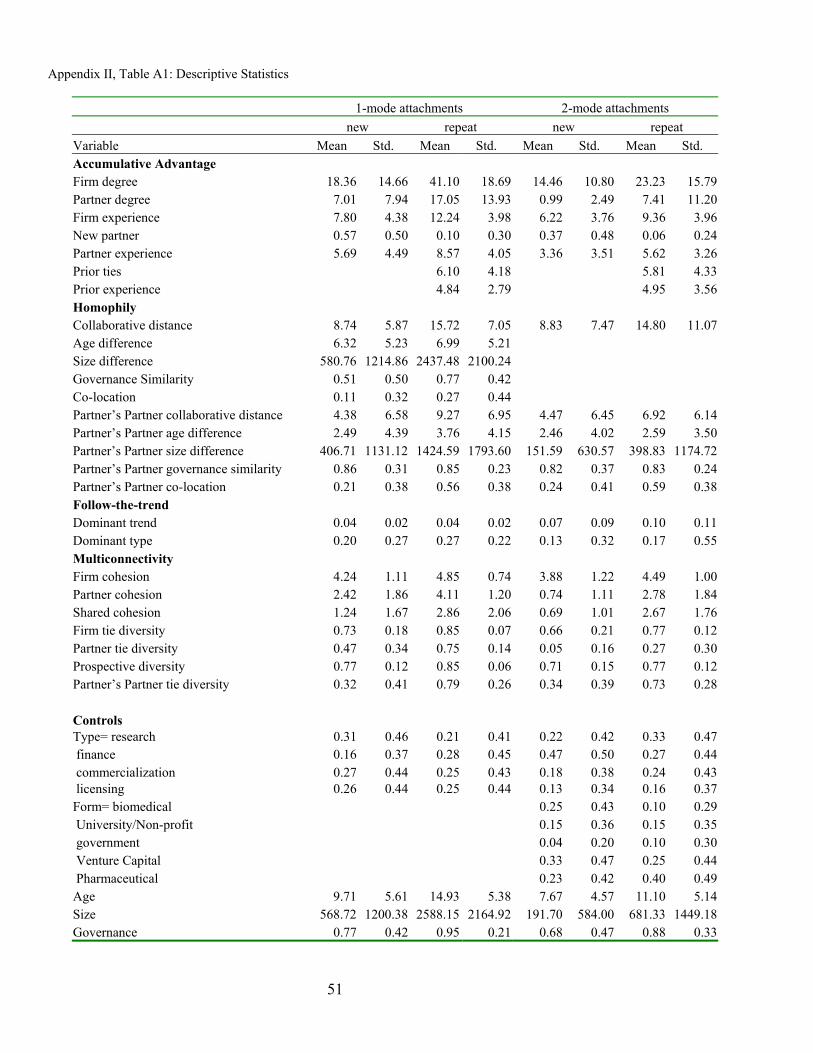
51
Appendix II, Table A1: Descriptive Statistics
1-mode attachments 2-mode attachments new repeat new repeat Variable Mean Std. Mean Std. Mean Std. Mean Std. Accumulative Advantage Firm degree 18.36 14.66 41.10 18.69 14.46 10.80 23.23 15.79Partner degree 7.01 7.94 17.05 13.93 0.99 2.49 7.41 11.20Firm experience 7.80 4.38 12.24 3.98 6.22 3.76 9.36 3.96New partner 0.57 0.50 0.10 0.30 0.37 0.48 0.06 0.24Partner experience 5.69 4.49 8.57 4.05 3.36 3.51 5.62 3.26Prior ties 6.10 4.18 5.81 4.33Prior experience 4.84 2.79 4.95 3.56Homophily Collaborative distance 8.74 5.87 15.72 7.05 8.83 7.47 14.80 11.07Age difference 6.32 5.23 6.99 5.21 Size difference 580.76 1214.86 2437.48 2100.24 Governance Similarity 0.51 0.50 0.77 0.42 Co-location 0.11 0.32 0.27 0.44 Partner’s Partner collaborative distance 4.38 6.58 9.27 6.95 4.47 6.45 6.92 6.14Partner’s Partner age difference 2.49 4.39 3.76 4.15 2.46 4.02 2.59 3.50Partner’s Partner size difference 406.71 1131.12 1424.59 1793.60 151.59 630.57 398.83 1174.72Partner’s Partner governance similarity 0.86 0.31 0.85 0.23 0.82 0.37 0.83 0.24Partner’s Partner co-location 0.21 0.38 0.56 0.38 0.24 0.41 0.59 0.38Follow-the-trend Dominant trend 0.04 0.02 0.04 0.02 0.07 0.09 0.10 0.11Dominant type 0.20 0.27 0.27 0.22 0.13 0.32 0.17 0.55Multiconnectivity Firm cohesion 4.24 1.11 4.85 0.74 3.88 1.22 4.49 1.00Partner cohesion 2.42 1.86 4.11 1.20 0.74 1.11 2.78 1.84Shared cohesion 1.24 1.67 2.86 2.06 0.69 1.01 2.67 1.76Firm tie diversity 0.73 0.18 0.85 0.07 0.66 0.21 0.77 0.12Partner tie diversity 0.47 0.34 0.75 0.14 0.05 0.16 0.27 0.30Prospective diversity 0.77 0.12 0.85 0.06 0.71 0.15 0.77 0.12Partner’s Partner tie diversity 0.32 0.41 0.79 0.26 0.34 0.39 0.73 0.28 Controls Type= research 0.31 0.46 0.21 0.41 0.22 0.42 0.33 0.47 finance 0.16 0.37 0.28 0.45 0.47 0.50 0.27 0.44 commercialization 0.27 0.44 0.25 0.43 0.18 0.38 0.24 0.43 licensing 0.26 0.44 0.25 0.44 0.13 0.34 0.16 0.37Form= biomedical 0.25 0.43 0.10 0.29 University/Non-profit 0.15 0.36 0.15 0.35 government 0.04 0.20 0.10 0.30 Venture Capital 0.33 0.47 0.25 0.44 Pharmaceutical 0.23 0.42 0.40 0.49Age 9.71 5.61 14.93 5.38 7.67 4.57 11.10 5.14Size 568.72 1200.38 2588.15 2164.92 191.70 584.00 681.33 1449.18Governance 0.77 0.42 0.95 0.21 0.68 0.47 0.88 0.33

52
Appendix II, Table A2: 1-mode attachments: McFadden Multi-probability Model estimates* new attachments repeat attachments
(1) (2) (3) (4) (5) Independent variables: Accumulative Advantage Partner Degree .0412**
(.0058) .0618** (.0085)
.0603** (.0086)
-.0037 (.0107)
.0014 (.0151)
New Partner .1558 (.1177)
.1463 (.1172)
.1550 (.1172)
2.3936** (.5917)
2.4770** (.6080)
Partner Experience -.0537** (.0128)
-.0474** (.0128)
-.0477** (.0130)
-.1429** (.0420)
-.1529** (.0447)
Prior Ties .3286** (.0556)
.3799** (.0602)
Prior Experience -.2984** (.0947)
-.3632** (.1027)
Homophily Collaborative distance -.0270~
(.0142) -.0297* (.0149)
-.0262~ (.0153)
.0513~ (.0293)
.0684* (.0311)
Age difference .0353** (.0088)
.0336** (.0097)
.0492** (.0115)
.1288** (.0337)
.1117** (.0344)
Size difference** .0182** (.0045)
.0163** (.0046)
.0303** (.0062)
.0011 (.0011)
.0012 (.0012)
Governance Similarity -.1458 (.0892)
-.1238 (.0901)
-.1323 (.0906)
.7119~ (.3909)
.4917 (.4140)
Co-location .6681** (.0947)
.6576** (.0952)
.6566** (.0954)
.7379* (.2891)
.8580** (.2960)
Partner’s Partner Collaborative Distance -.0027 (.0144)
-.0023 (.0145)
-.0021 (.0146)
.5245** (.0584)
.5079** (.0601)
Partner’s Partner Age Difference -.0192 (.0118)
-.0116 (.0119)
.0830* (.0331)
.0612 (.0409)
.0893* (.0437)
Partner’s Partner Size Difference -.0089 (.0056)
-.0083 (.0056)
-.0504* (.0247)
-.0052** (.0018)
-.0425* (.0188)
Partner’s Partner Governance Similarity -.0237 (.1429)
-.0143 (.1443)
-.0160 (.1450)
.6094
.5605 1.0179~ (.5770)
Partner’s Partner Co-Location .2579~ (.1334)
-.2374~ (.1340)
.2210~ (.1343)
-.7763 (.4950)
-.9146~ (.5146)
Follow-the-trend Dominant Trend
22.4007** (2.4351)
16.4288** (3.3135)
15.3775** (3.3216)
-21.5871* (10.0363)
-25.0997** (10.3612)
Dominant Type 2.7150** (.1515)
2.1221** (.1617)
2.1213** (.1632)
3.8823** (.6569)
3.9045** (.6931)

53
Multiconnectivity Partner Cohesion .3594**
(.0457) .0419 (.1481)
.0543 (.1466)
.9512** (.1919)
1.0824** (.2093)
Shared Cohesion .0566* (.0271)
.1518** (.0535)
.1458** (.0535)
.0978 (.0799)
.0783 (.0824)
Partner Tie Diversity 2.0492** (.2785)
2.8440** (.9773)
2.1283* (1.0408)
1.5821 (1.4550)
1.9676 (1.4345)
Prospective Tie diversity -2.7991 (1.5170)
20.2502** (5.6211)
82.7609** (21.4090)
-30.3778** (10.6104)
-29.5611** (10.5284)
Partner’s Partner Tie Diversity .4118 (.4286)
1.0324~ (.6031)
.8897 (.6018)
-5.8047** (1.4601)
-6.8265** (1.6196)
Contingencies*** Firm age x Partner degree -.0021**
(.0005) -.0021** (.0006)
Firm age x Shared cohesion -.0107* (.0048)
-.0103* (.0048)
Firm cohesion x Partner cohesion .0975** (.0346)
.1275** (.0357)
Firm cohesion x Prospective diversity -8.9460** (2.0969)
-27.6005** (6.4403)
Period & Timeline Effects Period3 x age difference -.0423*
(.0186)
Period3 x size difference -.0184** (.0068)
Period3 x Partner cohesion -.2068* (.0835)
Period3 x Partner diversity 4.0306* (1.9870)
Period3 x Prospective diversity -69.9582** (22.3349)
Period3 x Firm cohesion x Prospective diversity 21.4625** (6.9130)
Timeline x Partner’s Partner age difference -.0106** (.0037)
Timeline x Partner’s Partner size difference .0044~ (.0024)
LR chi-sq (df) 1498 (21) 1692 (27) 1767 (35) 498 (23) 522 (25) Pseudo-R2 .17 .19 .21 .60 .64 N 966 373 *The significance levels are ~=pvalue<.10, *=pvalue<.05, **=pvalue<.01. All models include fixed effects for firm, year, and type. **Size is divided by 100. ***Contingencies for activity type were included in models 2 and 3. They are available from Kenneth Koput.

54
Appendix II, Table A3: 2-mode attachments: McFadden Multi-probability Model estimates*
new attachments repeat attachments (1) (2) (3) (4) (5) (6) Independent variables: Accumulative Advantage Partner Degree -.0859**
(.0100) .0128 (.0100)
.0142 (.0106)
.0072 (.0079)
.0122 (.0081)
.0062 (.0082)
New Partner .5081** (.1167)
.7974** (.1350)
.6150** (.1669)
-.2385 (.5891)
-.2313 (.5772)
-.2323 (.5799)
Partner Experience -.2140** (.0150)
-.1535** (.0173)
-.1381** (.0179)
-.1453** (.0366)
-.15276** (.0369)
-.1819** (.0379)
Prior Ties .2327** (.0162)
.2448** (.0168)
.2470** (.0168)
Prior Experience -.1480** (.0265)
.0921 (.0717)
.1108 (.0726)
Homophily Collaborative distance .1794**
(.0124) .0386** (.0126)
.0449** (.0127)
.0168~ (.0100)
.0120 (.0102)
.0188~ (.0104)
Partner’s Partner Tie Distance -.0836** (.0124)
-.0089 (.0124)
-.0083 (.0124)
.2766** (.0221)
.2806** (.0234)
.3077** (.0248)
Partner’s Partner Age Difference .0048 (.0133)
.0435** (.0163)
.0430** (.0162)
.1497** (.0229)
.1525** (.0235)
.1498** (.0237)
Partner’s Partner Size Difference .0033* (.0013)
.0441** (.0122)
.0415** (.0123)
-.0088 (.0157)
-.0048 (.0157)
-.0139 (.0162)
Partner’s Partner Governance Simi-larity
.2690* (.1232)
.2316 (.1898)
.2685 (.1903)
-.6362** (.2451)
-.6019* (.2536)
-.6873** (.2550)
Partner’s Partner Co-Location .0938 (.1327)
-.0934 (.1763)
-.1475 (.1765)
-2.0462** (.2758)
-2.1407** (.2857)
-2.1807** (.2870)
Follow-the-trend Dominant Trend
6.2637** (.4811)
3.8608** (1.0541)
-3.7647** (1.0656)
-12.2855** (1.1006)
-12.1924** (1.3070)
-12.3164** (1.3330)
Dominant Type 2.5418** (.1288)
1.5736** (.1533)
1.5962** (.1541)
2.9147** (.2070)
3.0110** (.2136)
3.0718** (.2169)
Multiconnectivity Partner Cohesion .5114**
(.0622) 2.1824** (.1907)
3.29161** (.5708)
.0771 (.1064)
.3877* (.1871)
1.5000* (.7250)
Shared Cohesion 1.6624** (.0701)
4.3605** (.2038)
4.423** (.2183)
.6444** (.1239)
1.0000** (.1889)
2.1678** (.5974)
Partner Tie Diversity 3.6399** (.2189)
1.0723 (.7584)
2.9030** (.2002)
1.9538** (.3255)
1.8883** (.3400)
-1.303~ (.7559)
Prospective tie diversity -12.4229** (.6607)
4.8200** (1.6773)
1.1967 (1.8764)
-4.8813** (1.6806)
7.8716~ (4.2148)
9.9173* (4.6065)
Partner’s Partner Tie Diversity -1.3459** (.3385)
-8.0500** (.7161)
-8.3912** (.7372)
-4.1571** (.8235)
-.9626 (2.3109)
-5.2848~ (2.7551)
Contingencies*** Firm cohesion x Prior experience -.0607**
(.0162) -.0641** (.0163)
Firm cohesion x Partner cohesion -.6429** (.0654)
-1.1419** (.2234)
-.1186* (.0572)
-.4833* (.2400)
Firm cohesion x Shared cohesion -.1650** (.0624)
-.1655* (.0648)
Firm cohesion x Partner tie diversity -.1523 (.1834)
-.9175** (.2418)
Firm cohesion x Prospective diversity -5.1134** (.8105)
-3.3183** (.9022)
Firm cohesion x Partner’s Partner tie diversity
.9610** (.1631)
1.0233** (.1673)
Firm tie diversity x Partner tie diversity -2.4258** (.9173)
-1.5786~ (.9318)
Firm tie diversity x Prospective diver-sity
-13.3864** (2.6567)
-17.1266** (2.9355)
-22.3118** (7.7478)
-26.5231** (8.3263)
Firm tie diversity x Partner’s Partner tie diversity
-1.9205** (.7013)
-1.7864* (.7050)
-7.0456* (3.1050)
-7.5804* (3.2204)

55
Period & Timeline Effects Period3 x New Partner .5656*
(.2230)
Period3 x Prospective diversity 11.7024** (4.0933)
Period3 x Firm cohesion x Partner diversity
1.2202** (.3217)
Period3 x Firm cohesion x Prospective diversity
-6.0453** (1.8644)
Period3 x Firm diversity x Prospective diversity
14.2706* (6.9727)
Timeline x Partner cohesion -.1365* (.0610)
-.1247~ (.0748)
Timeline x Firm cohesion x Partner cohesion
.0573* (.0231)
.0398~ (.0241)
Timeline x Shared cohesion -.1336* (.0666)
Timeline x Partner tie diversity .4078** (.0895)
Timeline x Partner’s Partner tie di-versity
.6417** (.2020)
LR chi-square (df) 5970 (17) 8893 (40) 9059 (48) 2231 (18) 2289 (24) 2347 (29) Pseudo-R2 .32 .49 .51 .47 .49 .51 N 1500 1068
*Significance levels are *=pvalue<.05; **=pvalue<.01. All models include fixed effects for firm, year, and type, as well as main effects for form. **Size is divided by 100. ***Form and type contingencies were also included in the model. They are available from Kenneth Koput.
FIGURES
Figure 1. Life Science Patents Assigned to Biotechnology Firms and Research Universities, 1979-1999
0
200
400
600
800
1000
1200
1400
1600
1800
1976
1977
1978
1979
1980
1981
19821983
19841985
1986
1987
1988
1989
1990
1991
1992
1993
1994
1995
1996
1997
19981999
BiotechUniversity

56
Activity Volume by Organizational Form 1988, 1993, 1997
0
200
400
600
800
1000
1200
1988 DB
F
1993 DB
F
1997 DB
F
1988 PR
O
1993 PR
O
1997 PR
O
1988 Gov
1993 Gov
1997 Gov
1988 VC
1993 VC
1997 VC
1988 Pharm
a
1993 Pharm
a
1997 Pharm
a
COMLICFINR&D
Percentage of Activity by Organzational Form 1988, 1993, 1997
0%
20%
40%
60%
80%
100%
1988 DB
F
1993 DB
F
1997 DB
F
1988 PRO
1993 PRO
1997 PRO
1988 Gov
1993 Gov
1997 Gov
1988 VC
1993 VC
1997 VC
1988 Pharma
1993 Pharma
1997 Pharma
COMLICFINR&D
Figure 2. Distribution of Organizational Forms and Activities, 1988, 1993, 1997

57
Figure 3. Degree Distributions by Type of Partner

58
Figure 4. 1988 Main component, all ties Key For All Figures CYAN NODE = DBF ORANGE = PRO BROWN = Gov’t YELLOW = Pharma GRAY = VC WHITE = Other Triangle = New Entrant Circle = Incumbent Node size = standardized network degree, constant within figures RED TIE= R&D GREEN = FINANCE BLUE = COMMERCIAL . . MAGENTA = LICENS-ING

59
Figure 5. 1989 Main Component, New Ties

60
Figure 6. 1993 Main Component, All Ties

61
Figure 7, 1994 Main Component, New Ties

62
Figure 8. 1997 Main Component, All Ties

63
Figure 9. 1998 Main Component, New Ties

64
Figure 10. 1997 All Ties, Main Component, Nodes Colored by Cohesion
Node Key Size scaled to cohesion Red = five component Green = 3 or 4 component Blue = 1 or 2 component

65
Key
Figure 11. 1998 New Ties, Main Component, Colored by Cohesion
N
Blue
Green
Red
# Ties # Nodes
1074 749
136 477
304 160
634 112
Size scaled to 1997 cohesion Triangles = New Entrants (e.g. 0 component in 1997)


