Pulse Connect Secure...Pulse Connect Serviceは、完全なエンドツーエンドレイヤーセキュリティを提供します。これには、エンドポイントクライアント、デ
© Juniper Networks, Inc. 1
Network Connect & Junos Pulse Performance Logs on Windows
How-to
Network Connect & Pulse Performance Logs on Windows
© Juniper Networks, Inc. 2
Table of Contents Introduction Part 1: Client Prerequisites ...................................................................................................... 3
• Step 1.1: Packet Sniffer.................................................................................................. 3 • Step 1.2: Output IPs, Routes, Ping, Trace Route ........................................................ 3 • Step 1.3: Delete Client-Side Log Files ........................................................................... 5 • Step 1.4: Timezone of the Client ................................................................................... 5
Part 2: Server Prerequisites ..................................................................................................... 6 • Step 2.1: Enable Replay Protection............................................................................... 6 • Step 2.2: Disable the Upload Logs feature ................................................................... 6 • Step 2.3: Bandwidth Management ................................................................................ 7 • Step 2.4: FTP .................................................................................................................. 8 • Step 2.4: Additional Information ................................................................................... 8
Part 3: Log Gathering Procedure ............................................................................................. 9 • Step 3.1: Enable Server-Side Logging .......................................................................... 9
o Step 3.1.1: Enable Server-Side Logging for NC client log files ........................ 9 o Step 3.1.2: Debuglog ........................................................................................... 9 o Step 3.1.3: SA TCP Dump .................................................................................... 10
• Step 3.2: Enable Client-Side Logging ........................................................................... 11 o Step 3.2.1: Start Packet Sniffer on the Local Client Adapter ............................ 11 o Step 3.2.2: Start Packet Sniffer on the Juniper Virtual Adapter ....................... 12
• Step 3.3: Enable Application Server Packet Sniffer ..................................................... 12 • Step 3.4: Reproduce the Issue ...................................................................................... 12 • Step 3.5: Turn off Server-Side Logging and Collect Log Files .................................... 14
o Step 3.5.1: SA TCP Dump .................................................................................... 14 o Step 3.5.2: System Snapshot .............................................................................. 14 o Step 3.5.3: User Access Log, Event Log, and Administrator Log .................... 15 o Step 3.5.4: Disable Server-Side Logging for NC client log files ....................... 15
• Step 3.6: Turn off Client-Side Logging and Collect Log Files ..................................... 15 o Step 3.2.1: Stop Packet Sniffer on the Local Client Adapter ............................ 16 o Step 3.2.2: Stop Packet Sniffer on the Juniper Virtual Adapter ........................ 16 o Step 3.6.3: Collect Client-Side Log Files ............................................................ 17 o Step 3.6.4: Output of the Route Table and IP Address...................................... 17
• Step 3.7: Turn off Application Server Packet Sniffer and Save Capture .................... 18
Network Connect & Pulse Performance Logs on Windows
© Juniper Networks, Inc. 3
Introduction The procedure outlined in this document describes the process of enabling and collecting the required log files which are required by Juniper Support in order to troubleshoot slowness issues over the Network Connect (NC) or Junos Pulse VPN tunnel. These log collection requirements outlined in this document do NOT apply to installation, launch, or access related issues. Junos Pulse combines the features of Odyssey Access Client for LAN access, Network Connect or the SRX client software for WAN access, and WX client software for application acceleration services. Users of mobile devices (smartphones) can also enable Junos Pulse for secure connectivity to a Secure Access Appliance. In this case, please note that any and all references made to Junos Pulse (Pulse) within the contents of this document specifically refer to the feature which allows for a Layer 3 VPN connection to the Junos Pulse Secure Access Appliance on a Windows Desktop.
Part 1: Client Prerequisites Please ensure that we use the same client machine is used for the entire process outlined in this document.
Step 1.1: Packet Sniffer
Packet Sniffers are programs which can be used for capturing live traffic on a client network. There are several packet sniffers available today for a price and which are also free for download and use. Juniper Networks does not assume any responsibility for the selection of or use of these third party sites and products, so we do ask that you take the time to evaluate and gain the necessary approval needed to install such a program on the designated client machine and Application Server (if possible) prior to starting the log gathering process. Please ensure that the packet sniffer which you chose will allow you to save the TCP capture in either pcap or tcpdump(.dmp) format. Such a packet sniffer will be required by Juniper Support in order to validate the traffic pattern(s) and behavior on the client machine’s local network.
While Juniper Networks does not advocate or condemn the use of any such packet sniffer in particular, we commonly suggest the use of Wireshark as the full version is freely available for commercial use and it is supported on a wide range of platforms (Windows, MAC OS, Linux, and so forth). See Wireshark’s FAQ for additional details.
Step 1.2: Output of IPs, Routes, Ping, and Trace Route
IP Addresses
A print out of the IP Addressing assigned to the interface(s) and on the client will allow us to determine the network details for each interface currently in use on the client prior to setting up the VPN tunnel.
Routes
The Routing Table will confirm where data packets traveling over the client’s network is normally directed when the Juniper VPN is not in use.
Ping
In order to determine if there is any latency of the SA over the Wide Area Network (WAN), we will need to run the ping command to measure the response times.
Trace Route
Because the number of hops in between the client and the server can have an impact on latency, we suggest collecting a trace route so this can be confirmed.
To collect this data from a Windows client:
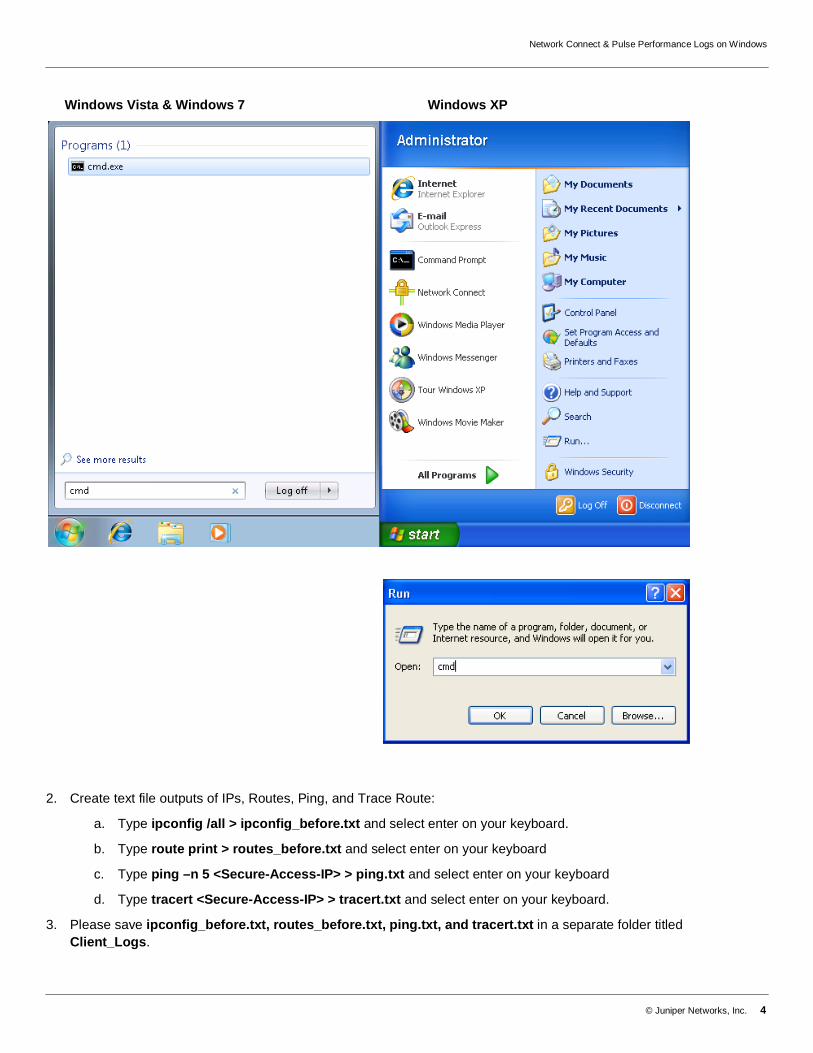
1. Open the command prompt:
a. Windows Vista/Windows 7: Select Start and type cmd in the search bar
b. Windows XP: Select Start > Run and type cmd in the run prompt
Network Connect & Pulse Performance Logs on Windows
© Juniper Networks, Inc. 4
Windows Vista & Windows 7 Windows XP
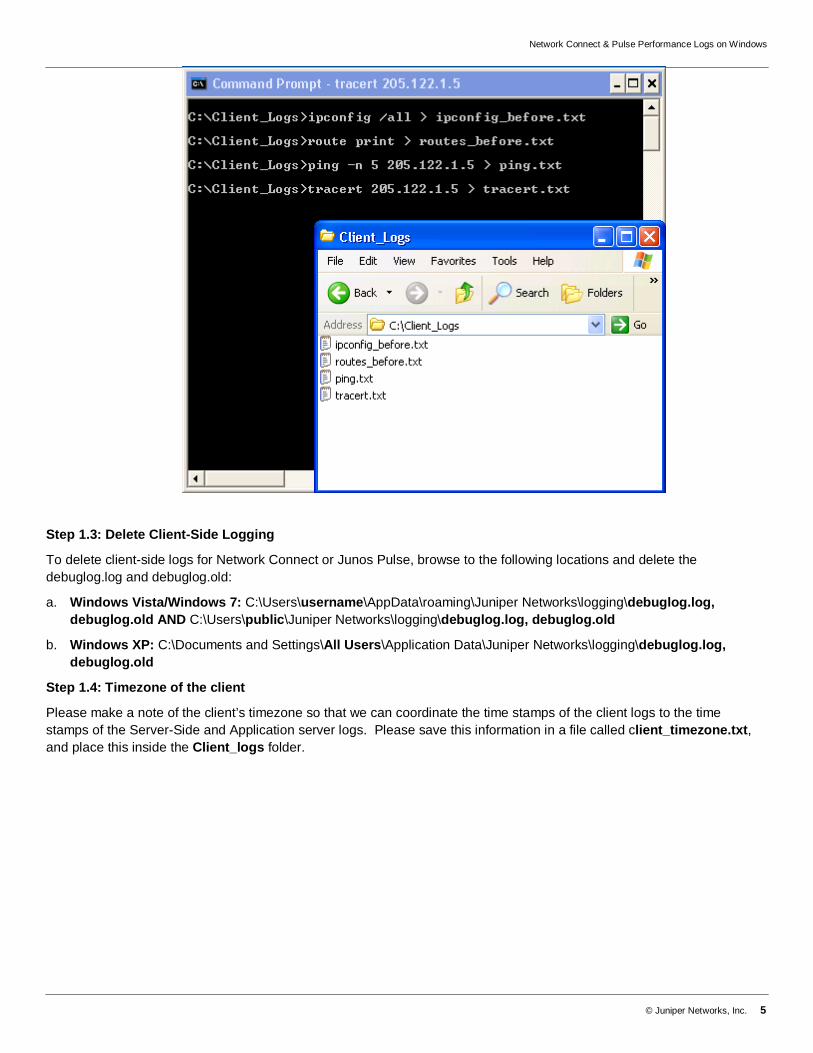
2. Create text file outputs of IPs, Routes, Ping, and Trace Route:
a. Type ipconfig /all > ipconfig_before.txt and select enter on your keyboard.
b. Type route print > routes_before.txt and select enter on your keyboard
c. Type ping –n 5 <Secure-Access-IP> > ping.txt and select enter on your keyboard
d. Type tracert <Secure-Access-IP> > tracert.txt and select enter on your keyboard.
3. Please save ipconfig_before.txt, routes_before.txt, ping.txt, and tracert.txt in a separate folder titled Client_Logs.
Network Connect & Pulse Performance Logs on Windows
© Juniper Networks, Inc. 5
Step 1.3: Delete Client-Side Logging
To delete client-side logs for Network Connect or Junos Pulse, browse to the following locations and delete the debuglog.log and debuglog.old:
a. Windows Vista/Windows 7: C:\Users\username\AppData\roaming\Juniper Networks\logging\debuglog.log, debuglog.old AND C:\Users\public\Juniper Networks\logging\debuglog.log, debuglog.old
b. Windows XP: C:\Documents and Settings\All Users\Application Data\Juniper Networks\logging\debuglog.log, debuglog.old
Step 1.4: Timezone of the client
Please make a note of the client’s timezone so that we can coordinate the time stamps of the client logs to the time stamps of the Server-Side and Application server logs. Please save this information in a file called client_timezone.txt, and place this inside the Client_logs folder.
Network Connect & Pulse Performance Logs on Windows
© Juniper Networks, Inc. 6
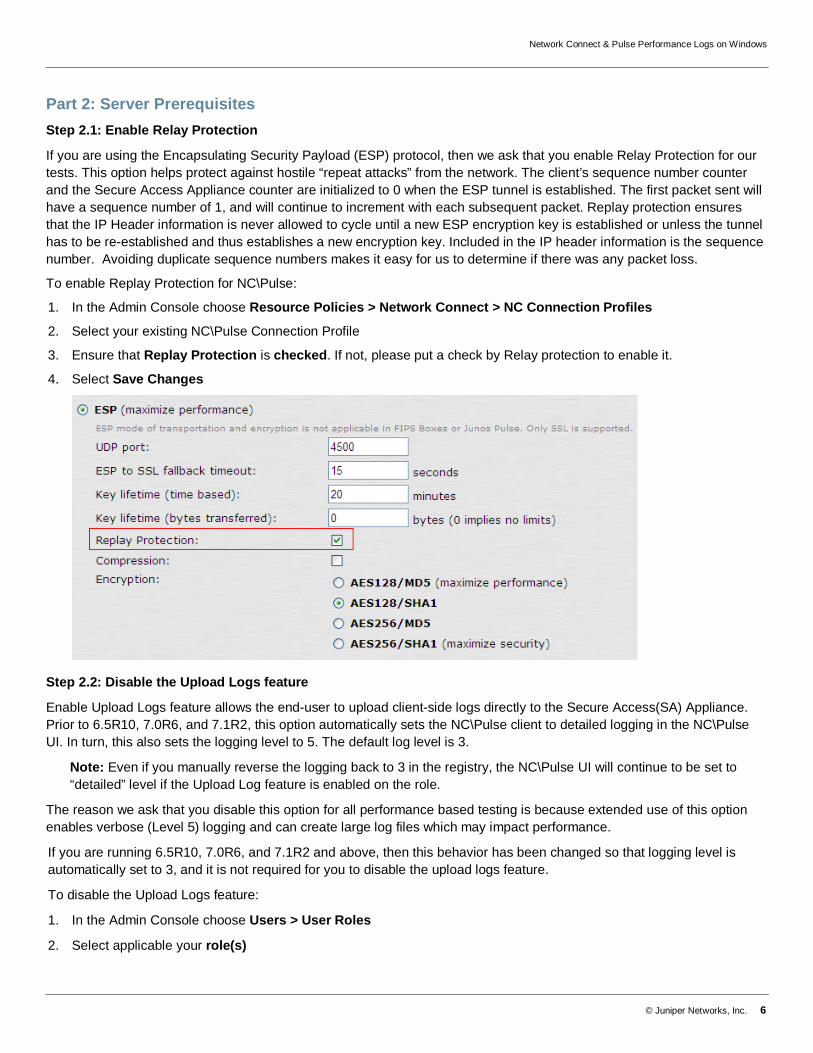
Part 2: Server Prerequisites Step 2.1: Enable Relay Protection
If you are using the Encapsulating Security Payload (ESP) protocol, then we ask that you enable Relay Protection for our tests. This option helps protect against hostile “repeat attacks” from the network. The client’s sequence number counter and the Secure Access Appliance counter are initialized to 0 when the ESP tunnel is established. The first packet sent will have a sequence number of 1, and will continue to increment with each subsequent packet. Replay protection ensures that the IP Header information is never allowed to cycle until a new ESP encryption key is established or unless the tunnel has to be re-established and thus establishes a new encryption key. Included in the IP header information is the sequence number. Avoiding duplicate sequence numbers makes it easy for us to determine if there was any packet loss.
To enable Replay Protection for NC\Pulse:
1. In the Admin Console choose Resource Policies > Network Connect > NC Connection Profiles
2. Select your existing NC\Pulse Connection Profile
3. Ensure that Replay Protection is checked. If not, please put a check by Relay protection to enable it.
4. Select Save Changes
Step 2.2: Disable the Upload Logs feature
Enable Upload Logs feature allows the end-user to upload client-side logs directly to the Secure Access(SA) Appliance. Prior to 6.5R10, 7.0R6, and 7.1R2, this option automatically sets the NC\Pulse client to detailed logging in the NC\Pulse UI. In turn, this also sets the logging level to 5. The default log level is 3.
Note: Even if you manually reverse the logging back to 3 in the registry, the NC\Pulse UI will continue to be set to “detailed” level if the Upload Log feature is enabled on the role.
The reason we ask that you disable this option for all performance based testing is because extended use of this option enables verbose (Level 5) logging and can create large log files which may impact performance.
If you are running 6.5R10, 7.0R6, and 7.1R2 and above, then this behavior has been changed so that logging level is automatically set to 3, and it is not required for you to disable the upload logs feature.
To disable the Upload Logs feature:
1. In the Admin Console choose Users > User Roles
2. Select applicable your role(s)
Network Connect & Pulse Performance Logs on Windows
© Juniper Networks, Inc. 7
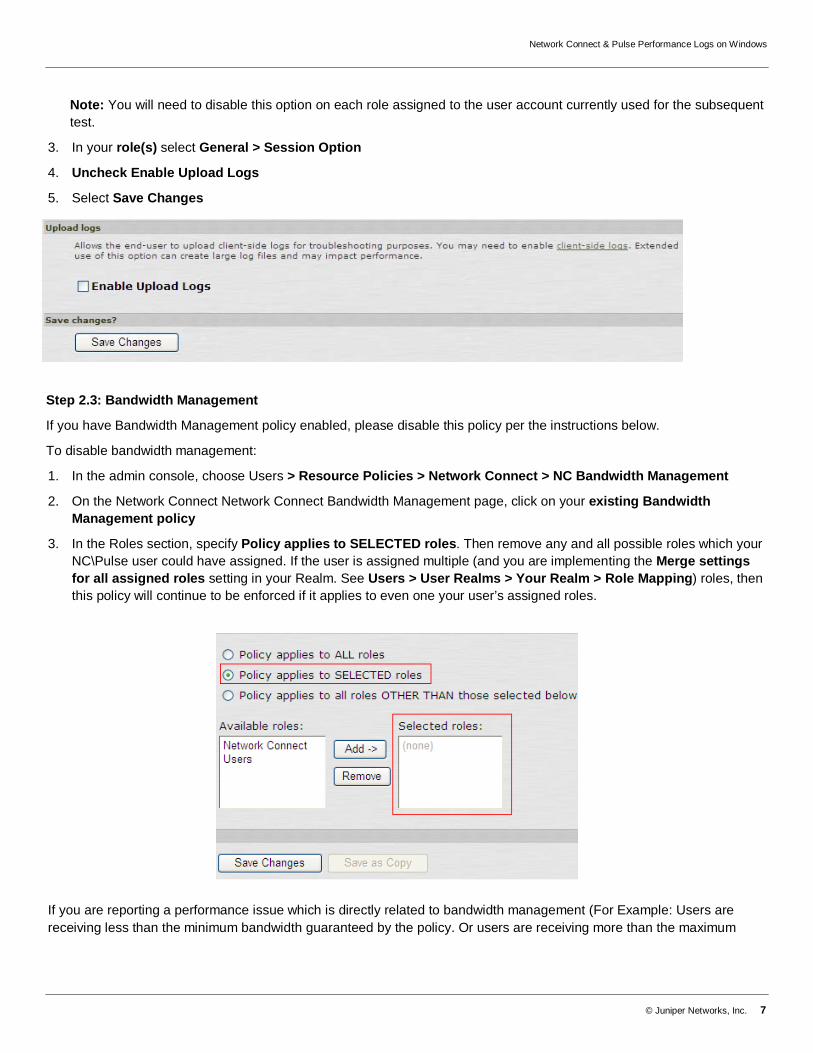
Note: You will need to disable this option on each role assigned to the user account currently used for the subsequent test.
3. In your role(s) select General > Session Option
4. Uncheck Enable Upload Logs
5. Select Save Changes
Step 2.3: Bandwidth Management
If you have Bandwidth Management policy enabled, please disable this policy per the instructions below.
To disable bandwidth management:
1. In the admin console, choose Users > Resource Policies > Network Connect > NC Bandwidth Management
2. On the Network Connect Network Connect Bandwidth Management page, click on your existing Bandwidth Management policy
3. In the Roles section, specify Policy applies to SELECTED roles. Then remove any and all possible roles which your NC\Pulse user could have assigned. If the user is assigned multiple (and you are implementing the Merge settings for all assigned roles setting in your Realm. See Users > User Realms > Your Realm > Role Mapping) roles, then this policy will continue to be enforced if it applies to even one your user’s assigned roles.
If you are reporting a performance issue which is directly related to bandwidth management (For Example: Users are receiving less than the minimum bandwidth guaranteed by the policy. Or users are receiving more than the maximum

Network Connect & Pulse Performance Logs on Windows
© Juniper Networks, Inc. 8
bandwidth allotted by their policy), then please keep in mind that Part 3 of this document will need to be performed twice: Once with the Bandwidth Management policy enabled and again with the Bandwidth Management policy disabled.
Step 2.4: FTP
If possible, we recommend that you setup an FTP server environment and allow the NC\Pulse user (who will be performing the steps in this document) the ability to access the designated FTP server. You can also use an existing FTP server if you already have one which is enabled and functioning. Before proceeding to Part 3 of this document, please ensure that you have verified the following:
a) Both download and upload to this FTP server is allowed and functioning for the designated test user.
b) If your application uses a GUI interface, you observe a “slight” improvement of the command line FTP application as it lacks the additional overhead associated with a GUI. If you do not observe at least equal or slight improvement in performance when using command line ftp, then ftp will not be of any assistance to us. Likely, there are other external factors which could be introducing additional latency to the network hosting the FTP server and or the Application server. Please rule out any such factors before proceeding with ftp.
Assuming the above criteria have been met, we can then use command line ftp as a baseline to compare the performance of your application. This can also help us to identify and isolate if the issue lies between the client and the SA or between the SA and the Application Server for the problem application. Please note that we do not “require” the use of FTP (as we understand this option cannot be enabled in some production environments), but it is strongly recommended for the reasons already stated above.
Step 2.5: Additional Information
Please provide the following information in addition to the Logs above:
1. Is the SA in a Cluster? If so, is it Active/Active (A/A) or Active/Passive (A/P)?
2. If this is in an A/A Cluster, can you replicate without the Load Balancer?
3. Time zone of the SA
4. Screenshot of the Dashboard\Central Manager Graph on the SA (System > Status > Overview)
5. Network Topology Diagram which labels each device by name and IP Address.
6. Please confirm if slowness is visible for download, upload or both?
7. What are we comparing NC\Pulse slowness to (Third Party VPN, Internal Corporate Access, or similar Secure Access setup)?
Please save this information in a file called sa_info.doc.

Network Connect & Pulse Performance Logs on Windows
© Juniper Networks, Inc. 9
Part 3: Log Gathering Procedure Step 3.1: Enable Server-Side Logging
The following log files must be enabled from the Junos Pulse Secure Access Appliance.
Step 3.1.1: Enable Server-Side logging for NC\Pulse client log files
Client-side logging is useful for debugging problems with an SA Series Appliance client-side feature such as Network Connect or Junos Pulse. When you enable logging Network Connect, the Appliance writes a log to any client computer that uses either Network Connect or Pulse. These settings are global, which means that the SA Series Appliance writes a log file to all clients that use the enabled feature. The Appliance then appends to the log file each time the feature is invoked during subsequent user sessions. Please note that logging on the client will be automatically enabled at level 3.
To enable Client-Side logging:
1. In the Admin Console choose System > Log/Monitoring > Client Side Logs > Settings
2. Put a check in Network Connect
3. Select Save Changes
Step 3.1.2: Debuglog
The Server-Side debug logging requested in this document may increase overall system load, so we ask that you enable this option only if one or both criteria are met:
a) The Secure Access currently in use for the following test does not have a heavy Network Connect or Pulse load.
b) JTAC has confirmed that debug logging can enabled.
Debug logs are particularly important in the event of a problem. You will need to set the debug log at a certain level and add the events list as directed below. We can include both the Debuglog and the system configuration in the System Snapshot. The debuglog is encrypted; you cannot view it.
To enable Debuglog:
1. In the Admin Console choose Maintenance > Troubleshooting > Monitoring > Debug
2. Put a check in Debug Logging On
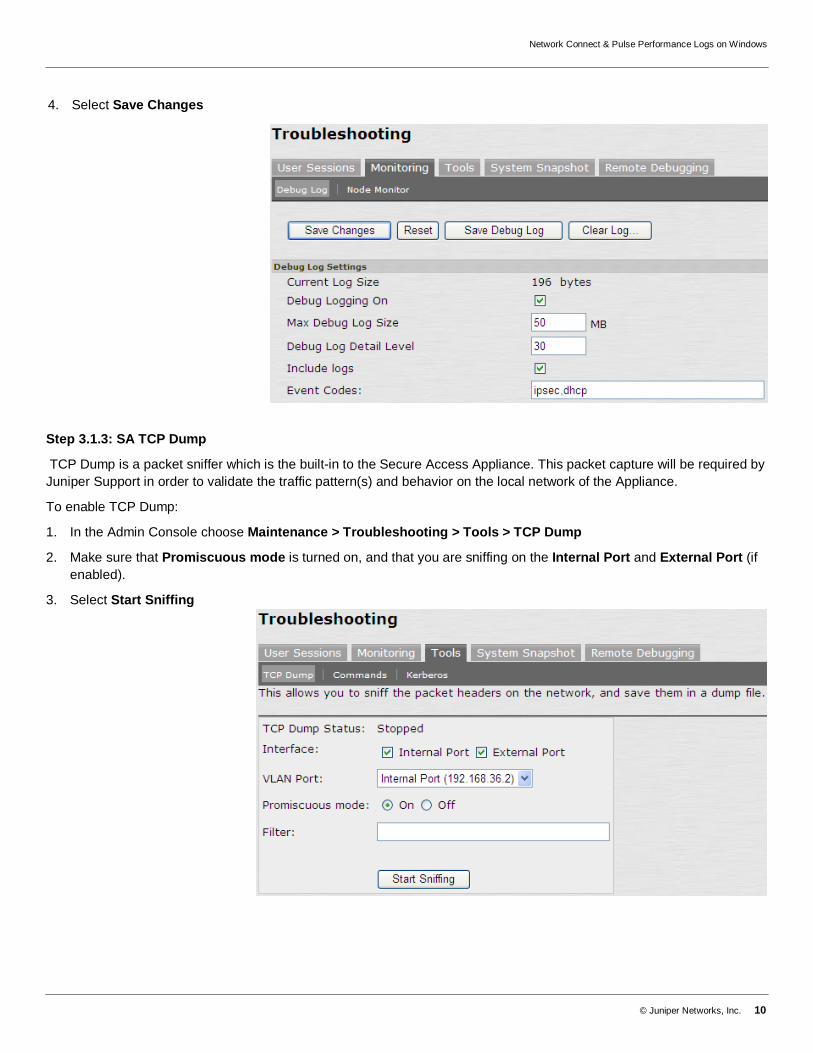
3. Set Max Debug Log Size to 50, Debug Log Detail Level to 30, and Event Codes to ipsec,dhcp (Comma separated, no spaces)
Network Connect & Pulse Performance Logs on Windows
© Juniper Networks, Inc. 10
4. Select Save Changes
Step 3.1.3: SA TCP Dump
TCP Dump is a packet sniffer which is the built-in to the Secure Access Appliance. This packet capture will be required by Juniper Support in order to validate the traffic pattern(s) and behavior on the local network of the Appliance.
To enable TCP Dump:
1. In the Admin Console choose Maintenance > Troubleshooting > Tools > TCP Dump
2. Make sure that Promiscuous mode is turned on, and that you are sniffing on the Internal Port and External Port (if enabled).
3. Select Start Sniffing
Network Connect & Pulse Performance Logs on Windows
© Juniper Networks, Inc. 11
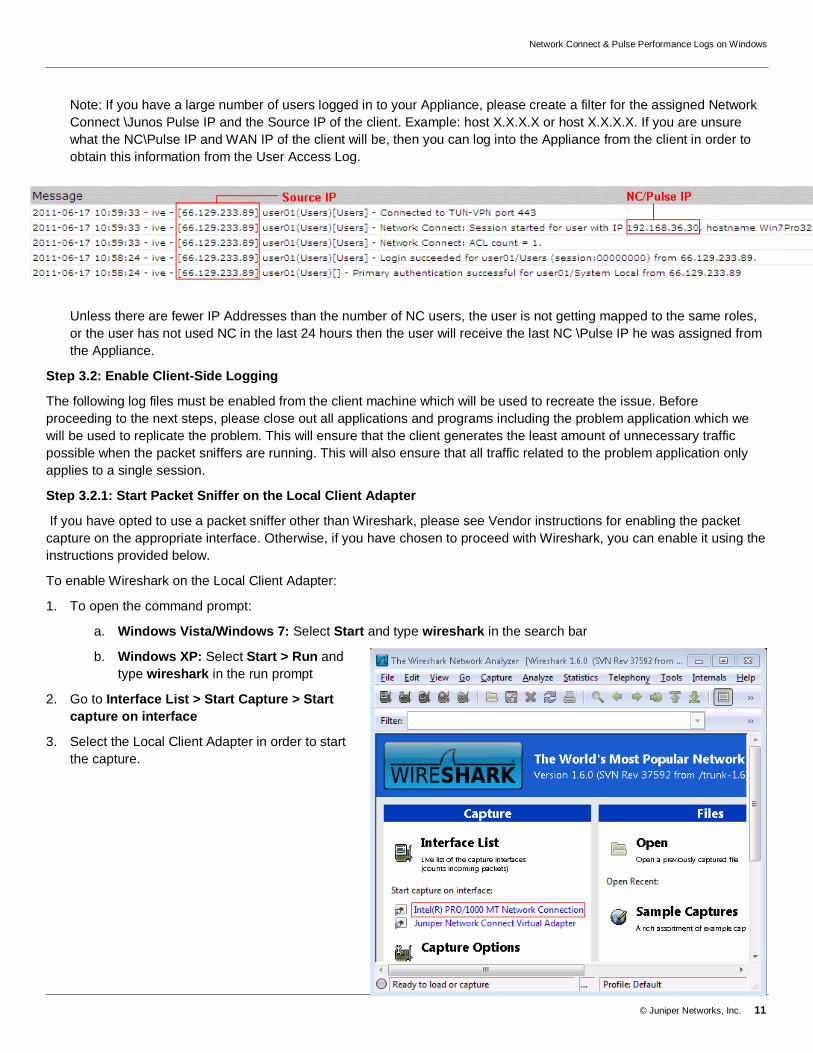
Note: If you have a large number of users logged in to your Appliance, please create a filter for the assigned Network Connect \Junos Pulse IP and the Source IP of the client. Example: host X.X.X.X or host X.X.X.X. If you are unsure what the NC\Pulse IP and WAN IP of the client will be, then you can log into the Appliance from the client in order to obtain this information from the User Access Log.
Unless there are fewer IP Addresses than the number of NC users, the user is not getting mapped to the same roles, or the user has not used NC in the last 24 hours then the user will receive the last NC \Pulse IP he was assigned from the Appliance.
Step 3.2: Enable Client-Side Logging
The following log files must be enabled from the client machine which will be used to recreate the issue. Before proceeding to the next steps, please close out all applications and programs including the problem application which we will be used to replicate the problem. This will ensure that the client generates the least amount of unnecessary traffic possible when the packet sniffers are running. This will also ensure that all traffic related to the problem application only applies to a single session.
Step 3.2.1: Start Packet Sniffer on the Local Client Adapter
If you have opted to use a packet sniffer other than Wireshark, please see Vendor instructions for enabling the packet capture on the appropriate interface. Otherwise, if you have chosen to proceed with Wireshark, you can enable it using the instructions provided below.
To enable Wireshark on the Local Client Adapter:
1. To open the command prompt:
a. Windows Vista/Windows 7: Select Start and type wireshark in the search bar
b. Windows XP: Select Start > Run and type wireshark in the run prompt
2. Go to Interface List > Start Capture > Start capture on interface
3. Select the Local Client Adapter in order to start the capture.

Network Connect & Pulse Performance Logs on Windows
© Juniper Networks, Inc. 12
Step 3.2.2: Start Packet Sniffer on the Juniper Virtual Adapter
If you have opted to use a packet sniffer other than Wireshark, please see Vendor instructions for enabling the packet capture on the appropriate interface. Otherwise, if you have chosen to proceed with Wireshark, you can enable it using the instructions provided below. Please note that if Wireshark was installed before you installed NC\Pulse, then the Juniper Virtual Adapter may not register with Wireshark until after you perform a reboot.
To enable Wireshark on the Juniper Virtual Adapter:
1. To open the command prompt:
a. Windows Vista/Windows 7: Select Start and type wireshark in the search bar
b. Windows XP: Select Start > Run and type wireshark in the run prompt
2. Go to Interface List > Start Capture > Start capture on interface
3. Select the Juniper Virtual Adapter in order to start the capture.
Step 3.3: Application Packet Sniffer
Capture a packet sniffer on the Application Server. This will enable Juniper Support to validate the traffic pattern(s) and also analyze the packet flow between the client and servers.
Step 3.4: Reproduce the Issue
At this point in the Log Gathering process, we can attempt to replicate the performance issues using the designated client machine. We will want to use the same client machine which was used in Part 1 of this document. Please keep all application closed except the problem application. Once you have replicated the issue using the problem application, please close out of the program. If we are able to use FTP, we can now test it out within the same NC\Pulse session.
To open and test out FTP:
1. Open the command prompt:
a. Windows Vista/Windows 7: Select Start and type cmd in the search bar
Network Connect & Pulse Performance Logs on Windows
© Juniper Networks, Inc. 13
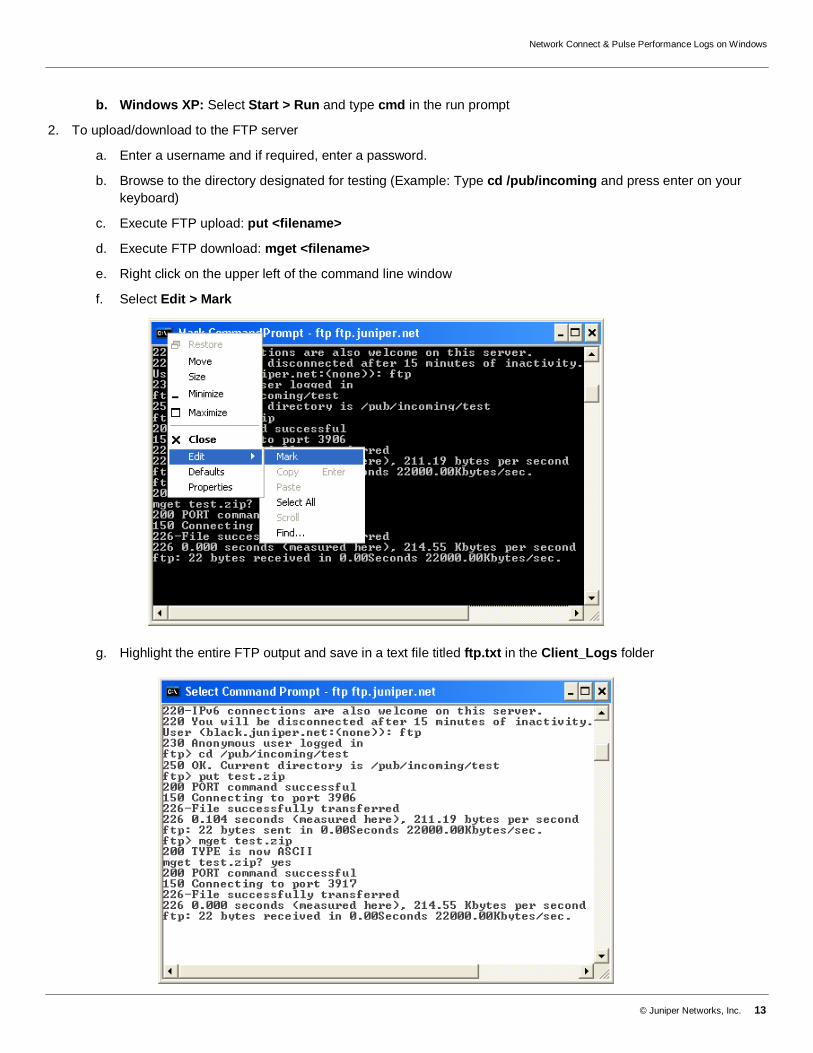
b. Windows XP: Select Start > Run and type cmd in the run prompt
2. To upload/download to the FTP server
a. Enter a username and if required, enter a password.
b. Browse to the directory designated for testing (Example: Type cd /pub/incoming and press enter on your keyboard)
c. Execute FTP upload: put <filename>
d. Execute FTP download: mget <filename>
e. Right click on the upper left of the command line window
f. Select Edit > Mark
g. Highlight the entire FTP output and save in a text file titled ftp.txt in the Client_Logs folder
Network Connect & Pulse Performance Logs on Windows
© Juniper Networks, Inc. 14
Step 3.5: Turn off Server-Side logging and Collect Log files
Once you have replicated the issue, please collect the following log files while NC\Pulse is still connected. Do not disconnect from NC\Pulse until after all of the Server-Side and Client-Side logs files have been collected.
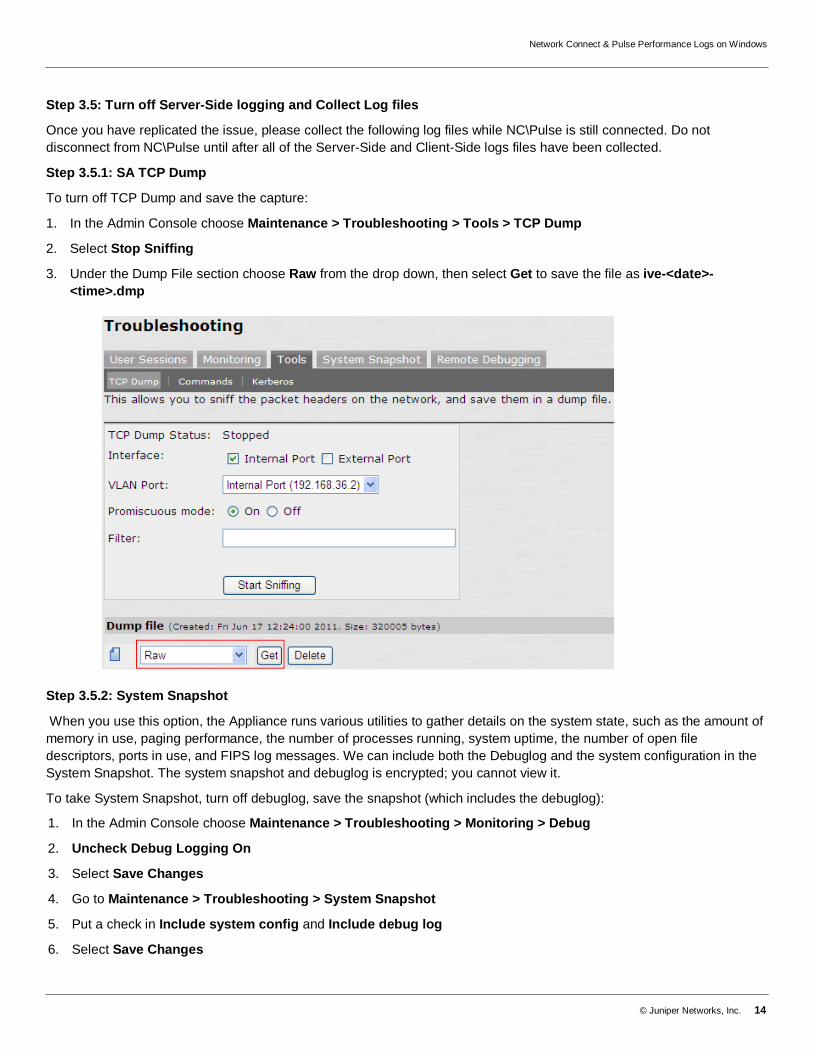
Step 3.5.1: SA TCP Dump
To turn off TCP Dump and save the capture:
1. In the Admin Console choose Maintenance > Troubleshooting > Tools > TCP Dump
2. Select Stop Sniffing
3. Under the Dump File section choose Raw from the drop down, then select Get to save the file as ive-<date>-<time>.dmp
Step 3.5.2: System Snapshot
When you use this option, the Appliance runs various utilities to gather details on the system state, such as the amount of memory in use, paging performance, the number of processes running, system uptime, the number of open file descriptors, ports in use, and FIPS log messages. We can include both the Debuglog and the system configuration in the System Snapshot. The system snapshot and debuglog is encrypted; you cannot view it.
To take System Snapshot, turn off debuglog, save the snapshot (which includes the debuglog):
1. In the Admin Console choose Maintenance > Troubleshooting > Monitoring > Debug
2. Uncheck Debug Logging On
3. Select Save Changes
4. Go to Maintenance > Troubleshooting > System Snapshot
5. Put a check in Include system config and Include debug log
6. Select Save Changes
Network Connect & Pulse Performance Logs on Windows
© Juniper Networks, Inc. 15
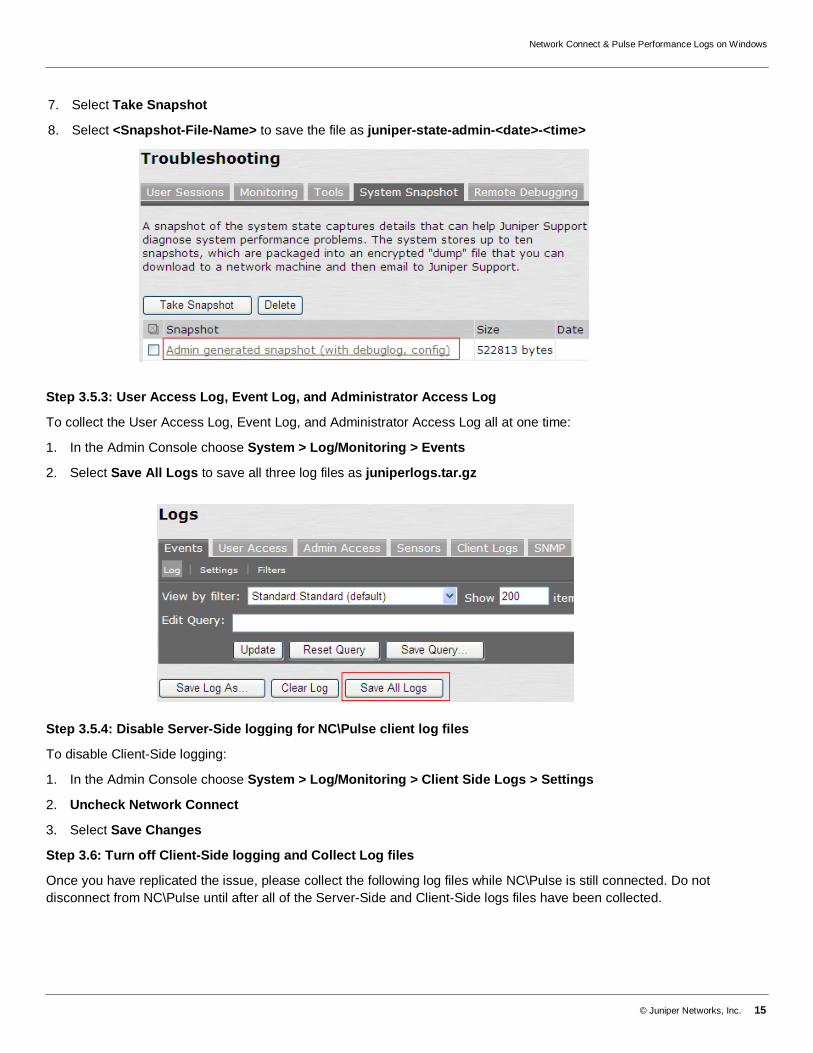
7. Select Take Snapshot
8. Select <Snapshot-File-Name> to save the file as juniper-state-admin-<date>-<time>
Step 3.5.3: User Access Log, Event Log, and Administrator Access Log
To collect the User Access Log, Event Log, and Administrator Access Log all at one time:
1. In the Admin Console choose System > Log/Monitoring > Events
2. Select Save All Logs to save all three log files as juniperlogs.tar.gz
Step 3.5.4: Disable Server-Side logging for NC\Pulse client log files
To disable Client-Side logging:
1. In the Admin Console choose System > Log/Monitoring > Client Side Logs > Settings
2. Uncheck Network Connect
3. Select Save Changes
Step 3.6: Turn off Client-Side logging and Collect Log files
Once you have replicated the issue, please collect the following log files while NC\Pulse is still connected. Do not disconnect from NC\Pulse until after all of the Server-Side and Client-Side logs files have been collected.
Network Connect & Pulse Performance Logs on Windows
© Juniper Networks, Inc. 16
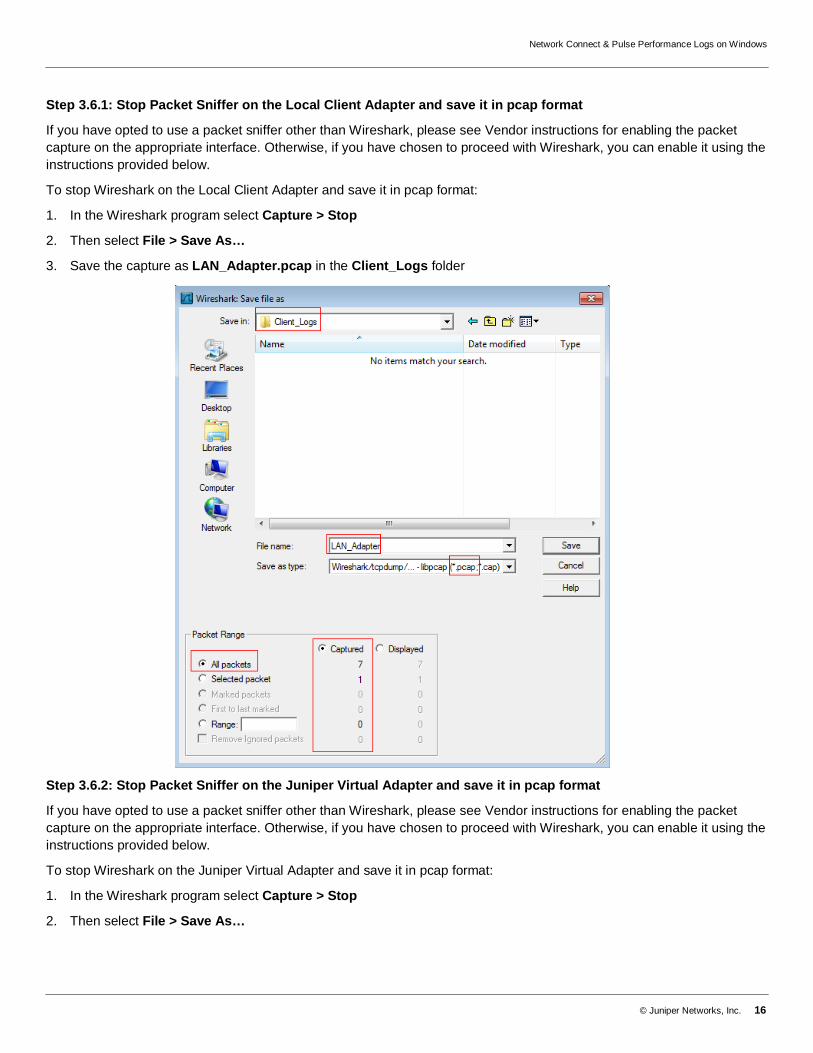
Step 3.6.1: Stop Packet Sniffer on the Local Client Adapter and save it in pcap format
If you have opted to use a packet sniffer other than Wireshark, please see Vendor instructions for enabling the packet capture on the appropriate interface. Otherwise, if you have chosen to proceed with Wireshark, you can enable it using the instructions provided below.
To stop Wireshark on the Local Client Adapter and save it in pcap format:
1. In the Wireshark program select Capture > Stop
2. Then select File > Save As…
3. Save the capture as LAN_Adapter.pcap in the Client_Logs folder
Step 3.6.2: Stop Packet Sniffer on the Juniper Virtual Adapter and save it in pcap format
If you have opted to use a packet sniffer other than Wireshark, please see Vendor instructions for enabling the packet capture on the appropriate interface. Otherwise, if you have chosen to proceed with Wireshark, you can enable it using the instructions provided below.
To stop Wireshark on the Juniper Virtual Adapter and save it in pcap format:
1. In the Wireshark program select Capture > Stop
2. Then select File > Save As…
Network Connect & Pulse Performance Logs on Windows
© Juniper Networks, Inc. 17
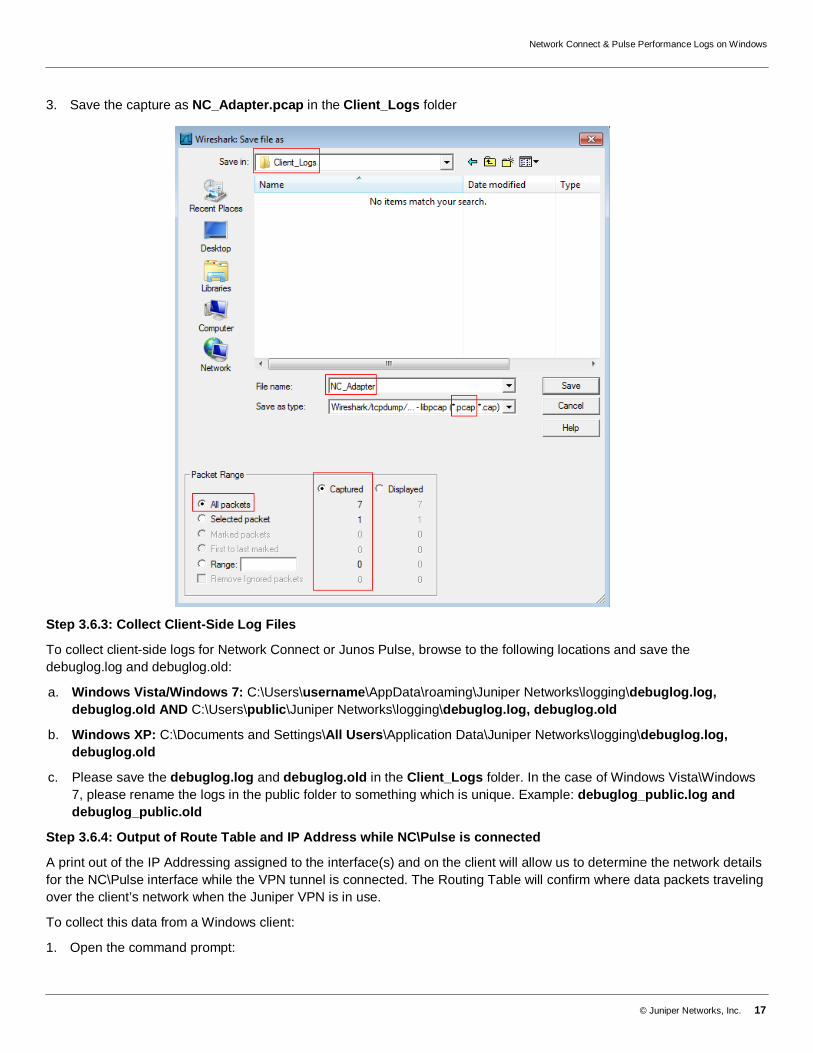
3. Save the capture as NC_Adapter.pcap in the Client_Logs folder
Step 3.6.3: Collect Client-Side Log Files
To collect client-side logs for Network Connect or Junos Pulse, browse to the following locations and save the debuglog.log and debuglog.old:
a. Windows Vista/Windows 7: C:\Users\username\AppData\roaming\Juniper Networks\logging\debuglog.log, debuglog.old AND C:\Users\public\Juniper Networks\logging\debuglog.log, debuglog.old
b. Windows XP: C:\Documents and Settings\All Users\Application Data\Juniper Networks\logging\debuglog.log, debuglog.old
c. Please save the debuglog.log and debuglog.old in the Client_Logs folder. In the case of Windows Vista\Windows 7, please rename the logs in the public folder to something which is unique. Example: debuglog_public.log and debuglog_public.old
Step 3.6.4: Output of Route Table and IP Address while NC\Pulse is connected
A print out of the IP Addressing assigned to the interface(s) and on the client will allow us to determine the network details for the NC\Pulse interface while the VPN tunnel is connected. The Routing Table will confirm where data packets traveling over the client’s network when the Juniper VPN is in use.
To collect this data from a Windows client:
1. Open the command prompt:
Network Connect & Pulse Performance Logs on Windows
© Juniper Networks, Inc. 18
a. Windows Vista/Windows 7: Select Start and type cmd in the search bar
b. Windows XP: Select Start > Run and type cmd in the run prompt
2. Create text file outputs of your local Route Table and IP Address:
a. Type ipconfig /all > ipconfig_after.txt and select enter on your keyboard.
b. Type route print > routes_after.txt and select enter on your keyboard
3. Please save ipconfig_after.txt and after_before.txt in the Client_Logs folder.
Step 3.7: Turn off Application Packet Sniffer and Save Capture
You can save this file as ApplicationServer.pcap.
You can now disconnect from NC\Pulse on the client machine. Please confirm that you have the following log files both from the Server-Side and the Client-Side:
1. ipconfig_before.txt
2. routes_before.txt
3. ping.txt
4. tracert.txt
5. client_timezone.txt
6. sa_info.doc (This contains the additional information and screenshot of Dashboard)
7. ftp.txt (if applicable)
8. ive-<date>-<time>.dmp
9. juniper-state-admin-<date>-<time>
10. juniperlogs.tar.gz
11. ipconfig_after.txt
12. routes_after.txt
13. NC_Adapter.pcap
14. LAN_Adapter.pcap
15. debuglog.log and debuglog.old (if created)
16. In the case of Windows Vista/Windows 7 only you should also have a second set of client logs. (Example: debuglog.log, debuglog.old, debuglog_public.log, debuglog_puplic.old)
17. ApplicationServer.pcap
For any questions or issues relating to the procedures outlined in this document, please contact support. For details on how to engage support, please refer to the following link: http://www.juniper.net/support/requesting-support.html