NETHMAP 2013 NETH 20 MARAN 2013
126
NETHMAP 2013 Consumption of antimicrobial agents and antimicrobial resistance among medically important bacteria in the Netherlands MARAN 2013 Monitoring of Antimicrobial Resistance and Antibiotic Usage in Animals in the Netherlands in 2012 Autoriteit Diergeneesmiddelen
Transcript of NETHMAP 2013 NETH 20 MARAN 2013
NETHMAP2013
Consumption of antimicrobial agents and antimicrobial resistance
among medically important bacteria in the Netherlands NETHMAP
2013
Consumption of antimicrobial agents and antimicrobial resistance
among medically important bacteria in the Netherlands
MARAN2013
Monitoring of Antimicrobial Resistanceand Antibiotic Usage in Animals in the Netherlands
in 2012
Autoriteit Diergeneesmiddelen
NE
TH
MA
P | M
AR
AN
| 2013
NE
TH
MA
P |
MA
RA
N |
2013

Part 1: NETHMAP 2013 pg 1 - 75
Part 2: MARAN 2013 pg 1 - 48
NETHMAP 2013
Consumption of antimicrobial agents and antimicrobial resistance
among medically important bacteria in the Netherlands
N E T H M A P 2 0 1 3
2
Colophon
This report is published under the acronym NethMap by the SWAB, the Dutch Foundation of the Working Party on Antibiotic Policy, in collaboration with the Centre for Infectious disease control (CIb) of the RIVM, the National Institute for Public Health and the Environment of the Netherlands. SWAB is fully supported by a structural grant from CIb, on behalf of the Ministry of Health, Welfare and Sports of the Netherlands. The information presented in NethMap is based on data from ongoing surveillance systems on the use of antimicrobial agents in human medicine and on the prevalence of resistance to relevant antimicrobial agents among medically important bacteria isolated from healthy individuals and patients in the community and from hospitalized patients. The document was produced on behalf of the SWAB by the Studio of the RIVM.NethMap can be ordered from the SWAB secretariat, c/o Secretariaat SWABP/a Universitair Medisch Centrum St Radboud Medische Microbiologie, Huispost 777, route 777 Postbus 9101 6500 HB Nijmegen, Tel.: (024) 36 19041/14356.NethMap 2013 and earlier versions are also available from the website of the SWAB: www.swab.nl. Contents may be reproduced in publications (book chapters, papers, reviews, and slide reviews etcetera) without permission with a maximum limit of four figures and/or tables per publication and full credit (reference) to the original publication.
EditorsDr Ir SC de GreeffProf Dr JW Mouton
Section EditorsDr AK van der BijProf Dr JAA Hoogkamp-KorstanjeProf Dr DJ MeviusDr. S Natsch Board-members of SWABProf Dr JM Prins (chair)Prof Dr JW Mouton (secretary)Prof Dr BJ Kullberg (treasurer)Dr MP BauerDr H BijlmerProf Dr JE DegenerDr PD van der LindenProf Dr A FriedrichDr IC Gyssens Dr NG HartwigProf Dr JAJW KluytmansDr. D MellesDr YG van der Meer
Prof Dr DJ MeviusDr S NatschDr EE StobberinghDr JWPM OverdiekProf Dr ThJM Verheij
Members of SWAB’s working group on surveillance of antimicrobial resistanceProf Dr JAA Hoogkamp-Korstanje (chair)Dr AK van der BijProf Dr JE DegenerDr Ir SC de GreeffDr R HendrixDr D MellesDr JW MoutonDr C SchultszDr EE Stobberingh
Members of CIb working on surveillance of antimicrobial resistanceIng J AlblasDr Ir W Altorf-van der KuilDr AK van der BijDr HA BijlmerDr Ir SC de GreeffMrs A HaenenMrs M Kamst-van Agterveld Dr A MeijerDrs J Monen Drs J MuilwijkDr AJ de NeelingDr DW NotermansDr LM SchoulsProf Dr D van SoolingenDr EE Stobberingh
Members of SWAB’s working group on surveillance of antimicrobial useDr. S. Natsch (convener)Drs. C. PellicaanDrs. A.D. LindemansDr. T.B.Y. LiemDr. P.D. van der LindenDr. A.J. de NeelingDrs. M.M.B. RoukensDr. A.W. van der VeldenDr. E.M.W. van de GardeDrs. M. Lourens
N E T H M A P 2 0 1 3
3
AcknowledgementsWe thank the Foundation for Pharmaceutical Statistics SFK, The Hague, for providing data on community usage of antimicrobial agents and all hospital pharmacists of the centres mentioned below for providing data on hospital usage.We thank all participants of ISIS-AR, SERIN, SIRIN, GRAS, the Netherlands Reference laboratory for meningitis in Amsterdam, the department of Virology of RIVM and the NIVEL for their important contributions, mrs Y Beeuwkes for preparing the illustrations and the staff of the Publishing Department RIVM for preparing this report for printing.
Centres contributing to the surveillance of the use and resistance of hospital usageAlkmaar, MC Alkmaar; Almelo/Hengelo, ziekenhuisgroep Twente; Amersfoort, Meander MC; Amstelveen, ziekenhuis Amstelland; Amsterdam, AMC; Amsterdam, BovenIJ ziekenhuis; Amsterdam, OLVG; Amsterdam, St.Lucas Andreas ziekenhuis; Amsterdam, VUMC; Apeldoorn, Gelre ziekenhuizen; Arnhem, Rijnstate; Assen, Wilhelmina ziekenhuis; Bergen op Zoom, Lievensberg; Boxmeer, Maasziekenhuis Pantein; Breda, Amphia ziekenhuis; Capelle a/d Ijsel, Ijselland ziekenhuis; Den Bosch, Jeroen Bosch ziekenhuis; Den Haag, Bronovo ziekenhuis; Den Haag, MC Haaglanden; Den Haag, HAGA ziekenhuizen; Den Helder, Gemini ziekenhuis; Deventer, Deventer ziekenhuis; Doetinchem, Slingerland ziekenhuis; Dokkum, Sionsberg; Dordrecht, Albert Schweizer ziekenhuis; Ede, Gelderse vallei; Eindhoven, Catharina ziekenhuis; Eindhoven, Maxima MC; Emmen, Scheperziekenhuis; Enschede, Medisch spectrum Twente; Gorinchem, Beatrix ziekenhuis; Gouda, Groene hart ziekenhuis; Groningen, UMCG; Haarlem, Kennemergasthuis; Haarlem, Spaarne ziekenhuis; Hardenberg, Ropcke Zweers; Harderwijk, St.Jansdal; Heerenveen, De Tjongerschans; Heerlen, Atrium MC; Helmond, Elkerliek; Hoogeveen, Bethesda ziekenhuis; Hoorn, Westfries gasthuis; Leiden, Diaconessenhuis; Leiden, LUMC; Leiderdorp, Rijnland ziekenhuis; Leeuwarden, Medisch centrum Leeuwarden; Maastricht, AZM; Meppel, Diaconessenhuis; Nieuwegein, St.Antonius ziekenhuis; Nijmegen, CWZ; Nijmegen, UMC St.Radboud; Purmerend, Waterland ziekenhuis; Roermond, Laurentius ziekenhuis; Roosendaal , Franciscus ziekenhuis; Rotterdam, Erasmus MC; Rotterdam, Maasstad ziekenhuis; Rotterdam, St.Franciscus gasthuis; Rotterdam, Ikazia ziekenhuis; Dirksland, van Weel Bethesda ziekenhuis; Schiedam, Vlietland ziekenhuis; Sittard, Orbis MC; Terneuzen, ZorgSaam; Tilburg, St. Elisabeth ziekenhuis; Tilburg, Twee steden ziekenhuis; Tiel, Ziekenhuis Rivierenland; Utrecht, Diakonessenhuis; Utrecht, UMCU; Veghel, Ziekenhuis Bernhoven; Venlo, VieCurie; Weert, St Jans Gasthuis; Winterswijk, koningin Beatrix; Woerden, Zuwe Hofpoort; Zaandam, Zaans MC; Zeeland, ADRZ;
Zoetermeer, Lange Land ziekenhuis; Zutphen, Gelre ziekenhuizen; Zwolle, Isala kliniek.. Centres contributing to the surveillance of resistance to antimicrobial agentsAlkmaar, MC Alkmaar; Almelo/Hengelo, ziekenhuisgroep Twente; Amersfoort, Meander MC; Amstelveen, ziekenhuis Amstelland; Amsterdam, AMC; Amsterdam, BovenIJ ziekenhuis; Amsterdam, OLVG; Amsterdam, St.Lucas Andreas ziekenhuis; Amsterdam, VUMC; Apeldoorn, Gelre ziekenhuizen; Arnhem, Rijnstate; Assen, Wilhelmina ziekenhuis; Bergen op Zoom, Lievensberg; Boxmeer, Maasziekenhuis Pantein; Breda, Amphia ziekenhuis; Capelle a/d Ijsel, Ijselland ziekenhuis; Den Bosch, Jeroen Bosch ziekenhuis; Den Haag, Bronovo ziekenhuis; Den Haag, MC Haaglanden; Den Haag, HAGA ziekenhuizen; Den Helder, Gemini ziekenhuis; Deventer, Deventer ziekenhuis; Doetinchem, Slingerland ziekenhuis; Dokkum, Sionsberg; Dordrecht, Albert Schweizer ziekenhuis; Ede, Gelderse vallei; Eindhoven, Catharina ziekenhuis; Eindhoven, Maxima MC; Emmen, Scheperziekenhuis; Enschede, Medisch spectrum Twente; Gorinchem, Beatrix ziekenhuis; Gouda, Groene hart ziekenhuis; Groningen, UMCG; Haarlem, Kennemergasthuis; Haarlem, Spaarne ziekenhuis; Hardenberg, Ropcke Zweers; Harderwijk, St.Jansdal; Heerenveen, De Tjongerschans; Heerlen, Atrium MC; Helmond, Elkerliek; Hoogeveen, Bethesda ziekenhuis; Hoorn, Westfries gasthuis; Leiden, Diaconessenhuis; Leiden, LUMC; Leiderdorp, Rijnland ziekenhuis; Leeuwarden, Medisch centrum Leeuwarden; Maastricht, AZM; Meppel, Diaconessenhuis; Nieuwegein, St.Antonius ziekenhuis; Nijmegen, CWZ; Nijmegen, UMC St.Radboud; Purmerend, Waterland ziekenhuis; Roermond, Laurentius ziekenhuis; Roosendaal , Franciscus ziekenhuis; Rotterdam, Erasmus MC; Rotterdam, Maasstad ziekenhuis; Rotterdam, St.Franciscus gasthuis; Rotterdam, Ikazia ziekenhuis; Dirksland, van Weel Bethesda ziekenhuis; Schiedam, Vlietland ziekenhuis; Sittard, Orbis MC; Terneuzen, ZorgSaam; Tilburg, St. Elisabeth ziekenhuis; Tilburg, Twee steden ziekenhuis; Tiel, Ziekenhuis Rivierenland; Utrecht, Diakonessenhuis; Utrecht, UMCU; Veghel, Ziekenhuis Bernhoven; Venlo, VieCurie; Weert, St Jans Gasthuis; Winterswijk, koningin Beatrix; Woerden, Zuwe Hofpoort; Zaandam, Zaans MC; Zeeland, ADRZ; Zoetermeer, Lange Land ziekenhuis; Zutphen, Gelre ziekenhuizen; Zwolle, Isala kliniek.
N E T H M A P 2 0 1 3
4
Laboratories contributing to the surveillance of resistance in ISIS-AR
Alkmaar, Medisch Centrum Alkmaar; Apeldoorn, Gelre Ziekenhuizen; Bergen op Zoom, Lievensberg Ziekenhuis; Breda, Amphia Ziekenhuis; Delft, Diagnostisch Centrum SSDZ; Deventer, Deventer Ziekenhuis; Dordrecht, Regionaal Laboratorium Medische Microbiologie; Enschede, Laboratorium Microbiologie TA; Goes, Admiraal De Ruyter Ziekenhuis; Groningen, Laboratorium voor Infectieziekten; Haarlem, Streeklaboratorium voor de Volksgezondheid; Heerlen, Atrium Medisch Centrum Parkstad; Hilversum, Centraal Bacteriologisch en Serologisch Laboratorium; Leeuwarden, Izore, Centrum Infectieziekten Friesland; Leiden, LUMC; Nieuwegein, St. Antonius Ziekenhuis; Nijmegen, Canisius Wilhelmina Ziekenhuis; Nijmegen, UMC St. Radboud; Roosendaal, St. Franciscus ziekenhuis; Schiedam, Vlietland Ziekenhuis; ’s-Gravenhage, HagaZiekenhuis; ’s-Gravenhage, MC Haaglanden Westeinde; ’s-Hertogenbosch, Jeroen Bosch Ziekenhuis; Terneuzen, Ziekenhuis ZorgSaam Zeeuws-Vlaanderen; Tilburg, Streeklab. v.d. Volksgezondheid; Utrecht, Diakonessenhuis; Utrecht, Saltro; Utrecht, UMC Utrecht; Veldhoven, Stichting PAMM; Velp, Ziekenhuis Rijnstate, loc. Velp; Woerden, Zuwe Hofpoort Ziekenhuis; Zwolle, Isala Klinieken
N E T H M A P 2 0 1 3
5
Content
1. Introduction .................................................................................................................................................................. 7
2. Extensive summary ...................................................................................................................................................... 9 2.1 Most important trends in antimicrobial use ...................................................................................................... 10 2.2 Most important trends in antimicrobial resistance ............................................................................................ 10 2.3 Antibiotic use and resistance in veterinary sector ............................................................................................ 10 2.4 Implications for therapy .................................................................................................................................... 11 2.5 Implications for public health and health policy ............................................................................................. 12
3. Use of antimicrobials ................................................................................................................................................. 15 3.1 Primary care ...................................................................................................................................................... 15 3.2 Hospitals ........................................................................................................................................................... 16 3.3 Nursing homes .................................................................................................................................................. 24
4. Surveillance of resistance .......................................................................................................................................... 27 4.1 Methods of surveillance .................................................................................................................................... 27 4.2 Primary care ...................................................................................................................................................... 29 4.2.1 ISIS-AR ................................................................................................................................................ 29 4.2.2 SERIN ................................................................................................................................................... 33 4.3 Nursing Homes ................................................................................................................................................. 34 4.4 Hospitals ........................................................................................................................................................... 34 4.4.1 ISIS-AR ................................................................................................................................................. 35 4.4.2 SIRIN .................................................................................................................................................... 49 4.5 BRMO ............................................................................................................................................................... 62 4.5.1 Carbapenemase producing Enterobacteriaceae (CPE) .......................................................................... 62 4.5.2 Vancomycin Resistant Enterococci in Dutch hospitals ......................................................................... 63 4.5.3 Methicillin resistant Staphylococcus aureus (MRSA) .......................................................................... 64 4.6 Resistance in specific Pathogens....................................................................................................................... 66 4.6.1 Neisseria meningitidis ........................................................................................................................... 66 4.6.2 Neisseria gonorrhoeae .......................................................................................................................... 67 4.6.3 Mycobacterium tuberculosis ................................................................................................................. 68 4.6.4 Resistance to influenza antiviral drugs .................................................................................................. 69 4.6.5 Resistance among anaerobic pathogens ................................................................................................ 70 4.6.6 Clostridium difficile ............................................................................................................................... 72 4.6.7 Azole resistance in Aspergillus fumigatus ............................................................................................. 72

N E T H M A P 2 0 1 3
7
1. Introduction
This is NethMap 2013, the eleventh SWAB/RIVM report on the use of antibiotics and trends in antimicrobial resistance in The Netherlands in 2012 and previous years. NethMap is a cooperative effort by members of The Netherlands Society for Infectious Diseases, The Netherlands Society of Hospital Pharmacists, The Netherlands Society for Medical Microbiology and the Centre for Infectious Disease Control Netherlands (CIb) at the National Institute for Public Health and the Environment (RIVM). In 1996, the Dutch Working Group on Antibiotic Policy was created, better known as SWAB (Stichting Werkgroep Antibiotica Beleid). SWAB has started several major initiatives to achieve its goals. Among these are training programmes on rational prescribing of antimicrobial drugs, development of evidence-based prescription guidelines, implementation of tailor-made hospital guides for antibiotic prophylaxis and therapy and an integrated nationwide surveillance system for antibiotic use and resistance. CIb has set up an Infectious Disease Surveillance Information System on Antibiotic Resistance (ISIS-AR) in collaboration with the medical microbiological laboratories, which was renewed in 2008. These surveillance data, together with surveillance data obtained in specific studies such as SERIN (Surveillance of Extramural Resistance in The Netherlands) and SIRIN (Surveillance of Intramural Resistance in The Netherlands), form the basis of resistance trends reported in NethMap. The initiatives correspond well with the recommendations by The Netherlands Council of Health Research (2001). In line with these recommendations, SWAB is fully funded by a structural grant from CIb, on behalf of the Ministry of Health, Welfare and Sports.NethMap 2013 extends and updates the information of the annual reports since 2003. NethMap parallels the monitoring system of antimicrobial resistance and antibiotic usage in animals in The Netherlands, entitled MARAN – Monitoring of Antimicrobial Resistance and Antibiotic Usage in Animals in The Netherlands. Jointly, NethMap and MARAN provide a comprehensive overview of antibiotic usage and resistance trends in The Netherlands in humans and in animal husbandry and therefore offer insight into the ecological pressure associated with emerging resistance. Lately, the appearance of highly resistant microorganisms (HRMO’s) has received significant attention and has become a significant public health issue. The epidemiological background of these microorganisms is increasingly complex, as are the challenges to antimicrobial treatment. In this issue of NethMap we therefore provide in a new chapter a comprehensive overview covering the major trends in antimicrobial resistance, consequences for therapeutic choices and these may serve as a basis for public health policies. We believe NethMap/Maran continues to contribute to our knowledge and awareness regarding the use of antibiotics and the resistance problems that are present and may arise in the future. We especially thank all those who are contributing to the surveillance efforts, and express our hope that they are willing to continue their important clinical and scientific support to SWAB and thereby contribute to the general benefit and health of the people.
The editors:Dr Ir SC de GreeffProf Dr JW Mouton

N E T H M A P 2 0 1 3
9
2. Extensive summary
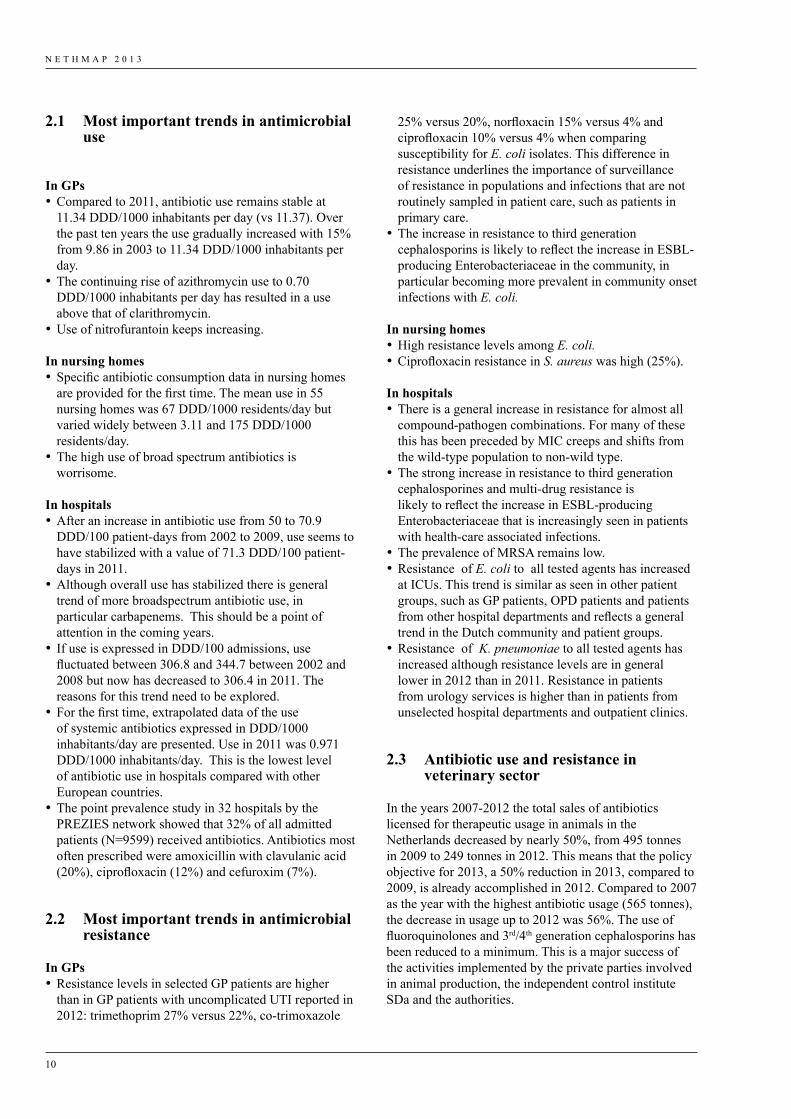
In the Netherlands, several surveillance programs have been developed to monitor antimicrobial resistance in important pathogens in different settings (SERIN, SIRIN, ISIS-AR). In addition, a number of specific surveillance programs exist that focus on the monitoring of specific pathogens, or even specific resistance mechanisms. These programs often include susceptibility testing, including conformation of important resistance mechanisms and molecular typing. For instance, all MRSA isolates cultured in the Netherlands are submitted to a reference
laboratory for further analysis. In table 2.01 an overview is provided of surveillance programs that are included in Nethmap 2013.
Table 2.01 Overview of Surveillance programs in the Netherlands.Surveillance program1 Origin of
isolatesavailable since
Sources 2012 Central or decentral susceptibility testing
Method of susceptibility testing
Surveillance program aimed at resistance surveillance in major pathogensSERIN GP 1996 20 GP practices from
NIVELCentral testing Microdilution
SIRIN Hospital 1996 14 hospitals Central testing MicrodilutionISIS-AR GP, Hospital,
Nursing homes2008 32 laboratories Decentral testing Various methods used in
routine susceptibility testingSpecific surveillance program aimed at resistance surveillance in specific pathogensCPE community, GP,
nursing home, hospital
2010 Nationwide Central testing Phenotypic and genotypic (PCR) confirmation of carbapenemases
VRE Hospital 2011 Nationwide Central testing PCR confirmation of VAN genes en genotyping
MRSA community, GP, nursing home, hospital
1989 Nationwide Central testing PCR confirmation of MecAgene, Spa typing, MLVA
Neisseria meningitidis Hospital 1994 Nationwide Central testing E-testNeisseria gonorrhoeae STI centers 2006 89% (of STI center
attendees)Decentral testing E-test
Mycobacterium tuberculosis
General population
1993 Nationwide Primarily central testing
Agar dilution and
BACTEC-Mgit 960 (liquid breakpoint)
Influenza antiviral drugs community, GP, nursing home, hospital
2005 NIVEL GP sentinels, SNIV nursing home sentinels, hospital/regional laboratories
central testing (RIVM, NIC-ErasmusMC, WHO-CC London)
Neuraminidase enzym inhibition assay; for established molecular markers sequencing and/or single nucleotide polymorphism (SNP) PCR
Resistance among anaerobic pathogens
Hospital 2010 1 lab Central testing E-test
Clostridium difficile Hospital, nursing homes
2005 18 hospitals (de)central testing
E-test and ribotyping
azole resistance in Aspergillus fumigatus
Hospital 2011 8 University hospitals Central testing EUCAST methodology
*SERIN= Surveillance of Extramural Resistance in The Netherlands; SIRIN= Surveillance of Intramural Resistance in The Netherlands; ISIS-AR= Infectious Disease Surveillance Information System on Antibiotic Resistance; GP=general practitioner ; CPE= Carbapenemase producing Enterobacteriaceae; VRE= vancomycin-resistant Enterococcus faecium; STI = sexually transmitted infections ; MGIT=Mycobacteria Growth Indicator Tube; EUCAST=European Committee on Antimicrobial Susceptibility Testing; NIVEL=Netherlands institute for health services research; NIC=National influenza center; WHO-CC = WHO Collaborating Centre
N E T H M A P 2 0 1 3
10
25% versus 20%, norfloxacin 15% versus 4% and ciprofloxacin 10% versus 4% when comparing susceptibility for E. coli isolates. This difference in resistance underlines the importance of surveillance of resistance in populations and infections that are not routinely sampled in patient care, such as patients in primary care.
•The increase in resistance to third generation cephalosporins is likely to reflect the increase in ESBL-producing Enterobacteriaceae in the community, in particular becoming more prevalent in community onset infections with E. coli.
In nursing homes•High resistance levels among E. coli. •Ciprofloxacin resistance in S. aureus was high (25%).
In hospitals•There is a general increase in resistance for almost all
compound-pathogen combinations. For many of these this has been preceded by MIC creeps and shifts from the wild-type population to non-wild type.
•The strong increase in resistance to third generation cephalosporines and multi-drug resistance is likely to reflect the increase in ESBL-producing Enterobacteriaceae that is increasingly seen in patients with health-care associated infections.
•The prevalence of MRSA remains low.•Resistance of E. coli to all tested agents has increased
at ICUs. This trend is similar as seen in other patient groups, such as GP patients, OPD patients and patients from other hospital departments and reflects a general trend in the Dutch community and patient groups.
•Resistance of K. pneumoniae to all tested agents has increased although resistance levels are in general lower in 2012 than in 2011. Resistance in patients from urology services is higher than in patients from unselected hospital departments and outpatient clinics.
2.3 Antibiotic use and resistance in veterinary sector
In the years 2007-2012 the total sales of antibiotics licensed for therapeutic usage in animals in the Netherlands decreased by nearly 50%, from 495 tonnes in 2009 to 249 tonnes in 2012. This means that the policy objective for 2013, a 50% reduction in 2013, compared to 2009, is already accomplished in 2012. Compared to 2007 as the year with the highest antibiotic usage (565 tonnes), the decrease in usage up to 2012 was 56%. The use of fluoroquinolones and 3rd/4th generation cephalosporins has been reduced to a minimum. This is a major success of the activities implemented by the private parties involved in animal production, the independent control institute SDa and the authorities.
2.1 Most important trends in antimicrobial use
In GPs•Compared to 2011, antibiotic use remains stable at
11.34 DDD/1000 inhabitants per day (vs 11.37). Over the past ten years the use gradually increased with 15% from 9.86 in 2003 to 11.34 DDD/1000 inhabitants per day.
•The continuing rise of azithromycin use to 0.70 DDD/1000 inhabitants per day has resulted in a use above that of clarithromycin.
•Use of nitrofurantoin keeps increasing.
In nursing homes•Specific antibiotic consumption data in nursing homes
are provided for the first time. The mean use in 55 nursing homes was 67 DDD/1000 residents/day but varied widely between 3.11 and 175 DDD/1000 residents/day.
•The high use of broad spectrum antibiotics is worrisome.
In hospitals•After an increase in antibiotic use from 50 to 70.9
DDD/100 patient-days from 2002 to 2009, use seems to have stabilized with a value of 71.3 DDD/100 patient-days in 2011.
•Although overall use has stabilized there is general trend of more broadspectrum antibiotic use, in particular carbapenems. This should be a point of attention in the coming years.
• If use is expressed in DDD/100 admissions, use fluctuated between 306.8 and 344.7 between 2002 and 2008 but now has decreased to 306.4 in 2011. The reasons for this trend need to be explored.
•For the first time, extrapolated data of the use of systemic antibiotics expressed in DDD/1000 inhabitants/day are presented. Use in 2011 was 0.971 DDD/1000 inhabitants/day. This is the lowest level of antibiotic use in hospitals compared with other European countries.
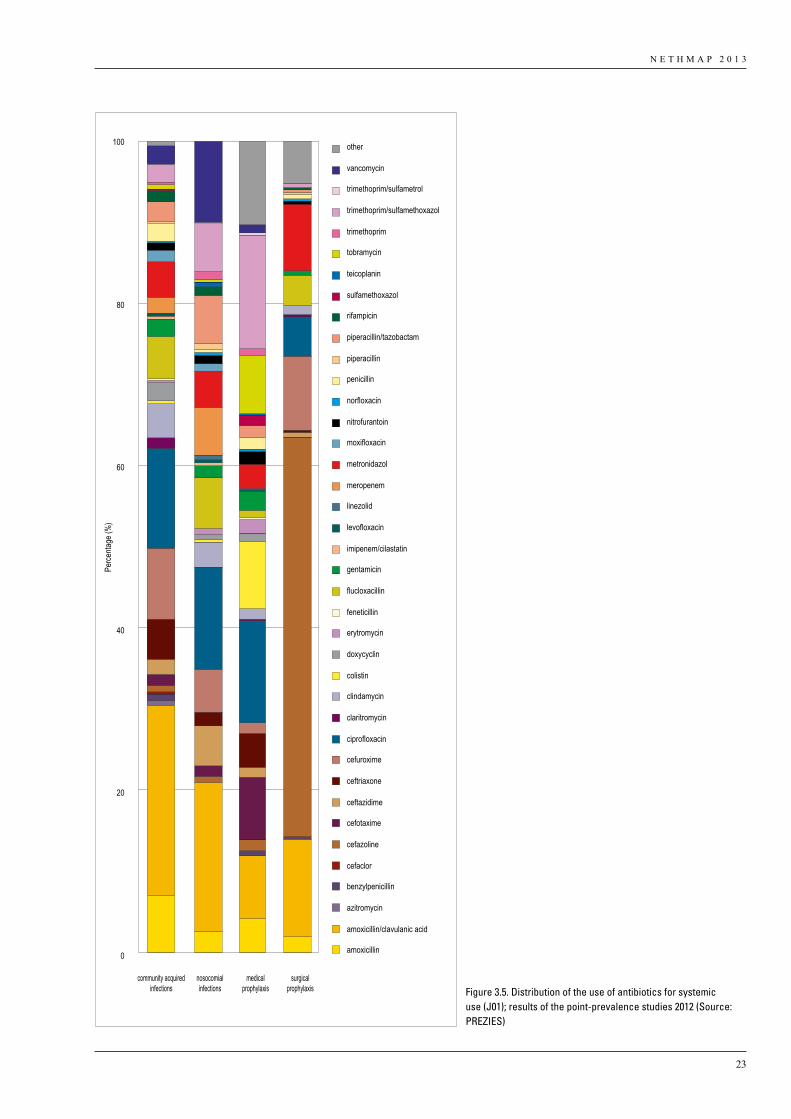
•The point prevalence study in 32 hospitals by the PREZIES network showed that 32% of all admitted patients (N=9599) received antibiotics. Antibiotics most often prescribed were amoxicillin with clavulanic acid (20%), ciprofloxacin (12%) and cefuroxim (7%).
2.2 Most important trends in antimicrobial resistance
In GPs•Resistance levels in selected GP patients are higher
than in GP patients with uncomplicated UTI reported in 2012: trimethoprim 27% versus 22%, co-trimoxazole
N E T H M A P 2 0 1 3
11
emergence of resistance. In the summary below, some of the most important implications for therapy are provided, based on the general trends of resistance. As implications differ by category of patient and indication of use, the summary is organized as such. It should be borne in mind that the majority of conclusions below are based on agents used as intravenous therapy, except for agents that are available as oral drugs only or have a specific indication such as UTI. Non-susceptible rates can be higher than resistance rates in some cases.
In GPsUrinary tract infections•Approximately 75% of Gram-negatives cultured
were E. coli. Other important pathogens were K. pneumoniae and P. mirabilis. High levels of resistance to amoxicillin, trimethoprim (up to 36%) and co-trimoxazole (up to 30%) make these agents less suitable for empirical treatment in UTI.
•The best suitable treatment options for uncomplicated UTI are nitrofurantoin (2% resistance in E. coli but increasing) and fosfomycin (1% resistance in E. coli, but 25% in K. pneumoniae and 14% in P. mirabilis). However, care must be taken with nitrofurantoin in the elderly.
•Resistance of co-amoxiclav was 15% in E. coli indicating that care should be taken with empirical treatment without further diagnostic work-up. Resistance was also over 10% for the fluoroquinolones (being over 11% for ciprofloxacin) leading to a similar conclusion.
•Multi-drug resistance, defined as resistance to all oral treatment agents for complicated UTI is increasing in selected GP patients complicating the oral treatment of complicated UTI among GP patients.
•The results indicate sampling for antimicrobial susceptibility testing becomes increasingly important in the treatment of UTI.
Pulmonary tract infections•Penicillin resistance in pneumococci is still very low. In
case of a respiratory tract infection with a high a priori chance of S. pneumoniae as the causative pathogen, penicillin/amoxicillin remains first choice for empirical treatment. Macrolides resistance exceeds 10%.
•The increase in co-amoxiclav resistant H. influenzae strains suggests an increase in BLNAR. In ISIS-AR this was 4% and in SIRIN up to 15%. These finding indicate limited usefulness of co-amoxiclav. Doxycyline may serve as a valid alternative empirical treatment choice or as the choice of therapy in case of no response to previous treatment.
In nursing homes•Similar to specimens from GP patients, the majority
of isolates cultured were E. coli (67%). All resistance levels except for nitrofurantoin were higher than 16%
• In 2012 the resistance levels have decreased in the commensal E. coli, used as an indicator organism for the Gram-negative intestinal flora. This includes the occurrence of cefotaxime resistance in E. coli from broilers, which decreased from 20% in 2007 to 5.8% in 2012. For all E. coli from food-producing animals 37% were resistant to amoxicillin and 4.9% to ciprofloxacin based on EUCAST MIC-breakpoints. This compares to 47% amoxicillin resistance and 14% ciprofloxacin resistance in E. coli isolates from unselected hospital departments.
•Campylobacter spp. from humans and poultry showed very similar resistance levels, 56 – 62% of C. jejuni from poultry meat products and poultry feces, respectively, were resistant to ciprofloxacin, compared to 55% of human clinical isolates. Resistance to the macrolides was low in both populations.
• In food-producing animals MRSA occurred frequently in calves and pigs. However, almost all isolates examined from pigs and calves belonged to the Livestock Associated MRSA CC398 (N = 179) variant, the two remaining were ST9. Typical human Community-, or Hospital-Associated MRSA variants were not detected in these animals, nor newly acquired resistance and virulence genes of relevance.
•ESBL/AmpC-producing E. coli and to a lesser extend also Salmonella were frequently detected in poultry, pigs, cattle and meat thereof. The dominant enzymes detected in E. coli were CTX-M-1 (55%), CTX-M-2 (7.5%), CMY-2 (8.2%) and a variety of incidental others enzymes. The dominant human ESBL variant CTX-M-15 was only detected incidentally (3.8%) in animal faecal sources. In meat products 167 ESBL/AmpC producing E. coli were identified. The enzymes detected were CTX-M-1 (30%), CTX-M-2 (17%), CMY-2 (13%) and CTX-M-15 (1%).
2.4 Implications for therapy
The general picture that emerges from trends in resistance rates is not very encouraging. Resistance rates are increasing and MIC creeps for many antimicrobial-microorganism combinations indicate that this will continue in the near future. For many of the antibiotics that were long considered as first line of treatment, resistance has already become alarmingly high, and empiric (mono) therapy for some of these agents is now unjustified in the severely ill patient. Alternatively, antimicrobials long used in general practice have resistance rates of up to 30 % or more (e.g. trimethoprim) preventing its use as a first choice even in patients with uncomplicated UTI. Routine culturing with antibiograms becomes increasingly important to tailor therapy to the individual patient, and if broad spectrum therapy was chosen initially antibiograms should be used to narrow down antimicrobial therapy given to prevent even further
N E T H M A P 2 0 1 3
12
2.5 Implications for public health and health policy
Antibiotic resistance is a major European and global public health problem and is, for a large part, driven by (mis) use of antibiotics. As a consequence, patients who are infected with resistant bacteria, that are often resistant to multiple antibiotics (multi-drug resistance), have limited options for treatment. Over the last years there has been a significant increasing trend of combined resistance/multidrug resistance, defined as resistance to third-generation cephalosporins, fluoroquinolones and aminoglycosides, in E. coli (ECDC) in many European countries. In the Netherlands, there is a general increase in resistance for almost all compound-pathogen combinations and multi-drug resistance in E. coli in all patient groups including GPs. This reflects a general trend, suggesting an increase in ESBL-producing Enterobacteriaceae in community onset and health care associated infections. The increasing trend of combined resistance means that, for patients who are infected with these multidrug-resistant bacteria, only few therapeutic options remain available, such as the carbapenems. To control the increase in antibiotic resistance, trends in resistance and antibiotic use should be carefully monitored to allow intervention if necessary. To ensure and enhance the validity of resistance surveillance nationwide it would be useful to include a number of standard antibiotics in test panels in each laboratory. For interventions in antibiotic use, the SWAB recently published a guidance document (‘visiedocument’). In the document, endorsed by the Health Care Inspectorate, a number of measures are recommended including antibiotic stewardship, restricted use of some broadspectrum antibiotics and more diagnostic interventions to allow individualizing therapy and narrow down when culture results and antibiograms become known.
Primary careSince GPs only send in isolates for culture and susceptibility testing in case of complicated infection or when there is no response to antimicrobial therapy, the data on GP patients will generally over-estimate resistance levels in GP patients. Thus, the patient who is first treated will likely respond much better to therapy as the present figures suggest. The steady increase in the use of broader spectrum antibiotics like amoxicillin/clavulanic acid, azithromycin and ciprofloxacin in primary care, and the increase in resistance to third generation cephalosporines, underlines the importance of a good surveillance system of resistance and antibiotic use in populations and infections that are not routinely sampled in patient care, such as patients in primary care.
and 5% were multidrug-resistant. These values have become too high to warrant empiric treatment of complicated UTI without further diagnostics.
In hospitalsOutpatient departments•Resistance rates against virtually all antimicrobials have
increased in Gram-negatives. •Except for nitrofurantoin and fosfomycin, high levels of
resistance preclude empirical treatment with oral agents for UTI and culture and antibiograms and tailored therapy are necessary.
•Resistance rates are comparable to, or slightly higher than in GP, thus the treatment strategies will be largely similar
Unselected hospital patient departments•High levels of resistance to amoxicillin, co-amoxiclav,
cefuroxime, co-trimoxazole and ciprofloxacin, make these agents less suitable for empirical treatment in serious infections. The ciprofloxacin resistance rate of 14% in E.coli is especially worrisome.
•Piperacillin/tazobactam, cefotaxime/ceftriaxone, ceftazidime and aminoglycoside resistance rates are all between 5 and 10% and in the range that is generally considered to be acceptable for patients not severely ill.
•Combination therapy of a beta-lactam with an aminoglycoside are the best suitable options for empirical treatment in serious infections.
Intensive care patients •High levels of resistance to amoxicillin, co-amoxiclav,
cefuroxime, co-trimoxazole and ciprofloxacin, make these agents less suitable for empirical treatment in serious infections. The ciprofloxacin resistance rate of 15% in E.coli is especially worrisome, but compares well with the values in unselected hospital patients.
•There are significant differences in resistant rates between hospitals as well as over time. This clearly indicates that empiric therapy should be based on the local epidemiology of resistance.
•Piperacillin/tazobactam, cefotaxime/ceftriaxone, ceftazidime and aminoglycoside resistance rates are all between 5 and 10% . This is in a range that warrants combination therapy or at least close monitoring for the severely ill. However, resistance to combinations of a beta-lactam and an aminoglycoside is between 1 and 5%. It should be realized however, that resistance to combinations is based on the effect of the drug alone and does not take into account any synergistic effects that may be present.
N E T H M A P 2 0 1 3
13
Nursing homesThe large variety in antibiotic use and the high use of broad spectrum antibiotics in nursing homes demonstrates that antibiotic prescription in nursing homes is mostly empirically and not always based on well-defined guidelines or actual resistance prevalence. The choice is usually based either on the resistance data from hospitals or from general practitioners. This will result in an antibiotic choice with a too broad spectrum, when the choice is based on hospital data, or a too small spectrum, when data from general practitioners are used. To control the emergence of resistance in nursing homes, prudent use of AB is essential. Additionally, since patients in nursing homes are not routinely sampled in case of infection this requires a change in local policies by performing more diagnostics. Another tool that may help here, is setting up a surveillance network in nursing homes that should give insight in the prevalence and spread of resistant micro-organisms as well as the use of antibiotics. Such a surveillance system will help to identify related factors and options for interventions and will play an important role in controlling the prevalence and spread of resistant bacteria among patients in nursing homes. Finally, surveillance in nursing homes helps to set up antibiotic therapy guidelines.
HospitalsSurveillance data on resistance in patients attending outpatient and hospital departments is available from (1) the Surveillance of Intramural Resistance in the Netherlands (SIRIN) and (2) the Infectious Disease Surveillance Information System for Antibiotic Resistance (ISIS-AR) database. Data from SIRIN is limited by the small number of isolates collected, but isolates are tested for susceptibility by a central laboratory and therefore a standardised methodology for susceptibility testing. In contrast, data from ISIS-AR is robust due to its large sample size and nation-wide collection sites, but the system uses data from on-site routine susceptibility testing in different laboratories, and testing methodology is therefore more heterogeneous. The now almost universal use of standard methodology and interpretation through EUCAST guidelines increasingly endorse the use of ISIS-AR data and conclusions derived there-from. This therefore is the last year SIRIN data are collected and reported.
ConclusionsWe conclude that the data presented in NethMap 2013 show continuing increases in antibiotic resistance in the Netherlands. The overall rise in resistance requires a rethinking of antimicrobial use and policy, including restricted use of some classes of antibiotics, in particular those that are employed as a last line of defense. Diagnostic cultures and in particular susceptibility testing are becoming increasingly important to guide antimicrobial treatment choices.

N E T H M A P 2 0 1 3
15
3. Use of antimicrobials
In this chapter the use of antimicrobials over the past ten years is reported. First the extramural antibiotic use from 2003 until 2012 will be presented; total use as well as the use of individual and groups of antibiotics. Second, antibiotic use in hospital care from 2002 until 2011 will be depicted, calculated as DDD/100 patient days, DDD/100 admissions, as well as in DDD/1000 inhabitant days. Furthermore, the antibiotic use data from the point prevalence study of the PREZIES network are reported. Finally, for the first time, we report data of antibiotic use in nursing homes in the Netherlands. In the final section, we compare the use of antibiotics in these three sectors.
3.1 Primary care
MethodsDutch data of outpatient antibiotic use are annually obtained from the SFK (foundation for pharmaceutical statistics, the Hague) and are expressed in numbers of Defined Daily Doses (DDD) for each ATC-5 code. The SFK collects data from 90% of the Dutch community pharmacies (serving 91.5% of the Dutch population ) and extrapolate their data to 100%. Data are presented as DDD per 1000 inhabitants per day (DID).
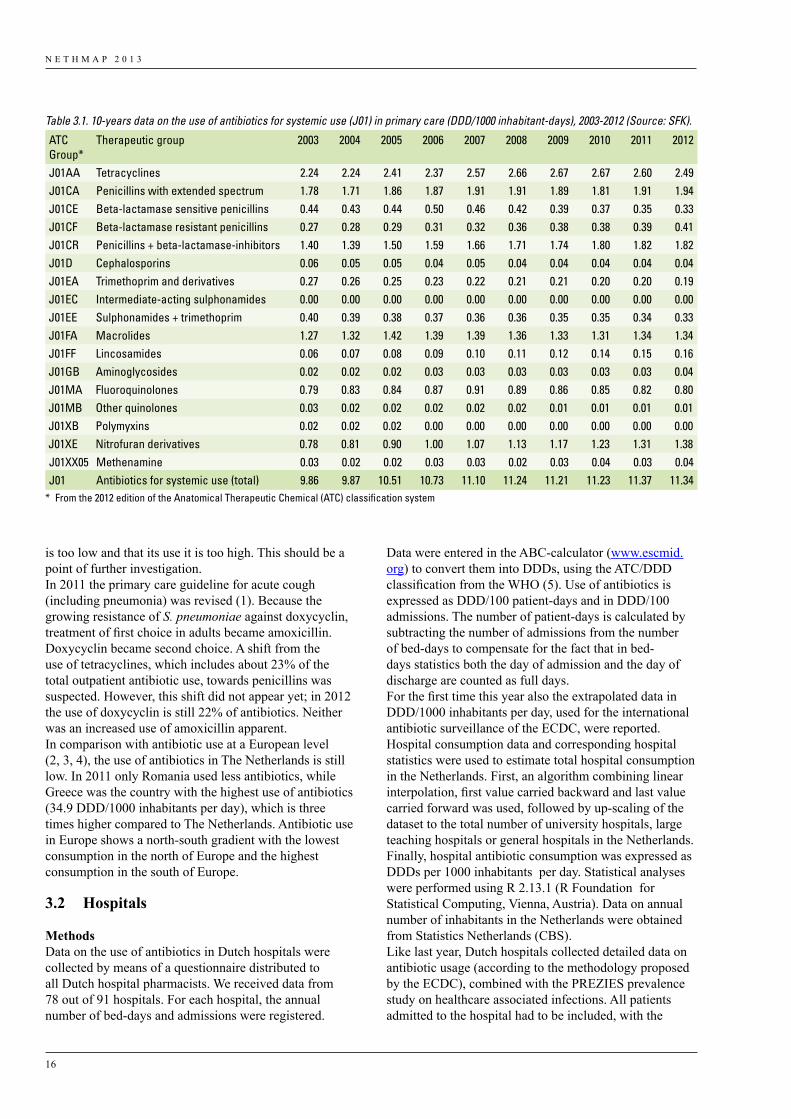
ResultsCompared to 2011, antibiotic use remains about stable at 11,34 DDD/1000 inhabitants per day (vs 11,37). Over the past ten years the use gradually increased with 15% from
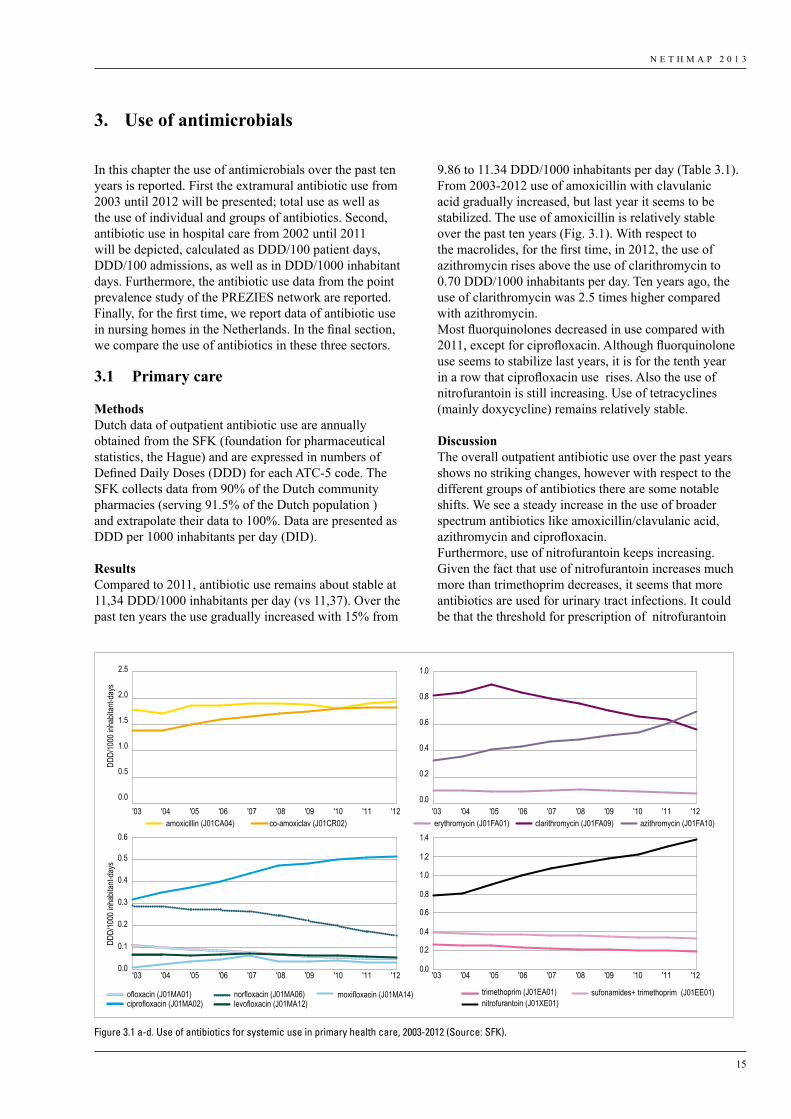
9.86 to 11.34 DDD/1000 inhabitants per day (Table 3.1).From 2003-2012 use of amoxicillin with clavulanic acid gradually increased, but last year it seems to be stabilized. The use of amoxicillin is relatively stable over the past ten years (Fig. 3.1). With respect to the macrolides, for the first time, in 2012, the use of azithromycin rises above the use of clarithromycin to 0.70 DDD/1000 inhabitants per day. Ten years ago, the use of clarithromycin was 2.5 times higher compared with azithromycin.Most fluorquinolones decreased in use compared with 2011, except for ciprofloxacin. Although fluorquinolone use seems to stabilize last years, it is for the tenth year in a row that ciprofloxacin use rises. Also the use of nitrofurantoin is still increasing. Use of tetracyclines (mainly doxycycline) remains relatively stable.
DiscussionThe overall outpatient antibiotic use over the past years shows no striking changes, however with respect to the different groups of antibiotics there are some notable shifts. We see a steady increase in the use of broader spectrum antibiotics like amoxicillin/clavulanic acid, azithromycin and ciprofloxacin. Furthermore, use of nitrofurantoin keeps increasing. Given the fact that use of nitrofurantoin increases much more than trimethoprim decreases, it seems that more antibiotics are used for urinary tract infections. It could be that the threshold for prescription of nitrofurantoin
amoxicillin (J01CA04) co-amoxiclav (J01CR02)
DDD/
1000
inha
bitan
t-day
s
1.5
1.0
0.5
0.0
2.0
2.5
trimethoprim (J01EA01)nitrofurantoin (J01XE01)
sufonamides+ trimethoprim (J01EE01)
0.0
0.2
0.4
0.6
0.8
1.0
1.2
1.4erythromycin (J01FA01) clarithromycin (J01FA09) azithromycin (J01FA10)
1.0
0.8
0.6
0.4
0.2
0.0
ofloxacin (J01MA01) moxifloxacin (J01MA14)ciprofloxacin (J01MA02)
norfloxacin (J01MA06)levofloxacin (J01MA12)
DDD/
1000
inha
bitan
t-day
s 0.5
0.6
0.4
0.3
0.2
0.1
0.0
'03 '04 '05 '06 '07 '08 '09 '10 '11 '12 '03 '04 '05 '06 '07 '08 '09 '10 '11 '12
'03 '04 '05 '06 '07 '08 '09 '10 '11 '12'03 '04 '05 '06 '07 '08 '09 '10 '11 '12
Figure 3.01
Figure 3.1 a-d. Use of antibiotics for systemic use in primary health care, 2003-2012 (Source: SFK).
N E T H M A P 2 0 1 3
16
is too low and that its use it is too high. This should be a point of further investigation.In 2011 the primary care guideline for acute cough (including pneumonia) was revised (1). Because the growing resistance of S. pneumoniae against doxycyclin, treatment of first choice in adults became amoxicillin. Doxycyclin became second choice. A shift from the use of tetracyclines, which includes about 23% of the total outpatient antibiotic use, towards penicillins was suspected. However, this shift did not appear yet; in 2012 the use of doxycyclin is still 22% of antibiotics. Neither was an increased use of amoxicillin apparent.In comparison with antibiotic use at a European level (2, 3, 4), the use of antibiotics in The Netherlands is still low. In 2011 only Romania used less antibiotics, while Greece was the country with the highest use of antibiotics (34.9 DDD/1000 inhabitants per day), which is three times higher compared to The Netherlands. Antibiotic use in Europe shows a north-south gradient with the lowest consumption in the north of Europe and the highest consumption in the south of Europe.
3.2 Hospitals
Methods Data on the use of antibiotics in Dutch hospitals were collected by means of a questionnaire distributed to all Dutch hospital pharmacists. We received data from 78 out of 91 hospitals. For each hospital, the annual number of bed-days and admissions were registered.
Data were entered in the ABC-calculator (www.escmid.org) to convert them into DDDs, using the ATC/DDD classification from the WHO (5). Use of antibiotics is expressed as DDD/100 patient-days and in DDD/100 admissions. The number of patient-days is calculated by subtracting the number of admissions from the number of bed-days to compensate for the fact that in bed-days statistics both the day of admission and the day of discharge are counted as full days.For the first time this year also the extrapolated data in DDD/1000 inhabitants per day, used for the international antibiotic surveillance of the ECDC, were reported. Hospital consumption data and corresponding hospital statistics were used to estimate total hospital consumption in the Netherlands. First, an algorithm combining linear interpolation, first value carried backward and last value carried forward was used, followed by up-scaling of the dataset to the total number of university hospitals, large teaching hospitals or general hospitals in the Netherlands. Finally, hospital antibiotic consumption was expressed as DDDs per 1000 inhabitants per day. Statistical analyses were performed using R 2.13.1 (R Foundation for Statistical Computing, Vienna, Austria). Data on annual number of inhabitants in the Netherlands were obtained from Statistics Netherlands (CBS).Like last year, Dutch hospitals collected detailed data on antibiotic usage (according to the methodology proposed by the ECDC), combined with the PREZIES prevalence study on healthcare associated infections. All patients admitted to the hospital had to be included, with the
Table 3.1. 10-years data on the use of antibiotics for systemic use (J01) in primary care (DDD/1000 inhabitant-days), 2003-2012 (Source: SFK).
ATC Group*
Therapeutic group 2003 2004 2005 2006 2007 2008 2009 2010 2011 2012
J01AA Tetracyclines 2.24 2.24 2.41 2.37 2.57 2.66 2.67 2.67 2.60 2.49J01CA Penicillins with extended spectrum 1.78 1.71 1.86 1.87 1.91 1.91 1.89 1.81 1.91 1.94J01CE Beta-lactamase sensitive penicillins 0.44 0.43 0.44 0.50 0.46 0.42 0.39 0.37 0.35 0.33J01CF Beta-lactamase resistant penicillins 0.27 0.28 0.29 0.31 0.32 0.36 0.38 0.38 0.39 0.41J01CR Penicillins + beta-lactamase-inhibitors 1.40 1.39 1.50 1.59 1.66 1.71 1.74 1.80 1.82 1.82J01D Cephalosporins 0.06 0.05 0.05 0.04 0.05 0.04 0.04 0.04 0.04 0.04J01EA Trimethoprim and derivatives 0.27 0.26 0.25 0.23 0.22 0.21 0.21 0.20 0.20 0.19J01EC Intermediate-acting sulphonamides 0.00 0.00 0.00 0.00 0.00 0.00 0.00 0.00 0.00 0.00J01EE Sulphonamides + trimethoprim 0.40 0.39 0.38 0.37 0.36 0.36 0.35 0.35 0.34 0.33J01FA Macrolides 1.27 1.32 1.42 1.39 1.39 1.36 1.33 1.31 1.34 1.34J01FF Lincosamides 0.06 0.07 0.08 0.09 0.10 0.11 0.12 0.14 0.15 0.16J01GB Aminoglycosides 0.02 0.02 0.02 0.03 0.03 0.03 0.03 0.03 0.03 0.04J01MA Fluoroquinolones 0.79 0.83 0.84 0.87 0.91 0.89 0.86 0.85 0.82 0.80J01MB Other quinolones 0.03 0.02 0.02 0.02 0.02 0.02 0.01 0.01 0.01 0.01J01XB Polymyxins 0.02 0.02 0.02 0.00 0.00 0.00 0.00 0.00 0.00 0.00J01XE Nitrofuran derivatives 0.78 0.81 0.90 1.00 1.07 1.13 1.17 1.23 1.31 1.38J01XX05 Methenamine 0.03 0.02 0.02 0.03 0.03 0.02 0.03 0.04 0.03 0.04J01 Antibiotics for systemic use (total) 9.86 9.87 10.51 10.73 11.10 11.24 11.21 11.23 11.37 11.34
* From the 2012 edition of the Anatomical Therapeutic Chemical (ATC) classification system
N E T H M A P 2 0 1 3
17
exception of patients on psychiatric wards and in the haemodialysis centre. Only systematic antibacterials (ATC-code J01) were included, with a maximum of three concomitant substances per patient.
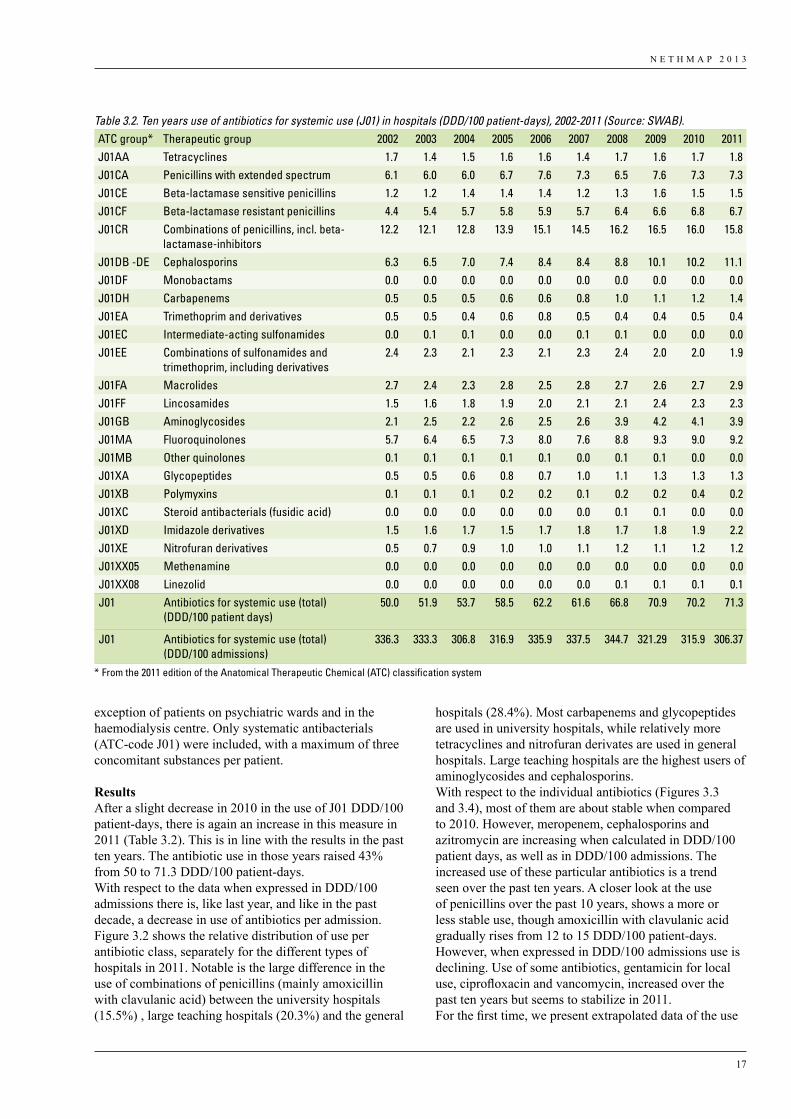
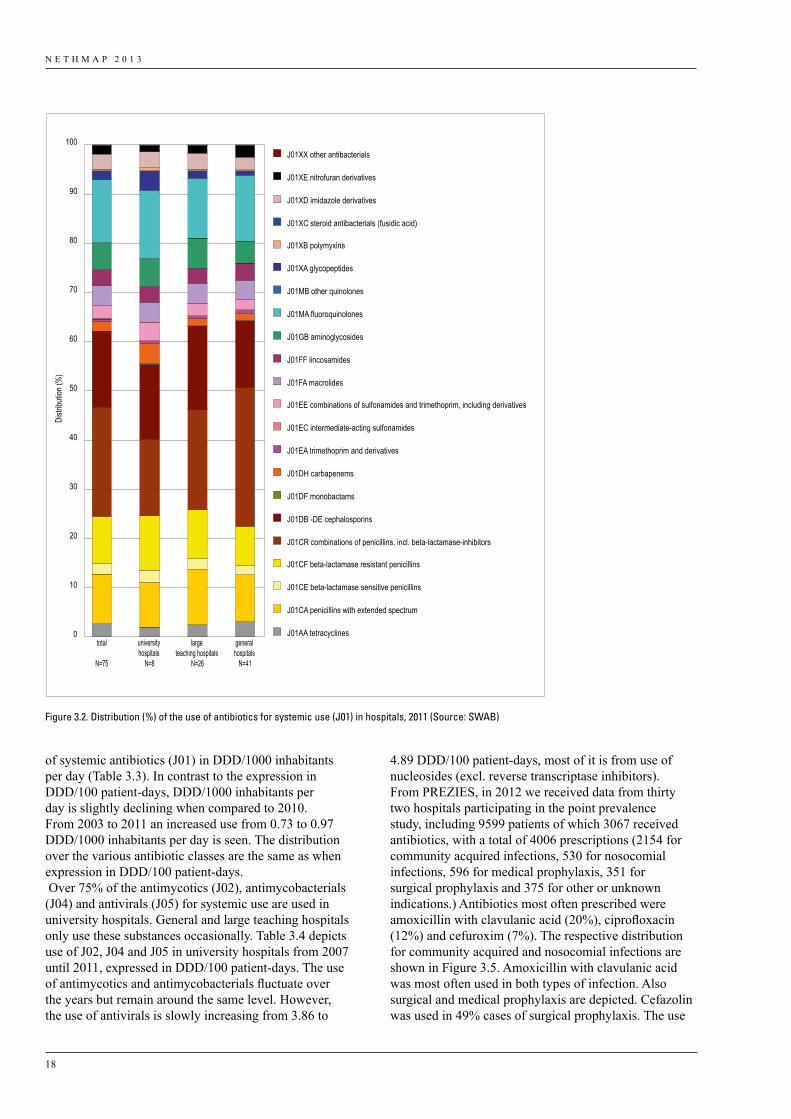
ResultsAfter a slight decrease in 2010 in the use of J01 DDD/100 patient-days, there is again an increase in this measure in 2011 (Table 3.2). This is in line with the results in the past ten years. The antibiotic use in those years raised 43% from 50 to 71.3 DDD/100 patient-days.With respect to the data when expressed in DDD/100 admissions there is, like last year, and like in the past decade, a decrease in use of antibiotics per admission.Figure 3.2 shows the relative distribution of use per antibiotic class, separately for the different types of hospitals in 2011. Notable is the large difference in the use of combinations of penicillins (mainly amoxicillin with clavulanic acid) between the university hospitals (15.5%) , large teaching hospitals (20.3%) and the general
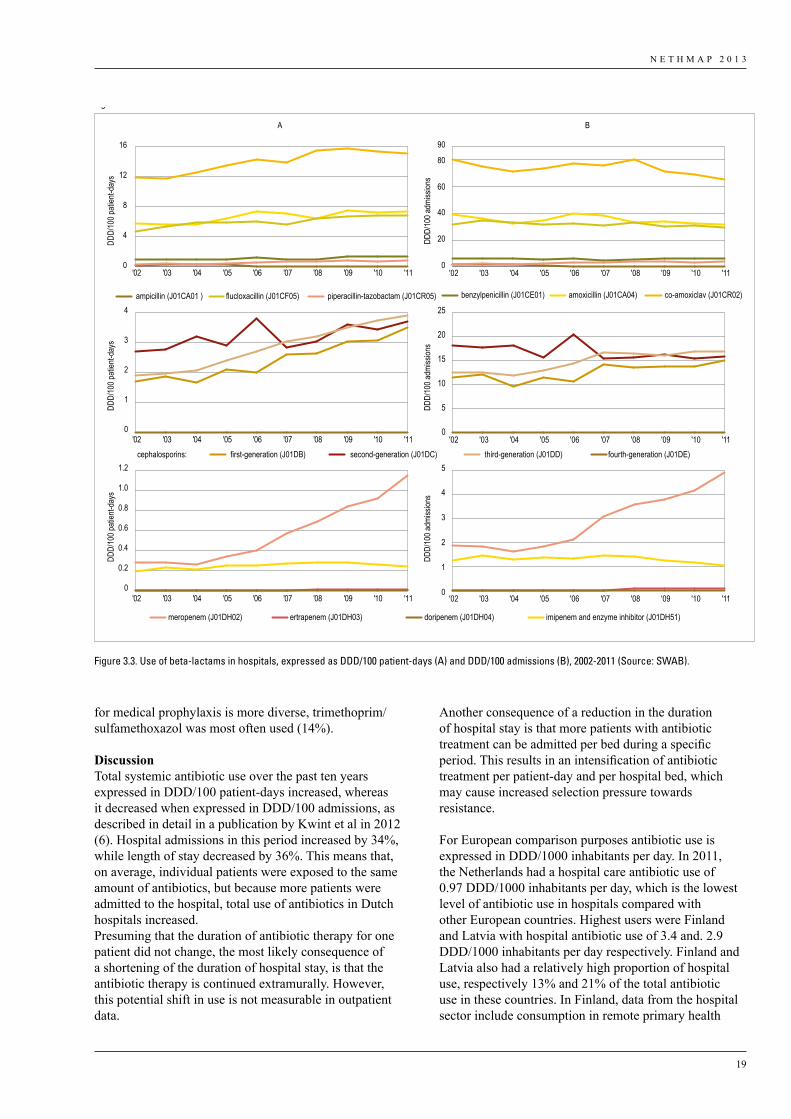
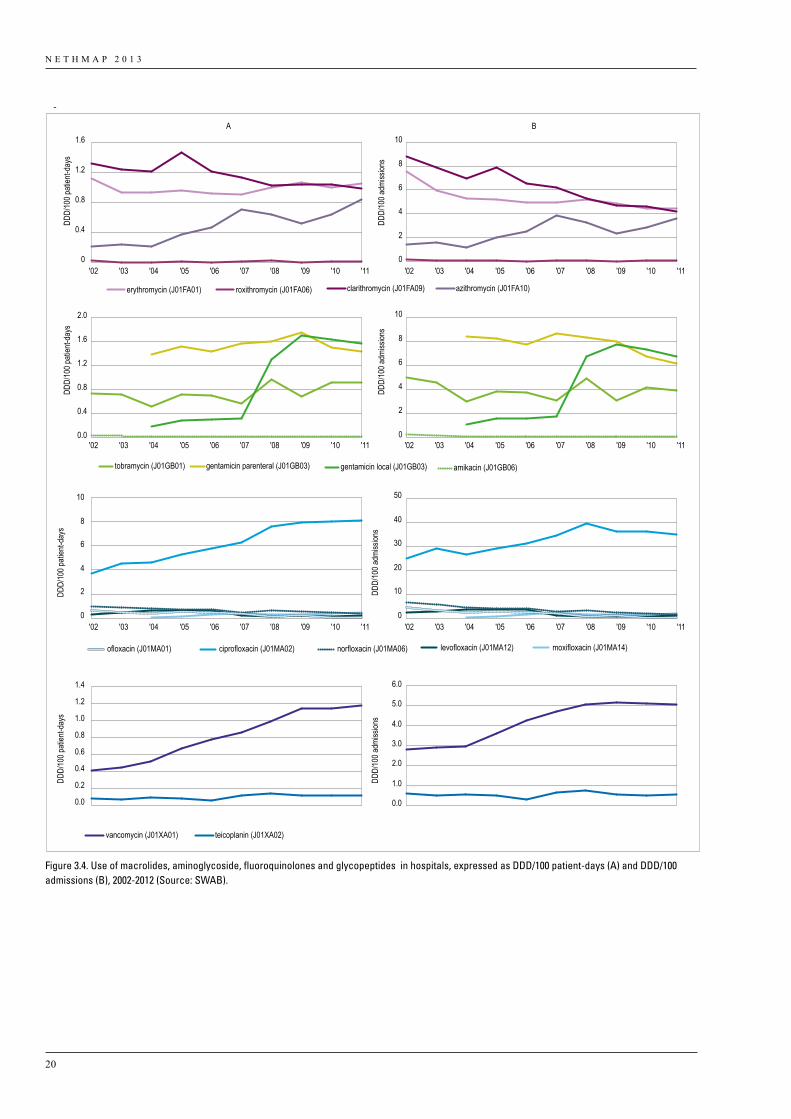
hospitals (28.4%). Most carbapenems and glycopeptides are used in university hospitals, while relatively more tetracyclines and nitrofuran derivates are used in general hospitals. Large teaching hospitals are the highest users of aminoglycosides and cephalosporins.With respect to the individual antibiotics (Figures 3.3 and 3.4), most of them are about stable when compared to 2010. However, meropenem, cephalosporins and azitromycin are increasing when calculated in DDD/100 patient days, as well as in DDD/100 admissions. The increased use of these particular antibiotics is a trend seen over the past ten years. A closer look at the use of penicillins over the past 10 years, shows a more or less stable use, though amoxicillin with clavulanic acid gradually rises from 12 to 15 DDD/100 patient-days. However, when expressed in DDD/100 admissions use is declining. Use of some antibiotics, gentamicin for local use, ciprofloxacin and vancomycin, increased over the past ten years but seems to stabilize in 2011.For the first time, we present extrapolated data of the use
Table 3.2. Ten years use of antibiotics for systemic use (J01) in hospitals (DDD/100 patient-days), 2002-2011 (Source: SWAB).ATC group* Therapeutic group 2002 2003 2004 2005 2006 2007 2008 2009 2010 2011J01AA Tetracyclines 1.7 1.4 1.5 1.6 1.6 1.4 1.7 1.6 1.7 1.8J01CA Penicillins with extended spectrum 6.1 6.0 6.0 6.7 7.6 7.3 6.5 7.6 7.3 7.3J01CE Beta-lactamase sensitive penicillins 1.2 1.2 1.4 1.4 1.4 1.2 1.3 1.6 1.5 1.5J01CF Beta-lactamase resistant penicillins 4.4 5.4 5.7 5.8 5.9 5.7 6.4 6.6 6.8 6.7J01CR Combinations of penicillins, incl. beta-
lactamase-inhibitors12.2 12.1 12.8 13.9 15.1 14.5 16.2 16.5 16.0 15.8
J01DB -DE Cephalosporins 6.3 6.5 7.0 7.4 8.4 8.4 8.8 10.1 10.2 11.1J01DF Monobactams 0.0 0.0 0.0 0.0 0.0 0.0 0.0 0.0 0.0 0.0J01DH Carbapenems 0.5 0.5 0.5 0.6 0.6 0.8 1.0 1.1 1.2 1.4J01EA Trimethoprim and derivatives 0.5 0.5 0.4 0.6 0.8 0.5 0.4 0.4 0.5 0.4J01EC Intermediate-acting sulfonamides 0.0 0.1 0.1 0.0 0.0 0.1 0.1 0.0 0.0 0.0J01EE Combinations of sulfonamides and
trimethoprim, including derivatives2.4 2.3 2.1 2.3 2.1 2.3 2.4 2.0 2.0 1.9
J01FA Macrolides 2.7 2.4 2.3 2.8 2.5 2.8 2.7 2.6 2.7 2.9J01FF Lincosamides 1.5 1.6 1.8 1.9 2.0 2.1 2.1 2.4 2.3 2.3J01GB Aminoglycosides 2.1 2.5 2.2 2.6 2.5 2.6 3.9 4.2 4.1 3.9J01MA Fluoroquinolones 5.7 6.4 6.5 7.3 8.0 7.6 8.8 9.3 9.0 9.2J01MB Other quinolones 0.1 0.1 0.1 0.1 0.1 0.0 0.1 0.1 0.0 0.0J01XA Glycopeptides 0.5 0.5 0.6 0.8 0.7 1.0 1.1 1.3 1.3 1.3J01XB Polymyxins 0.1 0.1 0.1 0.2 0.2 0.1 0.2 0.2 0.4 0.2J01XC Steroid antibacterials (fusidic acid) 0.0 0.0 0.0 0.0 0.0 0.0 0.1 0.1 0.0 0.0J01XD Imidazole derivatives 1.5 1.6 1.7 1.5 1.7 1.8 1.7 1.8 1.9 2.2J01XE Nitrofuran derivatives 0.5 0.7 0.9 1.0 1.0 1.1 1.2 1.1 1.2 1.2J01XX05 Methenamine 0.0 0.0 0.0 0.0 0.0 0.0 0.0 0.0 0.0 0.0J01XX08 Linezolid 0.0 0.0 0.0 0.0 0.0 0.0 0.1 0.1 0.1 0.1J01 Antibiotics for systemic use (total)
(DDD/100 patient days)50.0 51.9 53.7 58.5 62.2 61.6 66.8 70.9 70.2 71.3
J01 Antibiotics for systemic use (total) (DDD/100 admissions)
336.3 333.3 306.8 316.9 335.9 337.5 344.7 321.29 315.9 306.37
* From the 2011 edition of the Anatomical Therapeutic Chemical (ATC) classification system
N E T H M A P 2 0 1 3
18
Distr
ibutio
n (%
)
0
10
20
30
40
50
60
70
80
90
100
total
N=75
university hospitals
N=8
large teaching hospitals
N=26
general hospitals
N=41
J01XX other antibacterials
J01XE nitrofuran derivatives
J01XD imidazole derivatives
J01XC steroid antibacterials (fusidic acid)
J01XB polymyxins
J01XA glycopeptides
J01MB other quinolones
J01MA fluoroquinolones
J01GB aminoglycosides
J01FF lincosamides
J01FA macrolides
J01EE combinations of sulfonamides and trimethoprim, including derivatives
J01EC intermediate-acting sulfonamides
J01EA trimethoprim and derivatives
J01DH carbapenems
J01DF monobactams
J01DB -DE cephalosporins
J01CR combinations of penicillins, incl. beta-lactamase-inhibitors
J01CF beta-lactamase resistant penicillins
J01CE beta-lactamase sensitive penicillins
J01CA penicillins with extended spectrum
J01AA tetracyclines
Figure 3.02
Figure 3.2. Distribution (%) of the use of antibiotics for systemic use (J01) in hospitals, 2011 (Source: SWAB)
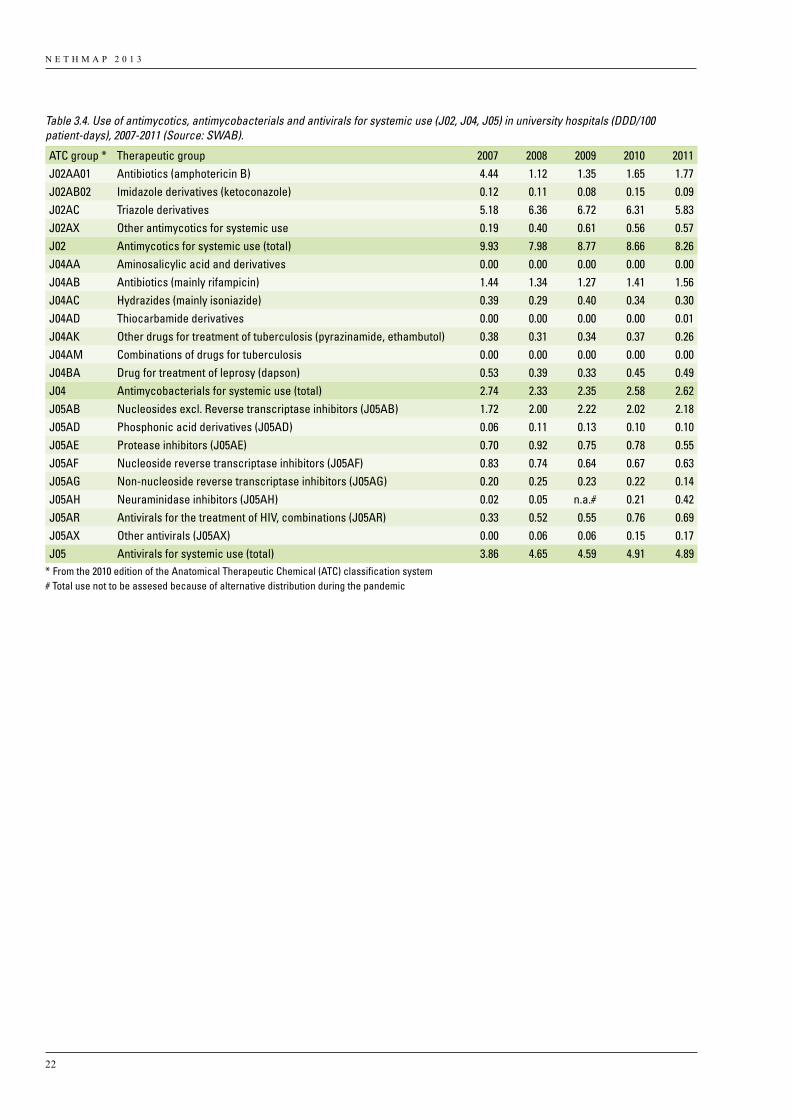
4.89 DDD/100 patient-days, most of it is from use of nucleosides (excl. reverse transcriptase inhibitors).From PREZIES, in 2012 we received data from thirty two hospitals participating in the point prevalence study, including 9599 patients of which 3067 received antibiotics, with a total of 4006 prescriptions (2154 for community acquired infections, 530 for nosocomial infections, 596 for medical prophylaxis, 351 for surgical prophylaxis and 375 for other or unknown indications.) Antibiotics most often prescribed were amoxicillin with clavulanic acid (20%), ciprofloxacin (12%) and cefuroxim (7%). The respective distribution for community acquired and nosocomial infections are shown in Figure 3.5. Amoxicillin with clavulanic acid was most often used in both types of infection. Also surgical and medical prophylaxis are depicted. Cefazolin was used in 49% cases of surgical prophylaxis. The use
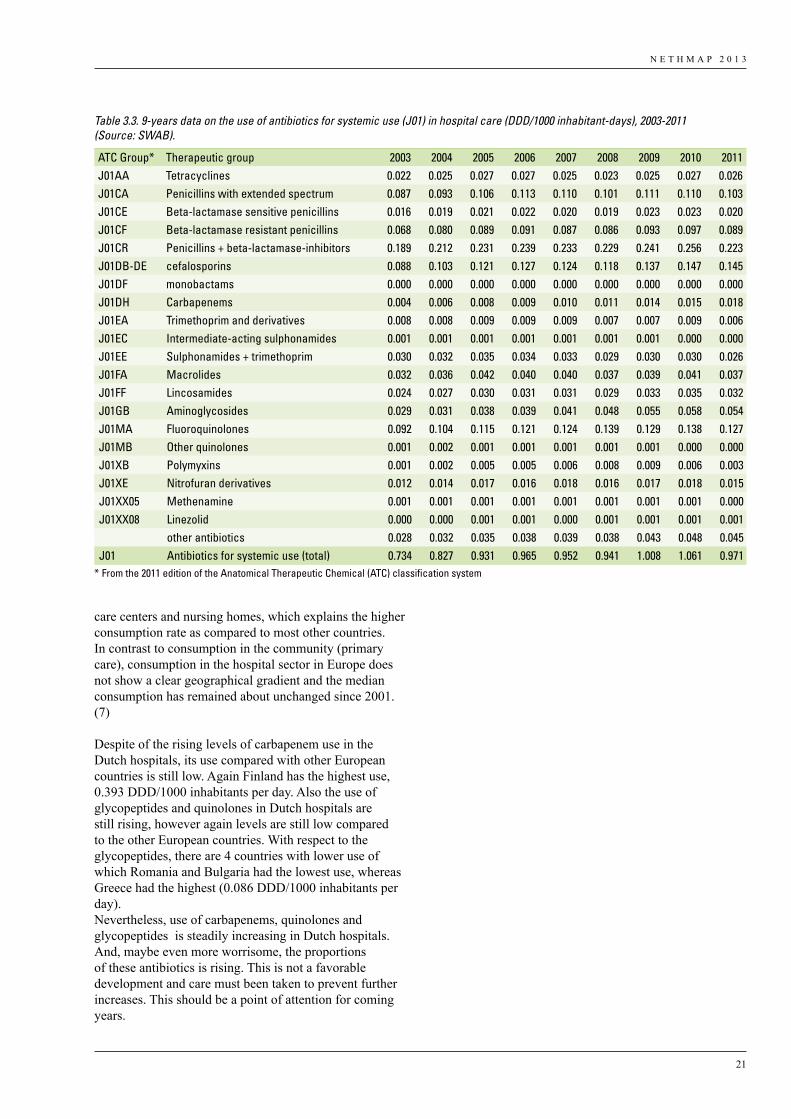
of systemic antibiotics (J01) in DDD/1000 inhabitants per day (Table 3.3). In contrast to the expression in DDD/100 patient-days, DDD/1000 inhabitants per day is slightly declining when compared to 2010. From 2003 to 2011 an increased use from 0.73 to 0.97 DDD/1000 inhabitants per day is seen. The distribution over the various antibiotic classes are the same as when expression in DDD/100 patient-days. Over 75% of the antimycotics (J02), antimycobacterials (J04) and antivirals (J05) for systemic use are used in university hospitals. General and large teaching hospitals only use these substances occasionally. Table 3.4 depicts use of J02, J04 and J05 in university hospitals from 2007 until 2011, expressed in DDD/100 patient-days. The use of antimycotics and antimycobacterials fluctuate over the years but remain around the same level. However, the use of antivirals is slowly increasing from 3.86 to
N E T H M A P 2 0 1 3
19
0
4
8
12
16
DDD/
100 p
atien
t-day
s
0
20
40
60
80
90
DDD/
100 a
dmiss
ions
A B
ampicillin (J01CA01 ) amoxicillin (J01CA04)benzylpenicillin (J01CE01)flucloxacillin (J01CF05) co-amoxiclav (J01CR02)piperacillin-tazobactam (J01CR05)
0
1
2
3
4
DDD/
100 p
atien
t-day
s
0
5
10
15
20
25
DDD/
100 a
dmiss
ions
first-generation (J01DB) second-generation (J01DC) third-generation (J01DD) fourth-generation (J01DE)
DDD/
100 p
atien
t-day
s
DDD/
100 a
dmiss
ions
0
1
2
3
4
5
meropenem (J01DH02) ertrapenem (J01DH03) doripenem (J01DH04) imipenem and enzyme inhibitor (J01DH51)
cephalosporins:
'02 '03 '04 '05 '06 '07 '08 '09 '10 '11 '02 '03 '04 '05 '06 '07 '08 '09 '10 '11
'02 '03 '04 '05 '06 '07 '08 '09 '10 '11 '02 '03 '04 '05 '06 '07 '08 '09 '10 '11
'02 '03 '04 '05 '06 '07 '08 '09 '10 '11 '02 '03 '04 '05 '06 '07 '08 '09 '10 '110
0.2
0.4
0.6
0.8
1.0
1.2
Figure 3.03
Figure 3.3. Use of beta-lactams in hospitals, expressed as DDD/100 patient-days (A) and DDD/100 admissions (B), 2002-2011 (Source: SWAB).
for medical prophylaxis is more diverse, trimethoprim/sulfamethoxazol was most often used (14%).
DiscussionTotal systemic antibiotic use over the past ten years expressed in DDD/100 patient-days increased, whereas it decreased when expressed in DDD/100 admissions, as described in detail in a publication by Kwint et al in 2012 (6). Hospital admissions in this period increased by 34%, while length of stay decreased by 36%. This means that, on average, individual patients were exposed to the same amount of antibiotics, but because more patients were admitted to the hospital, total use of antibiotics in Dutch hospitals increased. Presuming that the duration of antibiotic therapy for one patient did not change, the most likely consequence of a shortening of the duration of hospital stay, is that the antibiotic therapy is continued extramurally. However, this potential shift in use is not measurable in outpatient data.
Another consequence of a reduction in the duration of hospital stay is that more patients with antibiotic treatment can be admitted per bed during a specific period. This results in an intensification of antibiotic treatment per patient-day and per hospital bed, which may cause increased selection pressure towards resistance.
For European comparison purposes antibiotic use is expressed in DDD/1000 inhabitants per day. In 2011, the Netherlands had a hospital care antibiotic use of 0.97 DDD/1000 inhabitants per day, which is the lowest level of antibiotic use in hospitals compared with other European countries. Highest users were Finland and Latvia with hospital antibiotic use of 3.4 and. 2.9 DDD/1000 inhabitants per day respectively. Finland and Latvia also had a relatively high proportion of hospital use, respectively 13% and 21% of the total antibiotic use in these countries. In Finland, data from the hospital sector include consumption in remote primary health
N E T H M A P 2 0 1 3
20
Figure 3.4. Use of macrolides, aminoglycoside, fluoroquinolones and glycopeptides in hospitals, expressed as DDD/100 patient-days (A) and DDD/100 admissions (B), 2002-2012 (Source: SWAB).
DDD/
100 p
atien
t-day
s
DDD/
100 a
dmiss
ions
0
0.4
0.8
1.2
1.6
0
2
4
6
8
10
erythromycin (J01FA01) roxithromycin (J01FA06) clarithromycin (J01FA09) azithromycin (J01FA10)
DDD/
100 p
atien
t-day
s
DDD/
100 a
dmiss
ions
tobramycin (J01GB01) gentamicin parenteral (J01GB03) gentamicin local (J01GB03) amikacin (J01GB06)
DDD/
100 p
atien
t-day
s
DDD/
100 a
dmiss
ions
A B
DDD/
100 p
atien
t-day
s
DDD/
100 a
dmiss
ions
0
2
4
6
8
10
0
10
20
30
40
50
ofloxacin (J01MA01) ciprofloxacin (J01MA02) norfloxacin (J01MA06) levofloxacin (J01MA12) moxifloxacin (J01MA14)
0.0
0.2
0.4
0.6
0.8
1.0
1.2
1.4
0.0
1.0
2.0
3.0
4.0
5.0
6.0
vancomycin (J01XA01) teicoplanin (J01XA02)
'02 '03 '04 '05 '06 '07 '08 '09 '10 '11 '02 '03 '04 '05 '06 '07 '08 '09 '10 '11
'02 '03 '04 '05 '06 '07 '08 '09 '10 '11 '02 '03 '04 '05 '06 '07 '08 '09 '10 '11
'02 '03 '04 '05 '06 '07 '08 '09 '10 '11 '02 '03 '04 '05 '06 '07 '08 '09 '10 '11
0.0
0.4
0.8
1.2
1.6
2.0
0
2
4
6
8
10
Figure 3.04
N E T H M A P 2 0 1 3
21
care centers and nursing homes, which explains the higher consumption rate as compared to most other countries. In contrast to consumption in the community (primary care), consumption in the hospital sector in Europe does not show a clear geographical gradient and the median consumption has remained about unchanged since 2001. (7)
Despite of the rising levels of carbapenem use in the Dutch hospitals, its use compared with other European countries is still low. Again Finland has the highest use, 0.393 DDD/1000 inhabitants per day. Also the use of glycopeptides and quinolones in Dutch hospitals are still rising, however again levels are still low compared to the other European countries. With respect to the glycopeptides, there are 4 countries with lower use of which Romania and Bulgaria had the lowest use, whereas Greece had the highest (0.086 DDD/1000 inhabitants per day).Nevertheless, use of carbapenems, quinolones and glycopeptides is steadily increasing in Dutch hospitals. And, maybe even more worrisome, the proportions of these antibiotics is rising. This is not a favorable development and care must been taken to prevent further increases. This should be a point of attention for coming years.
Table 3.3. 9-years data on the use of antibiotics for systemic use (J01) in hospital care (DDD/1000 inhabitant-days), 2003-2011 (Source: SWAB).
ATC Group* Therapeutic group 2003 2004 2005 2006 2007 2008 2009 2010 2011J01AA Tetracyclines 0.022 0.025 0.027 0.027 0.025 0.023 0.025 0.027 0.026J01CA Penicillins with extended spectrum 0.087 0.093 0.106 0.113 0.110 0.101 0.111 0.110 0.103J01CE Beta-lactamase sensitive penicillins 0.016 0.019 0.021 0.022 0.020 0.019 0.023 0.023 0.020J01CF Beta-lactamase resistant penicillins 0.068 0.080 0.089 0.091 0.087 0.086 0.093 0.097 0.089J01CR Penicillins + beta-lactamase-inhibitors 0.189 0.212 0.231 0.239 0.233 0.229 0.241 0.256 0.223J01DB-DE cefalosporins 0.088 0.103 0.121 0.127 0.124 0.118 0.137 0.147 0.145J01DF monobactams 0.000 0.000 0.000 0.000 0.000 0.000 0.000 0.000 0.000J01DH Carbapenems 0.004 0.006 0.008 0.009 0.010 0.011 0.014 0.015 0.018J01EA Trimethoprim and derivatives 0.008 0.008 0.009 0.009 0.009 0.007 0.007 0.009 0.006J01EC Intermediate-acting sulphonamides 0.001 0.001 0.001 0.001 0.001 0.001 0.001 0.000 0.000J01EE Sulphonamides + trimethoprim 0.030 0.032 0.035 0.034 0.033 0.029 0.030 0.030 0.026J01FA Macrolides 0.032 0.036 0.042 0.040 0.040 0.037 0.039 0.041 0.037J01FF Lincosamides 0.024 0.027 0.030 0.031 0.031 0.029 0.033 0.035 0.032J01GB Aminoglycosides 0.029 0.031 0.038 0.039 0.041 0.048 0.055 0.058 0.054J01MA Fluoroquinolones 0.092 0.104 0.115 0.121 0.124 0.139 0.129 0.138 0.127J01MB Other quinolones 0.001 0.002 0.001 0.001 0.001 0.001 0.001 0.000 0.000J01XB Polymyxins 0.001 0.002 0.005 0.005 0.006 0.008 0.009 0.006 0.003J01XE Nitrofuran derivatives 0.012 0.014 0.017 0.016 0.018 0.016 0.017 0.018 0.015J01XX05 Methenamine 0.001 0.001 0.001 0.001 0.001 0.001 0.001 0.001 0.000J01XX08 Linezolid 0.000 0.000 0.001 0.001 0.000 0.001 0.001 0.001 0.001
other antibiotics 0.028 0.032 0.035 0.038 0.039 0.038 0.043 0.048 0.045J01 Antibiotics for systemic use (total) 0.734 0.827 0.931 0.965 0.952 0.941 1.008 1.061 0.971
* From the 2011 edition of the Anatomical Therapeutic Chemical (ATC) classification system
N E T H M A P 2 0 1 3
22
Table 3.4. Use of antimycotics, antimycobacterials and antivirals for systemic use (J02, J04, J05) in university hospitals (DDD/100 patient-days), 2007-2011 (Source: SWAB).
ATC group * Therapeutic group 2007 2008 2009 2010 2011J02AA01 Antibiotics (amphotericin B) 4.44 1.12 1.35 1.65 1.77J02AB02 Imidazole derivatives (ketoconazole) 0.12 0.11 0.08 0.15 0.09J02AC Triazole derivatives 5.18 6.36 6.72 6.31 5.83J02AX Other antimycotics for systemic use 0.19 0.40 0.61 0.56 0.57J02 Antimycotics for systemic use (total) 9.93 7.98 8.77 8.66 8.26J04AA Aminosalicylic acid and derivatives 0.00 0.00 0.00 0.00 0.00J04AB Antibiotics (mainly rifampicin) 1.44 1.34 1.27 1.41 1.56J04AC Hydrazides (mainly isoniazide) 0.39 0.29 0.40 0.34 0.30J04AD Thiocarbamide derivatives 0.00 0.00 0.00 0.00 0.01J04AK Other drugs for treatment of tuberculosis (pyrazinamide, ethambutol) 0.38 0.31 0.34 0.37 0.26J04AM Combinations of drugs for tuberculosis 0.00 0.00 0.00 0.00 0.00J04BA Drug for treatment of leprosy (dapson) 0.53 0.39 0.33 0.45 0.49J04 Antimycobacterials for systemic use (total) 2.74 2.33 2.35 2.58 2.62J05AB Nucleosides excl. Reverse transcriptase inhibitors (J05AB) 1.72 2.00 2.22 2.02 2.18J05AD Phosphonic acid derivatives (J05AD) 0.06 0.11 0.13 0.10 0.10J05AE Protease inhibitors (J05AE) 0.70 0.92 0.75 0.78 0.55J05AF Nucleoside reverse transcriptase inhibitors (J05AF) 0.83 0.74 0.64 0.67 0.63J05AG Non-nucleoside reverse transcriptase inhibitors (J05AG) 0.20 0.25 0.23 0.22 0.14J05AH Neuraminidase inhibitors (J05AH) 0.02 0.05 n.a.# 0.21 0.42J05AR Antivirals for the treatment of HIV, combinations (J05AR) 0.33 0.52 0.55 0.76 0.69J05AX Other antivirals (J05AX) 0.00 0.06 0.06 0.15 0.17J05 Antivirals for systemic use (total) 3.86 4.65 4.59 4.91 4.89
* From the 2010 edition of the Anatomical Therapeutic Chemical (ATC) classification system# Total use not to be assesed because of alternative distribution during the pandemic
N E T H M A P 2 0 1 3
23
0
20
40
60
80
100
community acquiredinfections
nosocomialinfections
medicalprophylaxis
surgicalprophylaxis
other
vancomycin
trimethoprim/sulfametrol
trimethoprim/sulfamethoxazol
trimethoprim
tobramycin
teicoplanin
sulfamethoxazol
rifampicin
piperacillin/tazobactam
piperacillin
penicillin
norfloxacin
nitrofurantoin
moxifloxacin
metronidazol
meropenem
linezolid
levofloxacin
imipenem/cilastatin
gentamicin
flucloxacillin
feneticillin
erytromycin
doxycyclin
colistin
clindamycin
claritromycin
ciprofloxacin
cefuroxime
ceftriaxone
ceftazidime
cefotaxime
cefazoline
cefaclor
benzylpenicillin
azitromycin
amoxicillin/clavulanic acid
amoxicillin
Figure 3.05Pe
rcenta
ge (%
)
Figure 3.5. Distribution of the use of antibiotics for systemic use (J01); results of the point-prevalence studies 2012 (Source: PREZIES)
N E T H M A P 2 0 1 3
24
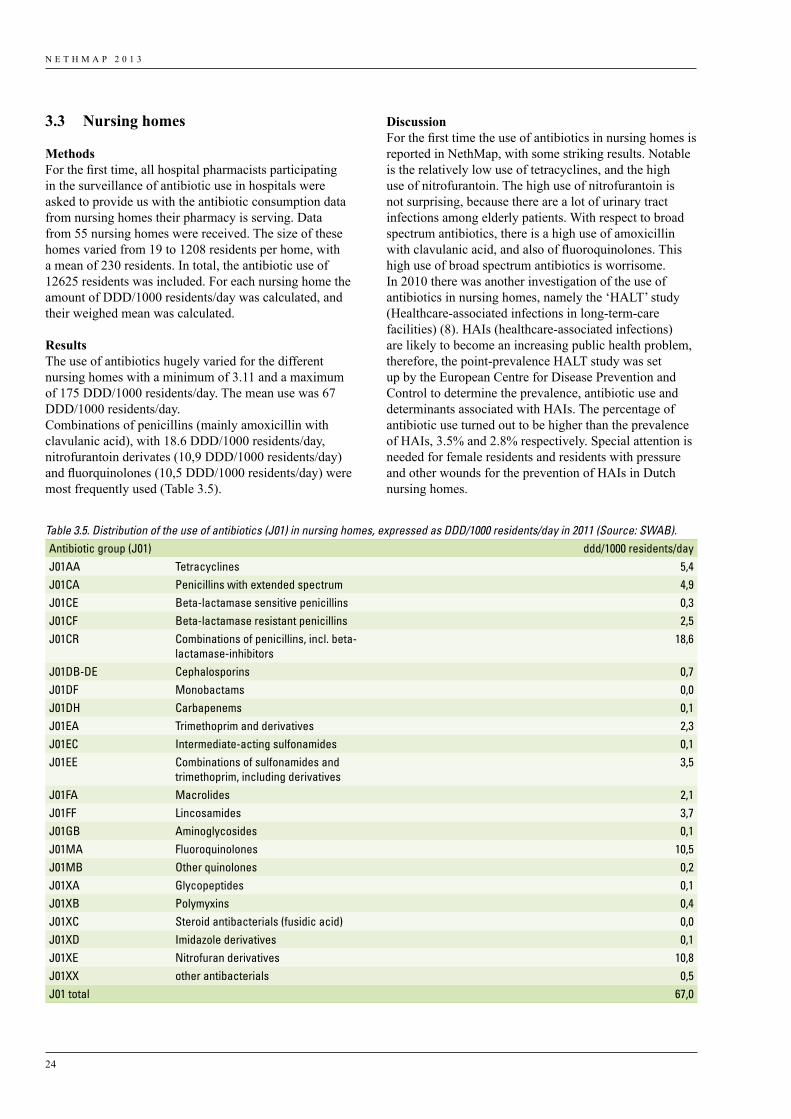
DiscussionFor the first time the use of antibiotics in nursing homes is reported in NethMap, with some striking results. Notable is the relatively low use of tetracyclines, and the high use of nitrofurantoin. The high use of nitrofurantoin is not surprising, because there are a lot of urinary tract infections among elderly patients. With respect to broad spectrum antibiotics, there is a high use of amoxicillin with clavulanic acid, and also of fluoroquinolones. This high use of broad spectrum antibiotics is worrisome.In 2010 there was another investigation of the use of antibiotics in nursing homes, namely the ‘HALT’ study (Healthcare-associated infections in long-term-care facilities) (8). HAIs (healthcare-associated infections) are likely to become an increasing public health problem, therefore, the point-prevalence HALT study was set up by the European Centre for Disease Prevention and Control to determine the prevalence, antibiotic use and determinants associated with HAIs. The percentage of antibiotic use turned out to be higher than the prevalence of HAIs, 3.5% and 2.8% respectively. Special attention is needed for female residents and residents with pressure and other wounds for the prevention of HAIs in Dutch nursing homes.
3.3 Nursing homes
MethodsFor the first time, all hospital pharmacists participating in the surveillance of antibiotic use in hospitals were asked to provide us with the antibiotic consumption data from nursing homes their pharmacy is serving. Data from 55 nursing homes were received. The size of these homes varied from 19 to 1208 residents per home, with a mean of 230 residents. In total, the antibiotic use of 12625 residents was included. For each nursing home the amount of DDD/1000 residents/day was calculated, and their weighed mean was calculated.
Results The use of antibiotics hugely varied for the different nursing homes with a minimum of 3.11 and a maximum of 175 DDD/1000 residents/day. The mean use was 67 DDD/1000 residents/day.Combinations of penicillins (mainly amoxicillin with clavulanic acid), with 18.6 DDD/1000 residents/day, nitrofurantoin derivates (10,9 DDD/1000 residents/day) and fluorquinolones (10,5 DDD/1000 residents/day) were most frequently used (Table 3.5).
Table 3.5. Distribution of the use of antibiotics (J01) in nursing homes, expressed as DDD/1000 residents/day in 2011 (Source: SWAB).Antibiotic group (J01) ddd/1000 residents/dayJ01AA Tetracyclines 5,4J01CA Penicillins with extended spectrum 4,9J01CE Beta-lactamase sensitive penicillins 0,3J01CF Beta-lactamase resistant penicillins 2,5J01CR Combinations of penicillins, incl. beta-
lactamase-inhibitors18,6
J01DB-DE Cephalosporins 0,7J01DF Monobactams 0,0J01DH Carbapenems 0,1J01EA Trimethoprim and derivatives 2,3J01EC Intermediate-acting sulfonamides 0,1J01EE Combinations of sulfonamides and
trimethoprim, including derivatives3,5
J01FA Macrolides 2,1J01FF Lincosamides 3,7J01GB Aminoglycosides 0,1J01MA Fluoroquinolones 10,5J01MB Other quinolones 0,2J01XA Glycopeptides 0,1J01XB Polymyxins 0,4J01XC Steroid antibacterials (fusidic acid) 0,0J01XD Imidazole derivatives 0,1J01XE Nitrofuran derivatives 10,8J01XX other antibacterials 0,5J01 total 67,0
N E T H M A P 2 0 1 3
25
Also at a European level antimicrobial use in nursing homes was investigated (9). Point prevalence studies were completed in April and November 2009. The Netherlands was excluded from this study as the minimum required sample size of five nursing homes was not met. With the nursing home results of this year, The Netherlands would end in the middle of the list of other European countries. The results suggest that there is considerable variation in antimicrobial use in nursing homes across and within European countries. Nursing homes provide a significant service to the European community and must be supported in order to optimize antimicrobial use and limit the development of antimicrobial resistance.
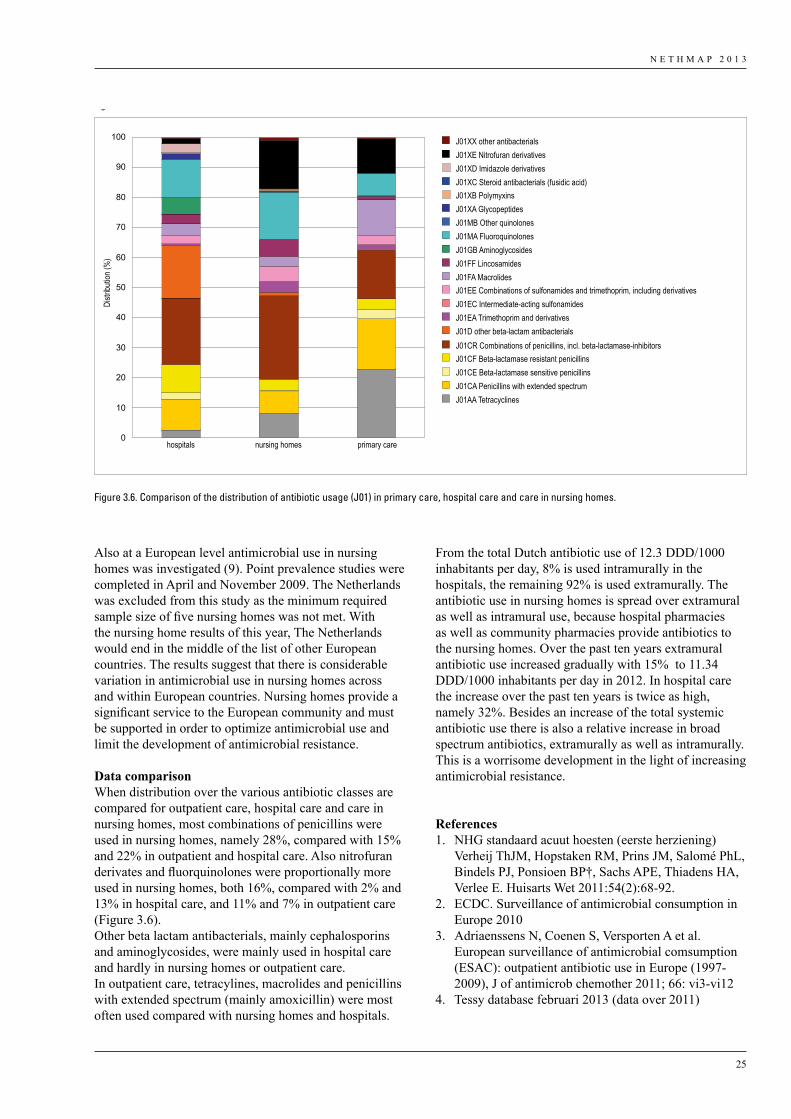
Data comparisonWhen distribution over the various antibiotic classes are compared for outpatient care, hospital care and care in nursing homes, most combinations of penicillins were used in nursing homes, namely 28%, compared with 15% and 22% in outpatient and hospital care. Also nitrofuran derivates and fluorquinolones were proportionally more used in nursing homes, both 16%, compared with 2% and 13% in hospital care, and 11% and 7% in outpatient care (Figure 3.6).Other beta lactam antibacterials, mainly cephalosporins and aminoglycosides, were mainly used in hospital care and hardly in nursing homes or outpatient care. In outpatient care, tetracylines, macrolides and penicillins with extended spectrum (mainly amoxicillin) were most often used compared with nursing homes and hospitals.
Distr
ibutio
n (%
)
0
10
20
30
40
50
60
70
80
90
100 J01XX other antibacterialsJ01XE Nitrofuran derivativesJ01XD Imidazole derivativesJ01XC Steroid antibacterials (fusidic acid)J01XB PolymyxinsJ01XA GlycopeptidesJ01MB Other quinolonesJ01MA FluoroquinolonesJ01GB AminoglycosidesJ01FF LincosamidesJ01FA MacrolidesJ01EE Combinations of sulfonamides and trimethoprim, including derivativesJ01EC Intermediate-acting sulfonamidesJ01EA Trimethoprim and derivativesJ01D other beta-lactam antibacterialsJ01CR Combinations of penicillins, incl. beta-lactamase-inhibitorsJ01CF Beta-lactamase resistant penicillinsJ01CE Beta-lactamase sensitive penicillinsJ01CA Penicillins with extended spectrumJ01AA Tetracyclines
hospitals nursing homes primary care
Figure 3.06
Figure 3.6. Comparison of the distribution of antibiotic usage (J01) in primary care, hospital care and care in nursing homes.
From the total Dutch antibiotic use of 12.3 DDD/1000 inhabitants per day, 8% is used intramurally in the hospitals, the remaining 92% is used extramurally. The antibiotic use in nursing homes is spread over extramural as well as intramural use, because hospital pharmacies as well as community pharmacies provide antibiotics to the nursing homes. Over the past ten years extramural antibiotic use increased gradually with 15% to 11.34 DDD/1000 inhabitants per day in 2012. In hospital care the increase over the past ten years is twice as high, namely 32%. Besides an increase of the total systemic antibiotic use there is also a relative increase in broad spectrum antibiotics, extramurally as well as intramurally. This is a worrisome development in the light of increasing antimicrobial resistance.
References1. NHG standaard acuut hoesten (eerste herziening)
Verheij ThJM, Hopstaken RM, Prins JM, Salomé PhL, Bindels PJ, Ponsioen BP†, Sachs APE, Thiadens HA, Verlee E. Huisarts Wet 2011:54(2):68-92.
2. ECDC. Surveillance of antimicrobial consumption in Europe 2010
3. Adriaenssens N, Coenen S, Versporten A et al. European surveillance of antimicrobial comsumption (ESAC): outpatient antibiotic use in Europe (1997-2009), J of antimicrob chemother 2011; 66: vi3-vi12
4. Tessy database februari 2013 (data over 2011)
N E T H M A P 2 0 1 3
26
5. WHO Collaborating Centre for Drug Statistics Methodology. ATC index with DDDs 2011. WHO Collaborating Centre; Oslo, Norway. 2012
6. Kwint HM, Van der Linden PD, Roukens MMB et al. Intensification of antibiotic use within acute care hospitals in the Netherlands, J of antimicrob chemother 2012; 67: 2283-2288
7. Adriaenssens N, Coenen S, Versporten A et al. European surveillance of antimicrobial consumption (ESAC): quality appraisal of antibiotic use in Europe. J of antimicrob chemother 2011; 66: vi71-vi77
8. Eilers R, Veldman-Ariesen MJ, Haenen A et al. Prevalence and determinants associated with healthcare-associated infections in long-term care facilities (HALT) in the Netherlands, May to June 2010, Euro Surveill. 2012; 17 (34): pii=20252.
9. McClean P, Tunney M, Goossens H et al. Antimicrobial prescribing in European nursing homes, JAntimicrob Chemother 2011; 66: 1609-1616
N E T H M A P 2 0 1 3
27
4.1 Methods of surveillance
In the Netherlands, the surveillance of resistance in GPs, nursing homes and hospitals, is based on three main surveillance programs: Surveillance of Extramural/Intramural Resistance In the Netherlands (SERIN and SIRIN) and ISIS-AR (Infectious Disease Surveillance Information System on Antibiotic Resistance). Below, a brief overview of the methods are decribed; more details can be found at www.swab.org.
SERINIn the SERIN program specific studies in the extramural setting are performed each year. Three studies are reported here, one in patients visiting the GP and two in nursing homes. In the first, the prevalence and antibiotic resistance of S.aureus isolated from the nares of patients (aged > 3 years) visiting the GP for a non-infectious condition was studied. Twenty GPs from the NIVEL sentinel network participated in the study. This study was part of the “Appropriateness of prescribing antibiotics in primary health care in Europe with respect to antibiotic resistance” (APRES) study comparing the prevalence of nasal S. aureus carriage and antibiotic resistance, including MRSA, among healthy patients between nine European countries. Exclusion criteria were: prescription of antimicrobial agents or hospitalization in the previous three months, immunocompromised patients, diabetes mellitus and nursing home residents. Resistance of S. aureus was quantitatively determined by microdilution and breakpoints for resistance according to EUCAST guidelines were applied. Isolates with MIC values >= 1 mg/l to oxacillin were analysed for the presence of the mecA gene using a real time PCR according to international standards. Multi drug resistance (MDR) was defined as resistant to three or more antibiotic classes. Azithromycin, erythromycin and clindamycin were grouped together in one class. To control for the influence of age and sex on the prevalence of S. aureus carriage and the possible clustering of S. aureus carriage at a GP level we calculated the prevalence using a multilevel logistic regression model. The multilevel model had three levels ( i.e. country, GP and patients) and estimated the prevalence of S. aureus based on the age and sex sample structure (the total study population). In calculating the prevalence of MRSA, both the number of isolated S. aureus strains and the total study population were used as denominator.The study in nursing homes involved long-stay residents from 17 nursing homes in the province of Limburg. They were eligible for participation, when they had signed the consent form (either by themselves or their legal representative). Twelve from 17 nursing homes were located in the northern part of Limburg which is an area with a lot of livestock, and five nursing homes were
situated in the southern part which is near the German and Belgian border. A total of 570 asymptomatic residents were included, of whom 532 could be evaluated. Urine samples were collected and used to inoculate an uricult. If a patient suffered from incontinence the uricult was pressed onto the incontinence pad. The uricults were analysed for the presence of E. coli; identification was performed using standard biochemical methods. Quantitative susceptibility testing was performed by microbroth dilution for amoxicillin, co-amoxiclav, trimethoprim, co-trimoxazole, gentamicin, nitrofurantoin and ciprofloxacin. Breakpoints for resistance were used according to the EUCAST guidelines. E. coli ATCC 35218 and ATCC 25922 were used as control strains. Multi drug resistance (MDR) was defined as resistance to three or more classes of antibiotics according to the international CMI guidelines.Production of an extended spectrum beta-lactamase (ESBL) was detected by a combination disk diffusion test according to the guidelines of the Dutch Society for Medical Microbiology.Six nursing homes in the Southern part of the province of Limburg with 1075 long-stay residents were eligible for participation in a study looking at S.aureus colonization and susceptibility, in particular methicillin resistance and quinolone resistance; only those who signed the consent form (either by themselves or their legal representative) were included. Finally 332 residents were included. Nasal swabs were taken and the susceptibility of isolated S. aureus strains were performed as previously described.Oxacillin resistant S.aureus were analyzed for the presence of the mecA gene using a real time PCR assay. Amplification of the spa locus, followed by sequencing was performed on all MRSA isolates. The spa types were clustered into clonal complexes (spa - CC) using the algorithm based upon repeat pattern (BURP) with the Ridom StaphType version 2.2.1.
ISIS-ARSince 2008, the Infectious Disease Surveillance Information System for Antibiotic Resistance (ISIS-AR) collects routinely available antimicrobial susceptibility data of all isolates from Dutch medical laboratories, including underlying MIC values and disk zone diameters. ISIS-AR is a combined initiative of the Ministry of Health, Welfare and Sport and the Dutch Society of Medical Microbiology (NVMM). The Centre for Infectious Disease Control at the National Institute for Public Health and the Environment (RIVM) in Bilthoven, the Netherlands, coordinates the collection of data. In 2012, 32 laboratories reported results to ISIS-AR; three laboratories serving university hospitals, 28 laboratories serving non-university hospitals and general practitioners and one laboratory only serving general practitioners. For
4. Surveillance of resistance
N E T H M A P 2 0 1 3
28
23 laboratories complete data from the beginning of 2008 until the end of 2012 were available, and therefore these laboratories were included in the current analyses for NethMap 2013.
We selected the first isolate per species per patient per year. Isolates for screening and inventory purposes were excluded. We calculated resistance levels and time trends from 2008 to 2012 for the most prevalent pathogens and their main antimicrobial treatment options. Compound-pathogen combinations were included if at least 50% of the isolates in a laboratory was tested for that specific compound in at least 50% of included laboratories. We applied European Committee on Antimicrobial Susceptibility Testing (EUCAST) 2012 breakpoints to the reported MICs of automated susceptibility test systems or Etests to calculate the prevalence of resistant isolates (“R”) and the prevalence of non-susceptible isolates (“I+R”) if at least 80% of the reported MICs were interpretable. This was true for all included gram-negative species (E. coli, P. mirabilis, K. pneumoniae, E. cloacae, P. aeruginosa, Acinetobacter spp.), S. aureus and coagulase-negative staphylococci including S. epidermidis. For H. influenzae, S. pneumoniae, M. catarrhalis, E. faecium and E. faecalis less than 80% of the MICs could be interpreted when applying the EUCAST recommendations and therefore the “S-I-R” interpretations, as reported by the 11 local laboratories that used EUCAST recommendations in 2012, were included for calculating the prevalence of resistant isolates and the prevalence of non-susceptible isolates.
To assess the reliability and representativeness of the results on resistance prevalence, we checked for each pathogen whether the monthly number of isolates per included laboratory was constant. Furthermore, for each bug-drug combination we created a funnelplot of resistance data. Data from laboratories with a difference from the mean that was larger than three times the standard deviation were excluded, if there was no explanation for this large deviation. Potential explanations found for large deviations were (1) that data came from a university hospital (usually showing a larger percentage of resistance) or (2) differences in methods used between laboratories; in the 4 laboratories that used the Phoenix automated susceptibility testing system (Becton Dickinson) a 10% higher level of resistance to co-amoxiclav was found compared with the 19 laboratories in which the Vitek automated susceptibility testing system (BioMerieux) was used.
The adoption of new guidelines or changes in breakpoints can have a substantial impact on the outcome and implications of antimicrobial resistance surveillance. To avoid bias in time trends, we only analysed trends for those species for which MICs were interpretable by the EUCAST breakpoints (i.e., E. coli, P. mirabilis, K.
pneumoniae, E. cloacae, P. aeruginosa, Acinetobacter spp. and S. aureus and coagulase-negative staphylococci including S. epidermidis). Time trends were analysed for the prevalence of resistant isolates as well as for the prevalence of non-susceptible isolates. Trends in resistance over time were tested by the Cochran-Armitage test. Two sided p-values <0.05 were considered significant.
Data are presented by site [i.e. general practice (GP), outpatient departments (OPD), non-ICU hospital departments, ICU departments, and urology departments] for each compound-pathogen combination. Antimicrobial susceptibility results for GP and urology departments are based on urinary isolates only. For the OPD and hospital departments, the antimicrobial susceptibility results are from blood, liquor, wound, lower respiratory tract and urinary isolates combined, except for the results presented on H. influenzae, S. pneumoniae, M. catarrhalis for which also isolates from the higher respiratory tract are included.
For the data on GP patients obtained from ISIS-AR, only urinary isolates are included. GPs usually send urine samples for culture and susceptibility testing in case of complicated UTI or when there is no response to antimicrobial therapy. Isolates will therefore over-represent urinary isolates from women with complicated urinary tract infections, men, young children and persons that did not respond to the initial antimicrobial therapy. The presented resistance levels are therefore not representative for all patients with urinary tract infections presenting at the GP. Therefore, these patients are further referred to as ‘selected GP patients’.Sampling of respiratory tract infections in GP patients is not routinely performed and only a limited number of samples from patients attending a GP were available. Results may therefore not be representative for all community respiratory bacterial pathogens. Compound-pathogen combinations were included if at least 50% of the isolates in a laboratory was tested for that specific compound in at least 50% of included laboratories. Resistance levels are therefore available for a limited number of compound-pathogen combinations because most laboratories only test for a small number of identical antimicrobial agents.
Results on non-susceptibility are not routinely presented in NethMap 2013. However, relevant differences in results on resistance and non-susceptibility are mentioned in the key messages. To enable the interpretation of time trends for compound-pathogens combinations with low resistance levels, figures only show time trends for which the prevalence of resistance is below 30%.
In some tables, data are presented for a combination of compounds with comparable resistance mechanisms, namely amoxicillin/ampicillin, ceftriaxone/cefotaxime,
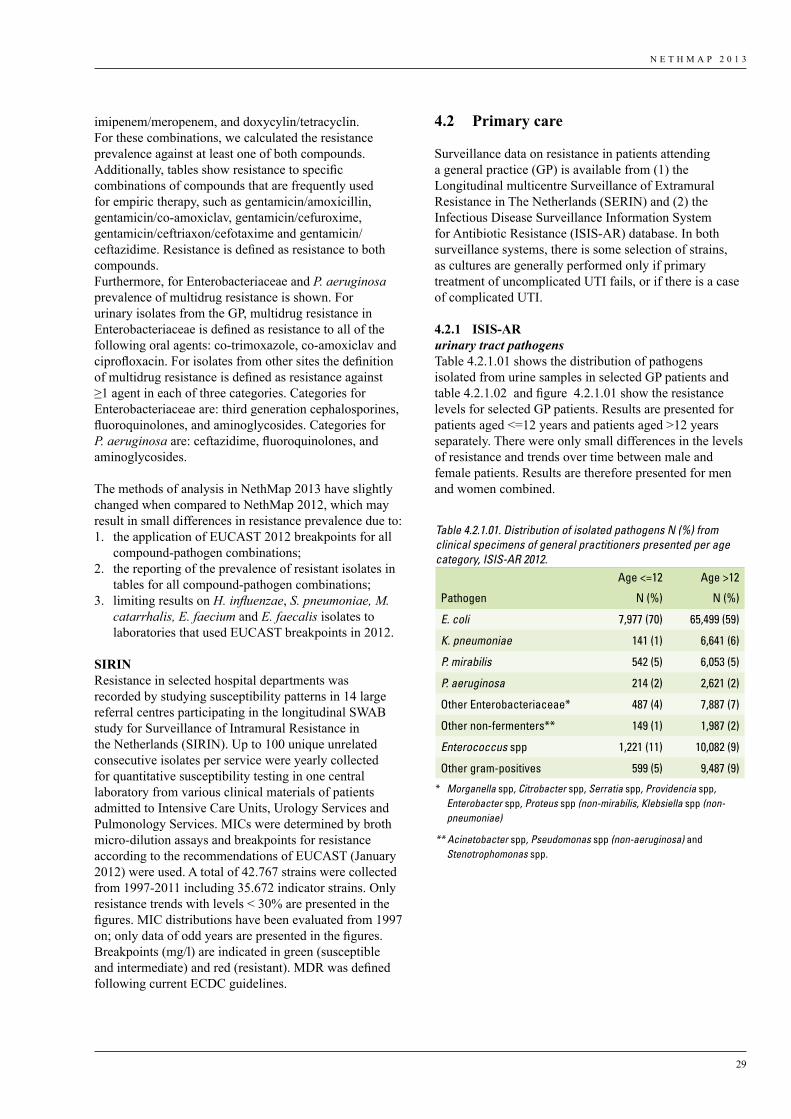
N E T H M A P 2 0 1 3
29
imipenem/meropenem, and doxycylin/tetracyclin. For these combinations, we calculated the resistance prevalence against at least one of both compounds. Additionally, tables show resistance to specific combinations of compounds that are frequently used for empiric therapy, such as gentamicin/amoxicillin, gentamicin/co-amoxiclav, gentamicin/cefuroxime, gentamicin/ceftriaxon/cefotaxime and gentamicin/ceftazidime. Resistance is defined as resistance to both compounds. Furthermore, for Enterobacteriaceae and P. aeruginosa prevalence of multidrug resistance is shown. For urinary isolates from the GP, multidrug resistance in Enterobacteriaceae is defined as resistance to all of the following oral agents: co-trimoxazole, co-amoxiclav and ciprofloxacin. For isolates from other sites the definition of multidrug resistance is defined as resistance against ≥1 agent in each of three categories. Categories for Enterobacteriaceae are: third generation cephalosporines, fluoroquinolones, and aminoglycosides. Categories for P. aeruginosa are: ceftazidime, fluoroquinolones, and aminoglycosides.
The methods of analysis in NethMap 2013 have slightly changed when compared to NethMap 2012, which may result in small differences in resistance prevalence due to: 1. the application of EUCAST 2012 breakpoints for all
compound-pathogen combinations;2. the reporting of the prevalence of resistant isolates in
tables for all compound-pathogen combinations;3. limiting results on H. influenzae, S. pneumoniae, M.
catarrhalis, E. faecium and E. faecalis isolates to laboratories that used EUCAST breakpoints in 2012.
SIRINResistance in selected hospital departments was recorded by studying susceptibility patterns in 14 large referral centres participating in the longitudinal SWAB study for Surveillance of Intramural Resistance in the Netherlands (SIRIN). Up to 100 unique unrelated consecutive isolates per service were yearly collected for quantitative susceptibility testing in one central laboratory from various clinical materials of patients admitted to Intensive Care Units, Urology Services and Pulmonology Services. MICs were determined by broth micro-dilution assays and breakpoints for resistance according to the recommendations of EUCAST (January 2012) were used. A total of 42.767 strains were collected from 1997-2011 including 35.672 indicator strains. Only resistance trends with levels < 30% are presented in the figures. MIC distributions have been evaluated from 1997 on; only data of odd years are presented in the figures. Breakpoints (mg/l) are indicated in green (susceptible and intermediate) and red (resistant). MDR was defined following current ECDC guidelines.
4.2 Primary care
Surveillance data on resistance in patients attending a general practice (GP) is available from (1) the Longitudinal multicentre Surveillance of Extramural Resistance in The Netherlands (SERIN) and (2) the Infectious Disease Surveillance Information System for Antibiotic Resistance (ISIS-AR) database. In both surveillance systems, there is some selection of strains, as cultures are generally performed only if primary treatment of uncomplicated UTI fails, or if there is a case of complicated UTI.
4.2.1 ISIS-AR urinary tract pathogensTable 4.2.1.01 shows the distribution of pathogens isolated from urine samples in selected GP patients and table 4.2.1.02 and figure 4.2.1.01 show the resistance levels for selected GP patients. Results are presented for patients aged <=12 years and patients aged >12 years separately. There were only small differences in the levels of resistance and trends over time between male and female patients. Results are therefore presented for men and women combined.
Table 4.2.1.01. Distribution of isolated pathogens N (%) from clinical specimens of general practitioners presented per age category, ISIS-AR 2012.
Age <=12 Age >12
Pathogen N (%) N (%)
E. coli 7,977 (70) 65,499 (59)
K. pneumoniae 141 (1) 6,641 (6)
P. mirabilis 542 (5) 6,053 (5)
P. aeruginosa 214 (2) 2,621 (2)
Other Enterobacteriaceae* 487 (4) 7,887 (7)
Other non-fermenters** 149 (1) 1,987 (2)
Enterococcus spp 1,221 (11) 10,082 (9)
Other gram-positives 599 (5) 9,487 (9)
* Morganella spp, Citrobacter spp, Serratia spp, Providencia spp, Enterobacter spp, Proteus spp (non-mirabilis, Klebsiella spp (non-pneumoniae)
** Acinetobacter spp, Pseudomonas spp (non-aeruginosa) and Stenotrophomonas spp.
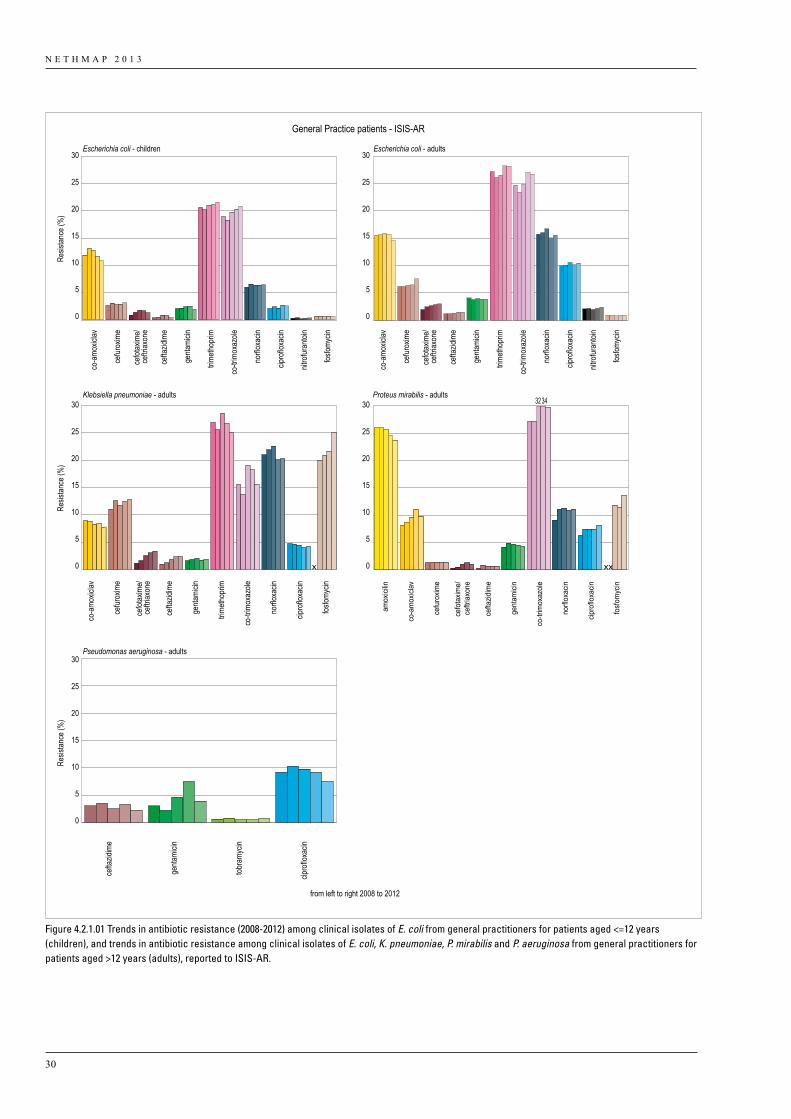
N E T H M A P 2 0 1 3
30
from left to right 2008 to 2012
General Practice patients - ISIS-AR
25
20
15
10
5
0
30
25
20
15
10
5
0
30
Resis
tance
(%)
25
20
15
10
5
0
30
25
20
15
10
5
0
30
Resis
tance
(%)
25
20
15
10
5
0
30
Resis
tance
(%)
co-a
moxic
lav
cefur
oxim
e
cefot
axim
e/ce
ftriax
one
cefot
axim
e/ce
ftriax
one
cefta
zidim
e
genta
micin
trimeth
oprim
co-tr
imox
azole
norflo
xacin
cipro
floxa
cin
nitro
furan
toin
fosfom
ycin
co-a
moxic
lav
cefur
oxim
e
cefot
axim
e/ce
ftriax
one
cefta
zidim
e
genta
micin
trimeth
oprim
co-tr
imox
azole
norflo
xacin
cipro
floxa
cin
nitro
furan
toin
fosfom
ycin
Escherichia coli - children Escherichia coli - adults
Klebsiella pneumoniae - adults
Pseudomonas aeruginosa - adults
Proteus mirabilis - adults
co-a
moxic
lav
cefur
oxim
e
cefta
zidim
e
genta
micin
trimeth
oprim
co-tr
imox
azole
norflo
xacin
cipro
floxa
cin
fosfom
ycin
amox
icilin
co-a
mox
iclav
cefu
roxim
e
cefo
taxim
e/ce
ftriax
one
cefta
zidim
e
gent
amici
n
co-tr
imox
azole
norfl
oxac
in
cipro
floxa
cin
fosfo
myc
in
cefta
zidim
e
genta
micin
tobra
mycin
cipro
floxa
cin
32 34
Figure 4.2.1.01 Trends in antibiotic resistance (2008-2012) among clinical isolates of E. coli from general practitioners for patients aged <=12 years (children), and trends in antibiotic resistance among clinical isolates of E. coli, K. pneumoniae, P. mirabilis and P. aeruginosa from general practitioners for patients aged >12 years (adults), reported to ISIS-AR.
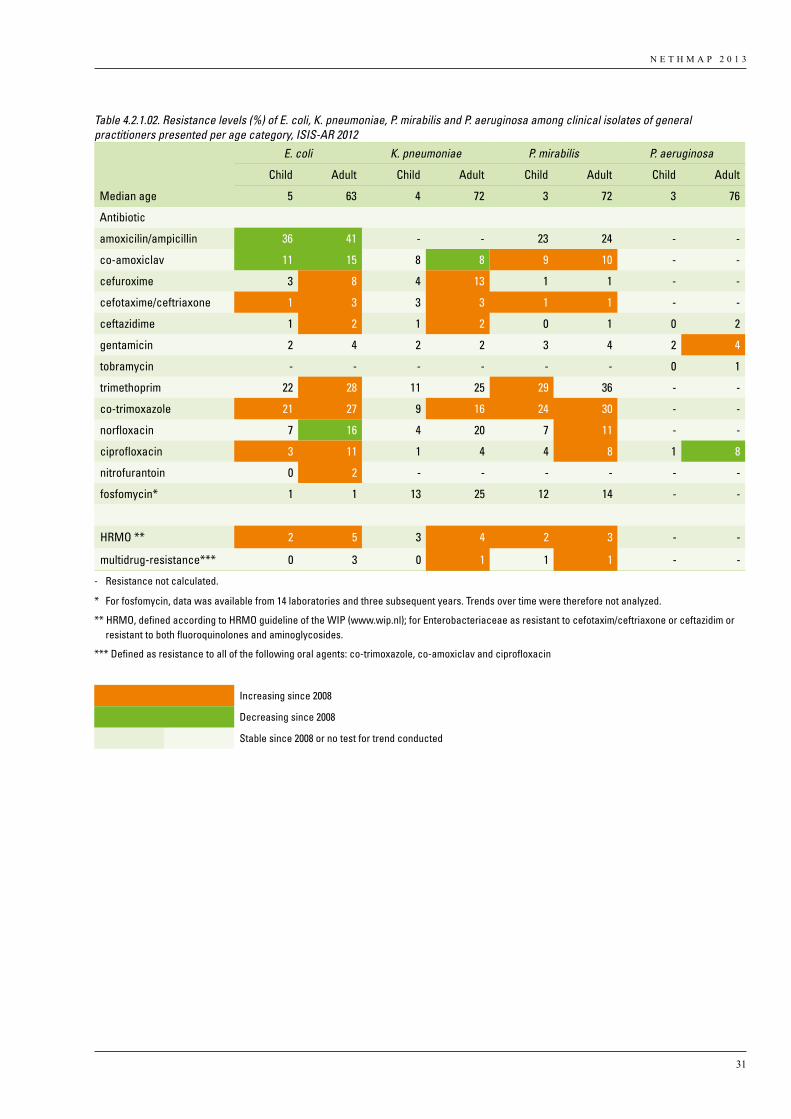
N E T H M A P 2 0 1 3
31
Table 4.2.1.02. Resistance levels (%) of E. coli, K. pneumoniae, P. mirabilis and P. aeruginosa among clinical isolates of general practitioners presented per age category, ISIS-AR 2012
E. coli K. pneumoniae P. mirabilis P. aeruginosa
Child Adult Child Adult Child Adult Child Adult
Median age 5 63 4 72 3 72 3 76
Antibiotic
amoxicilin/ampicillin 36 41 - - 23 24 - -
co-amoxiclav 11 15 8 8 9 10 - -
cefuroxime 3 8 4 13 1 1 - -
cefotaxime/ceftriaxone 1 3 3 3 1 1 - -
ceftazidime 1 2 1 2 0 1 0 2
gentamicin 2 4 2 2 3 4 2 4
tobramycin - - - - - - 0 1
trimethoprim 22 28 11 25 29 36 - -
co-trimoxazole 21 27 9 16 24 30 - -
norfloxacin 7 16 4 20 7 11 - -
ciprofloxacin 3 11 1 4 4 8 1 8
nitrofurantoin 0 2 - - - - - -
fosfomycin* 1 1 13 25 12 14 - -
HRMO ** 2 5 3 4 2 3 - -
multidrug-resistance*** 0 3 0 1 1 1 - -
- Resistance not calculated.
* For fosfomycin, data was available from 14 laboratories and three subsequent years. Trends over time were therefore not analyzed.
** HRMO, defined according to HRMO guideline of the WIP (www.wip.nl); for Enterobacteriaceae as resistant to cefotaxim/ceftriaxone or ceftazidim or resistant to both fluoroquinolones and aminoglycosides.
*** Defined as resistance to all of the following oral agents: co-trimoxazole, co-amoxiclav and ciprofloxacin
Increasing since 2008
Decreasing since 2008
Stable since 2008 or no test for trend conducted
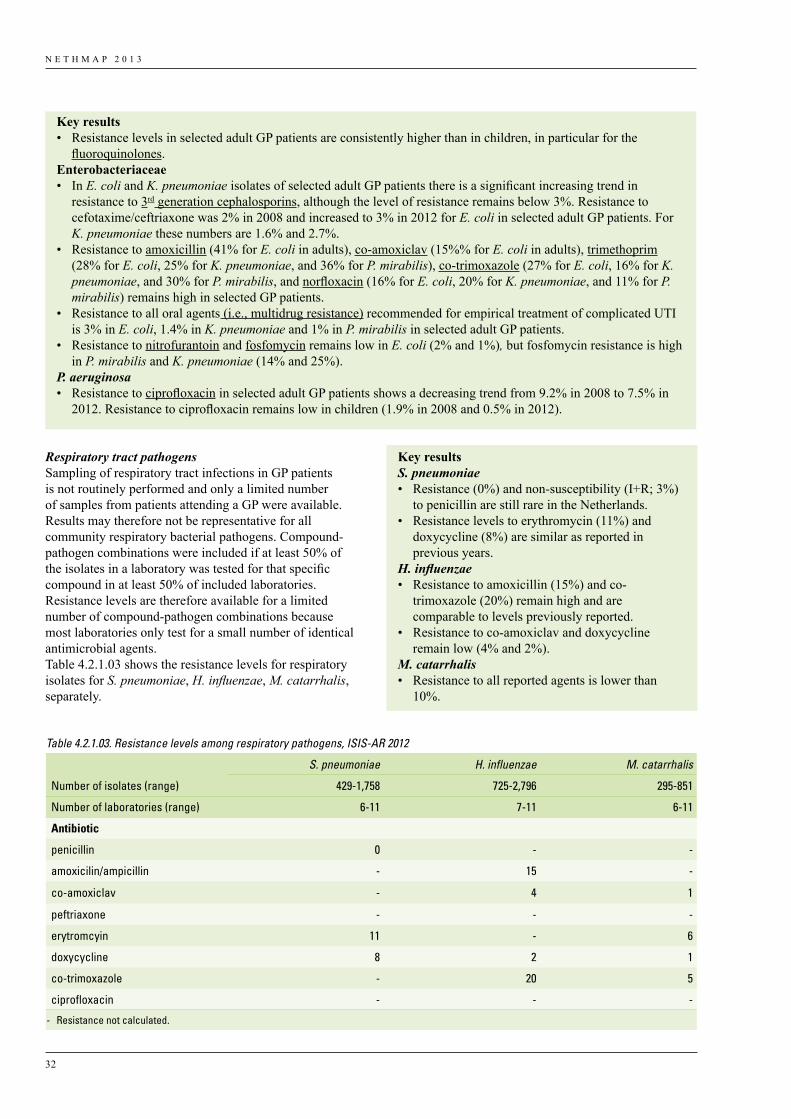
N E T H M A P 2 0 1 3
32
Respiratory tract pathogens Sampling of respiratory tract infections in GP patients is not routinely performed and only a limited number of samples from patients attending a GP were available. Results may therefore not be representative for all community respiratory bacterial pathogens. Compound-pathogen combinations were included if at least 50% of the isolates in a laboratory was tested for that specific compound in at least 50% of included laboratories. Resistance levels are therefore available for a limited number of compound-pathogen combinations because most laboratories only test for a small number of identical antimicrobial agents. Table 4.2.1.03 shows the resistance levels for respiratory isolates for S. pneumoniae, H. influenzae, M. catarrhalis, separately.
Key results• Resistance levels in selected adult GP patients are consistently higher than in children, in particular for the
fluoroquinolones. Enterobacteriaceae• In E. coli and K. pneumoniae isolates of selected adult GP patients there is a significant increasing trend in
resistance to 3rd generation cephalosporins, although the level of resistance remains below 3%. Resistance to cefotaxime/ceftriaxone was 2% in 2008 and increased to 3% in 2012 for E. coli in selected adult GP patients. For K. pneumoniae these numbers are 1.6% and 2.7%.
• Resistance to amoxicillin (41% for E. coli in adults), co-amoxiclav (15%% for E. coli in adults), trimethoprim (28% for E. coli, 25% for K. pneumoniae, and 36% for P. mirabilis), co-trimoxazole (27% for E. coli, 16% for K. pneumoniae, and 30% for P. mirabilis, and norfloxacin (16% for E. coli, 20% for K. pneumoniae, and 11% for P. mirabilis) remains high in selected GP patients.
• Resistance to all oral agents (i.e., multidrug resistance) recommended for empirical treatment of complicated UTI is 3% in E. coli, 1.4% in K. pneumoniae and 1% in P. mirabilis in selected adult GP patients.
• Resistance to nitrofurantoin and fosfomycin remains low in E. coli (2% and 1%), but fosfomycin resistance is high in P. mirabilis and K. pneumoniae (14% and 25%).
P. aeruginosa • Resistance to ciprofloxacin in selected adult GP patients shows a decreasing trend from 9.2% in 2008 to 7.5% in
2012. Resistance to ciprofloxacin remains low in children (1.9% in 2008 and 0.5% in 2012).
Table 4.2.1.03. Resistance levels among respiratory pathogens, ISIS-AR 2012
S. pneumoniae H. influenzae M. catarrhalis
Number of isolates (range) 429-1,758 725-2,796 295-851
Number of laboratories (range) 6-11 7-11 6-11
Antibiotic
penicillin 0 - -
amoxicilin/ampicillin - 15 -
co-amoxiclav - 4 1
peftriaxone - - -
erytromcyin 11 - 6
doxycycline 8 2 1
co-trimoxazole - 20 5
ciprofloxacin - - -
- Resistance not calculated.
Key resultsS. pneumoniae • Resistance (0%) and non-susceptibility (I+R; 3%)
to penicillin are still rare in the Netherlands.• Resistance levels to erythromycin (11%) and
doxycycline (8%) are similar as reported in previous years.
H. influenzae • Resistance to amoxicillin (15%) and co-
trimoxazole (20%) remain high and are comparable to levels previously reported.
• Resistance to co-amoxiclav and doxycycline remain low (4% and 2%).
M. catarrhalis• Resistance to all reported agents is lower than
10%.
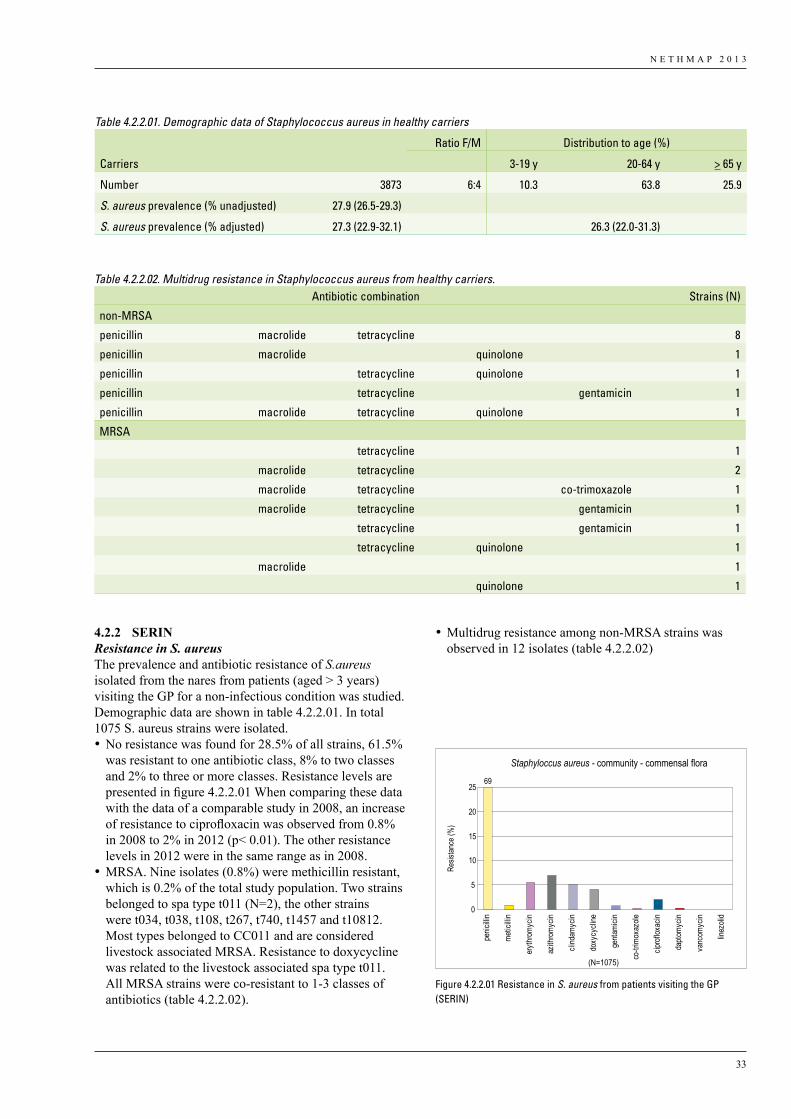
N E T H M A P 2 0 1 3
33
4.2.2 SERINResistance in S. aureus The prevalence and antibiotic resistance of S.aureus isolated from the nares from patients (aged > 3 years) visiting the GP for a non-infectious condition was studied. Demographic data are shown in table 4.2.2.01. In total 1075 S. aureus strains were isolated. •No resistance was found for 28.5% of all strains, 61.5%
was resistant to one antibiotic class, 8% to two classes and 2% to three or more classes. Resistance levels are presented in figure 4.2.2.01 When comparing these data with the data of a comparable study in 2008, an increase of resistance to ciprofloxacin was observed from 0.8% in 2008 to 2% in 2012 (p< 0.01). The other resistance levels in 2012 were in the same range as in 2008.
•MRSA. Nine isolates (0.8%) were methicillin resistant, which is 0.2% of the total study population. Two strains belonged to spa type t011 (N=2), the other strains were t034, t038, t108, t267, t740, t1457 and t10812. Most types belonged to CC011 and are considered livestock associated MRSA. Resistance to doxycycline was related to the livestock associated spa type t011. All MRSA strains were co-resistant to 1-3 classes of antibiotics (table 4.2.2.02).
•Multidrug resistance among non-MRSA strains was observed in 12 isolates (table 4.2.2.02)
Table 4.2.2.01. Demographic data of Staphylococcus aureus in healthy carriers
Ratio F/M Distribution to age (%)
Carriers 3-19 y 20-64 y > 65 y
Number 3873 6:4 10.3 63.8 25.9
S. aureus prevalence (% unadjusted) 27.9 (26.5-29.3)
S. aureus prevalence (% adjusted) 27.3 (22.9-32.1) 26.3 (22.0-31.3)
Table 4.2.2.02. Multidrug resistance in Staphylococcus aureus from healthy carriers. Antibiotic combination Strains (N)
non-MRSA
penicillin macrolide tetracycline 8
penicillin macrolide quinolone 1
penicillin tetracycline quinolone 1
penicillin tetracycline gentamicin 1
penicillin macrolide tetracycline quinolone 1
MRSA
tetracycline 1
macrolide tetracycline 2
macrolide tetracycline co-trimoxazole 1
macrolide tetracycline gentamicin 1
tetracycline gentamicin 1
tetracycline quinolone 1
macrolide 1
quinolone 1
Staphyloccus aureus - community - commensal flora
Resis
tance
(%)
(N=1075)
0
5
10
15
20
2569
penic
illin
metic
illin
erythr
omyc
in
azith
romyc
in
clind
amyc
in
doxy
cycli
ne
genta
micin
co-tr
imox
azole
ciprof
loxac
in
dapto
mycin
vanc
omyc
in
linez
olid
Figure 4.2.2.01 Resistance in S. aureus from patients visiting the GP (SERIN)
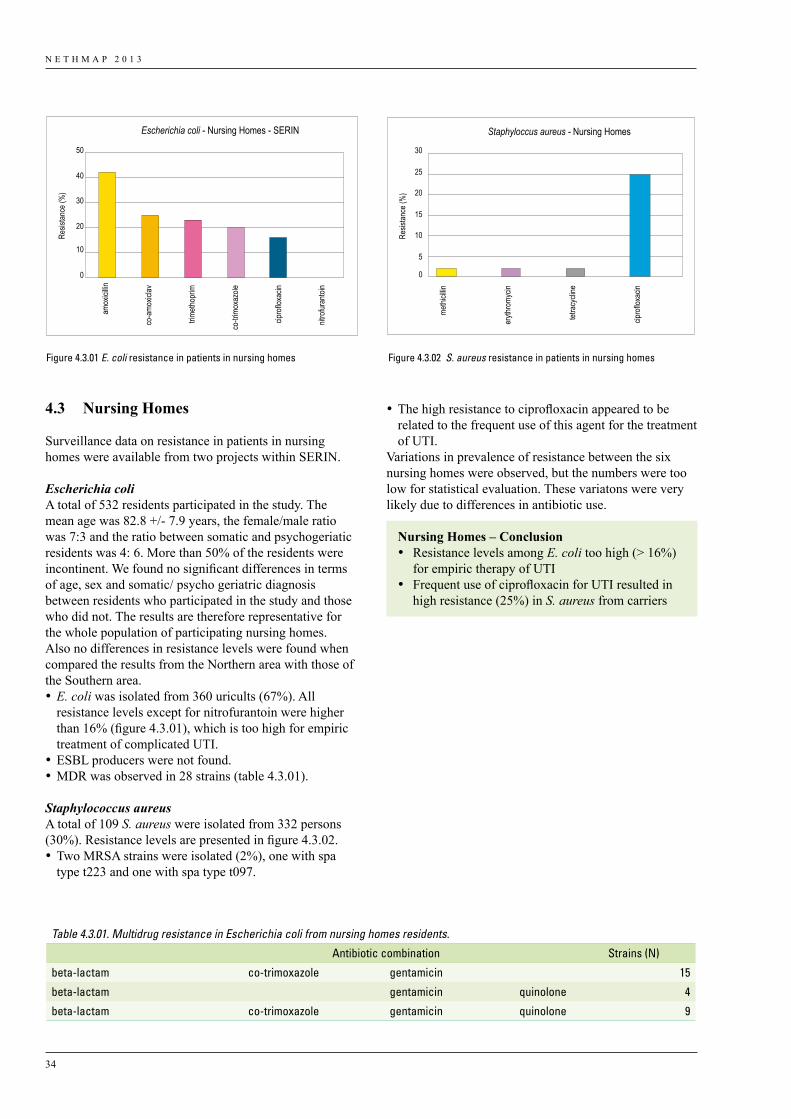
N E T H M A P 2 0 1 3
34
•The high resistance to ciprofloxacin appeared to be related to the frequent use of this agent for the treatment of UTI.
Variations in prevalence of resistance between the six nursing homes were observed, but the numbers were too low for statistical evaluation. These variatons were very likely due to differences in antibiotic use.
Nursing Homes – Conclusion• Resistance levels among E. coli too high (> 16%)
for empiric therapy of UTI• Frequent use of ciprofloxacin for UTI resulted in
high resistance (25%) in S. aureus from carriers
4.3 Nursing Homes
Surveillance data on resistance in patients in nursing homes were available from two projects within SERIN.
Escherichia coliA total of 532 residents participated in the study. The mean age was 82.8 +/- 7.9 years, the female/male ratio was 7:3 and the ratio between somatic and psychogeriatic residents was 4: 6. More than 50% of the residents were incontinent. We found no significant differences in terms of age, sex and somatic/ psycho geriatric diagnosis between residents who participated in the study and those who did not. The results are therefore representative for the whole population of participating nursing homes. Also no differences in resistance levels were found when compared the results from the Northern area with those of the Southern area.•E. coli was isolated from 360 uricults (67%). All
resistance levels except for nitrofurantoin were higher than 16% (figure 4.3.01), which is too high for empiric treatment of complicated UTI.
•ESBL producers were not found. •MDR was observed in 28 strains (table 4.3.01).
Staphylococcus aureusA total of 109 S. aureus were isolated from 332 persons (30%). Resistance levels are presented in figure 4.3.02. •Two MRSA strains were isolated (2%), one with spa
type t223 and one with spa type t097.
Escherichia coli - Nursing Homes - SERIN
Resis
tance
(%)
0
10
20
30
40
50
amox
icillin
co-a
moxic
lav
trimeth
oprim
co-tr
imox
azole
cipro
floxa
cin
nitro
furan
toin
Staphyloccus aureus - Nursing Homes
Resis
tance
(%)
5
0
10
15
20
25
30
methi
cillin
eryth
romy
cin
tetra
cycli
ne
cipro
floxa
cin
Figure 4.3.02
Figure 4.3.01 E. coli resistance in patients in nursing homes Figure 4.3.02 S. aureus resistance in patients in nursing homes
Table 4.3.01. Multidrug resistance in Escherichia coli from nursing homes residents.
Antibiotic combination Strains (N)
beta-lactam co-trimoxazole gentamicin 15
beta-lactam gentamicin quinolone 4
beta-lactam co-trimoxazole gentamicin quinolone 9
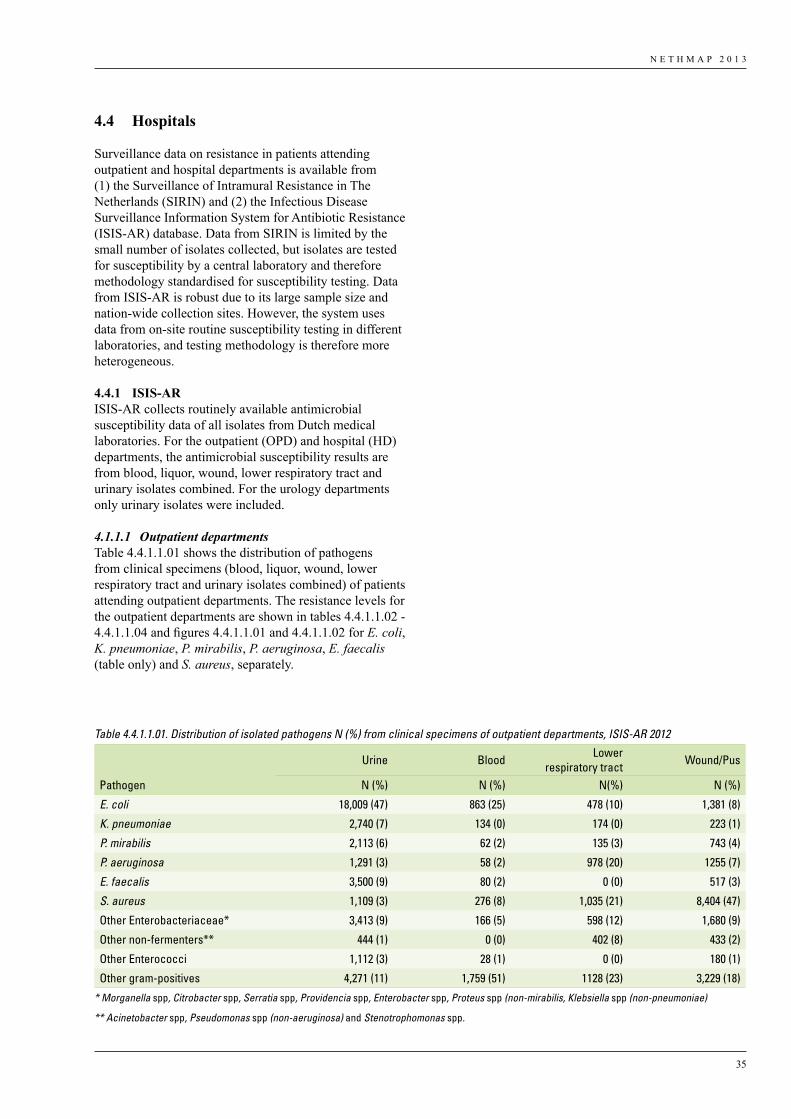
N E T H M A P 2 0 1 3
35
4.4 Hospitals
Surveillance data on resistance in patients attending outpatient and hospital departments is available from (1) the Surveillance of Intramural Resistance in The Netherlands (SIRIN) and (2) the Infectious Disease Surveillance Information System for Antibiotic Resistance (ISIS-AR) database. Data from SIRIN is limited by the small number of isolates collected, but isolates are tested for susceptibility by a central laboratory and therefore methodology standardised for susceptibility testing. Data from ISIS-AR is robust due to its large sample size and nation-wide collection sites. However, the system uses data from on-site routine susceptibility testing in different laboratories, and testing methodology is therefore more heterogeneous.
4.4.1 ISIS-ARISIS-AR collects routinely available antimicrobial susceptibility data of all isolates from Dutch medical laboratories. For the outpatient (OPD) and hospital (HD) departments, the antimicrobial susceptibility results are from blood, liquor, wound, lower respiratory tract and urinary isolates combined. For the urology departments only urinary isolates were included.
4.1.1.1 Outpatient departmentsTable 4.4.1.1.01 shows the distribution of pathogens from clinical specimens (blood, liquor, wound, lower respiratory tract and urinary isolates combined) of patients attending outpatient departments. The resistance levels for the outpatient departments are shown in tables 4.4.1.1.02 - 4.4.1.1.04 and figures 4.4.1.1.01 and 4.4.1.1.02 for E. coli, K. pneumoniae, P. mirabilis, P. aeruginosa, E. faecalis (table only) and S. aureus, separately.
Table 4.4.1.1.01. Distribution of isolated pathogens N (%) from clinical specimens of outpatient departments, ISIS-AR 2012
Urine Blood Lower respiratory tract Wound/Pus
Pathogen N (%) N (%) N(%) N (%)
E. coli 18,009 (47) 863 (25) 478 (10) 1,381 (8)
K. pneumoniae 2,740 (7) 134 (0) 174 (0) 223 (1)
P. mirabilis 2,113 (6) 62 (2) 135 (3) 743 (4)
P. aeruginosa 1,291 (3) 58 (2) 978 (20) 1255 (7)
E. faecalis 3,500 (9) 80 (2) 0 (0) 517 (3)
S. aureus 1,109 (3) 276 (8) 1,035 (21) 8,404 (47)
Other Enterobacteriaceae* 3,413 (9) 166 (5) 598 (12) 1,680 (9)
Other non-fermenters** 444 (1) 0 (0) 402 (8) 433 (2)
Other Enterococci 1,112 (3) 28 (1) 0 (0) 180 (1)
Other gram-positives 4,271 (11) 1,759 (51) 1128 (23) 3,229 (18)
* Morganella spp, Citrobacter spp, Serratia spp, Providencia spp, Enterobacter spp, Proteus spp (non-mirabilis, Klebsiella spp (non-pneumoniae)
** Acinetobacter spp, Pseudomonas spp (non-aeruginosa) and Stenotrophomonas spp.
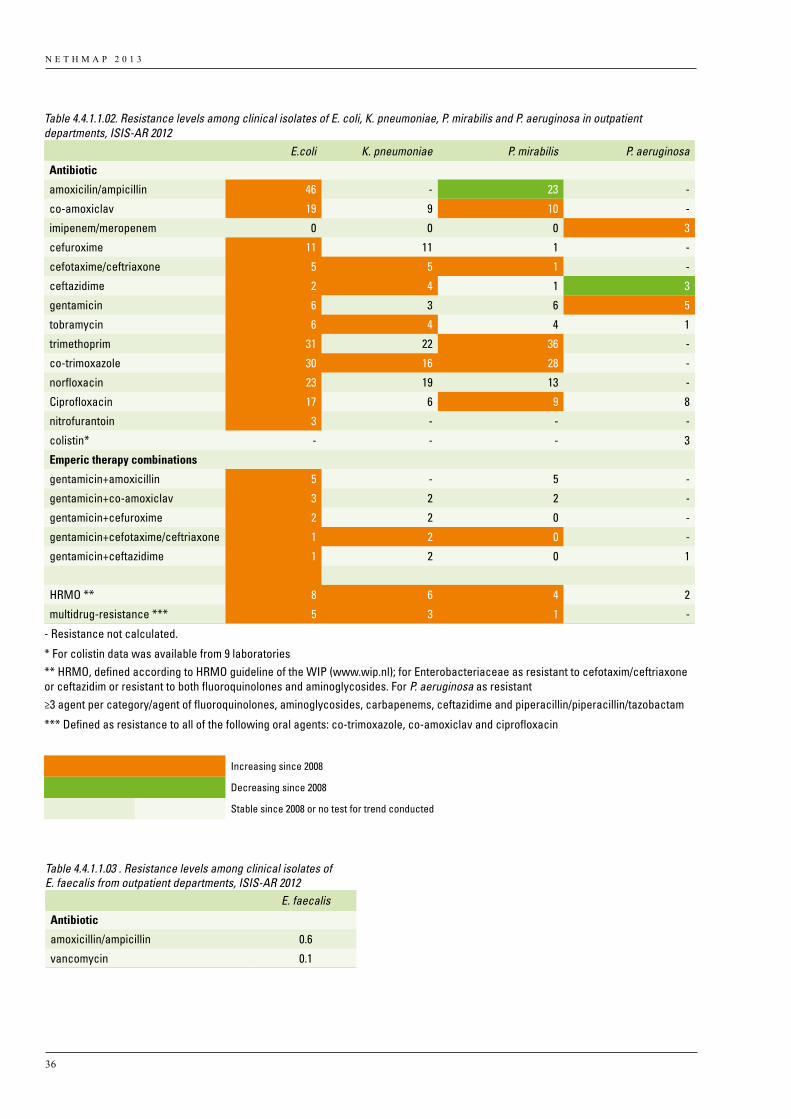
N E T H M A P 2 0 1 3
36
Table 4.4.1.1.02. Resistance levels among clinical isolates of E. coli, K. pneumoniae, P. mirabilis and P. aeruginosa in outpatient departments, ISIS-AR 2012
E.coli K. pneumoniae P. mirabilis P. aeruginosa
Antibiotic
amoxicilin/ampicillin 46 - 23 -
co-amoxiclav 19 9 10 -
imipenem/meropenem 0 0 0 3
cefuroxime 11 11 1 -
cefotaxime/ceftriaxone 5 5 1 -
ceftazidime 2 4 1 3
gentamicin 6 3 6 5
tobramycin 6 4 4 1
trimethoprim 31 22 36 -
co-trimoxazole 30 16 28 -
norfloxacin 23 19 13 -
Ciprofloxacin 17 6 9 8
nitrofurantoin 3 - - -
colistin* - - - 3
Emperic therapy combinations
gentamicin+amoxicillin 5 - 5 -
gentamicin+co-amoxiclav 3 2 2 -
gentamicin+cefuroxime 2 2 0 -
gentamicin+cefotaxime/ceftriaxone 1 2 0 -
gentamicin+ceftazidime 1 2 0 1
HRMO ** 8 6 4 2
multidrug-resistance *** 5 3 1 -
- Resistance not calculated.
* For colistin data was available from 9 laboratories** HRMO, defined according to HRMO guideline of the WIP (www.wip.nl); for Enterobacteriaceae as resistant to cefotaxim/ceftriaxone or ceftazidim or resistant to both fluoroquinolones and aminoglycosides. For P. aeruginosa as resistant ≥3 agent per category/agent of fluoroquinolones, aminoglycosides, carbapenems, ceftazidime and piperacillin/piperacillin/tazobactam
*** Defined as resistance to all of the following oral agents: co-trimoxazole, co-amoxiclav and ciprofloxacin
Increasing since 2008
Decreasing since 2008
Stable since 2008 or no test for trend conducted
Table 4.4.1.1.03 . Resistance levels among clinical isolates of E. faecalis from outpatient departments, ISIS-AR 2012 E. faecalis
Antibiotic
amoxicillin/ampicillin 0.6
vancomycin 0.1
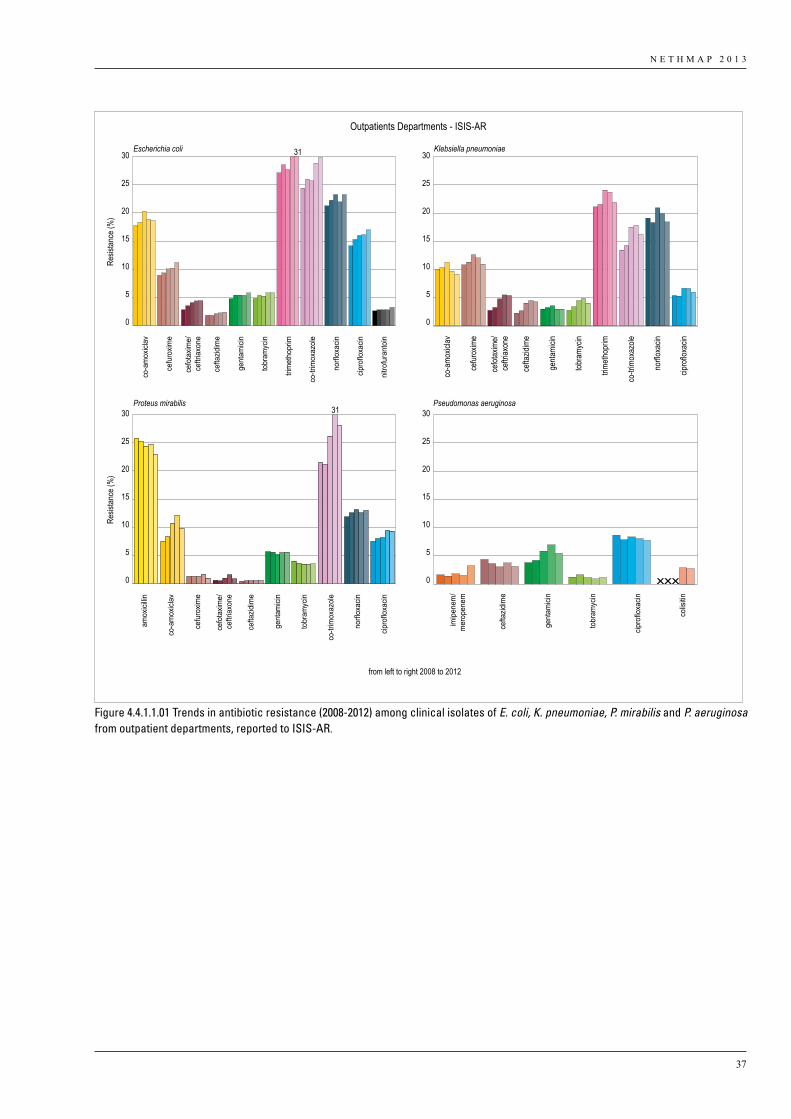
N E T H M A P 2 0 1 3
37
from left to right 2008 to 2012
Outpatients Departments - ISIS-AR
25
20
15
10
5
0
30
25
20
15
10
5
0
30
Resis
tance
(%)
25
20
15
10
5
0
30
25
20
15
10
5
0
30
Resis
tance
(%)
Escherichia coli Klebsiella pneumoniae
Proteus mirabilis Pseudomonas aeruginosa
co-a
mox
iclav
cefu
roxim
e
cefo
taxim
e/ce
ftria
xone
cefta
zidim
e
gent
amici
n
tobr
amyc
in
trim
etho
prim
co-tr
imox
azol
e
norfl
oxac
in
cipro
floxa
cin
nitro
fura
ntoi
n
co-a
moxic
lav
cefur
oxim
e
cefot
axim
e/ce
ftriax
one
cefta
zidim
e
genta
micin
tobra
mycin
trimeth
oprim
co-tr
imox
azole
norflo
xacin
cipro
floxa
cin
co-a
mox
iclav
amox
icillin
cefu
roxim
e
cefo
taxim
e/ce
ftria
xone
cefta
zidim
e
gent
amici
n
tobr
amyc
in
co-tr
imox
azol
e
norfl
oxac
in
cipro
floxa
cin
imip
enem
/m
erop
enem
cefta
zidim
e
gent
amici
n
tobr
amyc
in
cipro
floxa
cin
colis
itin
31
31
2.007 mm
Figure 4.4.1.1.01 Trends in antibiotic resistance (2008-2012) among clinical isolates of E. coli, K. pneumoniae, P. mirabilis and P. aeruginosa from outpatient departments, reported to ISIS-AR.
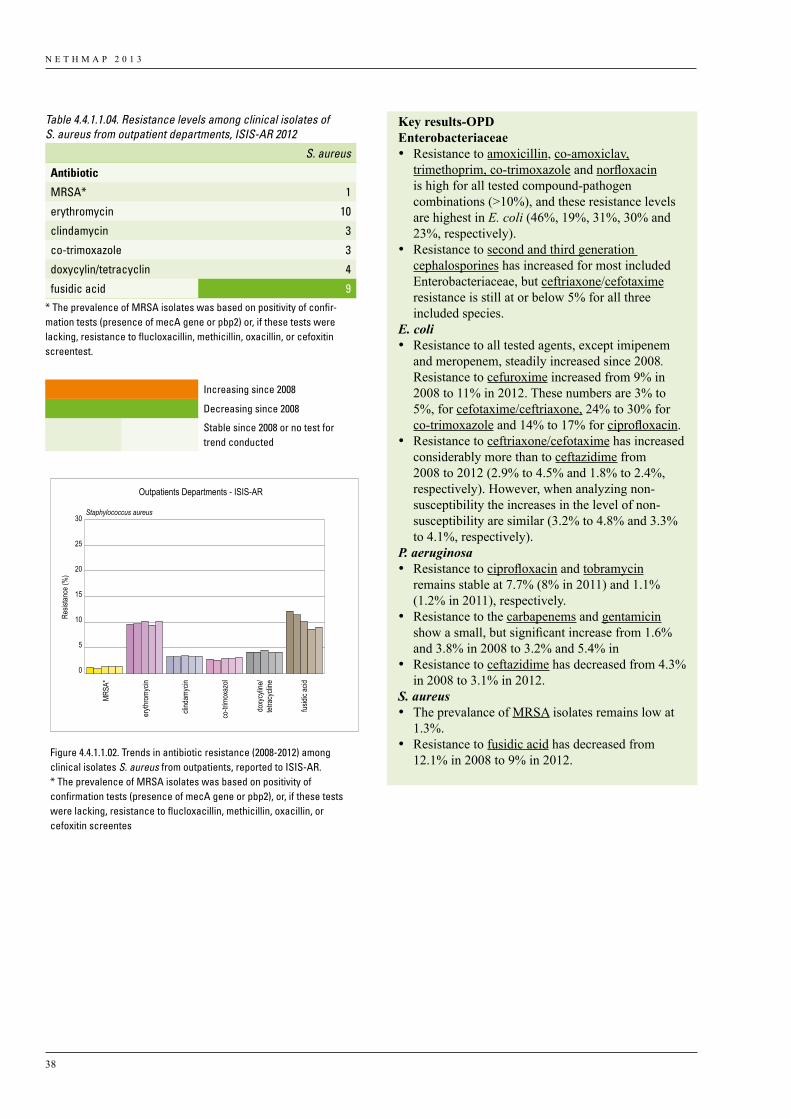
N E T H M A P 2 0 1 3
38
from left to right 2008 to 2012
Outpatients Departments - ISIS-AR
25
20
15
10
5
0
30
Resis
tance
(%)
Staphylococcus aureus
MRSA
*
eryth
romy
cin
clind
amyc
in
co-tr
imox
azol
doxy
cylin
e/tet
racy
cline
fusidi
c acid
Figure 4.4.1.1.02. Trends in antibiotic resistance (2008-2012) among clinical isolates S. aureus from outpatients, reported to ISIS-AR.* The prevalence of MRSA isolates was based on positivity of confirmation tests (presence of mecA gene or pbp2), or, if these tests were lacking, resistance to flucloxacillin, methicillin, oxacillin, or cefoxitin screentes
Table 4.4.1.1.04. Resistance levels among clinical isolates of S. aureus from outpatient departments, ISIS-AR 2012
S. aureus
Antibiotic
MRSA* 1
erythromycin 10
clindamycin 3
co-trimoxazole 3
doxycylin/tetracyclin 4
fusidic acid 9* The prevalence of MRSA isolates was based on positivity of confir-mation tests (presence of mecA gene or pbp2) or, if these tests were lacking, resistance to flucloxacillin, methicillin, oxacillin, or cefoxitin screentest.
Increasing since 2008
Decreasing since 2008
Stable since 2008 or no test for trend conducted
Key results-OPDEnterobacteriaceae • Resistance to amoxicillin, co-amoxiclav,
trimethoprim, co-trimoxazole and norfloxacin is high for all tested compound-pathogen combinations (>10%), and these resistance levels are highest in E. coli (46%, 19%, 31%, 30% and 23%, respectively).
• Resistance to second and third generation cephalosporines has increased for most included Enterobacteriaceae, but ceftriaxone/cefotaxime resistance is still at or below 5% for all three included species.
E. coli• Resistance to all tested agents, except imipenem
and meropenem, steadily increased since 2008. Resistance to cefuroxime increased from 9% in 2008 to 11% in 2012. These numbers are 3% to 5%, for cefotaxime/ceftriaxone, 24% to 30% for co-trimoxazole and 14% to 17% for ciprofloxacin.
• Resistance to ceftriaxone/cefotaxime has increased considerably more than to ceftazidime from 2008 to 2012 (2.9% to 4.5% and 1.8% to 2.4%, respectively). However, when analyzing non-susceptibility the increases in the level of non-susceptibility are similar (3.2% to 4.8% and 3.3% to 4.1%, respectively).
P. aeruginosa • Resistance to ciprofloxacin and tobramycin
remains stable at 7.7% (8% in 2011) and 1.1% (1.2% in 2011), respectively.
• Resistance to the carbapenems and gentamicin show a small, but significant increase from 1.6% and 3.8% in 2008 to 3.2% and 5.4% in
• Resistance to ceftazidime has decreased from 4.3% in 2008 to 3.1% in 2012.
S. aureus• The prevalance of MRSA isolates remains low at
1.3%.• Resistance to fusidic acid has decreased from
12.1% in 2008 to 9% in 2012.
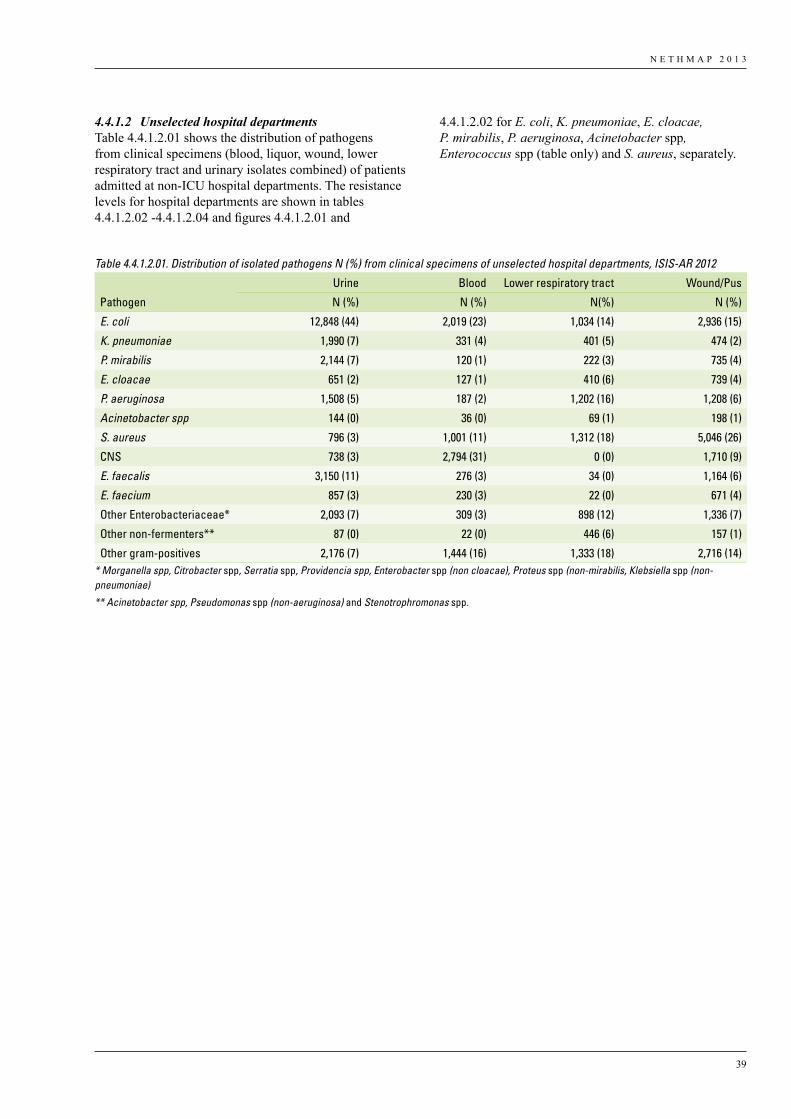
N E T H M A P 2 0 1 3
39
4.4.1.2 Unselected hospital departmentsTable 4.4.1.2.01 shows the distribution of pathogens from clinical specimens (blood, liquor, wound, lower respiratory tract and urinary isolates combined) of patients admitted at non-ICU hospital departments. The resistance levels for hospital departments are shown in tables 4.4.1.2.02 -4.4.1.2.04 and figures 4.4.1.2.01 and
4.4.1.2.02 for E. coli, K. pneumoniae, E. cloacae, P. mirabilis, P. aeruginosa, Acinetobacter spp, Enterococcus spp (table only) and S. aureus, separately.
Table 4.4.1.2.01. Distribution of isolated pathogens N (%) from clinical specimens of unselected hospital departments, ISIS-AR 2012
Urine Blood Lower respiratory tract Wound/Pus
Pathogen N (%) N (%) N(%) N (%)
E. coli 12,848 (44) 2,019 (23) 1,034 (14) 2,936 (15)
K. pneumoniae 1,990 (7) 331 (4) 401 (5) 474 (2)
P. mirabilis 2,144 (7) 120 (1) 222 (3) 735 (4)
E. cloacae 651 (2) 127 (1) 410 (6) 739 (4)
P. aeruginosa 1,508 (5) 187 (2) 1,202 (16) 1,208 (6)
Acinetobacter spp 144 (0) 36 (0) 69 (1) 198 (1)
S. aureus 796 (3) 1,001 (11) 1,312 (18) 5,046 (26)
CNS 738 (3) 2,794 (31) 0 (0) 1,710 (9)
E. faecalis 3,150 (11) 276 (3) 34 (0) 1,164 (6)
E. faecium 857 (3) 230 (3) 22 (0) 671 (4)
Other Enterobacteriaceae* 2,093 (7) 309 (3) 898 (12) 1,336 (7)
Other non-fermenters** 87 (0) 22 (0) 446 (6) 157 (1)
Other gram-positives 2,176 (7) 1,444 (16) 1,333 (18) 2,716 (14)* Morganella spp, Citrobacter spp, Serratia spp, Providencia spp, Enterobacter spp (non cloacae), Proteus spp (non-mirabilis, Klebsiella spp (non-pneumoniae)
** Acinetobacter spp, Pseudomonas spp (non-aeruginosa) and Stenotrophromonas spp.
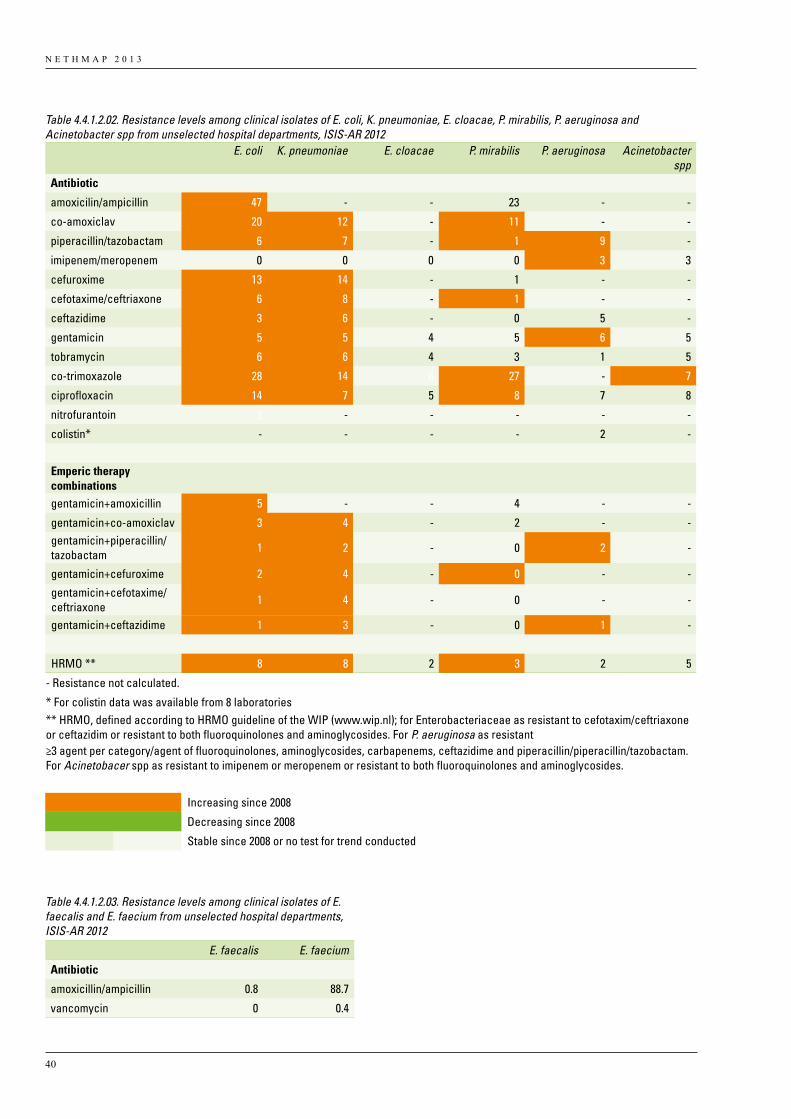
N E T H M A P 2 0 1 3
40
Table 4.4.1.2.02. Resistance levels among clinical isolates of E. coli, K. pneumoniae, E. cloacae, P. mirabilis, P. aeruginosa and Acinetobacter spp from unselected hospital departments, ISIS-AR 2012 E. coli K. pneumoniae E. cloacae P. mirabilis P. aeruginosa Acinetobacter
sppAntibiotic
amoxicilin/ampicillin 47 - - 23 - -
co-amoxiclav 20 12 - 11 - -
piperacillin/tazobactam 6 7 - 1 9 -
imipenem/meropenem 0 0 0 0 3 3
cefuroxime 13 14 - 1 - -
cefotaxime/ceftriaxone 6 8 - 1 - -
ceftazidime 3 6 - 0 5 -
gentamicin 5 5 4 5 6 5
tobramycin 6 6 4 3 1 5
co-trimoxazole 28 14 6 27 - 7
ciprofloxacin 14 7 5 8 7 8
nitrofurantoin 2 - - - - -
colistin* - - - - 2 -
Emperic therapy combinations
gentamicin+amoxicillin 5 - - 4 - -
gentamicin+co-amoxiclav 3 4 - 2 - -gentamicin+piperacillin/tazobactam 1 2 - 0 2 -
gentamicin+cefuroxime 2 4 - 0 - -
gentamicin+cefotaxime/ceftriaxone 1 4 - 0 - -
gentamicin+ceftazidime 1 3 - 0 1 -
HRMO ** 8 8 2 3 2 5
- Resistance not calculated.
* For colistin data was available from 8 laboratories** HRMO, defined according to HRMO guideline of the WIP (www.wip.nl); for Enterobacteriaceae as resistant to cefotaxim/ceftriaxone or ceftazidim or resistant to both fluoroquinolones and aminoglycosides. For P. aeruginosa as resistant ≥3 agent per category/agent of fluoroquinolones, aminoglycosides, carbapenems, ceftazidime and piperacillin/piperacillin/tazobactam. For Acinetobacer spp as resistant to imipenem or meropenem or resistant to both fluoroquinolones and aminoglycosides.
Increasing since 2008
Decreasing since 2008
Stable since 2008 or no test for trend conducted
Table 4.4.1.2.03. Resistance levels among clinical isolates of E. faecalis and E. faecium from unselected hospital departments, ISIS-AR 2012
E. faecalis E. faecium
Antibiotic
amoxicillin/ampicillin 0.8 88.7
vancomycin 0 0.4
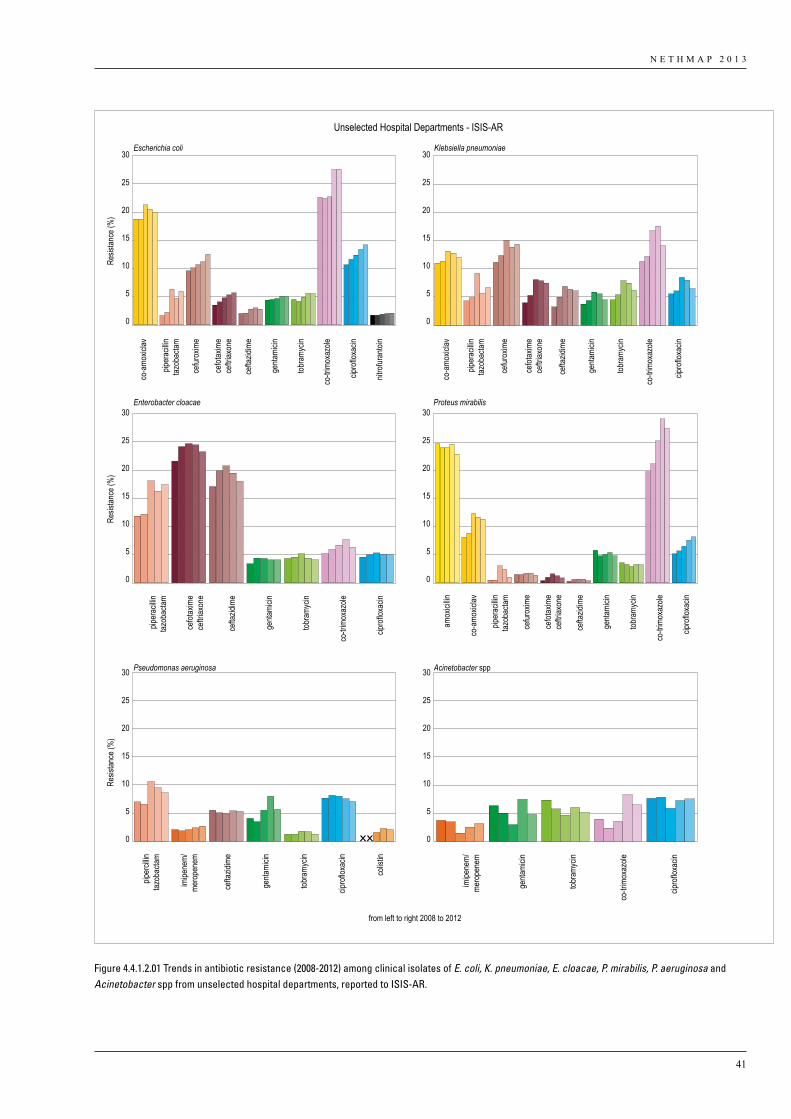
N E T H M A P 2 0 1 3
41
from left to right 2008 to 2012
Unselected Hospital Departments - ISIS-AR
0
5
10
15
20
25
30
0
5
10
15
20
25
30
Resis
tance
(%)
0
5
10
15
20
25
30
0
5
10
15
20
25
30
0
5
10
15
20
25
30
Resis
tance
(%)
0
5
10
15
20
25
30
Resis
tance
(%)
Escherichia coli Klebsiella pneumoniae
Enterobacter cloacae
Pseudomonas aeruginosa Acinetobacter spp
Proteus mirabilis
co-a
moxic
lav
cefur
oxim
e
cefot
axim
ece
ftriax
one
cefta
zidim
e
genta
micin
tobra
mycin
co-tr
imox
azole
cipro
floxa
cin
nitro
furan
toin
piper
acilli
ntaz
obac
tam
co-a
moxic
lav
cefur
oxim
e
cefot
axim
ece
ftriax
one
cefta
zidim
e
genta
micin
tobra
mycin
co-tr
imox
azole
cipro
floxa
cin
piper
acilli
ntaz
obac
tam
cefot
axim
ece
ftriax
one
cefta
zidim
e
genta
micin
tobra
mycin
co-tr
imox
azole
cipro
floxa
cin
piper
acilli
ntaz
obac
tam
amox
icillin
co-a
moxic
lav
cefur
oxim
e
cefot
axim
ece
ftriax
one
cefta
zidim
e
genta
micin
tobra
mycin
co-tr
imox
azole
cipro
floxa
cin
piper
acilli
ntaz
obac
tam
piper
cillin
tazob
actam
imipe
nem/
mero
pene
m
cefta
zidim
e
genta
micin
tobra
mycin
cipro
floxa
cin
colis
tin
co-tr
imox
azole
cipro
floxa
cin
imipe
nem/
mero
pene
m
genta
micin
tobra
mycin
Figure 4.4.1.2.01 Trends in antibiotic resistance (2008-2012) among clinical isolates of E. coli, K. pneumoniae, E. cloacae, P. mirabilis, P. aeruginosa and Acinetobacter spp from unselected hospital departments, reported to ISIS-AR.
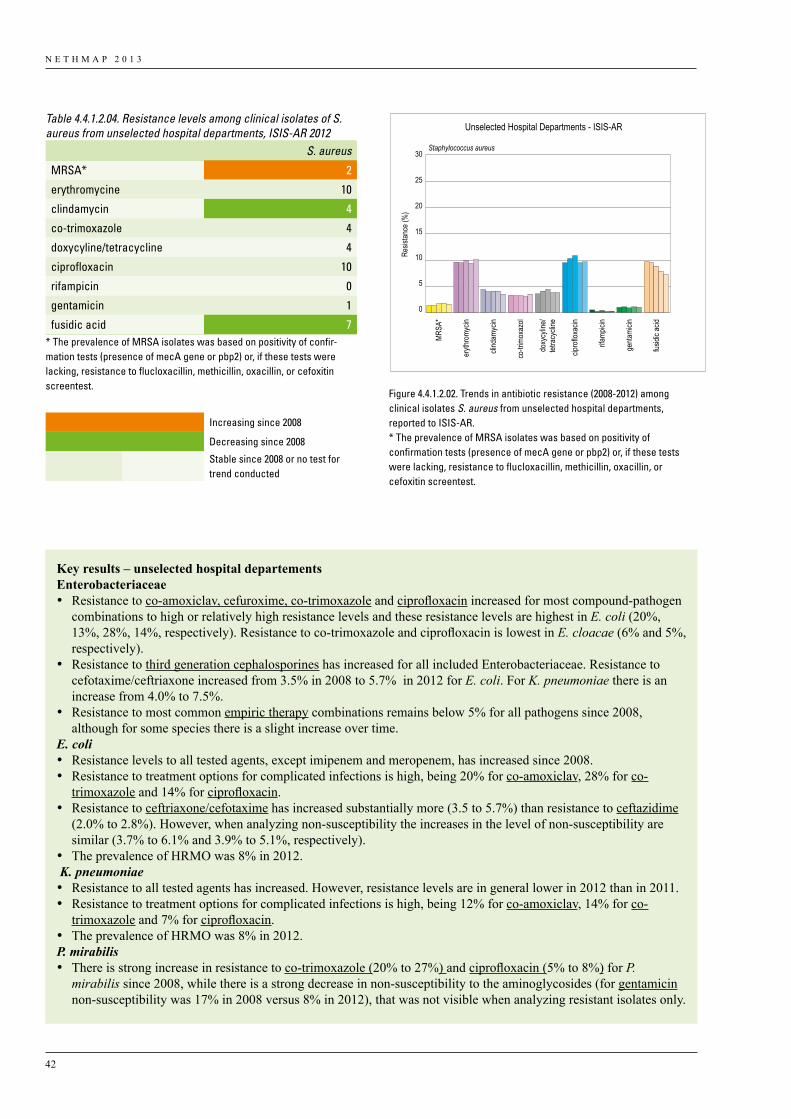
N E T H M A P 2 0 1 3
42
from left to right 2008 to 2012
Unselected Hospital Departments - ISIS-AR
25
20
15
10
5
0
30
Resis
tance
(%)
Staphylococcus aureus
MRSA
*
eryth
romy
cin
clind
amyc
in
co-tr
imox
azol
doxy
cylin
e/tet
racy
cline
fusidi
c acid
cipro
floxa
cin
rifamp
icin
genta
micin
Figure 4.4.1.2.02. Trends in antibiotic resistance (2008-2012) among clinical isolates S. aureus from unselected hospital departments, reported to ISIS-AR.* The prevalence of MRSA isolates was based on positivity of confirmation tests (presence of mecA gene or pbp2) or, if these testswere lacking, resistance to flucloxacillin, methicillin, oxacillin, or cefoxitin screentest.
Table 4.4.1.2.04. Resistance levels among clinical isolates of S. aureus from unselected hospital departments, ISIS-AR 2012 S. aureus
MRSA* 2
erythromycine 10
clindamycin 4
co-trimoxazole 4
doxycyline/tetracycline 4
ciprofloxacin 10
rifampicin 0
gentamicin 1
fusidic acid 7* The prevalence of MRSA isolates was based on positivity of confir-mation tests (presence of mecA gene or pbp2) or, if these tests were lacking, resistance to flucloxacillin, methicillin, oxacillin, or cefoxitin screentest.
Increasing since 2008
Decreasing since 2008
Stable since 2008 or no test for trend conducted
Key results – unselected hospital departementsEnterobacteriaceae • Resistance to co-amoxiclav, cefuroxime, co-trimoxazole and ciprofloxacin increased for most compound-pathogen
combinations to high or relatively high resistance levels and these resistance levels are highest in E. coli (20%, 13%, 28%, 14%, respectively). Resistance to co-trimoxazole and ciprofloxacin is lowest in E. cloacae (6% and 5%, respectively).
• Resistance to third generation cephalosporines has increased for all included Enterobacteriaceae. Resistance to cefotaxime/ceftriaxone increased from 3.5% in 2008 to 5.7% in 2012 for E. coli. For K. pneumoniae there is an increase from 4.0% to 7.5%.
• Resistance to most common empiric therapy combinations remains below 5% for all pathogens since 2008, although for some species there is a slight increase over time.
E. coli• Resistance levels to all tested agents, except imipenem and meropenem, has increased since 2008.• Resistance to treatment options for complicated infections is high, being 20% for co-amoxiclav, 28% for co-
trimoxazole and 14% for ciprofloxacin.• Resistance to ceftriaxone/cefotaxime has increased substantially more (3.5 to 5.7%) than resistance to ceftazidime
(2.0% to 2.8%). However, when analyzing non-susceptibility the increases in the level of non-susceptibility are similar (3.7% to 6.1% and 3.9% to 5.1%, respectively).
• The prevalence of HRMO was 8% in 2012. K. pneumoniae• Resistance to all tested agents has increased. However, resistance levels are in general lower in 2012 than in 2011.• Resistance to treatment options for complicated infections is high, being 12% for co-amoxiclav, 14% for co-
trimoxazole and 7% for ciprofloxacin.• The prevalence of HRMO was 8% in 2012.P. mirabilis• There is strong increase in resistance to co-trimoxazole (20% to 27%) and ciprofloxacin (5% to 8%) for P.
mirabilis since 2008, while there is a strong decrease in non-susceptibility to the aminoglycosides (for gentamicin non-susceptibility was 17% in 2008 versus 8% in 2012), that was not visible when analyzing resistant isolates only.
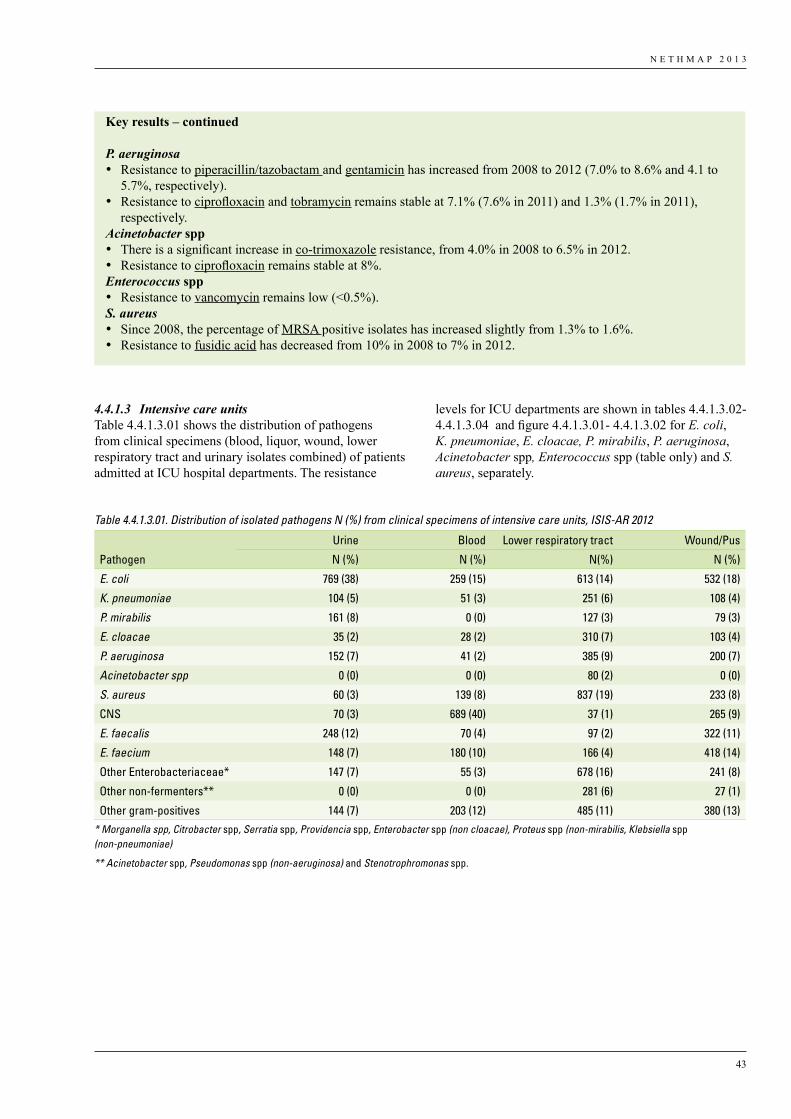
N E T H M A P 2 0 1 3
43
4.4.1.3 Intensive care unitsTable 4.4.1.3.01 shows the distribution of pathogens from clinical specimens (blood, liquor, wound, lower respiratory tract and urinary isolates combined) of patients admitted at ICU hospital departments. The resistance
levels for ICU departments are shown in tables 4.4.1.3.02-4.4.1.3.04 and figure 4.4.1.3.01- 4.4.1.3.02 for E. coli, K. pneumoniae, E. cloacae, P. mirabilis, P. aeruginosa, Acinetobacter spp, Enterococcus spp (table only) and S. aureus, separately.
Table 4.4.1.3.01. Distribution of isolated pathogens N (%) from clinical specimens of intensive care units, ISIS-AR 2012
Urine Blood Lower respiratory tract Wound/Pus
Pathogen N (%) N (%) N(%) N (%)
E. coli 769 (38) 259 (15) 613 (14) 532 (18)
K. pneumoniae 104 (5) 51 (3) 251 (6) 108 (4)
P. mirabilis 161 (8) 0 (0) 127 (3) 79 (3)
E. cloacae 35 (2) 28 (2) 310 (7) 103 (4)
P. aeruginosa 152 (7) 41 (2) 385 (9) 200 (7)
Acinetobacter spp 0 (0) 0 (0) 80 (2) 0 (0)
S. aureus 60 (3) 139 (8) 837 (19) 233 (8)
CNS 70 (3) 689 (40) 37 (1) 265 (9)
E. faecalis 248 (12) 70 (4) 97 (2) 322 (11)
E. faecium 148 (7) 180 (10) 166 (4) 418 (14)
Other Enterobacteriaceae* 147 (7) 55 (3) 678 (16) 241 (8)
Other non-fermenters** 0 (0) 0 (0) 281 (6) 27 (1)
Other gram-positives 144 (7) 203 (12) 485 (11) 380 (13)* Morganella spp, Citrobacter spp, Serratia spp, Providencia spp, Enterobacter spp (non cloacae), Proteus spp (non-mirabilis, Klebsiella spp (non-pneumoniae)
** Acinetobacter spp, Pseudomonas spp (non-aeruginosa) and Stenotrophromonas spp.
Key results – continued
P. aeruginosa• Resistance to piperacillin/tazobactam and gentamicin has increased from 2008 to 2012 (7.0% to 8.6% and 4.1 to
5.7%, respectively).• Resistance to ciprofloxacin and tobramycin remains stable at 7.1% (7.6% in 2011) and 1.3% (1.7% in 2011),
respectively.Acinetobacter spp• There is a significant increase in co-trimoxazole resistance, from 4.0% in 2008 to 6.5% in 2012.• Resistance to ciprofloxacin remains stable at 8%.Enterococcus spp• Resistance to vancomycin remains low (<0.5%).S. aureus• Since 2008, the percentage of MRSA positive isolates has increased slightly from 1.3% to 1.6%.• Resistance to fusidic acid has decreased from 10% in 2008 to 7% in 2012.
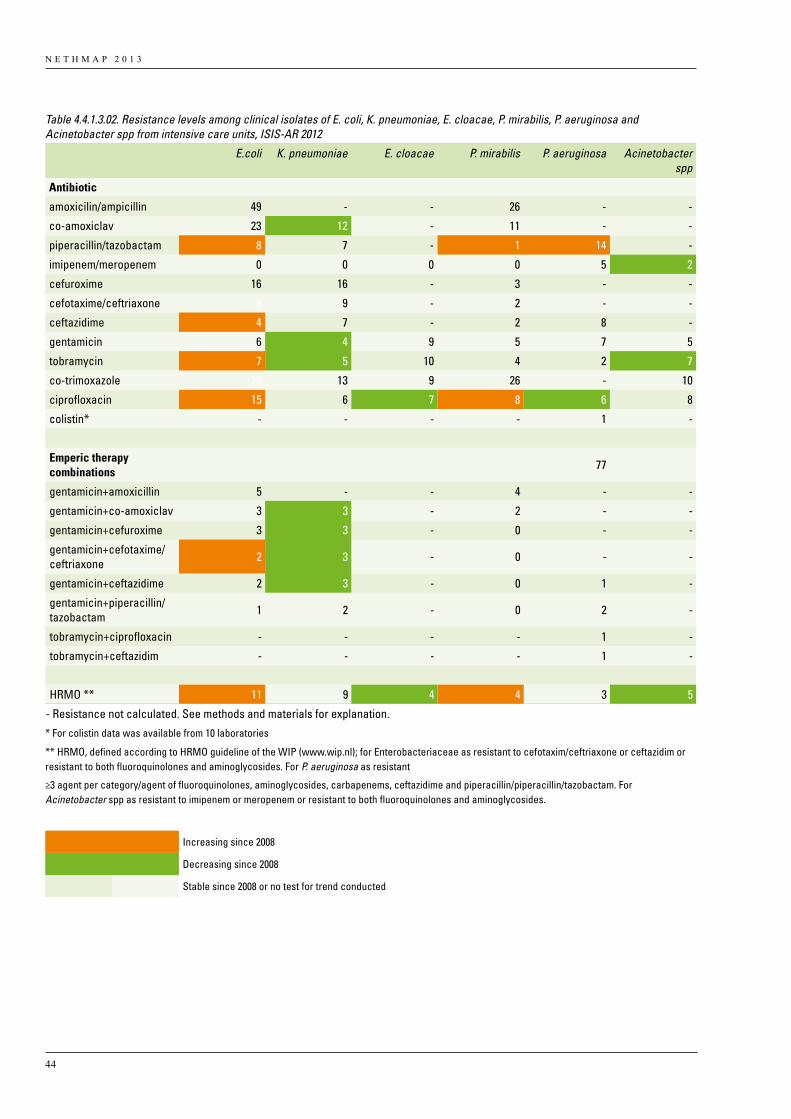
N E T H M A P 2 0 1 3
44
Table 4.4.1.3.02. Resistance levels among clinical isolates of E. coli, K. pneumoniae, E. cloacae, P. mirabilis, P. aeruginosa and Acinetobacter spp from intensive care units, ISIS-AR 2012
E.coli K. pneumoniae E. cloacae P. mirabilis P. aeruginosa Acinetobacter spp
Antibiotic
amoxicilin/ampicillin 49 - - 26 - -
co-amoxiclav 23 12 - 11 - -
piperacillin/tazobactam 8 7 - 1 14 -
imipenem/meropenem 0 0 0 0 5 2
cefuroxime 16 16 - 3 - -
cefotaxime/ceftriaxone 8 9 - 2 - -
ceftazidime 4 7 - 2 8 -
gentamicin 6 4 9 5 7 5
tobramycin 7 5 10 4 2 7
co-trimoxazole 28 13 9 26 - 10
ciprofloxacin 15 6 7 8 6 8
colistin* - - - - 1 -
Emperic therapy combinations
77
gentamicin+amoxicillin 5 - - 4 - -
gentamicin+co-amoxiclav 3 3 - 2 - -
gentamicin+cefuroxime 3 3 - 0 - -
gentamicin+cefotaxime/ceftriaxone 2 3 - 0 - -
gentamicin+ceftazidime 2 3 - 0 1 -
gentamicin+piperacillin/tazobactam 1 2 - 0 2 -
tobramycin+ciprofloxacin - - - - 1 -
tobramycin+ceftazidim - - - - 1 -
HRMO ** 11 9 4 4 3 5
- Resistance not calculated. See methods and materials for explanation.
* For colistin data was available from 10 laboratories
** HRMO, defined according to HRMO guideline of the WIP (www.wip.nl); for Enterobacteriaceae as resistant to cefotaxim/ceftriaxone or ceftazidim or resistant to both fluoroquinolones and aminoglycosides. For P. aeruginosa as resistant
≥3 agent per category/agent of fluoroquinolones, aminoglycosides, carbapenems, ceftazidime and piperacillin/piperacillin/tazobactam. For Acinetobacter spp as resistant to imipenem or meropenem or resistant to both fluoroquinolones and aminoglycosides.
Increasing since 2008
Decreasing since 2008
Stable since 2008 or no test for trend conducted
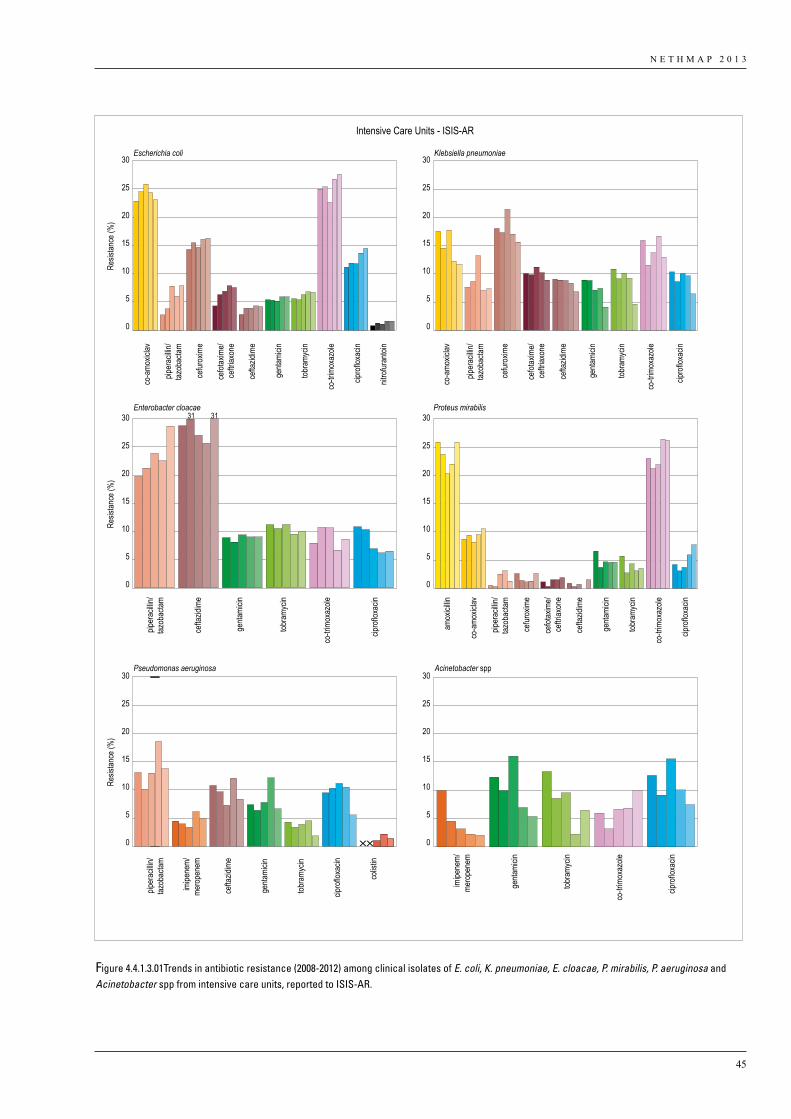
N E T H M A P 2 0 1 3
45
from left to right 2008 to 2012
Intensive Care Units - ISIS-AR
25
20
15
10
5
0
30
25
20
15
10
5
0
30
Resis
tance
(%)
25
20
15
10
5
0
30
25
20
15
10
5
0
30
25
20
15
10
5
0
30
Resis
tance
(%)
25
20
15
10
5
0
30
Resis
tance
(%)
Escherichia coli Klebsiella pneumoniae
Enterobacter cloacae
Pseudomonas aeruginosa Acinetobacter spp
Proteus mirabilis31 31
co-a
moxic
lav
piper
acilli
n/taz
obac
tam
piper
acilli
n/taz
obac
tampip
erac
illin/
tazob
actam
imipe
nem/
mero
pene
m
imipe
nem/
mero
pene
m
cefur
oxim
e
cefot
axim
e/ce
ftriax
one
cefta
zidim
e
tobra
mycin
co-tr
imox
azole
nitro
furan
toin
cipro
floxa
cin
genta
micin
cefta
zidim
e
tobra
mycin
tobra
mycin
co-tr
imox
azole
cipro
floxa
cin
cipro
floxa
cin
colis
tin
genta
micin
genta
micin
tobra
mycin
genta
micin
co-a
moxic
lav
co-a
moxic
lavpip
erac
illin/
tazob
actam
piper
acilli
n/taz
obac
tamce
furox
ime
cefot
axim
e/ce
ftriax
one
cefta
zidim
e
cefur
oxim
e
cefot
axim
e/ce
ftriax
one
cefta
zidim
e
cefta
zidim
e
tobra
mycin
tobra
mycin
co-tr
imox
azole
co-tr
imox
azole
co-tr
imox
azole
cipro
floxa
cincip
roflo
xacin
cipro
floxa
cin
genta
micin
genta
micin
amox
icillin
Figure 4.4.1.3.01Trends in antibiotic resistance (2008-2012) among clinical isolates of E. coli, K. pneumoniae, E. cloacae, P. mirabilis, P. aeruginosa and Acinetobacter spp from intensive care units, reported to ISIS-AR.
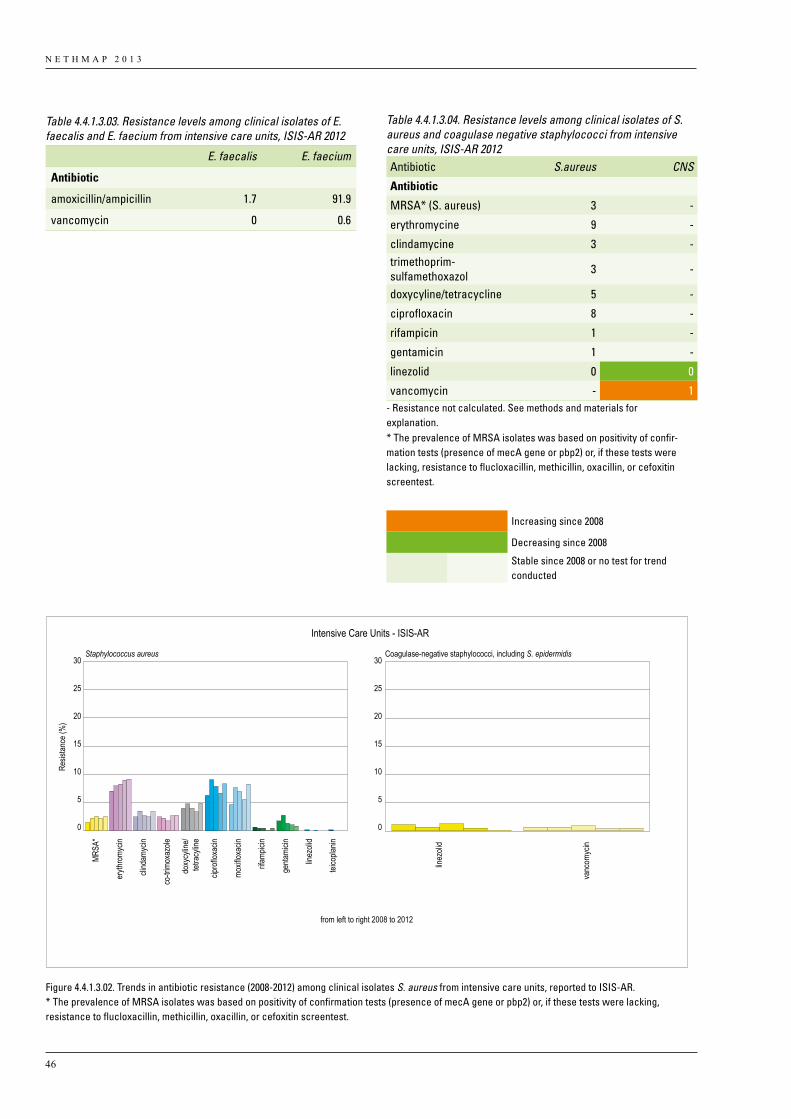
N E T H M A P 2 0 1 3
46
from left to right 2008 to 2012
Intensive Care Units - ISIS-AR
25
20
15
10
5
0
30
25
20
15
10
5
0
30
Resis
tance
(%)
Staphylococcus aureus Coagulase-negative staphylococci, including S. epidermidis
MRSA
*
eryth
romy
cin
clind
amyc
in
co-tr
imox
azole
cipro
floxa
cin
moxif
loxac
in
rifamp
icin
genta
micin
linez
olid
teico
planin
doxy
cylin
e/tet
racy
line
linez
olid
vanc
omyc
in
Figure 4.4.1.3.02. Trends in antibiotic resistance (2008-2012) among clinical isolates S. aureus from intensive care units, reported to ISIS-AR.* The prevalence of MRSA isolates was based on positivity of confirmation tests (presence of mecA gene or pbp2) or, if these tests were lacking, resistance to flucloxacillin, methicillin, oxacillin, or cefoxitin screentest.
Table 4.4.1.3.03. Resistance levels among clinical isolates of E. faecalis and E. faecium from intensive care units, ISIS-AR 2012
E. faecalis E. faecium
Antibiotic
amoxicillin/ampicillin 1.7 91.9
vancomycin 0 0.6
Table 4.4.1.3.04. Resistance levels among clinical isolates of S. aureus and coagulase negative staphylococci from intensive care units, ISIS-AR 2012Antibiotic S.aureus CNS
Antibiotic
MRSA* (S. aureus) 3 -
erythromycine 9 -
clindamycine 3 -trimethoprim- sulfamethoxazol 3 -
doxycyline/tetracycline 5 -
ciprofloxacin 8 -
rifampicin 1 -
gentamicin 1 -
linezolid 0 0
vancomycin - 1- Resistance not calculated. See methods and materials for explanation.* The prevalence of MRSA isolates was based on positivity of confir-mation tests (presence of mecA gene or pbp2) or, if these tests were lacking, resistance to flucloxacillin, methicillin, oxacillin, or cefoxitin screentest.
Increasing since 2008
Decreasing since 2008
Stable since 2008 or no test for trend conducted
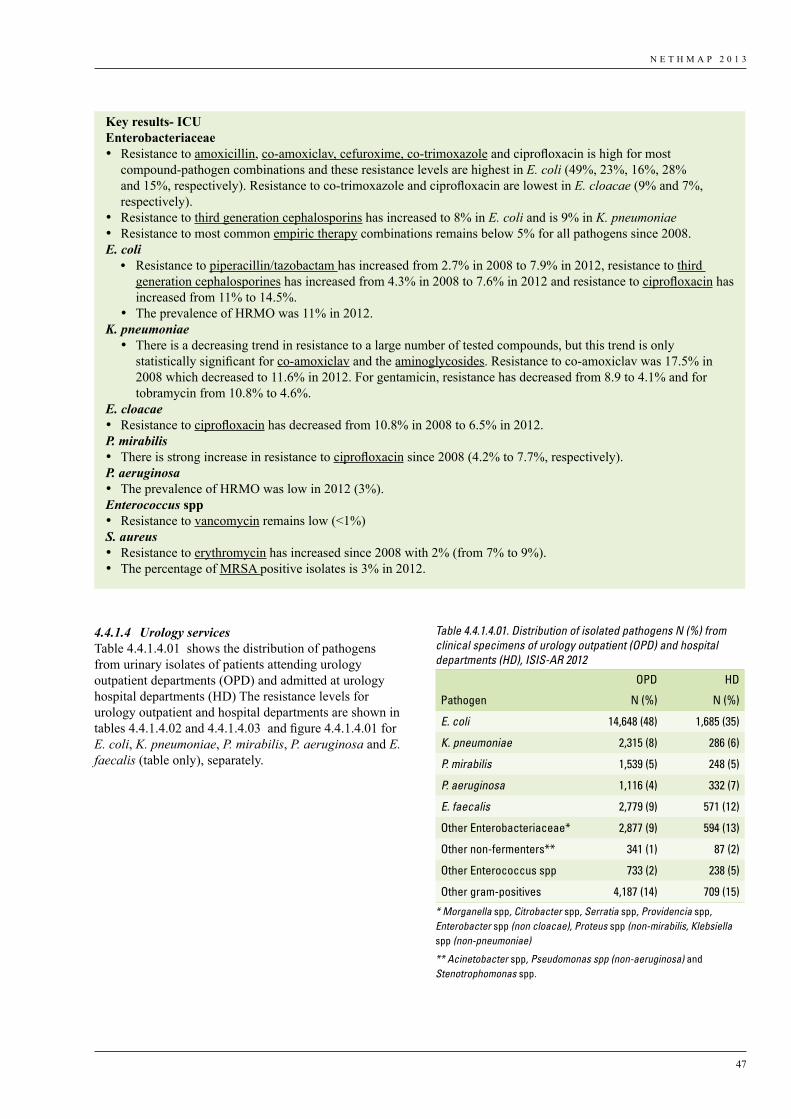
N E T H M A P 2 0 1 3
47
4.4.1.4 Urology servicesTable 4.4.1.4.01 shows the distribution of pathogens from urinary isolates of patients attending urology outpatient departments (OPD) and admitted at urology hospital departments (HD) The resistance levels for urology outpatient and hospital departments are shown in tables 4.4.1.4.02 and 4.4.1.4.03 and figure 4.4.1.4.01 for E. coli, K. pneumoniae, P. mirabilis, P. aeruginosa and E. faecalis (table only), separately.
Key results- ICUEnterobacteriaceae • Resistance to amoxicillin, co-amoxiclav, cefuroxime, co-trimoxazole and ciprofloxacin is high for most
compound-pathogen combinations and these resistance levels are highest in E. coli (49%, 23%, 16%, 28% and 15%, respectively). Resistance to co-trimoxazole and ciprofloxacin are lowest in E. cloacae (9% and 7%, respectively).
• Resistance to third generation cephalosporins has increased to 8% in E. coli and is 9% in K. pneumoniae• Resistance to most common empiric therapy combinations remains below 5% for all pathogens since 2008.E. coli
• Resistance to piperacillin/tazobactam has increased from 2.7% in 2008 to 7.9% in 2012, resistance to third generation cephalosporines has increased from 4.3% in 2008 to 7.6% in 2012 and resistance to ciprofloxacin has increased from 11% to 14.5%.
• The prevalence of HRMO was 11% in 2012.K. pneumoniae
• There is a decreasing trend in resistance to a large number of tested compounds, but this trend is only statistically significant for co-amoxiclav and the aminoglycosides. Resistance to co-amoxiclav was 17.5% in 2008 which decreased to 11.6% in 2012. For gentamicin, resistance has decreased from 8.9 to 4.1% and for tobramycin from 10.8% to 4.6%.
E. cloacae• Resistance to ciprofloxacin has decreased from 10.8% in 2008 to 6.5% in 2012.P. mirabilis• There is strong increase in resistance to ciprofloxacin since 2008 (4.2% to 7.7%, respectively).P. aeruginosa• The prevalence of HRMO was low in 2012 (3%).Enterococcus spp• Resistance to vancomycin remains low (<1%)S. aureus• Resistance to erythromycin has increased since 2008 with 2% (from 7% to 9%). • The percentage of MRSA positive isolates is 3% in 2012.
Table 4.4.1.4.01. Distribution of isolated pathogens N (%) from clinical specimens of urology outpatient (OPD) and hospital departments (HD), ISIS-AR 2012
OPD HD
Pathogen N (%) N (%)
E. coli 14,648 (48) 1,685 (35)
K. pneumoniae 2,315 (8) 286 (6)
P. mirabilis 1,539 (5) 248 (5)
P. aeruginosa 1,116 (4) 332 (7)
E. faecalis 2,779 (9) 571 (12)
Other Enterobacteriaceae* 2,877 (9) 594 (13)
Other non-fermenters** 341 (1) 87 (2)
Other Enterococcus spp 733 (2) 238 (5)
Other gram-positives 4,187 (14) 709 (15)
* Morganella spp, Citrobacter spp, Serratia spp, Providencia spp, Enterobacter spp (non cloacae), Proteus spp (non-mirabilis, Klebsiella spp (non-pneumoniae)
** Acinetobacter spp, Pseudomonas spp (non-aeruginosa) and Stenotrophomonas spp.
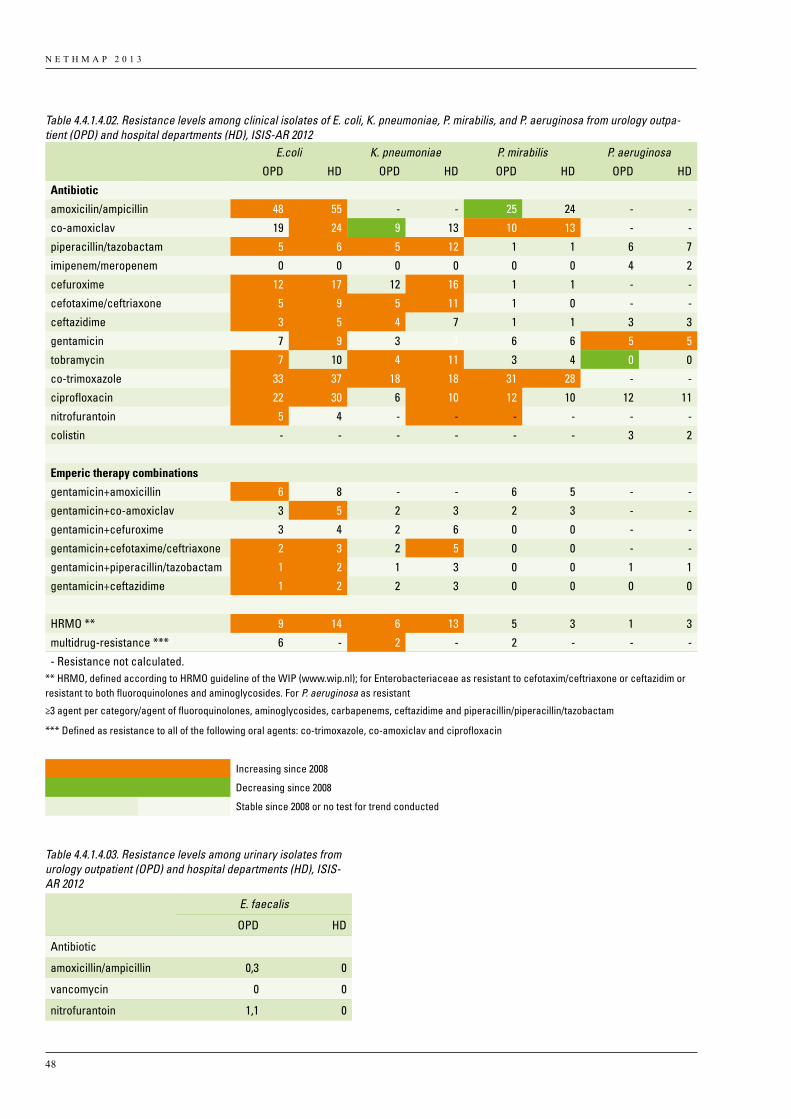
N E T H M A P 2 0 1 3
48
Table 4.4.1.4.02. Resistance levels among clinical isolates of E. coli, K. pneumoniae, P. mirabilis, and P. aeruginosa from urology outpa-tient (OPD) and hospital departments (HD), ISIS-AR 2012 E.coli K. pneumoniae P. mirabilis P. aeruginosa
OPD HD OPD HD OPD HD OPD HD
Antibiotic
amoxicilin/ampicillin 48 55 - - 25 24 - -
co-amoxiclav 19 24 9 13 10 13 - -
piperacillin/tazobactam 5 6 5 12 1 1 6 7
imipenem/meropenem 0 0 0 0 0 0 4 2
cefuroxime 12 17 12 16 1 1 - -
cefotaxime/ceftriaxone 5 9 5 11 1 0 - -
ceftazidime 3 5 4 7 1 1 3 3
gentamicin 7 9 3 7 6 6 5 5
tobramycin 7 10 4 11 3 4 0 0
co-trimoxazole 33 37 18 18 31 28 - -
ciprofloxacin 22 30 6 10 12 10 12 11
nitrofurantoin 5 4 - - - - - -
colistin - - - - - - 3 2
Emperic therapy combinations
gentamicin+amoxicillin 6 8 - - 6 5 - -
gentamicin+co-amoxiclav 3 5 2 3 2 3 - -
gentamicin+cefuroxime 3 4 2 6 0 0 - -
gentamicin+cefotaxime/ceftriaxone 2 3 2 5 0 0 - -
gentamicin+piperacillin/tazobactam 1 2 1 3 0 0 1 1
gentamicin+ceftazidime 1 2 2 3 0 0 0 0
HRMO ** 9 14 6 13 5 3 1 3
multidrug-resistance *** 6 - 2 - 2 - - -
- Resistance not calculated. ** HRMO, defined according to HRMO guideline of the WIP (www.wip.nl); for Enterobacteriaceae as resistant to cefotaxim/ceftriaxone or ceftazidim or resistant to both fluoroquinolones and aminoglycosides. For P. aeruginosa as resistant
≥3 agent per category/agent of fluoroquinolones, aminoglycosides, carbapenems, ceftazidime and piperacillin/piperacillin/tazobactam
*** Defined as resistance to all of the following oral agents: co-trimoxazole, co-amoxiclav and ciprofloxacin
Increasing since 2008
Decreasing since 2008
Stable since 2008 or no test for trend conducted
Table 4.4.1.4.03. Resistance levels among urinary isolates from urology outpatient (OPD) and hospital departments (HD), ISIS-AR 2012
E. faecalis
OPD HD
Antibiotic
amoxicillin/ampicillin 0,3 0
vancomycin 0 0
nitrofurantoin 1,1 0
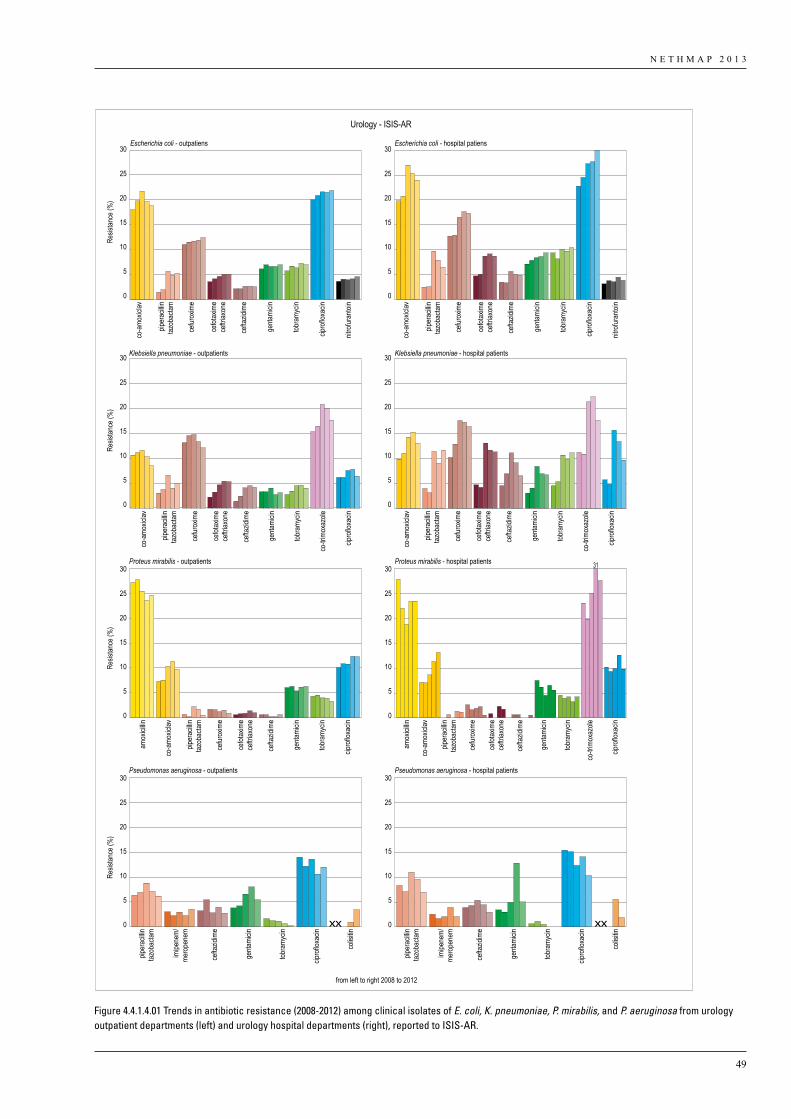
N E T H M A P 2 0 1 3
49
from left to right 2008 to 2012
Urology - ISIS-AR
0
5
10
15
20
25
30
0
5
10
15
20
25
30
Resis
tance
(%)
0
5
10
15
20
25
30
0
5
10
15
20
25
30
0
5
10
15
20
25
30
Resis
tance
(%)
0
5
10
15
20
25
30
Resis
tance
(%)
0
5
10
15
20
25
30
0
5
10
15
20
25
30
Resis
tance
(%)
Pseudomonas aeruginosa - outpatients Pseudomonas aeruginosa - hospital patients
cefot
axim
ece
ftriax
one
cefta
zidim
e
cefur
oxim
e
co-a
moxic
lav
genta
micin
tobra
mycin
nitro
furan
toin
cipro
floxa
cin
piper
acilli
ntaz
obac
tam
Escherichia coli - outpatiens
cefot
axim
ece
ftriax
one
cefta
zidim
e
cefur
oxim
e
co-a
moxic
lav
genta
micin
tobra
mycin
nitro
furan
toin
cipro
floxa
cin
piper
acilli
ntaz
obac
tam
Escherichia coli - hospital patiens
cefot
axim
ece
ftriax
one
cefta
zidim
e
cefur
oxim
e
co-a
moxic
lav
genta
micin
tobra
mycin
co-tr
imox
azole
cipro
floxa
cin
piper
acilli
ntaz
obac
tam
Klebsiella pneumoniae - outpatients
cefot
axim
ece
ftriax
one
cefta
zidim
e
cefur
oxim
e
co-a
moxic
lav
genta
micin
tobra
mycin
co-tr
imox
azole
cipro
floxa
cin
piper
acilli
ntaz
obac
tam
Klebsiella pneumoniae - hospital patients
cefot
axim
ece
ftriax
one
cefta
zidim
e
cefur
oxim
e
co-a
moxic
lav
amox
icillin
genta
micin
tobra
mycin
cipro
floxa
cin
piper
acilli
ntaz
obac
tam
Proteus mirabilis - outpatients
cefot
axim
ece
ftriax
one
cefta
zidim
e
cefur
oxim
e
co-a
moxic
lav
amox
icillin
genta
micin
tobra
mycin
co-tr
imox
azole
cipro
floxa
cin
piper
acilli
ntaz
obac
tam
Proteus mirabilis - hospital patients 31
cefta
zidim
e
imipe
nem/
mero
pene
m
genta
micin
tobra
mycin
cipro
floxa
cin
colis
itin
piper
acilli
ntaz
obac
tam
cefta
zidim
e
imipe
nem/
mero
pene
m
genta
micin
tobra
mycin
cipro
floxa
cin
colis
itin
piper
acilli
ntaz
obac
tam
Figure 4.4.1.4.01 Trends in antibiotic resistance (2008-2012) among clinical isolates of E. coli, K. pneumoniae, P. mirabilis, and P. aeruginosa from urology outpatient departments (left) and urology hospital departments (right), reported to ISIS-AR.
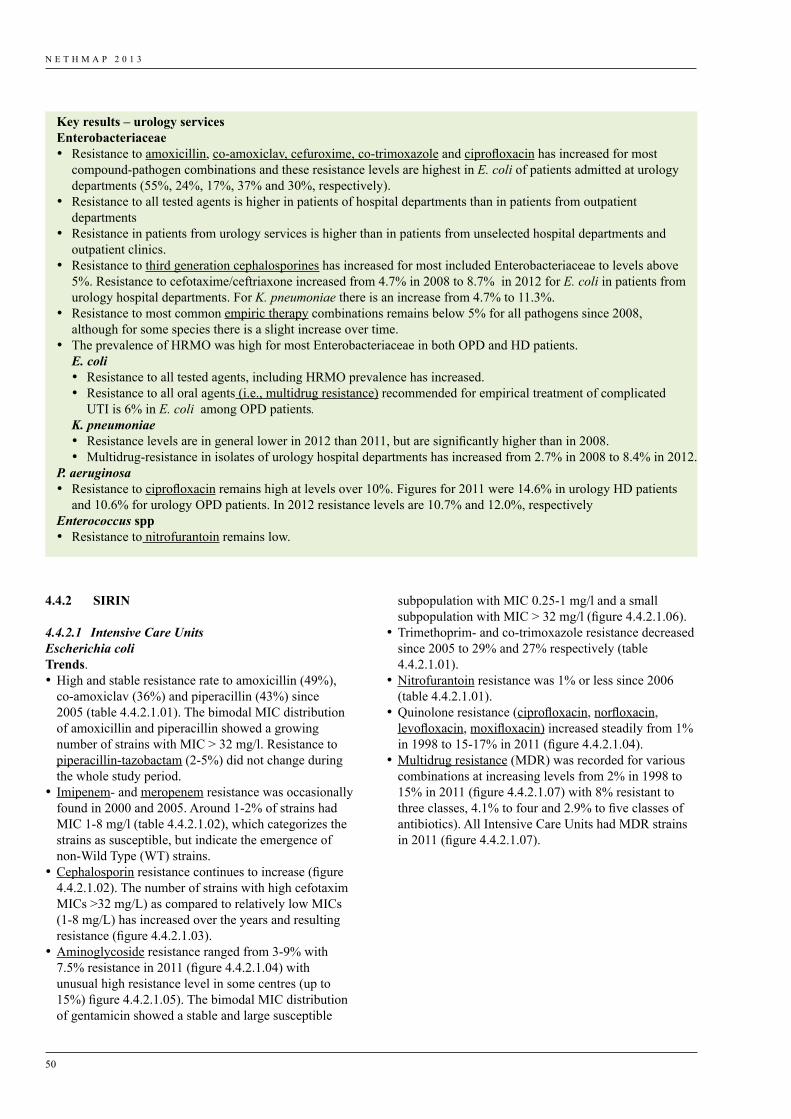
N E T H M A P 2 0 1 3
50
Key results – urology servicesEnterobacteriaceae• Resistance to amoxicillin, co-amoxiclav, cefuroxime, co-trimoxazole and ciprofloxacin has increased for most
compound-pathogen combinations and these resistance levels are highest in E. coli of patients admitted at urology departments (55%, 24%, 17%, 37% and 30%, respectively).
• Resistance to all tested agents is higher in patients of hospital departments than in patients from outpatient departments
• Resistance in patients from urology services is higher than in patients from unselected hospital departments and outpatient clinics.
• Resistance to third generation cephalosporines has increased for most included Enterobacteriaceae to levels above 5%. Resistance to cefotaxime/ceftriaxone increased from 4.7% in 2008 to 8.7% in 2012 for E. coli in patients from urology hospital departments. For K. pneumoniae there is an increase from 4.7% to 11.3%.
• Resistance to most common empiric therapy combinations remains below 5% for all pathogens since 2008, although for some species there is a slight increase over time.
• The prevalence of HRMO was high for most Enterobacteriaceae in both OPD and HD patients.E. coli• Resistance to all tested agents, including HRMO prevalence has increased.• Resistance to all oral agents (i.e., multidrug resistance) recommended for empirical treatment of complicated
UTI is 6% in E. coli among OPD patients.K. pneumoniae• Resistance levels are in general lower in 2012 than 2011, but are significantly higher than in 2008. • Multidrug-resistance in isolates of urology hospital departments has increased from 2.7% in 2008 to 8.4% in 2012.
P. aeruginosa• Resistance to ciprofloxacin remains high at levels over 10%. Figures for 2011 were 14.6% in urology HD patients
and 10.6% for urology OPD patients. In 2012 resistance levels are 10.7% and 12.0%, respectivelyEnterococcus spp• Resistance to nitrofurantoin remains low.
4.4.2 SIRIN
4.4.2.1 Intensive Care UnitsEscherichia coliTrends. •High and stable resistance rate to amoxicillin (49%),
co-amoxiclav (36%) and piperacillin (43%) since 2005 (table 4.4.2.1.01). The bimodal MIC distribution of amoxicillin and piperacillin showed a growing number of strains with MIC > 32 mg/l. Resistance to piperacillin-tazobactam (2-5%) did not change during the whole study period.
• Imipenem- and meropenem resistance was occasionally found in 2000 and 2005. Around 1-2% of strains had MIC 1-8 mg/l (table 4.4.2.1.02), which categorizes the strains as susceptible, but indicate the emergence of non-Wild Type (WT) strains.
•Cephalosporin resistance continues to increase (figure 4.4.2.1.02). The number of strains with high cefotaxim MICs >32 mg/L) as compared to relatively low MICs (1-8 mg/L) has increased over the years and resulting resistance (figure 4.4.2.1.03).
•Aminoglycoside resistance ranged from 3-9% with 7.5% resistance in 2011 (figure 4.4.2.1.04) with unusual high resistance level in some centres (up to 15%) figure 4.4.2.1.05). The bimodal MIC distribution of gentamicin showed a stable and large susceptible
subpopulation with MIC 0.25-1 mg/l and a small subpopulation with MIC > 32 mg/l (figure 4.4.2.1.06).
•Trimethoprim- and co-trimoxazole resistance decreased since 2005 to 29% and 27% respectively (table 4.4.2.1.01).
•Nitrofurantoin resistance was 1% or less since 2006 (table 4.4.2.1.01).
•Quinolone resistance (ciprofloxacin, norfloxacin, levofloxacin, moxifloxacin) increased steadily from 1% in 1998 to 15-17% in 2011 (figure 4.4.2.1.04).
•Multidrug resistance (MDR) was recorded for various combinations at increasing levels from 2% in 1998 to 15% in 2011 (figure 4.4.2.1.07) with 8% resistant to three classes, 4.1% to four and 2.9% to five classes of antibiotics). All Intensive Care Units had MDR strains in 2011 (figure 4.4.2.1.07).
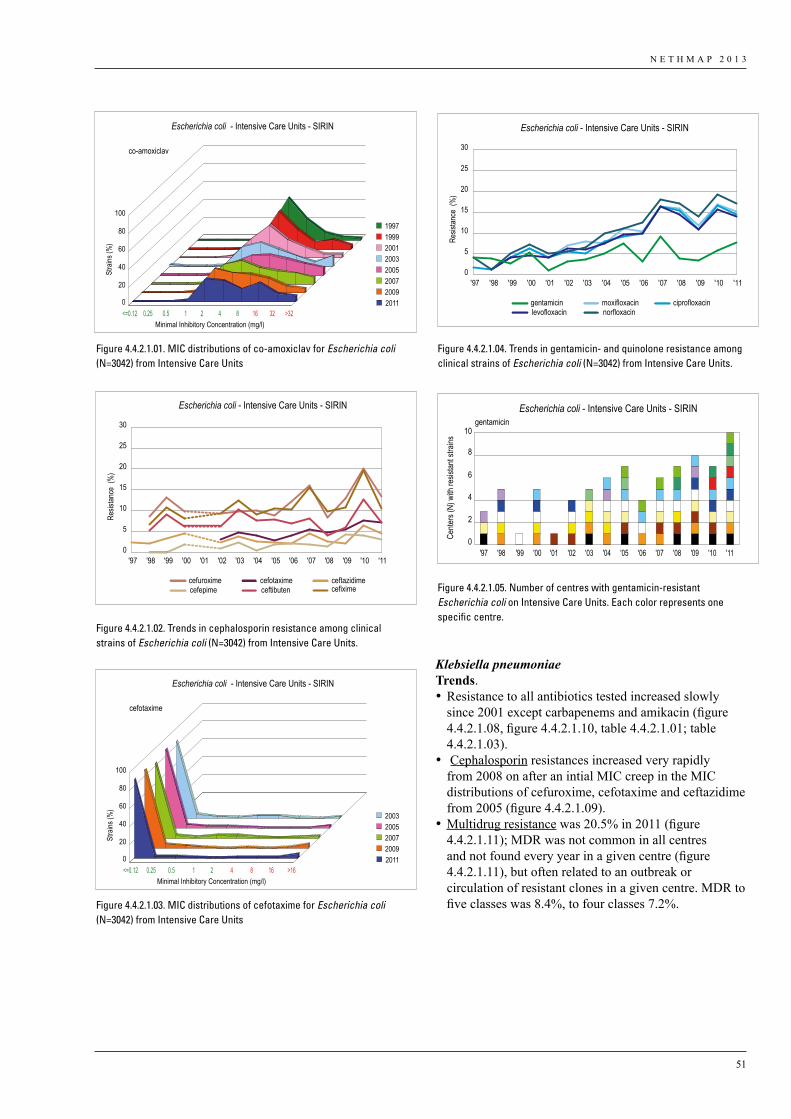
N E T H M A P 2 0 1 3
51
Klebsiella pneumoniaeTrends. •Resistance to all antibiotics tested increased slowly
since 2001 except carbapenems and amikacin (figure 4.4.2.1.08, figure 4.4.2.1.10, table 4.4.2.1.01; table 4.4.2.1.03).
• Cephalosporin resistances increased very rapidly from 2008 on after an intial MIC creep in the MIC distributions of cefuroxime, cefotaxime and ceftazidime from 2005 (figure 4.4.2.1.09).
•Multidrug resistance was 20.5% in 2011 (figure 4.4.2.1.11); MDR was not common in all centres and not found every year in a given centre (figure 4.4.2.1.11), but often related to an outbreak or circulation of resistant clones in a given centre. MDR to five classes was 8.4%, to four classes 7.2%.
Stra
ins (%
)
Escherichia coli - Intensive Care Units - SIRIN
0
20
40
60
80
100
<=0.12 0.25 0.5 1 2 4 8 16 32 >32Minimal Inhibitory Concentration (mg/l)
1997 1999 2001 2003 2005 2007 2009 2011
co-amoxiclav
Figure 4.4.2.1.01
gentamicin ciprofloxacinlevofloxacin norfloxacin
moxifloxacin
Escherichia coli - Intensive Care Units - SIRIN
Resis
tance
(%
)
0
5
10
15
20
25
30
'11'10'09'08'07'06'05'04'03'02'01'00'99'98'97
Figure 4.4.2.1.04
Escherichia coli - Intensive Care Units - SIRIN
Resis
tance
(%
)
cefuroxime ceftazidimecefiximecefepime ceftibuten
cefotaxime
0
5
10
15
20
25
30
'11'10'09'08'07'06'05'04'03'02'01'00'99'98'97
Figure 4.4.2.1.02
Escherichia coli - Intensive Care Units - SIRIN
Cente
rs (N
) with
resis
tant s
trains
0
2
4
6
8
10gentamicin
'98'97 '99 '00 '01 '02 '03 '04 '05 '06 '07 '08 '09 '10 '11
Figure 4.4.2.1.05
Stra
ins (%
)
Escherichia coli - Intensive Care Units - SIRIN
0
20
40
60
80
100
<=0.12 0.25 0.5 1 2 4 8 16 >16Minimal Inhibitory Concentration (mg/l)
2003 2005 2007 2009 2011
cefotaxime
Figure 4.4.2.1.03
Figure 4.4.2.1.01. MIC distributions of co-amoxiclav for Escherichia coli (N=3042) from Intensive Care Units
Figure 4.4.2.1.04. Trends in gentamicin- and quinolone resistance among clinical strains of Escherichia coli (N=3042) from Intensive Care Units.
Figure 4.4.2.1.02. Trends in cephalosporin resistance among clinical strains of Escherichia coli (N=3042) from Intensive Care Units.
Figure 4.4.2.1.05. Number of centres with gentamicin-resistant Escherichia coli on Intensive Care Units. Each color represents one specific centre.
Figure 4.4.2.1.03. MIC distributions of cefotaxime for Escherichia coli (N=3042) from Intensive Care Units
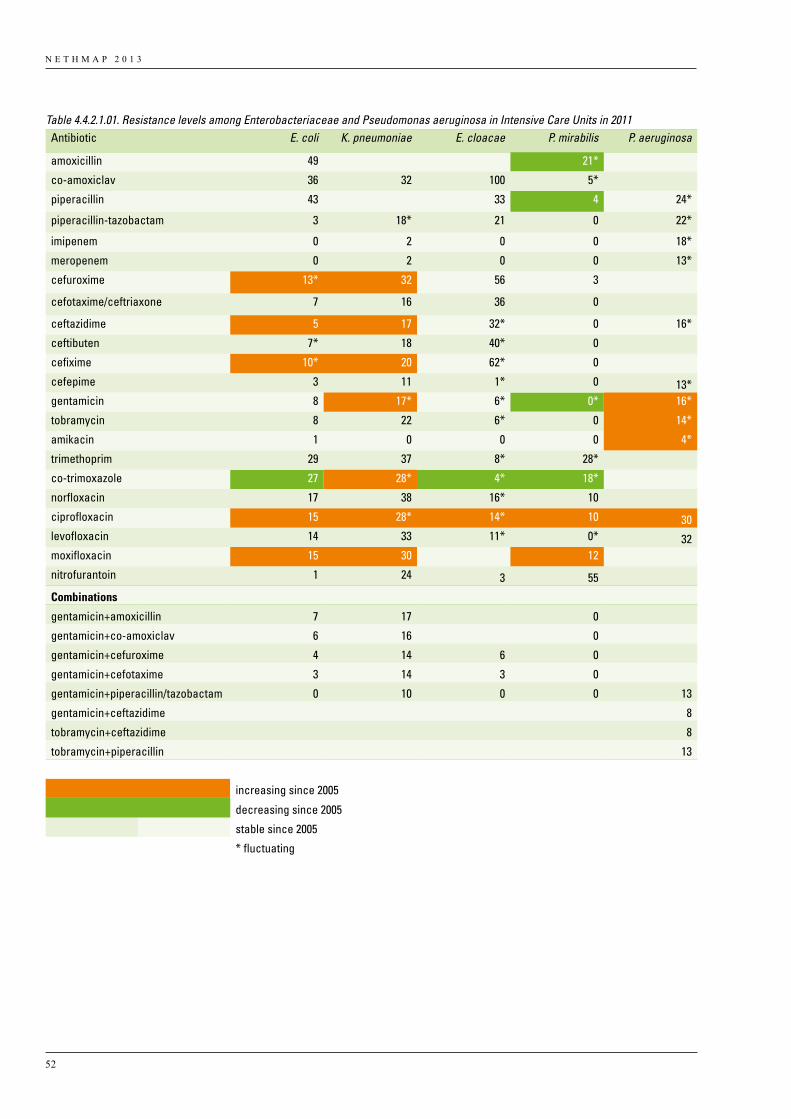
N E T H M A P 2 0 1 3
52
Table 4.4.2.1.01. Resistance levels among Enterobacteriaceae and Pseudomonas aeruginosa in Intensive Care Units in 2011 Antibiotic E. coli K. pneumoniae E. cloacae P. mirabilis P. aeruginosa
amoxicillin 49 21* co-amoxiclav 36 32 100 5* piperacillin 43 33 4 24*
piperacillin-tazobactam 3 18* 21 0 22*
imipenem 0 2 0 0 18*
meropenem 0 2 0 0 13*
cefuroxime 13* 32 56 3 cefotaxime/ceftriaxone 7 16 36 0 ceftazidime 5 17 32* 0 16*
ceftibuten 7* 18 40* 0 cefixime 10* 20 62* 0 cefepime 3 11 1* 0 13*gentamicin 8 17* 6* 0* 16*
tobramycin 8 22 6* 0 14*
amikacin 1 0 0 0 4*
trimethoprim 29 37 8* 28* co-trimoxazole 27 28* 4* 18* norfloxacin 17 38 16* 10 ciprofloxacin 15 28* 14* 10 30levofloxacin 14 33 11* 0* 32moxifloxacin 15 30 12 nitrofurantoin 1 24 3 55
Combinations
gentamicin+amoxicillin 7 17 0
gentamicin+co-amoxiclav 6 16 0
gentamicin+cefuroxime 4 14 6 0
gentamicin+cefotaxime 3 14 3 0
gentamicin+piperacillin/tazobactam 0 10 0 0 13
gentamicin+ceftazidime 8
tobramycin+ceftazidime 8
tobramycin+piperacillin 13
increasing since 2005
decreasing since 2005
stable since 2005
* fluctuating
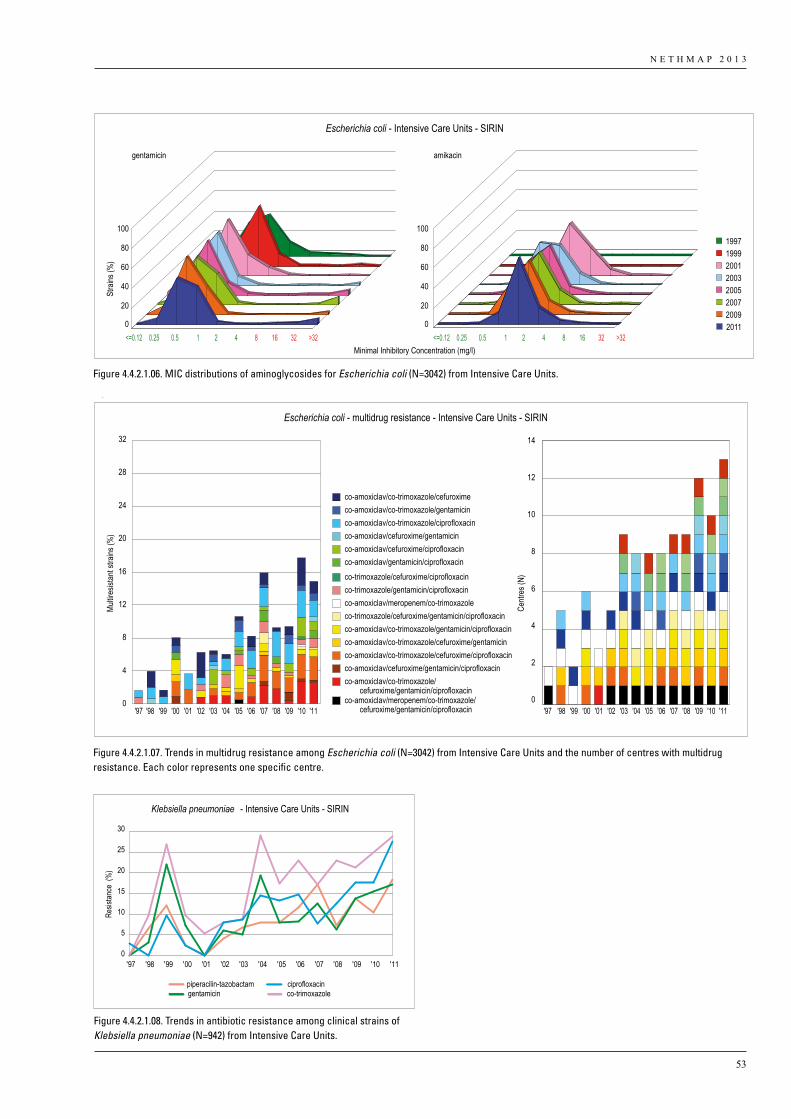
N E T H M A P 2 0 1 3
53
Stra
ins (%
)
Escherichia coli - Intensive Care Units - SIRIN
0
20
40
60
80
100
0
20
40
60
80
100
gentamicin amikacin
<=0.12 0.25 0.5 1 2 4 8 16 32 >32 <=0.12 0.25 0.5 1 2 4 8 16 32 >32Minimal Inhibitory Concentration (mg/l)
1997 1999 2001 2003 2005 2007 2009 2011
Figure 4.4.2.1.06
Escherichia coli - multidrug resistance - Intensive Care Units - SIRIN
Multir
esist
ant s
trains
(%)
0
4
8
12
16
20
24
28
32
'98'97 '99 '00 '01 '02 '03 '04 '05 '06 '07 '08 '09 '10 '11 '98'97 '99 '00 '01 '02 '03 '04 '05 '06 '07 '08 '09 '10 '11
co-amoxiclav/co-trimoxazole/cefuroximeco-amoxiclav/co-trimoxazole/gentamicinco-amoxiclav/co-trimoxazole/ciprofloxacinco-amoxiclav/cefuroxime/gentamicinco-amoxiclav/cefuroxime/ciprofloxacinco-amoxiclav/gentamicin/ciprofloxacinco-trimoxazole/cefuroxime/ciprofloxacinco-trimoxazole/gentamicin/ciprofloxacinco-amoxiclav/meropenem/co-trimoxazoleco-trimoxazole/cefuroxime/gentamicin/ciprofloxacinco-amoxiclav/co-trimoxazole/gentamicin/ciprofloxacinco-amoxiclav/co-trimoxazole/cefuroxime/gentamicinco-amoxiclav/co-trimoxazole/cefuroxime/ciprofloxacinco-amoxiclav/cefuroxime/gentamicin/ciprofloxacinco-amoxiclav/co-trimoxazole/
cefuroxime/gentamicin/ciprofloxacinco-amoxiclav/meropenem/co-trimoxazole/
cefuroxime/gentamicin/ciprofloxacin
Centr
es (N
)
0
2
4
6
8
10
12
14
Figure 4.4.2.1.07
Figure 4.4.2.1.06. MIC distributions of aminoglycosides for Escherichia coli (N=3042) from Intensive Care Units.
Figure 4.4.2.1.07. Trends in multidrug resistance among Escherichia coli (N=3042) from Intensive Care Units and the number of centres with multidrug resistance. Each color represents one specific centre.
piperacilin-tazobactam ciprofloxacingentamicin co-trimoxazole
Klebsiella pneumoniae - Intensive Care Units - SIRIN
Resis
tance
(%
)
0
5
10
15
20
25
30
'11'10'09'08'07'06'05'04'03'02'01'00'99'98'97
Figure 4.4.2.1.08
Figure 4.4.2.1.08. Trends in antibiotic resistance among clinical strains of Klebsiella pneumoniae (N=942) from Intensive Care Units.
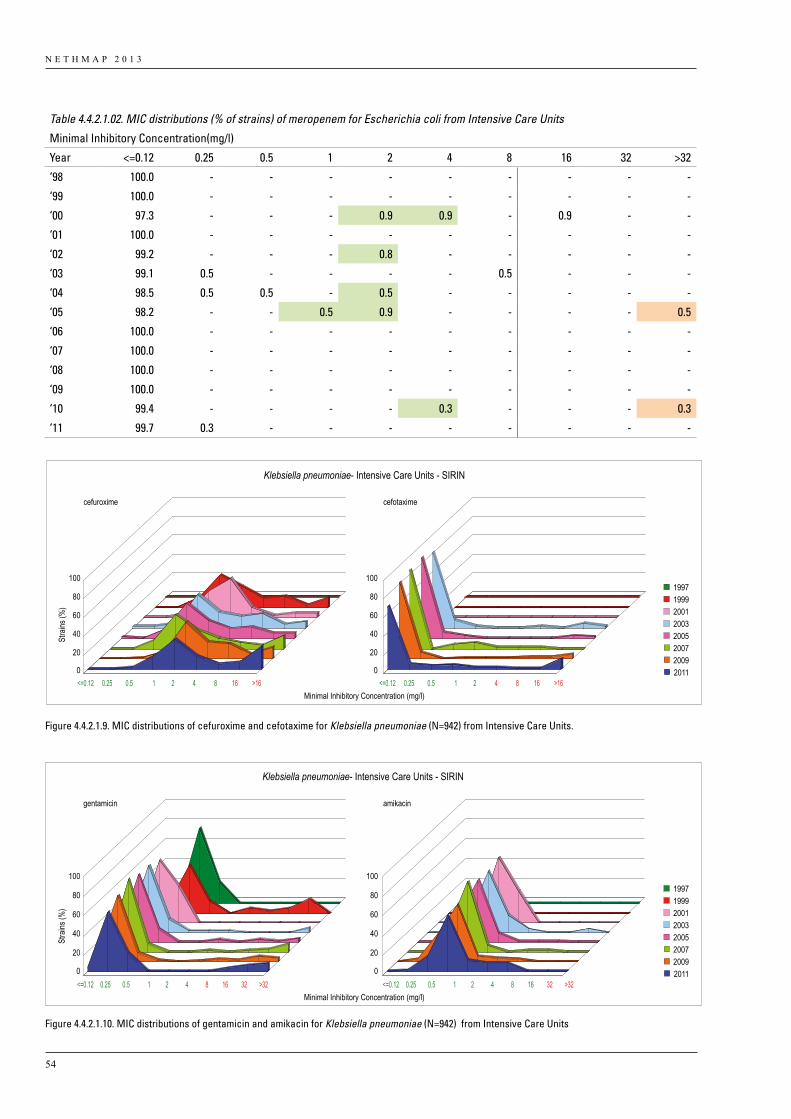
N E T H M A P 2 0 1 3
54
Table 4.4.2.1.02. MIC distributions (% of strains) of meropenem for Escherichia coli from Intensive Care Units
Minimal Inhibitory Concentration(mg/l)
Year <=0.12 0.25 0.5 1 2 4 8 16 32 >32
‘98 100.0 - - - - - - - - -
‘99 100.0 - - - - - - - - -
‘00 97.3 - - - 0.9 0.9 - 0.9 - -
‘01 100.0 - - - - - - - - -
‘02 99.2 - - - 0.8 - - - - -
‘03 99.1 0.5 - - - - 0.5 - - -
‘04 98.5 0.5 0.5 - 0.5 - - - - -
‘05 98.2 - - 0.5 0.9 - - - - 0.5
‘06 100.0 - - - - - - - - -
‘07 100.0 - - - - - - - - -
‘08 100.0 - - - - - - - - -
‘09 100.0 - - - - - - - - -
‘10 99.4 - - - - 0.3 - - - 0.3
‘11 99.7 0.3 - - - - - - - -
Stra
ins (%
)
Klebsiella pneumoniae- Intensive Care Units - SIRIN
0
20
40
60
80
100
0
20
40
60
80
100
cefuroxime cefotaxime
<=0.12 0.25 0.5 1 2 4 8 16 >16 <=0.12 0.25 0.5 1 2 4 8 16 >16Minimal Inhibitory Concentration (mg/l)
1997 1999 2001 2003 2005 2007 2009 2011
Figure 4.4.2.1.09
Stra
ins (%
)
Klebsiella pneumoniae- Intensive Care Units - SIRIN
Figure 4.4.2.1.1O
0
20
40
60
80
100
0
20
40
60
80
100
gentamicin amikacin
<=0.12 0.25 0.5 1 2 4 8 16 32 >32 <=0.12 0.25 0.5 1 2 4 8 16 32 >32Minimal Inhibitory Concentration (mg/l)
1997 1999 2001 2003 2005 2007 2009 2011
Figure 4.4.2.1.9. MIC distributions of cefuroxime and cefotaxime for Klebsiella pneumoniae (N=942) from Intensive Care Units.
Figure 4.4.2.1.10. MIC distributions of gentamicin and amikacin for Klebsiella pneumoniae (N=942) from Intensive Care Units
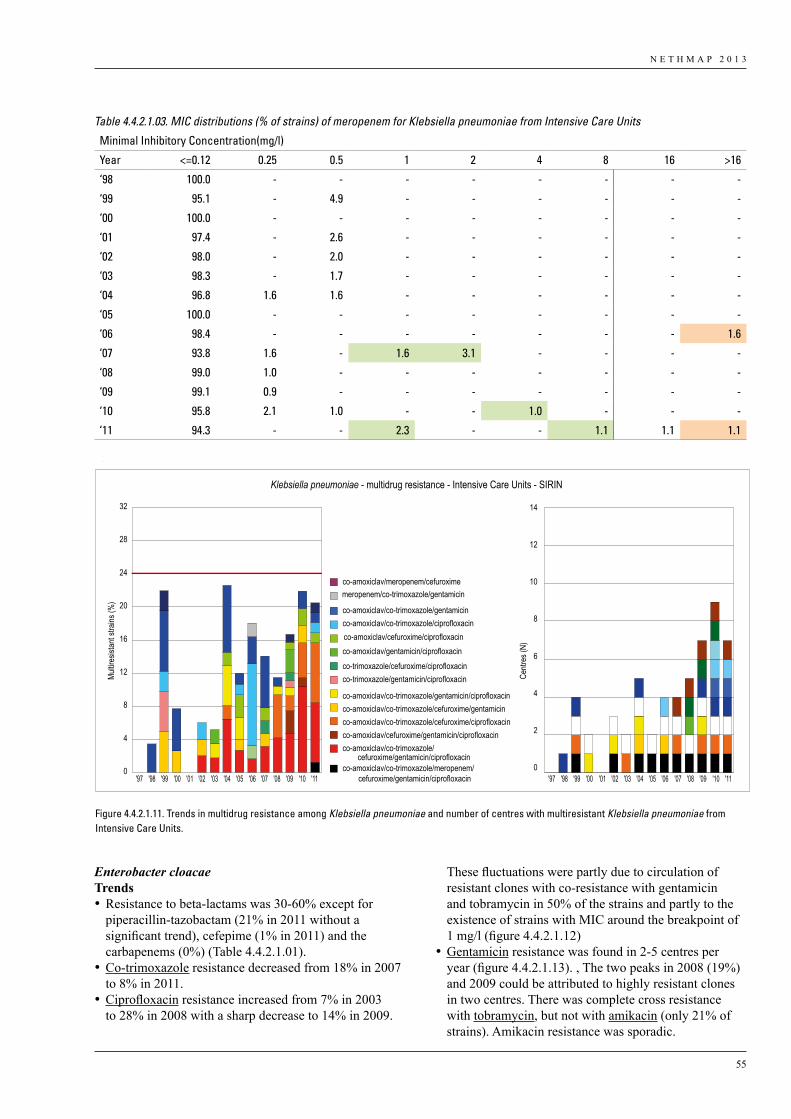
N E T H M A P 2 0 1 3
55
Enterobacter cloacaeTrends•Resistance to beta-lactams was 30-60% except for
piperacillin-tazobactam (21% in 2011 without a significant trend), cefepime (1% in 2011) and the carbapenems (0%) (Table 4.4.2.1.01).
•Co-trimoxazole resistance decreased from 18% in 2007 to 8% in 2011.
•Ciprofloxacin resistance increased from 7% in 2003 to 28% in 2008 with a sharp decrease to 14% in 2009.
These fluctuations were partly due to circulation of resistant clones with co-resistance with gentamicin and tobramycin in 50% of the strains and partly to the existence of strains with MIC around the breakpoint of 1 mg/l (figure 4.4.2.1.12)
•Gentamicin resistance was found in 2-5 centres per year (figure 4.4.2.1.13). , The two peaks in 2008 (19%) and 2009 could be attributed to highly resistant clones in two centres. There was complete cross resistance with tobramycin, but not with amikacin (only 21% of strains). Amikacin resistance was sporadic.
Table 4.4.2.1.03. MIC distributions (% of strains) of meropenem for Klebsiella pneumoniae from Intensive Care Units
Minimal Inhibitory Concentration(mg/l)
Year <=0.12 0.25 0.5 1 2 4 8 16 >16
‘98 100.0 - - - - - - - -
‘99 95.1 - 4.9 - - - - - -
‘00 100.0 - - - - - - - -
‘01 97.4 - 2.6 - - - - - -
‘02 98.0 - 2.0 - - - - - -
‘03 98.3 - 1.7 - - - - - -
‘04 96.8 1.6 1.6 - - - - - -
‘05 100.0 - - - - - - - -
‘06 98.4 - - - - - - - 1.6
‘07 93.8 1.6 - 1.6 3.1 - - - -
‘08 99.0 1.0 - - - - - - -
‘09 99.1 0.9 - - - - - - -
‘10 95.8 2.1 1.0 - - 1.0 - - -
‘11 94.3 - - 2.3 - - 1.1 1.1 1.1
Klebsiella pneumoniae - multidrug resistance - Intensive Care Units - SIRIN
Multir
esist
ant s
trains
(%)
0
4
8
12
16
20
24
28
32
co-amoxiclav/meropenem/cefuroximemeropenem/co-trimoxazole/gentamicin
co-amoxiclav/co-trimoxazole/gentamicinco-amoxiclav/co-trimoxazole/ciprofloxacinco-amoxiclav/cefuroxime/ciprofloxacinco-amoxiclav/gentamicin/ciprofloxacinco-trimoxazole/cefuroxime/ciprofloxacinco-trimoxazole/gentamicin/ciprofloxacin
co-amoxiclav/co-trimoxazole/gentamicin/ciprofloxacinco-amoxiclav/co-trimoxazole/cefuroxime/gentamicinco-amoxiclav/co-trimoxazole/cefuroxime/ciprofloxacinco-amoxiclav/cefuroxime/gentamicin/ciprofloxacinco-amoxiclav/co-trimoxazole/
co-amoxiclav/co-trimoxazole/meropenem/ cefuroxime/gentamicin/ciprofloxacin
cefuroxime/gentamicin/ciprofloxacin
Centr
es (N
)
0
2
4
6
8
10
12
14
'97 '98 '99 '00 '01 '02 '03 '04 '05 '06 '07 '08 '09 '10 '11 '97 '98 '99 '00 '01 '02 '03 '04 '05 '06 '07 '08 '09 '10 '11
Figure 4.4.2.1.11
Figure 4.4.2.1.11. Trends in multidrug resistance among Klebsiella pneumoniae and number of centres with multiresistant Klebsiella pneumoniae from Intensive Care Units.
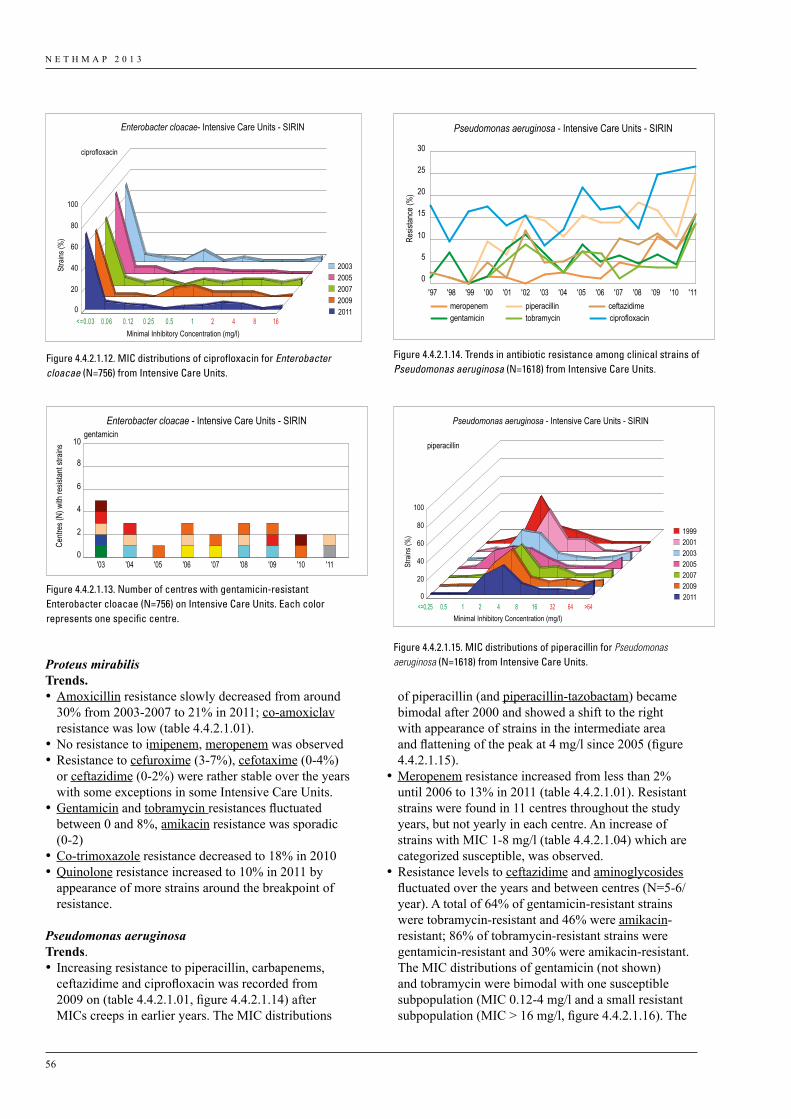
N E T H M A P 2 0 1 3
56
Proteus mirabilis Trends. •Amoxicillin resistance slowly decreased from around
30% from 2003-2007 to 21% in 2011; co-amoxiclav resistance was low (table 4.4.2.1.01).
•No resistance to imipenem, meropenem was observed•Resistance to cefuroxime (3-7%), cefotaxime (0-4%)
or ceftazidime (0-2%) were rather stable over the years with some exceptions in some Intensive Care Units.
•Gentamicin and tobramycin resistances fluctuated between 0 and 8%, amikacin resistance was sporadic (0-2)
•Co-trimoxazole resistance decreased to 18% in 2010•Quinolone resistance increased to 10% in 2011 by
appearance of more strains around the breakpoint of resistance.
Pseudomonas aeruginosaTrends. • Increasing resistance to piperacillin, carbapenems,
ceftazidime and ciprofloxacin was recorded from 2009 on (table 4.4.2.1.01, figure 4.4.2.1.14) after MICs creeps in earlier years. The MIC distributions
of piperacillin (and piperacillin-tazobactam) became bimodal after 2000 and showed a shift to the right with appearance of strains in the intermediate area and flattening of the peak at 4 mg/l since 2005 (figure 4.4.2.1.15).
•Meropenem resistance increased from less than 2% until 2006 to 13% in 2011 (table 4.4.2.1.01). Resistant strains were found in 11 centres throughout the study years, but not yearly in each centre. An increase of strains with MIC 1-8 mg/l (table 4.4.2.1.04) which are categorized susceptible, was observed.
•Resistance levels to ceftazidime and aminoglycosides fluctuated over the years and between centres (N=5-6/year). A total of 64% of gentamicin-resistant strains were tobramycin-resistant and 46% were amikacin-resistant; 86% of tobramycin-resistant strains were gentamicin-resistant and 30% were amikacin-resistant. The MIC distributions of gentamicin (not shown) and tobramycin were bimodal with one susceptible subpopulation (MIC 0.12-4 mg/l and a small resistant subpopulation (MIC > 16 mg/l, figure 4.4.2.1.16). The
Stra
ins (%
)
Enterobacter cloacae- Intensive Care Units - SIRIN
0
20
40
60
80
100
ciprofloxacin
Minimal Inhibitory Concentration (mg/l)
2003 2005 2007 2009 2011
<=0.03 0.06 0.12 0.25 0.5 1 2 4 8 16
Figure 4.4.2.1.12
Enterobacter cloacae - Intensive Care Units - SIRIN
Centr
es (N
) with
resis
tant s
trains
'03 '04 '05 '06 '07 '08 '09 '10 '110
2
4
6
8
10gentamicin
Figure 4.4.2.1.13
meropenem piperacillin ceftazidimegentamicin tobramycin ciprofloxacin
Pseudomonas aeruginosa - Intensive Care Units - SIRIN
Resis
tance
(%)
0
5
10
15
20
25
30
'11'10'09'08'07'06'05'04'03'02'01'00'99'98'97
Figure 4.4.2.1.14
Stra
ins (%
)
Pseudomonas aeruginosa - Intensive Care Units - SIRIN
0
20
40
60
80
100
Minimal Inhibitory Concentration (mg/l)
1999 2001 2003 2005 2007 2009 2011
piperacillin
<=0.25 0.5 1 2 4 8 16 32 64 >64
Figure 4.4.2.1.15
Figure 4.4.2.1.12. MIC distributions of ciprofloxacin for Enterobacter cloacae (N=756) from Intensive Care Units.
Figure 4.4.2.1.13. Number of centres with gentamicin-resistant Enterobacter cloacae (N=756) on Intensive Care Units. Each color represents one specific centre.
Figure 4.4.2.1.14. Trends in antibiotic resistance among clinical strains of Pseudomonas aeruginosa (N=1618) from Intensive Care Units.
Figure 4.4.2.1.15. MIC distributions of piperacillin for Pseudomonas aeruginosa (N=1618) from Intensive Care Units.
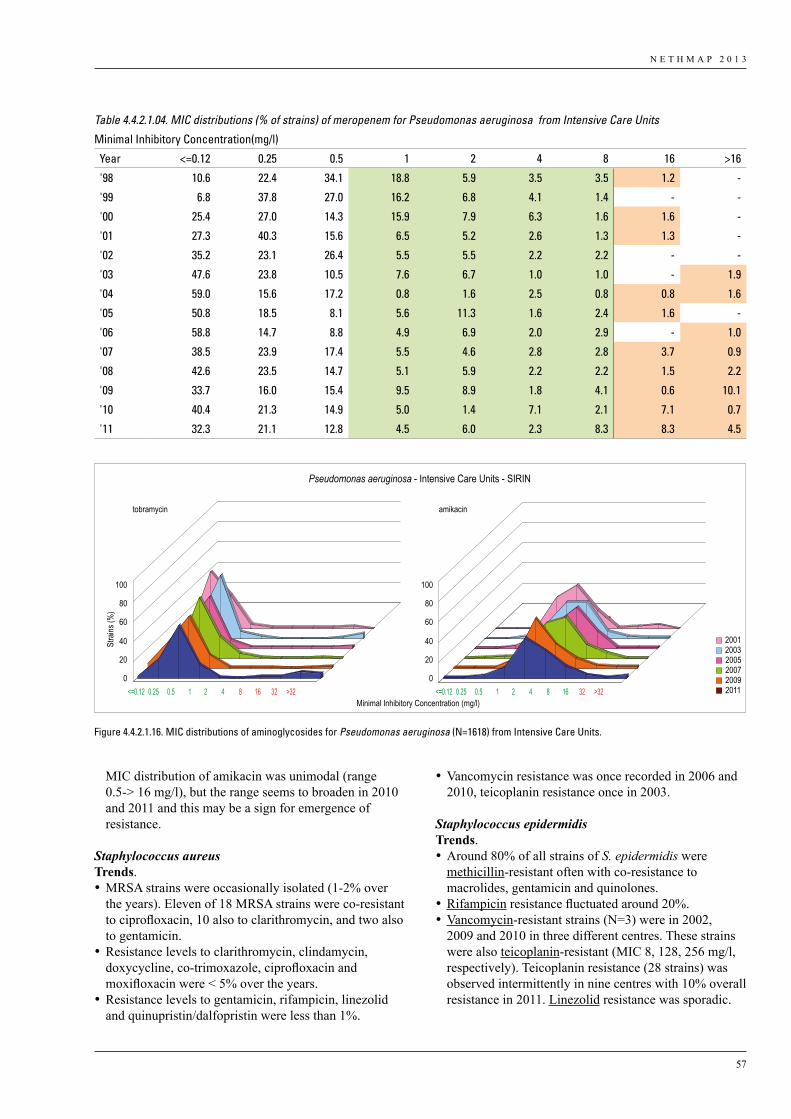
N E T H M A P 2 0 1 3
57
MIC distribution of amikacin was unimodal (range 0.5-> 16 mg/l), but the range seems to broaden in 2010 and 2011 and this may be a sign for emergence of resistance.
Staphylococcus aureusTrends. •MRSA strains were occasionally isolated (1-2% over
the years). Eleven of 18 MRSA strains were co-resistant to ciprofloxacin, 10 also to clarithromycin, and two also to gentamicin.
•Resistance levels to clarithromycin, clindamycin, doxycycline, co-trimoxazole, ciprofloxacin and moxifloxacin were < 5% over the years.
•Resistance levels to gentamicin, rifampicin, linezolid and quinupristin/dalfopristin were less than 1%.
•Vancomycin resistance was once recorded in 2006 and 2010, teicoplanin resistance once in 2003.
Staphylococcus epidermidisTrends. •Around 80% of all strains of S. epidermidis were
methicillin-resistant often with co-resistance to macrolides, gentamicin and quinolones.
•Rifampicin resistance fluctuated around 20%. •Vancomycin-resistant strains (N=3) were in 2002,
2009 and 2010 in three different centres. These strains were also teicoplanin-resistant (MIC 8, 128, 256 mg/l, respectively). Teicoplanin resistance (28 strains) was observed intermittently in nine centres with 10% overall resistance in 2011. Linezolid resistance was sporadic.
Table 4.4.2.1.04. MIC distributions (% of strains) of meropenem for Pseudomonas aeruginosa from Intensive Care Units
Minimal Inhibitory Concentration(mg/l)
Year <=0.12 0.25 0.5 1 2 4 8 16 >16
'98 10.6 22.4 34.1 18.8 5.9 3.5 3.5 1.2 -
'99 6.8 37.8 27.0 16.2 6.8 4.1 1.4 - -
'00 25.4 27.0 14.3 15.9 7.9 6.3 1.6 1.6 -
'01 27.3 40.3 15.6 6.5 5.2 2.6 1.3 1.3 -
'02 35.2 23.1 26.4 5.5 5.5 2.2 2.2 - -
'03 47.6 23.8 10.5 7.6 6.7 1.0 1.0 - 1.9
'04 59.0 15.6 17.2 0.8 1.6 2.5 0.8 0.8 1.6
'05 50.8 18.5 8.1 5.6 11.3 1.6 2.4 1.6 -
'06 58.8 14.7 8.8 4.9 6.9 2.0 2.9 - 1.0
'07 38.5 23.9 17.4 5.5 4.6 2.8 2.8 3.7 0.9
'08 42.6 23.5 14.7 5.1 5.9 2.2 2.2 1.5 2.2
'09 33.7 16.0 15.4 9.5 8.9 1.8 4.1 0.6 10.1
'10 40.4 21.3 14.9 5.0 1.4 7.1 2.1 7.1 0.7
'11 32.3 21.1 12.8 4.5 6.0 2.3 8.3 8.3 4.5
Stra
ins (%
)
Pseudomonas aeruginosa - Intensive Care Units - SIRIN
2001 2003 2005 2007 2009 2011
tobramycin
Minimal Inhibitory Concentration (mg/l)
amikacin
0
20
40
60
80
100
0
20
40
60
80
100
<=0.12 0.25 0.5 1 2 4 8 16 32 >32 <=0.12 0.25 0.5 1 2 4 8 16 32 >32
Figure 4.4.2.1.16
Figure 4.4.2.1.16. MIC distributions of aminoglycosides for Pseudomonas aeruginosa (N=1618) from Intensive Care Units.
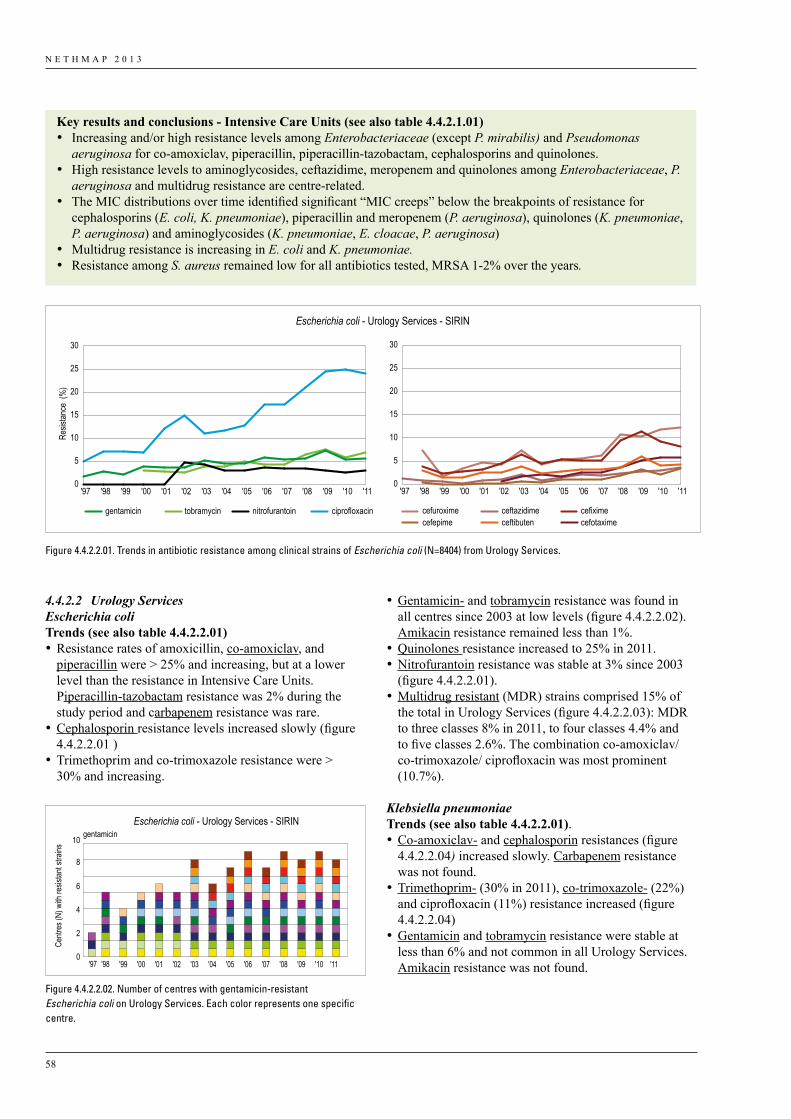
N E T H M A P 2 0 1 3
58
•Gentamicin- and tobramycin resistance was found in all centres since 2003 at low levels (figure 4.4.2.2.02). Amikacin resistance remained less than 1%.
•Quinolones resistance increased to 25% in 2011. •Nitrofurantoin resistance was stable at 3% since 2003
(figure 4.4.2.2.01).•Multidrug resistant (MDR) strains comprised 15% of
the total in Urology Services (figure 4.4.2.2.03): MDR to three classes 8% in 2011, to four classes 4.4% and to five classes 2.6%. The combination co-amoxiclav/co-trimoxazole/ ciprofloxacin was most prominent (10.7%).
Klebsiella pneumoniaeTrends (see also table 4.4.2.2.01). •Co-amoxiclav- and cephalosporin resistances (figure
4.4.2.2.04) increased slowly. Carbapenem resistance was not found.
•Trimethoprim- (30% in 2011), co-trimoxazole- (22%) and ciprofloxacin (11%) resistance increased (figure 4.4.2.2.04)
•Gentamicin and tobramycin resistance were stable at less than 6% and not common in all Urology Services. Amikacin resistance was not found.
4.4.2.2 Urology ServicesEscherichia coliTrends (see also table 4.4.2.2.01) •Resistance rates of amoxicillin, co-amoxiclav, and
piperacillin were > 25% and increasing, but at a lower level than the resistance in Intensive Care Units. Piperacillin-tazobactam resistance was 2% during the study period and carbapenem resistance was rare.
•Cephalosporin resistance levels increased slowly (figure 4.4.2.2.01 )
•Trimethoprim and co-trimoxazole resistance were > 30% and increasing.
Escherichia coli - Urology Services - SIRIN
Resis
tance
(%
)
gentamicin nitrofurantoin ciprofloxacintobramycin cefuroxime ceftazidime cefiximecefepime ceftibuten cefotaxime
0
5
10
15
20
25
30
'11'10'09'08'07'06'05'04'03'02'01'00'99'98'97
0
5
10
15
20
25
30
'11'10'09'08'07'06'05'04'03'02'01'00'99'98'97
Figure 4.4.2.2.01
Figure 4.4.2.2.01. Trends in antibiotic resistance among clinical strains of Escherichia coli (N=8404) from Urology Services.
Key results and conclusions - Intensive Care Units (see also table 4.4.2.1.01)• Increasing and/or high resistance levels among Enterobacteriaceae (except P. mirabilis) and Pseudomonas
aeruginosa for co-amoxiclav, piperacillin, piperacillin-tazobactam, cephalosporins and quinolones.• High resistance levels to aminoglycosides, ceftazidime, meropenem and quinolones among Enterobacteriaceae, P.
aeruginosa and multidrug resistance are centre-related. • The MIC distributions over time identified significant “MIC creeps” below the breakpoints of resistance for
cephalosporins (E. coli, K. pneumoniae), piperacillin and meropenem (P. aeruginosa), quinolones (K. pneumoniae, P. aeruginosa) and aminoglycosides (K. pneumoniae, E. cloacae, P. aeruginosa)
• Multidrug resistance is increasing in E. coli and K. pneumoniae.• Resistance among S. aureus remained low for all antibiotics tested, MRSA 1-2% over the years.
Centr
es (N
) with
resis
tant s
trains
'98'97 '99 '00 '01 '02 '03 '04 '05 '06 '07 '08 '09 '10 '110
2
4
6
8
10gentamicin
Escherichia coli - Urology Services - SIRIN
Figure 4.4.2.2.02
Figure 4.4.2.2.02. Number of centres with gentamicin-resistant Escherichia coli on Urology Services. Each color represents one specific centre.
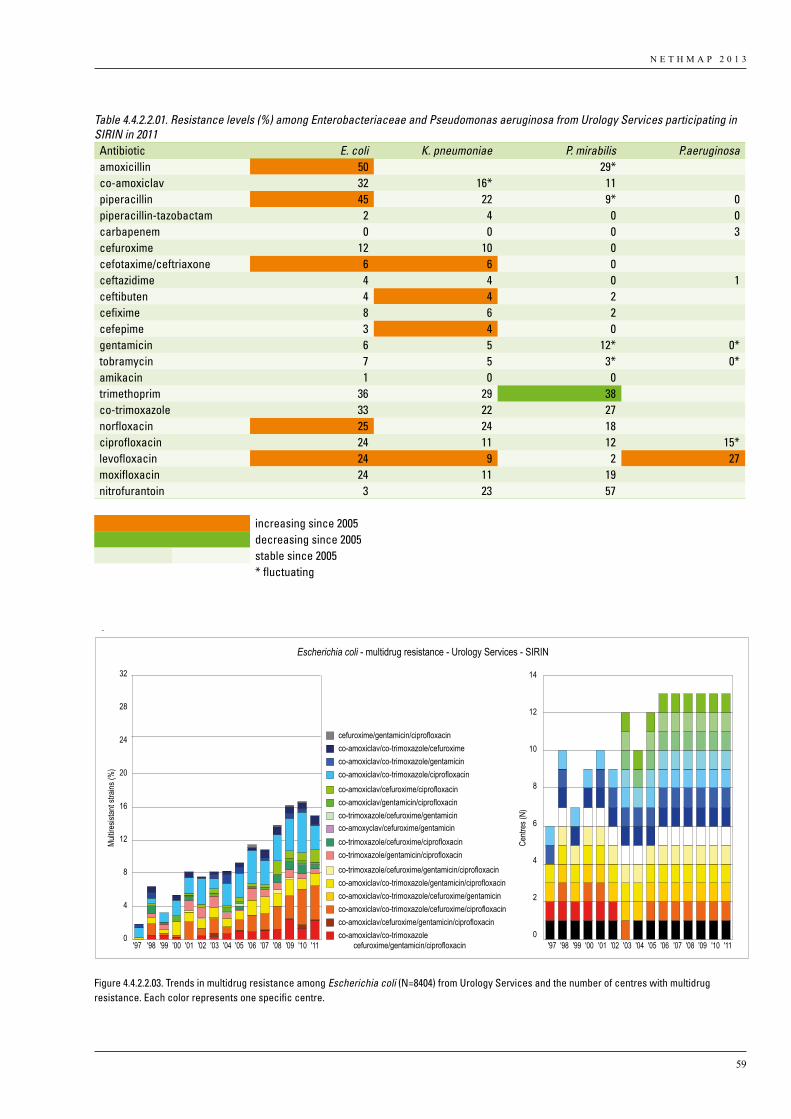
N E T H M A P 2 0 1 3
59
Table 4.4.2.2.01. Resistance levels (%) among Enterobacteriaceae and Pseudomonas aeruginosa from Urology Services participating in SIRIN in 2011
Antibiotic E. coli K. pneumoniae P. mirabilis P.aeruginosaamoxicillin 50 29*co-amoxiclav 32 16* 11piperacillin 45 22 9* 0piperacillin-tazobactam 2 4 0 0carbapenem 0 0 0 3cefuroxime 12 10 0cefotaxime/ceftriaxone 6 6 0ceftazidime 4 4 0 1ceftibuten 4 4 2cefixime 8 6 2cefepime 3 4 0gentamicin 6 5 12* 0* tobramycin 7 5 3* 0* amikacin 1 0 0trimethoprim 36 29 38co-trimoxazole 33 22 27norfloxacin 25 24 18ciprofloxacin 24 11 12 15* levofloxacin 24 9 2 27moxifloxacin 24 11 19nitrofurantoin 3 23 57
increasing since 2005decreasing since 2005stable since 2005* fluctuating
Escherichia coli - multidrug resistance - Urology Services - SIRIN
Multir
esist
ant s
trains
(%)
0
4
8
12
16
20
24
28
32
cefuroxime/gentamicin/ciprofloxacinco-amoxiclav/co-trimoxazole/cefuroximeco-amoxiclav/co-trimoxazole/gentamicinco-amoxiclav/co-trimoxazole/ciprofloxacinco-amoxiclav/cefuroxime/ciprofloxacinco-amoxiclav/gentamicin/ciprofloxacinco-trimoxazole/cefuroxime/gentamicin
co-trimoxazole/cefuroxime/ciprofloxacinco-trimoxazole/gentamicin/ciprofloxacinco-trimoxazole/cefuroxime/gentamicin/ciprofloxacinco-amoxiclav/co-trimoxazole/gentamicin/ciprofloxacinco-amoxiclav/co-trimoxazole/cefuroxime/gentamicinco-amoxiclav/co-trimoxazole/cefuroxime/ciprofloxacinco-amoxiclav/cefuroxime/gentamicin/ciprofloxacinco-amoxiclav/co-trimoxazole
cefuroxime/gentamicin/ciprofloxacin
Centr
es (N
)
0
2
4
6
8
10
12
14
'98'97 '99 '00 '01 '02 '03 '04 '05 '06 '07 '08 '09 '10 '11
co-amoxyclav/cefuroxime/gentamicin
Figure 4.4.2.2.03
'97 '98 '99 '00 '01 '02 '03 '04 '05 '06 '07 '08 '09 '10 '11
Figure 4.4.2.2.03. Trends in multidrug resistance among Escherichia coli (N=8404) from Urology Services and the number of centres with multidrug resistance. Each color represents one specific centre.
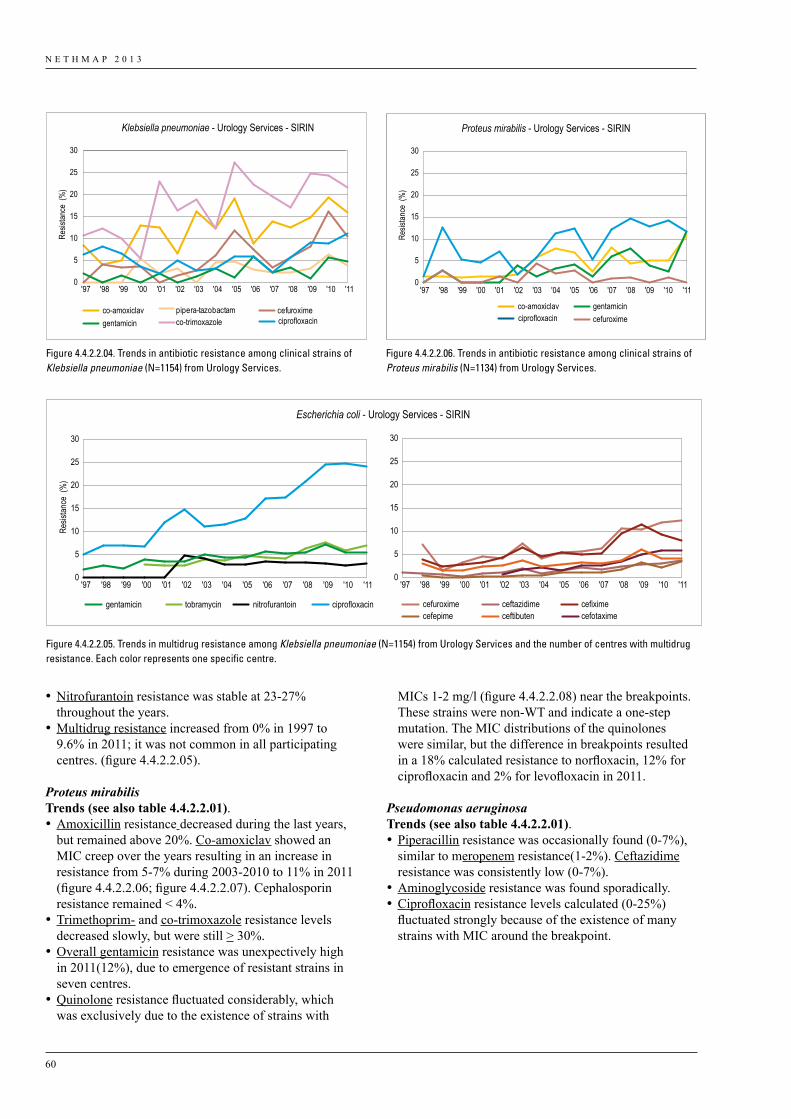
N E T H M A P 2 0 1 3
60
•Nitrofurantoin resistance was stable at 23-27% throughout the years.
•Multidrug resistance increased from 0% in 1997 to 9.6% in 2011; it was not common in all participating centres. (figure 4.4.2.2.05).
Proteus mirabilisTrends (see also table 4.4.2.2.01). •Amoxicillin resistance decreased during the last years,
but remained above 20%. Co-amoxiclav showed an MIC creep over the years resulting in an increase in resistance from 5-7% during 2003-2010 to 11% in 2011 (figure 4.4.2.2.06; figure 4.4.2.2.07). Cephalosporin resistance remained < 4%.
•Trimethoprim- and co-trimoxazole resistance levels decreased slowly, but were still > 30%.
•Overall gentamicin resistance was unexpectively high in 2011(12%), due to emergence of resistant strains in seven centres.
•Quinolone resistance fluctuated considerably, which was exclusively due to the existence of strains with
Klebsiella pneumoniae - Urology Services - SIRIN
Resis
tance
(%
)
co-amoxiclavgentamicin ciprofloxacinco-trimoxazole
0
5
10
15
20
25
30
'11'10'09'08'07'06'05'04'03'02'01'00'99'98'97
pipera-tazobactam cefuroxime
Figure 4.4.2.2.04
Proteus mirabilis - Urology Services - SIRIN
Resis
tance
(%
)
co-amoxiclav gentamicincefuroximeciprofloxacin
0
5
10
15
20
25
30
'11'10'09'08'07'06'05'04'03'02'01'00'99'98'97
Figure 4.4.2.2.06
Figure 4.4.2.2.04. Trends in antibiotic resistance among clinical strains of Klebsiella pneumoniae (N=1154) from Urology Services.
Figure 4.4.2.2.06. Trends in antibiotic resistance among clinical strains of Proteus mirabilis (N=1134) from Urology Services.
Escherichia coli - Urology Services - SIRIN
Resis
tance
(%
)
gentamicin nitrofurantoin ciprofloxacintobramycin cefuroxime ceftazidime cefiximecefepime ceftibuten cefotaxime
0
5
10
15
20
25
30
'11'10'09'08'07'06'05'04'03'02'01'00'99'98'97
0
5
10
15
20
25
30
'11'10'09'08'07'06'05'04'03'02'01'00'99'98'97
Figure 4.4.2.2.01
Figure 4.4.2.2.05. Trends in multidrug resistance among Klebsiella pneumoniae (N=1154) from Urology Services and the number of centres with multidrug resistance. Each color represents one specific centre.
MICs 1-2 mg/l (figure 4.4.2.2.08) near the breakpoints. These strains were non-WT and indicate a one-step mutation. The MIC distributions of the quinolones were similar, but the difference in breakpoints resulted in a 18% calculated resistance to norfloxacin, 12% for ciprofloxacin and 2% for levofloxacin in 2011.
Pseudomonas aeruginosaTrends (see also table 4.4.2.2.01). •Piperacillin resistance was occasionally found (0-7%),
similar to meropenem resistance(1-2%). Ceftazidime resistance was consistently low (0-7%).
•Aminoglycoside resistance was found sporadically. •Ciprofloxacin resistance levels calculated (0-25%)
fluctuated strongly because of the existence of many strains with MIC around the breakpoint.
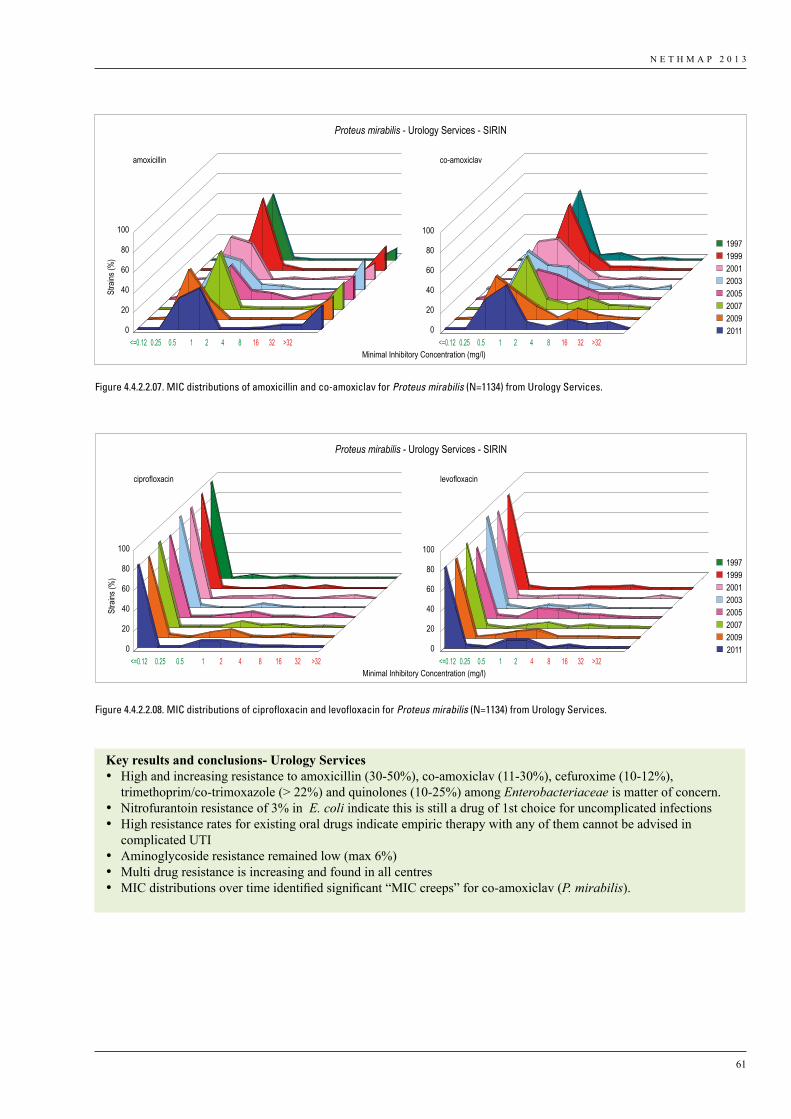
N E T H M A P 2 0 1 3
61
Key results and conclusions- Urology Services • High and increasing resistance to amoxicillin (30-50%), co-amoxiclav (11-30%), cefuroxime (10-12%),
trimethoprim/co-trimoxazole (> 22%) and quinolones (10-25%) among Enterobacteriaceae is matter of concern.• Nitrofurantoin resistance of 3% in E. coli indicate this is still a drug of 1st choice for uncomplicated infections• High resistance rates for existing oral drugs indicate empiric therapy with any of them cannot be advised in
complicated UTI• Aminoglycoside resistance remained low (max 6%)• Multi drug resistance is increasing and found in all centres• MIC distributions over time identified significant “MIC creeps” for co-amoxiclav (P. mirabilis).
0
20
40
60
80
100
0
20
40
60
80
100
amoxicillin co-amoxiclav
Minimal Inhibitory Concentration (mg/l)
Stra
ins (%
)
Proteus mirabilis - Urology Services - SIRIN
<=0.12 0.25 0.5 1 2 4 8 16 32 >32 <=0.12 0.25 0.5 1 2 4 8 16 32 >32
1997 1999 2001 2003 2005 2007 2009 2011
Figure 4.4.2.2.07
0
20
40
60
80
100
0
20
40
60
80
100
ciprofloxacin levofloxacin
Minimal Inhibitory Concentration (mg/l)
Stra
ins (%
)
Proteus mirabilis - Urology Services - SIRIN
<=0.12 0.25 0.5 1 2 4 8 16 32 >32 <=0.12 0.25 0.5 1 2 4 8 16 32 >32
1997 1999 2001 2003 2005 2007 2009 2011
Figure 4.4.2.2.08
Figure 4.4.2.2.07. MIC distributions of amoxicillin and co-amoxiclav for Proteus mirabilis (N=1134) from Urology Services.
Figure 4.4.2.2.08. MIC distributions of ciprofloxacin and levofloxacin for Proteus mirabilis (N=1134) from Urology Services.
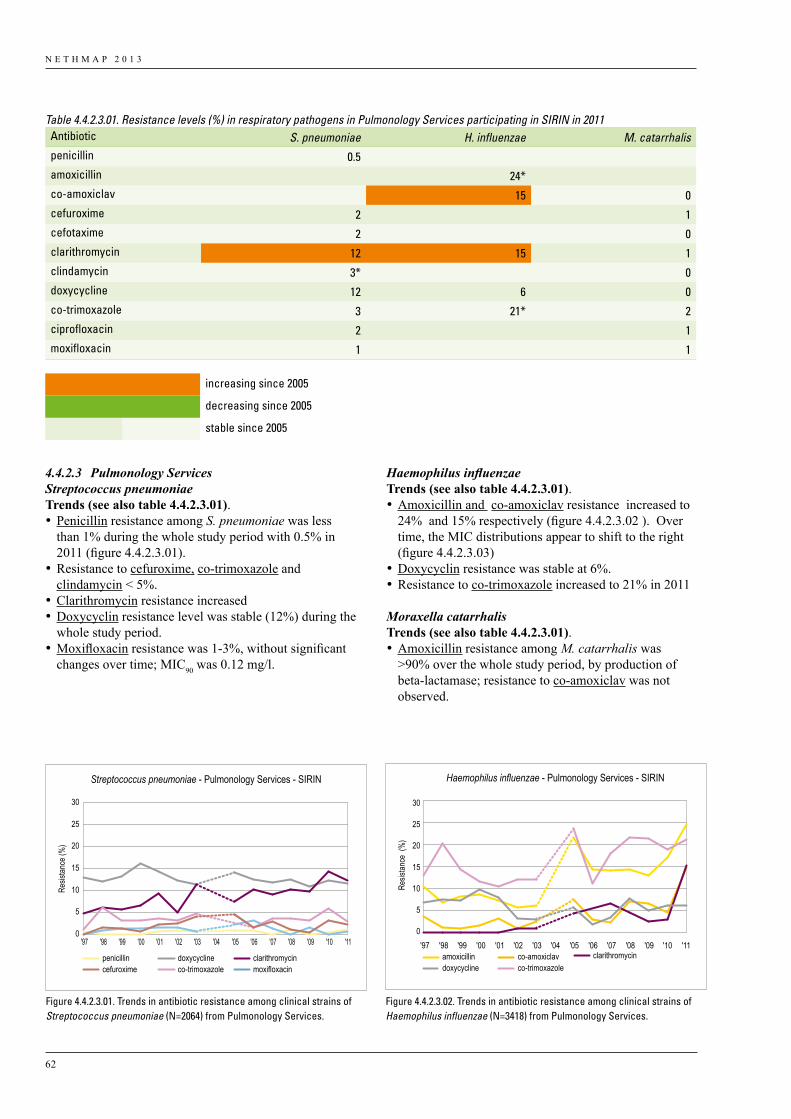
N E T H M A P 2 0 1 3
62
4.4.2.3 Pulmonology ServicesStreptococcus pneumoniaeTrends (see also table 4.4.2.3.01). •Penicillin resistance among S. pneumoniae was less
than 1% during the whole study period with 0.5% in 2011 (figure 4.4.2.3.01).
•Resistance to cefuroxime, co-trimoxazole and clindamycin < 5%.
•Clarithromycin resistance increased•Doxycyclin resistance level was stable (12%) during the
whole study period.•Moxifloxacin resistance was 1-3%, without significant
changes over time; MIC90 was 0.12 mg/l.
Table 4.4.2.3.01. Resistance levels (%) in respiratory pathogens in Pulmonology Services participating in SIRIN in 2011Antibiotic S. pneumoniae H. influenzae M. catarrhalispenicillin 0.5amoxicillin 24*co-amoxiclav 15 0cefuroxime 2 1cefotaxime 2 0clarithromycin 12 15 1clindamycin 3* 0doxycycline 12 6 0co-trimoxazole 3 21* 2ciprofloxacin 2 1moxifloxacin 1 1
increasing since 2005
decreasing since 2005
stable since 2005
Haemophilus influenzaeTrends (see also table 4.4.2.3.01). •Amoxicillin and co-amoxiclav resistance increased to
24% and 15% respectively (figure 4.4.2.3.02 ). Over time, the MIC distributions appear to shift to the right (figure 4.4.2.3.03)
•Doxycyclin resistance was stable at 6%. •Resistance to co-trimoxazole increased to 21% in 2011
Moraxella catarrhalisTrends (see also table 4.4.2.3.01). •Amoxicillin resistance among M. catarrhalis was
>90% over the whole study period, by production of beta-lactamase; resistance to co-amoxiclav was not observed.
penicillin doxycycline clarithromycincefuroxime co-trimoxazole moxifloxacin
Streptococcus pneumoniae - Pulmonology Services - SIRIN
Resis
tance
(%)
0
5
10
15
20
25
30
'11'10'09'08'07'06'05'04'03'02'01'00'99'98'97
Figure 4.4.2.3.01
amoxicillin co-amoxiclavdoxycycline co-trimoxazole
clarithromycin
Haemophilus influenzae - Pulmonology Services - SIRIN
Resis
tance
(%
)
0
5
10
15
20
25
30
'11'10'09'08'07'06'05'04'03'02'01'00'99'98'97
Figure 4.4.2.3.02
Figure 4.4.2.3.01. Trends in antibiotic resistance among clinical strains of Streptococcus pneumoniae (N=2064) from Pulmonology Services.
Figure 4.4.2.3.02. Trends in antibiotic resistance among clinical strains of Haemophilus influenzae (N=3418) from Pulmonology Services.
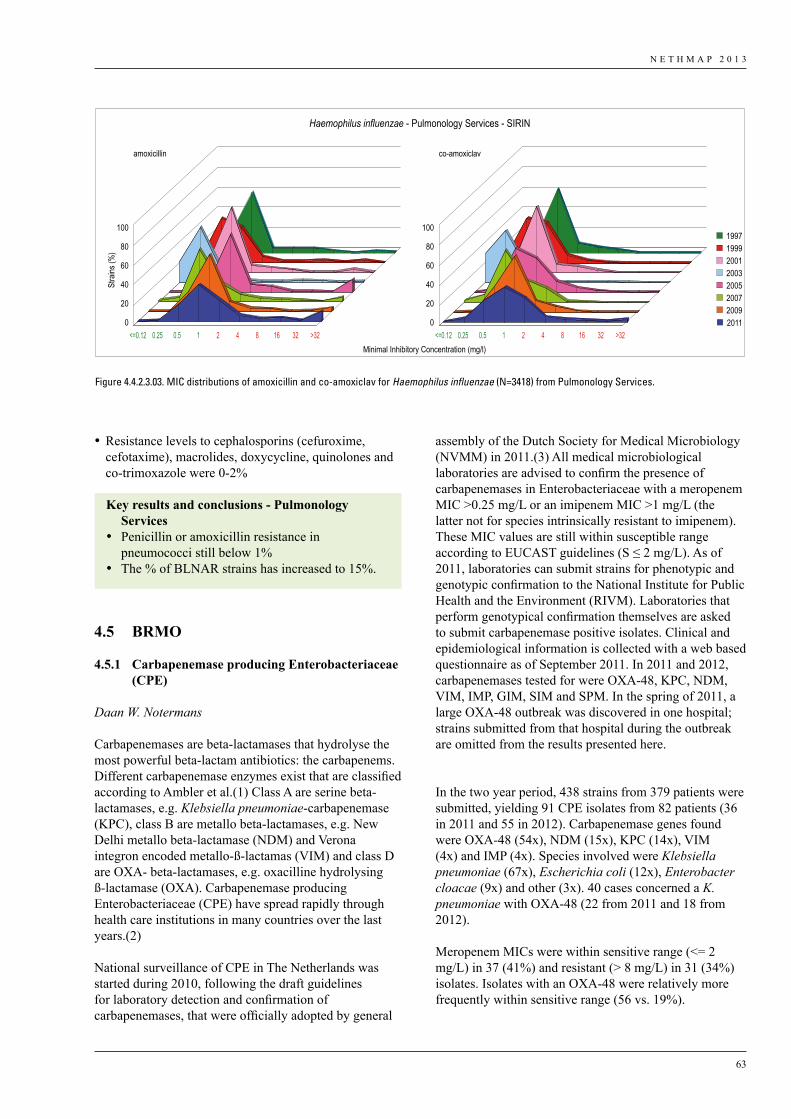
N E T H M A P 2 0 1 3
63
assembly of the Dutch Society for Medical Microbiology (NVMM) in 2011.(3) All medical microbiological laboratories are advised to confirm the presence of carbapenemases in Enterobacteriaceae with a meropenem MIC >0.25 mg/L or an imipenem MIC >1 mg/L (the latter not for species intrinsically resistant to imipenem). These MIC values are still within susceptible range according to EUCAST guidelines (S ≤ 2 mg/L). As of 2011, laboratories can submit strains for phenotypic and genotypic confirmation to the National Institute for Public Health and the Environment (RIVM). Laboratories that perform genotypical confirmation themselves are asked to submit carbapenemase positive isolates. Clinical and epidemiological information is collected with a web based questionnaire as of September 2011. In 2011 and 2012, carbapenemases tested for were OXA-48, KPC, NDM, VIM, IMP, GIM, SIM and SPM. In the spring of 2011, a large OXA-48 outbreak was discovered in one hospital; strains submitted from that hospital during the outbreak are omitted from the results presented here.
In the two year period, 438 strains from 379 patients were submitted, yielding 91 CPE isolates from 82 patients (36 in 2011 and 55 in 2012). Carbapenemase genes found were OXA-48 (54x), NDM (15x), KPC (14x), VIM (4x) and IMP (4x). Species involved were Klebsiella pneumoniae (67x), Escherichia coli (12x), Enterobacter cloacae (9x) and other (3x). 40 cases concerned a K. pneumoniae with OXA-48 (22 from 2011 and 18 from 2012).
Meropenem MICs were within sensitive range (<= 2 mg/L) in 37 (41%) and resistant (> 8 mg/L) in 31 (34%) isolates. Isolates with an OXA-48 were relatively more frequently within sensitive range (56 vs. 19%).
•Resistance levels to cephalosporins (cefuroxime, cefotaxime), macrolides, doxycycline, quinolones and co-trimoxazole were 0-2%
4.5 BRMO
4.5.1 Carbapenemase producing Enterobacteriaceae (CPE)
Daan W. Notermans
Carbapenemases are beta-lactamases that hydrolyse the most powerful beta-lactam antibiotics: the carbapenems. Different carbapenemase enzymes exist that are classified according to Ambler et al.(1) Class A are serine beta-lactamases, e.g. Klebsiella pneumoniae-carbapenemase (KPC), class B are metallo beta-lactamases, e.g. New Delhi metallo beta-lactamase (NDM) and Verona integron encoded metallo-ß-lactamas (VIM) and class D are OXA- beta-lactamases, e.g. oxacilline hydrolysing ß-lactamase (OXA). Carbapenemase producing Enterobacteriaceae (CPE) have spread rapidly through health care institutions in many countries over the last years.(2)
National surveillance of CPE in The Netherlands was started during 2010, following the draft guidelines for laboratory detection and confirmation of carbapenemases, that were officially adopted by general
Key results and conclusions - Pulmonology Services
• Penicillin or amoxicillin resistance in pneumococci still below 1%
• The % of BLNAR strains has increased to 15%.
0
20
40
60
80
100
0
20
40
60
80
100
amoxicillin
<=0.12 0.25 0.5 1 2 4 8 16 32 >32<=0.12 0.25 0.5 1 2 4 8 16 32 >32
co-amoxiclav
Minimal Inhibitory Concentration (mg/l)
Stra
ins (%
)Haemophilus influenzae - Pulmonology Services - SIRIN
1997 1999 2001 2003 2005 2007 2009 2011
Figure 4.4.2.3.03
Figure 4.4.2.3.03. MIC distributions of amoxicillin and co-amoxiclav for Haemophilus influenzae (N=3418) from Pulmonology Services.
N E T H M A P 2 0 1 3
64
Of 55 patients for whom epidemiological information was provided, 43 had been abroad, 24 of whom to North Africa or the Middle East. For 28 a hospitalisation abroad less than 6 months ago was reported. For 5 patients, all from 2011, a connection to the Dutch outbreak hospital was reported.
In conclusion, apart from the large OXA-48 outbreak in 2011, no other large CPE outbreaks were detected during the surveillance and only a limited number of CPE were seen in The Netherlands. The surveillance is on voluntary base and does not have complete national coverage yet. The number of strains submitted and the number of CPE isolates found increased from 2011 to 2012, which may reflect improved participation during the second year of the surveillance.
K. pneumoniae was the predominant species (73%) and OXA-48 the most frequently encountered (59%) carbapenemase, decreasing in 2012 compared to 2011.
As far as known, the majority of cases could either be related to admissions in a foreign hospital or to the Dutch outbreak hospital, but not all cases could be explained this way.
References1. Ambler RP, Coulson AF, Frère JM, et al. A standard
numbering scheme for the class A beta-lactamases. Biochem J. 1991;276:269-70.
2. Nordmann P, Naas T, Poirel L. Global spread of Carbapenemase-producing Enterobacteriaceae. Emerg Infect Dis. 2011;17:1791-8.
3. Bernards AT, Bonten MJM, Cohen Stuart J et al. 5.2 ‘Carbapenemases’ of Chapter 5 ‘Enterobacteriaceae’ in ‘Laboratory detection of highly resistant microorganisms (HRMO)’. Guideline. Version 2.0 November 15th, 2012. www.nvmm.nl/richtlijnen/hrmo-laboratory-detection-highly-resistant-microorganisms
4.5.2 Vancomycin Resistant Enterococci in Dutch hospitals
Rob J. L. Willems, Janetta Top, Jan Sinnige, Miquel Ekkelenkamp, Marc J. M. BontenDepartment of Medical Microbiology, University Medical Center Utrecht
corresponding author: [email protected]
Starting in 2011, a growing number of Dutch hospitals have been confronted with outbreaks of vancomycin-resistant Enterococcus faecium (VRE).
The first high-level vancomycin-resistant enterococci were isolated in Europe in 1986 (1). In the United States,
the percentage of E. faecium isolates that were resistant to vancomycin rose from 0 % before the mid 1980s to more than 80 % by 2007, while only 5% of E. faecalis were vancomycin resistant (2). This indicates that vancomycin-resistance is basically only a feature of E. faecium and therefore VRE in this section only refer to vancomycin-resistant E. faecium. In Europe, an important community reservoir of VRE existed in the 1980s and 1990s which has been associated with the massive use of avoparcin in animal husbandry. Avoparcin is a glycopeptide antibiotic, like vancomycin, and was used in several European countries (since the 1970s) as a growth promoter in the agricultural industry (1). The Europe-wide ban on the use of avoparcin in April 1997 resulted in a substantial reduction in the prevalence of VRE colonization in farm animals and non-hospitalized persons (1). In total nine types of vancomycin resistance have been characterized on both a phenotypic and a genotypic basis in enterococci, of which vanA and vanB are the most prevalent (3). All these types of vancomycin resistance can be acquired horizontally.
In-depth analysis of the evolutionary relatedness of E. faecium genotypes on a population level using multilocus sequence typing (MLST) data revealed that the majority of globally representative hospital isolates, including those that prevail in hospitals in the USA, were genotypically and evolutionary closely related. These clones belonged to a distinct E. faecium subpopulation, here referred to as hospital-associated (HA-) E. faecium. The HA-E.faecium subpopulation, previously designated clonal complex (CC) 17, is characterized by, among others, ampicillin resistance. Commensal E. faecium strains in the healthy human gut are usually ampicillin susceptible and do not belong to this subpopulation(4).
Around the turn of century, hospitals in the Netherlands experienced their first vanA-VRE outbreaks with VRE-clones that all belonged to the HA-E. faecium subpopulation (5–7). This first episode of VRE outbreaks in Dutch hospitals was followed by a period of 10 years in which there were cases of hospital-acquired infections by VRE, but no large hospital outbreaks. During this period, however, colonization rates with ampicillin-resistant, vancomycin-susceptible E. faecium belonging to the HA-E. faecium subpopulation substantially increased, as did nosocomial infections with these clones (8), indicating both enhanced capabilities of cross-transmission and pathogenicity. As it now appears, the penetration of ampicillin-resistant, vancomycin susceptible HA-E. faecium in Dutch hospitals forecasted the epidemic rise of VRE in 2011 and 2012 (9).
In 2011 a few Dutch hospitals, mainly in the north of the country were suddenly confronted with an epidemic rise of nosocomial colonization and infections by vanB-VRE, and in early 2012 it became clear that this epidemic rise
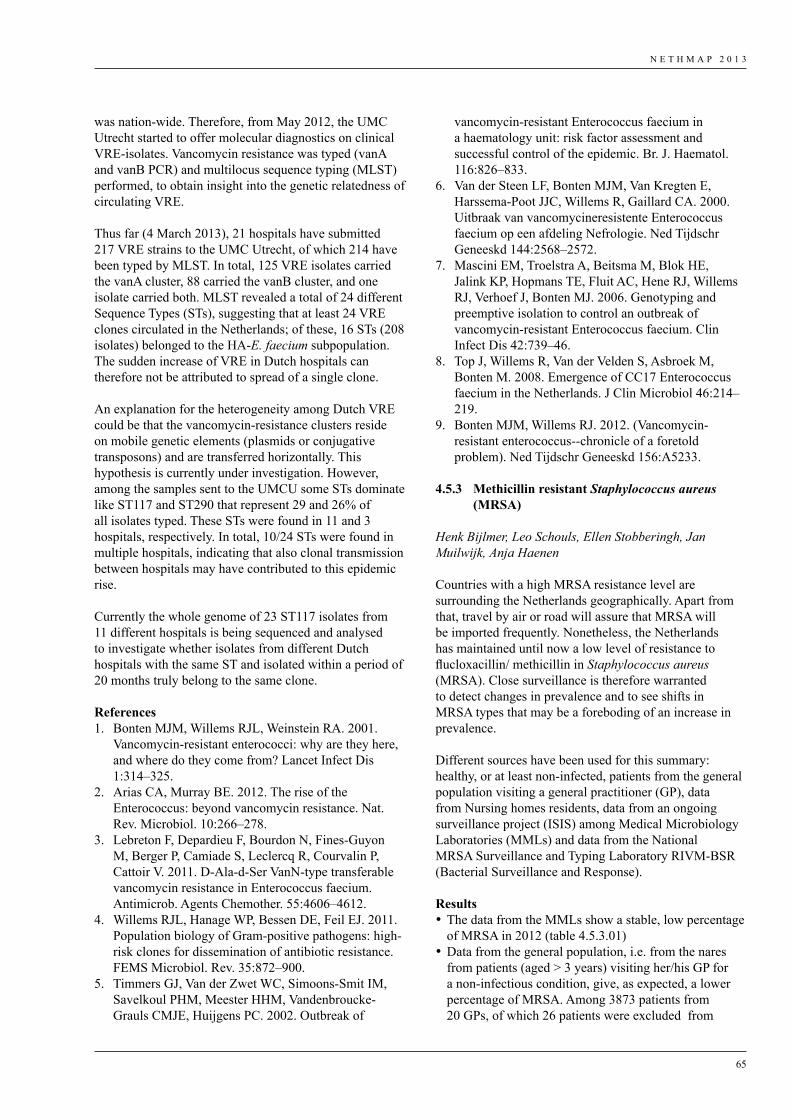
N E T H M A P 2 0 1 3
65
was nation-wide. Therefore, from May 2012, the UMC Utrecht started to offer molecular diagnostics on clinical VRE-isolates. Vancomycin resistance was typed (vanA and vanB PCR) and multilocus sequence typing (MLST) performed, to obtain insight into the genetic relatedness of circulating VRE.
Thus far (4 March 2013), 21 hospitals have submitted 217 VRE strains to the UMC Utrecht, of which 214 have been typed by MLST. In total, 125 VRE isolates carried the vanA cluster, 88 carried the vanB cluster, and one isolate carried both. MLST revealed a total of 24 different Sequence Types (STs), suggesting that at least 24 VRE clones circulated in the Netherlands; of these, 16 STs (208 isolates) belonged to the HA-E. faecium subpopulation. The sudden increase of VRE in Dutch hospitals can therefore not be attributed to spread of a single clone.
An explanation for the heterogeneity among Dutch VRE could be that the vancomycin-resistance clusters reside on mobile genetic elements (plasmids or conjugative transposons) and are transferred horizontally. This hypothesis is currently under investigation. However, among the samples sent to the UMCU some STs dominate like ST117 and ST290 that represent 29 and 26% of all isolates typed. These STs were found in 11 and 3 hospitals, respectively. In total, 10/24 STs were found in multiple hospitals, indicating that also clonal transmission between hospitals may have contributed to this epidemic rise.
Currently the whole genome of 23 ST117 isolates from 11 different hospitals is being sequenced and analysed to investigate whether isolates from different Dutch hospitals with the same ST and isolated within a period of 20 months truly belong to the same clone.
References1. Bonten MJM, Willems RJL, Weinstein RA. 2001.
Vancomycin-resistant enterococci: why are they here, and where do they come from? Lancet Infect Dis 1:314–325.
2. Arias CA, Murray BE. 2012. The rise of the Enterococcus: beyond vancomycin resistance. Nat. Rev. Microbiol. 10:266–278.
3. Lebreton F, Depardieu F, Bourdon N, Fines-Guyon M, Berger P, Camiade S, Leclercq R, Courvalin P, Cattoir V. 2011. D-Ala-d-Ser VanN-type transferable vancomycin resistance in Enterococcus faecium. Antimicrob. Agents Chemother. 55:4606–4612.
4. Willems RJL, Hanage WP, Bessen DE, Feil EJ. 2011. Population biology of Gram-positive pathogens: high-risk clones for dissemination of antibiotic resistance. FEMS Microbiol. Rev. 35:872–900.
5. Timmers GJ, Van der Zwet WC, Simoons-Smit IM, Savelkoul PHM, Meester HHM, Vandenbroucke-Grauls CMJE, Huijgens PC. 2002. Outbreak of
vancomycin-resistant Enterococcus faecium in a haematology unit: risk factor assessment and successful control of the epidemic. Br. J. Haematol. 116:826–833.
6. Van der Steen LF, Bonten MJM, Van Kregten E, Harssema-Poot JJC, Willems R, Gaillard CA. 2000. Uitbraak van vancomycineresistente Enterococcus faecium op een afdeling Nefrologie. Ned Tijdschr Geneeskd 144:2568–2572.
7. Mascini EM, Troelstra A, Beitsma M, Blok HE, Jalink KP, Hopmans TE, Fluit AC, Hene RJ, Willems RJ, Verhoef J, Bonten MJ. 2006. Genotyping and preemptive isolation to control an outbreak of vancomycin-resistant Enterococcus faecium. Clin Infect Dis 42:739–46.
8. Top J, Willems R, Van der Velden S, Asbroek M, Bonten M. 2008. Emergence of CC17 Enterococcus faecium in the Netherlands. J Clin Microbiol 46:214–219.
9. Bonten MJM, Willems RJ. 2012. (Vancomycin-resistant enterococcus--chronicle of a foretold problem). Ned Tijdschr Geneeskd 156:A5233.
4.5.3 Methicillin resistant Staphylococcus aureus (MRSA)
Henk Bijlmer, Leo Schouls, Ellen Stobberingh, Jan Muilwijk, Anja Haenen
Countries with a high MRSA resistance level are surrounding the Netherlands geographically. Apart from that, travel by air or road will assure that MRSA will be imported frequently. Nonetheless, the Netherlands has maintained until now a low level of resistance to flucloxacillin/ methicillin in Staphylococcus aureus (MRSA). Close surveillance is therefore warranted to detect changes in prevalence and to see shifts in MRSA types that may be a foreboding of an increase in prevalence.
Different sources have been used for this summary: healthy, or at least non-infected, patients from the general population visiting a general practitioner (GP), data from Nursing homes residents, data from an ongoing surveillance project (ISIS) among Medical Microbiology Laboratories (MMLs) and data from the National MRSA Surveillance and Typing Laboratory RIVM-BSR (Bacterial Surveillance and Response).
Results•The data from the MMLs show a stable, low percentage
of MRSA in 2012 (table 4.5.3.01)•Data from the general population, i.e. from the nares
from patients (aged > 3 years) visiting her/his GP for a non-infectious condition, give, as expected, a lower percentage of MRSA. Among 3873 patients from 20 GPs, of which 26 patients were excluded from
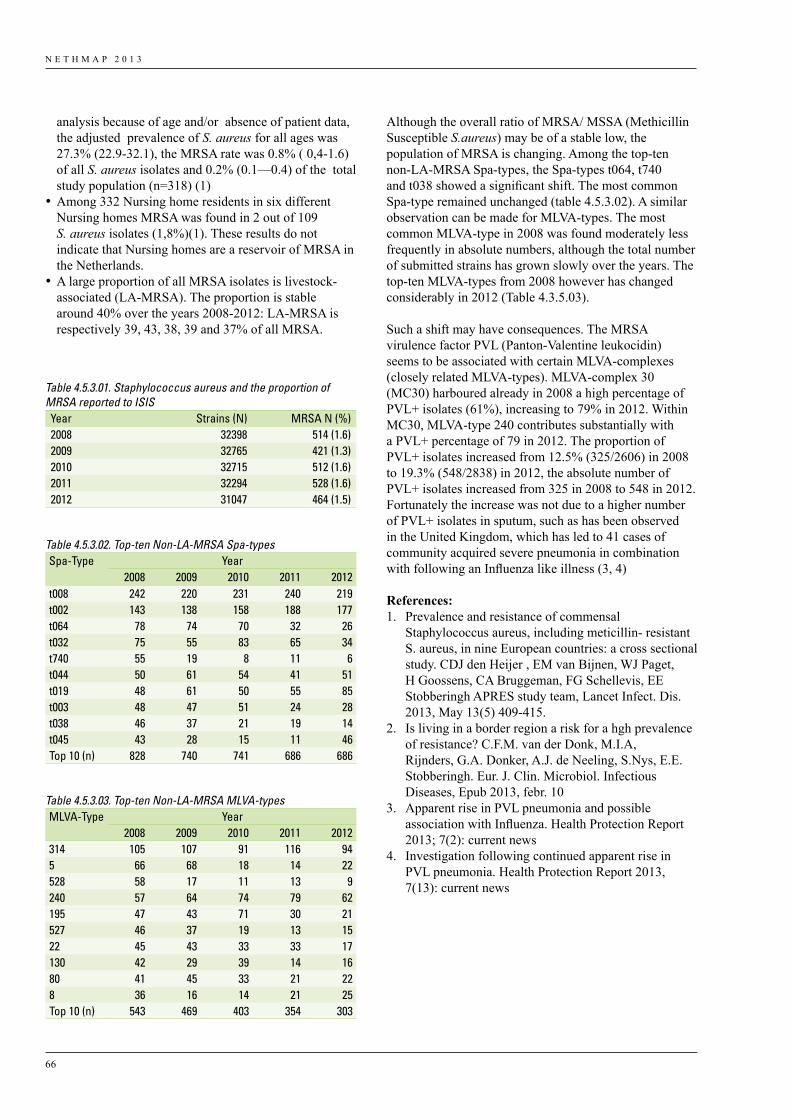
N E T H M A P 2 0 1 3
66
analysis because of age and/or absence of patient data, the adjusted prevalence of S. aureus for all ages was 27.3% (22.9-32.1), the MRSA rate was 0.8% ( 0,4-1.6) of all S. aureus isolates and 0.2% (0.1—0.4) of the total study population (n=318) (1)
•Among 332 Nursing home residents in six different Nursing homes MRSA was found in 2 out of 109 S. aureus isolates (1,8%)(1). These results do not indicate that Nursing homes are a reservoir of MRSA in the Netherlands.
•A large proportion of all MRSA isolates is livestock-associated (LA-MRSA). The proportion is stable around 40% over the years 2008-2012: LA-MRSA is respectively 39, 43, 38, 39 and 37% of all MRSA.
Although the overall ratio of MRSA/ MSSA (Methicillin Susceptible S.aureus) may be of a stable low, the population of MRSA is changing. Among the top-ten non-LA-MRSA Spa-types, the Spa-types t064, t740 and t038 showed a significant shift. The most common Spa-type remained unchanged (table 4.5.3.02). A similar observation can be made for MLVA-types. The most common MLVA-type in 2008 was found moderately less frequently in absolute numbers, although the total number of submitted strains has grown slowly over the years. The top-ten MLVA-types from 2008 however has changed considerably in 2012 (Table 4.3.5.03).
Such a shift may have consequences. The MRSA virulence factor PVL (Panton-Valentine leukocidin) seems to be associated with certain MLVA-complexes (closely related MLVA-types). MLVA-complex 30 (MC30) harboured already in 2008 a high percentage of PVL+ isolates (61%), increasing to 79% in 2012. Within MC30, MLVA-type 240 contributes substantially with a PVL+ percentage of 79 in 2012. The proportion of PVL+ isolates increased from 12.5% (325/2606) in 2008 to 19.3% (548/2838) in 2012, the absolute number of PVL+ isolates increased from 325 in 2008 to 548 in 2012. Fortunately the increase was not due to a higher number of PVL+ isolates in sputum, such as has been observed in the United Kingdom, which has led to 41 cases of community acquired severe pneumonia in combination with following an Influenza like illness (3, 4)
References:1. Prevalence and resistance of commensal
Staphylococcus aureus, including meticillin- resistant S. aureus, in nine European countries: a cross sectional study. CDJ den Heijer , EM van Bijnen, WJ Paget, H Goossens, CA Bruggeman, FG Schellevis, EE Stobberingh APRES study team, Lancet Infect. Dis. 2013, May 13(5) 409-415.
2. Is living in a border region a risk for a hgh prevalence of resistance? C.F.M. van der Donk, M.I.A, Rijnders, G.A. Donker, A.J. de Neeling, S.Nys, E.E. Stobberingh. Eur. J. Clin. Microbiol. Infectious Diseases, Epub 2013, febr. 10
3. Apparent rise in PVL pneumonia and possible association with Influenza. Health Protection Report 2013; 7(2): current news
4. Investigation following continued apparent rise in PVL pneumonia. Health Protection Report 2013, 7(13): current news
Table 4.5.3.01. Staphylococcus aureus and the proportion of MRSA reported to ISISYear Strains (N) MRSA N (%)2008 32398 514 (1.6)2009 32765 421 (1.3)2010 32715 512 (1.6)2011 32294 528 (1.6)2012 31047 464 (1.5)
Table 4.5.3.02. Top-ten Non-LA-MRSA Spa-typesSpa-Type Year
2008 2009 2010 2011 2012t008 242 220 231 240 219t002 143 138 158 188 177t064 78 74 70 32 26t032 75 55 83 65 34t740 55 19 8 11 6t044 50 61 54 41 51t019 48 61 50 55 85t003 48 47 51 24 28t038 46 37 21 19 14t045 43 28 15 11 46Top 10 (n) 828 740 741 686 686
Table 4.5.3.03. Top-ten Non-LA-MRSA MLVA-types MLVA-Type Year
2008 2009 2010 2011 2012314 105 107 91 116 945 66 68 18 14 22528 58 17 11 13 9240 57 64 74 79 62195 47 43 71 30 21527 46 37 19 13 1522 45 43 33 33 17130 42 29 39 14 1680 41 45 33 21 228 36 16 14 21 25Top 10 (n) 543 469 403 354 303
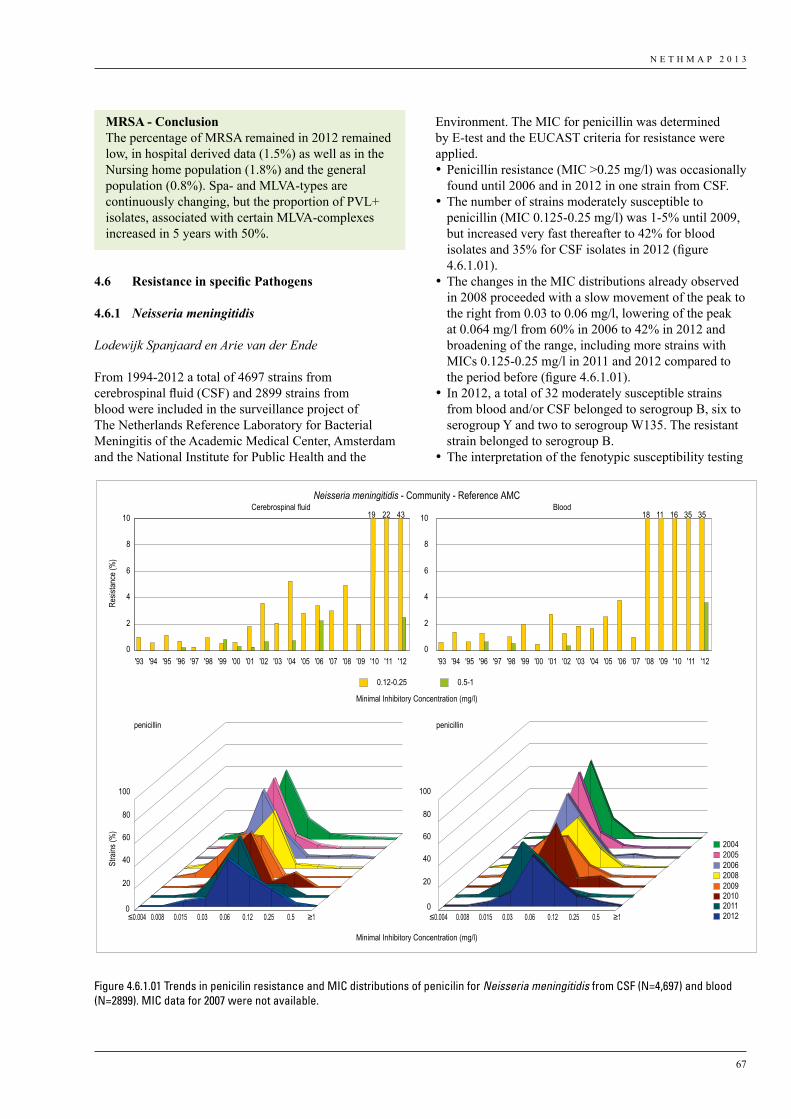
N E T H M A P 2 0 1 3
67
4.6 ResistanceinspecificPathogens
4.6.1 Neisseria meningitidis
Lodewijk Spanjaard en Arie van der Ende
From 1994-2012 a total of 4697 strains from cerebrospinal fluid (CSF) and 2899 strains from blood were included in the surveillance project of The Netherlands Reference Laboratory for Bacterial Meningitis of the Academic Medical Center, Amsterdam and the National Institute for Public Health and the
Environment. The MIC for penicillin was determined by E-test and the EUCAST criteria for resistance were applied.•Penicillin resistance (MIC >0.25 mg/l) was occasionally
found until 2006 and in 2012 in one strain from CSF.•The number of strains moderately susceptible to
penicillin (MIC 0.125-0.25 mg/l) was 1-5% until 2009, but increased very fast thereafter to 42% for blood isolates and 35% for CSF isolates in 2012 (figure 4.6.1.01).
•The changes in the MIC distributions already observed in 2008 proceeded with a slow movement of the peak to the right from 0.03 to 0.06 mg/l, lowering of the peak at 0.064 mg/l from 60% in 2006 to 42% in 2012 and broadening of the range, including more strains with MICs 0.125-0.25 mg/l in 2011 and 2012 compared to the period before (figure 4.6.1.01).
• In 2012, a total of 32 moderately susceptible strains from blood and/or CSF belonged to serogroup B, six to serogroup Y and two to serogroup W135. The resistant strain belonged to serogroup B.
•The interpretation of the fenotypic susceptibility testing
MRSA - ConclusionThe percentage of MRSA remained in 2012 remained low, in hospital derived data (1.5%) as well as in the Nursing home population (1.8%) and the general population (0.8%). Spa- and MLVA-types are continuously changing, but the proportion of PVL+ isolates, associated with certain MLVA-complexes increased in 5 years with 50%.
Neisseria meningitidis - Community - Reference AMC
2005 2006 2008 2009 2010 2011 2012
2004
penicillin penicillin
Cerebrospinal fluid Blood
0
2
4
6
8
10
0
2
4
6
8
10
'93 '94 '95 '96 '97 '98 '99 '00 '01 '02 '03 '04 '05 '06 '07 '08 '09 '10 '11 '12 '93 '94 '95 '96 '97 '98 '99 '00 '01 '02 '03 '04 '05 '06 '07 '08 '09 '10 '11 '12
0.12-0.25 0.5-1
1819 22 43 11 16 35 35
Stra
ins (%
)
Minimal Inhibitory Concentration (mg/l)
Resis
tance
(%)
Minimal Inhibitory Concentration (mg/l)
0
20
40
60
80
100
0
20
40
60
80
100
≤0.004 ≤0.0040.008 0.015 0.03 0.06 0.12 0.25 0.5 ≥1 ≥10.008 0.015 0.03 0.06 0.12 0.25 0.5
Figure 4.6.1.01 Trends in penicilin resistance and MIC distributions of penicilin for Neisseria meningitidis from CSF (N=4,697) and blood (N=2899). MIC data for 2007 were not available.
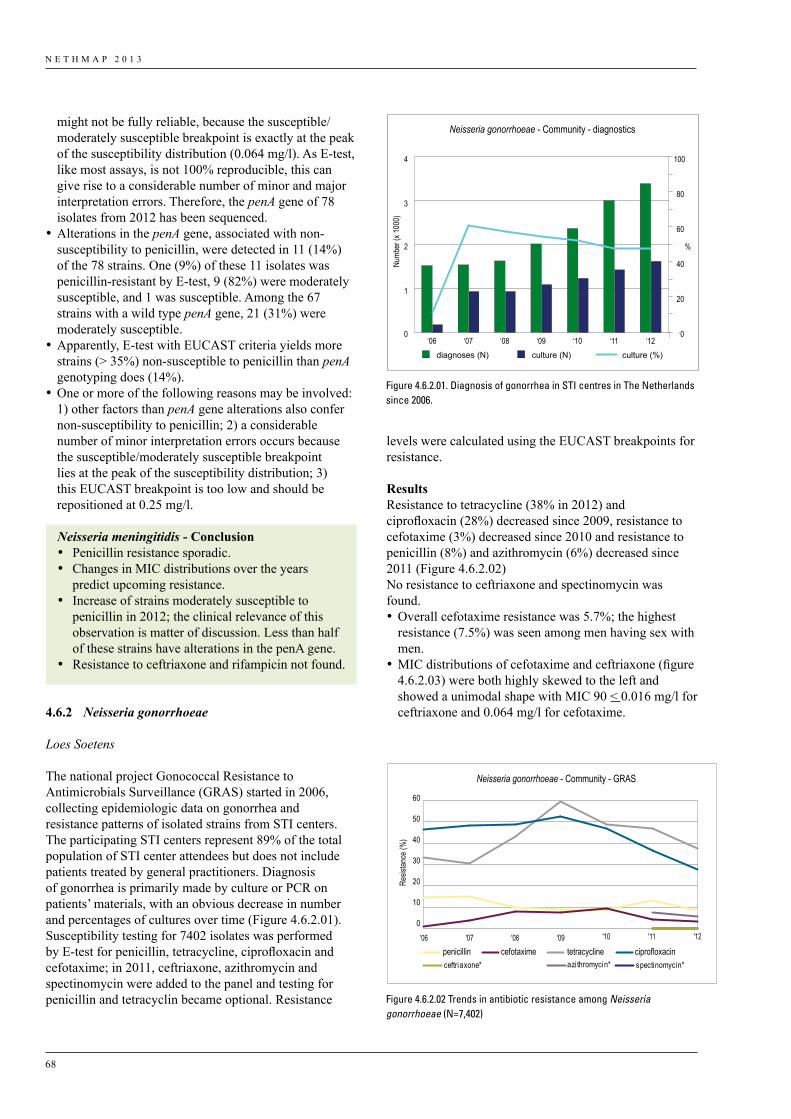
N E T H M A P 2 0 1 3
68
might not be fully reliable, because the susceptible/moderately susceptible breakpoint is exactly at the peak of the susceptibility distribution (0.064 mg/l). As E-test, like most assays, is not 100% reproducible, this can give rise to a considerable number of minor and major interpretation errors. Therefore, the penA gene of 78 isolates from 2012 has been sequenced.
•Alterations in the penA gene, associated with non-susceptibility to penicillin, were detected in 11 (14%) of the 78 strains. One (9%) of these 11 isolates was penicillin-resistant by E-test, 9 (82%) were moderately susceptible, and 1 was susceptible. Among the 67 strains with a wild type penA gene, 21 (31%) were moderately susceptible.
•Apparently, E-test with EUCAST criteria yields more strains (> 35%) non-susceptible to penicillin than penA genotyping does (14%).
•One or more of the following reasons may be involved: 1) other factors than penA gene alterations also confer non-susceptibility to penicillin; 2) a considerable number of minor interpretation errors occurs because the susceptible/moderately susceptible breakpoint lies at the peak of the susceptibility distribution; 3) this EUCAST breakpoint is too low and should be repositioned at 0.25 mg/l.
4.6.2 Neisseria gonorrhoeae
Loes Soetens
The national project Gonococcal Resistance to Antimicrobials Surveillance (GRAS) started in 2006, collecting epidemiologic data on gonorrhea and resistance patterns of isolated strains from STI centers. The participating STI centers represent 89% of the total population of STI center attendees but does not include patients treated by general practitioners. Diagnosis of gonorrhea is primarily made by culture or PCR on patients’ materials, with an obvious decrease in number and percentages of cultures over time (Figure 4.6.2.01). Susceptibility testing for 7402 isolates was performed by E-test for penicillin, tetracycline, ciprofloxacin and cefotaxime; in 2011, ceftriaxone, azithromycin and spectinomycin were added to the panel and testing for penicillin and tetracyclin became optional. Resistance
Neisseria meningitidis - Conclusion• Penicillin resistance sporadic.• Changes in MIC distributions over the years
predict upcoming resistance.• Increase of strains moderately susceptible to
penicillin in 2012; the clinical relevance of this observation is matter of discussion. Less than half of these strains have alterations in the penA gene.
• Resistance to ceftriaxone and rifampicin not found.
levels were calculated using the EUCAST breakpoints for resistance.
ResultsResistance to tetracycline (38% in 2012) and ciprofloxacin (28%) decreased since 2009, resistance to cefotaxime (3%) decreased since 2010 and resistance to penicillin (8%) and azithromycin (6%) decreased since 2011 (Figure 4.6.2.02)No resistance to ceftriaxone and spectinomycin was found.•Overall cefotaxime resistance was 5.7%; the highest
resistance (7.5%) was seen among men having sex with men.
•MIC distributions of cefotaxime and ceftriaxone (figure 4.6.2.03) were both highly skewed to the left and showed a unimodal shape with MIC 90 < 0.016 mg/l for ceftriaxone and 0.064 mg/l for cefotaxime.
Neisseria gonorrhoeae - Community - diagnostics
0
1
2
3
4
0
20
40
60
80
100
diagnoses (N) culture (N) culture (%)
Numb
er (x
1000
)
%
‘06 ‘07 ‘08 ‘09 ‘10 ‘11 ‘12
0
10
20
30
40
50
60
'06 '07 '08 '09 '11 '12'10
penicillin cefotaxime tetracycline ciprofloxacin
Neisseria gonorrhoeae - Community - GRAS
Resis
tance
(%)
azi thromycin* spectinomycin*ceftriaxone*
Figure 4.6.2.01. Diagnosis of gonorrhea in STI centres in The Netherlands since 2006.
Figure 4.6.2.02 Trends in antibiotic resistance among Neisseria gonorrhoeae (N=7,402)
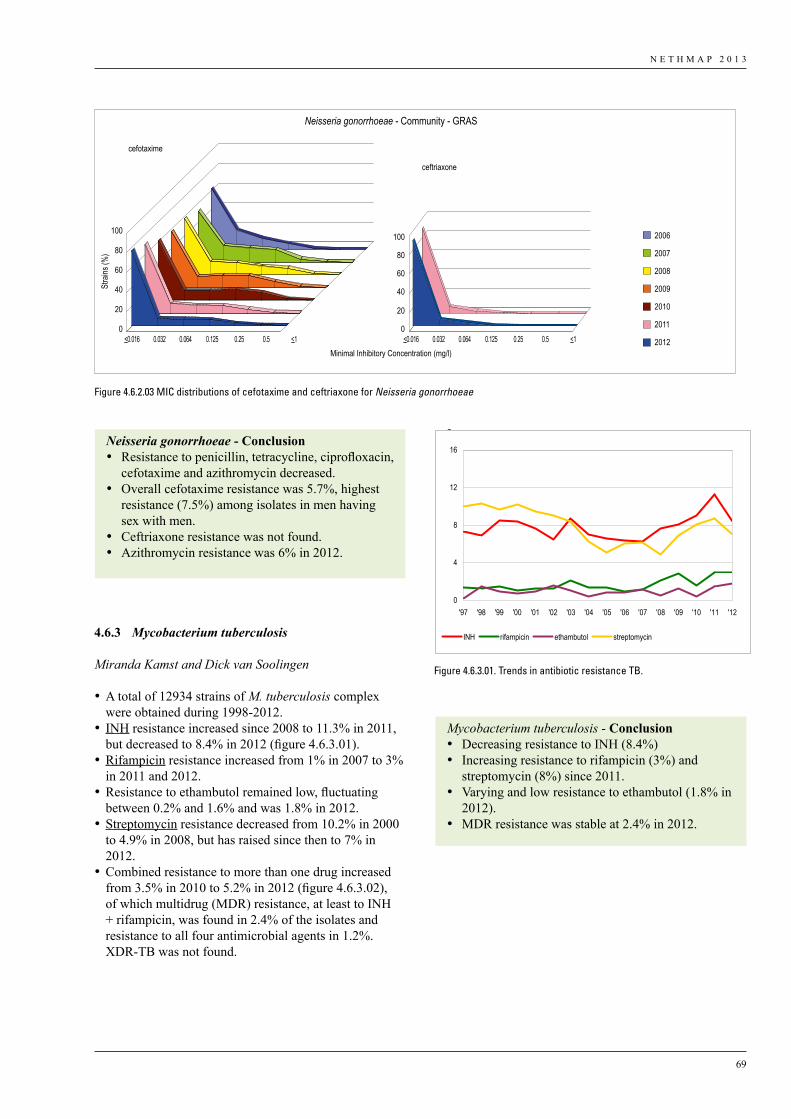
N E T H M A P 2 0 1 3
69
4.6.3 Mycobacterium tuberculosis
Miranda Kamst and Dick van Soolingen
•A total of 12934 strains of M. tuberculosis complex were obtained during 1998-2012.
• INH resistance increased since 2008 to 11.3% in 2011, but decreased to 8.4% in 2012 (figure 4.6.3.01).
•Rifampicin resistance increased from 1% in 2007 to 3% in 2011 and 2012.
•Resistance to ethambutol remained low, fluctuating between 0.2% and 1.6% and was 1.8% in 2012.
•Streptomycin resistance decreased from 10.2% in 2000 to 4.9% in 2008, but has raised since then to 7% in 2012.
•Combined resistance to more than one drug increased from 3.5% in 2010 to 5.2% in 2012 (figure 4.6.3.02), of which multidrug (MDR) resistance, at least to INH + rifampicin, was found in 2.4% of the isolates and resistance to all four antimicrobial agents in 1.2%. XDR-TB was not found.
Neisseria gonorrhoeae - Conclusion• Resistance to penicillin, tetracycline, ciprofloxacin,
cefotaxime and azithromycin decreased.• Overall cefotaxime resistance was 5.7%, highest
resistance (7.5%) among isolates in men having sex with men.
• Ceftriaxone resistance was not found.• Azithromycin resistance was 6% in 2012.
Mycobacterium tuberculosis - Conclusion• Decreasing resistance to INH (8.4%)• Increasing resistance to rifampicin (3%) and
streptomycin (8%) since 2011.• Varying and low resistance to ethambutol (1.8% in
2012). • MDR resistance was stable at 2.4% in 2012.
0
20
40
60
80
100
0
20
40
60
80
100 2006
2007
2008
2009
2010
2011
2012
Neisseria gonorrhoeae - Community - GRAS
Minimal Inhibitory Concentration (mg/l)
Stra
ins (%
)
cefotaxime
ceftriaxone
<0.016 0.032 0.064 0.125 0.25 0.5 <1 <0.016 0.032 0.064 0.125 0.25 0.5 <1
Figure 4.6.2.03 MIC distributions of cefotaxime and ceftriaxone for Neisseria gonorrhoeae
Figuur 1 Trends in antibiotic resistance TB
Figuur 2. Trends in combined resistance TB
0
4
8
12
16
'97 '98 '99 '00 '01 '02 '03 '04 '05 '06 '07 '08 '09 '10 '11 '12
INH rifampicin ethambutol streptomycin
0
2
4
6
8
10
12
14
16
'97 '98 '99 '00 '01 '02 '03 '04 '05 '06 '07 '08 '09 '10 '11 '12
streptomycin
streptomycin + ethambutol
ethambutol
rifampicin + ethambutol
rifampicin + streptomycin
rifampicin
INH + ethambutol
INH + streptomycin + ethambutol
INH + streptomycin
INH + rifampicin + ethambutol
INH + rifampicin + streptomycin +ethambutolINH + rifampicin + streptomycin
INH + rifampicin
INH
Figure 4.6.3.01. Trends in antibiotic resistance TB.

N E T H M A P 2 0 1 3
70
4.6.4 Resistancetoinfluenzaantiviraldrugs
Adam Meijer
Surveillance for resistanceIn the Netherlands the susceptibility of influenza viruses for the M2 ion channel blockers (M2B) amantadine and rimantadine and the neuraminidase enzyme inhibitors (NAI) oseltamivir and zanamivir are being monitored since the 2005/2006 winter season. This monitoring is embedded in the integrated clinical and virological surveillance of influenza using general practitioner (GP) sentinel stations, that is carried out by the NIVEL Netherlands Institute for Health Services Research and the National Institute for Public Health and the Environment (RIVM). In special circumstances, like during the emergence of oseltamivir resistant A(H1N1) virus during the 2007/2008 season and during the 2009 A(H1N1)pdm09 pandemic, this system is extended to include viruses detected in hospital and peripheral laboratories with special attention for viruses detected in patients treated with antivirals who show prolonged shedding of influenza virus. From the 2009/2010 season onwards hospital laboratories voluntarily report antiviral resistant cases to the RIVM. Techniques used in the Netherlands to monitor antiviral resistance in influenza viruses include Sanger sequencing, pyrosequencing or site-specific polymerase chain reaction (PCR) assay for known resistance markers for both the M2Bs and NAIs. For a subset of influenza viruses the susceptibility to NAIs is determined using an enzyme inhibition assay, which generates a 50% inhibitory concentration of the
drug (IC50). In the absence of known NAI resistance amino acid substitutions detected by genotypic assays, determination of the IC50 is the only way to determine the drug susceptibility of a virus.
ResultsTable 4.6.4.01 displays an overview of the antiviral susceptibility of influenza viruses since the 2005/2006 influenza season. New findings since the 2011/2012 season not reported in the 2012 NethMap report are highlighted here. In early August 2012, two travellers who returned from holiday in Catalonia (Spain) were found infected with identical oseltamivir highly reduced susceptible A(H1N1)pdm09 virus carrying the H275Y amino acid substitution in the neuraminidase. They were highly likely infected during their holiday in Catalonia. No epidemiological connection between the two cases was found, and neither of them was treated with oseltamivir. Genetic analysis of the neuraminidase gene revealed the presence of previously described ‘permissive’ amino acid substitution (V241I, N369K and N386S) that may increase the likelihood of such strains emerging and spreading widely. In January 2013 two hospitalised case of oseltamivir highly reduced susceptible A(H1N1)pdm09 virus carrying the H275Y amino acid substitution in the neuraminidase were reported to the RIVM as part of the voluntary notification system. Both patients were immunocompromised and the oseltamivir highly reduced susceptible virus was emerged in the patients during treatment with oseltamivir. The patients were epidemiological unlinked and admitted to different hospitals in different regions of the Netherlands.
Figuur 1 Trends in antibiotic resistance TB
Figuur 2. Trends in combined resistance TB
0
4
8
12
16
'97 '98 '99 '00 '01 '02 '03 '04 '05 '06 '07 '08 '09 '10 '11 '12
INH rifampicin ethambutol streptomycin
0
2
4
6
8
10
12
14
16
'97 '98 '99 '00 '01 '02 '03 '04 '05 '06 '07 '08 '09 '10 '11 '12
streptomycin
streptomycin + ethambutol
ethambutol
rifampicin + ethambutol
rifampicin + streptomycin
rifampicin
INH + ethambutol
INH + streptomycin + ethambutol
INH + streptomycin
INH + rifampicin + ethambutol
INH + rifampicin + streptomycin +ethambutolINH + rifampicin + streptomycin
INH + rifampicin
INH
Figure 4.6.3.02 Trends in combined resistance TB
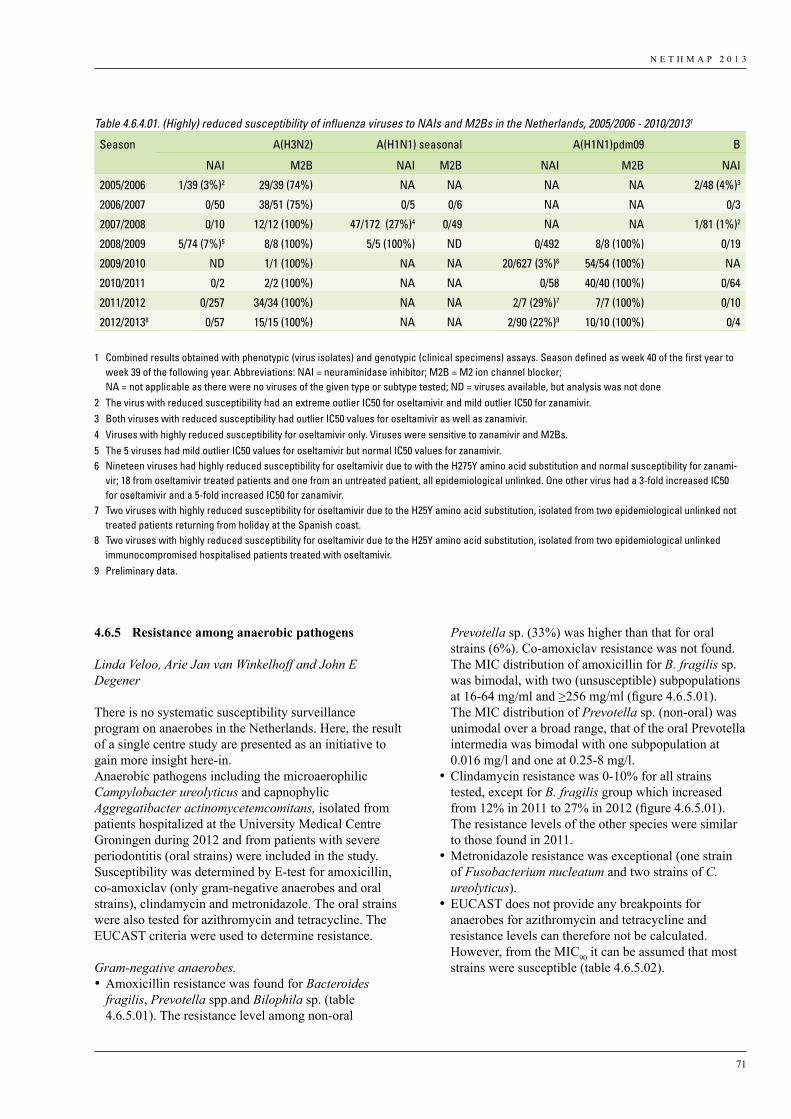
N E T H M A P 2 0 1 3
71
4.6.5 Resistance among anaerobic pathogens
Linda Veloo, Arie Jan van Winkelhoff and John E Degener
There is no systematic susceptibility surveillance program on anaerobes in the Netherlands. Here, the result of a single centre study are presented as an initiative to gain more insight here-in.Anaerobic pathogens including the microaerophilic Campylobacter ureolyticus and capnophylic Aggregatibacter actinomycetemcomitans, isolated from patients hospitalized at the University Medical Centre Groningen during 2012 and from patients with severe periodontitis (oral strains) were included in the study. Susceptibility was determined by E-test for amoxicillin, co-amoxiclav (only gram-negative anaerobes and oral strains), clindamycin and metronidazole. The oral strains were also tested for azithromycin and tetracycline. The EUCAST criteria were used to determine resistance.
Gram-negative anaerobes. •Amoxicillin resistance was found for Bacteroides
fragilis, Prevotella spp.and Bilophila sp. (table 4.6.5.01). The resistance level among non-oral
Prevotella sp. (33%) was higher than that for oral strains (6%). Co-amoxiclav resistance was not found. The MIC distribution of amoxicillin for B. fragilis sp. was bimodal, with two (unsusceptible) subpopulations at 16-64 mg/ml and >256 mg/ml (figure 4.6.5.01). The MIC distribution of Prevotella sp. (non-oral) was unimodal over a broad range, that of the oral Prevotella intermedia was bimodal with one subpopulation at 0.016 mg/l and one at 0.25-8 mg/l.
•Clindamycin resistance was 0-10% for all strains tested, except for B. fragilis group which increased from 12% in 2011 to 27% in 2012 (figure 4.6.5.01). The resistance levels of the other species were similar to those found in 2011.
•Metronidazole resistance was exceptional (one strain of Fusobacterium nucleatum and two strains of C. ureolyticus).
•EUCAST does not provide any breakpoints for anaerobes for azithromycin and tetracycline and resistance levels can therefore not be calculated. However, from the MIC90 it can be assumed that most strains were susceptible (table 4.6.5.02).
Table 4.6.4.01. (Highly) reduced susceptibility of influenza viruses to NAIs and M2Bs in the Netherlands, 2005/2006 - 2010/20131
Season A(H3N2) A(H1N1) seasonal A(H1N1)pdm09 B
NAI M2B NAI M2B NAI M2B NAI
2005/2006 1/39 (3%)2 29/39 (74%) NA NA NA NA 2/48 (4%)3
2006/2007 0/50 38/51 (75%) 0/5 0/6 NA NA 0/3
2007/2008 0/10 12/12 (100%) 47/172 (27%)4 0/49 NA NA 1/81 (1%)2
2008/2009 5/74 (7%)5 8/8 (100%) 5/5 (100%) ND 0/492 8/8 (100%) 0/19
2009/2010 ND 1/1 (100%) NA NA 20/627 (3%)6 54/54 (100%) NA
2010/2011 0/2 2/2 (100%) NA NA 0/58 40/40 (100%) 0/64
2011/2012 0/257 34/34 (100%) NA NA 2/7 (29%)7 7/7 (100%) 0/10
2012/20138 0/57 15/15 (100%) NA NA 2/90 (22%)9 10/10 (100%) 0/4
1 Combined results obtained with phenotypic (virus isolates) and genotypic (clinical specimens) assays. Season defined as week 40 of the first year to week 39 of the following year. Abbreviations: NAI = neuraminidase inhibitor; M2B = M2 ion channel blocker; NA = not applicable as there were no viruses of the given type or subtype tested; ND = viruses available, but analysis was not done
2 The virus with reduced susceptibility had an extreme outlier IC50 for oseltamivir and mild outlier IC50 for zanamivir.3 Both viruses with reduced susceptibility had outlier IC50 values for oseltamivir as well as zanamivir.4 Viruses with highly reduced susceptibility for oseltamivir only. Viruses were sensitive to zanamivir and M2Bs.5 The 5 viruses had mild outlier IC50 values for oseltamivir but normal IC50 values for zanamivir.6 Nineteen viruses had highly reduced susceptibility for oseltamivir due to with the H275Y amino acid substitution and normal susceptibility for zanami-
vir; 18 from oseltamivir treated patients and one from an untreated patient, all epidemiological unlinked. One other virus had a 3-fold increased IC50 for oseltamivir and a 5-fold increased IC50 for zanamivir.
7 Two viruses with highly reduced susceptibility for oseltamivir due to the H25Y amino acid substitution, isolated from two epidemiological unlinked not treated patients returning from holiday at the Spanish coast.
8 Two viruses with highly reduced susceptibility for oseltamivir due to the H25Y amino acid substitution, isolated from two epidemiological unlinked immunocompromised hospitalised patients treated with oseltamivir.
9 Preliminary data.
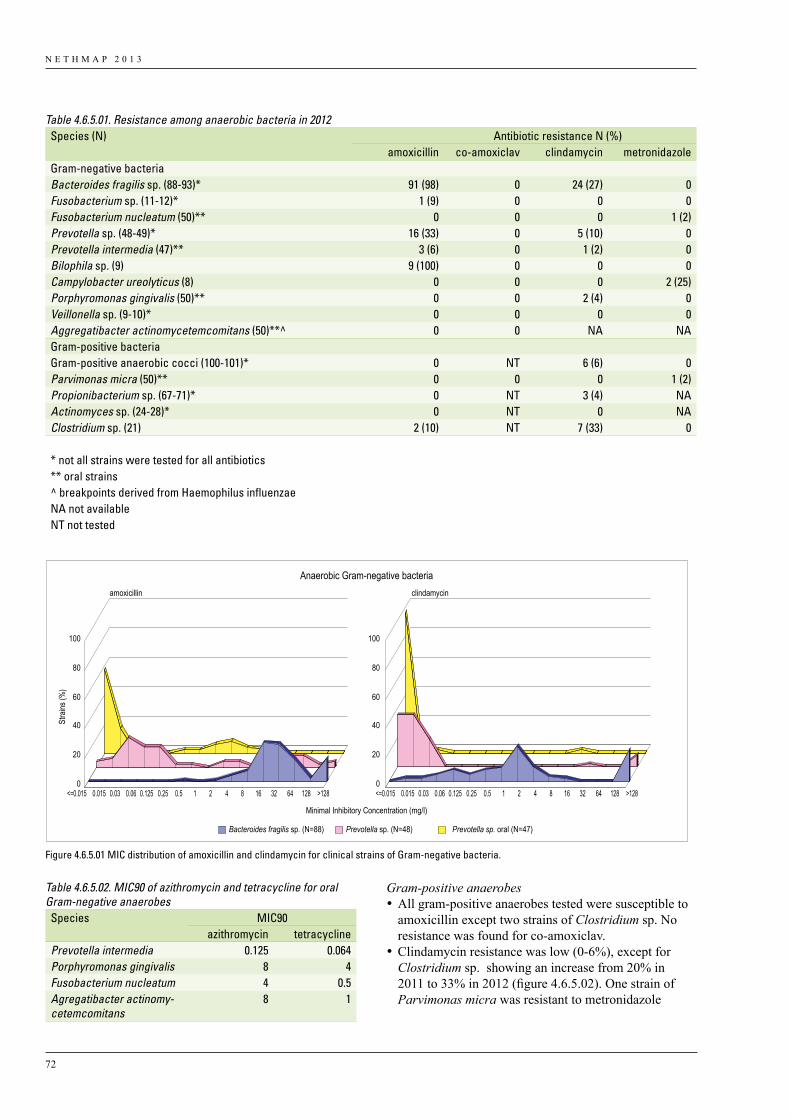
N E T H M A P 2 0 1 3
72
Gram-positive anaerobes•All gram-positive anaerobes tested were susceptible to
amoxicillin except two strains of Clostridium sp. No resistance was found for co-amoxiclav.
•Clindamycin resistance was low (0-6%), except for Clostridium sp. showing an increase from 20% in 2011 to 33% in 2012 (figure 4.6.5.02). One strain of Parvimonas micra was resistant to metronidazole
Table 4.6.5.01. Resistance among anaerobic bacteria in 2012Species (N) Antibiotic resistance N (%)
amoxicillin co-amoxiclav clindamycin metronidazoleGram-negative bacteriaBacteroides fragilis sp. (88-93)* 91 (98) 0 24 (27) 0Fusobacterium sp. (11-12)* 1 (9) 0 0 0Fusobacterium nucleatum (50)** 0 0 0 1 (2)Prevotella sp. (48-49)* 16 (33) 0 5 (10) 0Prevotella intermedia (47)** 3 (6) 0 1 (2) 0Bilophila sp. (9) 9 (100) 0 0 0Campylobacter ureolyticus (8) 0 0 0 2 (25)Porphyromonas gingivalis (50)** 0 0 2 (4) 0Veillonella sp. (9-10)* 0 0 0 0Aggregatibacter actinomycetemcomitans (50)**^ 0 0 NA NAGram-positive bacteriaGram-positive anaerobic cocci (100-101)* 0 NT 6 (6) 0Parvimonas micra (50)** 0 0 0 1 (2)Propionibacterium sp. (67-71)* 0 NT 3 (4) NAActinomyces sp. (24-28)* 0 NT 0 NAClostridium sp. (21) 2 (10) NT 7 (33) 0
* not all strains were tested for all antibiotics** oral strains^ breakpoints derived from Haemophilus influenzaeNA not availableNT not tested
Table 4.6.5.02. MIC90 of azithromycin and tetracycline for oral Gram-negative anaerobes Species MIC90
azithromycin tetracyclinePrevotella intermedia 0.125 0.064Porphyromonas gingivalis 8 4Fusobacterium nucleatum 4 0.5Agregatibacter actinomy-cetemcomitans
8 1
Bacteroides fragilis sp. (N=88) Prevotella sp. (N=48) Prevotella sp. oral (N=47)
amoxicillin clindamycin
Stra
ins (%
)
Minimal Inhibitory Concentration (mg/l)
0
20
40
60
80
100
0
20
40
60
80
100
<=0.015 0.015 0.03 0.06 0.125 0.25 0.5 1 2 4 8 16 32 64 128 >128 <=0.015 0.015 0.03 0.06 0.125 0.25 0.5 1 2 4 8 16 32 64 128 >128
Anaerobic Gram-negative bacteria
Figure 4.6.5.01 MIC distribution of amoxicillin and clindamycin for clinical strains of Gram-negative bacteria.
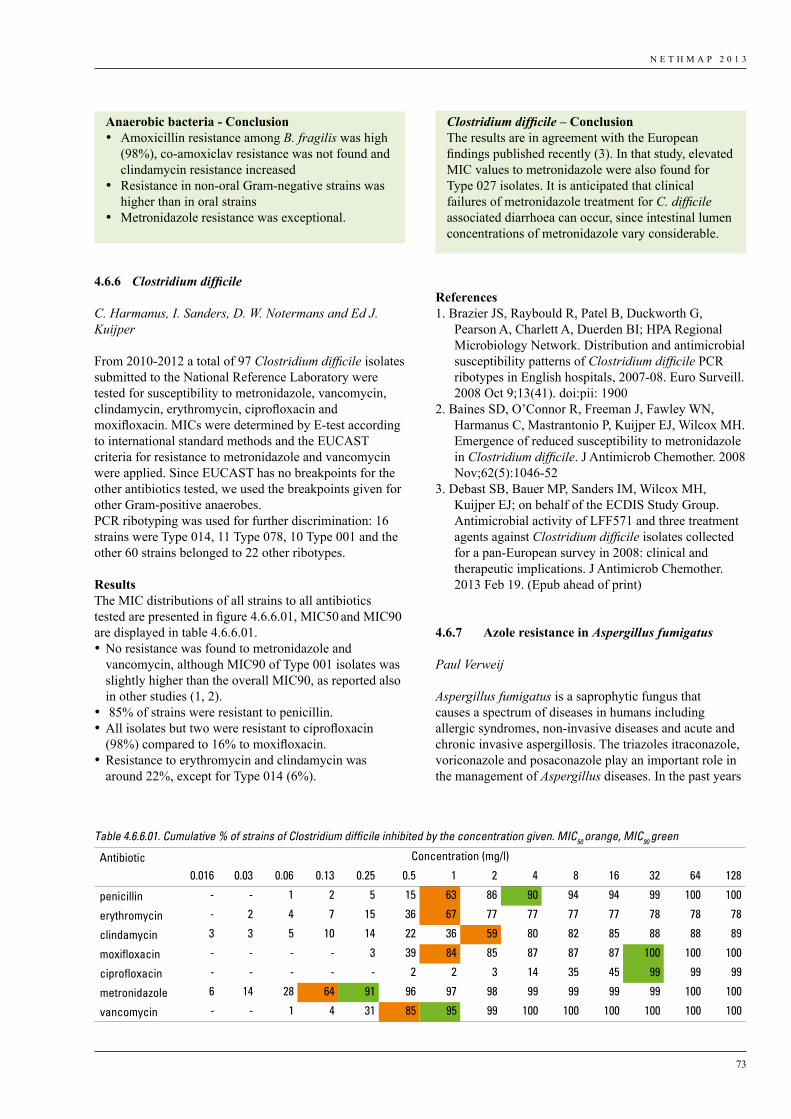
N E T H M A P 2 0 1 3
73
4.6.6 Clostridium difficile
C. Harmanus, I. Sanders, D. W. Notermans and Ed J. Kuijper
From 2010-2012 a total of 97 Clostridium difficile isolates submitted to the National Reference Laboratory were tested for susceptibility to metronidazole, vancomycin, clindamycin, erythromycin, ciprofloxacin and moxifloxacin. MICs were determined by E-test according to international standard methods and the EUCAST criteria for resistance to metronidazole and vancomycin were applied. Since EUCAST has no breakpoints for the other antibiotics tested, we used the breakpoints given for other Gram-positive anaerobes. PCR ribotyping was used for further discrimination: 16 strains were Type 014, 11 Type 078, 10 Type 001 and the other 60 strains belonged to 22 other ribotypes.
Results The MIC distributions of all strains to all antibiotics tested are presented in figure 4.6.6.01, MIC50 and MIC90 are displayed in table 4.6.6.01. •No resistance was found to metronidazole and
vancomycin, although MIC90 of Type 001 isolates was slightly higher than the overall MIC90, as reported also in other studies (1, 2).
• 85% of strains were resistant to penicillin. •All isolates but two were resistant to ciprofloxacin
(98%) compared to 16% to moxifloxacin.•Resistance to erythromycin and clindamycin was
around 22%, except for Type 014 (6%).
References1. Brazier JS, Raybould R, Patel B, Duckworth G,
Pearson A, Charlett A, Duerden BI; HPA Regional Microbiology Network. Distribution and antimicrobial susceptibility patterns of Clostridium difficile PCR ribotypes in English hospitals, 2007-08. Euro Surveill. 2008 Oct 9;13(41). doi:pii: 1900
2. Baines SD, O’Connor R, Freeman J, Fawley WN, Harmanus C, Mastrantonio P, Kuijper EJ, Wilcox MH. Emergence of reduced susceptibility to metronidazole in Clostridium difficile. J Antimicrob Chemother. 2008 Nov;62(5):1046-52
3. Debast SB, Bauer MP, Sanders IM, Wilcox MH, Kuijper EJ; on behalf of the ECDIS Study Group. Antimicrobial activity of LFF571 and three treatment agents against Clostridium difficile isolates collected for a pan-European survey in 2008: clinical and therapeutic implications. J Antimicrob Chemother. 2013 Feb 19. (Epub ahead of print)
4.6.7 Azoleresistancein Aspergillus fumigatus
Paul Verweij
Aspergillus fumigatus is a saprophytic fungus that causes a spectrum of diseases in humans including allergic syndromes, non-invasive diseases and acute and chronic invasive aspergillosis. The triazoles itraconazole, voriconazole and posaconazole play an important role in the management of Aspergillus diseases. In the past years
Anaerobic bacteria - Conclusion• Amoxicillin resistance among B. fragilis was high
(98%), co-amoxiclav resistance was not found and clindamycin resistance increased
• Resistance in non-oral Gram-negative strains was higher than in oral strains
• Metronidazole resistance was exceptional.
Table 4.6.6.01. Cumulative % of strains of Clostridium difficile inhibited by the concentration given. MIC50 orange, MIC90 green
Antibiotic Concentration (mg/l)
0.016 0.03 0.06 0.13 0.25 0.5 1 2 4 8 16 32 64 128
penicillin - - 1 2 5 15 63 86 90 94 94 99 100 100
erythromycin - 2 4 7 15 36 67 77 77 77 77 78 78 78
clindamycin 3 3 5 10 14 22 36 59 80 82 85 88 88 89
moxifloxacin - - - - 3 39 84 85 87 87 87 100 100 100
ciprofloxacin - - - - - 2 2 3 14 35 45 99 99 99
metronidazole 6 14 28 64 91 96 97 98 99 99 99 99 100 100
vancomycin - - 1 4 31 85 95 99 100 100 100 100 100 100
Clostridium difficile – ConclusionThe results are in agreement with the European findings published recently (3). In that study, elevated MIC values to metronidazole were also found for Type 027 isolates. It is anticipated that clinical failures of metronidazole treatment for C. difficile associated diarrhoea can occur, since intestinal lumen concentrations of metronidazole vary considerable.
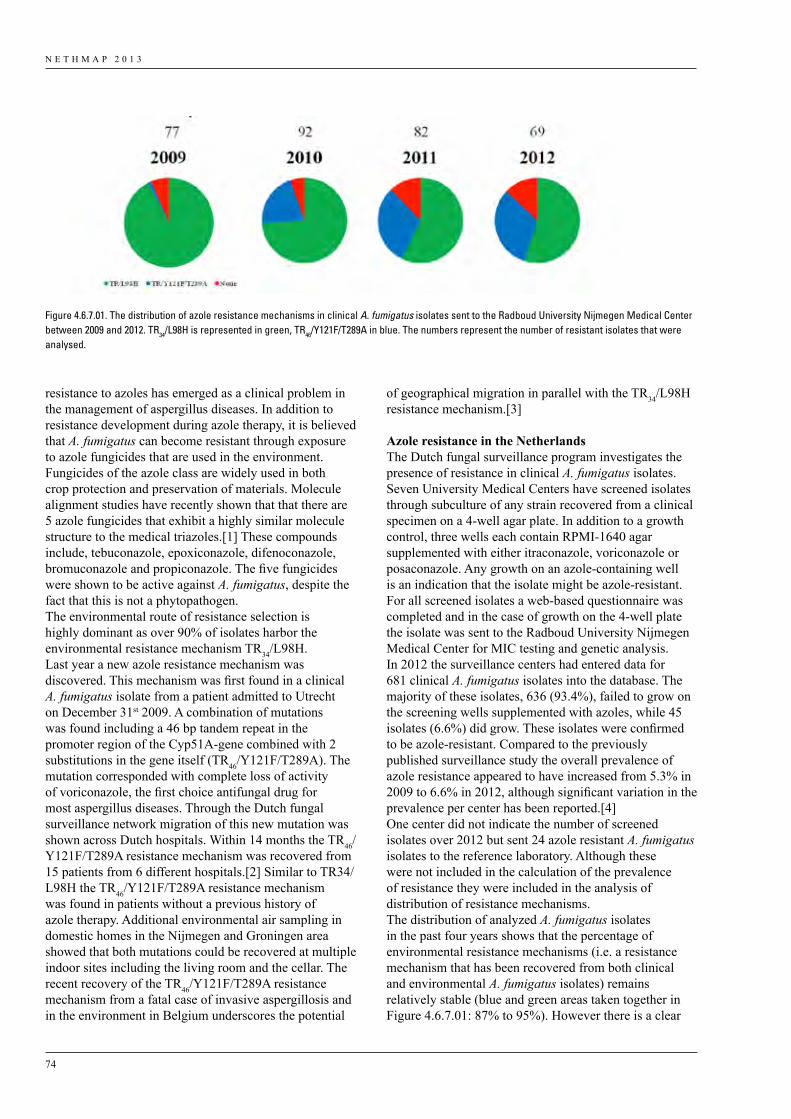
N E T H M A P 2 0 1 3
74
resistance to azoles has emerged as a clinical problem in the management of aspergillus diseases. In addition to resistance development during azole therapy, it is believed that A. fumigatus can become resistant through exposure to azole fungicides that are used in the environment. Fungicides of the azole class are widely used in both crop protection and preservation of materials. Molecule alignment studies have recently shown that that there are 5 azole fungicides that exhibit a highly similar molecule structure to the medical triazoles.[1] These compounds include, tebuconazole, epoxiconazole, difenoconazole, bromuconazole and propiconazole. The five fungicides were shown to be active against A. fumigatus, despite the fact that this is not a phytopathogen. The environmental route of resistance selection is highly dominant as over 90% of isolates harbor the environmental resistance mechanism TR34/L98H. Last year a new azole resistance mechanism was discovered. This mechanism was first found in a clinical A. fumigatus isolate from a patient admitted to Utrecht on December 31st 2009. A combination of mutations was found including a 46 bp tandem repeat in the promoter region of the Cyp51A-gene combined with 2 substitutions in the gene itself (TR46/Y121F/T289A). The mutation corresponded with complete loss of activity of voriconazole, the first choice antifungal drug for most aspergillus diseases. Through the Dutch fungal surveillance network migration of this new mutation was shown across Dutch hospitals. Within 14 months the TR46/Y121F/T289A resistance mechanism was recovered from 15 patients from 6 different hospitals.[2] Similar to TR34/L98H the TR46/Y121F/T289A resistance mechanism was found in patients without a previous history of azole therapy. Additional environmental air sampling in domestic homes in the Nijmegen and Groningen area showed that both mutations could be recovered at multiple indoor sites including the living room and the cellar. The recent recovery of the TR46/Y121F/T289A resistance mechanism from a fatal case of invasive aspergillosis and in the environment in Belgium underscores the potential
of geographical migration in parallel with the TR34/L98H resistance mechanism.[3]
AzoleresistanceintheNetherlandsThe Dutch fungal surveillance program investigates the presence of resistance in clinical A. fumigatus isolates. Seven University Medical Centers have screened isolates through subculture of any strain recovered from a clinical specimen on a 4-well agar plate. In addition to a growth control, three wells each contain RPMI-1640 agar supplemented with either itraconazole, voriconazole or posaconazole. Any growth on an azole-containing well is an indication that the isolate might be azole-resistant. For all screened isolates a web-based questionnaire was completed and in the case of growth on the 4-well plate the isolate was sent to the Radboud University Nijmegen Medical Center for MIC testing and genetic analysis. In 2012 the surveillance centers had entered data for 681 clinical A. fumigatus isolates into the database. The majority of these isolates, 636 (93.4%), failed to grow on the screening wells supplemented with azoles, while 45 isolates (6.6%) did grow. These isolates were confirmed to be azole-resistant. Compared to the previously published surveillance study the overall prevalence of azole resistance appeared to have increased from 5.3% in 2009 to 6.6% in 2012, although significant variation in the prevalence per center has been reported.[4] One center did not indicate the number of screened isolates over 2012 but sent 24 azole resistant A. fumigatus isolates to the reference laboratory. Although these were not included in the calculation of the prevalence of resistance they were included in the analysis of distribution of resistance mechanisms.The distribution of analyzed A. fumigatus isolates in the past four years shows that the percentage of environmental resistance mechanisms (i.e. a resistance mechanism that has been recovered from both clinical and environmental A. fumigatus isolates) remains relatively stable (blue and green areas taken together in Figure 4.6.7.01: 87% to 95%). However there is a clear
Figure 4.6.7.01. The distribution of azole resistance mechanisms in clinical A. fumigatus isolates sent to the Radboud University Nijmegen Medical Center between 2009 and 2012. TR34/L98H is represented in green, TR46/Y121F/T289A in blue. The numbers represent the number of resistant isolates that were analysed.
N E T H M A P 2 0 1 3
75
proportional increase of the new TR46/Y121F/T289A resistance mechanism (Figure: blue area). Whereas only one isolate with this resistance mechanism was recovered in 2009 (1.3%), in 2012 as many as 31.8% of all analyzed azole-resistant isolates harbored the TR46/Y121F/T289A resistance mechanism (Figure 4.6.7.01). The prevalence of azole resistance appears to continue to increase in the Netherlands. The emergence and migration of the TR46/Y121F/T289A resistance mechanism may have contributed to this increase. Patients with azole-resistant aspergillus diseases have a high probability of treatment failure, which was also shown for patients with invasive aspergillosis due to TR46/Y121F/T289A.[2] A recent technical report of the European Centre for Disease Control and Prevention has recognized this public health problem and advocates active surveillance and research.[5] Especially research aimed at understanding azole resistance selection in A. fumigatus in the environment is urgently warranted.
References1. Snelders E, Camps SMT, Karawajczyk A, Schaftenaar
G, et al. Triazole fungicides can induce cross-resistance to medical triazoles in Aspergillus fumigatus. PLoS One 2012;7; e31801.
2. Van der Linden JWM, Camps SMT, Kampinga GA, Arends JPA, et al. Aspergillosis due to voriconazole highly-resistant Aspergillus fumigatus and recovery of genetically related resistant isolates from domestic homes. Clin Infect Dis 2013; (in press).
3. Van der Linden JWM, Snelders E, Kampinga GA, Rijnders B, et al. Clinical implications of azole resistance in Aspergillus fumigatus, the Netherlands, 2007–2009. Emerg Infect Dis 2011;17:1846–54.
4. Vermeulen E, Maertens J, Schoemans H, Lagrou K. Azole-resistant Aspergillus fumigatus due to TR46/Y121F/T289A mutation emerging in Belgium, July 2012. Euro Surveill. 2012;17(48).
5. European Centre for Disease Prevention and Control. Risk assessment on the impact of environmental usage of triazoles on the development and spread of resistance to medical triazoles in Aspergillus species. Stockholm: ECDC; 2013.

Autoriteit Diergeneesmiddelen
MARAN 2013
Monitoring of Antimicrobial Resistanceand Antibiotic Usage in Animals in The Netherlands
in 2012
june 2013
M A R A N 2 0 1 3
2
Colophon
This report is published under the acronym MARAN-2013 by the Central Veterinary Institute, part of Wageningen UR in collaboration with the Food and Consumer Product Safety Authority, and the National Institute for Public Health and the Environment. The information presented in MARAN-2013 is based on total sales data of antimicrobial agents in animal husbandry and the development of antimicrobial resistance in bacteria of animal origin and of relevance to public health.
MARAN-2013 is published in a combined back-to-back report with NETHMAP-2013. The combined report is available on the website of CVI-Lelystad at www.cvi.wur.nl. More detailed information on the usage of antibiotics per animal species is available on the websites of The Netherlands Veterinary Medicines Authority (www.autoriteitdiergeneesmiddelen.nl) and the Agricultural Economics Institute (LEI) (www.maran.wur.nl). MARAN-2013 can be ordered from the secretariat of CVI-Lelystad, p/a Houtribweg 39, 8221 RA Lelystad, The Netherlands.
EditorsProf. Dr. D.J. Mevius, Central Veterinary Institute, part of Wageningen UR, LelystadNetherlands Veterinary Medicines Institute (SDa), UtrechtDept. I&I, Faculty of Veterinary Medicine, Utrecht UniversityIng. B. WitFood and Consumer Product Safety Authority, ZutphenDr. W. van PeltNational Institute for Public Health and the Environment, Bilthoven
The following persons contributed to the writing of MARAN 2013Part I Total sales of antibioticsDr. I.M. van Geijlswijk, Netherlands Veterinary Medicines Authority (SDa), UtrechtIng. N. Bondt, Ing. L.F. PuisterLEI, Agricultural Economics Research Institute, part of Wageningen UR, The HagueYvonne Beeuwkes, afdeling Medische Microbiologie, Universitair Medisch Centrum St Radboud , Nijmegen (lay-out figuren)VijfKeerBlauw, (lay-out)
Part II Resistance dataProf. Dr. D.J. Mevius, Dr. C.M. Dierikx, K.T. Veldman, A. van Essen-ZandbergenCentral Veterinary Institute, part of Wageningen UR, LelystadIng. B. WitFood and Consumer Product Safety Authority, UtrechtDr. W. van PeltNational Institute for Public Health and the Environment, Bilthoven
People involved in providing data for the surveillance of antimicrobial resistanceCentral Veterinary Institute, part of Wageningen UR (CVI), Lelystad:Cindy Dierikx, Kees Veldman, Marga Japing, Joop Testerink, Alieda van Essen, Arie Kant
National Institute of Public Health and the Environment (RIVM), Bilthoven:Max Heck, Henny Maas, Wilfrid van Pelt, Arjen van de Giessen, Kim van der Zwaluw
Food and Consumer Product Safety Authority (NVWA):Zutphen: Ben Wit, , Lisette Poldervaart, Caroliene van Heerwaarden, Michel Rapallini
Ministry of Economic AffairsBart van Assum, Albert Meijering
M A R A N 2 0 1 3
3
AcknowledgementsThis study was primarily financed by the Ministry of Economic Affairs, through the project ‘Antimicrobial Resistance Research in Animals’, grant number WOT-01-002-03.02, project leader Prof. Dr. D.J. Mevius.
The Food and Consumer Product Safety Authority provided additional financing for the work of Ing. B. Wit in animal products and the contribution to several chapters by Dr. W. van Pelt.
The authors thank Mr. Drs J.F. Schutte and Drs B.G.M. Eussen from FIDIN for providing detailed insight into the national sales data.

M A R A N 2 0 1 3
5
Contents
1 Summary ................................................................................................................................................................. 7
2 Usage of antibiotics in animal husbandry in The Netherlands ................................................................................... 9 2.1 Total sales of veterinary antibiotics in The Netherlands 2012 ........................................................................... 9
3 Resistance data .......................................................................................................................................................... 13 3.1 Food-borne pathogens...................................................................................................................................... 13 3.1.1 Salmonella ............................................................................................................................................. 13 3.1.2 Campylobacter ...................................................................................................................................... 20 3.1.3 Shiga- toxin producing E. coli (STEC) ................................................................................................. 25 3.2 Commensal indicator organisms ...................................................................................................................... 26 3.2.1 Escherichia coli in faeces of food-animals ........................................................................................... 27 3.2.2 E. coli in raw meat products of food-animals ........................................................................................ 32 3.2.3 Enterococcus faecalis and E. faecium in faeces of food-animals .......................................................... 33 3.2.4 Enterococcus faecalis and E. faecium in raw meat products of food-animals ...................................... 37
4 Appendix I. ESBL and AmpC-producing Enterobacteriaceae and MRSA in food producing animals in The Netherlands in 2012 ........................................................................................................................................... 41 4.1 ESBL-producing bacteria ................................................................................................................................ 41 4.2 MRSA .............................................................................................................................................................. 46
5 Appendix II. Materials and Methods ........................................................................................................................ 48

M A R A N 2 0 1 3
7
1 Summary
Antibiotic UsageIn the years 2007-2012 the total sales of antibiotics licenced for therapeutic usage in The Netherlands decreased by nearly 50%, from 495 tonnes in 2009 to 249 tonnes in 2012. This means that the policy objective for 2013, a 50% reduction in 2013, compared to 2009, is already almost accomplished in 2012. Compared to 2007 as year with the highest antibiotic usage, the decrease in usage up to 2012 was 56%. Because the live weight produced was stable, this indicates a true decrease in usage in animals. Also the use of antibiotics of critical importance to humans has been reduced to a minimum. This is a major success of the activities implemented by the private parties involved in animal production, the independent control institute SDa and the authorities. It shows that in previous years antibiotics truly have been overused as cheap management tools instead of only for treatment of diseased animals and that minimizing its usage is well possible.
Antimicrobial resistanceAn outbreak of S. Thompson (susceptible to most antibiotics) due to the consumption of contaminated smoked salmon resulted in a high (41.4%) prevalence of this specific serovar in humans. This was followed by S. Enteritidis (17%), the antigenic monophasic variant of S. Typhimurium: S. enterica serovar 1,4,5,12:i:- (12.8%) and S. Typhimurium (11.2%). Although no significant increase of the monophasic variant of S. Typhimurium was observed in humans, in animals its presence still increased. Other remarkable shifts in Salmonella serovars from animals were the strong increase in S. Infantis in poultry (from 5.2% in 2011 to 26.9% in 2012), the decrease of S. Braenderup in laying hens (from 20% in 2011 to 3% in 2012) and the decrease of S. Goldcoast in pigs (from 17.9% in 2011 to 0.5% in 2012).
Highest resistance levels were observed in S. Typhimurium, the monophasic S. enterica subspecies enterica 1,4,[5],12:i:-, S. Java, and to a lesser extend in S. Infantis. Although since 2010 a slight decrease in resistance levels was noticed in S. Typhimurium strains. 11.6% of Salmonella isolates demonstrated a non-wild type phenotype for ciprofloxacin, while 0.9% showed MICs larger than the clinical breakpoint (1 mg/L). The serovars of these ciprofloxacin resistant isolates were predominantly S. Infantis (23%) derived from poultry, S. Enteritidis (18%) derived from humans and S. Java (12%) or S. Typhimurium (9%) in poultry. The remaining 38% consisted of a diversity of serovars merely represented by a single isolate. The prevalence of ESBL producing isolates among Salmonella was 1.4% in 14 serovars, with S. Java as predominant serovar. Among S. Heidelberg 60% was ESBL-producer. S. Java derived
from poultry differed from the variant found in humans bases on trimethoprim resistance.
In veal calves, broilers, poultry meat and turkeys a very high proportion of Campylobacter was resistant to ciprofloxacin. Low levels were observed for erythromycin and gentamicin. Similarly, a high proportion of Campylobacter in humans was resistant to the critically important antimicrobial ciprofloxacin, whereas low resistance was recorded for another critically important antimicrobial erythromycin. Resistance levels in isolates from German broilers were higher for sulfamethoxazole and ampicillin compared to isolates from Dutch broilers. Dutch broiler isolates were more resistant to the macrolides, compared to German isolates. Resistance levels in isolates from white veal calves contained notably higher resistance levels for ampicillin, neomycin and sulfamethoxazole, compared to isolates from rosé veal calves. Turkey C. jejuni isolates showed much higher resistance levels for chloramphenicol compared to isolates from other animals sources. The reason is unknown.
In the last six years, increased resistance levels in Shiga toxin producing E. coli (STEC) from human patients have been reported. However in 2012 resistance levels in STEC from humans were similar or lower than found in 2011. In 2012, highest resistance levels were found for streptomycin, sulfamethoxazole and kanamycin.
Among indicator (commensal) E. coli isolates from meat and animals, resistance to ampicillin, streptomycin, tetracyclines, sulfonamides and trimethoprim was commonly detected in all host species except dairy cattle. Resistance to antimicrobials recognised as critically important in human medicine, such as the fluoroquinolones and third generation cephalosporins, was also observed in the indicator E. coli isolates. In isolates from most animal species and meat products a decrease in resistance levels was observed in 2012, most like as a result of the reductions in antibiotic usage. The separate reporting of the resistance rates obtained from the two types of veal calf husbandries reveals noticeable lower levels of resistance in rosé veal calves compared to white veal calves for almost all antibiotics tested. Reduced susceptibility to ciprofloxacin was highest for E. coli isolates from broilers and turkeys. These continuous high proportions of isolates exhibiting resistance to ciprofloxacin are of concern. Resistance to third-generation cephalosporins was further decreased in most animal species including poultry. These reductions are most likely the result of the vast limitations in usage of cephalosporins in food producing animals.
M A R A N 2 0 1 3
8
As in former years, high rates of resistance were observed for tetracycline, erythromycin and also for streptomycin in both E. faecalis and E. faecium isolates. In pigs and veal calves there resistance showed a tendency to decrease for erythromycin and streptomycin. Also for tetracycline decreasing resistance rates were recorded in veal calves, but not in pigs. Lower levels of resistance were observed in rosé veal calves compared to white veal calves in particular in E. faecium for tetracycline, erythromycin and streptomycin. Overall, in enterococci from meat samples, resistance levels were lower than in isolates from animals. Most remarkable is the striking difference between ampicillin resistance in E. faecium isolates from slaughter pigs (51.6%) compared to pork (0%). Moreover, comparable unexplained large differences in resistant rates were recorded for E. faecalis from pigs and pork. In contrast, these differences were not detected between broilers and poultry meat products. For the first time since the start of the survey (in 1998) no resistance to vancomycin was detected in enterococci from animals.
The occurrence of ESBL/AmpC-producing E. coli is widespread in Dutch food-producing animals and in raw meat products mainly of poultry origin. The potential attribution to infections in humans warrants strict measures to control antibiotic usage and possibilities of transmission of these organisms in animal production chains. However, the dominant human ESBL (CTX-M-15) was only rarely found in animals or their products. This suggest that the attribution of ESBLs from food-animal sources is a relative attribution. BlaCTX-M-1 was the predominant ESBL gene identified in all animal species and sources tested. To estimate any possible attribution from these animal related sources to human health, detailed genetic identification and characterisation of both plasmids and isolates is warranted. The results of this targeted surveillance of ESBLs in live animals and meat suggest that the prevalence of ESBLs at farm level has not substantially reduced yet.
MRSA is still commonly present in the Dutch veal calves and slaughter pigs. Most of the isolates belonged to MRSA CC398 and the isolates have acquired additional resistance genes, excluding genes for antibiotics of specific importance to human health like mupirocin or vancomycin. Resistance to quinu/dalfopristin was observed incidentally in pig isolates. The prevalence in slaughter pigs was almost 100% and the within herd prevalence was also very high. In veal calves the prevalence was somewhat lower than previously reported. The data suggest that the radical reductions in antibiotic usage in food-animals in The Netherlands have not yet had a major effect on the occurrence of MRSA in these animals.
It can be concluded that antibiotic sales of antibiotics licenced for therapeutic use in animals have substantially decreased since the top year 2007. The policies initiated in 2008 to limit antibiotic usage were highly successful. In 2012 in indicator organisms from all animal species the resistance levels have decreased including the occurrence of cefotaxime resistance in E. coli from broilers, which clearly decreased after the ban of ceftiofur in poultry hatcheries in 2010. Any effect on the occurrence of ESBL/AmpC-producing bacteria and MRSA in food-producing animals is less pronounced.
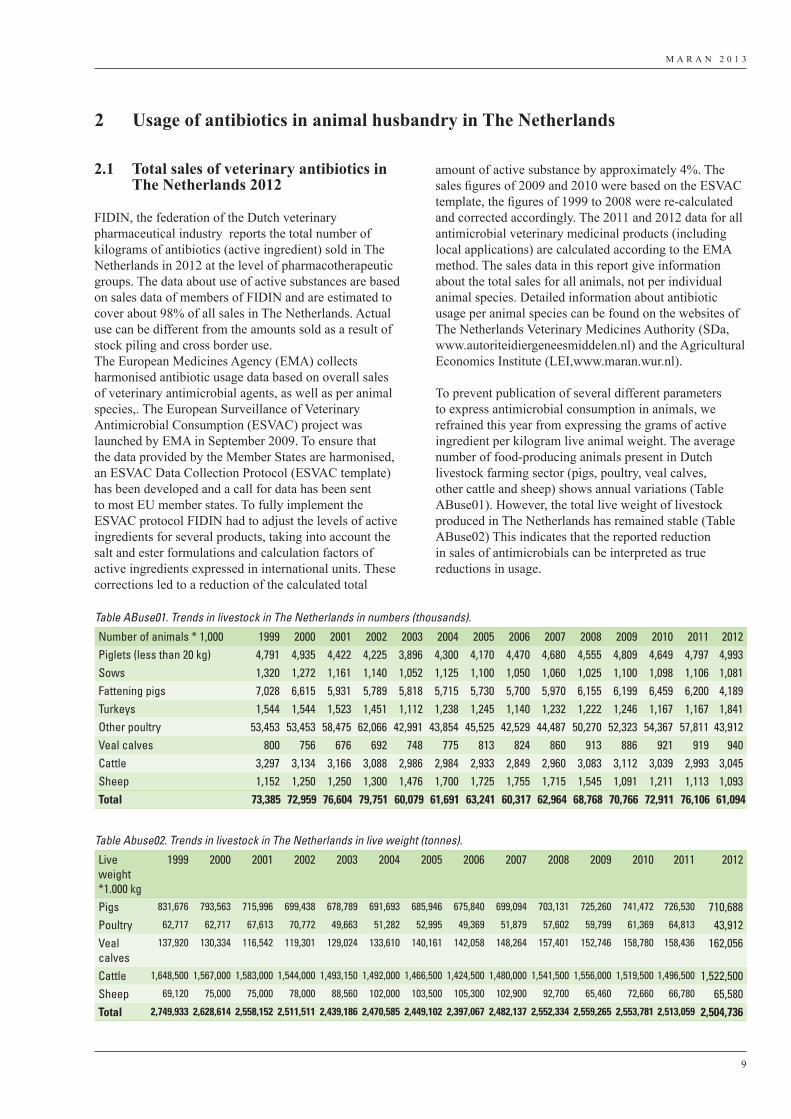
M A R A N 2 0 1 3
9
2.1 Total sales of veterinary antibiotics in The Netherlands 2012
FIDIN, the federation of the Dutch veterinary pharmaceutical industry reports the total number of kilograms of antibiotics (active ingredient) sold in The Netherlands in 2012 at the level of pharmacotherapeutic groups. The data about use of active substances are based on sales data of members of FIDIN and are estimated to cover about 98% of all sales in The Netherlands. Actual use can be different from the amounts sold as a result of stock piling and cross border use.The European Medicines Agency (EMA) collects harmonised antibiotic usage data based on overall sales of veterinary antimicrobial agents, as well as per animal species,. The European Surveillance of Veterinary Antimicrobial Consumption (ESVAC) project was launched by EMA in September 2009. To ensure that the data provided by the Member States are harmonised, an ESVAC Data Collection Protocol (ESVAC template) has been developed and a call for data has been sent to most EU member states. To fully implement the ESVAC protocol FIDIN had to adjust the levels of active ingredients for several products, taking into account the salt and ester formulations and calculation factors of active ingredients expressed in international units. These corrections led to a reduction of the calculated total
amount of active substance by approximately 4%. The sales figures of 2009 and 2010 were based on the ESVAC template, the figures of 1999 to 2008 were re-calculated and corrected accordingly. The 2011 and 2012 data for all antimicrobial veterinary medicinal products (including local applications) are calculated according to the EMA method. The sales data in this report give information about the total sales for all animals, not per individual animal species. Detailed information about antibiotic usage per animal species can be found on the websites of The Netherlands Veterinary Medicines Authority (SDa, www.autoriteidiergeneesmiddelen.nl) and the Agricultural Economics Institute (LEI,www.maran.wur.nl).
To prevent publication of several different parameters to express antimicrobial consumption in animals, we refrained this year from expressing the grams of active ingredient per kilogram live animal weight. The average number of food-producing animals present in Dutch livestock farming sector (pigs, poultry, veal calves, other cattle and sheep) shows annual variations (Table ABuse01). However, the total live weight of livestock produced in The Netherlands has remained stable (Table ABuse02) This indicates that the reported reduction in sales of antimicrobials can be interpreted as true reductions in usage.
2 Usage of antibiotics in animal husbandry in The Netherlands
Table ABuse01. Trends in livestock in The Netherlands in numbers (thousands).
Number of animals * 1,000 1999 2000 2001 2002 2003 2004 2005 2006 2007 2008 2009 2010 2011 2012Piglets (less than 20 kg) 4,791 4,935 4,422 4,225 3,896 4,300 4,170 4,470 4,680 4,555 4,809 4,649 4,797 4,993Sows 1,320 1,272 1,161 1,140 1,052 1,125 1,100 1,050 1,060 1,025 1,100 1,098 1,106 1,081Fattening pigs 7,028 6,615 5,931 5,789 5,818 5,715 5,730 5,700 5,970 6,155 6,199 6,459 6,200 4,189Turkeys 1,544 1,544 1,523 1,451 1,112 1,238 1,245 1,140 1,232 1,222 1,246 1,167 1,167 1,841Other poultry 53,453 53,453 58,475 62,066 42,991 43,854 45,525 42,529 44,487 50,270 52,323 54,367 57,811 43,912Veal calves 800 756 676 692 748 775 813 824 860 913 886 921 919 940Cattle 3,297 3,134 3,166 3,088 2,986 2,984 2,933 2,849 2,960 3,083 3,112 3,039 2,993 3,045Sheep 1,152 1,250 1,250 1,300 1,476 1,700 1,725 1,755 1,715 1,545 1,091 1,211 1,113 1,093Total 73,385 72,959 76,604 79,751 60,079 61,691 63,241 60,317 62,964 68,768 70,766 72,911 76,106 61,094
Table Abuse02. Trends in livestock in The Netherlands in live weight (tonnes).
Live weight *1.000 kg
1999 2000 2001 2002 2003 2004 2005 2006 2007 2008 2009 2010 2011 2012
Pigs 831,676 793,563 715,996 699,438 678,789 691,693 685,946 675,840 699,094 703,131 725,260 741,472 726,530 710,688Poultry 62,717 62,717 67,613 70,772 49,663 51,282 52,995 49,369 51,879 57,602 59,799 61,369 64,813 43,912Veal calves
137,920 130,334 116,542 119,301 129,024 133,610 140,161 142,058 148,264 157,401 152,746 158,780 158,436 162,056
Cattle 1,648,500 1,567,000 1,583,000 1,544,000 1,493,150 1,492,000 1,466,500 1,424,500 1,480,000 1,541,500 1,556,000 1,519,500 1,496,500 1,522,500Sheep 69,120 75,000 75,000 78,000 88,560 102,000 103,500 105,300 102,900 92,700 65,460 72,660 66,780 65,580Total 2,749,933 2,628,614 2,558,152 2,511,511 2,439,186 2,470,585 2,449,102 2,397,067 2,482,137 2,552,334 2,559,265 2,553,781 2,513,059 2,504,736
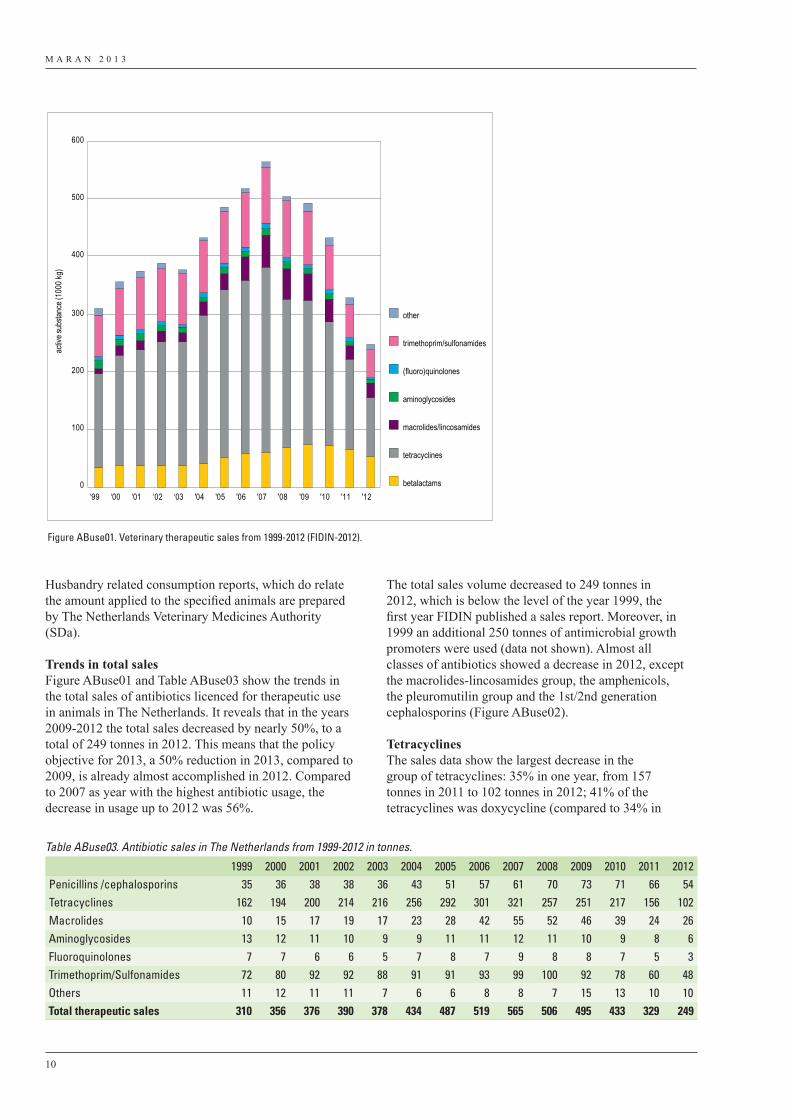
M A R A N 2 0 1 3
10
Husbandry related consumption reports, which do relate the amount applied to the specified animals are prepared by The Netherlands Veterinary Medicines Authority (SDa).
Trends in total salesFigure ABuse01 and Table ABuse03 show the trends in the total sales of antibiotics licenced for therapeutic use in animals in The Netherlands. It reveals that in the years 2009-2012 the total sales decreased by nearly 50%, to a total of 249 tonnes in 2012. This means that the policy objective for 2013, a 50% reduction in 2013, compared to 2009, is already almost accomplished in 2012. Compared to 2007 as year with the highest antibiotic usage, the decrease in usage up to 2012 was 56%.
The total sales volume decreased to 249 tonnes in 2012, which is below the level of the year 1999, the first year FIDIN published a sales report. Moreover, in 1999 an additional 250 tonnes of antimicrobial growth promoters were used (data not shown). Almost all classes of antibiotics showed a decrease in 2012, except the macrolides-lincosamides group, the amphenicols, the pleuromutilin group and the 1st/2nd generation cephalosporins (Figure ABuse02).
TetracyclinesThe sales data show the largest decrease in the group of tetracyclines: 35% in one year, from 157 tonnes in 2011 to 102 tonnes in 2012; 41% of the tetracyclines was doxycycline (compared to 34% in
0
100
200
300
400
500
600
‘99 ‘00 ‘01 ‘02 ‘03 '04 '05 '06 '07 '08 '09 '10 '11 '12
activ
e sub
stanc
e (10
00 kg
)
other
trimethoprim/sulfonamides
(fluoro)quinolones
aminoglycosides
macrolides/lincosamides
tetracyclines
betalactams
Figure ABuse01. Veterinary therapeutic sales from 1999-2012 (FIDIN-2012).
Table ABuse03. Antibiotic sales in The Netherlands from 1999-2012 in tonnes.
1999 2000 2001 2002 2003 2004 2005 2006 2007 2008 2009 2010 2011 2012Penicillins /cephalosporins 35 36 38 38 36 43 51 57 61 70 73 71 66 54Tetracyclines 162 194 200 214 216 256 292 301 321 257 251 217 156 102Macrolides 10 15 17 19 17 23 28 42 55 52 46 39 24 26Aminoglycosides 13 12 11 10 9 9 11 11 12 11 10 9 8 6Fluoroquinolones 7 7 6 6 5 7 8 7 9 8 8 7 5 3Trimethoprim/Sulfonamides 72 80 92 92 88 91 91 93 99 100 92 78 60 48Others 11 12 11 11 7 6 6 8 8 7 15 13 10 10Total therapeutic sales 310 356 376 390 378 434 487 519 565 506 495 433 329 249
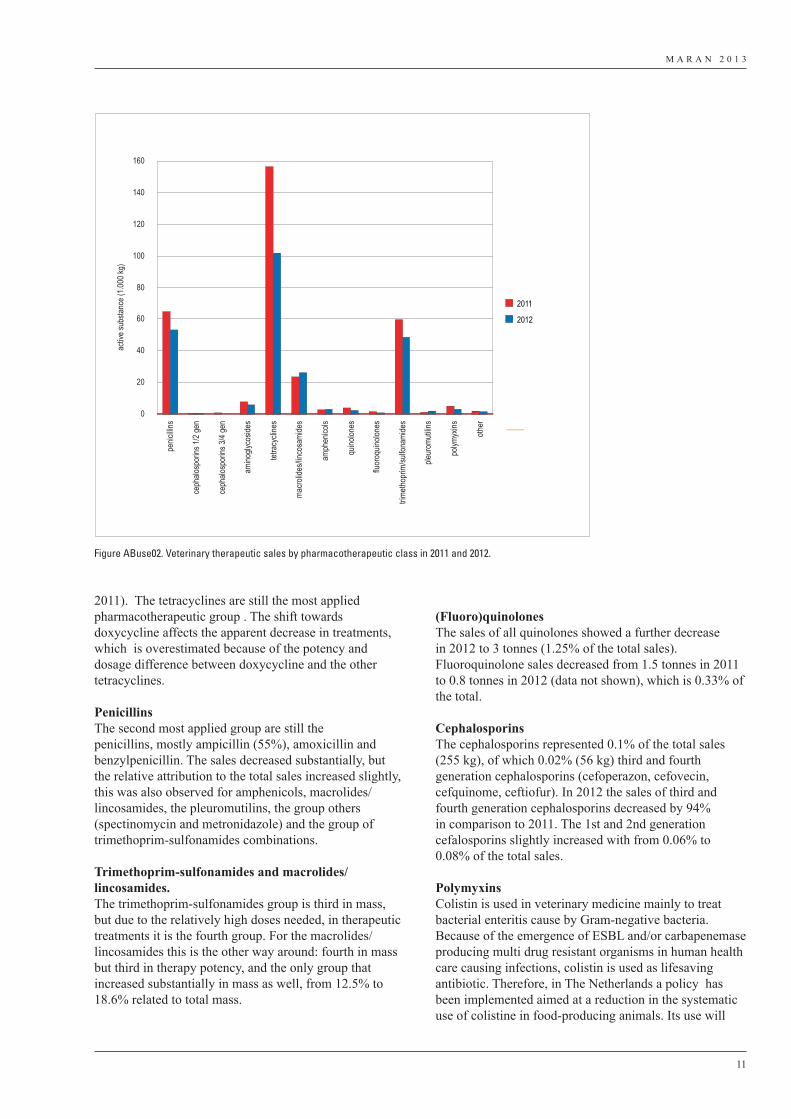
M A R A N 2 0 1 3
11
2011). The tetracyclines are still the most applied pharmacotherapeutic group . The shift towards doxycycline affects the apparent decrease in treatments, which is overestimated because of the potency and dosage difference between doxycycline and the other tetracyclines.
PenicillinsThe second most applied group are still the penicillins, mostly ampicillin (55%), amoxicillin and benzylpenicillin. The sales decreased substantially, but the relative attribution to the total sales increased slightly, this was also observed for amphenicols, macrolides/lincosamides, the pleuromutilins, the group others (spectinomycin and metronidazole) and the group of trimethoprim-sulfonamides combinations.
Trimethoprim-sulfonamides and macrolides/lincosamides.The trimethoprim-sulfonamides group is third in mass, but due to the relatively high doses needed, in therapeutic treatments it is the fourth group. For the macrolides/lincosamides this is the other way around: fourth in mass but third in therapy potency, and the only group that increased substantially in mass as well, from 12.5% to 18.6% related to total mass.
(Fluoro)quinolonesThe sales of all quinolones showed a further decrease in 2012 to 3 tonnes (1.25% of the total sales). Fluoroquinolone sales decreased from 1.5 tonnes in 2011 to 0.8 tonnes in 2012 (data not shown), which is 0.33% of the total.
CephalosporinsThe cephalosporins represented 0.1% of the total sales (255 kg), of which 0.02% (56 kg) third and fourth generation cephalosporins (cefoperazon, cefovecin, cefquinome, ceftiofur). In 2012 the sales of third and fourth generation cephalosporins decreased by 94% in comparison to 2011. The 1st and 2nd generation cefalosporins slightly increased with from 0.06% to 0.08% of the total sales.
PolymyxinsColistin is used in veterinary medicine mainly to treat bacterial enteritis cause by Gram-negative bacteria. Because of the emergence of ESBL and/or carbapenemase producing multi drug resistant organisms in human health care causing infections, colistin is used as lifesaving antibiotic. Therefore, in The Netherlands a policy has been implemented aimed at a reduction in the systematic use of colistine in food-producing animals. Its use will
0
20
40
60
80
100
120
140
160pe
nicilli
ns
ceph
alosp
orins
1/2 g
en
ceph
alosp
orins
3/4 g
en
amino
glyco
sides
tetra
cycli
nes
macro
lides
/linco
sami
des
amph
enico
ls
quino
lones
fluor
oquin
olone
s
trimeth
oprim
/sulfo
nami
des
pleur
omuti
lins
polym
yxins
other
activ
e sub
stanc
e (1.0
00 kg
)
2011
2012
Figure ABuse02. Veterinary therapeutic sales by pharmacotherapeutic class in 2011 and 2012.
M A R A N 2 0 1 3
12
be phased out and as far as possible limited to individual animals. As a result in 2012 35% less colistin was sold compared to 2011 (5.0 and 3.2 tonnes, respectively).
ConclusionThe sales of antibiotics licenced for therapy in The Netherlands have decreased dramatically since in 2008 memoranda of understanding were signed between the authorities, private parties involved in animal production and the Dutch Royal Veterinary Association. The measures that were implement were aimed at transparency and benchmarking of antibiotics by veterinarians and farmers. The use of antibiotics of critical importance to humans has been reduced substantially. It is the aim that these antibiotics will only be used for indications where no alternatives are present.
M A R A N 2 0 1 3
13
3 Resistance data
In this chapter susceptibility test results are presented as determined in 2012 for the food-borne pathogens Salmonella enterica, Campylobacter spp. and Escherichia coli O157, the food-borne commensal organisms E. coli, Enterococcus faecium and E. faecalis.
3.1 Food-borne pathogens
3.1.1 SalmonellaIn this chapter resistance percentages are presented on Salmonella isolated from humans suffering from clinical infections, food-producing animals and food products from animals as potential sources for distribution to humans via the food chain, and animal feeds as potential source for food-producing animals.
Salmonella serovar prevalenceIn The Netherlands, an extensive monitoring of Salmonella is carried out by the Dutch National Institute of Public Health and the Environment (RIVM), the EU reference laboratory (EU-RL) for Salmonella (EC) 882/2004). A summary of the sero- and phage typing results is presented in Table S01, concerning Salmonella isolates recovered from humans and farm animals (swine, cattle and poultry). Human isolates (N=2752 in 2012) were a selection of all isolates sent to the RIVM by regional public health laboratories. All strains were the first isolates recovered from patients with salmonellosis. The majority of the isolates from pigs (N=366) and cattle (N=77) were sent to the RIVM by the Animal Health Service in Deventer from a diversity of surveillance programs and clinical Salmonella infections. Those from chickens (broilers, including poultry products, N= 125; layers, reproduction animals and eggs, N=99) were mainly nonclinical Salmonella isolates derived from a diversity of monitoring programs on farms, slaughterhouses and at retail. Isolates from a diversity of other sources have been analysed as well (animal feed and human food products; other animals from animal husbandry and pets, samples from the environment etc.). Traditionally, S. Enteritidis or S. Typhimurium were most frequently isolated from human clinical infections. However, in 2012 S. Thompson dominated in humans (N = 1140). This was due to a nationwide outbreak of S. Thompson infections related to the consumption of contaminated smoked salmon products. Prevalence of S. Thompson in humans was followed by the monophasic variant of Typhimurium: S. enterica subspecies enterica 1,4,5,12:i:- (N = 351) S. Enteritidis (N=467) and S. Typhimurium (N = 308), in fourth place. The relative contribution of different animal species to infections in humans varied by serovar. S. Typhimurium and its monophasic variant were predominantly associated
with pigs and to a lesser extend with cattle. S. Enteritidis was mainly associated with poultry and more specifically layers and contaminated eggs (Table S01).In pigs, next to S. Typhimurium and its monophasic variant, S. Derby and S. Brandenburg dominated. In cattle, besides the S. Typhimurium variants, S. Dublin was most
Highlights1. An outbreak of S. Thompson (susceptible to
most antibiotics) due to the consumption of contaminated smoked salmon resulted in a high (41.4%) prevalence of this specific serovar in humans. This was followed by S. Enteritidis (17%), the antigenic monophasic variant of S. Typhimurium: S. enterica serovar 1,4,5,12:i:- (12.8%) and S. Typhimurium (11.2%). Although no significant increase of the monophasic variant of S. Typhimurium was observed in humans, in animals its presence still increased. Other remarkable shifts in Salmonella serovars from animals were the strong increase in S. Infantis in poultry (from 5.2% in 2011 to 26.9% in 2012), the decrease of S. Braenderup in laying hens (from 20% in 2011 to 3% in 2012) and the decrease of S. Goldcoast in pigs (from 17.9% in 2011 to 0.5% in 2012).
2. Highest resistance levels were observed in S. Typhimurium, the monophasic S. enterica subspecies enterica 1,4,[5],12:i:-, S. Java, and to a lesser extend in S. Infantis. Although since 2010 a slight decrease in resistance levels was noticed in S. Typhimurium strains.
3. The group of fluoroquinolones is widely regarded as the treatment of choice for severe salmonellosis in adults. Using the epidemiological cut off value of 0.06 mg/L, 11.6% of Salmonella isolates demonstrated a non-wild type phenotype for ciprofloxacin, while 0.9% showed MICs larger than the clinical breakpoint (1 mg/L). The serovars of these ciprofloxacin resistant isolates were predominantly S. Infantis (23%) derived from poultry, S. Enteritidis (18%) derived from humans andS. Java (12%) or S. Typhimurium (9%) in poultry. The remaining 38% consisted of a diversity of serovars merely represented by a single isolate.
4. The prevalence of ESBL producing isolates among Salmonella was 1.4% in 14 serovars, with S. Java as predominant serovar. Among S. Heidelberg 60% was ESBL-producer. S. Java derived from poultry differed from the variant found in humans bases on trimethoprim resistance.
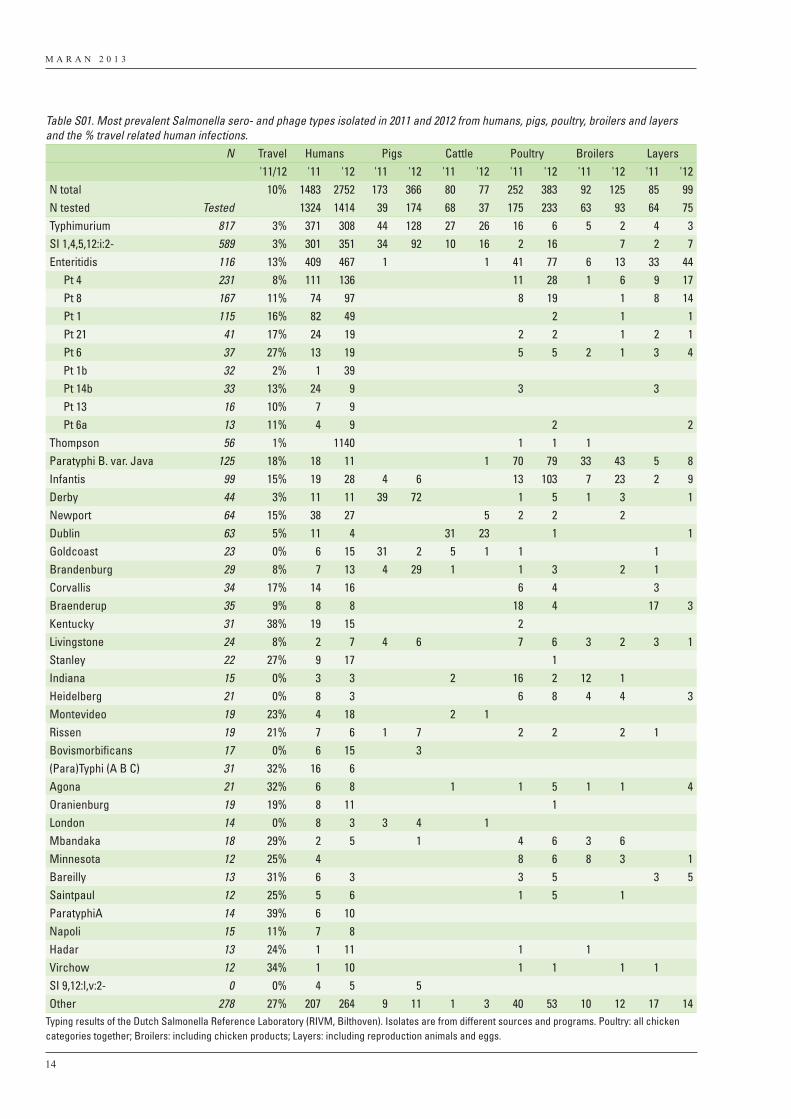
M A R A N 2 0 1 3
14
Table S01. Most prevalent Salmonella sero- and phage types isolated in 2011 and 2012 from humans, pigs, poultry, broilers and layers and the % travel related human infections. N Travel Humans Pigs Cattle Poultry Broilers Layers
'11/12 '11 '12 '11 '12 '11 '12 '11 '12 '11 '12 '11 '12N total 10% 1483 2752 173 366 80 77 252 383 92 125 85 99N tested Tested 1324 1414 39 174 68 37 175 233 63 93 64 75Typhimurium 817 3% 371 308 44 128 27 26 16 6 5 2 4 3SI 1,4,5,12:i:2- 589 3% 301 351 34 92 10 16 2 16 7 2 7Enteritidis 116 13% 409 467 1 1 41 77 6 13 33 44
Pt 4 231 8% 111 136 11 28 1 6 9 17 Pt 8 167 11% 74 97 8 19 1 8 14 Pt 1 115 16% 82 49 2 1 1 Pt 21 41 17% 24 19 2 2 1 2 1 Pt 6 37 27% 13 19 5 5 2 1 3 4 Pt 1b 32 2% 1 39 Pt 14b 33 13% 24 9 3 3 Pt 13 16 10% 7 9 Pt 6a 13 11% 4 9 2 2
Thompson 56 1% 1140 1 1 1Paratyphi B. var. Java 125 18% 18 11 1 70 79 33 43 5 8Infantis 99 15% 19 28 4 6 13 103 7 23 2 9Derby 44 3% 11 11 39 72 1 5 1 3 1Newport 64 15% 38 27 5 2 2 2Dublin 63 5% 11 4 31 23 1 1Goldcoast 23 0% 6 15 31 2 5 1 1 1Brandenburg 29 8% 7 13 4 29 1 1 3 2 1Corvallis 34 17% 14 16 6 4 3Braenderup 35 9% 8 8 18 4 17 3Kentucky 31 38% 19 15 2Livingstone 24 8% 2 7 4 6 7 6 3 2 3 1Stanley 22 27% 9 17 1Indiana 15 0% 3 3 2 16 2 12 1Heidelberg 21 0% 8 3 6 8 4 4 3Montevideo 19 23% 4 18 2 1Rissen 19 21% 7 6 1 7 2 2 2 1Bovismorbificans 17 0% 6 15 3(Para)Typhi (A B C) 31 32% 16 6Agona 21 32% 6 8 1 1 5 1 1 4Oranienburg 19 19% 8 11 1London 14 0% 8 3 3 4 1Mbandaka 18 29% 2 5 1 4 6 3 6Minnesota 12 25% 4 8 6 8 3 1Bareilly 13 31% 6 3 3 5 3 5Saintpaul 12 25% 5 6 1 5 1ParatyphiA 14 39% 6 10Napoli 15 11% 7 8Hadar 13 24% 1 11 1 1Virchow 12 34% 1 10 1 1 1 1SI 9,12:l,v:2- 0 0% 4 5 5Other 278 27% 207 264 9 11 1 3 40 53 10 12 17 14
Typing results of the Dutch Salmonella Reference Laboratory (RIVM, Bilthoven). Isolates are from different sources and programs. Poultry: all chicken categories together; Broilers: including chicken products; Layers: including reproduction animals and eggs.
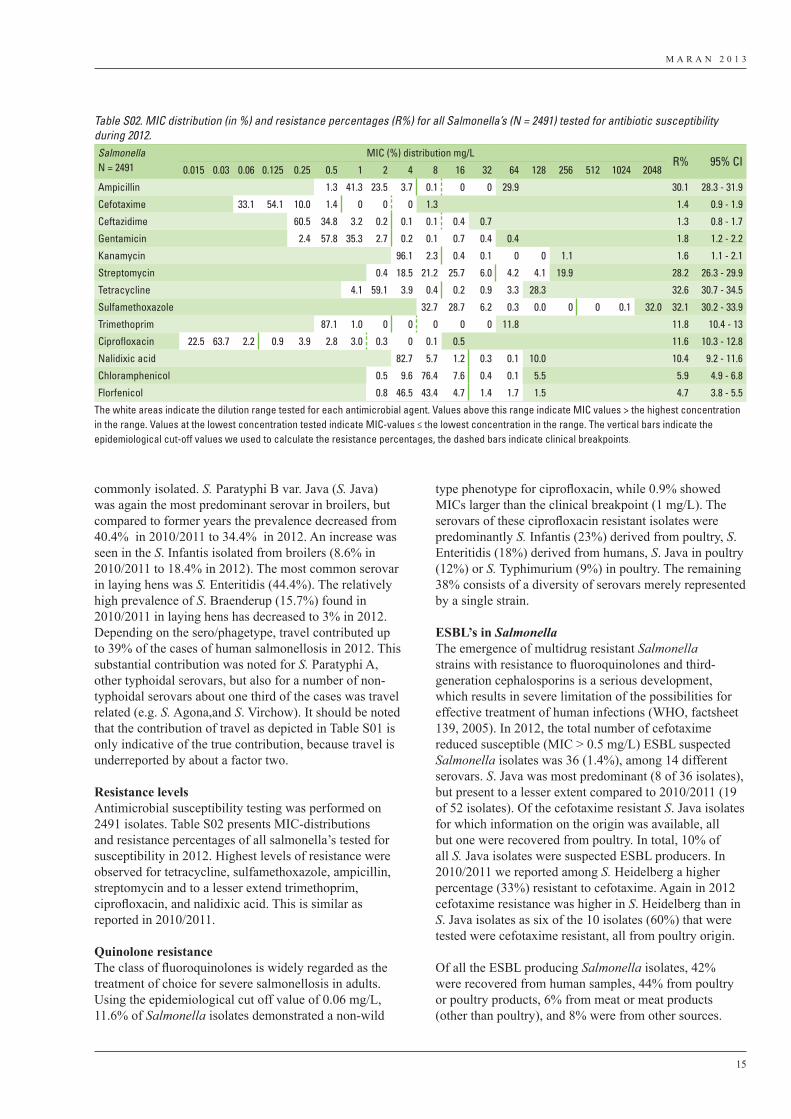
M A R A N 2 0 1 3
15
commonly isolated. S. Paratyphi B var. Java (S. Java) was again the most predominant serovar in broilers, but compared to former years the prevalence decreased from 40.4% in 2010/2011 to 34.4% in 2012. An increase was seen in the S. Infantis isolated from broilers (8.6% in 2010/2011 to 18.4% in 2012). The most common serovar in laying hens was S. Enteritidis (44.4%). The relatively high prevalence of S. Braenderup (15.7%) found in 2010/2011 in laying hens has decreased to 3% in 2012. Depending on the sero/phagetype, travel contributed up to 39% of the cases of human salmonellosis in 2012. This substantial contribution was noted for S. Paratyphi A, other typhoidal serovars, but also for a number of non-typhoidal serovars about one third of the cases was travel related (e.g. S. Agona,and S. Virchow). It should be noted that the contribution of travel as depicted in Table S01 is only indicative of the true contribution, because travel is underreported by about a factor two.
Resistance levelsAntimicrobial susceptibility testing was performed on 2491 isolates. Table S02 presents MIC-distributions and resistance percentages of all salmonella’s tested for susceptibility in 2012. Highest levels of resistance were observed for tetracycline, sulfamethoxazole, ampicillin, streptomycin and to a lesser extend trimethoprim, ciprofloxacin, and nalidixic acid. This is similar as reported in 2010/2011.
Quinolone resistanceThe class of fluoroquinolones is widely regarded as the treatment of choice for severe salmonellosis in adults. Using the epidemiological cut off value of 0.06 mg/L, 11.6% of Salmonella isolates demonstrated a non-wild
type phenotype for ciprofloxacin, while 0.9% showed MICs larger than the clinical breakpoint (1 mg/L). The serovars of these ciprofloxacin resistant isolates were predominantly S. Infantis (23%) derived from poultry, S. Enteritidis (18%) derived from humans, S. Java in poultry (12%) or S. Typhimurium (9%) in poultry. The remaining 38% consists of a diversity of serovars merely represented by a single strain. ESBL’s in SalmonellaThe emergence of multidrug resistant Salmonella strains with resistance to fluoroquinolones and third-generation cephalosporins is a serious development, which results in severe limitation of the possibilities for effective treatment of human infections (WHO, factsheet 139, 2005). In 2012, the total number of cefotaxime reduced susceptible (MIC > 0.5 mg/L) ESBL suspected Salmonella isolates was 36 (1.4%), among 14 different serovars. S. Java was most predominant (8 of 36 isolates), but present to a lesser extent compared to 2010/2011 (19 of 52 isolates). Of the cefotaxime resistant S. Java isolates for which information on the origin was available, all but one were recovered from poultry. In total, 10% of all S. Java isolates were suspected ESBL producers. In 2010/2011 we reported among S. Heidelberg a higher percentage (33%) resistant to cefotaxime. Again in 2012 cefotaxime resistance was higher in S. Heidelberg than in S. Java isolates as six of the 10 isolates (60%) that were tested were cefotaxime resistant, all from poultry origin.
Of all the ESBL producing Salmonella isolates, 42% were recovered from human samples, 44% from poultry or poultry products, 6% from meat or meat products (other than poultry), and 8% were from other sources.
Table S02. MIC distribution (in %) and resistance percentages (R%) for all Salmonella’s (N = 2491) tested for antibiotic susceptibility during 2012.Salmonella N = 2491
MIC (%) distribution mg/LR% 95% CI
0.015 0.03 0.06 0.125 0.25 0.5 1 2 4 8 16 32 64 128 256 512 1024 2048
Ampicillin 1.3 41.3 23.5 3.7 0.1 0 0 29.9 30.1 28.3 - 31.9
Cefotaxime 33.1 54.1 10.0 1.4 0 0 0 1.3 1.4 0.9 - 1.9
Ceftazidime 60.5 34.8 3.2 0.2 0.1 0.1 0.4 0.7 1.3 0.8 - 1.7
Gentamicin 2.4 57.8 35.3 2.7 0.2 0.1 0.7 0.4 0.4 1.8 1.2 - 2.2
Kanamycin 96.1 2.3 0.4 0.1 0 0 1.1 1.6 1.1 - 2.1
Streptomycin 0.4 18.5 21.2 25.7 6.0 4.2 4.1 19.9 28.2 26.3 - 29.9
Tetracycline 4.1 59.1 3.9 0.4 0.2 0.9 3.3 28.3 32.6 30.7 - 34.5
Sulfamethoxazole 32.7 28.7 6.2 0.3 0.0 0 0 0.1 32.0 32.1 30.2 - 33.9
Trimethoprim 87.1 1.0 0 0 0 0 0 11.8 11.8 10.4 - 13
Ciprofloxacin 22.5 63.7 2.2 0.9 3.9 2.8 3.0 0.3 0 0.1 0.5 11.6 10.3 - 12.8
Nalidixic acid 82.7 5.7 1.2 0.3 0.1 10.0 10.4 9.2 - 11.6
Chloramphenicol 0.5 9.6 76.4 7.6 0.4 0.1 5.5 5.9 4.9 - 6.8
Florfenicol 0.8 46.5 43.4 4.7 1.4 1.7 1.5 4.7 3.8 - 5.5
The white areas indicate the dilution range tested for each antimicrobial agent. Values above this range indicate MIC values > the highest concentration in the range. Values at the lowest concentration tested indicate MIC-values ≤ the lowest concentration in the range. The vertical bars indicate the epidemiological cut-off values we used to calculate the resistance percentages, the dashed bars indicate clinical breakpoints.
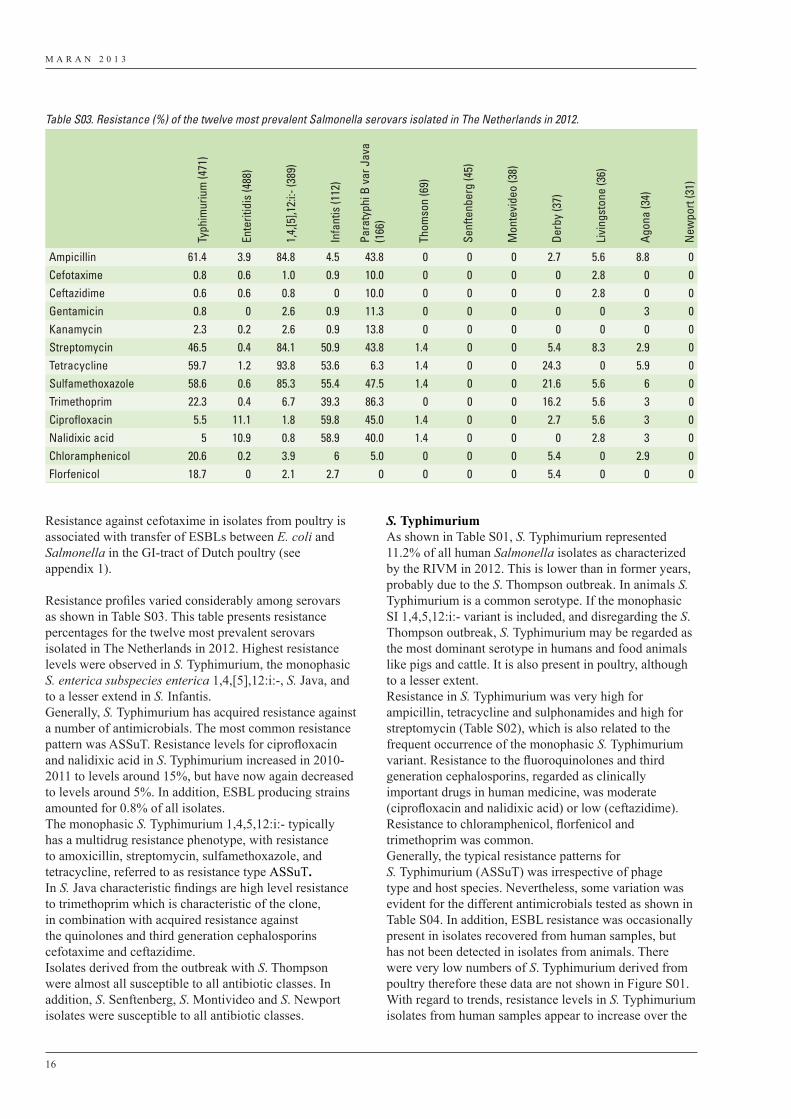
M A R A N 2 0 1 3
16
Resistance against cefotaxime in isolates from poultry is associated with transfer of ESBLs between E. coli and Salmonella in the GI-tract of Dutch poultry (see appendix 1).
Resistance profiles varied considerably among serovars as shown in Table S03. This table presents resistance percentages for the twelve most prevalent serovars isolated in The Netherlands in 2012. Highest resistance levels were observed in S. Typhimurium, the monophasic S. enterica subspecies enterica 1,4,[5],12:i:-, S. Java, and to a lesser extend in S. Infantis.Generally, S. Typhimurium has acquired resistance against a number of antimicrobials. The most common resistance pattern was ASSuT. Resistance levels for ciprofloxacin and nalidixic acid in S. Typhimurium increased in 2010-2011 to levels around 15%, but have now again decreased to levels around 5%. In addition, ESBL producing strains amounted for 0.8% of all isolates.The monophasic S. Typhimurium 1,4,5,12:i:- typically has a multidrug resistance phenotype, with resistance to amoxicillin, streptomycin, sulfamethoxazole, and tetracycline, referred to as resistance type ASSuT.In S. Java characteristic findings are high level resistance to trimethoprim which is characteristic of the clone, in combination with acquired resistance against the quinolones and third generation cephalosporins cefotaxime and ceftazidime.Isolates derived from the outbreak with S. Thompson were almost all susceptible to all antibiotic classes. In addition, S. Senftenberg, S. Montivideo and S. Newport isolates were susceptible to all antibiotic classes.
S. TyphimuriumAs shown in Table S01, S. Typhimurium represented 11.2% of all human Salmonella isolates as characterized by the RIVM in 2012. This is lower than in former years, probably due to the S. Thompson outbreak. In animals S. Typhimurium is a common serotype. If the monophasic SI 1,4,5,12:i:- variant is included, and disregarding the S. Thompson outbreak, S. Typhimurium may be regarded as the most dominant serotype in humans and food animals like pigs and cattle. It is also present in poultry, although to a lesser extent.Resistance in S. Typhimurium was very high for ampicillin, tetracycline and sulphonamides and high for streptomycin (Table S02), which is also related to the frequent occurrence of the monophasic S. Typhimurium variant. Resistance to the fluoroquinolones and third generation cephalosporins, regarded as clinically important drugs in human medicine, was moderate (ciprofloxacin and nalidixic acid) or low (ceftazidime). Resistance to chloramphenicol, florfenicol and trimethoprim was common. Generally, the typical resistance patterns for S. Typhimurium (ASSuT) was irrespective of phage type and host species. Nevertheless, some variation was evident for the different antimicrobials tested as shown in Table S04. In addition, ESBL resistance was occasionally present in isolates recovered from human samples, but has not been detected in isolates from animals. There were very low numbers of S. Typhimurium derived from poultry therefore these data are not shown in Figure S01. With regard to trends, resistance levels in S. Typhimurium isolates from human samples appear to increase over the
Table S03. Resistance (%) of the twelve most prevalent Salmonella serovars isolated in The Netherlands in 2012.
Typh
imur
ium
(471
)
Ente
ritid
is (4
88)
1,4,
[5],1
2:i:-
(389
)
Infa
ntis
(112
)
Para
typh
i B v
ar J
ava
(166
)
Thom
son
(69)
Senf
tenb
erg
(45)
Mon
tevi
deo
(38)
Derb
y (3
7)
Livi
ngst
one
(36)
Agon
a (3
4)
New
port
(31)
Ampicillin 61.4 3.9 84.8 4.5 43.8 0 0 0 2.7 5.6 8.8 0Cefotaxime 0.8 0.6 1.0 0.9 10.0 0 0 0 0 2.8 0 0Ceftazidime 0.6 0.6 0.8 0 10.0 0 0 0 0 2.8 0 0Gentamicin 0.8 0 2.6 0.9 11.3 0 0 0 0 0 3 0Kanamycin 2.3 0.2 2.6 0.9 13.8 0 0 0 0 0 0 0Streptomycin 46.5 0.4 84.1 50.9 43.8 1.4 0 0 5.4 8.3 2.9 0Tetracycline 59.7 1.2 93.8 53.6 6.3 1.4 0 0 24.3 0 5.9 0Sulfamethoxazole 58.6 0.6 85.3 55.4 47.5 1.4 0 0 21.6 5.6 6 0Trimethoprim 22.3 0.4 6.7 39.3 86.3 0 0 0 16.2 5.6 3 0Ciprofloxacin 5.5 11.1 1.8 59.8 45.0 1.4 0 0 2.7 5.6 3 0Nalidixic acid 5 10.9 0.8 58.9 40.0 1.4 0 0 0 2.8 3 0Chloramphenicol 20.6 0.2 3.9 6 5.0 0 0 0 5.4 0 2.9 0Florfenicol 18.7 0 2.1 2.7 0 0 0 0 5.4 0 0 0
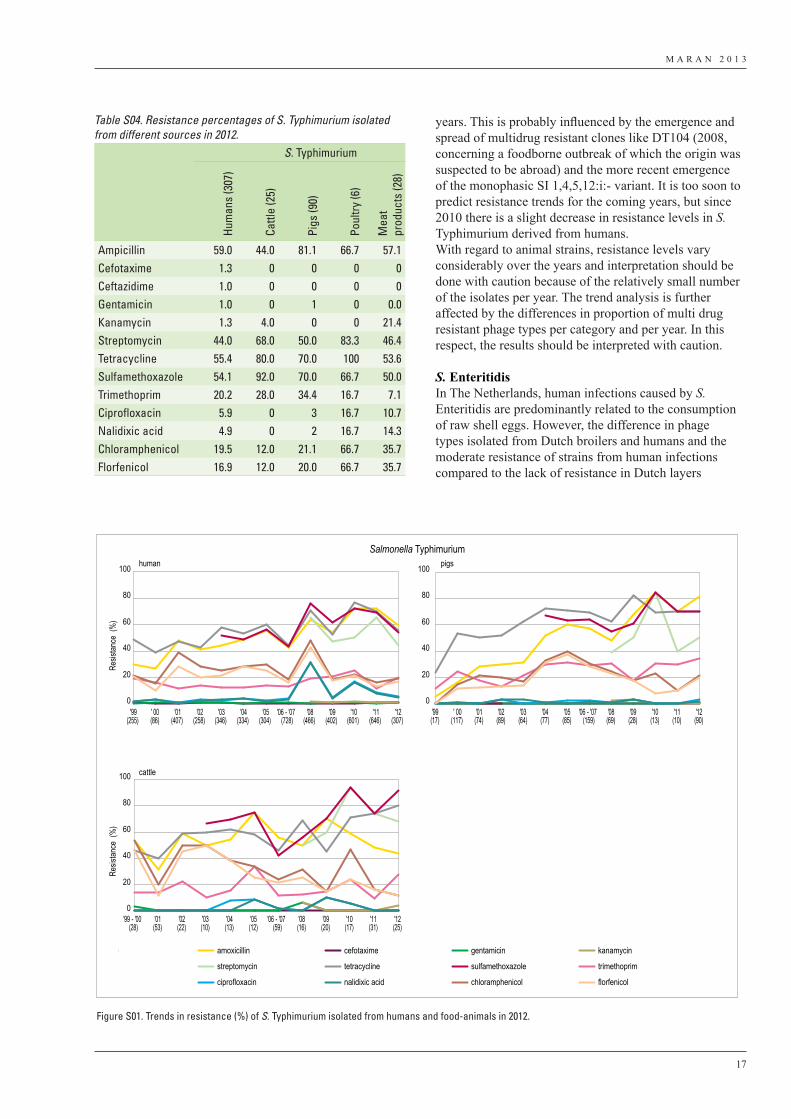
M A R A N 2 0 1 3
17
years. This is probably influenced by the emergence and spread of multidrug resistant clones like DT104 (2008, concerning a foodborne outbreak of which the origin was suspected to be abroad) and the more recent emergence of the monophasic SI 1,4,5,12:i:- variant. It is too soon to predict resistance trends for the coming years, but since 2010 there is a slight decrease in resistance levels in S. Typhimurium derived from humans.With regard to animal strains, resistance levels vary considerably over the years and interpretation should be done with caution because of the relatively small number of the isolates per year. The trend analysis is further affected by the differences in proportion of multi drug resistant phage types per category and per year. In this respect, the results should be interpreted with caution.
S. EnteritidisIn The Netherlands, human infections caused by S. Enteritidis are predominantly related to the consumption of raw shell eggs. However, the difference in phage types isolated from Dutch broilers and humans and the moderate resistance of strains from human infections compared to the lack of resistance in Dutch layers
Table S04. Resistance percentages of S. Typhimurium isolated from different sources in 2012.
S. Typhimurium
Hum
ans
(307
)
Cattl
e (2
5)
Pigs
(90)
Poul
try (6
)
Mea
t pr
oduc
ts (2
8)
Ampicillin 59.0 44.0 81.1 66.7 57.1Cefotaxime 1.3 0 0 0 0Ceftazidime 1.0 0 0 0 0Gentamicin 1.0 0 1 0 0.0Kanamycin 1.3 4.0 0 0 21.4Streptomycin 44.0 68.0 50.0 83.3 46.4Tetracycline 55.4 80.0 70.0 100 53.6Sulfamethoxazole 54.1 92.0 70.0 66.7 50.0Trimethoprim 20.2 28.0 34.4 16.7 7.1Ciprofloxacin 5.9 0 3 16.7 10.7Nalidixic acid 4.9 0 2 16.7 14.3Chloramphenicol 19.5 12.0 21.1 66.7 35.7Florfenicol 16.9 12.0 20.0 66.7 35.7
Salmonella Typhimurium
Resis
tance
(%
)Re
sistan
ce (
%)
human
0
20
40
60
80
100
0
20
40
60
80
100
0
20
40
60
80
100 pigs
cattle
amoxicillin cefotaxime gentamicin kanamycin
streptomycin tetracycline sulfamethoxazole trimethoprim
ciprofloxacin nalidixic acid chloramphenicol florfenicol
'99(255)
' 00(86)
'01(407)
'02(258)
'03(346)
'04(334)
'05(304)
'06 - '07(728)
'08(466)
'09(402)
'10(601)
'11(646)
'12(307)
'99(17)
' 00(117)
'01(74)
'02(89)
'03(64)
'04(77)
'05(85)
'06 - '07(159)
'08(69)
'09(28)
'10(13)
'11(10)
'12(90)
'99 - '00(28)
'01(53)
'02(22)
'03(10)
'04(13)
'05(12)
'06 - '07(59)
'08(16)
'09(20)
'10(17)
'11(31)
'12(25)
Figure S01. Trends in resistance (%) of S. Typhimurium isolated from humans and food-animals in 2012.
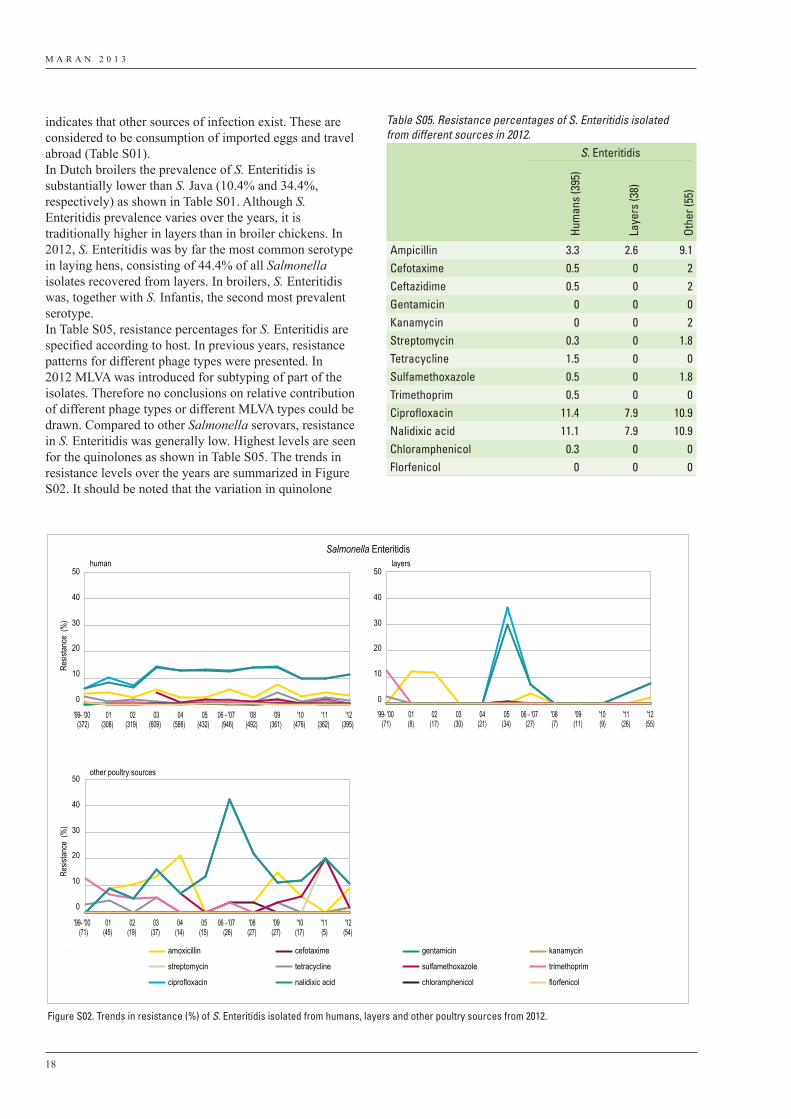
M A R A N 2 0 1 3
18
indicates that other sources of infection exist. These are considered to be consumption of imported eggs and travel abroad (Table S01).In Dutch broilers the prevalence of S. Enteritidis is substantially lower than S. Java (10.4% and 34.4%, respectively) as shown in Table S01. Although S. Enteritidis prevalence varies over the years, it is traditionally higher in layers than in broiler chickens. In 2012, S. Enteritidis was by far the most common serotype in laying hens, consisting of 44.4% of all Salmonella isolates recovered from layers. In broilers, S. Enteritidis was, together with S. Infantis, the second most prevalent serotype.In Table S05, resistance percentages for S. Enteritidis are specified according to host. In previous years, resistance patterns for different phage types were presented. In 2012 MLVA was introduced for subtyping of part of the isolates. Therefore no conclusions on relative contribution of different phage types or different MLVA types could be drawn. Compared to other Salmonella serovars, resistance in S. Enteritidis was generally low. Highest levels are seen for the quinolones as shown in Table S05. The trends in resistance levels over the years are summarized in Figure S02. It should be noted that the variation in quinolone
Salmonella Enteritidis
Resis
tance
(%
)Re
sistan
ce (
%)
0
10
20
30
40
50
0
10
20
30
40
50
0
10
20
30
40
50
human layers
other poultry sources
amoxicillin cefotaxime gentamicin kanamycin
streptomycin tetracycline sulfamethoxazole trimethoprim
ciprofloxacin nalidixic acid chloramphenicol florfenicol
'99- '00(372)
01(308)
02(319)
03(609)
04(588)
05(432)
06 - '07(946)
'08(492)
'09(361)
'10(476)
'11(362)
'12(395)
'99- '00(71)
01(8)
02(17)
03(30)
04(21)
05(34)
06 - '07(27)
'08(7)
'09(11)
'10(9)
'11(26)
'12(55)
'99- '00(71)
01(45)
02(19)
03(37)
04(14)
05(15)
06 - '07(26)
'08(27)
'09(27)
'10(17)
'11(5)
'12(54)
Figure S02. Trends in resistance (%) of S. Enteritidis isolated from humans, layers and other poultry sources from 2012.
Table S05. Resistance percentages of S. Enteritidis isolated from different sources in 2012.
S. Enteritidis
Hum
ans
(395
)
Laye
rs (3
8)
Othe
r (55
)
Ampicillin 3.3 2.6 9.1Cefotaxime 0.5 0 2Ceftazidime 0.5 0 2Gentamicin 0 0 0Kanamycin 0 0 2Streptomycin 0.3 0 1.8Tetracycline 1.5 0 0Sulfamethoxazole 0.5 0 1.8Trimethoprim 0.5 0 0Ciprofloxacin 11.4 7.9 10.9Nalidixic acid 11.1 7.9 10.9Chloramphenicol 0.3 0 0Florfenicol 0 0 0
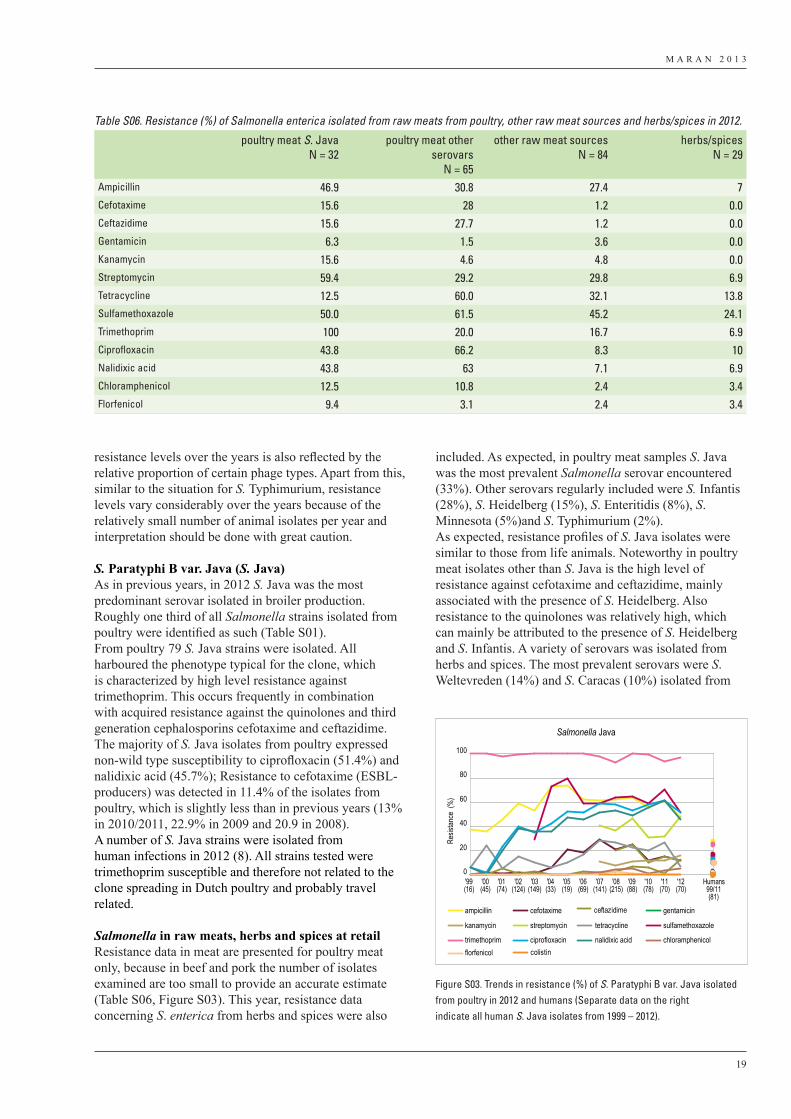
M A R A N 2 0 1 3
19
resistance levels over the years is also reflected by the relative proportion of certain phage types. Apart from this, similar to the situation for S. Typhimurium, resistance levels vary considerably over the years because of the relatively small number of animal isolates per year and interpretation should be done with great caution.
S. Paratyphi B var. Java (S. Java)As in previous years, in 2012 S. Java was the most predominant serovar isolated in broiler production. Roughly one third of all Salmonella strains isolated from poultry were identified as such (Table S01). From poultry 79 S. Java strains were isolated. All harboured the phenotype typical for the clone, which is characterized by high level resistance against trimethoprim. This occurs frequently in combination with acquired resistance against the quinolones and third generation cephalosporins cefotaxime and ceftazidime. The majority of S. Java isolates from poultry expressed non-wild type susceptibility to ciprofloxacin (51.4%) and nalidixic acid (45.7%); Resistance to cefotaxime (ESBL-producers) was detected in 11.4% of the isolates from poultry, which is slightly less than in previous years (13% in 2010/2011, 22.9% in 2009 and 20.9 in 2008). A number of S. Java strains were isolated from human infections in 2012 (8). All strains tested were trimethoprim susceptible and therefore not related to the clone spreading in Dutch poultry and probably travel related.
Salmonella in raw meats, herbs and spices at retailResistance data in meat are presented for poultry meat only, because in beef and pork the number of isolates examined are too small to provide an accurate estimate (Table S06, Figure S03). This year, resistance data concerning S. enterica from herbs and spices were also
included. As expected, in poultry meat samples S. Java was the most prevalent Salmonella serovar encountered (33%). Other serovars regularly included were S. Infantis (28%), S. Heidelberg (15%), S. Enteritidis (8%), S. Minnesota (5%)and S. Typhimurium (2%).As expected, resistance profiles of S. Java isolates were similar to those from life animals. Noteworthy in poultry meat isolates other than S. Java is the high level of resistance against cefotaxime and ceftazidime, mainly associated with the presence of S. Heidelberg. Also resistance to the quinolones was relatively high, which can mainly be attributed to the presence of S. Heidelberg and S. Infantis. A variety of serovars was isolated from herbs and spices. The most prevalent serovars were S. Weltevreden (14%) and S. Caracas (10%) isolated from
Salmonella Java
Resis
tance
(%
)
0
20
40
60
80
100
ampicillin cefotaxime gentamicin
kanamycin streptomycin tetracycline sulfamethoxazole
trimethoprim ciprofloxacin nalidixic acid chloramphenicolflorfenicol
'99(16)
'00(45)
'01(74)
'02(124)
'03(149)
'04(33)
'05(19)
'06(69)
'07(141)
'08(215)
'09(88)
'10(78)
'11(70)
'12(70)
Humans99/11(81)
ceftazidime
colistin
Figure S03. Trends in resistance (%) of S. Paratyphi B var. Java isolatedfrom poultry in 2012 and humans (Separate data on the rightindicate all human S. Java isolates from 1999 – 2012).
Table S06. Resistance (%) of Salmonella enterica isolated from raw meats from poultry, other raw meat sources and herbs/spices in 2012.
poultry meat S. JavaN = 32
poultry meat other serovars
N = 65
other raw meat sourcesN = 84
herbs/spicesN = 29
Ampicillin 46.9 30.8 27.4 7Cefotaxime 15.6 28 1.2 0.0Ceftazidime 15.6 27.7 1.2 0.0Gentamicin 6.3 1.5 3.6 0.0Kanamycin 15.6 4.6 4.8 0.0Streptomycin 59.4 29.2 29.8 6.9Tetracycline 12.5 60.0 32.1 13.8Sulfamethoxazole 50.0 61.5 45.2 24.1Trimethoprim 100 20.0 16.7 6.9Ciprofloxacin 43.8 66.2 8.3 10Nalidixic acid 43.8 63 7.1 6.9Chloramphenicol 12.5 10.8 2.4 3.4Florfenicol 9.4 3.1 2.4 3.4
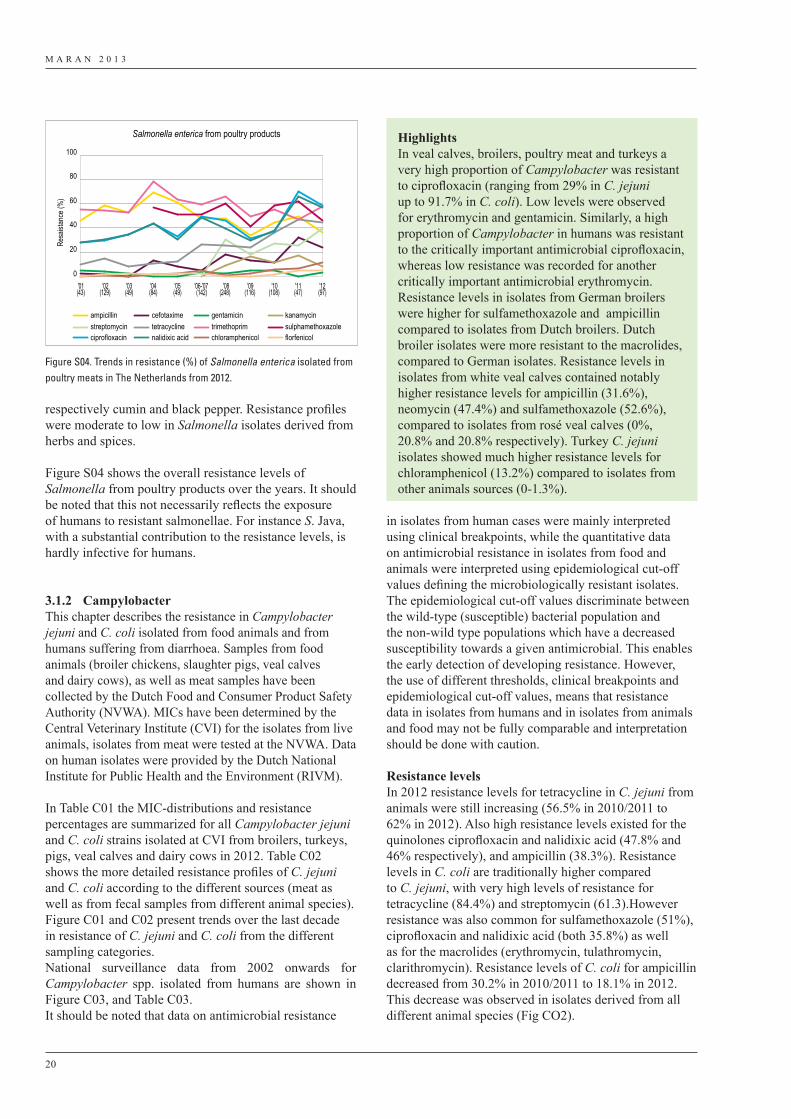
M A R A N 2 0 1 3
20
respectively cumin and black pepper. Resistance profiles were moderate to low in Salmonella isolates derived from herbs and spices.
Figure S04 shows the overall resistance levels of Salmonella from poultry products over the years. It should be noted that this not necessarily reflects the exposure of humans to resistant salmonellae. For instance S. Java, with a substantial contribution to the resistance levels, is hardly infective for humans.
3.1.2 CampylobacterThis chapter describes the resistance in Campylobacter jejuni and C. coli isolated from food animals and from humans suffering from diarrhoea. Samples from food animals (broiler chickens, slaughter pigs, veal calves and dairy cows), as well as meat samples have been collected by the Dutch Food and Consumer Product Safety Authority (NVWA). MICs have been determined by the Central Veterinary Institute (CVI) for the isolates from live animals, isolates from meat were tested at the NVWA. Data on human isolates were provided by the Dutch National Institute for Public Health and the Environment (RIVM).
In Table C01 the MIC-distributions and resistance percentages are summarized for all Campylobacter jejuni and C. coli strains isolated at CVI from broilers, turkeys, pigs, veal calves and dairy cows in 2012. Table C02 shows the more detailed resistance profiles of C. jejuni and C. coli according to the different sources (meat as well as from fecal samples from different animal species). Figure C01 and C02 present trends over the last decade in resistance of C. jejuni and C. coli from the different sampling categories. National surveillance data from 2002 onwards for Campylobacter spp. isolated from humans are shown in Figure C03, and Table C03.It should be noted that data on antimicrobial resistance
in isolates from human cases were mainly interpreted using clinical breakpoints, while the quantitative data on antimicrobial resistance in isolates from food and animals were interpreted using epidemiological cut-off values defining the microbiologically resistant isolates. The epidemiological cut-off values discriminate between the wild-type (susceptible) bacterial population and the non-wild type populations which have a decreased susceptibility towards a given antimicrobial. This enables the early detection of developing resistance. However, the use of different thresholds, clinical breakpoints and epidemiological cut-off values, means that resistance data in isolates from humans and in isolates from animals and food may not be fully comparable and interpretation should be done with caution.
Resistance levels In 2012 resistance levels for tetracycline in C. jejuni from animals were still increasing (56.5% in 2010/2011 to 62% in 2012). Also high resistance levels existed for the quinolones ciprofloxacin and nalidixic acid (47.8% and 46% respectively), and ampicillin (38.3%). Resistance levels in C. coli are traditionally higher compared to C. jejuni, with very high levels of resistance for tetracycline (84.4%) and streptomycin (61.3).However resistance was also common for sulfamethoxazole (51%), ciprofloxacin and nalidixic acid (both 35.8%) as well as for the macrolides (erythromycin, tulathromycin, clarithromycin). Resistance levels of C. coli for ampicillin decreased from 30.2% in 2010/2011 to 18.1% in 2012. This decrease was observed in isolates derived from all different animal species (Fig CO2).
Salmonella enterica from poultry products
Resa
istan
ce (%
)
0
20
40
60
80
100
ampicillin cefotaxime gentamicin kanamycinstreptomycin tetracycline trimethoprim sulphamethoxazoleciprofloxacin nalidixic acid chloramphenicol florfenicol
'01(43)
'02(129)
'03(49)
'04(84)
'05(49)
'06-'07(142)
'08(248)
'09(116)
'10(108)
'11(47)
'12(97)
Figure S04. Trends in resistance (%) of Salmonella enterica isolated frompoultry meats in The Netherlands from 2012.
HighlightsIn veal calves, broilers, poultry meat and turkeys a very high proportion of Campylobacter was resistant to ciprofloxacin (ranging from 29% in C. jejuni up to 91.7% in C. coli). Low levels were observed for erythromycin and gentamicin. Similarly, a high proportion of Campylobacter in humans was resistant to the critically important antimicrobial ciprofloxacin, whereas low resistance was recorded for another critically important antimicrobial erythromycin. Resistance levels in isolates from German broilers were higher for sulfamethoxazole and ampicillin compared to isolates from Dutch broilers. Dutch broiler isolates were more resistant to the macrolides, compared to German isolates. Resistance levels in isolates from white veal calves contained notably higher resistance levels for ampicillin (31.6%), neomycin (47.4%) and sulfamethoxazole (52.6%), compared to isolates from rosé veal calves (0%, 20.8% and 20.8% respectively). Turkey C. jejuni isolates showed much higher resistance levels for chloramphenicol (13.2%) compared to isolates from other animals sources (0-1.3%).
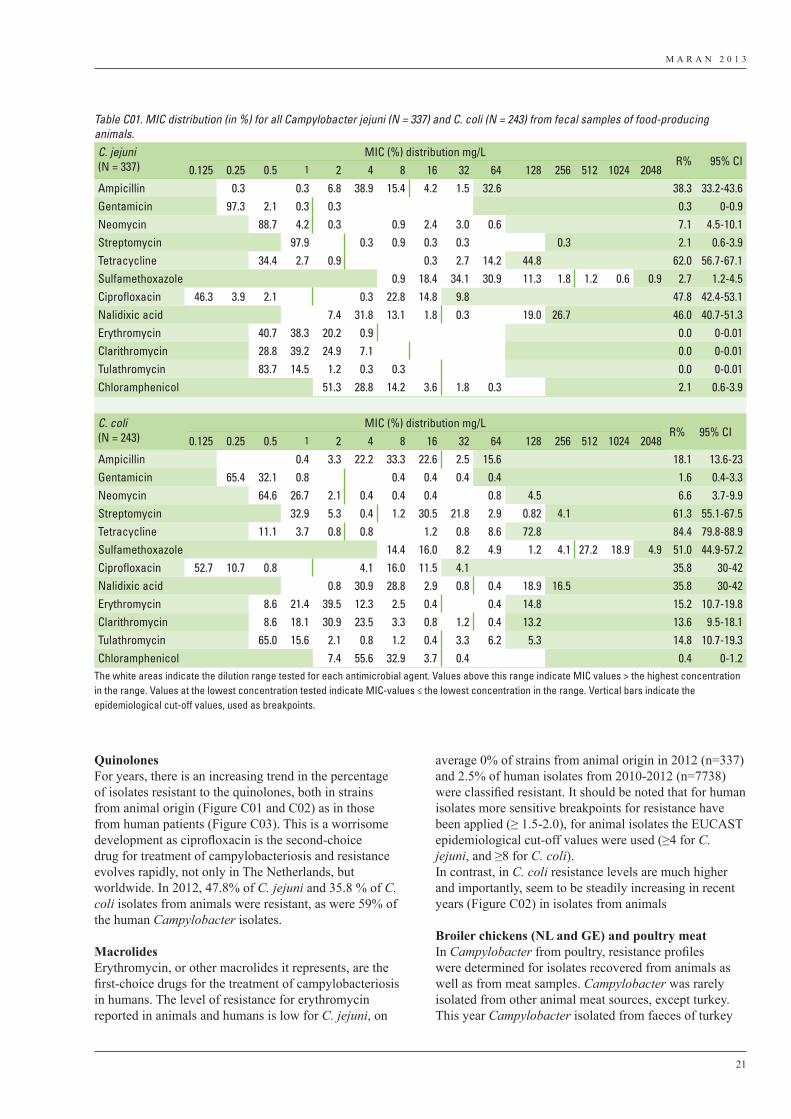
M A R A N 2 0 1 3
21
QuinolonesFor years, there is an increasing trend in the percentage of isolates resistant to the quinolones, both in strains from animal origin (Figure C01 and C02) as in those from human patients (Figure C03). This is a worrisome development as ciprofloxacin is the second-choice drug for treatment of campylobacteriosis and resistance evolves rapidly, not only in The Netherlands, but worldwide. In 2012, 47.8% of C. jejuni and 35.8 % of C. coli isolates from animals were resistant, as were 59% of the human Campylobacter isolates.
MacrolidesErythromycin, or other macrolides it represents, are the first-choice drugs for the treatment of campylobacteriosis in humans. The level of resistance for erythromycin reported in animals and humans is low for C. jejuni, on
average 0% of strains from animal origin in 2012 (n=337) and 2.5% of human isolates from 2010-2012 (n=7738) were classified resistant. It should be noted that for human isolates more sensitive breakpoints for resistance have been applied (≥ 1.5-2.0), for animal isolates the EUCAST epidemiological cut-off values were used (≥4 for C. jejuni, and ≥8 for C. coli).In contrast, in C. coli resistance levels are much higher and importantly, seem to be steadily increasing in recent years (Figure C02) in isolates from animals
Broiler chickens (NL and GE) and poultry meatIn Campylobacter from poultry, resistance profiles were determined for isolates recovered from animals as well as from meat samples. Campylobacter was rarely isolated from other animal meat sources, except turkey. This year Campylobacter isolated from faeces of turkey
Table C01. MIC distribution (in %) for all Campylobacter jejuni (N = 337) and C. coli (N = 243) from fecal samples of food-producing animals.C. jejuni (N = 337)
MIC (%) distribution mg/LR% 95% CI
0.125 0.25 0.5 1 2 4 8 16 32 64 128 256 512 1024 2048Ampicillin 0.3 0.3 6.8 38.9 15.4 4.2 1.5 32.6 38.3 33.2-43.6Gentamicin 97.3 2.1 0.3 0.3 0.3 0-0.9Neomycin 88.7 4.2 0.3 0.9 2.4 3.0 0.6 7.1 4.5-10.1Streptomycin 97.9 0.3 0.9 0.3 0.3 0.3 2.1 0.6-3.9Tetracycline 34.4 2.7 0.9 0.3 2.7 14.2 44.8 62.0 56.7-67.1Sulfamethoxazole 0.9 18.4 34.1 30.9 11.3 1.8 1.2 0.6 0.9 2.7 1.2-4.5Ciprofloxacin 46.3 3.9 2.1 0.3 22.8 14.8 9.8 47.8 42.4-53.1Nalidixic acid 7.4 31.8 13.1 1.8 0.3 19.0 26.7 46.0 40.7-51.3Erythromycin 40.7 38.3 20.2 0.9 0.0 0-0.01Clarithromycin 28.8 39.2 24.9 7.1 0.0 0-0.01Tulathromycin 83.7 14.5 1.2 0.3 0.3 0.0 0-0.01Chloramphenicol 51.3 28.8 14.2 3.6 1.8 0.3 2.1 0.6-3.9
C. coli(N = 243)
MIC (%) distribution mg/LR% 95% CI
0.125 0.25 0.5 1 2 4 8 16 32 64 128 256 512 1024 2048Ampicillin 0.4 3.3 22.2 33.3 22.6 2.5 15.6 18.1 13.6-23Gentamicin 65.4 32.1 0.8 0.4 0.4 0.4 0.4 1.6 0.4-3.3Neomycin 64.6 26.7 2.1 0.4 0.4 0.4 0.8 4.5 6.6 3.7-9.9Streptomycin 32.9 5.3 0.4 1.2 30.5 21.8 2.9 0.82 4.1 61.3 55.1-67.5Tetracycline 11.1 3.7 0.8 0.8 1.2 0.8 8.6 72.8 84.4 79.8-88.9Sulfamethoxazole 14.4 16.0 8.2 4.9 1.2 4.1 27.2 18.9 4.9 51.0 44.9-57.2Ciprofloxacin 52.7 10.7 0.8 4.1 16.0 11.5 4.1 35.8 30-42Nalidixic acid 0.8 30.9 28.8 2.9 0.8 0.4 18.9 16.5 35.8 30-42Erythromycin 8.6 21.4 39.5 12.3 2.5 0.4 0.4 14.8 15.2 10.7-19.8Clarithromycin 8.6 18.1 30.9 23.5 3.3 0.8 1.2 0.4 13.2 13.6 9.5-18.1Tulathromycin 65.0 15.6 2.1 0.8 1.2 0.4 3.3 6.2 5.3 14.8 10.7-19.3Chloramphenicol 7.4 55.6 32.9 3.7 0.4 0.4 0-1.2
The white areas indicate the dilution range tested for each antimicrobial agent. Values above this range indicate MIC values > the highest concentration in the range. Values at the lowest concentration tested indicate MIC-values ≤ the lowest concentration in the range. Vertical bars indicate the epidemiological cut-off values, used as breakpoints.
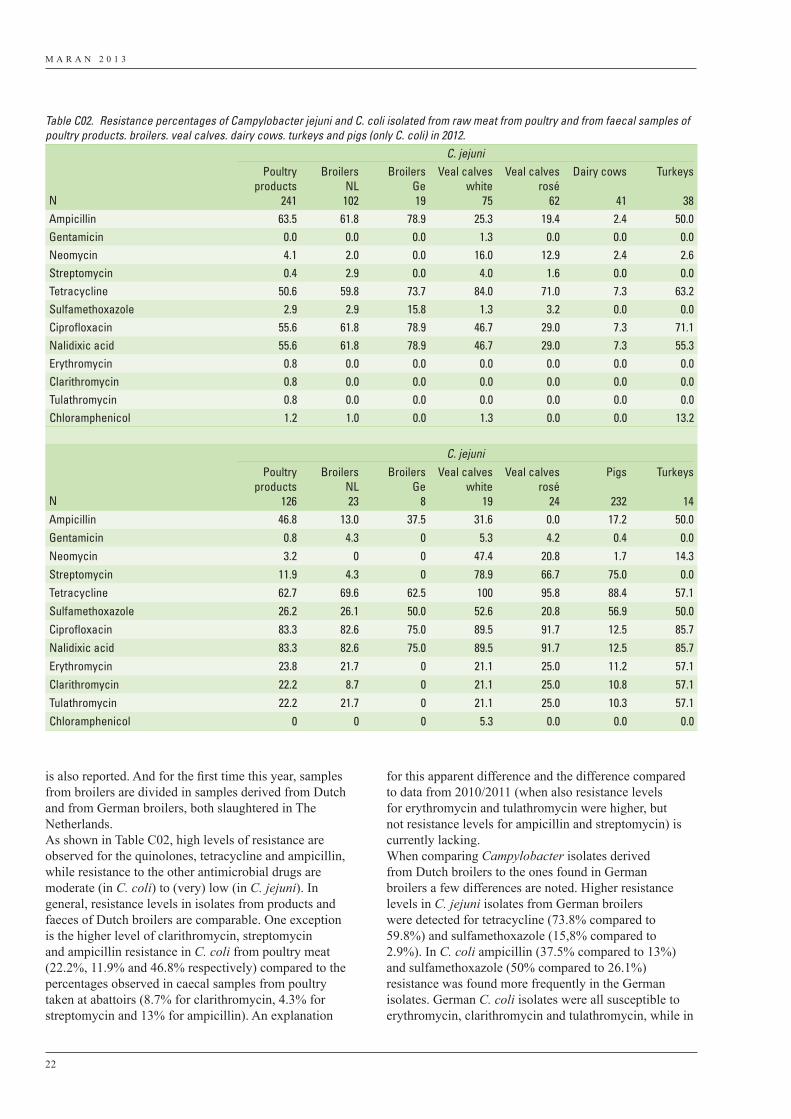
M A R A N 2 0 1 3
22
is also reported. And for the first time this year, samples from broilers are divided in samples derived from Dutch and from German broilers, both slaughtered in The Netherlands.As shown in Table C02, high levels of resistance are observed for the quinolones, tetracycline and ampicillin, while resistance to the other antimicrobial drugs are moderate (in C. coli) to (very) low (in C. jejuni). In general, resistance levels in isolates from products and faeces of Dutch broilers are comparable. One exception is the higher level of clarithromycin, streptomycin and ampicillin resistance in C. coli from poultry meat (22.2%, 11.9% and 46.8% respectively) compared to the percentages observed in caecal samples from poultry taken at abattoirs (8.7% for clarithromycin, 4.3% for streptomycin and 13% for ampicillin). An explanation
for this apparent difference and the difference compared to data from 2010/2011 (when also resistance levels for erythromycin and tulathromycin were higher, but not resistance levels for ampicillin and streptomycin) is currently lacking. When comparing Campylobacter isolates derived from Dutch broilers to the ones found in German broilers a few differences are noted. Higher resistance levels in C. jejuni isolates from German broilers were detected for tetracycline (73.8% compared to 59.8%) and sulfamethoxazole (15,8% compared to 2.9%). In C. coli ampicillin (37.5% compared to 13%) and sulfamethoxazole (50% compared to 26.1%) resistance was found more frequently in the German isolates. German C. coli isolates were all susceptible to erythromycin, clarithromycin and tulathromycin, while in
Table C02. Resistance percentages of Campylobacter jejuni and C. coli isolated from raw meat from poultry and from faecal samples of poultry products. broilers. veal calves. dairy cows. turkeys and pigs (only C. coli) in 2012.
C. jejuni
N
Poultryproducts
241
BroilersNL102
Broilers Ge19
Veal calves white
75
Veal calves rosé
62
Dairy cows
41
Turkeys
38Ampicillin 63.5 61.8 78.9 25.3 19.4 2.4 50.0Gentamicin 0.0 0.0 0.0 1.3 0.0 0.0 0.0Neomycin 4.1 2.0 0.0 16.0 12.9 2.4 2.6Streptomycin 0.4 2.9 0.0 4.0 1.6 0.0 0.0Tetracycline 50.6 59.8 73.7 84.0 71.0 7.3 63.2Sulfamethoxazole 2.9 2.9 15.8 1.3 3.2 0.0 0.0Ciprofloxacin 55.6 61.8 78.9 46.7 29.0 7.3 71.1Nalidixic acid 55.6 61.8 78.9 46.7 29.0 7.3 55.3Erythromycin 0.8 0.0 0.0 0.0 0.0 0.0 0.0Clarithromycin 0.8 0.0 0.0 0.0 0.0 0.0 0.0Tulathromycin 0.8 0.0 0.0 0.0 0.0 0.0 0.0Chloramphenicol 1.2 1.0 0.0 1.3 0.0 0.0 13.2
C. jejuni
N
Poultryproducts
126
BroilersNL23
Broilers Ge
8
Veal calves white
19
Veal calves rosé
24
Pigs
232
Turkeys
14Ampicillin 46.8 13.0 37.5 31.6 0.0 17.2 50.0Gentamicin 0.8 4.3 0 5.3 4.2 0.4 0.0Neomycin 3.2 0 0 47.4 20.8 1.7 14.3Streptomycin 11.9 4.3 0 78.9 66.7 75.0 0.0Tetracycline 62.7 69.6 62.5 100 95.8 88.4 57.1Sulfamethoxazole 26.2 26.1 50.0 52.6 20.8 56.9 50.0Ciprofloxacin 83.3 82.6 75.0 89.5 91.7 12.5 85.7Nalidixic acid 83.3 82.6 75.0 89.5 91.7 12.5 85.7Erythromycin 23.8 21.7 0 21.1 25.0 11.2 57.1Clarithromycin 22.2 8.7 0 21.1 25.0 10.8 57.1Tulathromycin 22.2 21.7 0 21.1 25.0 10.3 57.1Chloramphenicol 0 0 0 5.3 0.0 0.0 0.0
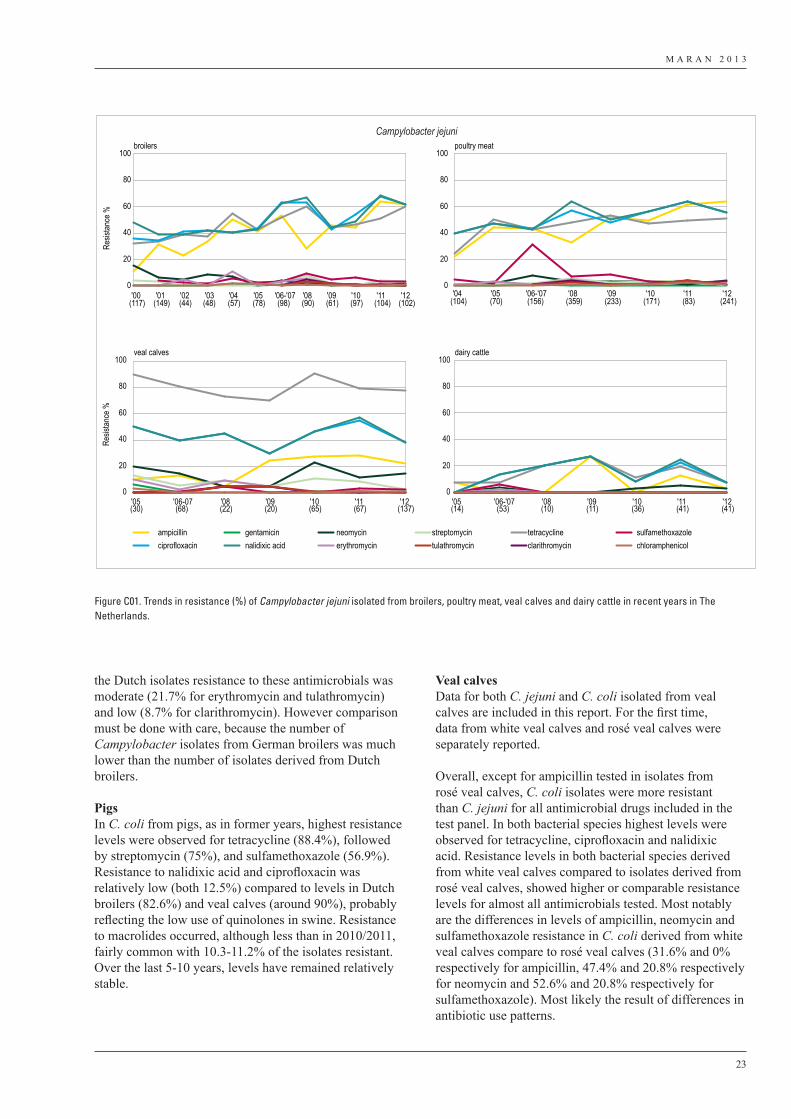
M A R A N 2 0 1 3
23
the Dutch isolates resistance to these antimicrobials was moderate (21.7% for erythromycin and tulathromycin) and low (8.7% for clarithromycin). However comparison must be done with care, because the number of Campylobacter isolates from German broilers was much lower than the number of isolates derived from Dutch broilers.
PigsIn C. coli from pigs, as in former years, highest resistance levels were observed for tetracycline (88.4%), followed by streptomycin (75%), and sulfamethoxazole (56.9%). Resistance to nalidixic acid and ciprofloxacin was relatively low (both 12.5%) compared to levels in Dutch broilers (82.6%) and veal calves (around 90%), probably reflecting the low use of quinolones in swine. Resistance to macrolides occurred, although less than in 2010/2011, fairly common with 10.3-11.2% of the isolates resistant. Over the last 5-10 years, levels have remained relatively stable.
Veal calvesData for both C. jejuni and C. coli isolated from veal calves are included in this report. For the first time, data from white veal calves and rosé veal calves were separately reported.
Overall, except for ampicillin tested in isolates from rosé veal calves, C. coli isolates were more resistant than C. jejuni for all antimicrobial drugs included in the test panel. In both bacterial species highest levels were observed for tetracycline, ciprofloxacin and nalidixic acid. Resistance levels in both bacterial species derived from white veal calves compared to isolates derived from rosé veal calves, showed higher or comparable resistance levels for almost all antimicrobials tested. Most notably are the differences in levels of ampicillin, neomycin and sulfamethoxazole resistance in C. coli derived from white veal calves compare to rosé veal calves (31.6% and 0% respectively for ampicillin, 47.4% and 20.8% respectively for neomycin and 52.6% and 20.8% respectively for sulfamethoxazole). Most likely the result of differences in antibiotic use patterns.
broilers poultry meat
0
20
40
60
80
100
0
20
40
60
80
100
0
20
40
60
80
100
0
20
40
60
80
100
Resis
tance
%
veal calves
Resis
tance
%
dairy cattle
ampicillin gentamicin neomycin streptomycin tetracycline sulfamethoxazoleciprofloxacin nalidixic acid erythromycin tulathromycin clarithromycin chloramphenicol
Campylobacter jejuni
'00(117)
'01(149)
'02(44)
'03(48)
'04(57)
'05(78)
'06-'07(98)
'08(90)
'09(61)
'10(97)
'11(104)
'12(102)
'04(104)
'05(70)
'06-'07(156)
'08(359)
'09(233)
'10(171)
'11(83)
'12(241)
'05(30)
'06-07(68)
'08(22)
'09(20)
'10(65)
'11(67)
'12(137)
'05(14)
'06-'07(53)
'08(10)
'09(11)
'10(36)
'11(41)
'12(41)
Figure C01. Trends in resistance (%) of Campylobacter jejuni isolated from broilers, poultry meat, veal calves and dairy cattle in recent years in The Netherlands.
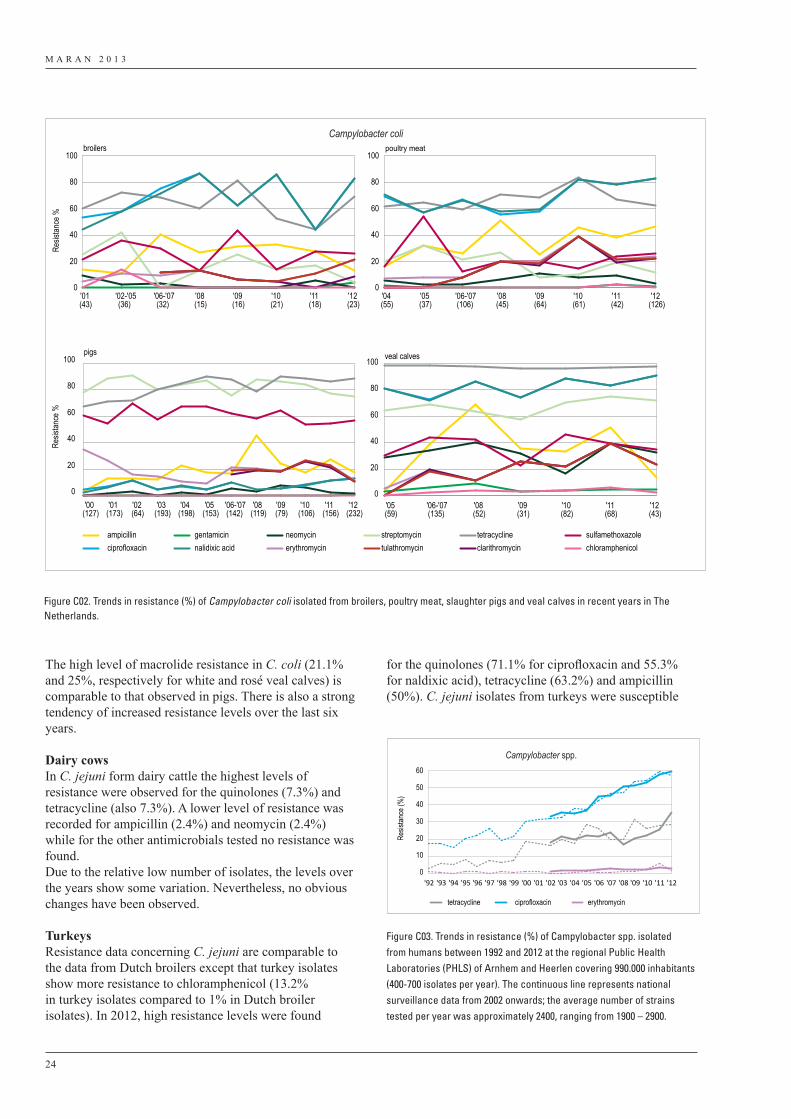
M A R A N 2 0 1 3
24
The high level of macrolide resistance in C. coli (21.1% and 25%, respectively for white and rosé veal calves) is comparable to that observed in pigs. There is also a strong tendency of increased resistance levels over the last six years.
Dairy cowsIn C. jejuni form dairy cattle the highest levels of resistance were observed for the quinolones (7.3%) and tetracycline (also 7.3%). A lower level of resistance was recorded for ampicillin (2.4%) and neomycin (2.4%) while for the other antimicrobials tested no resistance was found.Due to the relative low number of isolates, the levels over the years show some variation. Nevertheless, no obvious changes have been observed.
TurkeysResistance data concerning C. jejuni are comparable to the data from Dutch broilers except that turkey isolates show more resistance to chloramphenicol (13.2% in turkey isolates compared to 1% in Dutch broiler isolates). In 2012, high resistance levels were found
for the quinolones (71.1% for ciprofloxacin and 55.3% for naldixic acid), tetracycline (63.2%) and ampicillin (50%). C. jejuni isolates from turkeys were susceptible
0
10
20
30
40
50
60
Resis
tance
(%)
tetracycline ciprofloxacin erythromycin
Campylobacter spp.
'92 '93 '94 '95 '96 '97 '98 '99 '00 '01 '02 '03 '04 '05 '06 '07 '08 '09 '10 '11 '12
Figure C03. Trends in resistance (%) of Campylobacter spp. isolatedfrom humans between 1992 and 2012 at the regional Public HealthLaboratories (PHLS) of Arnhem and Heerlen covering 990.000 inhabitants(400-700 isolates per year). The continuous line represents nationalsurveillance data from 2002 onwards; the average number of strainstested per year was approximately 2400, ranging from 1900 – 2900.
0
20
40
60
80
100
0
20
40
60
80
100
0
20
40
60
80
100
0
20
40
60
80
100
Resis
tance
%Re
sistan
ce %
broilers poultry meat
veal calvespigs
ampicillin gentamicin neomycin streptomycin tetracycline sulfamethoxazoleciprofloxacin nalidixic acid erythromycin tulathromycin clarithromycin chloramphenicol
Campylobacter coli
'00(127)
'01(173)
'02(64)
'03(193)
'04(198)
'05(153)
'06-'07(142)
'08(119)
'09(79)
'10(106)
'11(156)
'12(232)
'05(59)
'06-'07(135)
'08(52)
'09(31)
'10(82)
'11(68)
'12(43)
'01(43)
'02-'05(36)
'06-'07(32)
'08(15)
'09(16)
'10(21)
'11(18)
'12(23)
'04(55)
'05(37)
'06-'07(106)
'08(45)
'09(64)
'10(61)
'11(42)
'12(126)
Figure C02. Trends in resistance (%) of Campylobacter coli isolated from broilers, poultry meat, slaughter pigs and veal calves in recent years in The Netherlands.
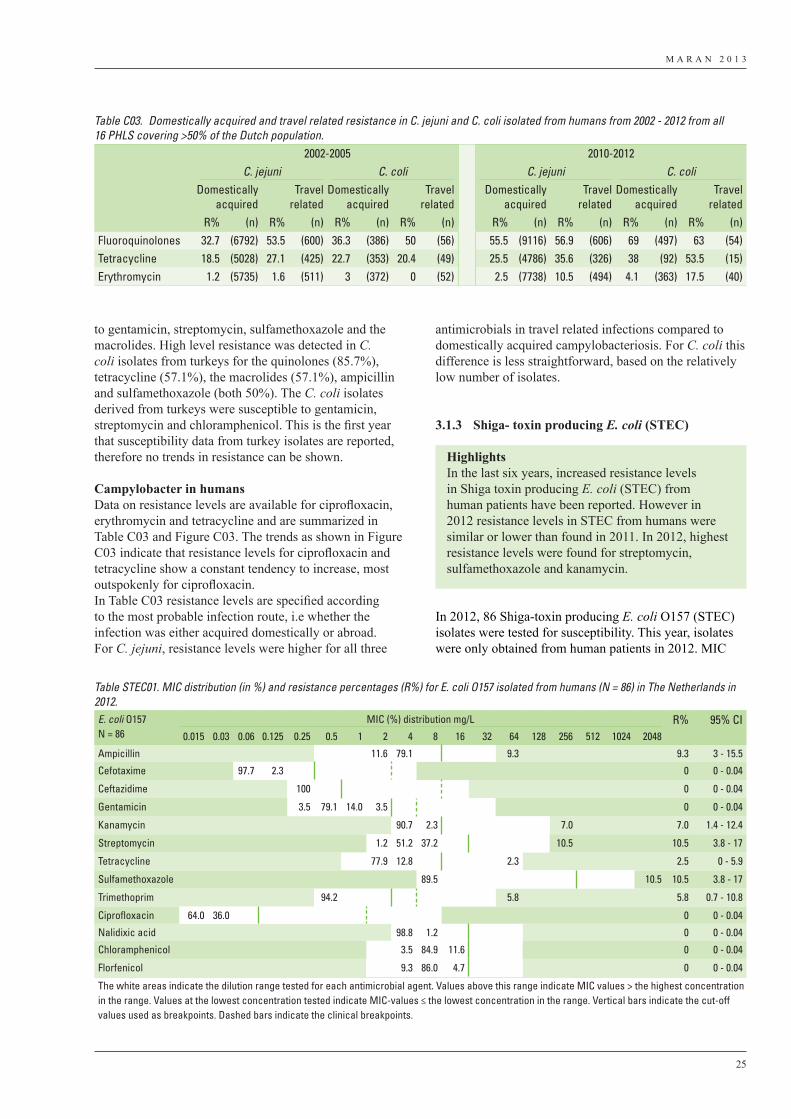
M A R A N 2 0 1 3
25
to gentamicin, streptomycin, sulfamethoxazole and the macrolides. High level resistance was detected in C. coli isolates from turkeys for the quinolones (85.7%), tetracycline (57.1%), the macrolides (57.1%), ampicillin and sulfamethoxazole (both 50%). The C. coli isolates derived from turkeys were susceptible to gentamicin, streptomycin and chloramphenicol. This is the first year that susceptibility data from turkey isolates are reported, therefore no trends in resistance can be shown.
Campylobacter in humans Data on resistance levels are available for ciprofloxacin, erythromycin and tetracycline and are summarized in Table C03 and Figure C03. The trends as shown in Figure C03 indicate that resistance levels for ciprofloxacin and tetracycline show a constant tendency to increase, most outspokenly for ciprofloxacin.In Table C03 resistance levels are specified according to the most probable infection route, i.e whether the infection was either acquired domestically or abroad. For C. jejuni, resistance levels were higher for all three
antimicrobials in travel related infections compared to domestically acquired campylobacteriosis. For C. coli this difference is less straightforward, based on the relatively low number of isolates.
3.1.3 Shiga- toxin producing E. coli (STEC)
In 2012, 86 Shiga-toxin producing E. coli O157 (STEC) isolates were tested for susceptibility. This year, isolates were only obtained from human patients in 2012. MIC
HighlightsIn the last six years, increased resistance levels in Shiga toxin producing E. coli (STEC) from human patients have been reported. However in 2012 resistance levels in STEC from humans were similar or lower than found in 2011. In 2012, highest resistance levels were found for streptomycin, sulfamethoxazole and kanamycin.
Table STEC01. MIC distribution (in %) and resistance percentages (R%) for E. coli O157 isolated from humans (N = 86) in The Netherlands in 2012.E. coli O157N = 86
MIC (%) distribution mg/L R% 95% CI0.015 0.03 0.06 0.125 0.25 0.5 1 2 4 8 16 32 64 128 256 512 1024 2048
Ampicillin 11.6 79.1 9.3 9.3 3 - 15.5
Cefotaxime 97.7 2.3 0 0 - 0.04
Ceftazidime 100 0 0 - 0.04
Gentamicin 3.5 79.1 14.0 3.5 0 0 - 0.04
Kanamycin 90.7 2.3 7.0 7.0 1.4 - 12.4
Streptomycin 1.2 51.2 37.2 10.5 10.5 3.8 - 17
Tetracycline 77.9 12.8 2.3 2.5 0 - 5.9
Sulfamethoxazole 89.5 10.5 10.5 3.8 - 17
Trimethoprim 94.2 5.8 5.8 0.7 - 10.8
Ciprofloxacin 64.0 36.0 0 0 - 0.04
Nalidixic acid 98.8 1.2 0 0 - 0.04
Chloramphenicol 3.5 84.9 11.6 0 0 - 0.04
Florfenicol 9.3 86.0 4.7 0 0 - 0.04
The white areas indicate the dilution range tested for each antimicrobial agent. Values above this range indicate MIC values > the highest concentration in the range. Values at the lowest concentration tested indicate MIC-values ≤ the lowest concentration in the range. Vertical bars indicate the cut-off values used as breakpoints. Dashed bars indicate the clinical breakpoints.
Table C03. Domestically acquired and travel related resistance in C. jejuni and C. coli isolated from humans from 2002 - 2012 from all 16 PHLS covering >50% of the Dutch population.
2002-2005 2010-2012C. jejuni C. coli C. jejuni C. coli
Domestically acquired
Travel related
Domestically acquired
Travel related
Domestically acquired
Travel related
Domestically acquired
Travel related
R% (n) R% (n) R% (n) R% (n) R% (n) R% (n) R% (n) R% (n)Fluoroquinolones 32.7 (6792) 53.5 (600) 36.3 (386) 50 (56) 55.5 (9116) 56.9 (606) 69 (497) 63 (54)Tetracycline 18.5 (5028) 27.1 (425) 22.7 (353) 20.4 (49) 25.5 (4786) 35.6 (326) 38 (92) 53.5 (15)Erythromycin 1.2 (5735) 1.6 (511) 3 (372) 0 (52) 2.5 (7738) 10.5 (494) 4.1 (363) 17.5 (40)
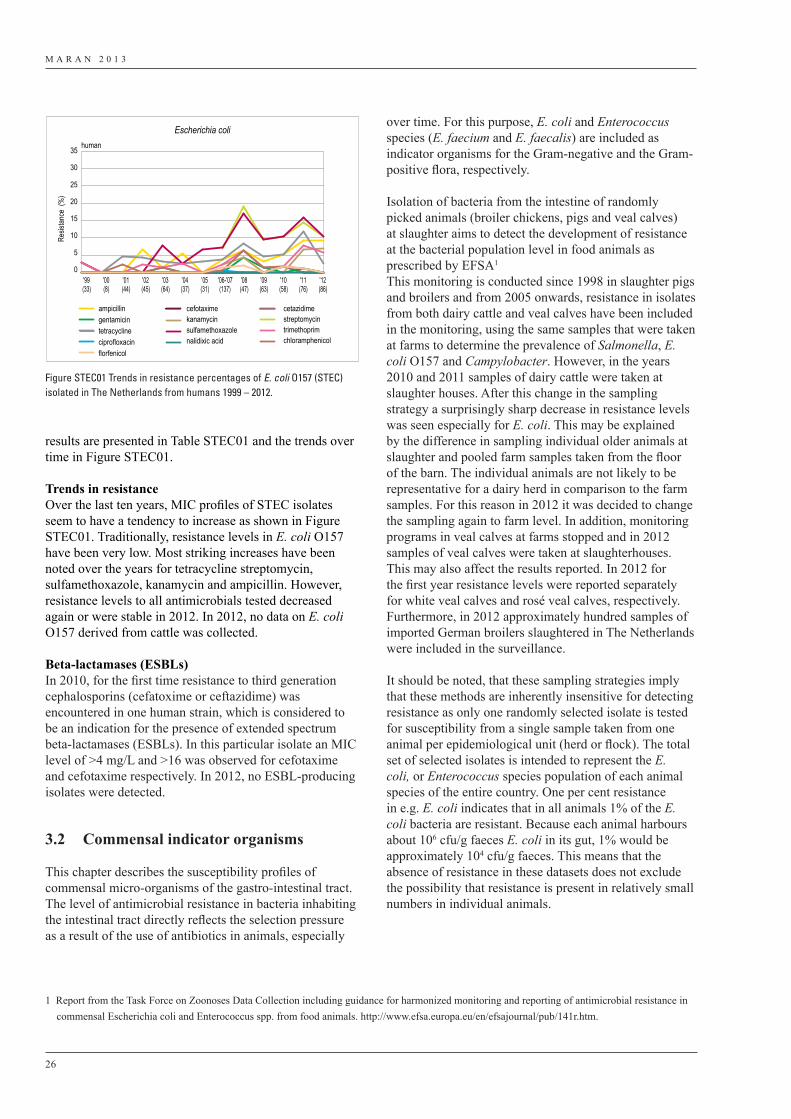
M A R A N 2 0 1 3
26
results are presented in Table STEC01 and the trends over time in Figure STEC01.
Trends in resistanceOver the last ten years, MIC profiles of STEC isolates seem to have a tendency to increase as shown in Figure STEC01. Traditionally, resistance levels in E. coli O157 have been very low. Most striking increases have been noted over the years for tetracycline streptomycin, sulfamethoxazole, kanamycin and ampicillin. However, resistance levels to all antimicrobials tested decreased again or were stable in 2012. In 2012, no data on E. coli O157 derived from cattle was collected.
Beta-lactamases (ESBLs)In 2010, for the first time resistance to third generation cephalosporins (cefatoxime or ceftazidime) was encountered in one human strain, which is considered to be an indication for the presence of extended spectrum beta-lactamases (ESBLs). In this particular isolate an MIC level of >4 mg/L and >16 was observed for cefotaxime and cefotaxime respectively. In 2012, no ESBL-producing isolates were detected.
3.2 Commensal indicator organisms
This chapter describes the susceptibility profiles of commensal micro-organisms of the gastro-intestinal tract. The level of antimicrobial resistance in bacteria inhabiting the intestinal tract directly reflects the selection pressure as a result of the use of antibiotics in animals, especially
over time. For this purpose, E. coli and Enterococcus species (E. faecium and E. faecalis) are included as indicator organisms for the Gram-negative and the Gram-positive flora, respectively.
Isolation of bacteria from the intestine of randomly picked animals (broiler chickens, pigs and veal calves) at slaughter aims to detect the development of resistance at the bacterial population level in food animals as prescribed by EFSA1
This monitoring is conducted since 1998 in slaughter pigs and broilers and from 2005 onwards, resistance in isolates from both dairy cattle and veal calves have been included in the monitoring, using the same samples that were taken at farms to determine the prevalence of Salmonella, E. coli O157 and Campylobacter. However, in the years 2010 and 2011 samples of dairy cattle were taken at slaughter houses. After this change in the sampling strategy a surprisingly sharp decrease in resistance levels was seen especially for E. coli. This may be explained by the difference in sampling individual older animals at slaughter and pooled farm samples taken from the floor of the barn. The individual animals are not likely to be representative for a dairy herd in comparison to the farm samples. For this reason in 2012 it was decided to change the sampling again to farm level. In addition, monitoring programs in veal calves at farms stopped and in 2012 samples of veal calves were taken at slaughterhouses. This may also affect the results reported. In 2012 for the first year resistance levels were reported separately for white veal calves and rosé veal calves, respectively. Furthermore, in 2012 approximately hundred samples of imported German broilers slaughtered in The Netherlands were included in the surveillance.
It should be noted, that these sampling strategies imply that these methods are inherently insensitive for detecting resistance as only one randomly selected isolate is tested for susceptibility from a single sample taken from one animal per epidemiological unit (herd or flock). The total set of selected isolates is intended to represent the E. coli, or Enterococcus species population of each animal species of the entire country. One per cent resistance in e.g. E. coli indicates that in all animals 1% of the E. coli bacteria are resistant. Because each animal harbours about 106 cfu/g faeces E. coli in its gut, 1% would be approximately 104 cfu/g faeces. This means that the absence of resistance in these datasets does not exclude the possibility that resistance is present in relatively small numbers in individual animals.
Escherichia coli
Resis
tance
(%
)
human
ampicillin cefotaxime cetazidimegentamicin kanamycin streptomycintetracycline sulfamethoxazole trimethoprimciprofloxacin nalidixic acid chloramphenicolflorfenicol
0
5
10
15
20
25
30
35
'99(33)
'00(8)
'01(44)
'02(45)
'03(64)
'04(37)
'05(31)
'06-'07(137)
'08(47)
'09(63)
'10(58)
'11(76)
'12(86)
Figure STEC01 Trends in resistance percentages of E. coli O157 (STEC) isolated in The Netherlands from humans 1999 – 2012.
1 Report from the Task Force on Zoonoses Data Collection including guidance for harmonized monitoring and reporting of antimicrobial resistance in commensal Escherichia coli and Enterococcus spp. from food animals. http://www.efsa.europa.eu/en/efsajournal/pub/141r.htm.
M A R A N 2 0 1 3
27
3.2.1 Escherichia coli in faeces of food-animals
In this chapter information is presented on resistance in E. coli from food-producing animals in The Netherlands as indicator organisms for the occurrence and trends in resistance in Gram-negative bacteria present in the gastro-intestinal tract of food-producing animals. It should be noted that resistant isolates were defined by using epidemiological cut-off values for the interpretation of minimum inhibitory concentrations (MIC) values. Epidemiological cut-off values are in most cases lower than clinical breakpoints, and this can result in more non-wild type susceptible isolates being classified as resistant, depending on the MIC distribution.
Resistance levelsResistance levels of a total of 1328 E. coli isolates obtained from chickens, pigs, cattle, and turkeys, tested by the Central Veterinary Institute part of Wageningen
Highlights1. Among indicator (commensal) E. coli isolates
from meat and animals, resistance to ampicillin, streptomycin, tetracyclines, sulfonamides and trimethoprim was commonly detected in all host species except dairy cattle. Resistance to antimicrobials recognised as critically important in human medicine, such as the fluoroquinolones and third generation cephalosporins, was also observed in the indicator E. coli isolates. In isolates from most animal species and meat products a decrease in resistance levels was observed in 2012, most like as a result of the reductions in antibiotic usage.
2. The separate reporting of the resistance rates obtained from the two types of veal calf husbandries reveals noticeable lower levels of resistance in rosé veal calves compared to white veal calves for almost all antibiotics tested.
3. Reduced susceptibility to ciprofloxacin was highest for E. coli isolates from broilers (50.3% in Dutch broilers and 57.3% in German broilers respectively) and turkeys (48.5%). These continuous high proportions of isolates exhibiting resistance to ciprofloxacin are of concern.
4. Resistance to third-generation cephalosporins was further decreased in most animal species, but still observed in indicator E. coli from poultry and cattle varying from 0.4% in dairy cattle to 5.8% in broiler chickens. These reductions are most likely the result of the vast limitations in usage of cephalosporins in food producing animals.
UR, are presented as MIC-distributions in TableEco01 and as resistance percentages per animal species in Table Eco02. Trends in resistance levels over time according to host animal species are shown in Figure Eco01 and information on multidrug resistance is shown in Figure Eco02. Additionally, resistance levels of 610 E. coli isolates collected from meat, tested by the Dutch Food and Consumer Product Safety Authority, are presented in Table Eco03. Trends in resistance of E. coli isolated from poultry meat products, beef and pork in The Netherlands from the period 1998 to 2012 are presented in Figure Eco03.Table Eco02 shows that for most drugs or drug classes there are notable variations in resistance levels between the different animal species.In general, highest resistance is seen for ampicillin, tetracycline, streptomycin, trimethoprim and sulfamethoxazole. These include the drug classes that are most frequently used in veterinary medicine.
QuinolonesReduced susceptibility to quinolones was most commonly encountered in E. coli isolated from broiler chickens; approximately 50% of all isolates showed non-wild type susceptibility2 to nalidixic acid and ciprofloxacin. In 2012 high level resistance (MIC >1 mg/L) to ciprofloxacin in broiler chickens was detected in 4.5%, compared to 7.2 in 2010/2011, 5.4% in 2009 and 6.3% of the isolates in 2008.The percentage of E. coli with reduced susceptibility to ciprofloxacin was also high among turkey (48.5%) and white veal (9.6%) compared to 1.4% in rosé veal, 1.1% in pigs, and 0.4% in dairy cattle. This likely reflects the use of quinolones in various animal husbandry systems.
Beta-lactamases (ESBLs)Resistance to third generation cephalosporins, indicative of ESBL producing E. coli, was detected in most animal host species included in this survey. Reduced susceptibility levels for cefotaxime ranged from 0.4% in samples from dairy cattle to 5.8% in broiler chickens. The data demonstrate a further decrease of cefotaxime resistance in broilers which started in 2011 (Figure Eco01). Noticeable is the lack of cephalosporin resistance detected in randomly isolated indicator E. coli isolates from pigs. Among E. coli isolated from meat, resistance against third generation cephalosporins in poultry meat sharply decreased from 20.3% in 2011/2011 to 8.0% in 2012 (Figure Eco03) The decrease of cephalosporin resistant E. coli in poultry meat is considered to be a direct effect of the decrease of cephalosporin resistance
2 a micro-organism is defined as wild type (WT) for a species by the absence of acquired and mutational resistance mechanisms to the drug in question. Wild type micro-organisms may or may not respond clinically to antimicrobial treatment (http://www.eucast.org).
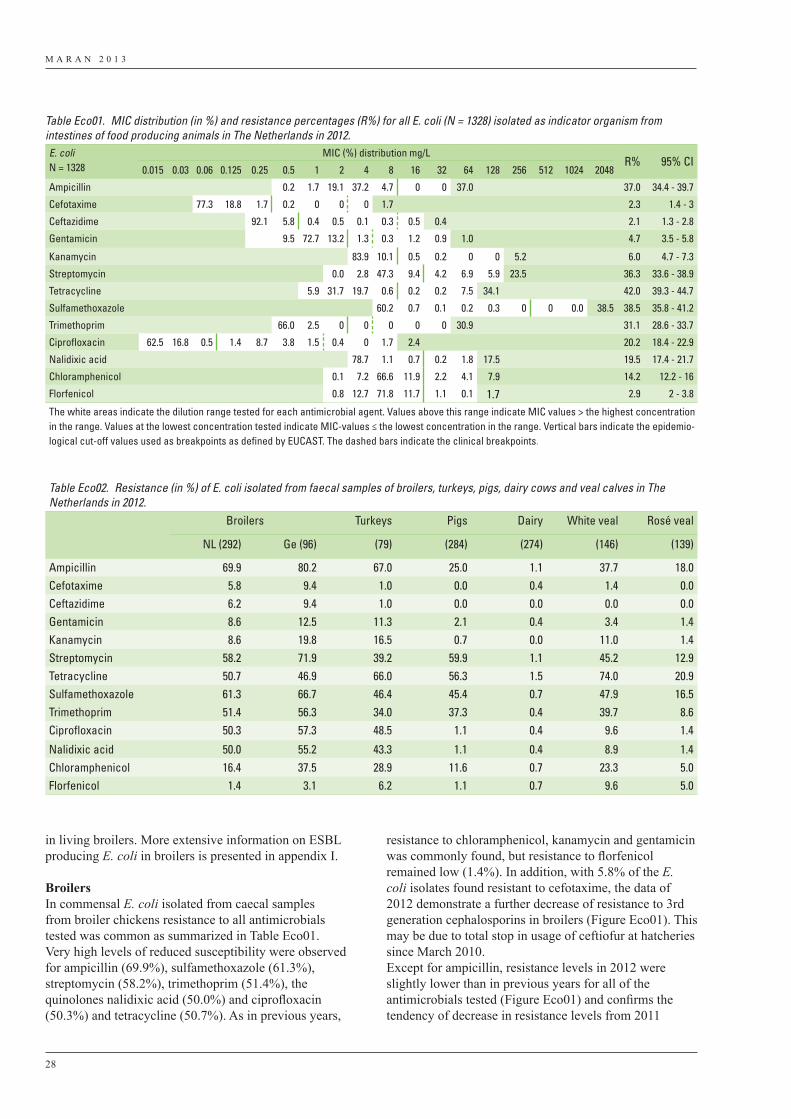
M A R A N 2 0 1 3
28
in living broilers. More extensive information on ESBL producing E. coli in broilers is presented in appendix I.
Broilers In commensal E. coli isolated from caecal samples from broiler chickens resistance to all antimicrobials tested was common as summarized in Table Eco01. Very high levels of reduced susceptibility were observed for ampicillin (69.9%), sulfamethoxazole (61.3%), streptomycin (58.2%), trimethoprim (51.4%), the quinolones nalidixic acid (50.0%) and ciprofloxacin (50.3%) and tetracycline (50.7%). As in previous years,
resistance to chloramphenicol, kanamycin and gentamicin was commonly found, but resistance to florfenicol remained low (1.4%). In addition, with 5.8% of the E. coli isolates found resistant to cefotaxime, the data of 2012 demonstrate a further decrease of resistance to 3rd generation cephalosporins in broilers (Figure Eco01). This may be due to total stop in usage of ceftiofur at hatcheries since March 2010.Except for ampicillin, resistance levels in 2012 were slightly lower than in previous years for all of the antimicrobials tested (Figure Eco01) and confirms the tendency of decrease in resistance levels from 2011
Table Eco01. MIC distribution (in %) and resistance percentages (R%) for all E. coli (N = 1328) isolated as indicator organism from intestines of food producing animals in The Netherlands in 2012.E. coliN = 1328
MIC (%) distribution mg/LR% 95% CI
0.015 0.03 0.06 0.125 0.25 0.5 1 2 4 8 16 32 64 128 256 512 1024 2048
Ampicillin 0.2 1.7 19.1 37.2 4.7 0 0 37.0 37.0 34.4 - 39.7
Cefotaxime 77.3 18.8 1.7 0.2 0 0 0 1.7 2.3 1.4 - 3
Ceftazidime 92.1 5.8 0.4 0.5 0.1 0.3 0.5 0.4 2.1 1.3 - 2.8
Gentamicin 9.5 72.7 13.2 1.3 0.3 1.2 0.9 1.0 4.7 3.5 - 5.8
Kanamycin 83.9 10.1 0.5 0.2 0 0 5.2 6.0 4.7 - 7.3
Streptomycin 0.0 2.8 47.3 9.4 4.2 6.9 5.9 23.5 36.3 33.6 - 38.9
Tetracycline 5.9 31.7 19.7 0.6 0.2 0.2 7.5 34.1 42.0 39.3 - 44.7
Sulfamethoxazole 60.2 0.7 0.1 0.2 0.3 0 0 0.0 38.5 38.5 35.8 - 41.2
Trimethoprim 66.0 2.5 0 0 0 0 0 30.9 31.1 28.6 - 33.7
Ciprofloxacin 62.5 16.8 0.5 1.4 8.7 3.8 1.5 0.4 0 1.7 2.4 20.2 18.4 - 22.9
Nalidixic acid 78.7 1.1 0.7 0.2 1.8 17.5 19.5 17.4 - 21.7
Chloramphenicol 0.1 7.2 66.6 11.9 2.2 4.1 7.9 14.2 12.2 - 16
Florfenicol 0.8 12.7 71.8 11.7 1.1 0.1 1.7 2.9 2 - 3.8
The white areas indicate the dilution range tested for each antimicrobial agent. Values above this range indicate MIC values > the highest concentration in the range. Values at the lowest concentration tested indicate MIC-values ≤ the lowest concentration in the range. Vertical bars indicate the epidemio-logical cut-off values used as breakpoints as defined by EUCAST. The dashed bars indicate the clinical breakpoints.
Table Eco02. Resistance (in %) of E. coli isolated from faecal samples of broilers, turkeys, pigs, dairy cows and veal calves in The Netherlands in 2012.
Broilers Turkeys Pigs Dairy White veal Rosé veal
NL (292) Ge (96) (79) (284) (274) (146) (139)
Ampicillin 69.9 80.2 67.0 25.0 1.1 37.7 18.0Cefotaxime 5.8 9.4 1.0 0.0 0.4 1.4 0.0Ceftazidime 6.2 9.4 1.0 0.0 0.0 0.0 0.0Gentamicin 8.6 12.5 11.3 2.1 0.4 3.4 1.4Kanamycin 8.6 19.8 16.5 0.7 0.0 11.0 1.4Streptomycin 58.2 71.9 39.2 59.9 1.1 45.2 12.9Tetracycline 50.7 46.9 66.0 56.3 1.5 74.0 20.9Sulfamethoxazole 61.3 66.7 46.4 45.4 0.7 47.9 16.5Trimethoprim 51.4 56.3 34.0 37.3 0.4 39.7 8.6Ciprofloxacin 50.3 57.3 48.5 1.1 0.4 9.6 1.4
Nalidixic acid 50.0 55.2 43.3 1.1 0.4 8.9 1.4Chloramphenicol 16.4 37.5 28.9 11.6 0.7 23.3 5.0Florfenicol 1.4 3.1 6.2 1.1 0.7 9.6 5.0

M A R A N 2 0 1 3
29
onwards. This is the likely result of de reductions in 2012 in overall antibiotic usage in broilers.In addition, the inclusion of a relative small subset of samples from German broilers (slaughtered at Dutch slaughter houses) resulted in slightly higher resistance rates for most antibiotics compared to Dutch broilers. These results demonstrate that German broilers also contain commensal E. coli with high level of resistances for most antibiotics tested.
Slaughter pigsIn swine very high levels of resistance in E. coli isolates in 2012 were recorded for tetracycline (56.3%), streptomycin (59.9%), sulfamethoxazole (45.4%), trimethoprim (37.3%) and ampicillin (25.0%). Although, resistance levels are still high, a clear tendency to decrease resistance has occurred in 2012 for all antibiotics mentioned above except for streptomycin (Figure Eco01).Reduced susceptibility to the quinolones persisted at a low level for both nalidixic acid (1.1%) and ciprofloxacin (1.1%). Remarkably, for the first time since 2006, no resistance was found against the 3rd generation cephalosporins indicating a decrease of ESBL-producing
E. coli in slaughter pigs. This may be the effect of the decision of the pig production sector to stop all usage of cephalosporins since 2011. With regard to the other antibiotics included in the survey, resistance to chloramphenicol, florfenicol and gentamicin remained stable over the years. In contrast, an on-going decrease of resistance for kanamycin was observed since 2007.
Veal calvesIn 2012, we were able to report resistance data on two veal calf husbandry types separately: white veal and rosé veal calves. White veal calves are fattened solely on a milk diet, while rosé veal calves are also fed some corn silage, straw or pelleted feed. On average in white veal calves more antibiotics are used. This resulted in two distinct data sets revealing a clear difference in resistance levels between the two husbandry types. For most antibiotics included a much higher resistance level was recorded for white veal than for rosé veal. These differences were major for ampicillin, kanamycin, streptomycin, tetracycline, sulfamethoxazole, trimethoprim and chloramphenicol (Table Eco02).
Escherichia coli
Resis
tance
(%
)Re
sistan
ce (
%)
chicken
0
20
40
60
80 pigs
0
20
40
60
80
veal calves
20
40
60
80 dairy cows
0
20
40
60
80
ampicillin cefotaxime gentamicin kanamycin
streptomycin tetracycline sulfamethoxazole trimethoprim
ciprofloxacin nalidixic acid chloramphenicol florfenicol
'98(303)
'99(318)
'01(318)
'02(164)
'03(165)
'04(300)
'05(304)
'06(154)
'07(43)
'08(440)
'09(291)
'10(284)
'11(283)
'12(292)
'98(302)
'99(318)
'01(318)
'02(149)
'03(155)
'04(296)
'05(299)
'06(79)
'07(169)
'08(296)
'09(296)
'10(282)
'11(287)
'12(284)
'96(166)
'98(38)
'05(165)
'06(152)
'07(175)
'08(153)
'09(171)
'10(172)
'11(166)
'12(286)
'05(139)
'06(127)
'07(152)
'08(148)
'09(136)
'10(264)
'11(267)
'12(274)
chan
ge in
samp
ling m
ethod
Figure Eco01. Trends in resistance (%) of E. coli isolated from broilers, slaughter pigs, veal calves, and dairy cattle in The Netherlands from 1998 – 2012.
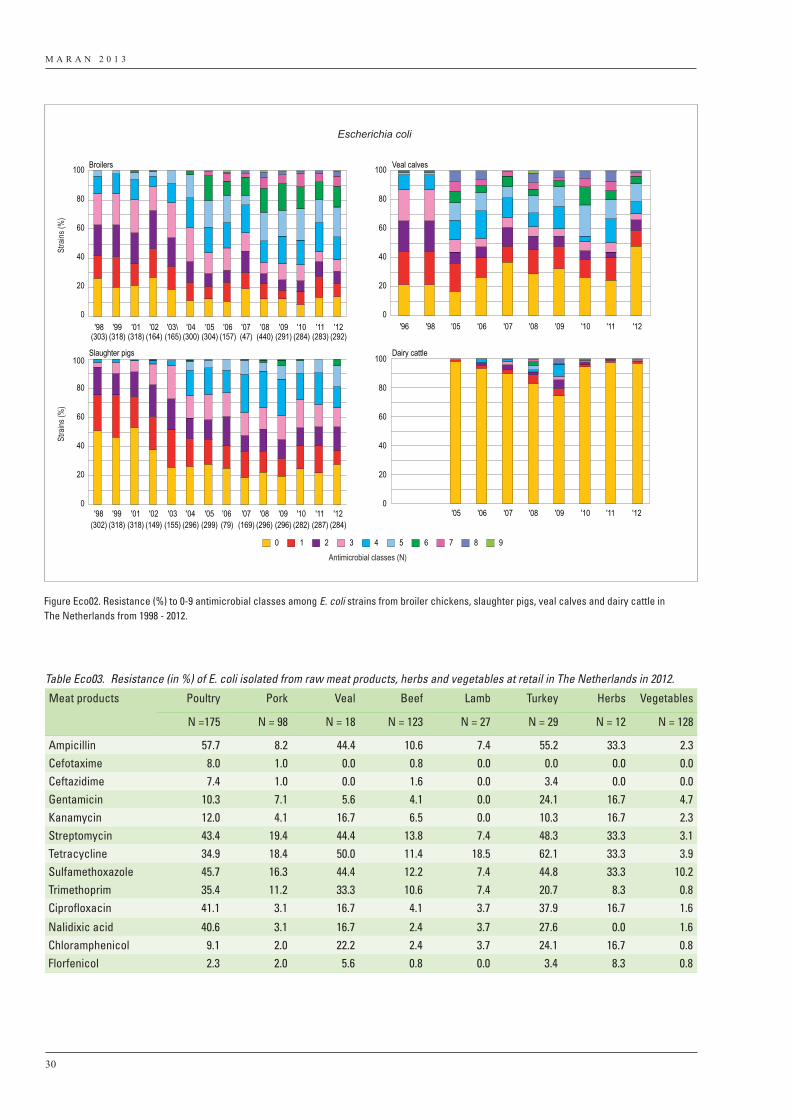
M A R A N 2 0 1 3
30
Broilers
0
20
40
60
80
100
0
20
40
60
80
100
0
20
40
60
80
100
0
20
40
60
80
100Slaughter pigs
Veal calves
Dairy cattle
9876543210
Escherichia coli
Stra
ins (%
)St
rains
(%)
Antimicrobial classes (N)
'98(303)
'99(318)
'01(318)
'02(164)
'03\(165)
'04(300)
'05(304)
'06(157)
'07(47)
'08(440)
'09(291)
'10(284)
'11(283)
'12(292)
'96 '98 '05 '06 '07 '08 '09 '10 '11 '12
'98(302)
'99(318)
'01(318)
'02(149)
'03(155)
'04(296)
'05(299)
'06(79)
'07(169)
'08(296)
'09(296)
'10(282)
'11(287)
'12(284)
'05 '06 '07 '08 '09 '10 '11 '12
Figure Eco02. Resistance (%) to 0-9 antimicrobial classes among E. coli strains from broiler chickens, slaughter pigs, veal calves and dairy cattle in The Netherlands from 1998 - 2012.
Table Eco03. Resistance (in %) of E. coli isolated from raw meat products, herbs and vegetables at retail in The Netherlands in 2012.
Meat products Poultry Pork Veal Beef Lamb Turkey Herbs Vegetables
N =175 N = 98 N = 18 N = 123 N = 27 N = 29 N = 12 N = 128
Ampicillin 57.7 8.2 44.4 10.6 7.4 55.2 33.3 2.3Cefotaxime 8.0 1.0 0.0 0.8 0.0 0.0 0.0 0.0Ceftazidime 7.4 1.0 0.0 1.6 0.0 3.4 0.0 0.0Gentamicin 10.3 7.1 5.6 4.1 0.0 24.1 16.7 4.7Kanamycin 12.0 4.1 16.7 6.5 0.0 10.3 16.7 2.3Streptomycin 43.4 19.4 44.4 13.8 7.4 48.3 33.3 3.1Tetracycline 34.9 18.4 50.0 11.4 18.5 62.1 33.3 3.9Sulfamethoxazole 45.7 16.3 44.4 12.2 7.4 44.8 33.3 10.2Trimethoprim 35.4 11.2 33.3 10.6 7.4 20.7 8.3 0.8Ciprofloxacin 41.1 3.1 16.7 4.1 3.7 37.9 16.7 1.6
Nalidixic acid 40.6 3.1 16.7 2.4 3.7 27.6 0.0 1.6Chloramphenicol 9.1 2.0 22.2 2.4 3.7 24.1 16.7 0.8Florfenicol 2.3 2.0 5.6 0.8 0.0 3.4 8.3 0.8
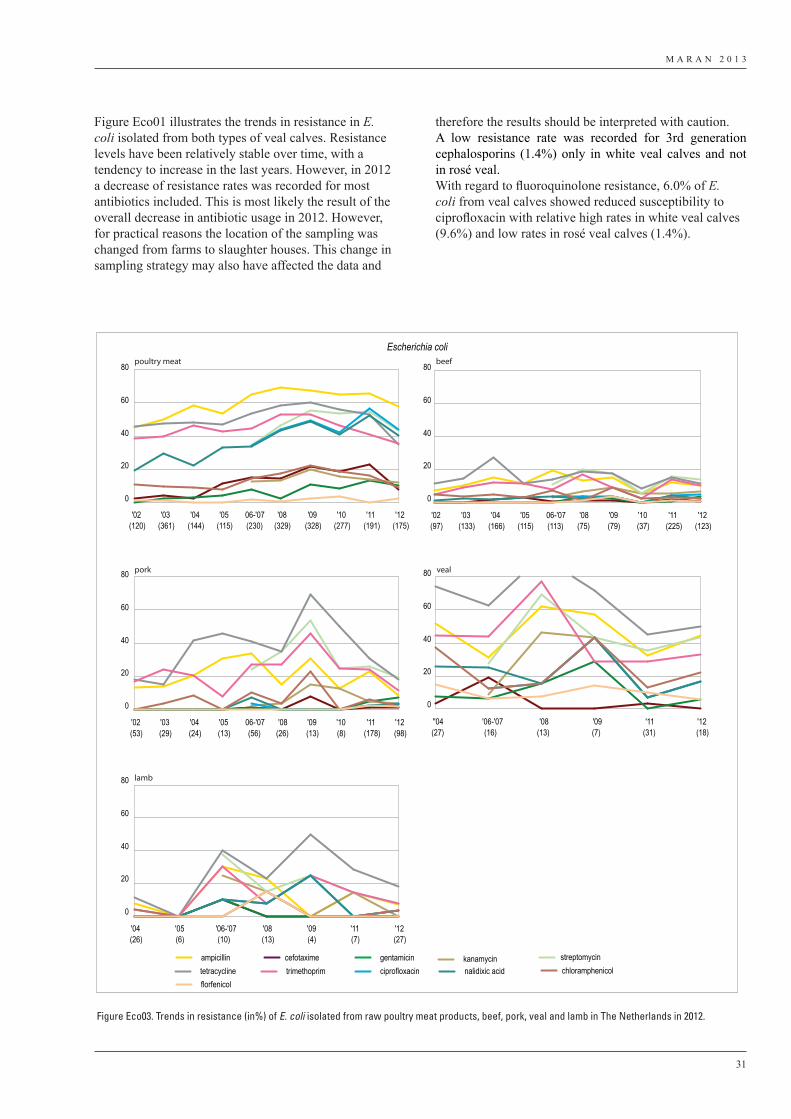
M A R A N 2 0 1 3
31
Figure Eco01 illustrates the trends in resistance in E. coli isolated from both types of veal calves. Resistance levels have been relatively stable over time, with a tendency to increase in the last years. However, in 2012 a decrease of resistance rates was recorded for most antibiotics included. This is most likely the result of the overall decrease in antibiotic usage in 2012. However, for practical reasons the location of the sampling was changed from farms to slaughter houses. This change in sampling strategy may also have affected the data and
therefore the results should be interpreted with caution. A low resistance rate was recorded for 3rd generation cephalosporins (1.4%) only in white veal calves and not in rosé veal.With regard to fluoroquinolone resistance, 6.0% of E. coli from veal calves showed reduced susceptibility to ciprofloxacin with relative high rates in white veal calves (9.6%) and low rates in rosé veal calves (1.4%).
0
20
40
60
80
0
20
40
60
80
0
20
40
60
80
0
20
40
60
80
0
20
40
60
80
ampicillin cefotaxime gentamicin kanamycin streptomycintetracycline trimethoprim ciprofloxacin nalidixic acid chloramphenicolflorfenicol
poultry meat
pork veal
lamb
beef
Escherichia coli
'02(120)
'03(361)
'04(144)
'05(115)
06-'07(230)
'08(329)
'09(328)
'10(277)
'11(191)
'12(175)
'02(97)
'03(133)
'04(166)
'05(115)
06-'07(113)
'08(75)
'09(79)
'10(37)
'11(225)
'12(123)
'02(53)
'03(29)
'04(24)
'05(13)
06-'07(56)
'08(26)
'09(13)
'10(8)
'11(178)
'12(98)
''04(27)
'06-'07(16)
'08(13)
'09(7)
'11(31)
'12(18)
'04(26)
'05(6)
'06-'07(10)
'08(13)
'09(4)
'11(7)
'12(27)
Figure Eco03. Trends in resistance (in%) of E. coli isolated from raw poultry meat products, beef, pork, veal and lamb in The Netherlands in 2012.
M A R A N 2 0 1 3
32
Dairy cattleIn general, resistance in E. coli isolated from dairy cattle is very low compared to resistance levels seen in pigs, broilers and veal calves. The levels of resistance were below 2 % for all antibiotics tested. As in 2011, only one isolate expressed resistance to cefotaxime (= 0.4% of the isolates) indicative for a low prevalence of ESBL-producing E. coli isolates in dairy cattle.The trends in resistance as illustrated in Figure Eco01 have shown a gradual increase for a number of antimicrobials since 2005 with highest levels in 2009. Data from 2010/2011 show a sharp decrease with very low levels again. Changes in sampling strategy have been implemented in 2010 (from collection of fecal samples at farm level to randomly sampling of individual animals at slaughterhouses) which may have affected the detection level of resistance determinants in E. coli. Therefore, these trends have to be interpreted with caution. Despite the fact that in 2012 sampling was conducted at farm level again the resistance levels did not clearly increase to the relative high levels of 2008 and 2009. These results indicate the maintenance of low level resistance of E. coli in dairy cattle since 2010 (Figure Eco01).
TurkeysFor the second year in row turkey samples were included in the survey. Data in this report are again based on 100 faecal samples collected from 20 individual farms (five samples per farm). In all cases, samples were taken at different farms than in 2011. Recorded resistance levels are comparable to broilers with also high resistance levels for ampicillin, tetracycline, streptomycin, sulfamethoxazole and trimethoprim (Table Eco02). Both in 2011 and 2012 resistance against chloramphenicol and florfenicol was more commonly observed in turkey compared to broilers Resistance to 3rd generation cephalosporins was in 2012 only found in one E. coli isolate (1.0%) which is for the second year lower than in broilers (5.8%). With 48.5% of the turkey E. coli isolates showing decreased susceptibility to ciprofloxacin this, together with broilers, represents the animal sectors with the most extensive level of resistance to quinolones.
Multidrug resistanceData on multidrug resistance are shown in Figure Eco02. The highest level of multidrug resistance was again present among E. coli originating from broilers. As in previous years, a very high percentage of 77.7% of the commensal E. coli strains from broiler chickens were resistant to two or more classes of antimicrobials included in the survey.Among E. coli from veal calves and pigs, multidrug resistance was also common; in veal calves 41.0% and in slaughter pigs 62.3% of commensal E. coli isolates was resistant to at least two classes of antibiotics. For E. coli from dairy cattle multidrug resistance was
rare, with 1.5% resistant to two or more antibiotics. After an apparent increase in percentage multidrug resistant isolates up to 2009, the level has stabilized at a low level in the last three years.Overall, the slight increase of the number of totally susceptible E. coli isolates in most animal species included in the survey might reflect a more prudent use of antibiotics.In 2012, no isolates were detected with reduced susceptibility to all nine tested antimicrobials or classes (represented by ampicillin, cefotaxime, gentamicin, tetracycline, sulfamethoxazole, trimethoprim, nalidixic acid, chloramphenicol, and kanamycin).
3.2.2 E. coli in raw meat products of food-animalsTable Eco03 shows resistance percentages of E. coli strains isolated from raw meat products (including poultry, pork, veal, beef, lamb and turkey) sampled at retail in The Netherlands by the Dutch Food and Consumer Product Safety Authority (VWA), as well as strains isolated from vegetables and herbs. In 2012, resistance percentages of E. coli isolated from poultry meat are still high, but show a tendency to decrease more rapidly than in E. coli isolated from live animals. Moreover, resistance rates are lower for most antibiotics compared to E. coli isolates from faecal samples of Dutch broiler chickens (Table Eco02). Although, the number of E. coli isolates obtained from pork was low in some years, an on-going decrease in resistance rates is observed. Also in pigs, the level of resistance of E. coli isolates seems to decrease more rapidly in meat than in living animals. Resistance rates of E. coli from beef samples are stable over the years. Interpretation of data from veal and lamb is complicated by the sometimes low number of isolates from meat products that are tested. This is reflected in the variability in resistance rates over the years as shown in Figure Eco03.
Results of E. coli isolated from herbs and vegetables were included in this report for the second year. In vegetables resistance levels in E. coli isolates were relatively low (<10%) for most antibiotics included. However, resistance was found for almost all antibiotics except 3rd generation cephalosporins. In herbs much higher resistance rates were observed for almost all antibiotic classes. In addition, there is a remarkable difference in resistance between ciprofloxacin (16.7%) and nalidixic acid (0.0%). This difference might be caused by the frequent presence of plasmid mediated quinolone resistance genes exhibiting an atypical phenotype being reduced susceptibility to ciprofloxacin, but remaining susceptible to nalidixic acid.
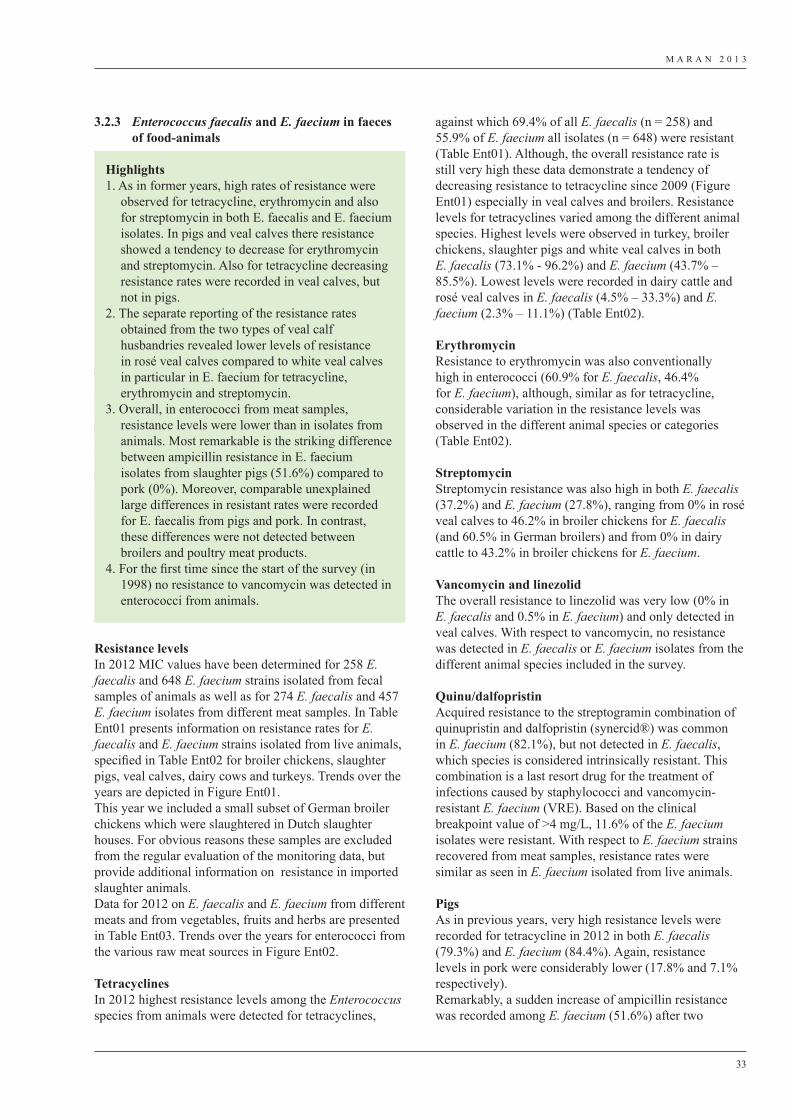
M A R A N 2 0 1 3
33
3.2.3 Enterococcus faecalis and E. faecium in faeces of food-animals
This chapter presents information on resistance in Enterococcus species from food-producing animals in The Netherlands as indicator organisms for the occurrence and trends in resistance in Gram-positive bacteria. Enterococcus faecalis and E. faecium isolates were selected from fecal samples of chickens, pigs, cattle and turkey. Supplementary to isolates from live animals, susceptibility profiles of E. faecalis and E. faecium isolated from raw meat are presented as well as from vegetables, fruits and herbs.
Highlights1. As in former years, high rates of resistance were
observed for tetracycline, erythromycin and also for streptomycin in both E. faecalis and E. faecium isolates. In pigs and veal calves there resistance showed a tendency to decrease for erythromycin and streptomycin. Also for tetracycline decreasing resistance rates were recorded in veal calves, but not in pigs.
2. The separate reporting of the resistance rates obtained from the two types of veal calf husbandries revealed lower levels of resistance in rosé veal calves compared to white veal calves in particular in E. faecium for tetracycline, erythromycin and streptomycin.
3. Overall, in enterococci from meat samples, resistance levels were lower than in isolates from animals. Most remarkable is the striking difference between ampicillin resistance in E. faecium isolates from slaughter pigs (51.6%) compared to pork (0%). Moreover, comparable unexplained large differences in resistant rates were recorded for E. faecalis from pigs and pork. In contrast, these differences were not detected between broilers and poultry meat products.
4. For the first time since the start of the survey (in 1998) no resistance to vancomycin was detected in enterococci from animals.
Resistance levelsIn 2012 MIC values have been determined for 258 E. faecalis and 648 E. faecium strains isolated from fecal samples of animals as well as for 274 E. faecalis and 457 E. faecium isolates from different meat samples. In Table Ent01 presents information on resistance rates for E. faecalis and E. faecium strains isolated from live animals, specified in Table Ent02 for broiler chickens, slaughter pigs, veal calves, dairy cows and turkeys. Trends over the years are depicted in Figure Ent01. This year we included a small subset of German broiler chickens which were slaughtered in Dutch slaughter houses. For obvious reasons these samples are excluded from the regular evaluation of the monitoring data, but provide additional information on resistance in imported slaughter animals.Data for 2012 on E. faecalis and E. faecium from different meats and from vegetables, fruits and herbs are presented in Table Ent03. Trends over the years for enterococci from the various raw meat sources in Figure Ent02.
TetracyclinesIn 2012 highest resistance levels among the Enterococcus species from animals were detected for tetracyclines,
against which 69.4% of all E. faecalis (n = 258) and 55.9% of E. faecium all isolates (n = 648) were resistant (Table Ent01). Although, the overall resistance rate is still very high these data demonstrate a tendency of decreasing resistance to tetracycline since 2009 (Figure Ent01) especially in veal calves and broilers. Resistance levels for tetracyclines varied among the different animal species. Highest levels were observed in turkey, broiler chickens, slaughter pigs and white veal calves in both E. faecalis (73.1% - 96.2%) and E. faecium (43.7% – 85.5%). Lowest levels were recorded in dairy cattle and rosé veal calves in E. faecalis (4.5% – 33.3%) and E. faecium (2.3% – 11.1%) (Table Ent02).
ErythromycinResistance to erythromycin was also conventionally high in enterococci (60.9% for E. faecalis, 46.4% for E. faecium), although, similar as for tetracycline, considerable variation in the resistance levels was observed in the different animal species or categories (Table Ent02).
StreptomycinStreptomycin resistance was also high in both E. faecalis (37.2%) and E. faecium (27.8%), ranging from 0% in rosé veal calves to 46.2% in broiler chickens for E. faecalis (and 60.5% in German broilers) and from 0% in dairy cattle to 43.2% in broiler chickens for E. faecium.
Vancomycin and linezolidThe overall resistance to linezolid was very low (0% in E. faecalis and 0.5% in E. faecium) and only detected in veal calves. With respect to vancomycin, no resistance was detected in E. faecalis or E. faecium isolates from the different animal species included in the survey.
Quinu/dalfopristinAcquired resistance to the streptogramin combination of quinupristin and dalfopristin (synercid®) was common in E. faecium (82.1%), but not detected in E. faecalis, which species is considered intrinsically resistant. This combination is a last resort drug for the treatment of infections caused by staphylococci and vancomycin-resistant E. faecium (VRE). Based on the clinical breakpoint value of >4 mg/L, 11.6% of the E. faecium isolates were resistant. With respect to E. faecium strains recovered from meat samples, resistance rates were similar as seen in E. faecium isolated from live animals.
PigsAs in previous years, very high resistance levels were recorded for tetracycline in 2012 in both E. faecalis (79.3%) and E. faecium (84.4%). Again, resistance levels in pork were considerably lower (17.8% and 7.1% respectively). Remarkably, a sudden increase of ampicillin resistance was recorded among E. faecium (51.6%) after two
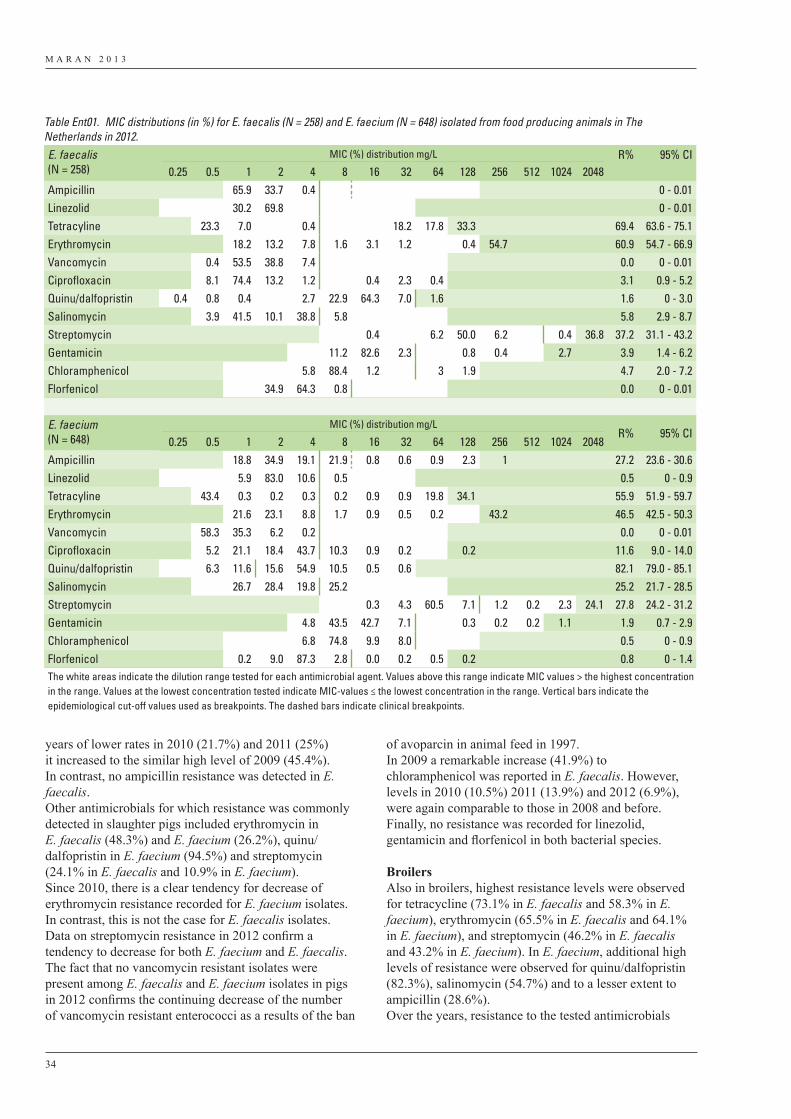
M A R A N 2 0 1 3
34
years of lower rates in 2010 (21.7%) and 2011 (25%) it increased to the similar high level of 2009 (45.4%). In contrast, no ampicillin resistance was detected in E. faecalis.Other antimicrobials for which resistance was commonly detected in slaughter pigs included erythromycin in E. faecalis (48.3%) and E. faecium (26.2%), quinu/dalfopristin in E. faecium (94.5%) and streptomycin (24.1% in E. faecalis and 10.9% in E. faecium). Since 2010, there is a clear tendency for decrease of erythromycin resistance recorded for E. faecium isolates. In contrast, this is not the case for E. faecalis isolates. Data on streptomycin resistance in 2012 confirm a tendency to decrease for both E. faecium and E. faecalis. The fact that no vancomycin resistant isolates were present among E. faecalis and E. faecium isolates in pigs in 2012 confirms the continuing decrease of the number of vancomycin resistant enterococci as a results of the ban
of avoparcin in animal feed in 1997. In 2009 a remarkable increase (41.9%) to chloramphenicol was reported in E. faecalis. However, levels in 2010 (10.5%) 2011 (13.9%) and 2012 (6.9%), were again comparable to those in 2008 and before. Finally, no resistance was recorded for linezolid, gentamicin and florfenicol in both bacterial species.
BroilersAlso in broilers, highest resistance levels were observed for tetracycline (73.1% in E. faecalis and 58.3% in E. faecium), erythromycin (65.5% in E. faecalis and 64.1% in E. faecium), and streptomycin (46.2% in E. faecalis and 43.2% in E. faecium). In E. faecium, additional high levels of resistance were observed for quinu/dalfopristin (82.3%), salinomycin (54.7%) and to a lesser extent to ampicillin (28.6%).Over the years, resistance to the tested antimicrobials
Table Ent01. MIC distributions (in %) for E. faecalis (N = 258) and E. faecium (N = 648) isolated from food producing animals in The Netherlands in 2012.E. faecalis (N = 258)
MIC (%) distribution mg/L R% 95% CI0.25 0.5 1 2 4 8 16 32 64 128 256 512 1024 2048
Ampicillin 65.9 33.7 0.4 0 - 0.01Linezolid 30.2 69.8 0 - 0.01Tetracyline 23.3 7.0 0.4 18.2 17.8 33.3 69.4 63.6 - 75.1Erythromycin 18.2 13.2 7.8 1.6 3.1 1.2 0.4 54.7 60.9 54.7 - 66.9Vancomycin 0.4 53.5 38.8 7.4 0.0 0 - 0.01Ciprofloxacin 8.1 74.4 13.2 1.2 0.4 2.3 0.4 3.1 0.9 - 5.2Quinu/dalfopristin 0.4 0.8 0.4 2.7 22.9 64.3 7.0 1.6 1.6 0 - 3.0Salinomycin 3.9 41.5 10.1 38.8 5.8 5.8 2.9 - 8.7Streptomycin 0.4 6.2 50.0 6.2 0.4 36.8 37.2 31.1 - 43.2Gentamicin 11.2 82.6 2.3 0.8 0.4 2.7 3.9 1.4 - 6.2Chloramphenicol 5.8 88.4 1.2 3 1.9 4.7 2.0 - 7.2Florfenicol 34.9 64.3 0.8 0.0 0 - 0.01
E. faecium (N = 648)
MIC (%) distribution mg/LR% 95% CI
0.25 0.5 1 2 4 8 16 32 64 128 256 512 1024 2048Ampicillin 18.8 34.9 19.1 21.9 0.8 0.6 0.9 2.3 1 27.2 23.6 - 30.6Linezolid 5.9 83.0 10.6 0.5 0.5 0 - 0.9Tetracyline 43.4 0.3 0.2 0.3 0.2 0.9 0.9 19.8 34.1 55.9 51.9 - 59.7Erythromycin 21.6 23.1 8.8 1.7 0.9 0.5 0.2 43.2 46.5 42.5 - 50.3Vancomycin 58.3 35.3 6.2 0.2 0.0 0 - 0.01Ciprofloxacin 5.2 21.1 18.4 43.7 10.3 0.9 0.2 0.2 11.6 9.0 - 14.0Quinu/dalfopristin 6.3 11.6 15.6 54.9 10.5 0.5 0.6 82.1 79.0 - 85.1Salinomycin 26.7 28.4 19.8 25.2 25.2 21.7 - 28.5Streptomycin 0.3 4.3 60.5 7.1 1.2 0.2 2.3 24.1 27.8 24.2 - 31.2Gentamicin 4.8 43.5 42.7 7.1 0.3 0.2 0.2 1.1 1.9 0.7 - 2.9Chloramphenicol 6.8 74.8 9.9 8.0 0.5 0 - 0.9Florfenicol 0.2 9.0 87.3 2.8 0.0 0.2 0.5 0.2 0.8 0 - 1.4The white areas indicate the dilution range tested for each antimicrobial agent. Values above this range indicate MIC values > the highest concentration in the range. Values at the lowest concentration tested indicate MIC-values ≤ the lowest concentration in the range. Vertical bars indicate the epidemiological cut-off values used as breakpoints. The dashed bars indicate clinical breakpoints.
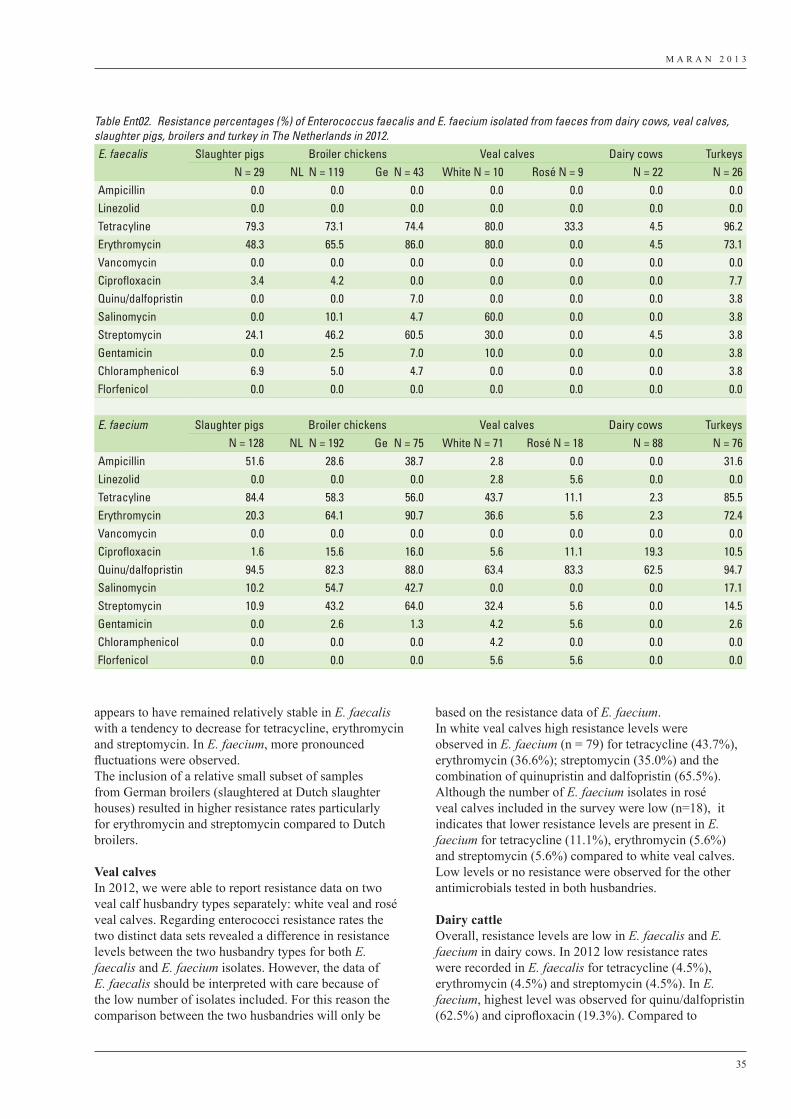
M A R A N 2 0 1 3
35
appears to have remained relatively stable in E. faecalis with a tendency to decrease for tetracycline, erythromycin and streptomycin. In E. faecium, more pronounced fluctuations were observed.The inclusion of a relative small subset of samples from German broilers (slaughtered at Dutch slaughter houses) resulted in higher resistance rates particularly for erythromycin and streptomycin compared to Dutch broilers.
Veal calvesIn 2012, we were able to report resistance data on two veal calf husbandry types separately: white veal and rosé veal calves. Regarding enterococci resistance rates the two distinct data sets revealed a difference in resistance levels between the two husbandry types for both E. faecalis and E. faecium isolates. However, the data of E. faecalis should be interpreted with care because of the low number of isolates included. For this reason the comparison between the two husbandries will only be
based on the resistance data of E. faecium. In white veal calves high resistance levels were observed in E. faecium (n = 79) for tetracycline (43.7%), erythromycin (36.6%); streptomycin (35.0%) and the combination of quinupristin and dalfopristin (65.5%). Although the number of E. faecium isolates in rosé veal calves included in the survey were low (n=18), it indicates that lower resistance levels are present in E. faecium for tetracycline (11.1%), erythromycin (5.6%) and streptomycin (5.6%) compared to white veal calves.Low levels or no resistance were observed for the other antimicrobials tested in both husbandries.
Dairy cattleOverall, resistance levels are low in E. faecalis and E. faecium in dairy cows. In 2012 low resistance rates were recorded in E. faecalis for tetracycline (4.5%), erythromycin (4.5%) and streptomycin (4.5%). In E. faecium, highest level was observed for quinu/dalfopristin (62.5%) and ciprofloxacin (19.3%). Compared to
Table Ent02. Resistance percentages (%) of Enterococcus faecalis and E. faecium isolated from faeces from dairy cows, veal calves, slaughter pigs, broilers and turkey in The Netherlands in 2012.E. faecalis Slaughter pigs Broiler chickens Veal calves Dairy cows Turkeys
N = 29 NL N = 119 Ge N = 43 White N = 10 Rosé N = 9 N = 22 N = 26Ampicillin 0.0 0.0 0.0 0.0 0.0 0.0 0.0Linezolid 0.0 0.0 0.0 0.0 0.0 0.0 0.0Tetracyline 79.3 73.1 74.4 80.0 33.3 4.5 96.2Erythromycin 48.3 65.5 86.0 80.0 0.0 4.5 73.1Vancomycin 0.0 0.0 0.0 0.0 0.0 0.0 0.0Ciprofloxacin 3.4 4.2 0.0 0.0 0.0 0.0 7.7Quinu/dalfopristin 0.0 0.0 7.0 0.0 0.0 0.0 3.8Salinomycin 0.0 10.1 4.7 60.0 0.0 0.0 3.8Streptomycin 24.1 46.2 60.5 30.0 0.0 4.5 3.8Gentamicin 0.0 2.5 7.0 10.0 0.0 0.0 3.8Chloramphenicol 6.9 5.0 4.7 0.0 0.0 0.0 3.8Florfenicol 0.0 0.0 0.0 0.0 0.0 0.0 0.0
E. faecium Slaughter pigs Broiler chickens Veal calves Dairy cows TurkeysN = 128 NL N = 192 Ge N = 75 White N = 71 Rosé N = 18 N = 88 N = 76
Ampicillin 51.6 28.6 38.7 2.8 0.0 0.0 31.6Linezolid 0.0 0.0 0.0 2.8 5.6 0.0 0.0Tetracyline 84.4 58.3 56.0 43.7 11.1 2.3 85.5Erythromycin 20.3 64.1 90.7 36.6 5.6 2.3 72.4Vancomycin 0.0 0.0 0.0 0.0 0.0 0.0 0.0Ciprofloxacin 1.6 15.6 16.0 5.6 11.1 19.3 10.5Quinu/dalfopristin 94.5 82.3 88.0 63.4 83.3 62.5 94.7Salinomycin 10.2 54.7 42.7 0.0 0.0 0.0 17.1Streptomycin 10.9 43.2 64.0 32.4 5.6 0.0 14.5Gentamicin 0.0 2.6 1.3 4.2 5.6 0.0 2.6Chloramphenicol 0.0 0.0 0.0 4.2 0.0 0.0 0.0Florfenicol 0.0 0.0 0.0 5.6 5.6 0.0 0.0
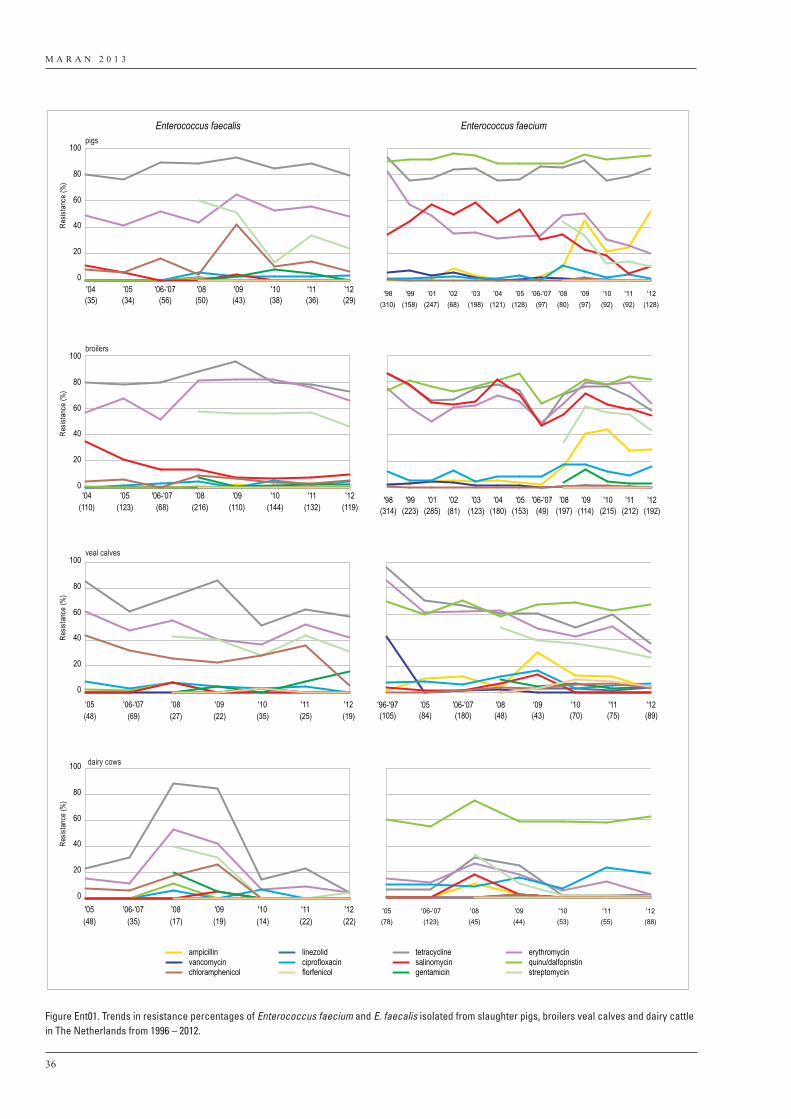
M A R A N 2 0 1 3
36
ampicillin linezolid tetracycline erythromycinvancomycin ciprofloxacin salinomycin quinu/dalfopristinchloramphenicol florfenicol gentamicin streptomycin
Enterococcus faecalis Enterococcus faecium
0
20
40
60
80
100pigs
0
20
40
60
80
100broilers
0
20
40
60
80
100 dairy cows
'04(35)
'05(34)
'06-'07(56)
'08(50)
'09(43)
'10(38)
'11(36)
'12(29)
Resis
tanc
e (%
)Re
sista
nce
(%)
0
20
40
60
80
100veal calves
Resis
tanc
e (%
)Re
sista
nce
(%)
'04(110)
'05(123)
'06-'07(68)
'08(216)
'09(110)
'10(144)
'11(132)
'12(119)
'05(48)
'06-'07(69)
'08(27)
'09(22)
'10(35)
'11(25)
'12(19)
'05(48)
'06-'07(35)
'08(17)
'09(19)
'10(14)
'11(22)
'12(22)
'98(310)
'99(158)
'01(247)
'02(68)
'03(198)
'04(121)
'05(128)
'06-'07(97)
'08(80)
'09(97)
'10(92)
'11(92)
'12(128)
'98(314)
'99(223)
'01(285)
'02(81)
'03(123)
'04(180)
'05(153)
'06-'07(49)
'08(197)
'09(114)
'10(215)
'11(212)
'12(192)
'96-'97(105)
'05(84)
'06-'07(180)
'08(48)
'09(43)
'10(70)
'11(75)
'12(89)
'05(78)
'06-'07(123)
'08(45)
'09(44)
'10(53)
'11(55)
'12(88)
Figure Ent01. Trends in resistance percentages of Enterococcus faecium and E. faecalis isolated from slaughter pigs, broilers veal calves and dairy cattle in The Netherlands from 1996 – 2012.
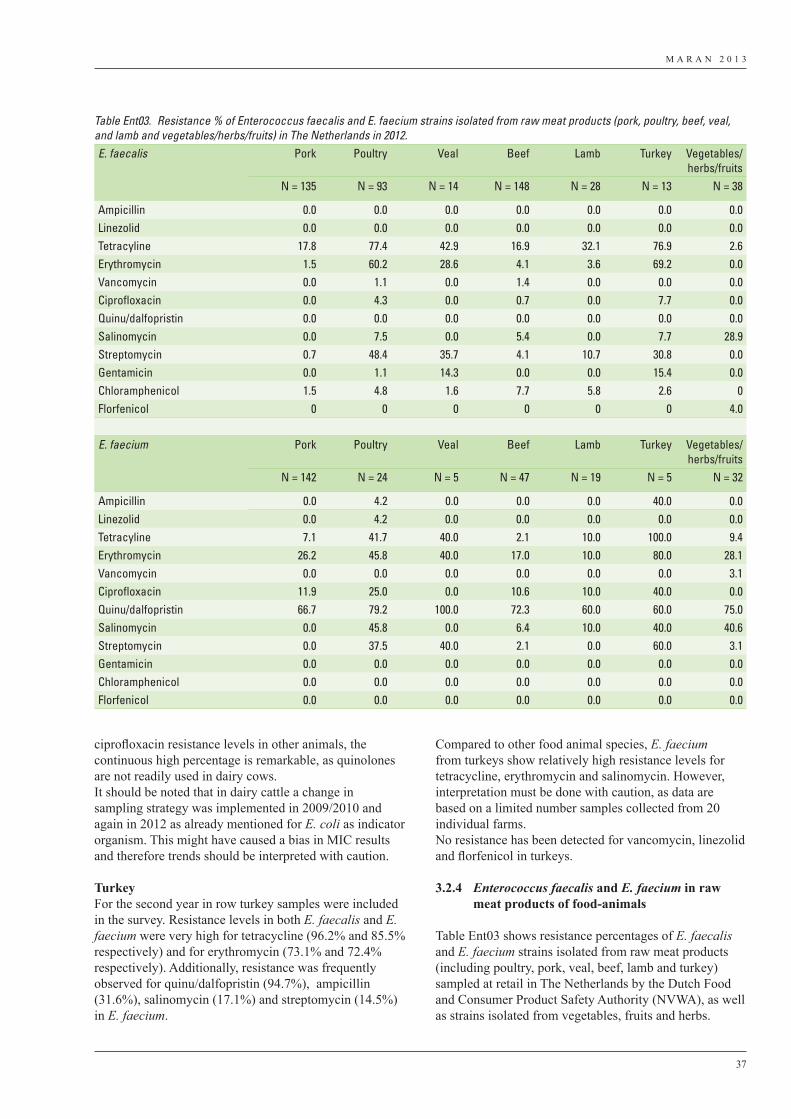
M A R A N 2 0 1 3
37
ciprofloxacin resistance levels in other animals, the continuous high percentage is remarkable, as quinolones are not readily used in dairy cows.It should be noted that in dairy cattle a change in sampling strategy was implemented in 2009/2010 and again in 2012 as already mentioned for E. coli as indicator organism. This might have caused a bias in MIC results and therefore trends should be interpreted with caution.
Turkey For the second year in row turkey samples were included in the survey. Resistance levels in both E. faecalis and E. faecium were very high for tetracycline (96.2% and 85.5% respectively) and for erythromycin (73.1% and 72.4% respectively). Additionally, resistance was frequently observed for quinu/dalfopristin (94.7%), ampicillin (31.6%), salinomycin (17.1%) and streptomycin (14.5%) in E. faecium.
Compared to other food animal species, E. faecium from turkeys show relatively high resistance levels for tetracycline, erythromycin and salinomycin. However, interpretation must be done with caution, as data are based on a limited number samples collected from 20 individual farms.No resistance has been detected for vancomycin, linezolid and florfenicol in turkeys.
3.2.4 Enterococcus faecalis and E. faecium in raw meat products of food-animals
Table Ent03 shows resistance percentages of E. faecalis and E. faecium strains isolated from raw meat products (including poultry, pork, veal, beef, lamb and turkey) sampled at retail in The Netherlands by the Dutch Food and Consumer Product Safety Authority (NVWA), as well as strains isolated from vegetables, fruits and herbs.
Table Ent03. Resistance % of Enterococcus faecalis and E. faecium strains isolated from raw meat products (pork, poultry, beef, veal, and lamb and vegetables/herbs/fruits) in The Netherlands in 2012.E. faecalis Pork Poultry Veal Beef Lamb Turkey Vegetables/
herbs/fruitsN = 135 N = 93 N = 14 N = 148 N = 28 N = 13 N = 38
Ampicillin 0.0 0.0 0.0 0.0 0.0 0.0 0.0Linezolid 0.0 0.0 0.0 0.0 0.0 0.0 0.0Tetracyline 17.8 77.4 42.9 16.9 32.1 76.9 2.6Erythromycin 1.5 60.2 28.6 4.1 3.6 69.2 0.0Vancomycin 0.0 1.1 0.0 1.4 0.0 0.0 0.0Ciprofloxacin 0.0 4.3 0.0 0.7 0.0 7.7 0.0Quinu/dalfopristin 0.0 0.0 0.0 0.0 0.0 0.0 0.0Salinomycin 0.0 7.5 0.0 5.4 0.0 7.7 28.9Streptomycin 0.7 48.4 35.7 4.1 10.7 30.8 0.0Gentamicin 0.0 1.1 14.3 0.0 0.0 15.4 0.0Chloramphenicol 1.5 4.8 1.6 7.7 5.8 2.6 0Florfenicol 0 0 0 0 0 0 4.0
E. faecium Pork Poultry Veal Beef Lamb Turkey Vegetables/herbs/fruits
N = 142 N = 24 N = 5 N = 47 N = 19 N = 5 N = 32
Ampicillin 0.0 4.2 0.0 0.0 0.0 40.0 0.0Linezolid 0.0 4.2 0.0 0.0 0.0 0.0 0.0Tetracyline 7.1 41.7 40.0 2.1 10.0 100.0 9.4Erythromycin 26.2 45.8 40.0 17.0 10.0 80.0 28.1Vancomycin 0.0 0.0 0.0 0.0 0.0 0.0 3.1Ciprofloxacin 11.9 25.0 0.0 10.6 10.0 40.0 0.0Quinu/dalfopristin 66.7 79.2 100.0 72.3 60.0 60.0 75.0Salinomycin 0.0 45.8 0.0 6.4 10.0 40.0 40.6Streptomycin 0.0 37.5 40.0 2.1 0.0 60.0 3.1Gentamicin 0.0 0.0 0.0 0.0 0.0 0.0 0.0Chloramphenicol 0.0 0.0 0.0 0.0 0.0 0.0 0.0Florfenicol 0.0 0.0 0.0 0.0 0.0 0.0 0.0
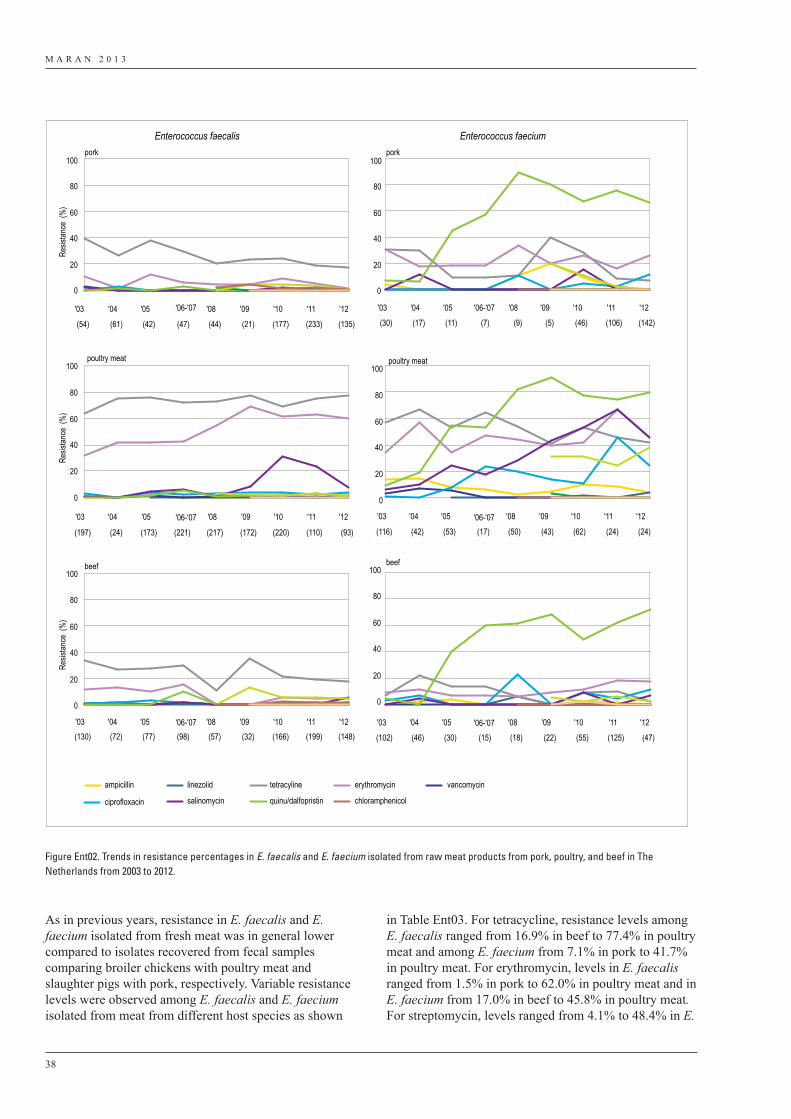
M A R A N 2 0 1 3
38
in Table Ent03. For tetracycline, resistance levels among E. faecalis ranged from 16.9% in beef to 77.4% in poultry meat and among E. faecium from 7.1% in pork to 41.7% in poultry meat. For erythromycin, levels in E. faecalis ranged from 1.5% in pork to 62.0% in poultry meat and in E. faecium from 17.0% in beef to 45.8% in poultry meat. For streptomycin, levels ranged from 4.1% to 48.4% in E.
As in previous years, resistance in E. faecalis and E. faecium isolated from fresh meat was in general lower compared to isolates recovered from fecal samples comparing broiler chickens with poultry meat and slaughter pigs with pork, respectively. Variable resistance levels were observed among E. faecalis and E. faecium isolated from meat from different host species as shown
Resis
tance
(%
)
0
20
40
60
80
100
poultry meat
0
20
40
60
80
100
Resis
tance
(%
)
beef
0
20
40
60
80
100
ampicillin linezolid tetracyline erythromycin vancomycin
ciprofloxacin salinomycin quinu/dalfopristin chloramphenicol
Resis
tance
(%
)
porkpork
poultry meat
0
20
40
60
80
100
0
20
40
60
80
100
0
20
40
60
80
100beef
Enterococcus faecalis Enterococcus faecium
'03
(30)
'04
(17)
'05
(11)
'06-'07'06-'07
'06-'07
'06-'07
'06-'07
'06-'07
(7)
'08
(9)
'09
(5)
'10
(46)
'11
(106)
'12
(142)
'03
(116)
'04
(42)
'05
(53) (17)
'08
(50)
'09
(43)
'10
(62)
'11
(24)
'12
(24)
'03
(102)
'04
(46)
'05
(30) (15)
'08
(18)
'09
(22)
'10
(55)
'11
(125)
'12
(47)
'03
(54)
'04
(61)
'05
(42) (47)
'08
(44)
'09
(21)
'10
(177)
'11
(233)
'12
(135)
'03
(197)
'04
(24)
'05
(173) (221)
'08
(217)
'09
(172)
'10
(220)
'11
(110)
'12
(93)
'03(130)
'04(72)
'05(77) (98)
'08(57)
'09(32)
'10(166)
'11(199)
'12(148)
Figure Ent02. Trends in resistance percentages in E. faecalis and E. faecium isolated from raw meat products from pork, poultry, and beef in The Netherlands from 2003 to 2012.
M A R A N 2 0 1 3
39
faecalis and from 0% to 37.5% in E. faecium.Remarkably, resistance to ampicillin was not detected in enterococci species from meat. In contrast, a relative high percentage of E. faecium isolates obtained from slaughter animals was resistant to ampicillin.Vancomycin resistance was observed in E. faecalis, isolated from poultry (n=1) and beef (n=2) and in one E. faecium from vegetables, fruits and herbs. No resistance for linezolid was detected in E. faecalis and E. faecium strains. For salinomycin, resistance levels in enterococci from poultry meat were relatively high compared to other sources.Quinu/dalfopristin resistance was high in E. faecium and comparable to the high rates in slaughter animals In general, resistance to gentamicin, chloramphenicol and florfenicol was low or absent in enterococci isolates from the various sample sources.
Trends over time are fairly stable for E. faecalis from different sources. The resistance percentages in E. faecium demonstrate more fluctuation over the years (Figure Ent02). With respect to quinu/dalfopristin, resistance rates seem to have reached a continuous high level in E. faecium from all three categories in recent years.
The overall differences between resistance levels in animals remain noteworthy and might suggest that certain selection pressures could favor the election of certain biotypes in meat. Also imported meat may have biased the results.
For the second year, MIC data on E. faecalis and E. faecium isolated from vegetables, fruits and herbs were included in the survey. Resistance levels were only present for a small fraction of the antibiotics tested. In E. faecalis, only resistance to tetracycline (28.9%) was observed in vegetables, fruits and herbs. In E. faecium, resistance was recorded for quinu/dalfopristin (75%), salinomycin (40.6%) and erythromycin (28.1%).

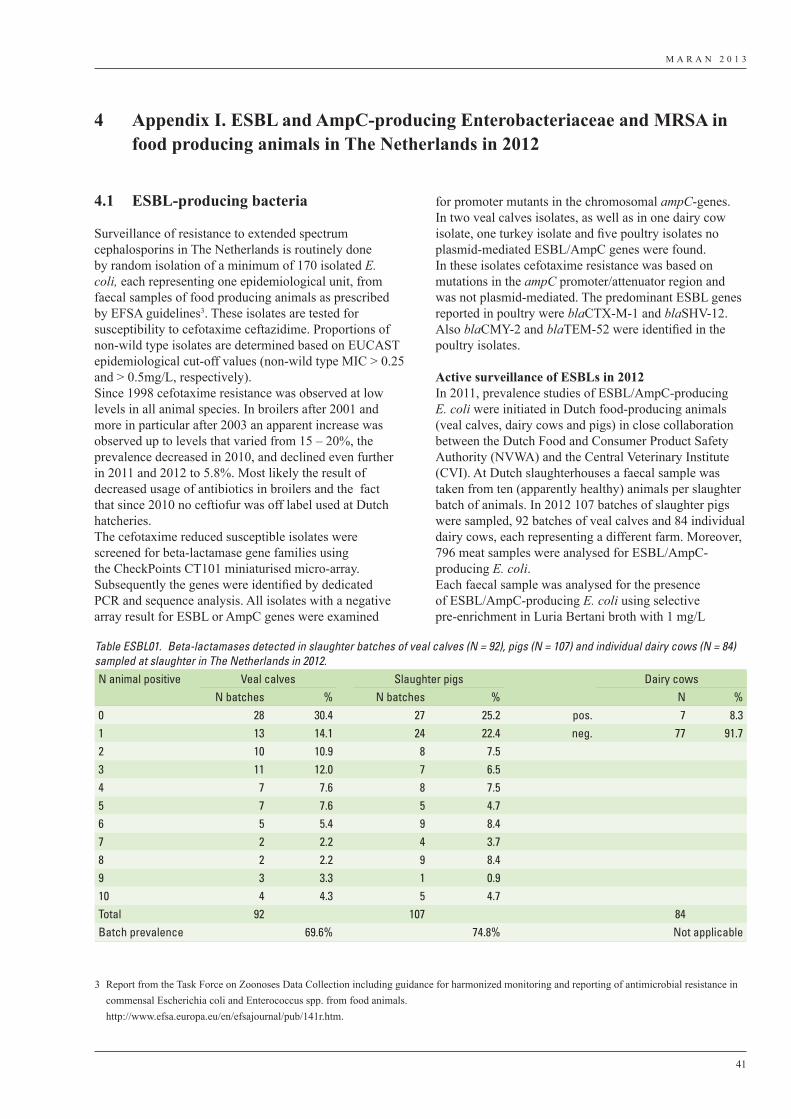
M A R A N 2 0 1 3
41
4.1 ESBL-producing bacteria
Surveillance of resistance to extended spectrum cephalosporins in The Netherlands is routinely done by random isolation of a minimum of 170 isolated E. coli, each representing one epidemiological unit, from faecal samples of food producing animals as prescribed by EFSA guidelines3. These isolates are tested for susceptibility to cefotaxime ceftazidime. Proportions of non-wild type isolates are determined based on EUCAST epidemiological cut-off values (non-wild type MIC > 0.25 and > 0.5mg/L, respectively). Since 1998 cefotaxime resistance was observed at low levels in all animal species. In broilers after 2001 and more in particular after 2003 an apparent increase was observed up to levels that varied from 15 – 20%, the prevalence decreased in 2010, and declined even further in 2011 and 2012 to 5.8%. Most likely the result of decreased usage of antibiotics in broilers and the fact that since 2010 no ceftiofur was off label used at Dutch hatcheries.The cefotaxime reduced susceptible isolates were screened for beta-lactamase gene families using the CheckPoints CT101 miniaturised micro-array. Subsequently the genes were identified by dedicated PCR and sequence analysis. All isolates with a negative array result for ESBL or AmpC genes were examined
for promoter mutants in the chromosomal ampC-genes. In two veal calves isolates, as well as in one dairy cow isolate, one turkey isolate and five poultry isolates no plasmid-mediated ESBL/AmpC genes were found. In these isolates cefotaxime resistance was based on mutations in the ampC promoter/attenuator region and was not plasmid-mediated. The predominant ESBL genes reported in poultry were blaCTX-M-1 and blaSHV-12. Also blaCMY-2 and blaTEM-52 were identified in the poultry isolates.
Active surveillance of ESBLs in 2012In 2011, prevalence studies of ESBL/AmpC-producing E. coli were initiated in Dutch food-producing animals (veal calves, dairy cows and pigs) in close collaboration between the Dutch Food and Consumer Product Safety Authority (NVWA) and the Central Veterinary Institute (CVI). At Dutch slaughterhouses a faecal sample was taken from ten (apparently healthy) animals per slaughter batch of animals. In 2012 107 batches of slaughter pigs were sampled, 92 batches of veal calves and 84 individual dairy cows, each representing a different farm. Moreover, 796 meat samples were analysed for ESBL/AmpC-producing E. coli. Each faecal sample was analysed for the presence of ESBL/AmpC-producing E. coli using selective pre-enrichment in Luria Bertani broth with 1 mg/L
4 Appendix I. ESBL and AmpC-producing Enterobacteriaceae and MRSA in food producing animals in The Netherlands in 2012
3 Report from the Task Force on Zoonoses Data Collection including guidance for harmonized monitoring and reporting of antimicrobial resistance in commensal Escherichia coli and Enterococcus spp. from food animals.
http://www.efsa.europa.eu/en/efsajournal/pub/141r.htm.
Table ESBL01. Beta-lactamases detected in slaughter batches of veal calves (N = 92), pigs (N = 107) and individual dairy cows (N = 84) sampled at slaughter in The Netherlands in 2012.N animal positive Veal calves Slaughter pigs Dairy cows
N batches % N batches % N %0 28 30.4 27 25.2 pos. 7 8.31 13 14.1 24 22.4 neg. 77 91.72 10 10.9 8 7.53 11 12.0 7 6.54 7 7.6 8 7.55 7 7.6 5 4.76 5 5.4 9 8.47 2 2.2 4 3.78 2 2.2 9 8.49 3 3.3 1 0.910 4 4.3 5 4.7Total 92 107 84Batch prevalence 69.6% 74.8% Not applicable
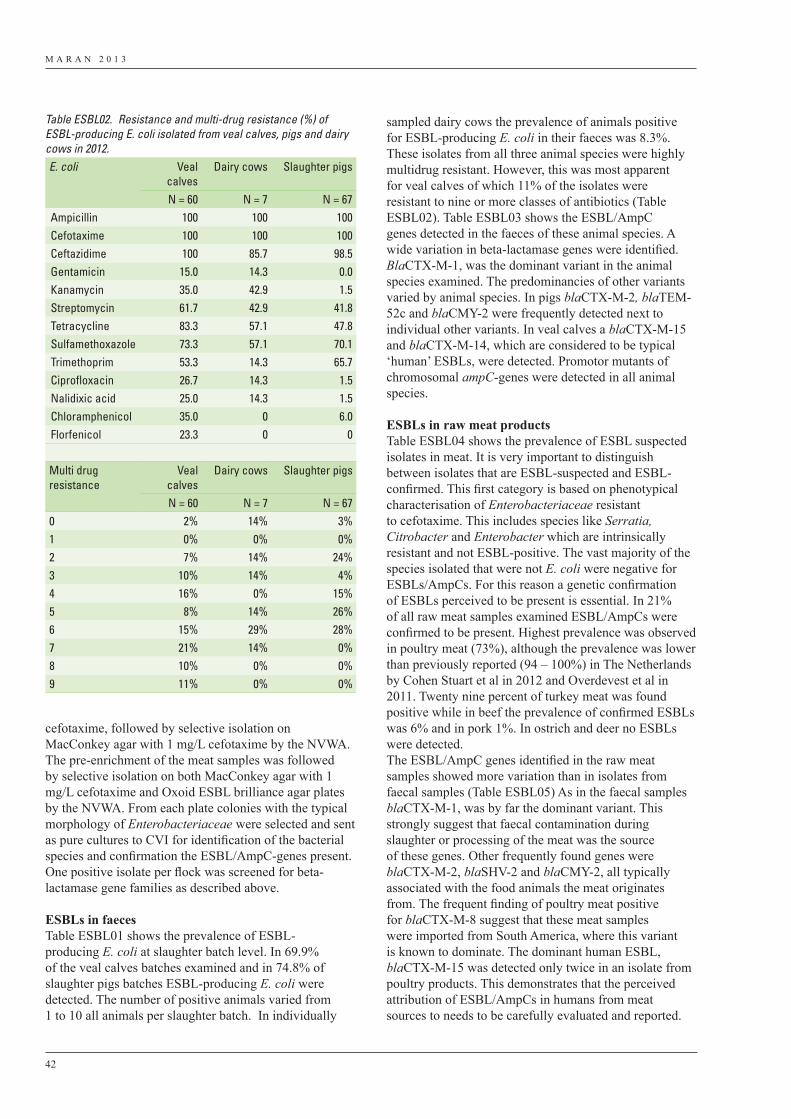
M A R A N 2 0 1 3
42
cefotaxime, followed by selective isolation on MacConkey agar with 1 mg/L cefotaxime by the NVWA. The pre-enrichment of the meat samples was followed by selective isolation on both MacConkey agar with 1 mg/L cefotaxime and Oxoid ESBL brilliance agar plates by the NVWA. From each plate colonies with the typical morphology of Enterobacteriaceae were selected and sent as pure cultures to CVI for identification of the bacterial species and confirmation the ESBL/AmpC-genes present. One positive isolate per flock was screened for beta-lactamase gene families as described above.
ESBLs in faecesTable ESBL01 shows the prevalence of ESBL-producing E. coli at slaughter batch level. In 69.9% of the veal calves batches examined and in 74.8% of slaughter pigs batches ESBL-producing E. coli were detected. The number of positive animals varied from 1 to 10 all animals per slaughter batch. In individually
sampled dairy cows the prevalence of animals positive for ESBL-producing E. coli in their faeces was 8.3%. These isolates from all three animal species were highly multidrug resistant. However, this was most apparent for veal calves of which 11% of the isolates were resistant to nine or more classes of antibiotics (Table ESBL02). Table ESBL03 shows the ESBL/AmpC genes detected in the faeces of these animal species. A wide variation in beta-lactamase genes were identified. BlaCTX-M-1, was the dominant variant in the animal species examined. The predominancies of other variants varied by animal species. In pigs blaCTX-M-2, blaTEM-52c and blaCMY-2 were frequently detected next to individual other variants. In veal calves a blaCTX-M-15 and blaCTX-M-14, which are considered to be typical ‘human’ ESBLs, were detected. Promotor mutants of chromosomal ampC-genes were detected in all animal species.
ESBLs in raw meat productsTable ESBL04 shows the prevalence of ESBL suspected isolates in meat. It is very important to distinguish between isolates that are ESBL-suspected and ESBL-confirmed. This first category is based on phenotypical characterisation of Enterobacteriaceae resistant to cefotaxime. This includes species like Serratia, Citrobacter and Enterobacter which are intrinsically resistant and not ESBL-positive. The vast majority of the species isolated that were not E. coli were negative for ESBLs/AmpCs. For this reason a genetic confirmation of ESBLs perceived to be present is essential. In 21% of all raw meat samples examined ESBL/AmpCs were confirmed to be present. Highest prevalence was observed in poultry meat (73%), although the prevalence was lower than previously reported (94 – 100%) in The Netherlands by Cohen Stuart et al in 2012 and Overdevest et al in 2011. Twenty nine percent of turkey meat was found positive while in beef the prevalence of confirmed ESBLs was 6% and in pork 1%. In ostrich and deer no ESBLs were detected.The ESBL/AmpC genes identified in the raw meat samples showed more variation than in isolates from faecal samples (Table ESBL05) As in the faecal samples blaCTX-M-1, was by far the dominant variant. This strongly suggest that faecal contamination during slaughter or processing of the meat was the source of these genes. Other frequently found genes were blaCTX-M-2, blaSHV-2 and blaCMY-2, all typically associated with the food animals the meat originates from. The frequent finding of poultry meat positive for blaCTX-M-8 suggest that these meat samples were imported from South America, where this variant is known to dominate. The dominant human ESBL, blaCTX-M-15 was detected only twice in an isolate from poultry products. This demonstrates that the perceived attribution of ESBL/AmpCs in humans from meat sources to needs to be carefully evaluated and reported.
Table ESBL02. Resistance and multi-drug resistance (%) of ESBL-producing E. coli isolated from veal calves, pigs and dairy cows in 2012.E. coli Veal
calvesDairy cows Slaughter pigs
N = 60 N = 7 N = 67Ampicillin 100 100 100Cefotaxime 100 100 100Ceftazidime 100 85.7 98.5Gentamicin 15.0 14.3 0.0Kanamycin 35.0 42.9 1.5Streptomycin 61.7 42.9 41.8Tetracycline 83.3 57.1 47.8Sulfamethoxazole 73.3 57.1 70.1Trimethoprim 53.3 14.3 65.7Ciprofloxacin 26.7 14.3 1.5Nalidixic acid 25.0 14.3 1.5Chloramphenicol 35.0 0 6.0Florfenicol 23.3 0 0
Multi drug resistance
Veal calves
Dairy cows Slaughter pigs
N = 60 N = 7 N = 670 2% 14% 3%1 0% 0% 0%2 7% 14% 24%3 10% 14% 4%4 16% 0% 15%5 8% 14% 26%6 15% 29% 28%7 21% 14% 0%8 10% 0% 0%9 11% 0% 0%
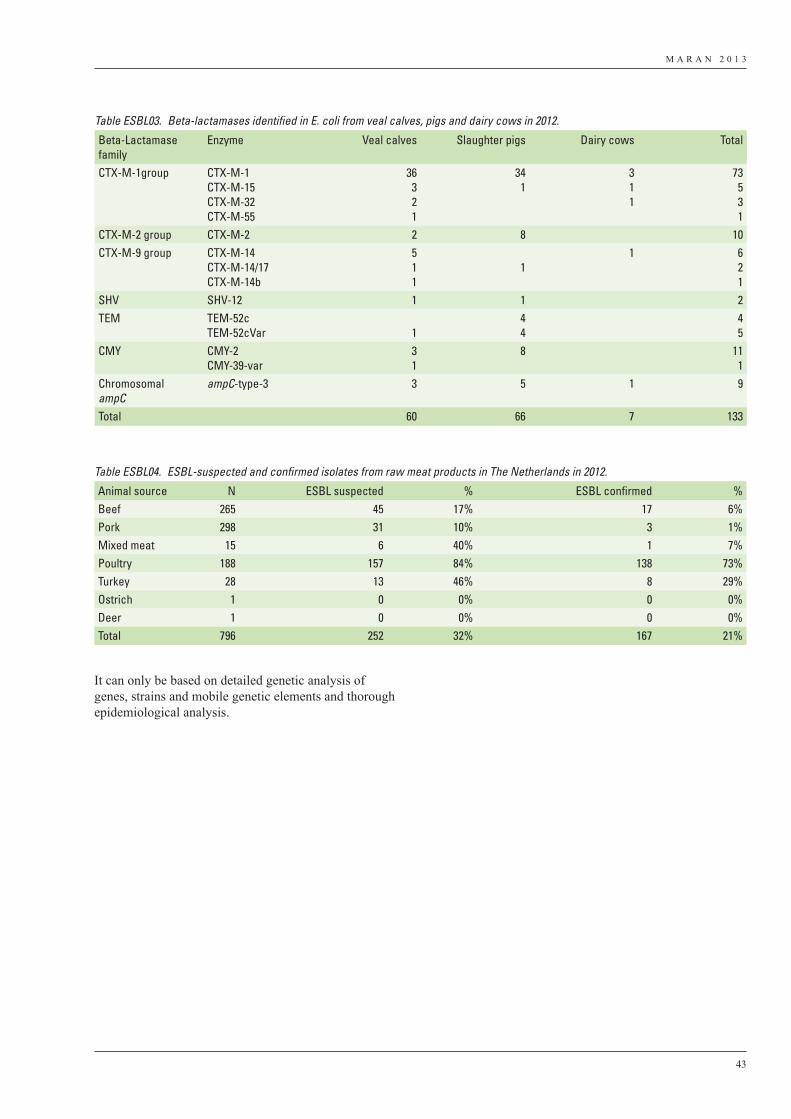
M A R A N 2 0 1 3
43
It can only be based on detailed genetic analysis of genes, strains and mobile genetic elements and thorough epidemiological analysis.
Table ESBL03. Beta-lactamases identified in E. coli from veal calves, pigs and dairy cows in 2012.
Beta-Lactamase family
Enzyme Veal calves Slaughter pigs Dairy cows Total
CTX-M-1group CTX-M-1CTX-M-15CTX-M-32CTX-M-55
36321
341
311
73531
CTX-M-2 group CTX-M-2 2 8 10CTX-M-9 group CTX-M-14
CTX-M-14/17CTX-M-14b
511
11 6
21
SHV SHV-12 1 1 2TEM TEM-52c
TEM-52cVar 144
45
CMY CMY-2CMY-39-var
31
8 111
ChromosomalampC
ampC-type-3 3 5 1 9
Total 60 66 7 133
Table ESBL04. ESBL-suspected and confirmed isolates from raw meat products in The Netherlands in 2012.
Animal source N ESBL suspected % ESBL confirmed %Beef 265 45 17% 17 6%Pork 298 31 10% 3 1%Mixed meat 15 6 40% 1 7%Poultry 188 157 84% 138 73%Turkey 28 13 46% 8 29%Ostrich 1 0 0% 0 0%Deer 1 0 0% 0 0%Total 796 252 32% 167 21%
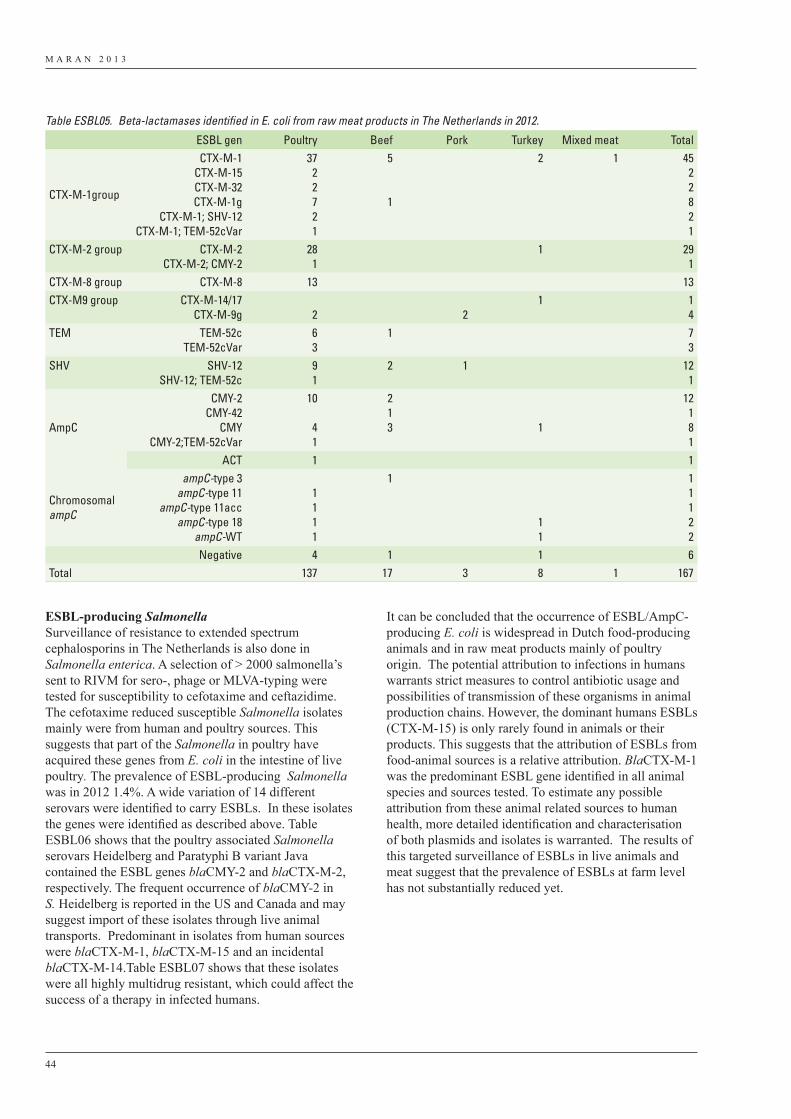
M A R A N 2 0 1 3
44
ESBL-producing SalmonellaSurveillance of resistance to extended spectrum cephalosporins in The Netherlands is also done in Salmonella enterica. A selection of > 2000 salmonella’s sent to RIVM for sero-, phage or MLVA-typing were tested for susceptibility to cefotaxime and ceftazidime. The cefotaxime reduced susceptible Salmonella isolates mainly were from human and poultry sources. This suggests that part of the Salmonella in poultry have acquired these genes from E. coli in the intestine of live poultry. The prevalence of ESBL-producing Salmonella was in 2012 1.4%. A wide variation of 14 different serovars were identified to carry ESBLs. In these isolates the genes were identified as described above. Table ESBL06 shows that the poultry associated Salmonella serovars Heidelberg and Paratyphi B variant Java contained the ESBL genes blaCMY-2 and blaCTX-M-2, respectively. The frequent occurrence of blaCMY-2 in S. Heidelberg is reported in the US and Canada and may suggest import of these isolates through live animal transports. Predominant in isolates from human sources were blaCTX-M-1, blaCTX-M-15 and an incidental blaCTX-M-14.Table ESBL07 shows that these isolates were all highly multidrug resistant, which could affect the success of a therapy in infected humans.
It can be concluded that the occurrence of ESBL/AmpC-producing E. coli is widespread in Dutch food-producing animals and in raw meat products mainly of poultry origin. The potential attribution to infections in humans warrants strict measures to control antibiotic usage and possibilities of transmission of these organisms in animal production chains. However, the dominant humans ESBLs (CTX-M-15) is only rarely found in animals or their products. This suggests that the attribution of ESBLs from food-animal sources is a relative attribution. BlaCTX-M-1 was the predominant ESBL gene identified in all animal species and sources tested. To estimate any possible attribution from these animal related sources to human health, more detailed identification and characterisation of both plasmids and isolates is warranted. The results of this targeted surveillance of ESBLs in live animals and meat suggest that the prevalence of ESBLs at farm level has not substantially reduced yet.
Table ESBL05. Beta-lactamases identified in E. coli from raw meat products in The Netherlands in 2012.
ESBL gen Poultry Beef Pork Turkey Mixed meat Total
CTX-M-1group
CTX-M-1CTX-M-15CTX-M-32CTX-M-1g
CTX-M-1; SHV-12CTX-M-1; TEM-52cVar
3722721
5
1
2 1 4522821
CTX-M-2 group CTX-M-2CTX-M-2; CMY-2
281
1 291
CTX-M-8 group CTX-M-8 13 13CTX-M9 group CTX-M-14/17
CTX-M-9g 2 21 1
4TEM TEM-52c
TEM-52cVar63
1 73
SHV SHV-12SHV-12; TEM-52c
91
2 1 121
AmpC
CMY-2CMY-42
CMYCMY-2;TEM-52cVar
10
41
213 1
12181
ACT 1 1
ChromosomalampC
ampC-type 3ampC-type 11
ampC-type 11accampC-type 18
ampC-WT
1111
1
11
11122
Negative 4 1 1 6Total 137 17 3 8 1 167
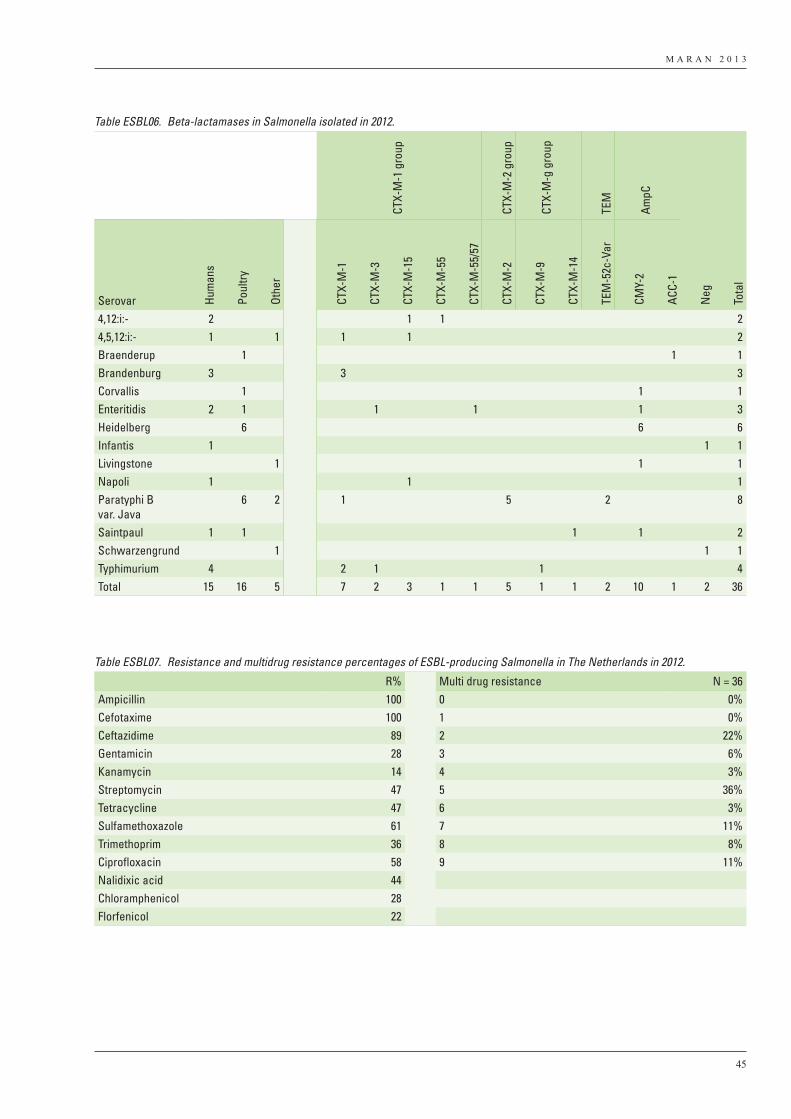
M A R A N 2 0 1 3
45
Table ESBL06. Beta-lactamases in Salmonella isolated in 2012.
CTX-
M-1
gro
up
CTX-
M-2
gro
up
CTX-
M-g
gro
up
TEM
AmpC
Serovar Hum
ans
Poul
try
Othe
r
CTX-
M-1
CTX-
M-3
CTX-
M-1
5
CTX-
M-5
5
CTX-
M-5
5/57
CTX-
M-2
CTX-
M-9
CTX-
M-1
4
TEM
-52c
-Var
CMY-
2
ACC-
1
Neg
Tota
l
4,12:i:- 2 1 1 24,5,12:i:- 1 1 1 1 2Braenderup 1 1 1Brandenburg 3 3 3Corvallis 1 1 1Enteritidis 2 1 1 1 1 3Heidelberg 6 6 6Infantis 1 1 1Livingstone 1 1 1Napoli 1 1 1Paratyphi B var. Java
6 2 1 5 2 8
Saintpaul 1 1 1 1 2Schwarzengrund 1 1 1Typhimurium 4 2 1 1 4Total 15 16 5 7 2 3 1 1 5 1 1 2 10 1 2 36
Table ESBL07. Resistance and multidrug resistance percentages of ESBL-producing Salmonella in The Netherlands in 2012.
R% Multi drug resistance N = 36Ampicillin 100 0 0%Cefotaxime 100 1 0%Ceftazidime 89 2 22%Gentamicin 28 3 6%Kanamycin 14 4 3%Streptomycin 47 5 36%Tetracycline 47 6 3%Sulfamethoxazole 61 7 11%Trimethoprim 36 8 8%Ciprofloxacin 58 9 11%Nalidixic acid 44Chloramphenicol 28Florfenicol 22
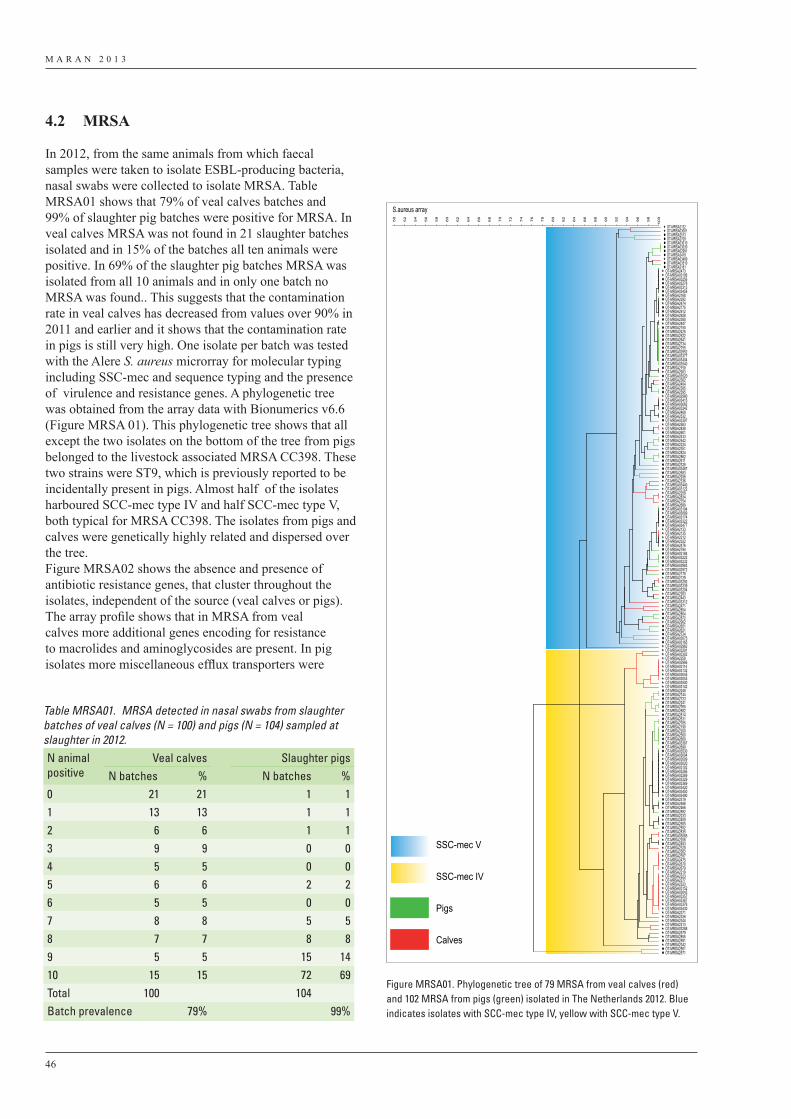
M A R A N 2 0 1 3
46
4.2 MRSA
In 2012, from the same animals from which faecal samples were taken to isolate ESBL-producing bacteria, nasal swabs were collected to isolate MRSA. Table MRSA01 shows that 79% of veal calves batches and 99% of slaughter pig batches were positive for MRSA. In veal calves MRSA was not found in 21 slaughter batches isolated and in 15% of the batches all ten animals were positive. In 69% of the slaughter pig batches MRSA was isolated from all 10 animals and in only one batch no MRSA was found.. This suggests that the contamination rate in veal calves has decreased from values over 90% in 2011 and earlier and it shows that the contamination rate in pigs is still very high. One isolate per batch was tested with the Alere S. aureus microrray for molecular typing including SSC-mec and sequence typing and the presence of virulence and resistance genes. A phylogenetic tree was obtained from the array data with Bionumerics v6.6 (Figure MRSA 01). This phylogenetic tree shows that all except the two isolates on the bottom of the tree from pigs belonged to the livestock associated MRSA CC398. These two strains were ST9, which is previously reported to be incidentally present in pigs. Almost half of the isolates harboured SCC-mec type IV and half SCC-mec type V, both typical for MRSA CC398. The isolates from pigs and calves were genetically highly related and dispersed over the tree.Figure MRSA02 shows the absence and presence of antibiotic resistance genes, that cluster throughout the isolates, independent of the source (veal calves or pigs).The array profile shows that in MRSA from veal calves more additional genes encoding for resistance to macrolides and aminoglycosides are present. In pig isolates more miscellaneous efflux transporters were
Table MRSA01. MRSA detected in nasal swabs from slaughter batches of veal calves (N = 100) and pigs (N = 104) sampled at slaughter in 2012.N animal positive
Veal calves Slaughter pigsN batches % N batches %
0 21 21 1 11 13 13 1 12 6 6 1 13 9 9 0 04 5 5 0 05 6 6 2 26 5 5 0 07 8 8 5 58 7 7 8 89 5 5 15 1410 15 15 72 69Total 100 104Batch prevalence 79% 99%
S.aureus array
100
98
96
94
92
90
88
86
84
82
80
78
76
74
72
70
68
66
64
62
60
58
56
54
52
50
OT-MRSA2132OT-MRSA03001OT-MRSA2513OT-MRSA2709OT-MRSA03010OT-MRSA03030OT-MRSA02991OT-MRSA2418OT-MRSA03489OT-MRSA03510OT-MRSA2181
OT-MRSA2473OT-MRSA03106OT-MRSA03256OT-MRSA03278OT-MRSA03313OT-MRSA03458OT-MRSA2168OT-MRSA2292OT-MRSA2474OT-MRSA2775OT-MRSA2912OT-MRSA2928OT-MRSA2380OT-MRSA2847OT-MRSA2150OT-MRSA2425OT-MRSA2522OT-MRSA2641OT-MRSA2734OT-MRSA2755OT-MRSA02952OT-MRSA03377OT-MRSA03404OT-MRSA03540OT-MRSA2159OT-MRSA2903OT-MRSA03520OT-MRSA2362OT-MRSA2404OT-MRSA2385OT-MRSA2395OT-MRSA02980OT-MRSA03415OT-MRSA03062OT-MRSA03242OT-MRSA2469OT-MRSA2532OT-MRSA03397OT-MRSA2583OT-MRSA2838OT-MRSA2601OT-MRSA2433OT-MRSA2542OT-MRSA2224OT-MRSA2351OT-MRSA2824OT-MRSA2862OT-MRSA2611OT-MRSA2328OT-MRSA03467OT-MRSA2683OT-MRSA2938OT-MRSA2336OT-MRSA03440OT-MRSA03122OT-MRSA2259OT-MRSA2834OT-MRSA2754OT-MRSA2689OT-MRSA03194OT-MRSA03089OT-MRSA03174OT-MRSA03322OT-MRSA03477OT-MRSA2133OT-MRSA2135OT-MRSA2312OT-MRSA2322OT-MRSA2476OT-MRSA2794OT-MRSA03184OT-MRSA03222OT-MRSA03232OT-MRSA02983OT-MRSA02972OT-MRSA2178OT-MRSA2129OT-MRSA03292OT-MRSA03339OT-MRSA03204OT-MRSA2283OT-MRSA2443OT-MRSA03312OT-MRSA2471OT-MRSA2854OT-MRSA2804OT-MRSA2872OT-MRSA2902OT-MRSA2651OT-MRSA2621OT-MRSA2724OT-MRSA03075OT-MRSA03165OT-MRSA02962OT-MRSA03291OT-MRSA03302OT-MRSA2258OT-MRSA02966OT-MRSA03114OT-MRSA03132OT-MRSA03045OT-MRSA03053OT-MRSA03500OT-MRSA03142OT-MRSA2248OT-MRSA2744OT-MRSA2723OT-MRSA2241OT-MRSA2765OT-MRSA2882OT-MRSA2814OT-MRSA2631OT-MRSA2785OT-MRSA2190OT-MRSA2200OT-MRSA2500OT-MRSA2660OT-MRSA03387OT-MRSA2699OT-MRSA03530OT-MRSA03004OT-MRSA03009OT-MRSA03020OT-MRSA03102OT-MRSA03266OT-MRSA03269OT-MRSA03329OT-MRSA03369OT-MRSA03420OT-MRSA03450OT-MRSA03490OT-MRSA2319OT-MRSA2488OT-MRSA2466OT-MRSA2892OT-MRSA2233OT-MRSA2409OT-MRSA2505OT-MRSA2552OT-MRSA2835OT-MRSA03085OT-MRSA2208OT-MRSA2493OT-MRSA2329OT-MRSA2262OT-MRSA2357OT-MRSA2475OT-MRSA2670OT-MRSA2679OT-MRSA2219OT-MRSA2223OT-MRSA2277OT-MRSA2323OT-MRSA03152OT-MRSA03043OT-MRSA03357OT-MRSA03367OT-MRSA03376OT-MRSA03430OT-MRSA2371OT-MRSA2326OT-MRSA2344OT-MRSA2213OT-MRSA03288OT-MRSA2579OT-MRSA2855OT-MRSA2591OT-MRSA2342OT-MRSA2561OT-MRSA2571
SSC-mec V
SSC-mec IV
Pigs
Calves
Figure MRSA01. Phylogenetic tree of 79 MRSA from veal calves (red) and 102 MRSA from pigs (green) isolated in The Netherlands 2012. Blue indicates isolates with SCC-mec type IV, yellow with SCC-mec type V.
SSC-mec V
SSC-mec IV
Pigs
Calves
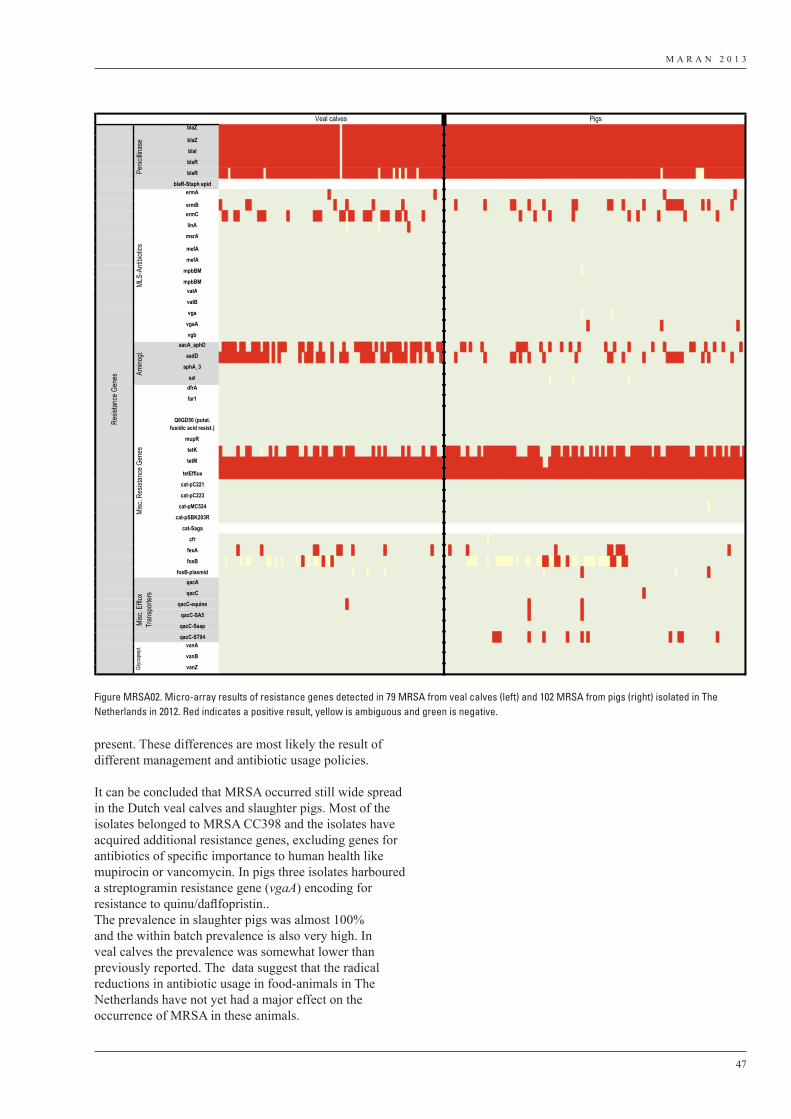
M A R A N 2 0 1 3
47
present. These differences are most likely the result of different management and antibiotic usage policies.
It can be concluded that MRSA occurred still wide spread in the Dutch veal calves and slaughter pigs. Most of the isolates belonged to MRSA CC398 and the isolates have acquired additional resistance genes, excluding genes for antibiotics of specific importance to human health like mupirocin or vancomycin. In pigs three isolates harboured a streptogramin resistance gene (vgaA) encoding for resistance to quinu/daflfopristin..The prevalence in slaughter pigs was almost 100% and the within batch prevalence is also very high. In veal calves the prevalence was somewhat lower than previously reported. The data suggest that the radical reductions in antibiotic usage in food-animals in The Netherlands have not yet had a major effect on the occurrence of MRSA in these animals.
blaZPOS POS POS POS POS POS POS POS POS POS POS POS POS POS POS POS POS POS POS POS POS POS POS POS POS POS POS POS POS POS POS POS POS POS POS POS POS POS POS POS POS NEG POS POS POS POS POS POS POS POS POS POS POS POS POS POS POS POS POS POS POS POS POS POS POS POS POS POS POS POS POS POS POS POS POS POS POS POS POS POS POS POS POS POS POS POS POS POS POS POS POS POS POS POS POS POS POS POS POS POS POS POS POS POS POS POS POS POS POS POS POS POS POS POS POS POS POS POS POS POS POS POS POS POS POS POS POS POS POS POS POS POS POS POS POS POS POS POS POS POS POS POS POS POS POS POS POS POS POS POS POS POS POS POS POS POS POS POS POS POS POS POS POS POS POS POS POS POS POS POS POS POS POS POS POS POS POS POS
blaZ POS POS POS POS POS POS POS POS POS POS POS POS POS POS POS POS POS POS POS POS POS POS POS POS POS POS POS POS POS POS POS POS POS POS POS POS POS POS POS POS POS NEG POS POS POS POS POS POS POS POS POS POS POS POS POS POS POS POS POS POS POS POS POS POS POS POS POS POS POS POS POS POS POS POS POS POS POS POS POS POS POS POS POS POS POS POS POS POS POS POS POS POS POS POS POS POS POS POS POS POS POS POS POS POS POS POS POS POS POS POS POS POS POS POS POS POS POS POS POS POS POS POS POS POS POS POS POS POS POS POS POS POS POS POS POS POS POS POS POS POS POS POS POS POS POS POS POS POS POS POS POS POS POS POS POS POS POS POS POS POS POS POS POS POS POS POS POS POS POS POS POS POS POS POS POS POS POS POS
blaI POS POS POS POS POS POS POS POS POS POS POS POS POS POS POS POS POS POS POS POS POS POS POS POS POS POS POS POS POS POS POS POS POS POS POS POS POS POS POS POS POS NEG POS POS POS POS POS POS POS POS POS POS POS POS POS POS POS POS POS POS POS POS POS POS POS POS POS POS POS POS POS POS POS POS POS POS POS POS POS POS POS POS POS POS POS POS POS POS POS POS POS POS POS POS POS POS POS POS POS POS POS POS POS POS POS POS POS POS POS POS POS POS POS POS POS POS POS POS POS POS POS POS POS POS POS POS POS POS POS POS POS POS POS POS POS POS POS POS POS POS POS POS POS POS POS POS POS POS POS POS POS POS POS POS POS POS POS POS POS POS POS POS POS POS POS POS POS POS POS POS POS POS POS POS POS POS POS POS
blaR POS POS POS POS POS POS POS POS POS POS POS POS POS POS POS POS POS POS POS POS POS POS POS POS POS POS POS POS POS POS POS POS POS POS POS POS POS POS POS POS POS NEG POS POS POS POS POS POS POS POS POS POS POS POS POS POS POS POS POS POS POS POS POS POS POS POS POS POS POS POS POS POS POS POS POS POS POS POS POS POS POS POS POS POS POS POS POS POS POS POS POS POS POS POS POS POS POS POS POS POS POS POS POS POS POS POS POS POS POS POS POS POS POS POS POS POS POS POS POS POS POS POS POS POS POS POS POS POS POS POS POS POS POS POS POS POS POS POS POS POS POS POS POS POS POS POS POS POS POS POS POS POS POS POS POS POS POS POS POS POS POS POS POS POS POS POS POS POS POS POS POS POS POS POS POS POS POS POS
blaR POS POS POS AMB POS POS POS POS POS POS POS POS POS POS POS NEG POS POS POS POS POS POS POS POS POS POS POS POS POS POS POS POS POS POS POS POS POS POS POS POS POS NEG POS POS POS POS POS POS POS POS POS POS POS POS AMB POS POS POS POS AMB POS AMB POS NEG POS POS POS AMB POS POS POS POS POS POS POS POS POS POS POS POS POS POS POS POS POS POS POS POS POS POS POS POS POS POS POS POS POS POS POS POS POS POS POS POS POS POS POS POS POS POS POS POS POS POS POS POS POS POS POS POS POS POS POS POS POS POS POS POS POS POS POS POS POS POS POS POS POS POS POS POS POS POS POS POS POS POS POS POS POS AMB POS POS POS POS POS POS POS POS POS POS POS AMB AMB AMB POS POS POS POS POS POS POS POS POS POS POS POS POS POS
blaR-Staph epid n.a. n.a. n.a. n.a. n.a. n.a. n.a. n.a. n.a. n.a. n.a. n.a. n.a. n.a. n.a. n.a. n.a. n.a. n.a. n.a. n.a. n.a. n.a. n.a. n.a. n.a. n.a. n.a. n.a. n.a. n.a. n.a. n.a. n.a. n.a. n.a. n.a. n.a. n.a. n.a. n.a. n.a. n.a. n.a. n.a. n.a. n.a. n.a. n.a. n.a. n.a. n.a. n.a. n.a. n.a. n.a. n.a. n.a. n.a. n.a. n.a. n.a. n.a. n.a. n.a. n.a. n.a. n.a. n.a. n.a. n.a. n.a. n.a. n.a. n.a. n.a. n.a. n.a. n.a. n.a. n.a. n.a. n.a. n.a. n.a. n.a. n.a. n.a. n.a. n.a. n.a. n.a. n.a. n.a. n.a. n.a. n.a. n.a. n.a. n.a. n.a. n.a. n.a. n.a. n.a. n.a. n.a. n.a. n.a. n.a. n.a. n.a. n.a. n.a. n.a. n.a. n.a. n.a. n.a. n.a. n.a. n.a. n.a. n.a. n.a. n.a. n.a. n.a. n.a. n.a. n.a. n.a. n.a. n.a. n.a. n.a. n.a. n.a. n.a. n.a. n.a. n.a. n.a. n.a. n.a. n.a. n.a. n.a. n.a. n.a. n.a. n.a. n.a. n.a. n.a. n.a. n.a. n.a. n.a. n.a. n.a. n.a. n.a. n.a. n.a. n.a. n.a. n.a. n.a. n.a. n.a. n.a. n.a. n.a. n.a. n.a. n.a. n.a.
ermANEG NEG NEG NEG NEG NEG NEG NEG NEG NEG NEG NEG NEG NEG NEG NEG NEG NEG NEG NEG NEG NEG NEG NEG NEG NEG NEG NEG NEG NEG NEG NEG NEG NEG NEG NEG NEG POS NEG NEG NEG NEG NEG NEG NEG NEG NEG NEG NEG NEG NEG NEG NEG NEG NEG NEG NEG NEG NEG NEG NEG NEG NEG NEG NEG NEG NEG NEG NEG NEG NEG NEG NEG POS NEG NEG NEG NEG NEG NEG NEG NEG NEG NEG NEG NEG NEG NEG NEG NEG NEG NEG NEG NEG NEG NEG NEG NEG NEG NEG NEG NEG NEG NEG NEG NEG NEG NEG NEG NEG NEG NEG NEG NEG NEG NEG NEG NEG NEG NEG NEG NEG NEG NEG NEG NEG NEG NEG NEG NEG NEG NEG NEG NEG NEG NEG NEG NEG NEG NEG NEG NEG NEG NEG NEG NEG NEG NEG NEG NEG POS NEG NEG NEG NEG NEG NEG NEG NEG NEG NEG NEG NEG NEG NEG NEG NEG NEG NEG NEG NEG NEG NEG NEG POS NEG NEG NEG
ermB POS NEG NEG NEG NEG NEG NEG NEG NEG POS POS NEG NEG NEG NEG NEG NEG NEG NEG NEG NEG NEG NEG NEG NEG NEG NEG NEG NEG NEG NEG NEG NEG NEG NEG NEG NEG NEG NEG POS NEG NEG NEG POS NEG NEG NEG NEG NEG NEG NEG NEG POS NEG NEG NEG NEG NEG NEG NEG NEG NEG POS NEG NEG NEG NEG NEG NEG NEG NEG NEG NEG NEG NEG NEG NEG NEG NEG POS NEG NEG NEG NEG NEG NEG NEG NEG NEG POS NEG NEG NEG NEG NEG NEG NEG NEG POS POS NEG NEG NEG NEG POS NEG NEG NEG NEG POS NEG NEG NEG NEG NEG NEG NEG NEG NEG POS POS NEG NEG NEG NEG NEG NEG NEG NEG NEG NEG POS POS NEG NEG NEG POS NEG NEG NEG NEG NEG NEG POS NEG NEG NEG NEG NEG NEG NEG POS POS POS POS POS POS NEG NEG NEG NEG NEG NEG POS NEG POS NEG NEG NEG NEG NEG NEG NEG POS NEG NEG NEG NEG
ermCNEG POS POS NEG NEG POS POS NEG NEG NEG NEG NEG NEG POS POS POS NEG NEG NEG NEG NEG NEG NEG POS NEG NEG NEG NEG NEG NEG NEG NEG POS POS POS NEG NEG NEG NEG NEG NEG POS POS NEG POS POS NEG NEG NEG POS POS POS NEG NEG NEG POS POS POS NEG NEG POS POS NEG POS NEG NEG NEG NEG NEG POS NEG NEG NEG NEG NEG NEG NEG NEG NEG NEG NEG NEG NEG NEG NEG NEG NEG NEG NEG NEG NEG NEG NEG NEG NEG NEG NEG NEG NEG NEG NEG POS NEG NEG NEG NEG POS NEG NEG NEG NEG POS NEG NEG NEG NEG NEG NEG NEG POS NEG NEG NEG NEG NEG NEG NEG NEG NEG NEG NEG NEG NEG NEG NEG NEG NEG NEG POS NEG NEG POS NEG NEG NEG NEG NEG NEG POS NEG NEG NEG NEG NEG NEG NEG NEG POS NEG NEG NEG NEG NEG NEG NEG NEG NEG NEG POS NEG NEG NEG NEG NEG NEG NEG NEG NEG
linANEG NEG NEG NEG NEG NEG NEG NEG NEG NEG NEG NEG NEG NEG NEG NEG NEG NEG NEG NEG NEG NEG NEG NEG NEG NEG NEG NEG NEG NEG NEG NEG NEG NEG NEG NEG NEG NEG NEG NEG NEG NEG NEG AMB NEG NEG NEG NEG NEG NEG NEG NEG NEG NEG AMB NEG NEG NEG NEG NEG NEG NEG NEG NEG POS NEG NEG NEG NEG NEG NEG NEG NEG NEG NEG NEG NEG NEG NEG NEG NEG NEG NEG NEG NEG NEG NEG NEG NEG NEG NEG NEG NEG NEG NEG NEG NEG NEG NEG NEG NEG NEG NEG NEG NEG NEG NEG NEG NEG NEG NEG NEG NEG NEG NEG NEG NEG NEG NEG NEG NEG NEG NEG NEG NEG NEG NEG NEG NEG NEG NEG NEG NEG NEG NEG NEG NEG NEG NEG NEG NEG NEG NEG NEG NEG NEG NEG NEG NEG NEG NEG NEG NEG NEG NEG NEG NEG NEG NEG NEG NEG NEG NEG NEG NEG NEG NEG NEG NEG NEG NEG NEG NEG NEG NEG NEG NEG NEG
msrANEG NEG NEG NEG NEG NEG NEG NEG NEG NEG NEG NEG NEG NEG NEG NEG NEG NEG NEG NEG NEG NEG NEG NEG NEG NEG NEG NEG NEG NEG NEG NEG NEG NEG NEG NEG NEG NEG NEG NEG NEG NEG NEG NEG NEG NEG NEG NEG NEG NEG NEG NEG NEG NEG NEG NEG NEG NEG NEG NEG NEG NEG NEG NEG NEG NEG NEG NEG NEG NEG NEG NEG NEG NEG NEG NEG NEG NEG NEG NEG NEG NEG NEG NEG NEG NEG NEG NEG NEG NEG NEG NEG NEG NEG NEG NEG NEG NEG NEG NEG NEG NEG NEG NEG NEG NEG NEG NEG NEG NEG NEG NEG NEG NEG NEG NEG NEG NEG NEG NEG NEG NEG NEG NEG NEG NEG NEG NEG NEG NEG NEG NEG NEG NEG NEG NEG NEG NEG NEG NEG NEG NEG NEG NEG NEG NEG NEG NEG NEG NEG NEG NEG NEG NEG NEG NEG NEG NEG NEG NEG NEG NEG NEG NEG NEG NEG NEG NEG NEG NEG NEG NEG NEG NEG NEG NEG NEG NEG
mefA NEG NEG NEG NEG NEG NEG NEG NEG NEG NEG NEG NEG NEG NEG NEG NEG NEG NEG NEG NEG NEG NEG NEG NEG NEG NEG NEG NEG NEG NEG NEG NEG NEG NEG NEG NEG NEG NEG NEG NEG NEG NEG NEG NEG NEG NEG NEG NEG NEG NEG NEG NEG NEG NEG NEG NEG NEG NEG NEG NEG NEG NEG NEG NEG NEG NEG NEG NEG NEG NEG NEG NEG NEG NEG NEG NEG NEG NEG NEG NEG NEG NEG NEG NEG NEG NEG NEG NEG NEG NEG NEG NEG NEG NEG NEG NEG NEG NEG NEG NEG NEG NEG NEG NEG NEG NEG NEG NEG NEG NEG NEG NEG NEG NEG NEG NEG NEG NEG NEG NEG NEG NEG NEG NEG NEG NEG NEG NEG NEG NEG NEG NEG NEG NEG NEG NEG NEG NEG NEG NEG NEG NEG NEG NEG NEG NEG NEG NEG NEG NEG NEG NEG NEG NEG NEG NEG NEG NEG NEG NEG NEG NEG NEG NEG NEG NEG NEG NEG NEG NEG NEG NEG NEG NEG NEG NEG NEG NEG
mefA NEG NEG NEG NEG NEG NEG NEG NEG NEG NEG NEG NEG NEG NEG NEG NEG NEG NEG NEG NEG NEG NEG NEG NEG NEG NEG NEG NEG NEG NEG NEG NEG NEG NEG NEG NEG NEG NEG NEG NEG NEG NEG NEG NEG NEG NEG NEG NEG NEG NEG NEG NEG NEG NEG NEG NEG NEG NEG NEG NEG NEG NEG NEG NEG NEG NEG NEG NEG NEG NEG NEG NEG NEG NEG NEG NEG NEG NEG NEG NEG NEG NEG NEG NEG NEG NEG NEG NEG NEG NEG NEG NEG NEG NEG NEG NEG NEG NEG NEG NEG NEG NEG NEG NEG NEG NEG NEG NEG NEG NEG NEG NEG NEG NEG NEG NEG NEG NEG NEG NEG NEG NEG NEG NEG NEG NEG NEG NEG NEG NEG NEG NEG NEG NEG NEG NEG NEG NEG NEG NEG NEG NEG NEG NEG NEG NEG NEG NEG NEG NEG NEG NEG NEG NEG NEG NEG NEG NEG NEG NEG NEG NEG NEG NEG NEG NEG NEG NEG NEG NEG NEG NEG NEG NEG NEG NEG NEG NEG
mpbBM NEG NEG NEG NEG NEG NEG NEG NEG NEG NEG NEG NEG NEG NEG NEG NEG NEG NEG NEG NEG NEG NEG NEG NEG NEG NEG NEG NEG NEG NEG NEG NEG NEG NEG NEG NEG NEG NEG NEG NEG NEG NEG NEG NEG NEG NEG NEG NEG NEG NEG NEG NEG NEG NEG NEG NEG NEG NEG NEG NEG NEG NEG NEG NEG NEG NEG NEG NEG NEG NEG NEG NEG NEG NEG NEG NEG NEG NEG NEG NEG NEG NEG NEG NEG NEG NEG NEG NEG NEG NEG NEG NEG NEG NEG NEG NEG NEG NEG NEG NEG NEG NEG NEG NEG NEG NEG NEG NEG NEG NEG NEG NEG NEG NEG NEG NEG NEG NEG NEG NEG NEG NEG AMB NEG NEG NEG NEG NEG NEG NEG NEG NEG NEG NEG NEG NEG NEG NEG NEG NEG NEG NEG NEG NEG NEG NEG NEG NEG NEG NEG NEG NEG NEG NEG NEG NEG NEG NEG NEG NEG NEG NEG NEG NEG NEG NEG NEG NEG NEG NEG NEG NEG NEG NEG NEG NEG NEG NEG
mpbBM NEG NEG NEG NEG NEG NEG NEG NEG NEG NEG NEG NEG NEG NEG NEG NEG NEG NEG NEG NEG NEG NEG NEG NEG NEG NEG NEG NEG NEG NEG NEG NEG NEG NEG NEG NEG NEG NEG NEG NEG NEG NEG NEG NEG NEG NEG NEG NEG NEG NEG NEG NEG NEG NEG NEG NEG NEG NEG NEG NEG NEG NEG NEG NEG NEG NEG NEG NEG NEG NEG NEG NEG NEG NEG NEG NEG NEG NEG NEG NEG NEG NEG NEG NEG NEG NEG NEG NEG NEG NEG NEG NEG NEG NEG NEG NEG NEG NEG NEG NEG NEG NEG NEG NEG NEG NEG NEG NEG NEG NEG NEG NEG NEG NEG NEG NEG NEG NEG NEG NEG NEG NEG NEG NEG NEG NEG NEG NEG NEG NEG NEG NEG NEG NEG NEG NEG NEG NEG NEG NEG NEG NEG NEG NEG NEG NEG NEG NEG NEG NEG NEG NEG NEG NEG NEG NEG NEG NEG NEG NEG NEG NEG NEG NEG NEG NEG NEG NEG NEG NEG NEG NEG NEG NEG NEG NEG NEG NEG
vatANEG NEG NEG NEG NEG NEG NEG NEG NEG NEG NEG NEG NEG NEG NEG NEG NEG NEG NEG NEG NEG NEG NEG NEG NEG NEG NEG NEG NEG NEG NEG NEG NEG NEG NEG NEG NEG NEG NEG NEG NEG NEG NEG NEG NEG NEG NEG NEG NEG NEG NEG NEG NEG NEG NEG NEG NEG NEG NEG NEG NEG NEG NEG NEG NEG NEG NEG NEG NEG NEG NEG NEG NEG NEG NEG NEG NEG NEG NEG NEG NEG NEG NEG NEG NEG NEG NEG NEG NEG NEG NEG NEG NEG NEG NEG NEG NEG NEG NEG NEG NEG NEG NEG NEG NEG NEG NEG NEG NEG NEG NEG NEG NEG NEG NEG NEG NEG NEG NEG NEG NEG NEG NEG NEG NEG NEG NEG NEG NEG NEG NEG NEG NEG NEG NEG NEG NEG NEG NEG NEG NEG NEG NEG NEG NEG NEG NEG NEG NEG NEG NEG NEG NEG NEG NEG NEG NEG NEG NEG NEG NEG NEG NEG NEG NEG NEG NEG NEG NEG NEG NEG NEG NEG NEG NEG NEG NEG NEG
vatBNEG NEG NEG NEG NEG NEG NEG NEG NEG NEG NEG NEG NEG NEG NEG NEG NEG NEG NEG NEG NEG NEG NEG NEG NEG NEG NEG NEG NEG NEG NEG NEG NEG NEG NEG NEG NEG NEG NEG NEG NEG NEG NEG NEG NEG NEG NEG NEG NEG NEG NEG NEG NEG NEG NEG NEG NEG NEG NEG NEG NEG NEG NEG NEG NEG NEG NEG NEG NEG NEG NEG NEG NEG NEG NEG NEG NEG NEG NEG NEG NEG NEG NEG NEG NEG NEG NEG NEG NEG NEG NEG NEG NEG NEG NEG NEG NEG NEG NEG NEG NEG NEG NEG NEG NEG NEG NEG NEG NEG NEG NEG NEG NEG NEG NEG NEG NEG NEG NEG NEG NEG NEG NEG NEG NEG NEG NEG NEG NEG NEG NEG NEG NEG NEG NEG NEG NEG NEG NEG NEG NEG NEG NEG NEG NEG NEG NEG NEG NEG NEG NEG NEG NEG NEG NEG NEG NEG NEG NEG NEG NEG NEG NEG NEG NEG NEG NEG NEG NEG NEG NEG NEG NEG NEG NEG NEG NEG NEG
vgaNEG NEG NEG NEG NEG NEG NEG NEG NEG NEG NEG NEG NEG NEG NEG NEG NEG NEG NEG NEG NEG NEG NEG NEG NEG NEG NEG NEG NEG NEG NEG NEG NEG NEG NEG NEG NEG NEG NEG NEG NEG NEG NEG NEG NEG NEG NEG NEG NEG NEG NEG NEG NEG NEG NEG NEG NEG NEG NEG NEG NEG NEG NEG NEG NEG NEG NEG NEG NEG NEG NEG NEG NEG NEG NEG NEG NEG NEG NEG NEG NEG NEG NEG NEG NEG NEG NEG NEG NEG NEG NEG NEG NEG NEG NEG NEG NEG NEG NEG NEG NEG NEG NEG NEG NEG NEG NEG NEG NEG NEG NEG NEG NEG NEG NEG NEG NEG NEG NEG NEG NEG NEG AMB NEG NEG NEG NEG NEG NEG NEG NEG NEG AMB NEG NEG NEG NEG NEG NEG NEG NEG NEG NEG NEG NEG NEG NEG NEG NEG NEG NEG NEG NEG NEG NEG NEG NEG NEG NEG NEG NEG NEG NEG NEG NEG NEG NEG NEG NEG NEG NEG NEG NEG NEG NEG NEG NEG NEG
vgaANEG NEG NEG NEG NEG NEG NEG NEG NEG NEG NEG NEG NEG NEG NEG NEG NEG NEG NEG NEG NEG NEG NEG NEG NEG NEG NEG NEG NEG NEG NEG NEG NEG NEG NEG NEG NEG NEG NEG NEG NEG NEG NEG NEG NEG NEG NEG NEG NEG NEG NEG NEG NEG NEG NEG NEG NEG NEG NEG NEG NEG NEG NEG NEG NEG NEG NEG NEG NEG NEG NEG NEG NEG NEG NEG NEG NEG NEG NEG NEG NEG NEG NEG NEG NEG NEG NEG NEG NEG NEG NEG NEG NEG NEG NEG NEG NEG NEG NEG NEG NEG NEG NEG NEG NEG NEG NEG NEG NEG NEG NEG NEG NEG NEG NEG NEG NEG NEG NEG NEG NEG NEG NEG NEG POS NEG NEG NEG NEG NEG NEG NEG NEG NEG NEG NEG NEG NEG NEG NEG NEG NEG NEG NEG NEG NEG NEG NEG NEG POS NEG NEG NEG NEG NEG NEG NEG NEG NEG NEG NEG NEG NEG NEG NEG NEG NEG NEG NEG NEG NEG NEG NEG NEG NEG POS NEG NEG
vgbNEG NEG NEG NEG NEG NEG NEG NEG NEG NEG NEG NEG NEG NEG NEG NEG NEG NEG NEG NEG NEG NEG NEG NEG NEG NEG NEG NEG NEG NEG NEG NEG NEG NEG NEG NEG NEG NEG NEG NEG NEG NEG NEG NEG NEG NEG NEG NEG NEG NEG NEG NEG NEG NEG NEG NEG NEG NEG NEG NEG NEG NEG NEG NEG NEG NEG NEG NEG NEG NEG NEG NEG NEG NEG NEG NEG NEG NEG NEG NEG NEG NEG NEG NEG NEG NEG NEG NEG NEG NEG NEG NEG NEG NEG NEG NEG NEG NEG NEG NEG NEG NEG NEG NEG NEG NEG NEG NEG NEG NEG NEG NEG NEG NEG NEG NEG NEG NEG NEG NEG NEG NEG NEG NEG NEG NEG NEG NEG NEG NEG NEG NEG NEG NEG NEG NEG NEG NEG NEG NEG NEG NEG NEG NEG NEG NEG NEG NEG NEG NEG NEG NEG NEG NEG NEG NEG NEG NEG NEG NEG NEG NEG NEG NEG NEG NEG NEG NEG NEG NEG NEG NEG NEG NEG NEG NEG NEG NEG
aacA_aphDNEG POS POS POS POS POS NEG POS POS NEG NEG POS POS POS NEG POS POS NEG POS NEG POS POS POS NEG NEG NEG NEG POS POS NEG POS POS NEG NEG POS NEG NEG NEG POS NEG NEG NEG POS NEG NEG NEG POS POS POS POS POS POS NEG POS NEG POS NEG POS POS POS POS POS NEG POS NEG POS POS POS POS NEG POS POS NEG NEG POS POS NEG NEG NEG NEG NEG POS POS NEG POS NEG NEG NEG POS NEG NEG NEG NEG NEG NEG NEG NEG NEG NEG NEG POS POS POS POS NEG NEG NEG NEG POS NEG NEG POS NEG NEG NEG POS NEG NEG POS NEG NEG POS NEG NEG NEG NEG NEG NEG NEG NEG POS NEG NEG POS NEG NEG NEG NEG POS NEG NEG NEG NEG NEG NEG NEG POS NEG NEG NEG POS NEG NEG NEG NEG NEG NEG NEG NEG POS POS NEG NEG NEG POS NEG NEG POS NEG NEG POS NEG NEG NEG NEG NEG POS NEG
aadDPOS POS POS POS POS POS POS POS POS POS POS POS POS POS POS POS POS NEG POS NEG POS NEG NEG NEG NEG NEG NEG POS NEG POS POS POS NEG POS POS POS NEG NEG POS NEG NEG POS POS POS NEG NEG NEG NEG POS POS POS POS POS NEG NEG POS POS POS NEG POS POS POS POS POS NEG POS POS NEG POS NEG NEG POS POS NEG NEG POS NEG NEG NEG POS NEG NEG NEG NEG NEG NEG NEG NEG NEG POS NEG NEG NEG NEG NEG NEG NEG NEG POS POS NEG POS NEG NEG POS NEG NEG NEG NEG POS NEG NEG NEG NEG NEG NEG NEG NEG NEG NEG POS NEG NEG NEG NEG NEG NEG NEG NEG NEG NEG POS POS NEG NEG NEG POS NEG NEG NEG NEG NEG NEG POS NEG NEG NEG NEG NEG NEG NEG POS POS POS POS POS POS NEG NEG NEG NEG NEG NEG POS NEG POS NEG NEG NEG NEG NEG NEG NEG POS NEG NEG NEG NEG
aphA_3NEG NEG NEG NEG NEG NEG NEG NEG NEG NEG NEG NEG NEG NEG NEG NEG NEG NEG NEG NEG NEG NEG NEG NEG NEG NEG NEG NEG NEG NEG NEG NEG NEG NEG NEG NEG NEG NEG NEG NEG NEG NEG NEG NEG NEG NEG NEG NEG NEG NEG NEG NEG NEG NEG NEG NEG NEG NEG NEG NEG NEG NEG NEG NEG NEG NEG NEG NEG NEG NEG NEG NEG NEG NEG NEG NEG NEG NEG NEG NEG NEG NEG NEG NEG NEG NEG NEG NEG NEG NEG NEG NEG NEG NEG NEG NEG NEG NEG NEG NEG NEG NEG NEG NEG NEG NEG NEG NEG NEG NEG NEG NEG NEG NEG NEG NEG NEG NEG NEG NEG NEG NEG NEG NEG NEG NEG NEG NEG NEG NEG NEG NEG NEG NEG NEG NEG NEG NEG NEG NEG NEG NEG NEG NEG NEG NEG NEG NEG NEG NEG NEG NEG NEG NEG NEG NEG NEG NEG NEG NEG NEG NEG NEG NEG NEG NEG NEG NEG NEG NEG NEG NEG NEG NEG NEG NEG NEG NEG
satNEG NEG NEG NEG NEG NEG NEG NEG NEG NEG NEG NEG NEG NEG NEG NEG NEG NEG NEG NEG NEG NEG NEG NEG NEG NEG NEG NEG NEG NEG NEG NEG NEG NEG NEG NEG NEG NEG NEG NEG NEG NEG NEG NEG NEG NEG NEG NEG NEG NEG NEG NEG NEG NEG NEG NEG NEG NEG NEG NEG NEG NEG NEG NEG NEG NEG NEG NEG NEG NEG NEG NEG NEG NEG NEG NEG NEG NEG NEG NEG NEG NEG NEG NEG NEG NEG NEG NEG NEG NEG NEG NEG NEG NEG NEG NEG NEG NEG NEG NEG NEG NEG NEG NEG NEG NEG NEG NEG NEG NEG NEG AMB NEG NEG NEG NEG NEG NEG NEG AMB NEG NEG NEG NEG NEG NEG NEG NEG NEG NEG NEG NEG NEG NEG NEG NEG NEG NEG AMB NEG NEG NEG NEG NEG NEG NEG NEG NEG NEG NEG NEG NEG NEG NEG NEG NEG NEG NEG NEG NEG NEG NEG NEG NEG NEG NEG NEG NEG NEG NEG NEG NEG NEG NEG NEG NEG NEG NEG
dfrANEG NEG NEG NEG NEG NEG NEG NEG NEG NEG NEG NEG NEG NEG NEG NEG NEG NEG NEG NEG NEG NEG NEG NEG NEG NEG NEG NEG NEG NEG NEG NEG NEG NEG NEG NEG NEG NEG NEG NEG NEG NEG NEG NEG NEG NEG NEG NEG NEG NEG NEG NEG NEG NEG NEG NEG NEG NEG NEG NEG NEG NEG NEG NEG NEG NEG NEG NEG NEG NEG NEG NEG NEG NEG NEG NEG NEG NEG NEG NEG NEG NEG NEG NEG NEG NEG NEG NEG NEG NEG NEG NEG NEG NEG NEG NEG NEG NEG NEG NEG NEG NEG NEG NEG NEG NEG NEG NEG NEG NEG NEG NEG NEG NEG NEG NEG NEG NEG NEG NEG NEG NEG NEG NEG NEG NEG NEG NEG NEG NEG NEG NEG NEG NEG NEG NEG NEG NEG NEG NEG NEG NEG NEG NEG NEG NEG NEG NEG NEG NEG NEG NEG NEG NEG NEG NEG NEG NEG NEG NEG NEG NEG NEG NEG NEG NEG NEG NEG NEG NEG NEG NEG NEG NEG NEG NEG NEG NEG
far1NEG NEG NEG NEG NEG NEG NEG NEG NEG NEG NEG NEG NEG NEG NEG NEG NEG NEG NEG NEG NEG NEG NEG NEG NEG NEG NEG NEG NEG NEG NEG NEG NEG NEG NEG NEG NEG NEG NEG NEG NEG NEG NEG NEG NEG NEG NEG NEG NEG NEG NEG NEG NEG NEG NEG NEG NEG NEG NEG NEG NEG NEG NEG NEG NEG NEG NEG NEG NEG NEG NEG NEG NEG NEG NEG NEG NEG NEG NEG NEG NEG NEG NEG NEG NEG NEG NEG NEG NEG NEG NEG NEG NEG NEG NEG NEG NEG NEG NEG NEG NEG NEG NEG NEG NEG NEG NEG NEG NEG NEG NEG NEG NEG NEG NEG NEG NEG NEG NEG NEG NEG NEG NEG NEG NEG NEG NEG NEG NEG NEG NEG NEG NEG NEG NEG NEG NEG NEG NEG NEG NEG NEG NEG NEG NEG NEG NEG NEG NEG NEG NEG NEG NEG NEG NEG NEG NEG NEG NEG NEG NEG NEG NEG NEG NEG NEG NEG NEG NEG NEG NEG NEG NEG NEG NEG NEG NEG NEG
Q6GD50 (putat. fusidic acid resist.)
NEG NEG NEG NEG NEG NEG NEG NEG NEG NEG NEG NEG NEG NEG NEG NEG NEG NEG NEG NEG NEG NEG NEG NEG NEG NEG NEG NEG NEG NEG NEG NEG NEG NEG NEG NEG NEG NEG NEG NEG NEG NEG NEG NEG NEG NEG NEG NEG NEG NEG NEG NEG NEG NEG NEG NEG NEG NEG NEG NEG NEG NEG NEG NEG NEG NEG NEG NEG NEG NEG NEG NEG NEG NEG NEG NEG NEG NEG NEG NEG NEG NEG NEG NEG NEG NEG NEG NEG NEG NEG NEG NEG NEG NEG NEG NEG NEG NEG NEG NEG NEG NEG NEG NEG NEG NEG NEG NEG NEG NEG NEG NEG NEG NEG NEG NEG NEG NEG NEG NEG NEG NEG NEG NEG NEG NEG NEG NEG NEG NEG NEG NEG NEG NEG NEG NEG NEG NEG NEG NEG NEG NEG NEG NEG NEG NEG NEG NEG NEG NEG NEG NEG NEG NEG NEG NEG NEG NEG NEG NEG NEG NEG NEG NEG NEG NEG NEG NEG NEG NEG NEG NEG NEG NEG NEG NEG NEG NEG
mupRNEG NEG NEG NEG NEG NEG NEG NEG NEG NEG NEG NEG NEG NEG NEG NEG NEG NEG NEG NEG NEG NEG NEG NEG NEG NEG NEG NEG NEG NEG NEG NEG NEG NEG NEG NEG NEG NEG NEG NEG NEG NEG NEG NEG NEG NEG NEG NEG NEG NEG NEG NEG NEG NEG NEG NEG NEG NEG NEG NEG NEG NEG NEG NEG NEG NEG NEG NEG NEG NEG NEG NEG NEG NEG NEG NEG NEG NEG NEG NEG NEG NEG NEG NEG NEG NEG NEG NEG NEG NEG NEG NEG NEG NEG NEG NEG NEG NEG NEG NEG NEG NEG NEG NEG NEG NEG NEG NEG NEG NEG NEG NEG NEG NEG NEG NEG NEG NEG NEG NEG NEG NEG NEG NEG NEG NEG NEG NEG NEG NEG NEG NEG NEG NEG NEG NEG NEG NEG NEG NEG NEG NEG NEG NEG NEG NEG NEG NEG NEG NEG NEG NEG NEG NEG NEG NEG NEG NEG NEG NEG NEG NEG NEG NEG NEG NEG NEG NEG NEG NEG NEG NEG NEG NEG NEG NEG NEG NEG
tetKPOS NEG NEG NEG NEG NEG POS NEG NEG POS POS NEG NEG NEG AMB NEG NEG POS NEG POS NEG NEG NEG POS POS POS POS NEG NEG POS NEG NEG POS POS NEG POS POS NEG NEG POS POS POS NEG POS POS POS NEG NEG NEG NEG NEG NEG POS NEG POS NEG POS NEG NEG NEG NEG NEG POS NEG POS NEG NEG NEG NEG POS NEG NEG POS POS NEG NEG POS POS POS POS POS NEG NEG POS NEG NEG NEG POS NEG POS POS POS POS POS POS POS POS POS POS POS NEG NEG NEG NEG POS POS POS POS NEG NEG NEG NEG POS POS POS NEG POS POS NEG POS POS NEG POS NEG NEG POS NEG POS NEG POS NEG POS POS NEG POS POS POS NEG NEG POS POS POS POS POS POS POS NEG POS POS NEG NEG POS POS POS POS POS POS POS POS NEG NEG POS POS POS NEG POS POS NEG POS POS NEG POS NEG POS POS POS NEG POS
tetMPOS POS POS POS POS POS POS POS POS POS POS POS POS POS POS POS POS POS POS POS POS POS POS POS POS POS POS POS POS POS POS POS POS POS POS POS POS POS POS POS POS POS POS POS POS POS POS POS POS POS POS POS POS POS POS POS POS POS POS POS POS POS POS POS POS POS POS POS POS POS POS POS POS POS POS POS POS POS POS POS POS POS POS POS POS POS POS POS POS POS POS POS POS POS POS POS POS POS POS POS POS POS POS POS POS POS POS POS POS NEG NEG POS POS POS POS POS POS POS POS POS POS POS POS POS POS POS POS POS POS POS POS POS POS POS POS POS POS POS POS POS POS POS POS POS POS POS POS POS POS POS POS POS POS POS POS POS POS POS POS POS POS POS POS POS POS POS POS POS POS POS POS POS POS POS POS POS POS POS
tetEfflux POS POS POS POS POS POS POS POS POS POS POS POS POS POS POS POS POS POS POS POS POS POS POS POS POS POS POS POS POS POS POS POS POS POS POS POS POS POS POS POS POS POS POS POS POS POS POS POS POS POS POS POS POS POS POS POS POS POS POS POS POS POS POS POS POS POS POS POS POS POS POS POS POS POS POS POS POS POS POS POS POS POS POS POS POS POS POS POS POS POS POS POS POS POS POS POS POS POS POS POS POS POS POS POS POS POS POS POS POS POS POS POS POS POS POS POS POS POS POS POS POS POS POS POS POS POS POS POS POS POS POS POS POS POS POS POS POS POS POS POS POS POS POS POS POS POS POS POS POS POS POS POS POS POS POS POS POS POS POS POS POS POS POS POS POS POS POS POS POS POS POS POS POS POS POS POS POS POS
cat-pC221 NEG NEG NEG NEG NEG NEG NEG NEG NEG NEG NEG NEG NEG NEG NEG NEG NEG NEG NEG NEG NEG NEG NEG NEG NEG NEG NEG NEG NEG NEG NEG NEG NEG NEG NEG NEG NEG NEG NEG NEG NEG NEG NEG NEG NEG NEG NEG NEG NEG NEG NEG NEG NEG NEG NEG NEG NEG NEG NEG NEG NEG NEG NEG NEG NEG NEG NEG NEG NEG NEG NEG NEG NEG NEG NEG NEG NEG NEG NEG NEG NEG NEG NEG NEG NEG NEG NEG NEG NEG NEG NEG NEG NEG NEG NEG NEG NEG NEG NEG NEG NEG NEG NEG NEG NEG NEG NEG NEG NEG NEG NEG NEG NEG NEG NEG NEG NEG NEG NEG NEG NEG NEG NEG NEG NEG NEG NEG NEG NEG NEG NEG NEG NEG NEG NEG NEG NEG NEG NEG NEG NEG NEG NEG NEG NEG NEG NEG NEG NEG NEG NEG NEG NEG NEG NEG NEG NEG NEG NEG NEG NEG NEG NEG NEG NEG NEG NEG NEG NEG NEG NEG NEG NEG NEG NEG NEG NEG NEG
cat-pC223 NEG NEG NEG NEG NEG NEG NEG NEG NEG NEG NEG NEG NEG NEG NEG NEG NEG NEG NEG NEG NEG NEG NEG NEG NEG NEG NEG NEG NEG NEG NEG NEG NEG NEG NEG NEG NEG NEG NEG NEG NEG NEG NEG NEG NEG NEG NEG NEG NEG NEG NEG NEG NEG NEG NEG NEG NEG NEG NEG NEG NEG NEG NEG NEG NEG NEG NEG NEG NEG NEG NEG NEG NEG NEG NEG NEG NEG NEG NEG NEG NEG NEG NEG NEG NEG NEG NEG NEG NEG NEG NEG NEG NEG NEG NEG NEG NEG NEG NEG NEG NEG NEG NEG NEG NEG NEG NEG NEG NEG NEG NEG NEG NEG NEG NEG NEG NEG NEG NEG NEG NEG NEG NEG NEG NEG NEG NEG NEG NEG NEG NEG NEG NEG NEG NEG NEG NEG NEG NEG NEG NEG NEG NEG NEG NEG NEG NEG NEG NEG NEG NEG NEG NEG NEG NEG NEG NEG NEG NEG NEG NEG NEG NEG NEG NEG NEG NEG NEG NEG NEG NEG NEG NEG NEG NEG NEG NEG NEG
cat-pMC524 NEG NEG NEG NEG NEG NEG NEG NEG NEG NEG NEG NEG NEG NEG NEG NEG NEG NEG NEG NEG NEG NEG NEG NEG NEG NEG NEG NEG NEG NEG NEG NEG NEG NEG NEG NEG NEG NEG NEG NEG NEG NEG NEG NEG NEG NEG NEG NEG NEG NEG NEG NEG NEG NEG NEG NEG NEG NEG NEG NEG NEG NEG NEG NEG NEG NEG NEG NEG NEG NEG NEG NEG NEG NEG NEG NEG NEG NEG NEG NEG NEG NEG NEG NEG NEG NEG NEG NEG NEG NEG NEG NEG NEG NEG NEG NEG NEG NEG NEG NEG NEG NEG NEG NEG NEG NEG NEG NEG NEG NEG NEG NEG NEG NEG NEG NEG NEG NEG NEG NEG NEG NEG NEG NEG NEG NEG NEG NEG NEG NEG NEG NEG NEG NEG NEG NEG NEG NEG NEG NEG NEG NEG NEG NEG NEG NEG NEG NEG NEG NEG NEG NEG NEG NEG NEG NEG NEG NEG NEG NEG NEG NEG NEG NEG NEG AMB NEG NEG NEG NEG NEG NEG NEG NEG NEG NEG NEG NEG
cat-pSBK203R NEG NEG NEG NEG NEG NEG NEG NEG NEG NEG NEG NEG NEG NEG NEG NEG NEG NEG NEG NEG NEG NEG NEG NEG NEG NEG NEG NEG NEG NEG NEG NEG NEG NEG NEG NEG NEG NEG NEG NEG NEG NEG NEG NEG NEG NEG NEG NEG NEG NEG NEG NEG NEG NEG NEG NEG NEG NEG NEG NEG NEG NEG NEG NEG NEG NEG NEG NEG NEG NEG NEG NEG NEG NEG NEG NEG NEG NEG NEG NEG NEG NEG NEG NEG NEG NEG NEG NEG NEG NEG NEG NEG NEG NEG NEG NEG NEG NEG NEG NEG NEG NEG NEG NEG NEG NEG NEG NEG NEG NEG NEG NEG NEG NEG NEG NEG NEG NEG NEG NEG NEG NEG NEG NEG NEG NEG NEG NEG NEG NEG NEG NEG NEG NEG NEG NEG NEG NEG NEG NEG NEG NEG NEG NEG NEG NEG NEG NEG NEG NEG NEG NEG NEG NEG NEG NEG NEG NEG NEG NEG NEG NEG NEG NEG NEG NEG NEG NEG NEG NEG NEG NEG NEG NEG NEG NEG NEG NEG
cat-Saga n.a. n.a. n.a. n.a. n.a. n.a. n.a. n.a. n.a. n.a. n.a. n.a. n.a. n.a. n.a. n.a. n.a. n.a. n.a. n.a. n.a. n.a. n.a. n.a. n.a. n.a. n.a. n.a. n.a. n.a. n.a. n.a. n.a. n.a. n.a. n.a. n.a. n.a. n.a. n.a. n.a. n.a. n.a. n.a. n.a. n.a. n.a. n.a. n.a. n.a. n.a. n.a. n.a. n.a. n.a. n.a. n.a. n.a. n.a. n.a. n.a. n.a. n.a. n.a. n.a. n.a. n.a. n.a. n.a. n.a. n.a. n.a. n.a. n.a. n.a. n.a. n.a. n.a. n.a. n.a. n.a. n.a. n.a. n.a. n.a. n.a. n.a. n.a. n.a. n.a. n.a. n.a. n.a. n.a. n.a. n.a. n.a. n.a. n.a. n.a. n.a. n.a. n.a. n.a. n.a. n.a. n.a. n.a. n.a. n.a. n.a. n.a. n.a. n.a. n.a. n.a. n.a. n.a. n.a. n.a. n.a. n.a. n.a. n.a. n.a. n.a. n.a. n.a. n.a. n.a. n.a. n.a. n.a. n.a. n.a. n.a. n.a. n.a. n.a. n.a. n.a. n.a. n.a. n.a. n.a. n.a. n.a. n.a. n.a. n.a. n.a. n.a. n.a. n.a. n.a. n.a. n.a. n.a. n.a. n.a. n.a. n.a. n.a. n.a. n.a. n.a. n.a. n.a. n.a. n.a. n.a. n.a. n.a. n.a. n.a. n.a. n.a. n.a.
cfr NEG NEG NEG NEG NEG NEG NEG NEG NEG NEG NEG NEG NEG NEG NEG NEG NEG NEG NEG NEG NEG NEG NEG NEG NEG NEG NEG NEG NEG NEG NEG NEG NEG NEG NEG NEG NEG NEG NEG NEG NEG NEG NEG NEG NEG NEG NEG NEG NEG NEG NEG NEG NEG NEG NEG NEG NEG NEG NEG NEG NEG NEG NEG NEG NEG NEG NEG NEG NEG NEG NEG NEG NEG NEG NEG NEG NEG NEG NEG NEG NEG NEG NEG NEG NEG NEG NEG NEG NEG NEG AMB NEG NEG NEG NEG NEG NEG NEG NEG NEG NEG NEG NEG NEG NEG NEG NEG NEG NEG NEG NEG NEG NEG NEG NEG NEG NEG NEG NEG NEG NEG NEG NEG NEG NEG NEG NEG NEG NEG NEG NEG NEG NEG NEG NEG NEG NEG NEG NEG NEG NEG NEG NEG NEG NEG NEG NEG NEG NEG NEG NEG NEG NEG NEG NEG NEG NEG NEG NEG NEG NEG NEG NEG NEG NEG NEG NEG NEG NEG NEG NEG NEG NEG NEG NEG NEG NEG NEG
fexA NEG NEG NEG NEG NEG NEG POS NEG NEG NEG NEG NEG NEG NEG POS NEG NEG NEG NEG NEG NEG NEG NEG NEG NEG NEG NEG NEG NEG NEG NEG NEG POS POS NEG NEG NEG NEG NEG NEG POS POS NEG NEG NEG POS NEG NEG NEG NEG NEG NEG NEG NEG NEG NEG POS NEG NEG NEG NEG NEG NEG NEG NEG NEG NEG NEG NEG NEG NEG NEG POS NEG NEG NEG NEG POS NEG NEG NEG NEG NEG POS NEG NEG NEG NEG NEG NEG NEG NEG NEG NEG NEG NEG NEG NEG NEG NEG NEG NEG NEG NEG NEG NEG NEG NEG NEG NEG NEG NEG NEG POS NEG NEG NEG NEG NEG NEG NEG NEG NEG NEG NEG NEG NEG NEG NEG NEG NEG POS POS NEG POS POS POS NEG NEG NEG NEG NEG NEG NEG NEG NEG NEG NEG NEG NEG NEG NEG NEG NEG NEG NEG NEG NEG NEG NEG NEG NEG NEG NEG NEG NEG NEG NEG NEG NEG NEG NEG POS NEG NEG NEG NEG NEG
fosB NEG NEG AMB NEG NEG NEG NEG AMB NEG AMB AMB NEG NEG NEG NEG NEG AMB AMB NEG AMB NEG AMB NEG NEG NEG NEG AMB NEG POS AMB AMB NEG AMB AMB NEG POS AMB AMB POS AMB NEG NEG NEG NEG NEG NEG NEG NEG NEG NEG NEG NEG NEG NEG NEG NEG NEG NEG NEG NEG NEG NEG NEG NEG NEG NEG NEG NEG NEG NEG NEG NEG NEG NEG NEG NEG NEG NEG NEG NEG NEG NEG NEG AMB AMB AMB AMB NEG NEG NEG AMB NEG NEG AMB AMB AMB AMB AMB AMB NEG AMB NEG NEG AMB AMB NEG NEG AMB AMB POS POS AMB AMB POS POS AMB NEG POS NEG AMB AMB NEG NEG AMB AMB AMB AMB NEG AMB AMB AMB AMB POS POS AMB AMB POS POS AMB NEG NEG NEG NEG NEG NEG NEG NEG NEG NEG NEG NEG NEG NEG NEG NEG NEG NEG NEG NEG NEG NEG NEG NEG NEG NEG NEG NEG NEG NEG NEG NEG NEG NEG NEG NEG NEG NEG NEG
fosB-plasmid NEG NEG NEG NEG NEG NEG NEG NEG NEG NEG NEG NEG NEG NEG NEG NEG NEG NEG NEG NEG NEG NEG NEG NEG NEG NEG NEG NEG NEG NEG NEG NEG NEG NEG NEG NEG NEG NEG NEG NEG NEG NEG NEG NEG NEG AMB NEG NEG NEG NEG AMB NEG NEG NEG NEG NEG AMB NEG NEG NEG NEG NEG NEG NEG NEG NEG NEG NEG NEG NEG NEG NEG NEG NEG NEG NEG NEG NEG NEG NEG NEG NEG NEG NEG NEG NEG NEG NEG NEG NEG NEG NEG NEG NEG NEG NEG NEG NEG NEG NEG NEG NEG NEG NEG NEG NEG NEG NEG NEG AMB NEG NEG NEG NEG NEG NEG NEG NEG NEG NEG NEG NEG POS NEG NEG NEG NEG NEG NEG NEG NEG NEG NEG NEG NEG NEG NEG NEG NEG NEG NEG NEG NEG NEG NEG NEG NEG NEG NEG NEG NEG NEG NEG NEG AMB NEG NEG NEG NEG NEG NEG NEG NEG NEG NEG POS NEG NEG NEG NEG NEG NEG NEG NEG NEG NEG NEG NEG
qacA NEG NEG NEG NEG NEG NEG NEG NEG NEG NEG NEG NEG NEG NEG NEG NEG NEG NEG NEG NEG NEG NEG NEG NEG NEG NEG NEG NEG NEG NEG NEG NEG NEG NEG NEG NEG NEG NEG NEG NEG NEG NEG NEG NEG NEG NEG NEG NEG NEG NEG NEG NEG NEG NEG NEG NEG NEG NEG NEG NEG NEG NEG NEG NEG NEG NEG NEG NEG NEG NEG NEG NEG NEG NEG NEG NEG NEG NEG NEG NEG NEG NEG NEG NEG NEG NEG NEG NEG NEG NEG NEG NEG NEG NEG NEG NEG NEG NEG NEG NEG NEG NEG NEG NEG NEG NEG NEG NEG NEG NEG NEG NEG NEG NEG NEG NEG NEG NEG NEG NEG NEG NEG NEG NEG NEG NEG NEG NEG NEG NEG NEG NEG NEG NEG NEG NEG NEG NEG NEG NEG NEG NEG NEG NEG NEG NEG NEG NEG NEG NEG NEG NEG NEG NEG NEG NEG NEG NEG NEG NEG NEG NEG NEG NEG NEG NEG NEG NEG NEG NEG NEG NEG NEG NEG NEG NEG NEG NEG
qacC NEG NEG NEG NEG NEG NEG NEG NEG NEG NEG NEG NEG NEG NEG NEG NEG NEG NEG NEG NEG NEG NEG NEG NEG NEG NEG NEG NEG NEG NEG NEG NEG NEG NEG NEG NEG NEG NEG NEG NEG NEG NEG NEG NEG NEG NEG NEG NEG NEG NEG NEG NEG NEG NEG NEG NEG NEG NEG NEG NEG NEG NEG NEG NEG NEG NEG NEG NEG NEG NEG NEG NEG NEG NEG NEG NEG NEG NEG NEG NEG NEG NEG NEG NEG NEG NEG NEG NEG NEG NEG NEG NEG NEG NEG NEG NEG NEG NEG NEG NEG NEG NEG NEG NEG NEG NEG NEG NEG NEG NEG NEG NEG NEG NEG NEG NEG NEG NEG NEG NEG NEG NEG NEG NEG NEG NEG NEG NEG NEG NEG NEG NEG NEG NEG NEG NEG NEG NEG NEG NEG NEG NEG NEG POS NEG NEG NEG NEG NEG NEG NEG NEG NEG NEG NEG NEG NEG NEG NEG NEG NEG NEG NEG NEG NEG NEG NEG NEG NEG NEG NEG NEG NEG NEG NEG NEG NEG NEG
qacC-equine NEG NEG NEG NEG NEG NEG NEG NEG NEG NEG NEG NEG NEG NEG NEG NEG NEG NEG NEG NEG NEG NEG NEG NEG NEG NEG NEG NEG NEG NEG NEG NEG NEG NEG NEG NEG NEG NEG NEG NEG NEG NEG NEG POS NEG NEG NEG NEG NEG NEG NEG NEG NEG NEG NEG NEG NEG NEG NEG NEG NEG NEG NEG NEG NEG NEG NEG NEG NEG NEG NEG NEG NEG NEG NEG NEG NEG NEG NEG NEG NEG NEG NEG NEG NEG NEG NEG NEG NEG NEG NEG NEG NEG NEG NEG NEG NEG NEG NEG NEG NEG NEG NEG NEG POS NEG NEG NEG NEG NEG NEG NEG NEG NEG NEG NEG NEG NEG NEG NEG NEG NEG POS NEG NEG NEG NEG NEG NEG NEG NEG NEG NEG NEG NEG NEG NEG NEG NEG NEG NEG NEG NEG NEG NEG NEG NEG NEG NEG NEG NEG NEG NEG NEG NEG NEG NEG NEG NEG NEG NEG NEG NEG NEG NEG NEG NEG NEG NEG NEG NEG NEG NEG NEG NEG NEG NEG NEG
qacC-SA5 NEG NEG NEG NEG NEG NEG NEG NEG NEG NEG NEG NEG NEG NEG NEG NEG NEG NEG NEG NEG NEG NEG NEG NEG NEG NEG NEG NEG NEG NEG NEG NEG NEG NEG NEG NEG NEG NEG NEG NEG NEG NEG NEG NEG NEG NEG NEG NEG NEG NEG NEG NEG NEG NEG NEG NEG NEG NEG NEG NEG NEG NEG NEG NEG NEG NEG NEG NEG NEG NEG NEG NEG NEG NEG NEG NEG NEG NEG NEG NEG NEG NEG NEG NEG NEG NEG NEG NEG NEG NEG NEG NEG NEG NEG NEG NEG NEG NEG NEG NEG NEG NEG NEG NEG POS NEG NEG NEG NEG NEG NEG NEG NEG NEG NEG NEG NEG NEG NEG NEG NEG NEG POS NEG NEG NEG NEG NEG NEG NEG NEG NEG NEG NEG NEG NEG NEG NEG NEG NEG NEG NEG NEG NEG NEG NEG NEG NEG NEG NEG NEG NEG NEG NEG NEG NEG NEG NEG NEG NEG NEG NEG NEG NEG NEG NEG NEG NEG NEG NEG NEG NEG NEG NEG NEG NEG NEG NEG
qacC-Ssap NEG NEG NEG NEG NEG NEG NEG NEG NEG NEG NEG NEG NEG NEG NEG NEG NEG NEG NEG NEG NEG NEG NEG NEG NEG NEG NEG NEG NEG NEG NEG NEG NEG NEG NEG NEG NEG NEG NEG NEG NEG NEG NEG NEG NEG NEG NEG NEG NEG NEG NEG NEG NEG NEG NEG NEG NEG NEG NEG NEG NEG NEG NEG NEG NEG NEG NEG NEG NEG NEG NEG NEG NEG NEG NEG NEG NEG NEG NEG NEG NEG NEG NEG NEG NEG NEG NEG NEG NEG NEG NEG NEG NEG NEG NEG NEG NEG NEG NEG NEG NEG NEG NEG NEG NEG NEG NEG NEG NEG NEG NEG NEG NEG NEG NEG NEG NEG NEG NEG NEG NEG NEG NEG NEG NEG NEG NEG NEG NEG NEG NEG NEG NEG NEG NEG NEG NEG NEG NEG NEG NEG NEG NEG NEG NEG NEG NEG NEG NEG NEG NEG NEG NEG NEG NEG NEG NEG NEG NEG NEG NEG NEG NEG NEG NEG NEG NEG NEG NEG NEG NEG NEG NEG NEG NEG NEG NEG NEG
qacC-ST94 NEG NEG NEG NEG NEG NEG NEG NEG NEG NEG NEG NEG NEG NEG NEG NEG NEG NEG NEG NEG NEG NEG NEG NEG NEG NEG NEG NEG NEG NEG NEG NEG NEG NEG NEG NEG NEG NEG NEG NEG NEG NEG NEG NEG NEG NEG NEG NEG NEG NEG NEG NEG NEG NEG NEG NEG NEG NEG NEG NEG NEG NEG NEG NEG NEG NEG NEG NEG NEG NEG NEG NEG NEG NEG NEG NEG NEG NEG NEG NEG NEG NEG NEG NEG NEG NEG NEG NEG NEG NEG NEG NEG POS POS POS NEG NEG NEG NEG NEG NEG NEG NEG NEG POS NEG NEG NEG NEG POS NEG NEG NEG NEG NEG NEG NEG POS NEG NEG NEG NEG POS NEG POS NEG NEG NEG NEG NEG NEG NEG NEG NEG NEG NEG NEG NEG NEG NEG NEG NEG NEG NEG NEG NEG NEG NEG NEG NEG NEG NEG POS NEG NEG POS POS NEG NEG NEG NEG NEG NEG NEG NEG NEG NEG NEG POS NEG NEG NEG NEG NEG NEG NEG NEG NEG
vanANEG NEG NEG NEG NEG NEG NEG NEG NEG NEG NEG NEG NEG NEG NEG NEG NEG NEG NEG NEG NEG NEG NEG NEG NEG NEG NEG NEG NEG NEG NEG NEG NEG NEG NEG NEG NEG NEG NEG NEG NEG NEG NEG NEG NEG NEG NEG NEG NEG NEG NEG NEG NEG NEG NEG NEG NEG NEG NEG NEG NEG NEG NEG NEG NEG NEG NEG NEG NEG NEG NEG NEG NEG NEG NEG NEG NEG NEG NEG NEG NEG NEG NEG NEG NEG NEG NEG NEG NEG NEG NEG NEG NEG NEG NEG NEG NEG NEG NEG NEG NEG NEG NEG NEG NEG NEG NEG NEG NEG NEG NEG NEG NEG NEG NEG NEG NEG NEG NEG NEG NEG NEG NEG NEG NEG NEG NEG NEG NEG NEG NEG NEG NEG NEG NEG NEG NEG NEG NEG NEG NEG NEG NEG NEG NEG NEG NEG NEG NEG NEG NEG NEG NEG NEG NEG NEG NEG NEG NEG NEG NEG NEG NEG NEG NEG NEG NEG NEG NEG NEG NEG NEG NEG NEG NEG NEG NEG NEG
vanBNEG NEG NEG NEG NEG NEG NEG NEG NEG NEG NEG NEG NEG NEG NEG NEG NEG NEG NEG NEG NEG NEG NEG NEG NEG NEG NEG NEG NEG NEG NEG NEG NEG NEG NEG NEG NEG NEG NEG NEG NEG NEG NEG NEG NEG NEG NEG NEG NEG NEG NEG NEG NEG NEG NEG NEG NEG NEG NEG NEG NEG NEG NEG NEG NEG NEG NEG NEG NEG NEG NEG NEG NEG NEG NEG NEG NEG NEG NEG NEG NEG NEG NEG NEG NEG NEG NEG NEG NEG NEG NEG NEG NEG NEG NEG NEG NEG NEG NEG NEG NEG NEG NEG NEG NEG NEG NEG NEG NEG NEG NEG NEG NEG NEG NEG NEG NEG NEG NEG NEG NEG NEG NEG NEG NEG NEG NEG NEG NEG NEG NEG NEG NEG NEG NEG NEG NEG NEG NEG NEG NEG NEG NEG NEG NEG NEG NEG NEG NEG NEG NEG NEG NEG NEG NEG NEG NEG NEG NEG NEG NEG NEG NEG NEG NEG NEG NEG NEG NEG NEG NEG NEG NEG NEG NEG NEG NEG NEG
vanZNEG NEG NEG NEG NEG NEG NEG NEG NEG NEG NEG NEG NEG NEG NEG NEG NEG NEG NEG NEG NEG NEG NEG NEG NEG NEG NEG NEG NEG NEG NEG NEG NEG NEG NEG NEG NEG NEG NEG NEG NEG NEG NEG NEG NEG NEG NEG NEG NEG NEG NEG NEG NEG NEG NEG NEG NEG NEG NEG NEG NEG NEG NEG NEG NEG NEG NEG NEG NEG NEG NEG NEG NEG NEG NEG NEG NEG NEG NEG NEG NEG NEG NEG NEG NEG NEG NEG NEG NEG NEG NEG NEG NEG NEG NEG NEG NEG NEG NEG NEG NEG NEG NEG NEG NEG NEG NEG NEG NEG NEG NEG NEG NEG NEG NEG NEG NEG NEG NEG NEG NEG NEG NEG NEG NEG NEG NEG NEG NEG NEG NEG NEG NEG NEG NEG NEG NEG NEG NEG NEG NEG NEG NEG NEG NEG NEG NEG NEG NEG NEG NEG NEG NEG NEG NEG NEG NEG NEG NEG NEG NEG NEG NEG NEG NEG NEG NEG NEG NEG NEG NEG NEG NEG NEG NEG NEG NEG NEG
Veal calves PigsRe
sistan
ce G
enes
Penic
illina
seML
S-An
tibiot
icsAm
inogl.
Misc
. Res
istan
ce G
enes
Misc
. Efflu
x Tr
ansp
orter
sGl
ycop
ept.
Figure MRSA02. Micro-array results of resistance genes detected in 79 MRSA from veal calves (left) and 102 MRSA from pigs (right) isolated in The Netherlands in 2012. Red indicates a positive result, yellow is ambiguous and green is negative.
M A R A N 2 0 1 3
48
Detailed information on microbiological methods used are available on the website http://www.wageningenur.nl/nl/Expertises-Dienstverlening/Onderzoeksinstituten/central-veterinary-institute/Publicaties-CVI/MARAN-Rapporten.htm
5 Appendix II. Materials and Methods