Netflix Optimization: A Confluence of Metrics, Algorithms ... · 1 Netflix Optimization: A...
63
1 Netflix Optimization: A Confluence of Metrics, Algorithms, and Experimentation CIKM 2013, UEO Workshop Caitlin Smallwood
-
Upload
truongdung -
Category
Documents
-
view
223 -
download
0
Transcript of Netflix Optimization: A Confluence of Metrics, Algorithms ... · 1 Netflix Optimization: A...

1
Netflix Optimization: A Confluence of
Metrics, Algorithms, and Experimentation CIKM 2013, UEO Workshop
Caitlin Smallwood

2
Allegheny
Monongahela
Ohio River

TV & Movie Enjoyment Made Easy
Stream any video in our collection on a variety of devices
for $7.99 a month

Over
800 Partner Products

5

Content Partners

Kids

Original Content

The UI
9

The Data
10
Visitor data
User Metadata
Social
Users’ Plays (streaming)
Users’ Ratings
Users’ Searches
Device streaming
performance
Video Metadata
Video Impressions

A few facts
11
40M members globally
Ratings: 4M+/day
Searches: 3M+/day
Plays: 1B+/month

Metrics
12

13
“Engagement is a user’s response to an interaction
that gains, maintains, and encourages their attention,
particularly when they are intrinsically motivated”
- Jacques, 1996

User Engagement Measurement Techniques
Self-reported or “explicit”
Satisfaction, likelihood to recommend, likelihood to
use or re-use, self-reported usage, self-reported
preferences
Physical observation of users
User experience in-person research, eye tracking
Behavioral observation of users
Analytics on behavioral data 14
Common user engagement metrics
Lifetime value (LTV)
Retention
Page views
Time spent
Number of distinct actions
Recency of last visit/use
Time between visits/uses 15

YOUR Engagement Metrics
What’s your business model?
What do you want your customers to do?
What do your happiest, most valuable customers do?
16
What’s your business model?
Monthly subscription
What do you want your customers to do?
Retain monthly (forever) because they enjoy the service
What do your happiest, most valuable customers do?
Retain month over month…
and watch

Monthly Retention
17

Specificity
18
Billing
Cancel
request
Cancel
Cancel
request
Revoke
cancel
Billing
Failure
Billing
Recovery
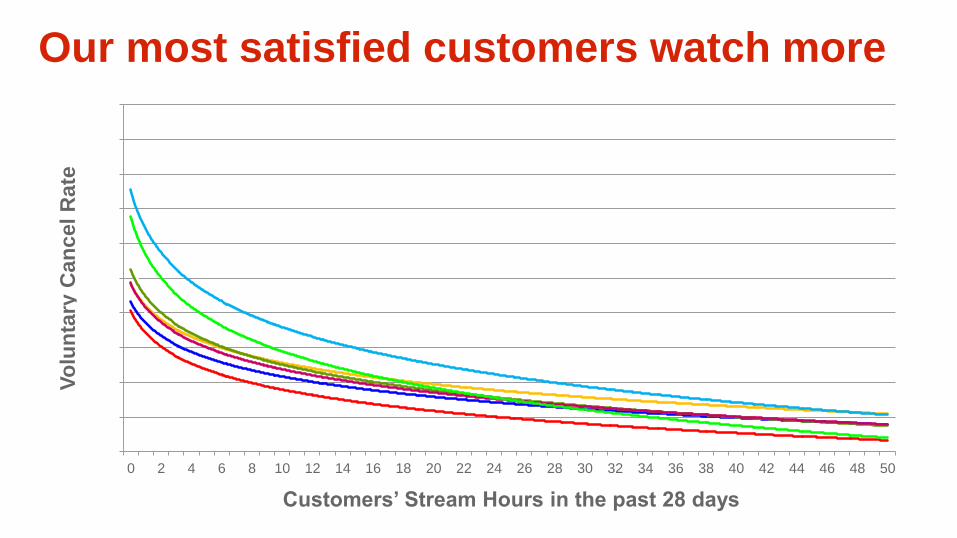
Our most satisfied customers watch more
0%
2%
4%
6%
8%
10%
12%
14%
16%
18%
20%
0 2 4 6 8 10 12 14 16 18 20 22 24 26 28 30 32 34 36 38 40 42 44 46 48 50
Vo
lun
tary
Can
cel
Rate
Customers’ Stream Hours in the past 28 days
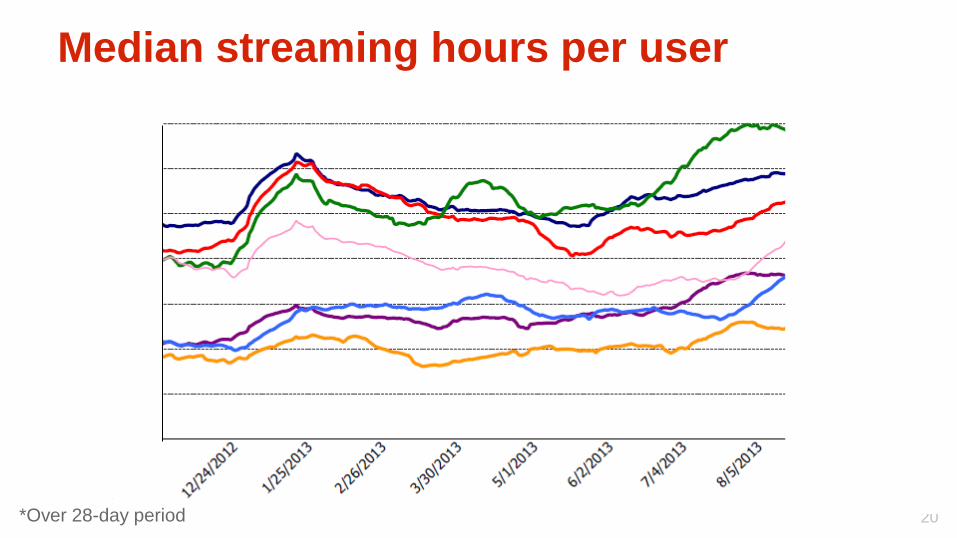
Median streaming hours per user
20 *Over 28-day period

User engagement = user granularity
% of users who do x
Medians – or better, distributions – of
user-level volume measures
21

Negative metrics can also be useful
22 *Over 28-day period
Percent of users with no streaming*

One process for identifying engagement
metrics
Decide on criteria for a “good” metric
Brainstorm metrics that might meet criteria
Identify the best candidates
Predictive modeling or other analytic techniques
Expert judgment
Qualitative research
Validate by trying to use the metric
Experiment measurement
Algorithm or model input
Trends
23

Some metric criteria suggestions
Metric is correlated with core business metrics
(conversion, retention)
and contributes unique predictive power beyond the
other metrics?
Metric is user-level or weights users properly
toward core metrics
Metric is actionable
Metric shows differentiation 24

Brainstorm from all angles
Variety/novelty, joy, trust, focused attention
Positive and negative experiences
What, who, how, why?
Recency, Frequency, Monetization
Short-term, long-term, changes over time
Metric variants
… 25

Example of ranking metrics’ abilities to explain
core business metrics (retention in this case)
26
0
0.002
0.004
0.006
0.008
0.01
0.012
Va
ria
ble
Im
po
rtance
Me
asu
re

27

Algorithms
28
Algorithms for…
Content recommendations
Search results
Streaming experience
29

80% of plays are based on recommendations
PS3
phone
tablet
Same algorithms power the recommendations on all devices

The Basics
31
Data Inputs
Explicit member data
• Taste preferences
• Title ratings
Implicit member data
• Viewing history
• Queue adds
• Ratings
Non-personalized data
• Content library
• Title tags
• Popularity
Algorithms Recommendations
• Rows
• Titles within rows

What the algorithms do
Row selection
Video ranking
Video-video similarity
User-user similarity
Search recommendations
Also need to consider complex
characteristics and tradeoffs such
as:
Popularity vs personalization
Diversity
Novelty/Freshness
Evidence

Probability, statistics, optimization,
dynamic systems Hypothesis testing, estimation,
delta method, bootstrapping
Linear and generalized linear
models
Matrix factorization
Markov processes
Various clustering algorithms
Bayesian models
Latent Dirichlet Allocation
L1 and L2 regularizations
Association Rules
Tree-based methods
Bagging and boosting
Vector spaces and the
Mahalanobis distance
…
33

Source of Signals
34
Any can provide valuable signals
Entire
population Segments Individuals

35
Evolution occurs through experimentation

Faster Innovation Through Offline Testing
Evaluate Model
Generate Hypothesis
Train Model
A/B Test Roll Out Change Offline

Offline Metrics
Offline metrics help guide decisions on what to A/B test
Understand metric limitations and ignore as needed
No offline set of metrics is predictive enough of cancelation rates
Some metrics predict local algorithm metrics
In-line with the way algorithms are optimized
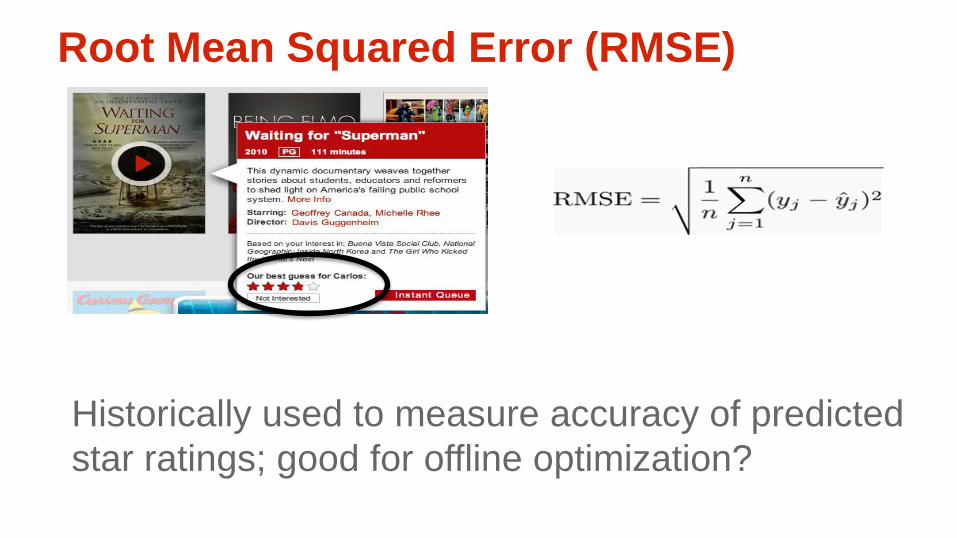
Root Mean Squared Error (RMSE)
Historically used to measure accuracy of predicted
star ratings; good for offline optimization?

vs.
Why would RMSE improvement be a key
driver to increase retention?

Personalized Video Ranking

Personalized Video Ranking
TopN problem
Natural metrics come from information retrieval:
Mean reciprocal rank
Precision
Recall
…
But which correlate with cancelation rates and
overall usage?

Interesting Challenges in Algorithms How do we develop recommender systems that directly
optimize long term goals (user retention and overall consumption) offline?
The effect of presentation bias
Can any offline metric help?
Can we remove this bias from our signals and algorithms?
What’s the best way to define the space of rows of videos?
What’s the best way to construct a page of recommendations?
How can we best cold-start users and videos?

Experimentation
43
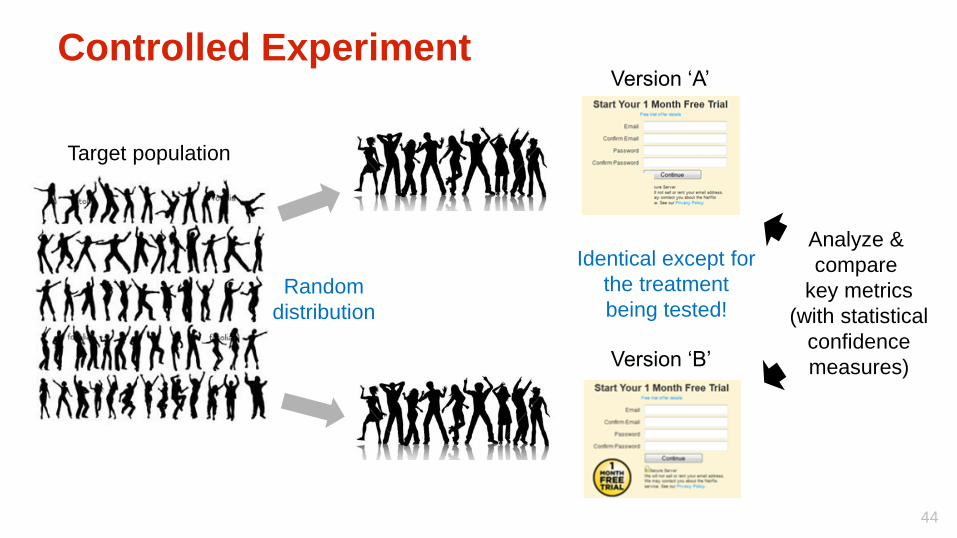
Controlled Experiment
44
Analyze &
compare
key metrics
(with statistical
confidence
measures)
Target population
Random
distribution
Version ‘A’
Version ‘B’
Identical except for
the treatment
being tested!

The Appeal: Causality
45

Ingredients of great experimentation
Innovation and prioritization of impactful tests
Experimental design (methodology, test cell design, sampling…)
Execution of controlled experiment
Accuracy (of data, engineering, statistics)
Proper decision-making metrics & measurement techniques
Pace & agility
Interpretation and decision-making
46

2010
47

Now
48
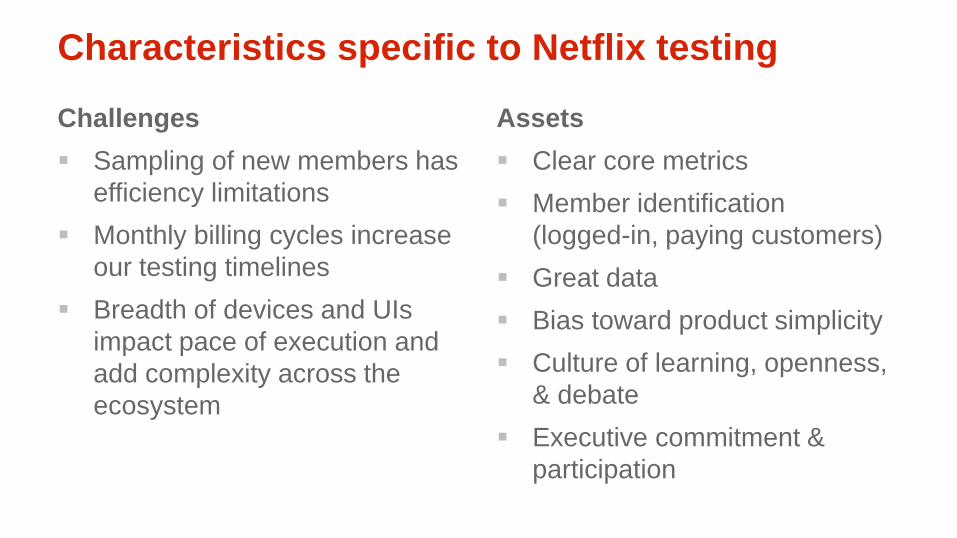
Characteristics specific to Netflix testing
Challenges
Sampling of new members has
efficiency limitations
Monthly billing cycles increase
our testing timelines
Breadth of devices and UIs
impact pace of execution and
add complexity across the
ecosystem
Assets
Clear core metrics
Member identification
(logged-in, paying customers)
Great data
Bias toward product simplicity
Culture of learning, openness,
& debate
Executive commitment &
participation

Metrics
Cumulative Retention
Streaming
Many other “secondary” engagement metrics
50

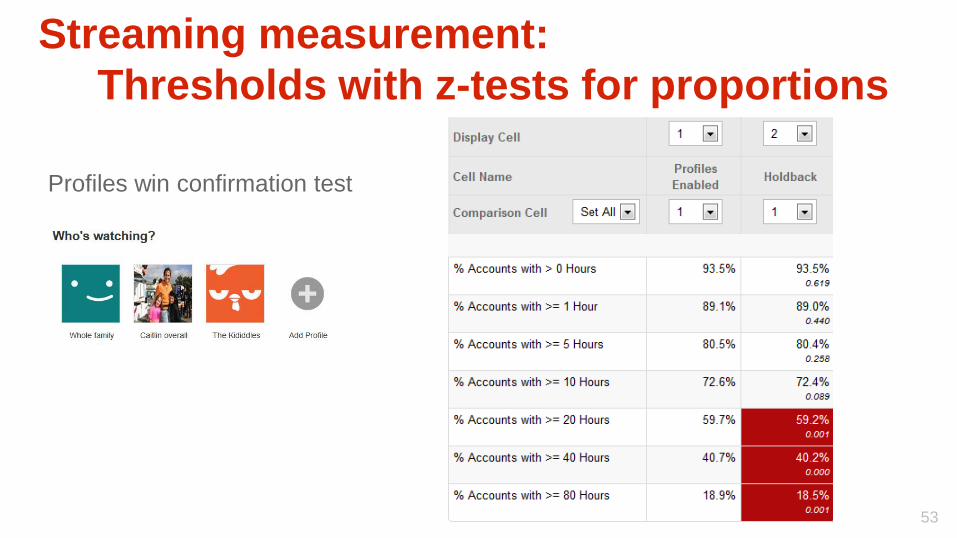
Streaming measurement:
Kolmogorov-Smirnov (KS) test
Hours
KS Test statistic

Streaming measurement:
KS example
Streaming measurement:
Thresholds with z-tests for proportions
53
Profiles win confirmation test

54
Probability of retaining at each future billing cycle
based on streaming S hours at N days of tenure
Total hours consumed during 22 days of membership
Re
ten
tio
n
Streaming measurement:
Streaming score model
Challenges with “hours”
Not all “hours” have equal value to customers
TV vs features have dramatically different
consumption rates
Service is available after cancel request
Timespan for hours measurement
55

“Similars Algorithm” Experiment
56
Algorithm A
Algorithm B

What should we measure in this test? Ideas?
Retention & overall streaming
CTR on Similars rows; Share of hours from similars rows?
Should we care about cannibalization?
Horizontal position played?
Should we measure whether the new algorithm generated results that were more “similar”?
What does the customer expect out of the row based on its label?
Did the customer enjoy the titles more even if he/she did not watch more in total hours?
57

How might we know whether a customer
enjoyed a title?
Gave it a high rating
But only a subset of users rate
Came back to watch again
Different opportunity for a TV show vs movie
Fraction of content viewed
𝐹𝐶𝑉 =𝑑𝑢𝑟𝑎𝑡𝑖𝑜𝑛 𝑤𝑎𝑡𝑐ℎ𝑒𝑑
𝑡𝑖𝑡𝑙𝑒 𝑟𝑢𝑛𝑡𝑖𝑚𝑒
58

Fraction of Content Viewed (“FCV”) Average FCV
# of titles viewed/# of streaming hours
% of Titles with FCV <= 15%
% of sessions with FCV <= 15%
% of Active Days with a Play >= 90%
% of Play Days with a Full Play
% of Hours from Browse Plays
…
59
Variants for:
• TV vs movies
• Episode, season, show
• Timeframes
• How the title was found

60
Nearly every engagement metric is highly
correlated with total streaming hours

Best metric variants do provide some lift
61 Controlling for streaming hours, these metrics improve retention prediction

62
New metrics are often tested
as algorithm input signals
(and vice-versa)

63
Metrics
Algorithms
Acknowledgements:
• Carlos Gomez-Uribe
• Juliette Aurisset
• Kelly Uphoff
Experimentation