Net Promoter Score: Automatic Root Cause Analysis with a Waterfall chart
12
CustomerGauge Automating Root Cause Analysis for Net Promoter Adam Dorrell 04 January 2011
-
Upload
customergauge -
Category
Business
-
view
1.366 -
download
2
Transcript of Net Promoter Score: Automatic Root Cause Analysis with a Waterfall chart

CustomerGauge Automating Root Cause Analysis for Net Promoter
Adam Dorrell 04 January 2011
Understanding Root Cause
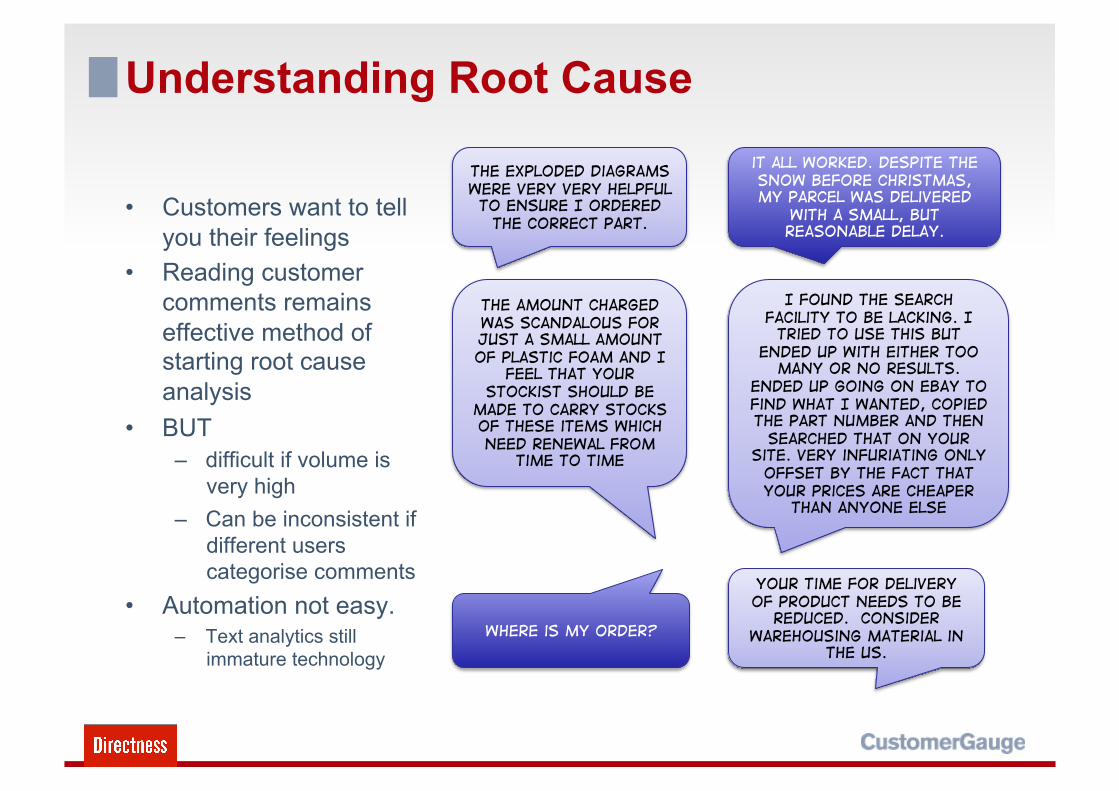
• Customers want to tell you their feelings
• Reading customer comments remains effective method of starting root cause analysis
• BUT – difficult if volume is
very high – Can be inconsistent if
different users categorise comments
• Automation not easy. – Text analytics still
immature technology
Your time for delivery of product needs to be
reduced. Consider warehousing material in
the US.
the exploded diagrams were very very helpful to ensure I ordered
the correct part.
the amount charged was scandalOUS for just a small amount of plastic foam and I
feel that your stockist should be
made to carry stocks of these items which need renewal from
time to time
it all worked. Despite the snow before Christmas, my parcel was delivered
with a small, but reasonable delay.
Where is my order?
I found the search facility to be lacking. I tried to use this but
ended up with eithER too many or no results.
ended up going on ebay to find what I wanted, copied the part number and then
searched that on your site. Very infuriating only
offset by the fact that your prices are cheaper
than anyone else

Automating Root Cause Analysis
• CustomerGauge can help automatically organise customer comments into “buckets”
• Customer chooses issues him/herself
• Benefits: – Send to most appropriate person – Assign values to issues – Understand Net Promoter
Impact – Major issues and
sub-issues can be reported on
logistics CommUNI-CATION
CUSTOMER SERVICE
PRODUCT
LATE Delivery
DAMAGE Returns
Root-cause Waterfall Chart
Reporting on Root Cause
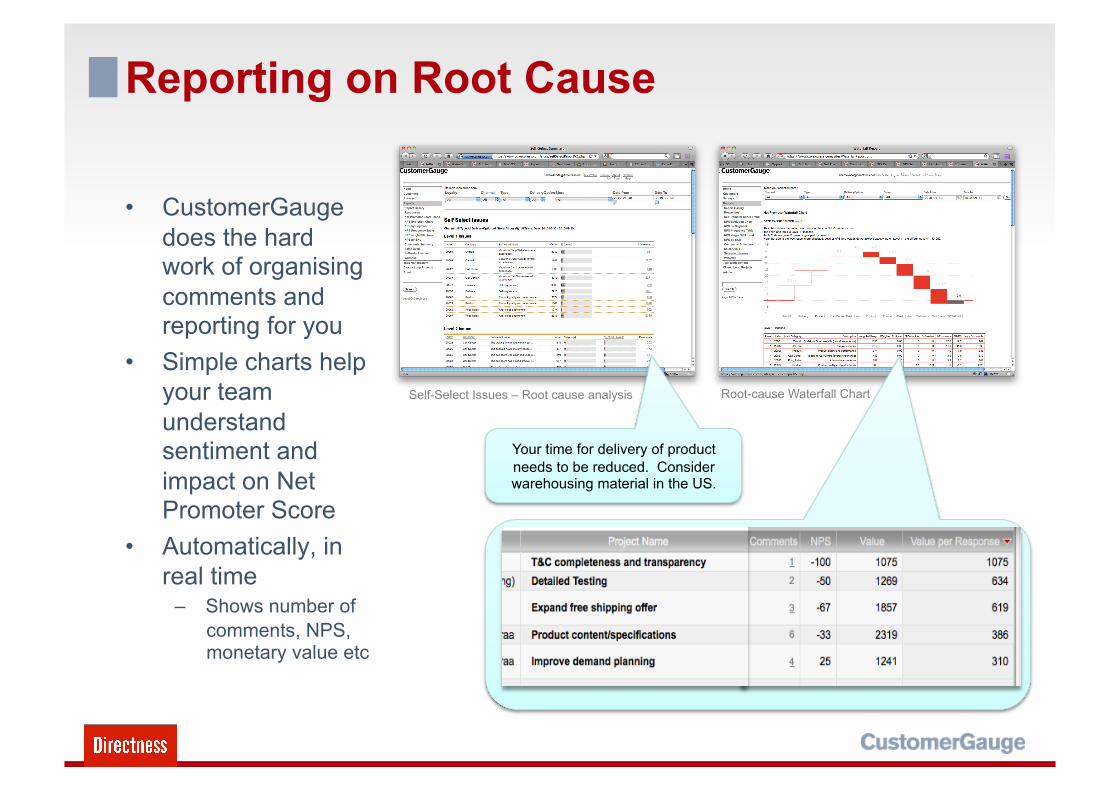
• CustomerGauge does the hard work of organising comments and reporting for you
• Simple charts help your team understand sentiment and impact on Net Promoter Score
• Automatically, in real time
– Shows number of comments, NPS, monetary value etc
Self-Select Issues – Root cause analysis
Your time for delivery of product needs to be reduced. Consider warehousing material in the US.

How it works / 1. Survey Page 1
• Ask standard Net Promoter® question
• Follow up with questions for Detractor (“How can we improve?”) and Promoter (“What did we do well?”)
Detractor PROMOTER
Net Promoter, NPS, and Net Promoter Score are trademarks of Satmetrix Systems, Inc., Bain & Company, and Fred Reichheld.

How it works / 2. Survey Page 2
• Ask “Self-Select” questions (depending on Promoter or Detractor)
• Customer checks boxes on likes/dislikes
• Comments back up the selections

How it works / 3. Multiple Selections
DELIVERY
SHIPPING COST
PACKAGING ORDER STATUS
Level 1
Level 2
Contact CENTRE
Comment
NPS (from previous page)
• Reporting is handled in back end
• NPS and order values added

How it works / 4. Reporting & Assigning
• CustomerGauge allocates comments, values and NPS scores
– Also assigns to individual or department for action or analysis
DELIVERY
SHIPPING COST
PACKAGING ORDER STATUS
Level 1
Level 2
Comment List For “Shipping Cost”
Assigned to: David Smith Logistics Manager

How it works / 5. Waterfall Report
• Waterfall shows the “bridge” between Promoters and Detractors using Level 1 issues
– Shows % of impact on NPS
• Drill down report to Level 2 is below chart.
Waterfall chart: Company A: NPS 41
Waterfall chart: Company B: NPS -3
Level 1 & Level 2 reasons for detractors and prompters
Promoters Detractors Overall NPS
60
19
41
Promoters%
Detractors%
Net Promoter Score Promoters% – Detractors% = NPS
Concept:

How it works / 6. Setup and Maintain
• Level 1 and Level 2 reasons can be edited at any time to tune survey
– Multiple languages – Customisable for segments etc

Summary
• Customer “Self Select” checkboxes on survey automatically fills reports in CustomerGauge
– Allocated to individuals – Allows detailed analysis of
root cause – Drives actions
• Simple and in real-time

Next steps and further reading
• Try a sample survey here: – http://bit.ly/hjQPGF
• Ask about how CustomerGauge helps organise issues into improvement projects – [email protected]