The Prophets of Old 1 Nephi 19 The Large Plates of Nephi The Small Plates of Nephi.

Nephi City Wastewater System
Master Plan
September 2011
Jones & DeMille Engineering, Inc.
[0912-057]
1535 South 100 West � Richfield, UT 84701 � Ph. 435-896-8266 � Fax 435-896-8268
248 East Main � Price, UT 84501 � Ph. 435-637-8266 � Fax 435-637-8268
50 South Main, Suite 28 � Manti, UT 84642 � Ph. 435-835-4540

Nephi City Wastewater System Master Plan Jones & DeMille Engineering, Inc. i
TABLE OF CONTENTS
EXECUTIVE SUMMARY ....................................................................................................................................... 1
BACKGROUND ................................................................................................................................................... 3
GENERAL OVERVIEW ...................................................................................................................................................... 3 ONSITE SYSTEMS ........................................................................................................................................................... 4 FLOW‐REDUCTION PROGRAMS ......................................................................................................................................... 4 ENVIRONMENTALCONDITIONS .......................................................................................................................................... 4
Surface and GroundWater Hydrology .................................................................................................................. 4 Ground Water ...................................................................................................................................................... 5 Physiography, Topography, Geology and Soils .................................................................................................... 6 Precipitation, Temperature and Prevailing Winds ............................................................................................... 9 Land Use and Development ............................................................................................................................... 11 Water Quality and Public Health Problems ........................................................................................................ 13
POPULATION ............................................................................................................................................................... 13 Population Estimates ......................................................................................................................................... 13 Equivalent Residential Units (ERUs) and Population Equivalent ........................................................................ 14
SEWER LINES ..................................................................................................................................................... 15
CURRENT CONDITIONS .................................................................................................................................................. 15 Flow Measurements ........................................................................................................................................... 15 Video Inspection ................................................................................................................................................. 18 Infiltration and Inflow ........................................................................................................................................ 19 SewerCAD Computer Simulation ........................................................................................................................ 19
FUTURE CONDITIONS .................................................................................................................................................... 23 Projected Growth ............................................................................................................................................... 23 Computer Simulation ......................................................................................................................................... 23 Anticipated Growth ............................................................................................................................................ 23
TOTAL CONTAINMENT LAGOONS ...................................................................................................................... 28
EXISTING CONDITIONS .................................................................................................................................................. 28 Major Influent Characteristics ............................................................................................................................ 28 Water Balance .................................................................................................................................................... 28
FUTURE CONDITIONS .................................................................................................................................................... 30
ENVIRONMENTAL REVIEW ................................................................................................................................ 31
ENVIRONMENTAL INFORMATION ..................................................................................................................................... 31 HISTORICAL AND ARCHAEOLOGICAL SITES ......................................................................................................................... 31 FLOODPLAINS AND WETLANDS ....................................................................................................................................... 32 AGRICULTURAL LANDS .................................................................................................................................................. 32 WILD AND SCENIC RIVERS ............................................................................................................................................. 32 FISH AND WILDLIFE PROTECTION .................................................................................................................................... 32 AIR QUALITY ............................................................................................................................................................... 32 WATER QUALITY AND QUANTITY .................................................................................................................................... 33 DIRECT AND INDIRECT IMPACTS ...................................................................................................................................... 33 MITIGATION ADVERSE IMPACTS ...................................................................................................................................... 33
DEVELOPMENT AND SCREENING OF ALTERNATIVES .......................................................................................... 33
DO NOTHING ALTERNATIVE ........................................................................................................................................... 33 MECHANICAL TREATMENT ............................................................................................................................................. 34

Nephi City Wastewater System Master Plan Jones & DeMille Engineering, Inc. ii
CONSTRUCTED WETLANDS ............................................................................................................................................ 35 TYPE II EFFLUENT REUSE ............................................................................................................................................... 36 NEW ADDITIONAL LAGOON ........................................................................................................................................... 37
EVALUATION OF PRINCIPAL ALTERNATIVES AND PLAN ADOPTION .................................................................... 37
TYPE II EFFLUENT REUSE ............................................................................................................................................... 37 NEW ADDITIONAL LAGOON ........................................................................................................................................... 39
DESCRIPTION AND IMPLEMENTATION ARRANGEMENTS ................................................................................... 39
JUSTIFICATION AND DESCRIPTION OF SELECTED PLAN .......................................................................................................... 39 DESIGN PROCESS ......................................................................................................................................................... 39 COST ESTIMATES ......................................................................................................................................................... 40 ENERGY REQUIREMENTS ............................................................................................................................................... 41 ENVIRONMENTAL IMPACTS ............................................................................................................................................ 41 OPERATION AND MAINTENANCE REQUIREMENTS ............................................................................................................... 42 LAND ACQUISITION ...................................................................................................................................................... 42
FINANCIAL AND ORDINANCE REVISION CONSIDERATIONS ................................................................................. 42
USER FEES AND AFFORDABILITY CRITERIA ......................................................................................................................... 42 CONNECTION FEES ....................................................................................................................................................... 44 IMPACT FEES ............................................................................................................................................................... 44
Statutes .............................................................................................................................................................. 44 Probable Impact Fees ......................................................................................................................................... 45 Impact Fee Implementation Plan ....................................................................................................................... 46
ORDINANCE REVIEW .................................................................................................................................................... 46
CONCLUSIONS ................................................................................................................................................... 47
SEWER LINES .............................................................................................................................................................. 47 TOTAL CONTAINMENT LAGOONS .................................................................................................................................... 47 MAINTENANCE ............................................................................................................................................................ 48
TABLE OF FIGURES
Figure 1 Nephi city limits. ............................................................................................................................. 3 Figure 2 Surface water in Nephi. ................................................................................................................... 5 Figure 3 Depth to water table. ...................................................................................................................... 6 Figure 4 Suitability of soils for total containment lagoons. .......................................................................... 7 Figure 5 Unified soil classification of soils in and around Nephi, UT ............................................................ 9 Figure 6 Thirty‐year normal precipitation. .................................................................................................. 10 Figure 7 Thirty‐year normal temperature. .................................................................................................. 10 Figure 8 Nephi City zoning map. ................................................................................................................. 12 Figure 9 Population estimates for Nephi, Utah. ......................................................................................... 14 Figure 10 Measured flows at the Airport. ................................................................................................... 16 Figure 11 Measured flows at 500 S 300 W. ................................................................................................ 17 Figure 12 Measured flows at 500 S 1200 W. .............................................................................................. 17 Figure 13 Measured flows at 1500 N 350 W............................................................................................... 18 Figure 14 Measured flows at 950 N 400 W. ................................................................................................ 18 Figure 15 Comparison of sewer flows to rainfall. ....................................................................................... 19 Figure 16 Measured flows. .......................................................................................................................... 21 Figure 17 Design flows for population 5,879. ............................................................................................. 22

Nephi City Wastewater System Master Plan Jones & DeMille Engineering, Inc. iii
Figure 18 Measured flows with smart growth for a population of 8,000. ................................................. 24 Figure 19 Design flows with smart growth for a population of 8,000. ....................................................... 25 Figure 20 Measured flows with smart growth for a population of 10,000. ............................................... 26 Figure 21 Design flows with smart growth for a population of 10,000. ..................................................... 27 Figure 22 Comparison of estimated and measured sewage volumes January 1987 through September 2010. ........................................................................................................................................................... 30 Figure 23 Trend lines showing possible future filling rates. ....................................................................... 34 Figure 24 Argos Sequencing Batch Reactor (SBR). ...................................................................................... 35 Figure 25 Schematic of a constructed wetland........................................................................................... 36 Figure 26 Allowable uses for type II effluent. ............................................................................................. 36 Figure 27 Utah water quality limits. ............................................................................................................ 38
TABLE OF TABLES
Table 1 Sewer Line Measured Flows and Capacities .................................................................................... 1 Table 2 Sewer Line Design Flows and Capacities .......................................................................................... 1 Table 3 Description of Soil Types and Suitability of Soils for Total Containment Lagoons ........................... 8 Table 4 Population Estimates for Nephi, Utah ............................................................................................ 13 Table 5 Population and Water Usage Statistics .......................................................................................... 15 Table 6 Equivalent Residential Units ........................................................................................................... 15 Table 7 Average and Peak Measured Flows at Various Locations .............................................................. 15 Table 8 Distribution of Population Increase (Smart Growth) ..................................................................... 23 Table 9 Results of Inorganic and Microbiology Tests on Wastewater Influent .......................................... 28 Table 10 Required Size of Primary Lagoon Cell Based on State Recommended BOD Loading .................. 28 Table 11 Monthly Pan Evaporation Data at Nephi, UT ............................................................................... 29 Table 12 Monthly Pan and Lagoon Evaporation Data ................................................................................ 29 Table 13 Necessary Area of Additional Lagoons for Different Usage Values ............................................. 31 Table 14 Estimated Detention Times .......................................................................................................... 38 Table 15 Engineer's Opinion of Probable Cost for a 5 Acre Pond with Chlorinator and a Pump Station ... 40 Table 16 Engineer's Opinion of Probable Cost for Additional 33 Acre Lagoon........................................... 41 Table 17 Nephi City Sewer System Cash Flow Analysis .............................................................................. 43 Table 18 Minimum Slopes of Sewer Lines .................................................................................................. 48
APPENDICES
Appendix A Study Exhibits Appendix B Sewer Use Ordinance Appendix C
Class 1 Cultural Resource Survey

Nephi City Wastewater System Master Plan
Jones & DeMille Engineering, Inc. 1
EXECUTIVE SUMMARY
COLLECTION SYSTEM
The capacity of the main sewer lines was determined by measuring flows at five locations. These
measurements show that the main sewer pipes have peak flows much less than the state-required
design flows (see Table 1 and Table 2). However, since the measurements were only taken for a week at
each location, actual peak flows may be higher than these values. The sewer line at 500 South 1200
West is currently the most critical section. It collects sewage from virtually all connections south of 350
South in Nephi City.
Measured peak flows equate to about 69 gallons per capita per day, which is about three times less than
the design flow of 250 gallons per capita per day required by the state. The design flow can be lowered
based on “rates of flow established from an approved infiltration/inflow study”.
Table 1 Sewer Line Measured Flows and Capacities
Location Peak Flow
(gpm)
Peak Flow
(% Capacity)
Additional ERUs
Airport 570 5 66,349
1500 N 350 W 41 4 5,925
950 N 400 W 235 19 6,061
500 S 1200 W 289 34 3,398
500 S 300 W 194 22 4,077
Table 2 Sewer Line Design Flows and Capacities
Location Required Flow
(gpm)
Required Flow
(% Capacity)
Additional ERUs
Airport 1786 15 18,821
1500 N 350 W 130 13 1,717
950 N 400 W 494 86 156
500 S 1200 W 902 106 -104
500 S 300 W 606 70 503
Exhibit 1B outlines the regions that feed into the locations in Table 1 and how much growth can be
accommodated in each region. The exhibit shows only 75% of the estimated allowable ERUs so that the
sewer pipes only ever fill to 75% of capacity. We recommend that Nephi City purchase a portable flow
monitor and periodically measure the peak flows in each of the locations in Table 1 and any other key
locations they deem important. This will insure that the sewer lines do not exceed system capacities as
Nephi City grows and help determine an approved per-capita design flow.
Several areas of Nephi City were evaluated for possible expansion of the sewer network. Exhibit 1A
details how each of these areas may be sewered. Areas outside the limits of Exhibit 1A are not able to
be sewered because their elevations are too low for gravity flow.

Nephi City Wastewater System Master Plan
Jones & DeMille Engineering, Inc. 2
TREATMENT FACILITY
A water balance was conducted on the total containment lagoons to determine their capacity. In the
spring of 1999, the volume of water stored in the lagoon system was about 580 acre-feet. The capacity
of the lagoons system is 600 acre-feet. Since 1999, the maximum water level has dropped to about 470
acre-feet on average. However, an exceptionally wet year, a year with little evaporation, or a year with
high sewer flows could cause the current lagoons to fill past capacity. In recent summers, the volume of
water stored in the lagoons has dropped to about 350 acre-feet. Because the lagoons have been filled so
close to full capacity in the past, Nephi City should immediately start making plans to increase the
capacity of their wastewater treatment system. To ensure that the future treatment system is not
oversized, Nephi City should install a permanent flow monitoring system at the lagoon site as soon as
possible. If a flow meter is not installed, any future treatment system would have to be designed based
on conservative estimates of flow, and the system would certainly be oversized. With data from a flow
meter, however, Nephi City would be able to save money because the future treatment system would
be sized appropriately.
For adequate treatment of wastewater, the primary cell of the lagoon system must meet a minimum
surface area. The minimum area is based on how much biochemical oxygen demand (BOD) is entering
the lagoons. Maximum BOD loading is 35 lbs/acre/day. In the absence of BOD data, 0.17 lbs/capita/day
is used. This necessitates an area of 59 acres for the primary cell for the current population. The current
primary cell is only 33 acres, so according to BOD estimates, the primary cell of the lagoon system is
undersized for the current population. However the BOD of a single sample of wastewater taken on
10/29/2010 showed the BOD loading as 84 mg/L or 0.04 lb/capita/day. If this sample is representative of
average BOD loading throughout the year, then the primary cell only needs to be 14 acres for the
current population. Most likely, the primary cell will be sufficiently large to handle growth in the near
future and the size of the lagoons system will be controlled by total capacity. We recommend that Nephi
City test for BOD on a monthly basis. The knowledge of BOD loading will help predict the treatment
quality attained in the lagoons and will help determine if an additional lagoon should be constructed or
if type II effluent reuse should be pursued.

Nephi City Wastewater System Master Plan
Jones & DeMille Engineering, Inc. 3
BACKGROUND
General Overview
The purpose of this study is to determine if the current wastewater collection system and total
containment lagoons meet the current needs of Nephi City and how well they will continue to meet the
needs of Nephi City for each incremental population increase.
Nephi City is located approximately 85 miles south of Salt Lake City in the eastern portion of Juab
County, Utah. The boundaries of this study include the Nephi City limits (Figure 1).
Figure 1 Nephi city limits.
Currently, Nephi City has a central wastewater collection system that collects and transports wastewater
to three total containment lagoons to the northwest of the city. Total containment lagoons are shallow
ponds that store wastewater while aerobic bacteria decompose the solid and liquid waste. Because the

Nephi City Wastewater System Master Plan
Jones & DeMille Engineering, Inc. 4
water evaporates from the surface of the ponds and percolates into the ground, no surface water leaves
the lagoons. State requirements mandate that water levels in the lagoons should be greater than 3 feet
to prevent damage from plant growth and should be less than 6 feet for the primary cells and for all cells
that do not have supplemental aeration or mixing. Water levels in Nephi City’s lagoons have reached as
high as 6.0 feet in lagoon 1, 5.8 feet in lagoon 2, and 4.8 feet in lagoon 3 in the last two years. The
maximum recorded levels occurred in spring of 1999 and were as 4.6 feet, 6.0 feet, and 6.8 feet in
lagoons 1, 2, and 3, respectively. The state also requires a minimum of 3 feet of freeboard (distance
from water level to top of dike), which has been maintained during the last decade.
Nephi City’s total containment lagoons are located about 3 miles northwest of the city, which is more
than the minimum specified distance of ¼ mile from developed areas. The combined surface areas of
the current lagoons is 100 acres with lagoons 1 and 2 having surface areas of 33 acres and lagoon 3
having a surface area of 34 acres. The state requires that the lagoon system should have at least three
cells and that the cells should have approximately equal capacity, which is true of Nephi City’s current
lagoon system. The state also recommends that rectangular ponds should not have a length-to-width
ratio greater than 3.0, but the Nephi City lagoons have a length-to-width ratio of approximately 5.5.
With long, narrow lagoons, the possibility exists for the lagoons to short circuit; the edges of the lagoons
could be very stagnant while the middle portion circulates. This scenario decreases the detention time
of the lagoon system and reduces treatment capacity. In the case of Nephi City’s lagoons, the transfer
structures that convey water from one lagoon to the next are placed very well, reducing any negative
effects of the long, narrow lagoons.
Onsite Systems
There are a few onsite septic systems throughout the city, but almost all businesses and residences
within Nephi City limits are connected to the Nephi sewer system, while most units outside of Nephi City
limits are served by individual onsite systems. The locations of the onsite systems are not known, they
have not created any problems to date, and they are not expected to connect to the existing system in
the foreseeable future. Additional sewer infrastructure will likely have to be constructed when
undeveloped regions become populated.
Flow-Reduction Programs
Flow reduction is accomplished in three ways: 1) water conservation by end users, 2) water reuse, and
3) infiltration/inflow mitigation. Nephi City should continue to follow the guidelines set forth in its Water
Conservation Plan to help reduce the flows throughout the wastewater system.
EnvironmentalConditions
Surface and GroundWater Hydrology
Topographic maps from the United States Geological Survey show two drainages extending westward
out of the mouth of Salt Creek Canyon (see Figure 2). The first, Salt Creek, travels west between 100
South and 100 North until it turns north at 300 West near the Juab County Fairgrounds. Salt Creek then
joins Big Hollow at about 450 North 300 West. The second drainage, Big Hollow, starts at the mouth of
Salt Creek Canyon and travels west between 200 North and 500 North until it exits the city proper. It
then continues northwest towards the lagoons until cutting directly west to join West Creek to the
southwest of the lagoons. West Creek then flows toward the north and passes about a quarter mile to
the west of the lagoons.

Nephi City Wastewater System Master Plan
Jones & DeMille Engineering, Inc. 5
Figure 2 Surface water in Nephi.
Surface water and groundwater from Nephi naturally drain towards the west with the northern part of
the city draining towards the northwest and the southern part of the city draining towards the west.
Most residential units in Nephi have elevations between 5100 and 5200 feet while the elevation of the
lagoons is about 4980 feet.
Ground Water
Nephi gets its culinary and irrigation water from rivers, underground wells, and springs. Well logs from
the Utah Division of Water Rights (see Figure 3) show that the water table within Nephi City is around
150 feet underground, and that the water table near the lagoons is only 20-30 feet underground. State
requirements are that “a minimum separation of four (4) feet (1.2 meters) between the bottom of the
lagoon and the maximum ground water elevation should be maintained.” Before any additional lagoons
are installed, test bores should be drilled to verify that the ground water is at least 4 feet below ground.
No ground water quality studies are available at this time.
Salt Creek
Big Hollow
We
st C
ree
k Lagoons

Nephi City Wastewater System Master Plan
Jones & DeMille Engineering, Inc. 6
0 feet 170 feet Figure 3 Depth to water table.
Physiography, Topography, Geology and Soils
Nephi is located near the mouth of Salt Creek Canyon at the junction of I-15 and SR-132. Sewer hookups
stretch about 3.8 miles from north to south and about 1.8 miles from east to west. The city is relatively
flat with no major hills except for the bench on the east side of I-15.
Soil data from the United States Department of Agriculture (USDA) Natural Resources Conservation
Service (NRCS) show that the total containment lagoons for Nephi City are located on soils that are
somewhat limited, as shown in Figure 4. According to the rating system, somewhat limited describes
soils with “features that are moderately favorable for [total containment lagoons]. The limitations can
be overcome or minimized by special planning, design, or installation. Fair performance and moderate
maintenance can be expected” (http://websoilsurvey.nrcs.usda.gov/app/WebSoilSurvey.aspx). As
shown in Table 3, soil type Benjamin Silty Clay Loam (Bc) is somewhat limited because of insufficient
depth to saturation zone and potential for flooding. Soil type Juab Loam (JbA) is also somewhat limited
because of excessive seepage and potential flooding. Note that in Table 3, the numeric values for rating
reasons range from 0.01 (most suitable) to 1.00 (least suitable).
Excessive seepage is generally only a problem with new lagoons because, over time, porous soils
become plugged. Thus, the current sewage lagoons in Nephi are likely not contaminating the
groundwater excessively. The potential for flooding near the lagoons appears small from the NRCS data
that is available, however the probability of flooding near the lagoons is beyond the scope of this study.

Nephi City Wastewater System Master Plan
Jones & DeMille Engineering, Inc. 7
Very limited Somewhat limited Not limited Figure 4 Suitability of soils for total containment lagoons.
Lagoons

Nephi City Wastewater System Master Plan
Jones & DeMille Engineering, Inc. 8
Table 3 Description of Soil Types and Suitability of Soils for Total Containment Lagoons
Map
Unit
Symbol
Map Unit Name Rating Component
Name (Percent)
Rating Reasons
(Numeric Values)
AF AquicUstifluvents, saline Very limited
AquicUstifluvents
(85%)
Flooding (1.00)
Depth to saturated zone (1.00)
Roshe Springs
(5%)
Flooding (1.00)
Depth to saturated zone (1.00)
Seepage (0.53)
Bb Benjamin silty clay loam Somewhat
limited Benjamin (80%) Depth to saturated zone (0.92)
Bc Benjamin silty clay loam,
moderately saline-alkali
Somewhat
limited Benjamin (80%)
Depth to saturated zone (0.92)
Flooding (0.40)
DaC Dagor loam, 2 to 8
percent slopes Very limited Dagor (80%)
Seepage (1.00)
Slope (0.68)
Flooding (0.40)
FhB Fridlo loam, 2 to 4
percent slopes
Somewhat
limited Fridlo (90%) Slope (0.08)
HbA Hansel silt loam, 0 to 2
percent slopes Very limited Hansel (80%) Seepage (1.00)
JbA Juab loam, 0 to 2 percent
slopes
Somewhat
limited Juab (80%)
Seepage (0.53)
Flooding (0.20)
JbC Juab loam, 4 to 8 percent
slopes
Somewhat
limited Juab (80%)
Slope (0.92)
Seepage (0.53)
Kb Kirkham silt loam Somewhat
limited Kirkham (88%)
Depth to saturated zone (0.99)
Flooding (0.40)
MvB
Musiniasilty clay loam,
moist, 0 to 2 percent
slopes
Not limited Musinia (80%)
RaD Reebok cobbly loam, 4 to
15 percent slopes Very limited Reebok (80%)
Depth to cemented pan (1.00)
Slope (1.00)
Large stones (0.54)
Seepage (0.53)
Rr Roshe Springs silt loam Very limited
Roshe Springs
(77%)
Flooding (1.00)
Depth to saturated zone (1.00)
Seepage (0.53)
Provo Bay (10%) Flooding (1.00)
Depth to saturated zone (1.00)
Saltair (5%) Flooding (1.00)
Depth to saturated zone (1.00)

Nephi City Wastewater System Master Plan
Jones & DeMille Engineering, Inc. 9
The NRCS also shows soil types according to the Unified Soil Classification System. As seen in Figure 5,
the majority of the surface soil in Nephi is clay and silt, with some clayey gravel in the southeast portion
of the city.
CL-ML CL GC GC-GM Unknown
Figure 5 Unified soil classification of soils in and around Nephi, UT
Precipitation, Temperature and Prevailing Winds
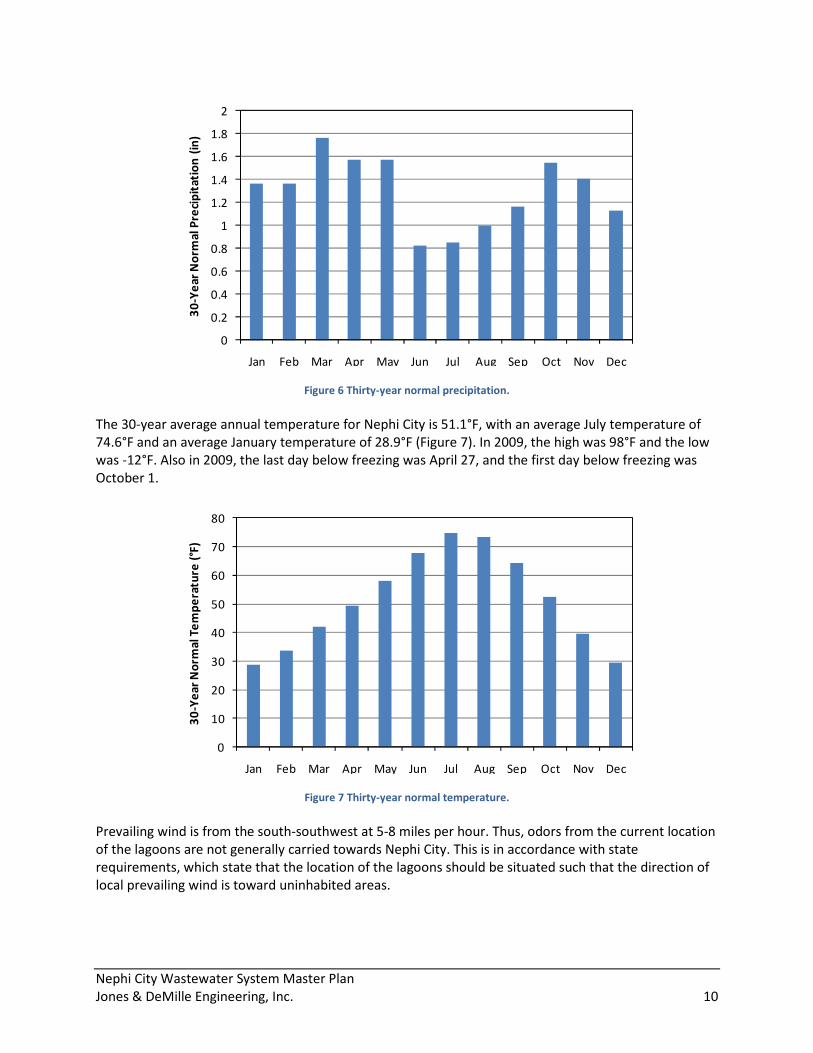
The 30-year normal precipitation for Nephi City is 15.54 inches, with the most precipitation occurring in
March, April, May, and October (Figure 6).
Nephi City Wastewater System Master Plan
Jones & DeMille Engineering, Inc. 10
Figure 6 Thirty-year normal precipitation.
The 30-year average annual temperature for Nephi City is 51.1°F, with an average July temperature of
74.6°F and an average January temperature of 28.9°F (Figure 7). In 2009, the high was 98°F and the low
was -12°F. Also in 2009, the last day below freezing was April 27, and the first day below freezing was
October 1.
Figure 7 Thirty-year normal temperature.
Prevailing wind is from the south-southwest at 5-8 miles per hour. Thus, odors from the current location
of the lagoons are not generally carried towards Nephi City. This is in accordance with state
requirements, which state that the location of the lagoons should be situated such that the direction of
local prevailing wind is toward uninhabited areas.
0
0.2
0.4
0.6
0.8
1
1.2
1.4
1.6
1.8
2
Jan Feb Mar Apr May Jun Jul Aug Sep Oct Nov Dec
30
-Ye
ar
No
rma
l P
reci
pit
ati
on
(in
)
0
10
20
30
40
50
60
70
80
Jan Feb Mar Apr May Jun Jul Aug Sep Oct Nov Dec
30
-Ye
ar
No
rma
l T
em
pe
ratu
re (
°F)

Nephi City Wastewater System Master Plan
Jones & DeMille Engineering, Inc. 11
Land Use and Development
Nephi has a total area of 4.2 square miles. The city contains approximately 1,700 residential units and
150 commercial units. Most of the land within the city boundaries has already been developed.
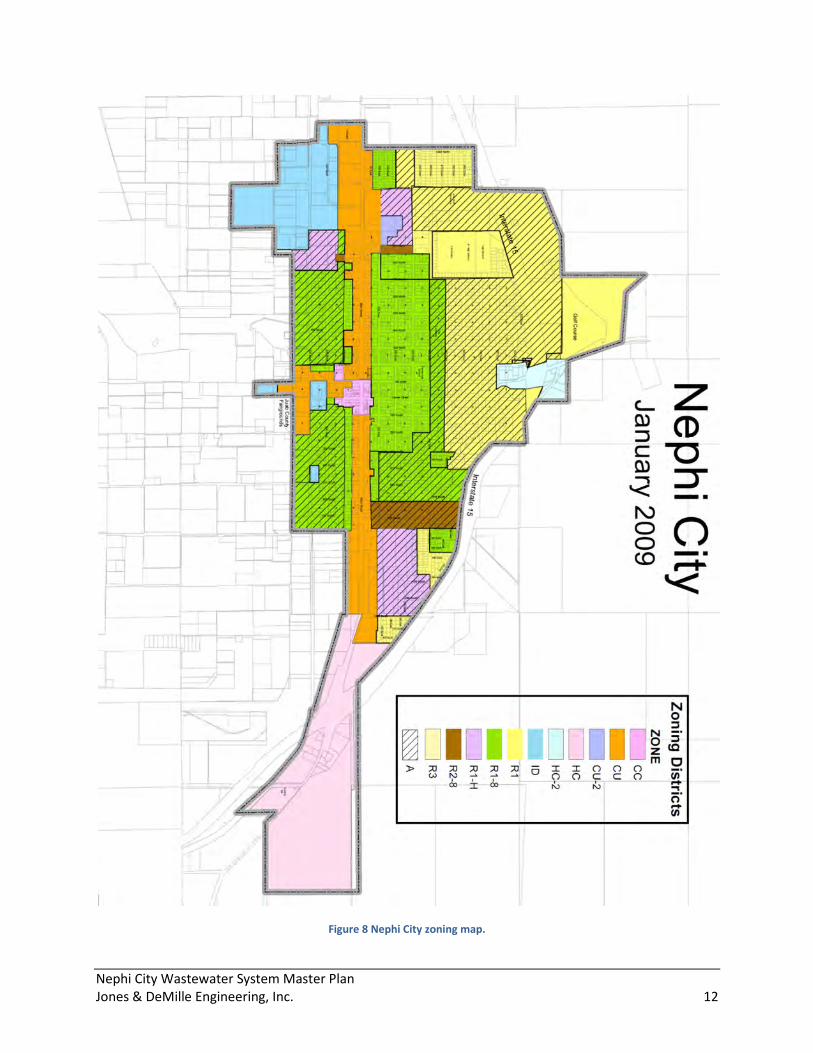
However, city zoning maps (Figure 8) show that future business growth is likely to extend to the north
and south along Main Street, future industrial growth is likely to occur in the northwest corner of the
city, and future residential developments are likely to be built to the north of Juab High School, to the
east of I-15, and to the south of 700 S. Long term growth will likely spread to the north, south, and west
because of the mountains on the east.
Nephi City Wastewater System Master Plan
Jones & DeMille Engineering, Inc. 12
Figure 8 Nephi City zoning map.

Nephi City Wastewater System Master Plan
Jones & DeMille Engineering, Inc. 13
Water Quality and Public Health Problems
There are no known existing water quality or public health problems caused by inadequate wastewater
treatment disposal practices.
Population
Population Estimates
Population estimates and projections for Nephi were obtained from the US Census Bureau and the
Governor’s Office of Planning and Budget (GOP&B).
Table 4 summarizes the estimated population data. These same values are shown graphically in Figure 9.
The average growth rate from 1960 to 2000 was calculated and used to predict population from 2006 to
2030. The future population may be higher or lower than the predicted values due to economic or other
factors. The table and figure show that the GOP&B population estimates exceed the population
estimates based upon the 1960 to 2000 average growth rate. Just prior to the release of this report
preliminary 2010 U.S. Census data became available. The population listed in the census for Nephi City is
5,389. This indicates that the current GOP&B population projections for Nephi City will likely
overestimate the population increase for the projection period. The findings of this report are based
upon a 2010 population of 5,879. An actual lower population of 5,389 result means that the estimated
inflows per capita are slightly underestimated in this report. At the same time, the estimated population
of 10,000 may likely occur at some point beyond the GOP&B projected date of 2030.
Table 4 Population Estimates for Nephi, Utah
Population
Year Census
GOP&B
1960 2,566
1970 2,699
1980 3,285
1990 3,515
2000 4,733
2006 4,784* 5,207
2010 5,078* 5,879
2020 5,893* 7,913
2030 6,840* 10,064 *Census trend

Nephi City Wastewater System Master Plan
Jones & DeMille Engineering, Inc. 14
Figure 9 Population estimates for Nephi, Utah.
Equivalent Residential Units (ERUs) and Population Equivalent
One Equivalent Residential Unit (ERUs) is the amount of sewage that one average permanent residence
produces in a day and is equal to 800 gallons per day. Businesses and other establishments are
converted into ERUs at varying rates. For example, it takes 5.33 hotel rooms to make 1.0 ERU. In this
way, the total number of ERUs in Nephi City was calculated. The total was 1,707 ERUs from residential
units and 292 ERUs from commercial units. However, the individual tally did not correspond to the
actual winter culinary water usage, which is directly related to sewer usage in systems without
significant amounts of infiltration and inflow. Therefore the ERUs from commercial units were estimated
based on winter culinary water usage.
During the winter, very little water is used for watering lawns or other functions that do not drain into
the sewer; rather, most of the water is used for showering, flushing toilets, and other activities that do
drain into the sewer. Therefore, winter water usage is highly correlated with sewer flows. Nephi City
records show that typical culinary water usage during the months of December, January, and February
for the years 2007 to 2010 is about 21.6 million gallons per month (see Table 5). Since the amount of
culinary water entering the sewer system from commercial units is not known, this value had to be
estimated. It was assumed that the percentage of culinary water that entered the sewer system was the
same whether it was routed through a residential unit or a commercial unit. This is a good assumption
because the ratio of residential sewer connections to residential culinary water connections is about the
same as the ratio of commercial sewer connections to commercial culinary water connections.
Nephi City has approximately 1,707 residential connections. This equates to 1,707 ERUs from residential
connections. Nephi City also has 152 commercial connections, but the commercial connections use
more water per connection than the residential connections, as shown in Table 5. In fact, the 152
commercial units use as much culinary water as 1,745 residences. With some simple algebra, an
equivalent population can be calculated. The commercial units in Nephi City use as much water as 6,008
people, bringing the total population equivalent of Nephi City to 11,887 in 2010. Sewer interceptors and
outfalls are designed for 250 gallons per capita per day (R317-3-2.2.B.2.b), so the design peak flow for
the system is 11,887 people × 250 gallons per capita per day = 2,971,750 gallons per day = 2,064 gallons
0
2,000
4,000
6,000
8,000
10,000
12,000
1960 1980 2000 2020
Population
Year
Census
GOP&B
Census Trend

Nephi City Wastewater System Master Plan
Jones & DeMille Engineering, Inc. 15
per minute. These calculations are shown in Table 5. Similar calculations resulted in the design peak
flows given in Table 6.
Table 5 Population and Water Usage Statistics
Number of
Connections
Winter Water Usage
(Gallons per Month) ERUs
Population
Equivalent
Wastewater Design
Peak Flows (Gallons
per Minute)
Residential 1,707 10,693,998 1,707 5,879 1,021
Commercial 152 10,934,992 1,745 6,008 1,043
Total 1,859 21,628,991 3,452 11,887 2,064
Table 6 Equivalent Residential Units
Residential
Population ERUs
Population
Equivalent
Wastewater Design
Peak Flow
(Gallons per Minute)
5,879 3,452 11,887 2,064
6,000 3,523 12,135 2,107
7,000 4,110 14,157 2,458
8,000 4,697 16,180 2,809
9,000 5,285 18,202 3,160
10,000 5,872 20,225 3,511
SEWER LINES
Current Conditions
Flow Measurements
A short-term monitoring of sewer flows was conducted at five locations from June 24, 2010 to August 3,
2010, with each location being monitored for about a week. Table 7 lists the location, monitoring time,
pipe diameter, and peak flow at each of the five locations.
Table 7 Average and Peak Measured Flows at Various Locations
Location Monitoring Time Pipe
Diameter (in.)
Average Flow
(gpm*)
Peak Flow
(gpm)
Airport 6/24/10 – 7/1/10 18 414 570
500 S 300 W 7/1/10 – 7/12/10 12 94 194
500 S 1200 W 7/12/10 – 7/19/10 12 169 289
1500 N 350 W 7/20/10 – 7/26/10 12 20 41
950 N 400 W 7/26/10 – 8/3/10 15 137 235 *Gallons per minute (gpm).
The pipe near the airport is the main collector, and all wastewater from Nephi City flows through this
one pipe. The pipe at 500 S 300 W transports wastewater from all units contained in the area between
400 S and 1200 S and between 200 W and I-15. The pipe at 500 S 1200 W transports wastewater from
Nephi City Wastewater System Master Plan
Jones & DeMille Engineering, Inc. 16
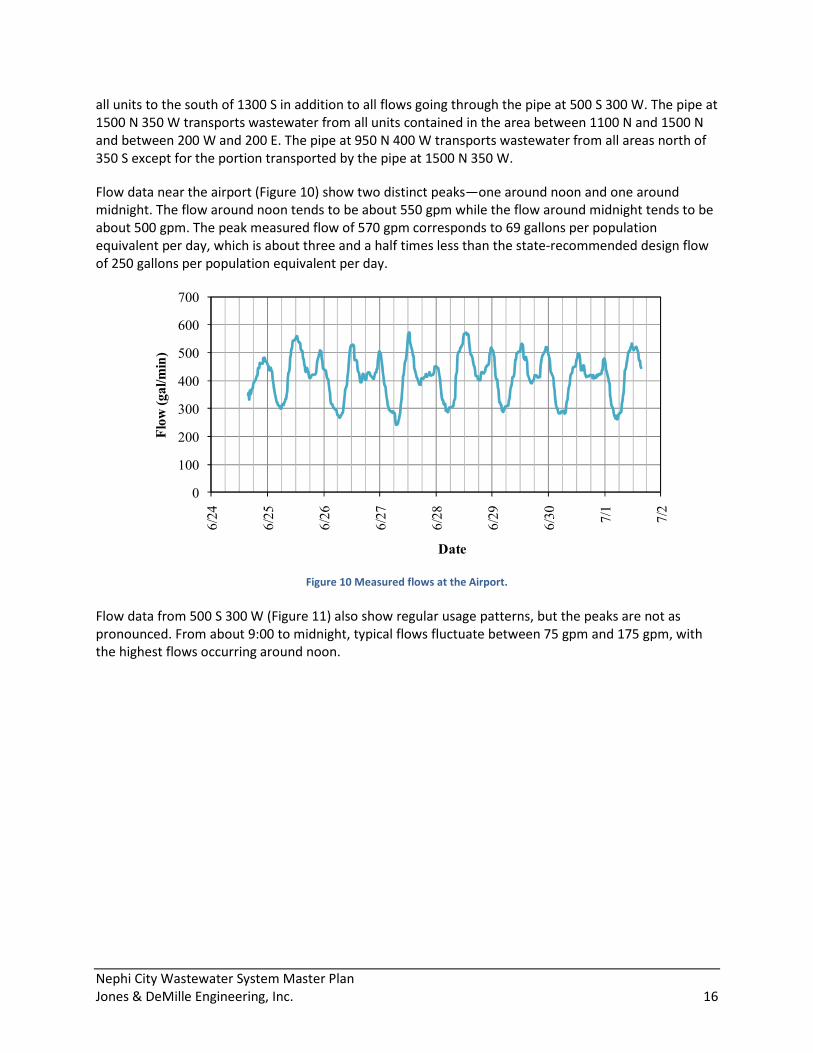
all units to the south of 1300 S in addition to all flows going through the pipe at 500 S 300 W. The pipe at
1500 N 350 W transports wastewater from all units contained in the area between 1100 N and 1500 N
and between 200 W and 200 E. The pipe at 950 N 400 W transports wastewater from all areas north of
350 S except for the portion transported by the pipe at 1500 N 350 W.
Flow data near the airport (Figure 10) show two distinct peaks—one around noon and one around
midnight. The flow around noon tends to be about 550 gpm while the flow around midnight tends to be
about 500 gpm. The peak measured flow of 570 gpm corresponds to 69 gallons per population
equivalent per day, which is about three and a half times less than the state-recommended design flow
of 250 gallons per population equivalent per day.
Figure 10 Measured flows at the Airport.
Flow data from 500 S 300 W (Figure 11) also show regular usage patterns, but the peaks are not as
pronounced. From about 9:00 to midnight, typical flows fluctuate between 75 gpm and 175 gpm, with
the highest flows occurring around noon.
0
100
200
300
400
500
600
700
6/2
4
6/2
5
6/2
6
6/2
7
6/2
8
6/2
9
6/3
0
7/1
7/2
Flow (gal/min)
Date

Nephi City Wastewater System Master Plan
Jones & DeMille Engineering, Inc. 17
Figure 11 Measured flows at 500 S 300 W.
Flow data from 500 S 1200 W (Figure 12) show flows around 200 gpm from noon to midnight for the
first 4 days of observation, but the last 3 days show much higher peaks of about 280 gpm around
1:00pm.
Figure 12 Measured flows at 500 S 1200 W.
Flow data from 1500 N 350 W (Figure 13) show very low flows, with peaks of about 40 gpm around
noon.
0
50
100
150
200
250
7/1
7/2
7/3
7/4
7/5
7/6
7/7
7/8
7/9
7/1
0
7/1
1
7/1
2
7/1
3
Flow (gal/min)
Date
0
50
100
150
200
250
300
350
7/1
1
7/1
2
7/1
3
7/1
4
7/1
5
7/1
6
7/1
7
7/1
8
7/1
9
7/2
0
7/2
1
Flow (gal/min)
Date

Nephi City Wastewater System Master Plan
Jones & DeMille Engineering, Inc. 18
Figure 13 Measured flows at 1500 N 350 W.
Flow data from 950 N 400 W (Figure 14) show peak flows around 11:00am of about 230 gpm and peak
flows around 11:00pm of about 150-200 gpm.
Figure 14 Measured flows at 950 N 400 W.
Video Inspection
As part of this study, 10,000 feet of historically problematic sewer lines were inspected. The most severe
problems are listed in Exhibit 1C. The most common problem was service lines protruding into the sewer
main and restricting flow. There were also several pipes with severe grease or with standing water in
them.
0
5
10
15
20
25
30
35
40
45
7/2
0
7/2
1
7/2
2
7/2
3
7/2
4
7/2
5
7/2
6
7/2
7
Flow (gal/min)
Date
0
50
100
150
200
250
300
7/2
6
7/2
7
7/2
8
7/2
9
7/3
0
7/3
1
8/1
8/2
8/3
8/4
Flow (gal/min)
Date

Nephi City Wastewater System Master Plan
Jones & DeMille Engineering, Inc. 19
Infiltration and Inflow
Infiltration is the process by which ground water enters the sewer system through cracks or holes in the
sewer lines. Similarly, inflow is the process by which storm water enters the sewer system. Infiltration
and inflow are common in aging sewer systems. However, because the majority of the Nephi City sewer
system pipes are located where the ground water table is at least 100 feet underground, it is unlikely
that significant infiltration is occurring in the Nephi City sewer system. Furthermore, a comparison of
sewer flows to rainfall (Figure 15) shows no significant inflow during the period of measurement. Since
Nephi City rainfall data is not available for the whole duration, the next closest rainfall station, Payson, is
also shown. However, due to the limited availability of sewer flow data, inflow may still occur
undetected throughout the year. As the Nephi City sewer system ages, infiltration and inflow will likely
decrease the capacity of the system.
Figure 15 Comparison of sewer flows to rainfall.
SewerCAD Computer Simulation
The capacity of a sewer pipe is dependent on its size, slope, and roughness, among other things. A
computer simulation was created using the SewerCAD software package to model the Nephi City sewer
pipe network. Because several manholes were buried, and the elevations of the pipe segments inside
the manholes could not be measured, the slopes of those pipe segments are not known. To model the
current capacity and demands of the Nephi City sewer system, pipes that had unknown slopes were
interpolated from upstream and downstream measurements. This estimation process was not
conservative because the interpolation process assumes a constant slope between known elevations.
The model was also simplified by reducing the total number of pipe segments to meet software
constraints. The segments that were removed were the ones farthest away from the lagoons. Because
0
0.1
0.2
0.3
0.4
0.5
0.6
0.7
0
100
200
300
400
500
600
700
6/1
9
6/2
6
7/3
7/1
0
7/1
7
7/2
4
7/3
1
8/7
Rainfall (in)
Flow (gal/min)
Date
Airport 500 S 300 W 500 S 1200 W 1500 N 350 W
950 N 400 W Rainfall - Payson Rainfall - Nephi

Nephi City Wastewater System Master Plan Jones & DeMille Engineering, Inc. 20
they had very small flows resulting from only one or two residences, these segments did not need to be analyzed for capacity.
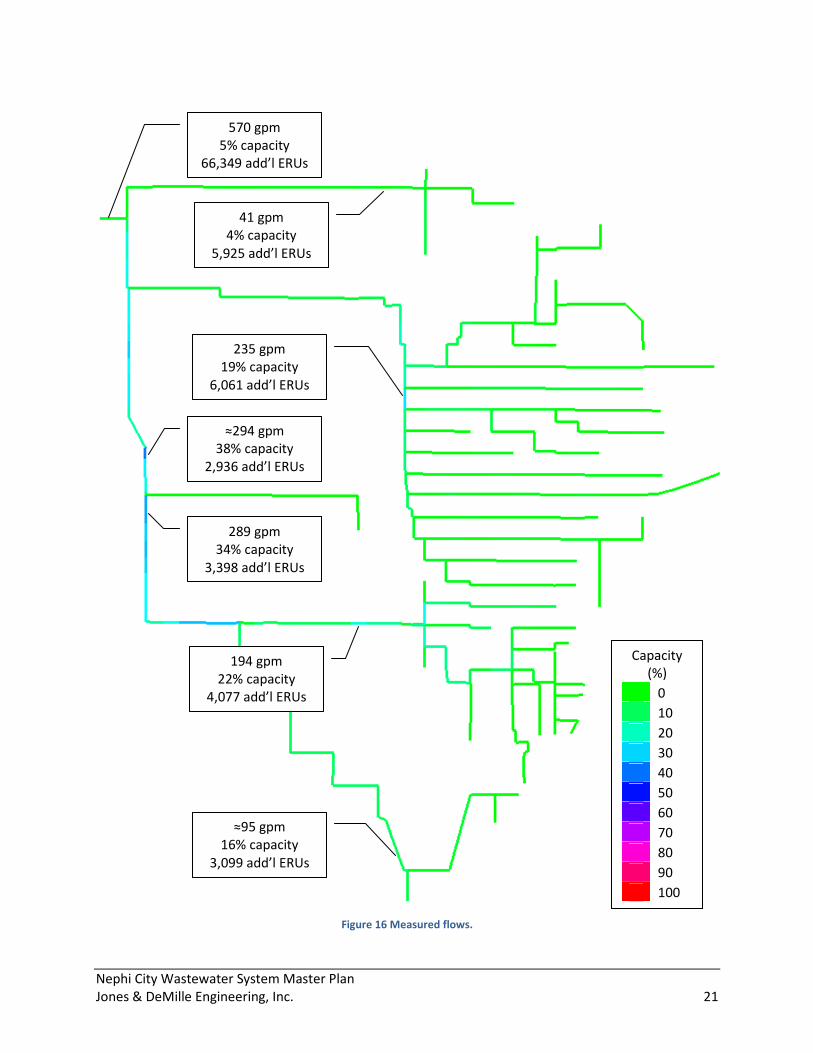
Several different simulations were run for differing scenarios. For the first simulation, measured peak flows were distributed among the areas upstream of each recording location. Figure 16 shows the results of this simulation. The 12” diameter sewer line running from Highway 132 north towards the airport is currently running at an estimated 38% of capacity, according to the single week of data that is available. It is likely that yearly peak flows are actually greater than those captured during the period of monitoring. Additionally, unknown slopes may actually be flatter than estimated, reducing the design capacity. Therefore, this modeled segment may actually see peak flows greater than 38% of capacity. Exhibit 1 of Appendix A shows the additional ERUs, by City area, that can be added before a segment of sewer line reaches capacity. The exhibit is based upon current measured flows per capita and actual capacity may be lower if higher peak flows per capita occur.
Figure 17 shows flows resulting from 3,452 ERUs / 10,270 population equivalent / 1,783 gpm peak flow distributed proportionally throughout the city. This simulation represents state‐required design flows for the current population of 5,879.
Nephi City Wastewater System Master Plan
Jones & DeMille Engineering, Inc. 21
Figure 16 Measured flows.
570 gpm
5% capacity
66,349 add’l ERUs
Capacity
(%)
0
10
20
30
40
50
60
70
80
90
100
289 gpm
34% capacity
3,398 add’l ERUs
41 gpm
4% capacity
5,925 add’l ERUs
≈95 gpm
16% capacity
3,099 add’l ERUs
≈294 gpm
38% capacity
2,936 add’l ERUs
194 gpm
22% capacity
4,077 add’l ERUs
235 gpm
19% capacity
6,061 add’l ERUs

Nephi City Wastewater System Master Plan
Jones & DeMille Engineering, Inc. 22
Figure 17 Design flows for population 5,879.
Capacity
(%)
0
10
20
30
40
50
60
70
80
90
100
1,786 gpm
15% capacity
18,821 add’l ERUs
902 gpm
106% capacity
-104 add’l ERUs
130 gpm
13% capacity
1,717 add’l ERUs
296 gpm
49% capacity
598 add’l ERUs
920 gpm
118% capacity
-278 add’l ERUs
606 gpm
70% capacity
503 add’l ERUs
494 gpm
86% capacity
156 add’l ERUs
Nephi City Wastewater System Master Plan
Jones & DeMille Engineering, Inc. 23
Future Conditions
Projected Growth
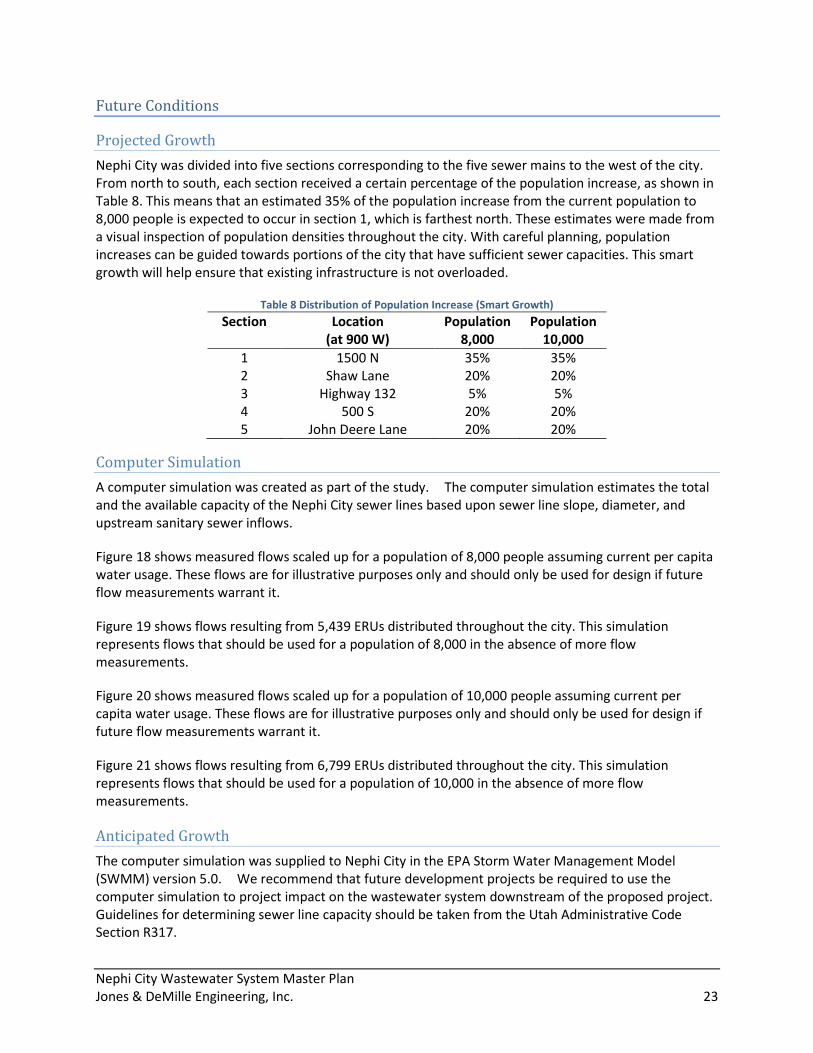
Nephi City was divided into five sections corresponding to the five sewer mains to the west of the city.
From north to south, each section received a certain percentage of the population increase, as shown in
Table 8. This means that an estimated 35% of the population increase from the current population to
8,000 people is expected to occur in section 1, which is farthest north. These estimates were made from
a visual inspection of population densities throughout the city. With careful planning, population
increases can be guided towards portions of the city that have sufficient sewer capacities. This smart
growth will help ensure that existing infrastructure is not overloaded.
Table 8 Distribution of Population Increase (Smart Growth)
Section Location
(at 900 W)
Population
8,000
Population
10,000
1 1500 N 35% 35%
2 Shaw Lane 20% 20%
3 Highway 132 5% 5%
4 500 S 20% 20%
5 John Deere Lane 20% 20%
Computer Simulation
A computer simulation was created as part of the study. The computer simulation estimates the total
and the available capacity of the Nephi City sewer lines based upon sewer line slope, diameter, and
upstream sanitary sewer inflows.
Figure 18 shows measured flows scaled up for a population of 8,000 people assuming current per capita
water usage. These flows are for illustrative purposes only and should only be used for design if future
flow measurements warrant it.
Figure 19 shows flows resulting from 5,439 ERUs distributed throughout the city. This simulation
represents flows that should be used for a population of 8,000 in the absence of more flow
measurements.
Figure 20 shows measured flows scaled up for a population of 10,000 people assuming current per
capita water usage. These flows are for illustrative purposes only and should only be used for design if
future flow measurements warrant it.
Figure 21 shows flows resulting from 6,799 ERUs distributed throughout the city. This simulation
represents flows that should be used for a population of 10,000 in the absence of more flow
measurements.
Anticipated Growth
The computer simulation was supplied to Nephi City in the EPA Storm Water Management Model
(SWMM) version 5.0. We recommend that future development projects be required to use the
computer simulation to project impact on the wastewater system downstream of the proposed project.
Guidelines for determining sewer line capacity should be taken from the Utah Administrative Code
Section R317.

Nephi City Wastewater System Master Plan
Jones & DeMille Engineering, Inc. 24
Figure 18 Measured flows with smart growth for a population of 8,000.
745 gpm
6% capacity
246 gpm
20% capacity
370 gpm
44% capacity
113 gpm
11% capacity
136 gpm
22% capacity
386 gpm
50% capacity
234 gpm
27% capacity
Capacity
(%)
0
10
20
30
40
50
60
70
80
90
100

Nephi City Wastewater System Master Plan
Jones & DeMille Engineering, Inc. 25
Figure 19 Design flows with smart growth for a population of 8,000.
2,809 gpm
24% capacity
1,002 gpm
81% capacity
1,343 gpm
158% capacity
409 gpm
40% capacity
494 gpm
81% capacity
1,398 gpm
180% capacity
849 gpm
98% capacity
Capacity
(%)
0
10
20
30
40
50
60
70
80
90
100

Nephi City Wastewater System Master Plan
Jones & DeMille Engineering, Inc. 26
Figure 20 Measured flows with smart growth for a population of 10,000.
911 gpm
8% capacity
257 gpm
21% capacity
448 gpm
53% capacity
181 gpm
18% capacity
175 gpm
29% capacity
473 gpm
61% capacity
273 gpm
32% capacity
Capacity
(%)
0
10
20
30
40
50
60
70
80
90
100

Nephi City Wastewater System Master Plan
Jones & DeMille Engineering, Inc. 27
Figure 21 Design flows with smart growth for a population of 10,000.
3,511 gpm
30% capacity
1,142 gpm
93% capacity
1,624 gpm
191% capacity
655 gpm
64% capacity
634 gpm
105% capacity
1,714 gpm
221% capacity
990 gpm
114% capacity
Capacity
(%)
0
10
20
30
40
50
60
70
80
90
100

Nephi City Wastewater System Master Plan
Jones & DeMille Engineering, Inc. 28
TOTAL CONTAINMENT LAGOONS
Existing Conditions
Major Influent Characteristics
Wastewater samples from the lagoon influent, taken on 10/29/2010, were tested for biochemical
oxygen demand (BOD), dissolved oxygen (DO), pH, total suspended solids (TSS), coliform, and E. coli. The
results are shown in Table 9.
Table 9 Results of Inorganic and Microbiology Tests on Wastewater Influent
Parameter Sample Result
Inorganic
Biochemical Oxygen Demand (BOD), mg/L 84
Dissolved Oxygen (DO), mg/L 1.1
pH 7.4
Total Suspended Solids (TSS), mg/L 103
Microbiology
Coliform, Org/100 mL > 2400
E. Coli, Org/100 mL > 2400
The primary cell of the lagoons is sized based on how much BOD enters the lagoon system. Each acre of
lagoon can handle 35 lbs of BOD per day. In the absence of test data, 0.17 lbs/capita/day of BOD is
assumed to enter the lagoon system. Based on 0.17 lbs/capita/day of BOD the primary cell size needs to
be 59.0 acres for a population of 6,000 people, as shown in Table 10. However, the BOD of the sample
was 84 mg/L or approximately 0.04 lbs/capita/day. If this sample is representative of all sewage entering
the lagoons, the primary cell only needs to be 14 acres for the current population. We recommend that
Nephi City start a monthly program to test for, at a minimum, BOD of the sewage entering the lagoon.
That way when it comes time to expand the lagoons or to switch to a mechanical treatment system,
Nephi City will be able to base the design on actual BOD loading instead of on conservative estimates.
Table 10 Required Size of Primary Lagoon Cell Based on State Recommended BOD Loading
Population
Parameter 6,000 8,000 10,000
Population Equivalents 12,135 16,180 20,225
BOD, lbs/yr at 0.17lbs/capita/day 752,990 1,003,987 1,254,983
TSS, lbs/yr at 0.20lbs/capita/day 885,871 1,181,161 1,476,451
Primary Cell Size, acres at 35 lbs BOD/acre/day 59.0 78.6 98.2
Water Balance
Monthly evaporation from the lagoons was estimated based on historical evaporation data in Nephi, UT
(Table 11). As can be seen from the table, evaporation is not recorded in winter months, so these values
had to be estimated.

Nephi City Wastewater System Master Plan
Jones & DeMille Engineering, Inc. 29
Table 11 Monthly Pan Evaporation Data at Nephi, UT
Source: http://soildatamart.nrcs.usda.gov/manuscripts/UT608/0/Tables.pdf
Month Elberta Station (in.) Nephi Station (in.) Levan Station (in.)
May 6.3 10.3 9.8
June 7.2 12.0 11.4
July 8.3 12.8 12.1
August 7.5 10.3 9.8
September 5.1 7.9 7.5
October 2.9 5.1 4.8
Seasonal Evaporation 37.3 58.4 55.4
Table 12 gives the monthly Nephi City pan evaporation from Table 11 as well as the estimated average
lagoon evaporation. Since evaporation pans freeze in winter months, these values are not recorded and
must be estimated.
Table 12 Monthly Pan and Lagoon Evaporation Data
Month
Average Pan
Evaporation (in.) Pan Coefficient
Average Lagoon
Evaporation (in.)
Jan 0.0* 0.6 0.00
Feb 1.5* 0.6 0.90
Mar 4.0* 0.7 2.80
Apr 7.0* 0.7 4.90
May 10.3 0.8 8.24
Jun 12.0 0.8 9.60
Jul 12.8 0.8 10.24
Aug 10.3 0.8 8.24
Sep 7.9 0.7 5.53
Oct 5.1 0.7 3.57
Nov 2.0* 0.6 1.20
Dec 0.0* 0.6 0.00
*Value was estimated
With a residential population of 5,879 and a population equivalent of 11,887, each population
equivalent currently produces an average of approximately 50.2 gallons per day for a total of 414 gallons
per minute of average measured flow (according to US 2010 Census data obtained just prior to the
release of this report the population is 5,389 – which results in a population equivalent of 10,896, each
population equivalent currently producing an average of approximately 54.7 gallons per day) . According
to state requirements, total containment lagoons should be sized for 100 gallons per day per population
equivalent unless field measurements prescribe otherwise. Although the flow data suggests that current
usage is about 50.2 gallons per day per population equivalent in Nephi City, there is insufficient flow
data to substantiate this assumption, and more conservative estimates must be used unless
measurements from permanent flow meters justify otherwise.

Nephi City Wastewater System Master Plan
Jones & DeMille Engineering, Inc. 30
We therefore recommend that Nephi City install permanent flow meters upstream of the lagoons. These
meters should be installed as soon as possible so that there will be sufficient flow data to justify the
design of smaller and less costly additions to the lagoon system.
Hydraulic conductivity is a measure of how quickly water seeps through the soil. Since the hydraulic
conductivity of the lagoon bottoms was not measured directly, the model was calibrated by comparing
the estimated volume of sewage in the lagoons to the measured volume and adjusting the hydraulic
conductivity so they matched (see Figure 22). The hydraulic conductivity of the lagoon bottoms was
found to be approximately 9×10⁻⁷ cm/s, which is slightly less than the maximum allowable value of
1×10⁻⁶ cm/s.
A water balance on the current lagoons was performed. The volume at the end of the first month was
calculated using the following equations.
������� = ������ + �� ��� + ���� − ����������� − �������
Where:
�� ��� = �������������������� × ��������������������������� × ����
���� = ��� � �!��� × ����"���ℎ
����������� = ��� � �!��� × �����������"���ℎ
������� = ��� � �!��� × $%&����� '��&� �����% × ���&"���ℎ + (�����ℎ� )��**
(�����ℎ� )��**
Liner thickness was assumed to be 1 foot (the minimum amount) for all lagoons.
Figure 22 Comparison of estimated and measured sewage volumes January 1987 through September 2010.
Future Conditions
After the computer simulation was calibrated from measured values, it was used to determine the
necessary area of additional lagoons for increased populations. Table 13 gives the necessary area of
0
100
200
300
400
500
600
'87 '88 '89 '90 '91 '92 '93 '94 '95 '96 '97 '98 '99 '00 '01 '02 '03 '04 '05 '06 '07 '08 '09 '10 '11 '12 '13 '14 '15 '16 '17 '18 '19 '20 '21 '22 '23 '24 '25 '26 '27
Total Volume in Lagoons (acre-ft)
Date
Measured
Annual Max of Model with Actual Rainfall and Evaporation
Annual Max of Model with Average Rainfall and Evaporation

Nephi City Wastewater System Master Plan
Jones & DeMille Engineering, Inc. 31
additional lagoons using assumed current usage of 50.2 gallons per day per population equivalent (best
case scenario) and using state requirements of 100 gallons per day per population equivalent (worst
case scenario).
Table 13 Necessary Area of Additional Lagoons for Different Usage Values
Population Necessary Area of Additional Lagoons
Using Assumed Current Usage
Necessary Area of Additional Lagoons
Using State Requirements
5,879 0 acres 51 acres
6,000 0 acres 54 acres
7,000 0 acres 78 acres
8,000 6 acres 102 acres
9,000 20 acres 126 acres
10,000 31 acres 150 acres
ENVIRONMENTAL REVIEW
Environmental Information
The project area covers approximately 160 acres, and within that area, the three existing sewage
lagoons cover about 100 acres. The project area is located approximately 3 miles northwest from the
center of Nephi, Utah and approximately 0.75 miles west of the Nephi Municipal Airport. It is accessible
by county roads from the north and the south. The terrain of the project area is flat with range land on
the west and agricultural land on the other three sides. The nearest house to the project area is
approximately 1.25 miles away.
There are no unusual weather or climate conditions that affect the ongoing sewage treatment process
(existing lagoons). Nephi has a total area of 4.2 square miles. The expected growth area is expected to
remain at least 2 miles from the project area, thus avoiding any potential conflicts. There are no
developed recreational sites in the area, and other recreational use, if any, is very limited.
Prior to proceeding with the proposed project, all Federal, state, and local permits would be obtained.
This permitting process would include completing any required public participation processes. To date
there is no public controversy relating to the project.
Historical and Archaeological Sites
A Class I Inventory for the project was completed by Bighorn Archaeological Consultants, LLC (Report
Number 11-11) in March of 2011 (see Appendix C). The file search revealed one previously inventoried
project and no cultural resource sites within one mile of the project area.

Nephi City Wastewater System Master Plan
Jones & DeMille Engineering, Inc. 32
Floodplains and Wetlands
a) Delineation only. Does not include permitting for impacts.
There are no floodplains present in the project area and the proposed action will not increase
the risk of flooding or the risk of damage to human life and property and will not be contrary to
Executive Order 11988 – Floodplain Management.
b) There is a limited amount of riparian vegetation along West Creek which is about one-quarter
mile west of the exiting lagoons. The operation of the existing lagoons does not affect this
riparian area, and the construction and operation of the potential new lagoon will have no
effect on this riparian area. There is also a limited amount of wetland vegetation just west of the
existing lagoons. This vegetation is the direct result of seepage from the sewage lagoons.This
seepage is a normal result from this type of water treatment operation. The construction of a
new lagoon will just maintain this type of vegetation.
Agricultural Lands
Irrigated croplands are located on three sides (north, east, and south) of the existing sewage lagoons
(project area). They are not, however, affected by the project. If an additional new lagoon is
constructed, it would be located on disturbed, non-agricultural land just west of the existing lagoons.If
processed water is to be discharged onto the surface, as part of the new design features of the project,
adjacent agricultural lands would benefit from its use as irrigation water.
Wild and Scenic Rivers
The only designated Wild & Scenic River in Utah is portions of the Virgin River and its tributaries
approximately 185 miles south, in the vicinity of Zion National Park. No other river or stream segments
within a 75-mile radius have been determined suitable for nomination.
Fish and Wildlife Protection
There are no designated threatened or endangered plant or animal species or their habitat in the
project area. There are no designated state sensitive plant or animal species or their habitat in the
project area. However, the Ferruginous Hawk, a state sensitive species, may occasionally forage in the
area (Utah Division of Wildlife Resources, Utah Conservation Data Center
http://dwrcdc.nr.utah.gov/ucdc/) .
The general vicinity of the project provides habitat for such animals as mule deer, rabbits, coyotes,
smaller rodents, and numerous passerine birds. Waterfowl such as Canada Geese and seagulls use the
lagoons as resting and nesting habitat. The sewage lagoons are fenced with an eight-foot, chain-link
fence that will keep larger mammals out.
Air Quality
The prevailing wind is from the south-southwest at 5-8mph. Thus, odors from the current location of the
lagoons are not generally carried towards Nephi City. Other than odor, no other potential air pollutants
will be generated due to the project.

Nephi City Wastewater System Master Plan
Jones & DeMille Engineering, Inc. 33
Water Quality and Quantity
Two small streams are located in the general project area. Big Hollow is approximately one-half mile to
the south of the lagoons and flows to the west into West Creek. West Creek is about one-quarter mile
west of the lagoons and flows north about six miles into Mona Reservoir. No water from the existing
sewage lagoons enters the streams. The only water leaving the lagoons is from evaporation and a
limited amount of seepage. The operation of the existing lagoons does not affect West Creek area, and
the construction and operation of the potential new lagoon will have no effect on it either.
Direct and Indirect Impacts
No adverse direct or indirect impacts are anticipated. The project, as proposed, is designed to process
the additional sewage disposal needs of Nephi, in anticipation of the projected population growth. If an
additional new lagoon is constructed, it would be located west of and adjacent to the existing lagoons in
an area that is disturbed. If processed water is to be discharged onto the surface, as part of the new
design features of the project, adjacent agricultural lands would benefit from its use as irrigation water.
Mitigation Adverse Impacts
No additional mitigations measures are needed. The proposed project design will mitigate any potential
impacts.
DEVELOPMENT AND SCREENING OF ALTERNATIVES
As Nephi City continues to grow, the current total containment lagoons will no longer be sufficient. In
the best case scenario, Nephi City will need to have additional capacity in its lagoon system for a
population of 8,000 people, which is projected to occur by 2020. In the worst case scenario, Nephi City’s
wastewater system is already undersized for the current population. Therefore, Nephi City needs to
make plans now for how to expand its wastewater treatment system. Five alternatives for expanding the
wastewater treatment system are:
1. Do Nothing
2. Mechanical Treatment
3. Constructed Wetlands
4. Type II Effluent Reuse
5. New Additional Lagoon
Each alternative will be discussed in detail.
Do Nothing Alternative
If Nephi City decides not to add additional capacity to its lagoon system at this time, it is unlikely that
any problems will occur in the next one to two years. However, if the conditions that caused the lagoons
to fill faster than normal from 1992 to 1999 happen again, the lagoons could overtop as soon as 2012.
At that point, it would be too late to add capacity to the lagoon system. The lagoons would likely
overtop and pollute West Creek, and remedial actions would have to be taken.

Nephi City Wastewater System Master Plan
Jones & DeMille Engineering, Inc. 34
Figure 23 Trend lines showing possible future filling rates.
In addition to remedial action, the Water Quality Act (Utah Code - Title 19 - Chapter 5) provides that any
person who violates a permit condition implementing provisions of the act is subject to a civil penalty
not to exceed $10,000 per day of such violation. Any person who willfully or negligently violates permit
conditions of the act is subject to a fine not exceeding $25,000 per day of violation. Any person
convicted under UCA 19-5-115(2) a second time shall be punished by a fine not exceeding $50,000 per
day. Nephi City has an operating permit for its lagoons and is subject to the Water Quality Act.
Because of the possible damage to the environment and the possible civil penalties, the do nothing
alternative will not be pursued.
Mechanical Treatment
There are several different types of mechanical treatment systems that are available for a variety of
applications. These include membrane filters, activated sludge, etc. Most systems are composed of
various concrete tanks that successively treat the sewage. Mechanical treatment systems generally take
up less space than sewage lagoons or constructed wetlands, thus making them ideal for large cities
where real estate is expensive. They are also ideal for systems with total inflow of more than 1 million
gallons per day because lagoons have to be extremely large to accommodate such large flows. However,
mechanical treatment systems have large operation and maintenance costs because they have pumps,
mixers, and moving parts that must be replaced regularly. They also require a full-time operator.
A cost proposal for an Argos Sequencing Batch Reactor (Figure 24) was completed by Aeration Industries
International, Inc. in March 2010. Six SBR batch reactors, each capable of handling approximately 0.12
MGD, could handle 0.72 MGD. The current estimated flow for Nephi City is 0.61 MGD, so the six batch
reactors would be sufficient for the current flow but not the 20-year flow. The engineer’s estimate of
probable costs for the construction of this particular SBR system was $4,010,000. Operation and
maintenance costs would be around $242,000/year. A mechanical treatment plant for Nephi City would
be more expensive than this estimate because Nephi City has higher flows than the city for which the
estimate was prepared.
0
100
200
300
400
500
600
'87 '88 '89 '90 '91 '92 '93 '94 '95 '96 '97 '98 '99 '00 '01 '02 '03 '04 '05 '06 '07 '08 '09 '10 '11 '12
Total Volume in Lagoons (acre-ft)
Date

Nephi City Wastewater System Master Plan
Jones & DeMille Engineering, Inc. 35
Figure 24 Argos Sequencing Batch Reactor (SBR).
Although a system has not been designed, and a cost analysis has not been completed for Nephi City, it
is very likely that the actual cost of an SBR system that could handle Nephi City’s wastewater flows in
2040 would cost close to $8,000,000 to construct and would have higher operation and maintenance
costs, too. An $8,000,000 loan at 2.5% interest for 30 years would equate to about a $17.00 per
connection per month increase. End users would also have to pay an additional $19.45 per connection
per month for operation and maintenance of the treatment plant, which never goes away.
Because a mechanical treatment system would cost more than double the price of a new lagoon system,
and because the existing lagoons would have to be abandoned in the process, a mechanical treatment
system will not be pursued at this time.
Constructed Wetlands
According to the United States Environmental Protection Agency’s manual on Constructed Wetlands
Treatment of Municipal Wastewaters, “constructed wetlands are especially well suited for wastewater
treatment in small communities where inexpensive land is available and skilled operators are hard to
find.” Constructed wetlands must meet the same liner requirements as lagoons, and they must meet the
same monitoring requirements as discharging lagoons. Often, constructed wetlands have an
impermeable liner so that water does not seep into the ground and so that a constant flow through the
wetlands can be maintained. Historically, the size of constructed wetlands has varied from 2 to 200
acres/MGD depending on effluent requirements and the additional amount of treatment needed to
permit discharge. Most communities use constructed wetlands for polishing lagoon effluent to meet the
state’s discharge requirements. Wetlands must have a constant supply of partially treated wastewater
to keep the vegetation and treatment processes viable. Without the water, the plants and organisms
would die and re-vegetation would be required prior to discharging to the lagoons. Figure 25 shows a
schematic of a constructed wetland. Average operating depth of a constructed wetland is about 3 feet,
which is half that of a lagoon. Because constructed wetlands are shallower than lagoons, they are more
prone to ice buildup, which reduces oxygen supply and slows treatment.

Nephi City Wastewater System Master Plan
Jones & DeMille Engineering, Inc. 36
Source: http://water.epa.gov/type/wetlands/restore/upload/2004_12_20_wetlands_pdf_Design_Manual2000.pdf
Figure 25 Schematic of a constructed wetland.
Nephi City is not expected to have consistent overflow from the existing lagoons in the foreseeable
future. The requirements to discharge treated wastewater from the wastewater treatment system into
waters of the state will significantly increase the testing and operational costs to the system. It is also
anticipated that construction costs for a wetland will be significantly more than that of a lagoon sized to
treat the same amount of water. Therefore, constructed wetlands are not a viable option for Nephi City.
Type II Effluent Reuse
Under certain circumstances, overflow from sewage lagoons may be used for irrigation or for other uses
given in Figure 26.
Source: http://www.water.utah.gov/WaterReuse/WaterReuseAA.pdf
Figure 26 Allowable uses for type II effluent.
A typical lagoons system must have at least three cells, and it must be large enough to contain all
sewage until the water evaporates or seeps into the ground. Depending on the quality of the water after
passing through the three existing lagoons, if a fourth lagoon cell is constructed, all the water entering
the fourth cell may not need additional treatment. Instead of building an additional lagoon, the excess

Nephi City Wastewater System Master Plan
Jones & DeMille Engineering, Inc. 37
water could be used for agricultural purposes. The water would have to be chlorinated, and an
additional small pond would have to be constructed as a storage basin for emergencies.
For Nephi City, type II effluent reuse is a viable and practical alternative, and it has been selected as a
principal alternative.
New Additional Lagoon
Nephi City’s current lagoons have been functioning properly since they were constructed in 1983. Nephi
City’s past record with proper maintenance and record-keeping indicates that an additional lagoon at
the same site would also likely receive proper maintenance.
An additional lagoon of equal size to the existing three lagoons would increase total capacity by 33%.
The total population that could be served by the new 4-cell system would be approximately 9,000
people assuming that current per capita sewer usage continues. The 1983 wastewater treatment
facilities plans by Creamer and Noble Engineers shows a future fourth lagoon cell to the northwest of
the existing three lagoons. The fourth cell could be built on land that Nephi City already owns, saving the
city money.
An additional total containment lagoon has been selected as a principal alternative.
EVALUATION OF PRINCIPAL ALTERNATIVES AND PLAN ADOPTION
Type II Effluent Reuse
There are strict requirements for water quality that must be obtained before the overflow from a lagoon
system can be used for irrigation. The effluent must be sampled daily for TSS, coliform, and pH and
weekly for BOD, as shown in Figure 27. A provision in the code states that,
“At the discretion of the Executive Secretary, the sampling frequency to determine compliance
with water quality limits for effluent from lagoon systems used to irrigate agricultural crops,
may be reduced to monthly grab sampling for BOD, and weekly grab sampling for E. coli, TSS
and pH. The Water Quality Board may also allow a relaxation of lagoon effluent BOD and
suspended solids concentrations, in accordance with R317-1-3.2.”
If Nephi City decides to pursue type II effluent reuse, it will probably have to demonstrate conformance
to the minimum water quality limits during a probationary period, perhaps six months or a year, before
the stricter sampling frequency could be relaxed.
Disinfection is required for all systems with fewer than 5 cells and with detention times less than 150
days at the mean operating depth. Disinfection can be accomplished by chlorination, ozonation, or other
chemical disinfectants, UV radiation, or other approved processes. The most common method is
chlorination. An alternative disposal option or diversion to storage basin must be available in case
quality requirements are not met.
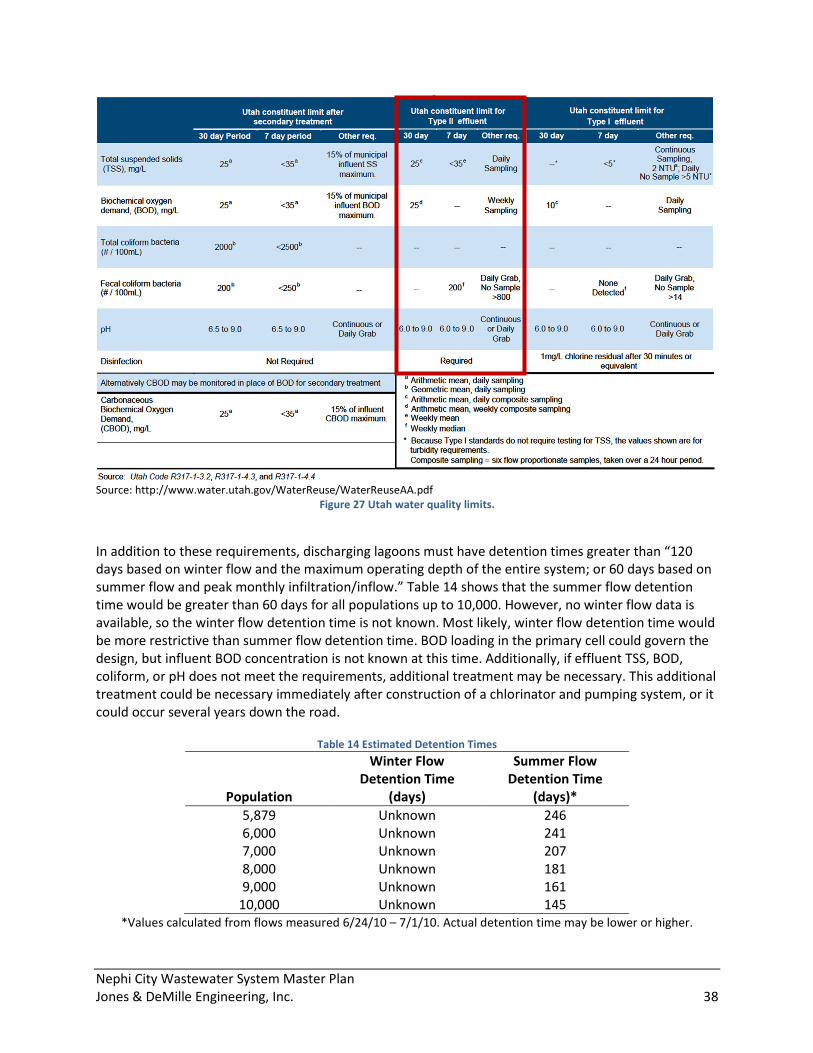
Nephi City Wastewater System Master Plan
Jones & DeMille Engineering, Inc. 38
Source: http://www.water.utah.gov/WaterReuse/WaterReuseAA.pdf
Figure 27 Utah water quality limits.
In addition to these requirements, discharging lagoons must have detention times greater than “120
days based on winter flow and the maximum operating depth of the entire system; or 60 days based on
summer flow and peak monthly infiltration/inflow.” Table 14 shows that the summer flow detention
time would be greater than 60 days for all populations up to 10,000. However, no winter flow data is
available, so the winter flow detention time is not known. Most likely, winter flow detention time would
be more restrictive than summer flow detention time. BOD loading in the primary cell could govern the
design, but influent BOD concentration is not known at this time. Additionally, if effluent TSS, BOD,
coliform, or pH does not meet the requirements, additional treatment may be necessary. This additional
treatment could be necessary immediately after construction of a chlorinator and pumping system, or it
could occur several years down the road.
Table 14 Estimated Detention Times
Population
Winter Flow
Detention Time
(days)
Summer Flow
Detention Time
(days)*
5,879 Unknown 246
6,000 Unknown 241
7,000 Unknown 207
8,000 Unknown 181
9,000 Unknown 161
10,000 Unknown 145
*Values calculated from flows measured 6/24/10 – 7/1/10. Actual detention time may be lower or higher.

Nephi City Wastewater System Master Plan
Jones & DeMille Engineering, Inc. 39
The total population that could be served by the current 3-cell system with type II effluent reuse would
probably be at least 10,000 people, based on minimum detention time, assuming that current per capita
sewer usage continues. However, if the BOD coming into the lagoons turns out to be higher than the
sample that was collected, the lagoons would probably need to be expanded to give a larger surface
area in the primary cell. Also, effluent from the third cell needs to be tested regularly to ensure that the
requirements for type II reuse could be satisfied.
New Additional Lagoon
If a new total containment lagoon is constructed, all designs will have to conform to Utah Administrative
Code Title R317, Environmental Quality, Water Quality. Additionally, per Nephi City’s operating permit
issued April 29, 2010, the lagoons must meet all requirements of the Utah Water Quality Act, Title 19,
Chapter 5, Utah Code Annotated. Maintenance for a fourth lagoon would be similar to maintenance
done in the past for the existing lagoons, with one exception. In the past, Nephi City has operated its
lagoons by periodically opening and closing the gates between the three lagoons to keep the depths in
the three lagoons roughly equal. The correct operation of the lagoons involves waiting until the first
lagoon is full then letting the water spill from the first lagoon to the second lagoon. Similarly, when the
second lagoon is full, let the water spill from the second lagoon to the third lagoon.
DESCRIPTION AND IMPLEMENTATION ARRANGEMENTS
Justification and Description of Selected Plan
Two plans were selected as feasible for Nephi City: type II effluent reuse and an additional lagoon. The
no action alternative was ruled out because historical measurements of the lagoons indicate that the
lagoons could overtop in the near future. The mechanical treatment alternative was ruled out because
mechanical treatment is cost-prohibitive for a community the size of Nephi City. Finally, the engineered
wetlands alternative was ruled out because the lagoons are not expected to have consistent outflow
and because Nephi City does not wish to discharge any sewage into waters of the state.
Design Process
Upon review of Nephi City’s wastewater collection and treatment system, the treatment portion of the
wastewater system was identified as needing upgrades. The total volume of wastewater stored in the
lagoons over the past several years indicates that the ponds filled to a point where they were near
overtopping in 1999. Because there are no inflow records to indicate a probable cause for the filling of
the lagoons, nor do drinking water use records trend with the increase and subsequent decrease in total
volume stored, we recommend that Nephi City move forward immediately with the design process to
increase the treatment capacity of the system. The need for immediate attention comes from the fact
that the last increase to near overflow capacity happened at a rate that, if repeated in the future, would
certainly overflow the lagoons in just two years. The following is a list of steps Nephi City should follow
to initiate design and subsequent construction of additional treatment capacity:
1. Obtain flow data and water quality samples
2. Review and update Wastewater System Master Plan with flow records
3. Select an Engineering Firm qualified to design and oversee construction of the selected
alternative
4. Create conceptual design of project and refine cost estimates

Nephi City Wastewater System Master Plan
Jones & DeMille Engineering, Inc. 40
5. Seek project funding (CIB or Utah Division of Water Quality)
6. Implement final design process and UDWQ review
7. Bidding and contractor negotiations
8. Construction
The design and construction process for a project this size can vary in length from 12 to 24 months
depending on funding and permitting requirements.
Cost Estimates
An engineer’s estimate of probable cost for the construction of a type II effluent reuse system is given in
Table 15.
Table 15 Engineer's Opinion of Probable Cost for a 5 Acre Pond with Chlorinator and a Pump Station
ITEM # ITEM DESCRIPTION QTY UNITS UNIT PRICE TOTAL
1 Mobilization @ 10% 1 L.S. $70,000.00 $71,000.00
2 Rip Rap D50=5" 500 C.Y. $70.00 $35,000.00
3 Transfer Structure 1 Each $12,500.00 $12,500.00
4 Transfer Structure Outlet 1 Each $2,000.00 $2,000.00
5 Inlet Pad & Sump 1 Each $2,000.00 $2,000.00
6 Lagoon Site Preparation 1 L.S. $20,000.00 $20,000.00
7 Compacted Embankment 10,000 C.Y. $8.00 $80,000.00
8 Clay Liner Material 7,500 C.Y. $15.00 $112,500.00
9 Clay Liner Native Soil Cover 4,000 C.Y. $8.00 $32,000.00
10 Dike Top UBC Surface 250 C.Y. $20.00 $5,000.00
11 6' Chain Link Fence with Barbed Wire 500 L.F. $20.00 $10,000.00
12 Warning Sign 5 Each $250.00 $1,250.00
13 Water Level Indicator 1 Each $1,500.00 $1,500.00
14 Chlorinator Building/Pump Station 1 L.S. $265,000.00 $265,000.00
15 6" Irrigation Piping 4,000 L.F. $15.00 $60,000.00
16 Generator Station 1 L.S. $10,000.00 $10,000.00
17 Contingency @ 15% 1 L.S. $58,000.00 $58,000.00
Construction Total
TOTAL: $777,750.00
Planning Engineering $10,000.00
Design Engineering $55,000.00
City Administration, Legal $20,000.00
Environmental & Permitting, etc. $80,000.00
Construction Engineering $67,000.00
PROJECT TOTAL $1,009,750.00
An engineer’s estimate of probable cost for the construction of an additional 33-acre cell is given in
Table 16.

Nephi City Wastewater System Master Plan
Jones & DeMille Engineering, Inc. 41
Table 16 Engineer's Opinion of Probable Cost for Additional 33 Acre Lagoon
ITEM # ITEM DESCRIPTION QTY UNITS UNIT PRICE TOTAL
1 Mobilization @ 10% 1 L.S. $228,000.00 $228,000.00
2 Rip Rap D50=5" 5000 C.Y. $55.00 $275,000.00
3 Splitter Structure 1 L.S. $12,500.00 $12,500.00
4 Transfer Structure 1 Each $12,500.00 $12,500.00
5 Transfer Structure Outlet 1 Each $2,000.00 $2,000.00
6 Inlet Pad & Sump 1 Each $2,000.00 $2,000.00
7 Lagoon Site Preparation 1 L.S. $50,000.00 $50,000.00
8 Compacted Embankment 65000 C.Y. $8.00 $520,000.00
9 Clay Liner Material 55000 C.Y. $15.00 $825,000.00
10 Clay Liner Native Soil Cover 27500 C.Y. $8.00 $220,000.00
11 Dike Top UBC Surface 1000 C.Y. $20.00 $20,000.00
12 6' Chain Link Fence with Barbed Wire 500 L.F. $20.00 $10,000.00
13 Warning Sign 5 Each $250.00 $1,250.00
14 Water Level Indicator 1 Each $1,500.00 $1,500.00
15 Contingency @ 15% 1 L.S. $327,000.00 $327,000.00
Construction Total
TOTAL: $2,506,750.00
Planning Engineering $10,000.00
Design Engineering $176,000.00
City Administration, Legal $20,000.00
Environmental & Permitting, etc. $65,000.00
Construction Engineering $214,000.00
PROJECT TOTAL
$2,991,750.00
Energy Requirements
If an additional lagoon is constructed, no additional energy requirements will be created. If type II
effluent reuse is selected, energy requirements would include power for pumps and the chlorine station.
The type of pump would depend on the location that the effluent is being pumped to, and the energy
consumption of the chlorinator would depend on the volume of effluent being treated. However,
pumping costs could be billed to the recipient of the water, so energy costs should not influence the
decision of whether an addition lagoon is built or whether type II effluent reuse is pursued. The cost of
extending permanent power facilities to the current lagoon location was investigated and found to be
approximately $200,000. Consequently, the engineer's opinion of probable cost for a 5 Acre Pond with
chlorinator and a pump station, found in Table 15, includes an item for a generator station. A
generator station was included in the cost estimate because of the significantly lower initial capital cost
of a generator station versus the capital cost of extending permanent power to the lagoons.
Environmental Impacts
As stated in the Environmental Review section of this report, an additional lagoon would have no
adverse impacts on the environment. Type II effluent reuse could actually benefit the environment by
providing irrigation water to agricultural land.

Nephi City Wastewater System Master Plan
Jones & DeMille Engineering, Inc. 42
Operation and Maintenance Requirements
For an additional lagoon, the increased operation and maintenance costs would be almost negligible.
Someone from public works would still have to inspect the lagoon system on a regular basis and take
daily measurements of lagoon depths. Operation and maintenance of a type II effluent reuse system
would be much more demanding than operation and maintenance of an additional lagoon. In addition
to the monitoring of the existing lagoons, daily and weekly samples would need to be collected and
tested for TSS, BOD, pH, and coliforms. The chlorinator would need to be kept in working condition as
well as the pump station and pipe network.
Land Acquisition
When the current lagoons were constructed, a portion of land was set aside for a fourth lagoon. This
land is about 30 acres and is located to the northwest of and immediately adjacent to the existing
lagoons. If a new lagoon is constructed, no additional land would need to be purchased. If type II
effluent reuse is pursued, the treatment facility and pump station could be located adjacent to the
lagoons on land that the city already owns. Nephi City would need to enter an agreement with a
landowner near the lagoons for water rights to the effluent.
FINANCIAL AND ORDINANCE REVISION CONSIDERATIONS
User Fees and Affordability Criteria
Nephi City currently charges a flat rate of $7.25/month per connection for residential connections.
Commercials connections are charged a base rate of $8.25/month per connection. In addition to the
base rate, commercial connections are charged $0.40 per thousand gallons of metered water use.
Under certain circumstances, grant money is available to help subsidize wastewater system
improvements. However, before grant money is available, loan repayment, operation and maintenance
costs, and reserve fund payments must total at least 1.4% of the median adjusted gross income (MAGI)
of that community. In 2009, Nephi City’s MAGI was $38,718. This means that the monthly sewer bill
must exceed $45.17 per connection before Nephi City will be eligible for a grant.
A cash flow analysis was performed on records provided by Nephi City officials (Table 17). These records
include cash flow data from July 1, 2005 to June 30, 2010.

Nephi City Wastewater System Master Plan
Jones & DeMille Engineering, Inc. 43
Table 17 Nephi City Sewer System Cash Flow Analysis
Cash Flow Analysis of 2005-2009 Fiscal Year Beginning:
2005 2006 2007 2008 2009
1. Cash Receipts:
a. Residential Sewer Revenue $140,229.00 $132,270.00 $146,515.00 $144,038.00 $146,873.00
b. Commercial Sewer Revenue $57,875.00 $65,054.00 $73,236.00 $82,084.00 $74,199.00
c. Other Sewer Revenue $7,525.00 $1,170.00 $1,580.00 $1,960.00 $2,063.00
2. Total Cash Receipts (1a thru 1c) $205,629.00 $198,494.00 $221,331.00 $228,082.00 $223,135.00
3. Operating Expenses
a. Loan Interest and Principal Payment $87,671.00 $87,671.00 $87,671.00 $87,671.00 $0.00(1)
b. All Other Expenses(3) $47,622.00 $42,842.00 $39,899.00 $24,565.00 $113,388.00(2)
4. Total 0&M Expenses (3a and 3b) $135,293.00 $130,513.00 $127,570.00 $112,236.00 $113,388.00
5. Coverage Ratio (2-3b)/3a 1.8 1.8 2.1 2.3 N/A
6. Operating Ratio (2-3a)/3b 2.5 2.6 3.3 5.7 2.0
(1)CIB loan paid off in 2008 fiscal year
(2)Does not include expenditures related to Master Plan preparation
(3)Water and sewer funds are combined. It is assumed 25% of personnel costs are attributed to sewer
Ratios are important factors and are used in determining the financial viability of the sewer system.
The coverage ratio is a measure of the sufficiency of net operating profit to cover the debt service
requirements of the system. The operating ratio is a measure of whether operating revenues are
sufficient to cover operation, maintenance, and replacement expenses (the operating ratio of 1.2 means
the water system receives 20 percent more in water sales than is spent in operating expenses). The City
should charge user fees high enough to generate a minimum coverage ratio of 1.25, preferably 1.5, and
a minimum operating ratio of 1.0, preferably 1.2. The coverage and operating ratios that the City
operates with should be considered with respect to available reserves and cash position. If the City
maintains sufficient reserves to cover unanticipated expenses or revenue shortfalls then the City could
choose to operate near the minimum ratios. However, if the City elects to use the cash reserves to pay
off outstanding debt or other expenses that arise then the City should adjust monthly user fees to
operate near the preferred coverage and operating ratios.
The cash flow analysis indicates the system has been self-sufficient over the analyzed years. The CIB loan
was paid off in the 2008 fiscal year – eliminating any system debt. Prior to that time, the system had
adequate net revenue to easily cover loan principal and interest payments, as indicated by the coverage
ratio. Based upon average values from the 2005-2009 cash flow analysis, the City can afford a yearly
loan interest and principal payment of $135,000 for a wastewater system enhancement. This would
result in a coverage ratio of approximately 1.5. A $2,847,000 loan at 2.5% interest for 30 years would
equate to a monthly payment of $11,250 for a total yearly amount of $135,000. If a larger loan amount
is required for the project then it is recommended that the user rate be raised to keep the operating and
coverage ratios above the preferred limits.
It appears that the operating ratio has been and will continue to be well above the recommended
minimum. Therefore, it is not anticipated that there will be a need to increase user rates in the
immediate future. However, it is recommended that the City review these ratios periodically to
determine if they are adequate to maintain the financial viability of the system. If possible, rates should

Nephi City Wastewater System Master Plan
Jones & DeMille Engineering, Inc. 44
be adjusted well in advance of anticipated conditions that will cause the coverage and operating ratios
to go below the minimum levels. If a loan is secured for a wastewater project and the yearly payment is
$135,000 or less, then, based upon average values from the 2005-2009 cash flow analysis, the City’s
operating ratio will be approximately 1.5 or more.
Options to make adjustments to the user rate include one or a combination of the following: raise the
base sewer rate, reduce the base rate usage amount, increase the overage charges, or create a tiered
overage structure. Funding agencies often request information concerning rate structures and
methods used to encourage conservation. Implementing rate adjustments as discussed above would
demonstrate the City is doing its part to encourage water conservation and should receive favorable
consideration during funding requests.
Connection Fees
The City currently charges a connection fee of $250 per single-family residential regular connection.
The sewer connection is to be owner-installed and to Nephi City subdivision specifications. To be
consistent with current legislation, connection fees and impact fees will be discussed separately, and it is
recommended the City assess them separately to individuals desiring to connect to the sewer system.
Connection fees should pay for all costs associated with the connection. The connection fee should be
analyzed annually by the City to ensure that it is equitable to both the City and the resident.
Impact Fees
An impact fee is a one-time charge on a new development for the purpose of raising revenue for new or
expanding public facilities to support the impact of new development. Impact fees are expressly
distinguished from a tax, a building permit fee, a hook-up fee, a fee for project improvements, or other
reasonable permit or application fees, such as conditional use or subdivision application fees. In 1995
the Utah State Legislature enacted laws that firm up the authority of local governments to impose
impact fees but also impose a number of strict requirements relative to the procedure and
establishment of those fees. This law has undergone numerous revisions and additions and was
subsequently recodified by the 2011 Legislature. The provisions of the statute must be carefully
followed to protect local governments from the expense of refunding those fees with interest. This
section contains an impact fee study conducted to help Nephi City investigate the advantages of
performing an Impact Fee Facilities Plan and Impact Fee Analysis in accordance with Utah Code, Title 11,
Chapter 36 – The Impact Fees Act and other judicial decisions that have further defined the means and
methods of determining an equitable impact fee. This section does not represent an official Impact Fee
Analysis, but outlines the benefits of preforming one and the necessary steps required to conduct one.
Statutes
The Utah Supreme Court ruled in Banberry Development Corp. v. South Jordan that an equitable
correlation between the fee charged and the impact on the system caused by the development can be
achieved by evaluating the following seven factors:
1. The cost of existing public facilities. This factor establishes a maximum recovery at the actual
cost of constructing or acquiring the facility (not its replacement cost);
2. The manner of financing existing public facilities, such as user charges, special assessments,
bonded indebtedness, general taxes, or federal grants. This factor requires the local

Nephi City Wastewater System Master Plan
Jones & DeMille Engineering, Inc. 45
government to subtract the total dollar amount financed from grants or other non-general
fund sources from the actual cost;
3. The extent to which the newly developed properties and the other properties in the
municipality have already contributed to the cost of existing public facilities, by such means
as user charges, special assessments, or payment from the proceeds of general taxes. This
factor requires the local government to subtract a portion of the user charges, all of the
special assessments, and some general tax sources from the actual cost;
4. The extent to which the newly developed properties and the other properties in the
municipality will contribute to the cost of existing public facilities in the future. This factor
requires the local government to subtract from the actual cost the general tax revenues that
the new development will contribute to retiring the cost of the facility;
5. The extent to which the newly developed properties are entitled to a credit because the
municipality is requiring their developers or owners, by contractual arrangement or
otherwise, to provide common facilities, inside or outside the proposed development, that
have been provided by the municipality and financed through general taxation or other
means, apart from user charges, in other parts of the municipality. This factor requires the
local government to subtract from the actual cost of a facility any developer “exaction”
within the fee category;
6. Extraordinary costs, if any, in servicing the newly developed properties; and
7. Time-price differential inherent in fair comparisons of amounts paid at different times. This
factor allows the local government to add the time value of money (interest paid) into the
actual cost of the capital facility. As such the cost of an old capital facility, with capacity to
accommodate new growth can be supplemented with an interest component under the law.
Probable Impact Fees
Impact fees can be assessed on a system-wide basis or can be assessed based upon service areas.
Since all future sewer connections would be served by whichever alternative is selected, a system wide
impact fee would be the correct fee assessment method. Impact fees are calculated as the total cost of
facilities to serve new development divided by the units of new development (i.e. ERCs). The probable
impact fee for each alternative is outlined below, assuming that the alternatives are paid for completely
through loans and not grants. The calculation of probable impact fees below also assumes that the loans
will be paid off by sewer system fees and impact fees and not through general taxation. Actual impact
fees may be more or less based upon debt service charges and actual cost of construction and
engineering. Based on the 2010 U.S. Census data Nephi City may not grow to the 9,000 or 10,000
residents within a 20 or 30 year loan repayment period. Consequently only a part of the sewer
treatment system expansion would be paid for with impact fees because the loan would be retired
before all the potential growth, accommodated by the alternatives listed below, would occur.
Alternative I – Type II Effluent Reuse
The estimated total cost for the type II effluent reuse option is $996,750. The population that could be
served by the type II effluent reuse alternative is 4,121 (10,000 – 5,879). This population is equivalent to
1,198 ERCs (4,121/3.44). The resulting probable impact fee is $832 ($996,750/1,198).
Nephi City Wastewater System Master Plan
Jones & DeMille Engineering, Inc. 46
Alternative 2 – Additional Lagoon
The estimated total cost for the additional lagoon option is $2,991,750. The population that could be
served by the type II effluent reuse alternative is 3,121 (9,000 – 5,879). This population is equivalent to
907 ERCs (3,121/3.44). The resulting probable impact fee is $3,299 ($2,991,750/907).
Impact Fee Implementation Plan
The first step Nephi City must follow to implement an impact fee enactment is to follow the proper
notice schedule. Failure to provide proper notices may result in an invalid enactment, requirement that
funds collected be refunded, and the entire process of adopting an impact fee system may have to be
repeated.
An Impact Fee Facilities Plan (IFFP) is required for any impact fee enactment for municipalities with
more than 5000 residents in the last census. The IFFP is to determine the public facilities required to
serve development resulting from new development activity and the proposed means by which the City
will meet those demands. The IFFP must consider all revenue sources, including impact fees and
anticipated dedication of system improvements, to finance the impacts on system improvements. The
IFFP itemizes the necessary projects that must be constructed to accommodate future growth. Impact
fees must be expended within 6 years of collection. The IFFP should take this into consideration and
base the size and timing of needed projects accordingly. Impact fees can be used to retire debt incurred
in IFFP listed projects.
An Impact Fee Analysis (IFA) can then be performed. The IFA is used to estimate the proportionate share
of the costs for existing capacity that will be recouped and the costs of impacts on system improvements
that are reasonably related to the new development activity. The IFA identifies how the impact fee was
calculated.
The actual enactment of an impact fee must be accomplished for a city by an ordinance.
The City must then ensure that proper accounting and recorded keeping is exercised in relation to the
collection and handling of impact fees. Impact fees for each type of service must be deposited in their
own interest bearing account. Yearly reports must be submitted to the State Auditor and outline each
dollar collected and each dollar spent. Finally, any impact fee not used within 6 years for system
improvements outlined in the IFFP must be refunded with interest.
Ordinance Review
Nephi City’s sewer system and overall sewer use has changed significantly since 1979, when its sewer
service regulations were adopted. Several sections of the regulations have been amended as recently as
2007. In order for the City to sufficiently protect its investment and maintain the functionality of the
system, additional sewer service regulations should be added to the existing regulations. An example
ordinance with more stringent regulations is attached in Appendix B. The primary area of emphasis in
the example ordinance is to limit what end users dispose of in the City’s system. Nephi’s current
regulations do not sufficiently address the many types of pollutants that can permanently damage the
existing treatment system.

Nephi City Wastewater System Master Plan
Jones & DeMille Engineering, Inc. 47
The Nephi City Council should review the current sewer service regulations in conjunction with the
sample ordinance and determine which additional regulations need to be amended into their
regulations. Other resources for additional regulations include the Rural Water Association of Utah and
the American Public Works Association.
CONCLUSIONS
The Nephi City wastewater system study has identified several items that the City needs to complete.
These items will assist in protecting the City’s investment and maintaining a fully operational system.
The items requiring immediate action and continued attention include the following:
1. Install flow meter at lagoons
2. Implement regular influent testing
3. Monitor flow at key locations throughout the City
4. Initiate design process for treatment expansion
5. Review wastewater system study to understand alternatives
6. Review and update City’s sewer service regulations
7. At a minimum, instigate 1-year sewer line cleaning rotation of problem areas and 3-year
sewer line cleaning rotation elsewhere
Sewer Lines
The flows that were measured in each of five sewer lines showed that most areas of the city can tolerate
reasonable expansion. A possible exception is the sewer line on Airport Road between Highway 132 and
Shaw Lane. With design flows for a population of 5,879 the sewer line is at 118% capacity. The area that
currently contributes wastewater to this pipe is the portion of Nephi City to the south of 350 South
together with the area adjacent to Highway 132 west of the fairgrounds. We recommend one of the
following alternatives to mitigate the potential problem:
A. Replace the existing sewer line with a larger diameter pipe.
or
B. Prohibit growth to the south of 350 South together with the area adjacent to Highway 132 west
of the fairgrounds.
or
C. (Recommended alternative) Purchase a portable flow monitor, and limit growth to the south of
350 South together with the area adjacent to Highway 132 west of the fairgrounds so that peak
flows stay below 580 gallons per minute (75% of capacity) along the critical sewer line. We
believe this may occur after the addition of approximately 2,000 equivalent residential units.
Total Containment Lagoons
This study has shown that there is a need to increase the capacity of the total containment lagoons. In
preparation for the construction of an additional lagoon or the application of type II effluent reuse,
measures should be taken now to reduce the cost of future expansion. We recommend that Nephi City

Nephi City Wastewater System Master Plan
Jones & DeMille Engineering, Inc. 48
install a permanent flow monitor at the entrance to the lagoons. This will allow the engineer in the
future to design the lagoons based on actual flows (estimated to be about 50.2 gallons per population
equivalent per day) instead of on conservative estimates (100 gallons per population equivalent per
day). Additionally, winter and summer flow measurements are needed in order to investigate the
possibility of type II effluent reuse.
We also recommend that Nephi City start measuring the amount of BOD entering the lagoon. This
should be done on a monthly basis. The amount of BOD entering the lagoons determines the necessary
size of the first cell. If BOD is not measured, the first cell will probably have to be increased to an area of
59 acres for the current population. This is almost double the current size of 33 acres.
Maintenance
A major finding of this study is that a large number of sewer lines have insufficient slope. These flat
segments of pipe tend to clog and back up. Therefore, we recommend that Nephi City ensure that new
sewer lines meet the minimum slope requirements given in TableR317-3-2.3(D)(4), which is reproduced
here in Table 18. Wherever possible, steeper slopes should be used.
Table 18 Minimum Slopes of Sewer Lines
Adapted from: http://www.rules.utah.gov/publicat/code/r317/r317-003.htm
Sewer Size, in. Slope, ft/ft
8 0.00334
9 0.00285
10 0.00248
12 0.00194
14 0.00158
15 0.00144
16 0.00132
18 0.00113
21 0.00092
24 0.00077
27 0.00066
30 0.00057
36 0.00045
The video logs showed several protruding service lines throughout the system. These protruding service
lines reduce capacity and can cause blockages. To help prevent issues like this in the future, we
recommend that Nephi City implement a quality control program for new construction. This could
include video inspections of sewer lines in new subdivisions and anything else the city feels is
appropriate. For all new connections outside of subdivisions no video would be needed. These single
connections should be required to submit as-built records indicating the distance from the connection of
the lateral and the sewer main to the nearest sewer manhole. The single connections should also be
inspected by Nephi City staff to ensure proper installation. The video logs also showed locations with
severe grease buildup. We therefore recommend that Nephi City implement a maintenance schedule for
cleaning existing sewer lines on a regular basis, especially known problem spots. The time between

Nephi City Wastewater System Master Plan
Jones & DeMille Engineering, Inc. 49
cleanings should be based on past experience and on knowledge of industrial and/or commercial users
upstream of each location.
An example ordinance is attached in Appendix B. The primary area of emphasis in the example
ordinance is to limit what end users dispose of in the City’s system. Nephi’s current regulations do not
sufficiently address the many types of pollutants that can permanently damage the existing treatment
and collection system. Enactment and enforcement of the example ordinance, or similarly restrictive
ordinance, will lower the amount of required system maintenance.

Nephi City Wastewater System Master Plan A-1
Appendix A
Study Exhibits

200 S
I-15 SB FWY
I-15 NB FWY
400 E
MAIN ST
500 S
100 N
AIRPORT RD
300 E
700 N
100 W
500 N
200 N
600 N
600 E
100 S
800 E
400 S
500 E
HWY 1
32
400 W
700 S
SHEEP LANE RD
HWY 28
300 W
400 N
300 N
600 S
500 W
BLACKETT LN
ELWOOD
ELEVATOR RD
800 N
900 N
CENT
ER S
T
FOUR MILE
1500
N
900 E
BIGLO
WS
700 EFRONTAGE RD
SHAW
LN
JOHN
DEE
RE LN
GREE
NHAL
GH LN
MORG
AN LN
200 W
WEST AIRPORT LN
50 E
1400
S ORGILL RD
BILL P
AY LN
250 E
DR JO
NES L
N
310 E760 S14
50 N
BYRON SCOTT
1300
S100 E150 E
CARL
JARR
ETT L
N
200 E
740 N
550 E475 E
325 ESP
IDER
RD
CHUR
CH LN
300 S
1100
N
1250
N
DALE
SPE
RRY L
N
1000
N
GOLF
COU
RSE R
D
SHEEP LN
THE MONA RD
TATT
ON
480 E
GARR
ETT F
ARM
RD
650 E
820 S
NORTONVILLE FRONTAGE RD
350 S
570 S
930 S
CHURCH CROCKED LN
450 N
PRICKLEY ST
1000
S880 S
230 E
GARR
ETT 425 W
770 N
TERRY BROWN
520 SBL
ACKE
TT LA
NE 1
1430 SSUNSET RAIL RD
400 N
SHEEP LN
200 E
300 N
1250
N
600 E
150 E
900 E
300 W400 W
700 N
700 E700 E
200 W
1450
N
HWY 28
200 E
300 W
ORGI
LL R
D
BIGLO
WS
100 E
SHEE
P LAN
E RD
100 E 300 S
³
GIS
ENGINEERED BY: RJ 11-10 CHECKED BY: JD 11-10SURVEYED BY: DRAWN BY: TRB 11-10 LAST EDIT: 12/22/2010PROJECT NUMBER: 0912-057 MAP NAME: H:\JD\PROJ\0912-057\GIS\maps\1B_LANDSCAPE.mxd
J U A B C O U N T YSCALE: 1"=2,000'
E X -1PLOTTED: 12/22/2010
Wastewater StudySystem Capacity Exhibit
N e p h i C ity
Richfield & Price Utah www.jonesanddemille.com
L e g e n dSEWER LINES
A D D IT IO N A L E .R .U .1,8002,2004,4004,50049,700CITY BOUNDARY
2,000 0 2,0001,000 Feet

Nephi City Wastewater System Master Plan B-1
Appendix B
Sewer Use Ordinance

Sample Ordinance
ORDINANCE NO. 200 AN ORDINANCE ESTABLISHING
SEWER USE REGULATIONS
An ordinance regulating the use of public and private sewers and drains, private wastewater disposal, the installation and connection of building sewers, and the discharge of waters and wastes into the public sewer system(s); and providing penalties for violations thereof.
Be it ordained and enacted by the Council of the City of _______, Utah as follows:
ARTICLE I Definitions
Unless the context specifically indicates otherwise, the meaning of terms used in this ordinance shall have the meanings hereinafter designated:
Sec. 1 “Act" - The Federal Water Pollution Control Act also referred to as the Clean Water Act, as amended, 33. U.S.C. 1251, et seq.
Sec. 2 “ASTM” - American Society for Testing Materials.
Sec. 3 “Authority” - The City, Utah or its representative thereof.
Sec. 4 “BOD5 or Biochemical Oxygen Demand” - The quantity of oxygen utilized in the biochemical oxidation of organic matter under standard laboratory procedure in five (5) days at 20 degrees Centigrade in terms of milligrams per liter (mg/l).
Sec. 5 "Building Drain" — that part of the lowest horizontal piping of a drainage system which receives the discharge from waste and other drainage pipes inside the walls of the building and conveys it to the building sewer, beginning five (5) feet outside the building wall.
Sec. 6 “Building Sewer” - the extension from the building drain to the public sewer or other place of disposal, also referred to as a house connection or service connection.
Sec. 7 “City” — the area within the corporate boundaries of the City as presently established or as amended by ordinance or other legal actions at a future time. The term “City” when used herein may also be used to refer to the City Council and its authorized representative.
Sec. 8 “Chemical Oxygen Demand (COD)” - the quantity of oxygen utilized in the chemical oxidation of organic matter as determined by standard laboratory procedures, and as expressed in terms of milligrams per liter (mg/l).
Sec. 9 “Compatible Pollutant” - biochemical oxygen demand, suspended solids, pH, and fecal coliform bacteria, plus additional pollutants identified in the NPDES Permit if the treatment facilities aredesigned to treat such pollutants to a degree which complies with effluent concentration limits imposed by the permit.
Sec. 10 “Control Manhole” — a structure specially constructed for the purpose of measuring flow and sampling of wastes.

Sec. 11 “Easement” — an acquired legal right for the specific use of land owned by others.
Sec. 12 "Fecal Coliform” — any number of organisms common to the intestinal tract of man and animals whose presence in sanitary sewage is an indicator of pollution.
Sec. 13 “Floatable Oil” - Oil, fat, or grease in a physical state, such that it will separate by gravity from wastewater.
Sec. 14 “Garbage” - animal and vegetable waste resulting from the handling, preparation, cooking, and serving of food.
Sec. 15 “Incompatible Pollutant” — any pollutant that is not defined as a compatible pollutant (Sec. 9) including non-biodegradable dissolved solids.
Sec. 16 “Industry” - any nongovernmental or nonresidential user of a publicly owned treatment works which is identified in the Standard Industrial Classification Manual, latest edition, which is categorized in Divisions A, B, D, E and I.
Sec. 17 “Industrial Waste” — gaseous, liquid, and solid wastes resulting from industrial or manufacturing processes, trade or business, or from the development, recovery, and processing of natural resources, as distinct from residential or domestic strength wastes.
Sec. 18 “Infiltration” — water entering the sewage system (including building drains and pipes) from the ground through such means as defective pipes, pipe joints, connections, and manhole walls.
Sec. 19 “Infiltration/Inflow (I/I)” - the total quantity of water from both infiltration and inflow.
Sec. 20 “Inflow” - water other than wastewater that enters a sewer system (including building drains) from sources such as, but not limited to, roof leaders, cellar drains, yard and area drains, foundation drains, drains from springs and swampy areas, manhole covers, cross-connections from storm sewers, catch basins, surface runoff, street wash waters or drainage.
Sec. 21 “Interference” - the inhibition or disruption of the City’s wastewater disposal system processes or operations which causes or significantly contributes to a violation of any requirement of theCity’s NPDES and/or SDS Permit. The term includes of sewage sludge use or disposal by the City in accordance with published regulations providing guidelines under Section 405 of the Act or any regulations developed pursuant to the Solid Waste Disposal Act, the Clean Air Act, the Toxic Substances Control Act, or more stringent State criteria applicable to the method of disposal or use employed by the City. Sec. 22 “UDEQ” — Utah Department of Environmental Quality.
Sec. 23 “National Categorical Pretreatment Standards” - federal regulations establishing pretreatment standards for introduction of pollutants in publicly-owned wastewater treatment facilities which are determined to be not susceptible to treatment by such treatment facilities or would interfere with the operation of such treatment facilities, pursuant to Section 307(b) of the Act.
Sec. 24 “National Pollutant Discharge Elimination System (NPDES) Permit” — a permit issued by the UDEQ, setting limits on pollutants that a permittee may legally discharge into navigable waters of the UnitedStates pursuant to Sections 402 and 405 of the Act.
Sec. 25 “Natural Outlet” - any outlet, including storm sewers and combined sewers, which overflow into a watercourse, pond, ditch, lake or other body of surface water or ground water.
Sec. 26 “Non-contact Cooling Water” — the water discharged from any use such as air conditioning, cooling or refrigeration, or during which the only pollutant added, is heat.
Sec. 27 “Normal Domestic Strength Waste” — wastewater that is primarily introduced by residential users with a BOD5 concentration not greater than 200 mg/l and a suspended solids (TSS) concentration not greater than 250 mg/l.
Sec. 28 “Person” — any individual, firm, company, association, society, corporation, or group.
Sec. 29 “pH” - the logarithm of the reciprocal of the concentration of hydrogen ions in terms of grams per liter of solution.
Sec. 30 “Pretreatment” - the treatment of wastewater from industrial sources prior to the introduction of the waste effluent into a publicly-owned treatment works (See Sec. 23).
Sec. 31 “Properly Shredded Garbage” - the wastes from the preparation, cooking and dispensing of food that have been shredded to such a degree that all particles will be carried freely under the flowconditions normally prevailing in public sewers with no particle greater than 1/2 inch (1.27 cm) in any dimension.
Sec. 32 “Sewage” - the spent water of a community. The preferred term is wastewater.
Sec. 33 “Sewer” - a pipe or conduit that carries wastewater or drainage water.
a. “Collection Sewer” - a sewer whose primary purpose is to collect wastewaters from individual point source discharges and connections.
b. “Combined Sewer” - a sewer intended to serve as a sanitary sewer and a storm sewer.
c. “Force Main” - a pipe in which wastewater is carried under pressure.
d. “Interceptor Sewer” - a sewer whose primary purpose is to transport wastewater from collection sewers to a treatment facility.
e. “Private Sewer” - a sewer which is not owned and maintained by a public authority.
f. “Public Sewer” - a sewer owned, maintained and controlled by a public authority.
g. “Sanitary Sewer” - a sewer intended to carry only liquid and water-carried wastes from residences, commercial buildings, industrial plants, and institutions together with minor quantities of ground, storm, and surface waters which are not admitted intentionally.
h. “Storm Sewer or Storm Drain” - a drain or sewer intended to carry storm waters, surface runoff, ground water, sub-surface water, street wash water, drainage, and unpolluted water from any source.

Sec. 34 “Shall” is mandatory; “May” is permissive.
Sec. 35 “Significant Industrial User” — any industrial user of the wastewater treatment facility which has a discharge flow (1) in excess of 25,000 gallons per average work day, or (2) has exceededfive percent (5%) of the total flow received at the treatment facility, or (3) whose waste contains a toxic pollutant in toxic amounts pursuant to Section 307(a) of the Act, or (4) whose discharge has a significant effect, either singly or in combination with other contributing industries, on the wastewater disposalsystem, the quality of sludge, the system’s effluent quality, or emissions generated by the treatment system.
Sec. 36 “Slug” - any discharge of water or wastewater which in concentration of any given constituent, or in quantity of flow, exceeds for any period of duration longer than fifteen (15) minutes, more than five (5) times the average 24-hour concentration of flows during normal operation, and shall adversely affect the collection and/or performance of the wastewater treatment works.
Sec. 37 “State NPDES Surface Discharge Permit” - any permit (including any terms, conditions and requirements thereof) issued by the UDEQ pursuant to Utah Administrative Code R-317-8.
Sec. 38 “Superintendent” — the utilities superintendent or a deputy, agent or representative thereof.
Sec. 39 “Suspended Solids (SS) or Total Suspended Solids (TSS)” - the total suspended matter that either floats on the surface of, or is in suspension in water, wastewater or other liquids, and is removable by laboratory filtering as prescribed in “Standard Methods for the Examination of Water and Wastewater”, latest edition, and referred to as non-filterable residue.
Sec. 40 “Toxic Pollutant” — the concentration of any pollutant or combination of pollutants which upon exposure to or assimilation into any organism will cause adverse effects as defined in standardsissued pursuant to Section 307(a) of the Act.
Sec. 41 “Unpolluted Water” - water of quality equal to or better than the effluent criteria in effect, or water that would not cause violation of receiving water quality standards, and would not be benefited by discharge to the sanitary sewers and wastewater treatment facilities. (See “Non-contact Cooling Water”, Sec. 26.)
Sec. 42 “User” - any person who discharges or causes or permits the discharge of wastewater into the City’s wastewater disposal system.
Sec. 43 “Wastewater” — the spent water of a community and referred to as sewage. From the standpoint of source, it may be a combination of the liquid and water-carried wastes from residences, commercial buildings, industrial plants, and institutions together with any ground water, surface water and storm water that may be present.
Sec. 44 “Wastewater Treatment Works or Treatment Works” - an arrangement of any devices, facilities, structures, equipment, or processes owned or used by the City for the purpose of the transmission, storage, treatment, recycling, and reclamation of municipal sewage, domestic sewage or industrial wastewater, or structures necessary to recycle or reuse water including interceptor sewers, outfall sewers, collection sewers, pumping, power, and other equipment and their appurtenances; extensions, improvements, remodeling, additions, and alterations thereof; elements essential to provide a reliable recycled water supply such as standby treatment units and clearwell facilities; and any works including land which is an integral part of the treatment process or is used for ultimate disposal of

residues resulting from such treatment.
Sec. 45 “Watercourse” - a natural or artificial channel for the passage of water, either continuously or intermittently.
Sec. 46 “WPCF” - the Water Pollution Control Federation.
ARTICLE II Control by the Utilities Superintendent
Sec. 1 The Utilities Superintendent shall have control and general supervision of all public sewers and service connections in the City, and shall be responsible for administering the provisions of this ordinance to the end that a proper and efficient public sewer is maintained.
ARTICLE III
Sec. 1 It shall be unlawful for any person to place, deposit, or permit to be deposited in any unsanitary manner on public or private property within the City, or in any area under jurisdiction, any human or animal excrement, garbage or objectionable waste.
Sec. 2 It shall be unlawful to discharge to any natural outlet any wastewater or other polluted waters, except where suitable treatment has been provided in accordance with subsequent provisions of thisordinance and the City’s NPDES/SDS Permit.
Sec. 3 Except as provided hereinafter, it shall be unlawful to construct or maintain any privy, privy vault, septic tank, cesspool, or other facility intended or used for the disposal of wastewater.
Sec. 4 The owner(s) of all houses, buildings, or properties used for human occupancy, employment, recreation or other purposes from which wastewater is discharged, and which is situated within the City and adjacent to any street, alley, or right-of-way in which there is now located, or may in the future be located, a public sanitary sewer of the City, shall be required at the owner(s) expense to install asuitable service connection to the public sewer in accordance with provisions of this Code, within 90 days of the date said public sewer is operational, provided said public sewer is within 200 feet of the structure generating the wastewater. All future buildings constructed on property adjacent to the public sewer shall be required to immediately connect to the public sewer. If sewer connections are not made pursuant to this section, an official 30-day notice shall be served instructing the affected property owner to make said connection.
Sec. 5 In the event an owner shall fail to connect to a public sewer in compliance with a notice given under Article II, Section 4 of the Ordinance, the City must undertake to have said connection made and shall assess the cost thereof against the benefited property. Such assessment, when levied, shall bear interest at the rate determined by the City Council and shall be certified to the Auditor of the County of __________, Utah and shall be collected and remitted to the City in the same manner as assessments for local improvements. The rights of the City shall be in addition to any remedial or enforcement provisions of this ordinance.
ARTICLE IV Private Wastewater Disposal
Sec. 1 Where a public sewer is not available under the provisions of Article III, Section 4; the building sewer shall be connected to a private wastewater disposal system complying with the

provisions of this Article.
Sec. 2 Prior to commencement of construction of a private wastewater disposal system, the owner(s) shall first obtain a written permit signed by the City. The application for such permit shall be made on a form furnished by the City, which the applicant shall supplement by any plans, specifications, and other information as are deemed necessary to the City.
Sec. 3 A permit for a private wastewater disposal system shall not become effective until the installation is completed to the satisfaction of the City or its authorized representative. The City or its representative shall be allowed to inspect the work at any stage of construction, and, in any event, the applicant for the permit shall notify the City when work is ready for final inspection, and before any underground portions are covered. The inspection shall be made within eight (8) hours of the receipt of notice.
Sec. 4 The type, capacities, location, and layout of a private wastewater disposal system shall comply with all requirements of entitled, “Individual Sewage Treatment System Standards”. No septic tank or cesspool shall be permitted to discharge to any natural outlet.
Sec. 5 At such time as a public sewer becomes available to a property serviced by a private wastewater disposal system, a direct connection shall be made to the public sewer within 90 days incompliance with the Ordinance, and within 30 days any septic tanks, cesspools, and similar private wastewater disposal systems shall be cleaned of sludge. The bottom shall be broken to permit drainage, and the tank or pit filled with suitable material.
Sec. 6 The owner(s) shall operate and maintain the private wastewater disposal facilities in a sanitary manner at all times at no expense to the City.
Sec. 7 No statement contained in this article shall be construed to interfere with any additional requirements that may be imposed by the UDEQ or the Division of Water Quality of the State of Utah.
ARTICLE V Building Sewers and Connections
Sec. 1 Any new connection(s) to the sanitary sewer system shall be prohibited unless sufficient capacity is available in all downstream facilities including, but not limited to capacity for flow, BOD5, and suspended solids, as determined by the Superintendent.
Sec. 2 No unauthorized person(s) shall uncover, make any connections with or opening into, use, alter, or disturb any public sewer or appurtenance thereof without first obtaining a written permit from the City.
Sec. 3 Applications for permits shall be made agent and the party employed to do the location, name of owner, street number connected, and how occupied. No person building drain beyond the limits of the which the service connection permit has by the owner or authorized work, and shall state the of the building to be shall extend any private building or property for been given.
Sec. 4 There shall be two (2) classes of building sewer permits: (a) for residential and commercial service, and (b) for service to establishments producing industrial wastes. In either case, the application shall be supplemented by any plans, specifications, or any other information considered pertinent in the judgment of the City. The industry, as a condition of permit authorization, must provide information describing its wastewater constituents, characteristics, and type of activity.
Sec. 5 All costs and expenses incidental to the installation and connection of the building sewer shall be borne by the owner(s). The owner(s) shall indemnify the City from any loss or damage that may be directly or indirectly occasioned by the installation building of the sewer.
Sec. 6 A separate and independent building sewer shall be provided for every building, except where one building stands at the rear of another on an interior lot and no private sewer is available or can be constructed to the rear building through an adjoining alley, court, yard, or driveway. The building sewer from the front building may be extended to the rear building and the whole considered one building sewer. The City does not and will not assume any obligation or responsibility for damage caused by or resulting from any such connection aforementioned.
Sec. 7 Old building sewers may be used in connection with new buildings only when they are found, on examination and test by the superintendent or his representative, to meet all requirements ofthis ordinance.
Sec. 8 The size, slopes, alignment, materials of construction of a building sewer, and the methods to be used in excavating, placing of the pipe, jointing, testing, and backfilling of the trench, shall all conform to the requirements of the State of Utah Building and Plumbing Code or other applicable rules and regulations of the City. In the absence of code provisions or in the amplification thereof, the materials and procedures set forth in appropriate specifications of the ASTM and WPCF Manual of Practice No. 9, shall apply.
Sec. 9 Whenever possible, the building sewer shall be brought to the building at an elevation below the basement floor. In all buildings in which any building drain is too low to permit gravity flow to the public sewer, sanitary sewage carried by such building drain shall be lifted by an approved means and discharged to the building sewer.
Sec. 10 No person(s) shall make connection of roof downspouts, foundation drains, areaway drains, or other sources of surface runoff or groundwater to a building sewer or indirectly to the wastewater disposal system.
Sec. 11 The connection of the building sewer into the public sewer shall conform to the requirements of the State of Utah Building and Plumbing Code or other applicable rules and regulations of the City, or the procedures set forth in appropriate specifications of the ASTM and the WPCF Manual of Practice No. 9. All such connections shall be made gastight and watertight, and verified by proper testing to prevent the inclusion of infiltration/inflow. Any deviation from the prescribed procedures and materials must be approved by the City prior to installation.
Sec. 12 The applicant for the building sewer permit shall notify the City when the building sewer is ready for inspection and connection to the public sewer. The connection and inspection shall be made under the supervision of the superintendent or authorized representative thereof.
Sec. 13 All excavations for building sewer installation shall be adequately guarded with barricades and lights so as to protect the public from hazard. Streets, sidewalks, parkways, and other public property disturbed in the course of the work, shall be restored in a manner satisfactory to the City.
Sec. 14 No person shall make a service connection with any public sewer unless regularly licensed under this chapter to perform such work, and no permit shall be granted to any person except such regularly licensed person.
Sec. 15 Any person desiring a license to make a service connection with public sewers, shall apply
in writing to the City Council with satisfactory evidence that the applicant or employer is trained or skilled in the business and qualified to receive a license. All applications shall be referred to the Superintendent for recommendations to the Council. If approved by the Council, such license shall be issued by the City Clerk upon the filing of a bond as hereinafter provided.
Sec. 16 No license shall be issued to any person until a $_____ bond to the City, approved by the Council, is filed with the City Clerk conditioned that the licensee will indemnify and save harmless the City from all suits, accidents, and damage that may arise by reason of any opening in any street, alley, or public ground, made by the licensee or by those in the licensee’s employment for any purpose whatever, and that the licensee will replace and restore the street and alley over such opening to the condition existing prior to installation, adequately guard with barricades and lights and will keep and maintain the same to the satisfaction of the Superintendent, and shall conform in all respects to the rules andregulations of the Council relative thereto, and pay all fines that may be imposed on the licensee by law.
Sec. 17 The license fee for making service connections is $_________. All licenses shall expire on ____________________ of the license year unless the license is suspended or revoked by the Council for cause. Upon failure to apply for a license renewal prior to the expiration date thereof, the license fee for the ensuing year shall be $____________.
Sec. 18 The Council may suspend or revoke any license issued under this article for any of the following causes:
a. Giving false information in connection with the application for a license.
b. Incompetence of the licensee.
c. Willful violation of any provisions of this article or any rule or regulation pertaining to the making of service connections.
ARTICLE VI Use of Public Services
Sec. 1 No person(s) shall discharge or cause to be discharged any unpolluted water such as stormwater, ground water, roof runoff, surface drainage, or non-contact cooling water to any sanitary sewer.
Sec. 2 Stormwater and all other unpolluted drainage shall be discharged to such sewers as are specifically designed as storm sewers or to a natural outlet approved by the City and other regulatory agencies.Industrial cooling water or unpolluted process waters may be discharged to a storm sewer or natural outlet on approval of the City and upon approval and the issuance of a discharge permit by the UDEQ.
Sec. 3 No person(s) shall discharge or cause to be discharged any of the following described waters or wastes to any public sewers:
a. Any liquids, solids, or gases which by reason of their nature or quantity are, or may be, sufficient either alone or by interaction with other substances to cause fire or explosion or be injurious in any other way to the wastewater disposal system or to the operation of the system. Prohibited materials include, but are not limited to, gasoline, kerosene, naptha, benzene, toluene, xylene, ethers, alcohols, ketones,
aldehydes, peroxides, chlorates, perchlorates, bromates, carbides, hydrides, and sulfide.
b. Solid or viscous substances which will cause obstruction to the flow in a sewer or other interference with the operation of the wastewater treatment facilities such as, but not limited to, grease, garbage with particles greater than one-half (1/2) inch in any dimension, animal guts or tissues, paunch manure, bones, hair, hides or fleshings, entrails, whole blood, feathers, ashes, cinders, sand, spent lime, stone or marble dust, metal, glass, straw, shavings, grass clippings, rags, spent grains, spent hops, waste paper, wood, plastic, asphalt residues, residues from refining or processing of fuel or lubricating oil, mud or glass grinding or polishing wastes.
c. Any wastewater having a pH of less than 5.0 or greater than 9.5 or having any other corrosive property capable of causing damage or hazard to structures, equipment, and personnel of the wastewater disposal system.
d. Any wastewater containing toxic pollutants in sufficient quantity, either singly or by interaction with other pollutants, to inhibit or disrupt any wastewater treatment process, constitute a hazard to humans or animals, or create a toxic effect in the receiving waters of the wastewater disposal system. A toxic pollutant shall include but not be limited to any pollutant identified pursuant to Section 307(a) of the Act.
Sec. 4 The following described substances, materials, water, or wastes shall be limited in discharges to municipal systems to concentrations or quantities which will not harm either sewers, the wastewater treatment works treatment process or equipment, will not have an adverse effect on the receiving stream and/or soil, vegetation and ground water, or will not otherwise endanger lives, limb, public property, or constitute a nuisance. The Superintendent may set limitations lower than limitations established in the regulations below if, in his opinion, such more severe limitations are necessary to meet the above objections. In forming his opinion as to the acceptability of wastes, the Superintendent will give consideration to such factors as the quantity of subject waste in reaction to flows and velocities in the sewers, materials of construction of the sewers, nature of the sewage treatment process, the City’s NPDES permit, capacity of the sewage treatment plant, degree of treatability of wastes in the sewage treatment plant, and other pertinent factors. The limitations or restrictions on materials or characteristics of waste or wastewaters discharged to the sanitary sewer which shall not be violated without approval of the Superintendent are as follows:
a. Any wastewater having a temperature greater than 150 degrees F (65.6 degrees C), or causing, individually or in combination with other wastewater, the influent at the wastewater treatment plant to have a temperature exceeding 104 degrees F (40 degrees C), or having heat in amounts which will inhibit biological activity in the wastewater treatment works resulting in interference therein.
b. Any wastewater containing fats, wax, grease, or oils, whether emulsified or not, in excess of 100 mg/l or containing substances which may solidify or become viscous at temperatures between 32 degrees F and 150 degrees F (0 degrees C and 65.6 degrees C); and any wastewater containing oil and grease concentrations of mineral origin of greater than 100 mg/l, whether emulsified or not.
c. Any quantities or flow, concentrations, or both which constitute a “slug” as defined herein. (See Article I, Section 33.)
d. Any garbage not properly shredded, as defined in Article I. Section 28. Garbage grinders may be connected to sanitary sewers from homes, hotels, institutions, restaurants, hospitals, catering establishments, or similar places where garbage originates from the preparation of food on the premises

or when served by caterers.
e. Any noxious or malodorous liquids, gases, or solids which either singly or by interaction with other wastes are capable of creating a public nuisance or hazard to life, or are sufficient to prevent entry into the sewers for their maintenance and repair.
f. Any wastewater with objectionable color not removed in the treatment process, such as, but not limited to dye wastes and vegetable tanning solutions.
g. Non-contact cooling water or unpolluted storm. drainage, or ground water.
h. Wastewater containing inert suspended solids (such as, but not limited to, Fullers earth, lime slurries, and lime residues) or of dissolved solids (such as, but not limited to, sodium chloride and sodium sulfate) in such quantities that would cause disruption with the wastewater disposal system.
i. Any radioactive wastes or isotopes of such half-life or concentration as may exceed limits established by the superintendent in compliance with applicable state or federal regulations.
j. Any waters or wastes containing the following substances to such degree that any such material received in the composite wastewater at the wastewater treatment works in excess of the following limits for such materials:
Waste or Chemical Daily Maximum Concentration (mg/l)
30-Day Average Concentration (mg/l)
Arsenic Cadmium 1.2 0.5 Copper 4.5 1.8 Cyanide 0.8 0.23 Lead 0.6 0.3 Mercury Nickel 4.1 1.8 Silver Total Chromium 7.0 2.5 Zinc 4.2 1.8 Total Heavy Metals (Copper, Chromium, Nickel, Zinc) 10.5 5.0
Phenolic compounds which cannot be removed by City’s wastewater treatment system.
k. Any wastewater which creates conditions at or near the wastewater disposal system which violates any statute, rule, regulation, or ordinance of any regulatory agency, or state or federal regulatory body.
l. Any waters or wastes containing BOD5 or suspended solids of such character and quantity that unusual attention or expense is required to handle such materials at the wastewater treatment works, except as may be permitted by specific written agreement subject to the provisions of Section 16 of this Article.

Sec. 5 If any waters or wastes are discharged or are proposed to be discharged to the public sewers which contain substances or possess the characteristics enumerated in Section 4 of this Article, and/or which in the judgment of the Superintendent, may have a deleterious effect upon the wastewater treatment facilities, processes, or equipment; receiving water and/or soil, vegetation, and ground water; or which otherwise create a hazard to life or constitute a public nuisance, the City may:
a. Reject the wastes,
b. Require pretreatment to an acceptable condition for discharge to the public sewers, pursuant to Section 307(b) of the Act and all addendums thereof,
c. Require control over the quantities and rates of discharge, and/or,
d. Require payment to cover the added costs of handling, treating, and disposing of wastes not covered by existing taxes or sewer service charges.
If the City permits the pretreatment or equalization of waste flows, the design, installation, and maintenance of the facilities and equipment shall be made at the owner’s expense, and shall be subject to the review and approval of the City pursuant to the requirements of the UDEQ.
Sec. 6 No user shall increase the use of process water or, in any manner, attempt to dilute a discharge as a partial or complete substitute for adequate treatment to achieve compliance with the limitations contained in Sections 3 and 4 of this Article, or contained in the National Categorical Pretreatment Standards or any state requirements.
Sec. 7 Where pretreatment or flow-equalizing facilities are provided or required for any waters or wastes, they shall be maintained continuously in satisfactory and effective operation at the expense of the owner(s).
Sec. 8 Grease, oil, and sand interceptors shall be provided when, in the opinion of the Superintendent, they are necessary for the proper handling of liquid wastes containing floatable grease in excessive amounts, as specified in Section 4(b), any flammable wastes as specified in Section 3(a), sand or other harmful ingredients; except that such interceptors shall not be required for private living quarters or dwelling units. All interceptors shall be of the type to be readily and easily accessible for cleaning and inspection. In the maintaining of these interceptors, the owner(s) shall be responsible for the proper removal and disposal of the captured materials by appropriate means, and shall maintain a record of dates and means of disposal which are subject to review by the Superintendent. Any removal and hauling of the collected materials not performed by the owner’s personnel, must be performed by a currently licensed waste disposal firm.
Sec. 9 Where required by the City, the owner of any property serviced by a building sewer carrying industrial wastes shall install a suitable structure, or control manhole, with such necessary meters and other appurtenances in the building sewer to facilitate observation, sampling, and measurement of wastes. Such structure shall be accessible and safely located, and shall be constructed in accordance with plans approved by the City. The structure shall be installed by the owner at his expense and shall be maintained by the owner to be safe and accessible at all times.
Sec. 10 The owner of any property serviced by a building sewer carrying industrial wastes may, at the discretion of the City, be required to provide laboratory measurements, tests, or analyses of waters orwastes to illustrate compliance with this Ordinance and any special conditions for discharge established

by the City or regulatory agencies having jurisdiction over the discharge. The number, type, and frequency of sampling and laboratory analyses to be performed by the owner shall be as stipulated by the City. The industry must supply a complete analysis of the constituents of the wastewater discharge to assure that compliance with Federal, State and local standards are being met. The owner shall report the results of measurements and laboratory analyses to the City at such times and in such manner as prescribed by the City. The owner shall bear the expense of all measurements, analyses, and reporting required by the City. At such times as deemed necessary, the City reserves the right to take measurements and samples for analysis by an independent laboratory.
Sec. 11 All measurements, tests, and analyses of the characteristics of waters and wastes to which reference is made in this ordinance shall be determined in accordance with the latest edition of StandardMethods for the Examination of Water and Wastewater, published by the American Public Health Association. Sampling methods, location, times, duration and frequencies are to be determined on an individual basis subject to approval by the Superintendent.
Sec. 12 Where required by the City, the owner of any property serviced by a sanitary sewer shall provide protection from an accidental discharge of prohibited materials or other substances regulated by this ordinance. Where necessary, facilities to prevent accidental discharges of prohibited materials shall be provided and maintained at the owner’s expense. Detailed plans showing facilities and operating procedures to provide this protection shall be submitted to the Superintendent for review and approval prior to construction of the facility. Review and approval of such plans and operating procedures shall not relieve any user from the responsibility to modify the user’s facility as necessary to meet the requirements of this ordinance. Users shall notify the Superintendent immediately upon having a slug or accidental discharge of substances of wastewater in violation of this ordinance to enable countermeasures to be taken by the Superintendent to minimize damage to the wastewater treatment works. Such notification will not relieve any user of any liability for any expense, loss or damage to the wastewater treatment system or treatment process, or for any fines imposed on the City on account thereof under any State and Federal law. Employees shall insure that all employees who may cause or discover such a discharge, are advised of the emergency notification procedure.
Sec. 13 No person, having charge of any building or other premises which drains into the public sewer, shall permit any substance or matter which may form a deposit or obstruction to flow or pass into the public sewer. Within 90 days after receipt of written notice from the City, the owner shall install a suitable and sufficient catch basin or waste trap, or if one already exists, shall clean out, repair or alter the same, and perform such other work as the Superintendent may deem necessary. Upon the owner’s refusal or neglect to install a catch basin or waste trap or to clean out, repair, or alter the same after the period of 120 days, the Superintendent may cause such work to be completed at the expense of the owner or representative thereof.
Sec. 14 Whenever any service connection becomes clogged, obstructed, broken or out of order, or detrimental to the use of the public sewer, or unfit for the purpose of drainage, the owner shall repair or cause such work to be done as the Superintendent may direct. Each day after seven (7) days that a person neglects or fails to so act shall constitute a separate violation of this section, and the Superintendent may then cause the work to be done, and recover from such owner or agent the expense thereof by an action in the name of the City.
Sec. 15 The owner or operator of any motor vehicle washing or servicing facility shall provide and maintain in serviceable condition at all times, a catch basin or waste trap in the building drain system to prevent grease, oil, dirt or any mineral deposit from entering the public sewer system.
Sec. 16 In addition to any penalties that may be imposed for violation of any provision of this chapter, the City may assess against any person the cost of repairing or restoring sewers or associated

facilities damaged as a result of the discharge of prohibited wastes by such person, and may collect such assessment as an additional charge for the use of the public sewer system or in any other manner deemed appropriate by the City.
Sec. 17 No statement contained in this Article shall be construed as preventing any special agreement or arrangement between the City and any industrial concern whereby an industrial waste of unusual strength or character may be accepted by the City for treatment, subject to payment therefore by the industrial concern, providing that National Categorical Pretreatment Standards and the City’s NPDES and/or State Disposal System Permit limitations are not violated.
ARTICLE VII
Sec. 1 No person(s) shall maliciously, willfully, or negligently break, damage, destroy, uncover, deface or tamper with any structure, appurtenance, or equipment which is part of the wastewater facilities. Any person violating this provision shall be subject to immediate arrest under the charge of a misdemeanor.
ARTICLE VIII User Rate Schedule for Charges
Sec. 1 Each user of sewer service shall pay the charge(s) applicable to the type of service, and in accordance with the provisions set forth in Ordinance No. ______.
ARTICLE IX Powers and Authority of Inspectors
Sec. 1 The superintendent or other duly authorized employees of the City, bearing proper credentials and identification, shall be permitted to enter all properties for the purpose of inspection, observations, measurement, sampling, and testing pertinent to the discharges to the City’s sewer system in accordance with the provisions of this ordinance.
Sec. 2 The superintendent or other duly authorized employees are authorized to obtain information concerning industrial processes which have a direct bearing on the type and source of discharge to the wastewater collection system. An industry may withhold information considered confidential however, the industry must establish that the revelation to the public of the information in question, might result in an advantage to competitors.
Sec. 3 While performing necessary work on private properties, the superintendent or duly authorized employees of the City shall observe all safety rules applicable to the premises established by the company, and the company shall be held harmless for injury or death to the City employees and the City shall indemnify the company against loss or damage to its property by City employees and against liability claims and demands for personal injury or property damage asserted against the company and growing out of the gauging and sampling operation, except as such may be caused by negligence or failure of the company to maintain safe conditions as required in Article VI, Section 9 of this ordinance.
Sec. 4 The superintendent or other duly authorized employees of the City bearing proper credentials and identification shall be permitted to enter all private properties through which the City holds a duly negotiated easement for the purposes of, but not limited to, inspection, observation, measurement, sampling, repair, and maintenance of any portion of the wastewater facilities lying within said easement. All entry and subsequent work, if any, on said easement, shall be done in full accordance with the terms of the duly negotiated easement pertaining to the private property involved.

ARTICLE X Penalties
Sec. 1 Any person found to be violating any provision of this ordinance, shall be served by the City with written notice stating the nature of the violation and providing a reasonable time limit for the satisfactory correction thereof. The offender shall, within the period of time stated in such notice, permanently cease all violations.
Sec. 2 Any person who shall continue any violation beyond the time limit provided for in Section 1 of this Article, shall be guilty of a misdemeanor, and on conviction thereof, shall be fined in the amount not exceeding $50 for each violation. Each day in which any such violation occurs shall be deemed as a separate offense.
Sec. 3 Any person violating any of the provisions of this ordinance shall become liable to the City for any expense, loss, or damage occasioned by the City by reason of such violation.
ARTICLE XI Validity
Sec.1 This ordinance shall be in full force and take effect from and after its passage and approval and publication as provided by law.
Sec. 2 All other ordinances and parts of other ordinances inconsistent or in conflict with any part of this ordinance, are hereby repealed to the extent of such inconsistency or conflict.

Nephi City Wastewater System Master Plan C-1
Appendix C
Class 1 Cultural Resource Survey

Bighorn Archaeologicalconsultants, LLC
1791 North 280 WestOrem, Utah 84057
(801) 368-8091
Report Number 11-11
A Class I Inventory for the Proposed Wastewater System in Nephi,
Juab County, Utah
by
Jon Baxter
for
Jones and DeMille Engineering 1535 South 100 West Richfield, UT 84701
March 2011

ii
Abstract At the request of Jones and DeMille Engineering., Bighorn Archaeological Consultants, LLC, completed a Class I inventory of the proposed wastewater system for the town of Nephi, Juab County, Utah. The project area is located on private lands. The file search revealed one previously inventoried project and no cultural resource sites within one mile of the project area.

iii
Table of Contents Abstract ........................................................................................................................................... ii Table of Contents ........................................................................................................................... iii List of Figures ................................................................................................................................ iii Introduction ......................................................................................................................................1 Project Location ...............................................................................................................................1 Environmental Setting .....................................................................................................................1 Previous Research ............................................................................................................................1 Summary and Project Recommendations ........................................................................................2 List of Tables Table 1. Previous Inventories Located within a Mile of the APE ...................................................2 Appendix A Project Location Map

Introduction Jones and DeMille Engineering, (Jones and DeMille) and the city of Nephi are planning to upgrade the waste water lagoons. As Nephi City continues to grow, the current total containment lagoons will no longer be sufficient. As such, Jones and DeMille and Nephi City are planning improve the lagoon capacity in order to better serve the users of the system. At the request of Jones and DeMille, Bighorn Archaeological Consultants, LLC (Bighorn), completed a Class I inventory of proposed waste water lagoon upgrade. Jon Baxter of Bighorn completed the file search of the proposed area on March 16, 2011. Project Location The project area is located in Nephi, Utah just east of the city center. (Appendix A). The proposed waste water lagoon upgrade is located in T12 S, R1 W (USGS 7.5 Quad Map: Sugarloaf, Utah). The project area is located on private lands in Section 25 just west of the Nephi Airport (Appendix A). Environmental Setting Geology: The project area is on the southern edge of the Wasatch Front Valleys Subsection of the Basin and Range Province. The surface is an exposure of Recent Era alluvium and colluvium derived principally from Cretaceous Price River and Jurassic Entrada Sandstone. These formations are exposed in the foothills located to the east of the project area. The surface material is an eroded sandy clay, mixed with stream-worn cobbles. The area has been leveled and subjected to regular plowing that has resulted in a soil surface which appears to lack soil horizon development. Flora: The project area is within the Upper Sonoran Life Zone and is in a former Sagebrush Plant Community. Modern agriculture has replaced the native flora with a variety of rotation crops and introduced species such as Russian thistle, crested wheat and alfalfa. Sagebrush, annual forbs, grasses, willow, wild rose and Siberian elm are found throughout the area. Fauna: The proposed lagoon upgrade is on the eastern edge of the Great Basin Faunal Area (Durrant 1952). The Great Basin Faunal Area contains a variety of sub-species found in no other location, but shares major species with surrounding areas. Modern agriculture has impacted the native species by significantly reducing their numbers or eliminating them altogether. Fauna known throughout the area include magpies, common crows, sparrows, introduced English starlings, a single cottontail rabbit, and grey squirrel. The area is also winter range for mule deer. Previous Research Bighorn conducted a Class I file search for reported projects and previously recorded cultural sites at the Division of State History in Salt Lake City, Utah on 16 March 2011. This search revealed one cultural resource inventory and no archaeological sites within one mile of the Area of Potential Effects (APE) (Table 1).

2
Table 1. Previous Inventories Located within a Mile of the APE. Project Name Project Number Reference UDOT Lunt Park Rest Area Pipeline & Sewer U91AS0379 Nielson 1986 General Land Office (GLO) maps and aerial photographs of the area were also reviewed for historic features, such as roads and trails. No GLO maps depicted features within the project area. Summary and Project Recommendations Bighorn Archaeological Consultants, LLC completed a Class I inventory for a proposed waste water lagoon upgrade for the city of Nephi, Juab County, Utah. The proposed project area is located on private lands. The file search revealed no cultural resource sites and one previously inventoried project within one mile of the project area.

Bighorn
Archaeological
Consultants, LLC ¤Juab CountyT12S, R1W
Nephi Wastewater Lagoon Location Map
USGS 7.5' Series Quads: Sugarloaf, Utah, Nephi, Utah
0 1 mi
0 1 km
1:24,000Legend
Proposed ProjectPrivate