
Nepal Doorsanchar Company Limited Annual Report · Nepal Telecom Annual Report 2017-2018 Nepal...
104
Annual Report 2017-2018 Nepal Doorsanchar Company Limited Nepal Telecom
Transcript of Nepal Doorsanchar Company Limited Annual Report · Nepal Telecom Annual Report 2017-2018 Nepal...
Nepal Doorsanchar Company LimitedCentral Office, Bhadrakaliplaza, Kathmandu
twitter.com/ndcl_nt
facebook.com/NepalTelecom.NT
www.ntc.net.np
Nepal Telecom
Annual Report2017-2018
Nepal Doorsanchar Company Limited
Nepal Telecom
MILESTONES
Year Nepal Telecom Milestones
1913 Establishment of first telephone lines in Kathmandu
1914 Establishment of Open wire Trunk Link from Kathmandu to Raxaul (India)
1935 Installation of 25 lines automatic exchange in Royal Palace
1936 Installation of Open Wire Trunk line from Kathmandu to Dhankuta
1950 Establishment of Telegram Service
1950 Introduction to High frequency Radio System (AM)
1950 Establishment of CB telephone exchange (100 lines) in Kathmandu
1951 Installation of Open Wire Trunk line from Kathmandu to Palpa
1955 Distribution of telephone line to general public
1962 First Public Telephone Exchange in Kathmandu (300 lines CB)
1964 Beginning of International Telecommunications Service using HF Radio to India and Pakistan
1965 First Automatic exchange in Nepal (1000 lines in Kathmandu)
1971 Introduction of Telex Services
1974 Microwave transmission links establishment for internal trunk
1982 Establishment of Standard "B" Type Earth Station for international circuits
1982 Establishment of SPC telex exchange
1983 Establishment of digital Telephone Exchange
1984 Commencement of STD service
1984 Reliable Rural Telecom Service (JICA) started
1987 Commencement of STD service
1995 Installation of Optical Fiber Network
1996 Conversion of all Transmission link to Digital transmission link
1996 Automation of the entire Telephone Network
1996 Independent International Gateway Exchange established
1996 Introduction of VSAT services
1997 Digital Link with D.O.T. India through Optical Fiber in Birgunj - Raxual
1998 Direct Link with Bangladesh established
1999 Launching of GSM Mobile Postpaid service
2000 Implementation of SDH Microwave Radio
2000 Launching of Internet Service
2001 Launching of Payphone Service
2001 International Roaming Service started in GSM Mobile
2002 East West Highway Optical Fiber Project started
2003 GSM NAMASTE Prepaid Service launched
2004 Establishment of NEPAL TELECOM (Transformation from Corporation to Nepal Doorsanchar Company Limited)
2004 FIN EasyCall Pre-paid Calling Card Service (PCC Services) launched
Year Nepal Telecom Milestones
2004 SLC Results published by 1600 IVR Service
2005 FIN Advanced FreePhone Service (AFS) launched
2005 Soft launch of CDMA
2005 Access Network Services introduced
2005 Outsourcing of PSTN Telephone Inquiry Service (197)
2006 FIN PSTN Credit Limit PCL Service launched
2006 FIN NepalDirect Home Country Direct (HCD Service) launched
2006 Introduction of IVR 198 Service for PSTN Fault Complaint in Kathmandu Valley
2006 CDMA Limited Services in Kathmandu Valley
2006 10+2 Results published via IVR 1601 Service
2006 PSTN Voice Mail Service (VMS) launched
2007 National Roaming for CDMA Mobile (SkyPhone) started
2007 Expansion of Internet Bandwidth via Optical link between Nepal & India
2007 PSTN Bill Inquiry Service started via 1606 IVR Service
2007 VOIP Call Complaint Registration started via 188 IVR Service
2007 GPRS, 3G and CRBT Services introduced in GSM Mobile
2008 Broadband ADSL Service launched
2008 IVR Service 1607 started for GSM and CDMA PUK Inquiry
2008 IVR 198 service extended for ADSL Fault Complaint Registration
2008 PSTN VMS – Notice Board Service
2009 IVR 198 Service extended outside KTM valley
2009 IVR 1606 Service extended outside Kathmandu Valley
2009 SMS Service from GSM to CDMA mobile started
2009 Postpaid CDMA Mobile Service started
2010 EasyPhone (SoftPhone) SIP PCC Service launched
2010 All 3915 VDCs served by Nepal Telecom’s services
2010 Volume Based ADSL Service Launched
2011 EasyPhone (SoftPhone) SIP PPP Service launched
2011 GSM 3G Data Card Service introduced
2011 First International Carrier Partner’s Meet organized by NT
2012 WiMAX 4G Service launched
2012 IP-CDMA System commissioned
2012 Convergent Real Time Billing and Customer Support System Launched
2013 IP-Based Wireline Network (NGN) Service launched
2014 Wi-Fi Hotspot, NT Official Mobile App
2015 FTTH service launched
2015 Social Site “Meet” launched
2016 NTpro service launched
2017 4G/LTE sevice launched
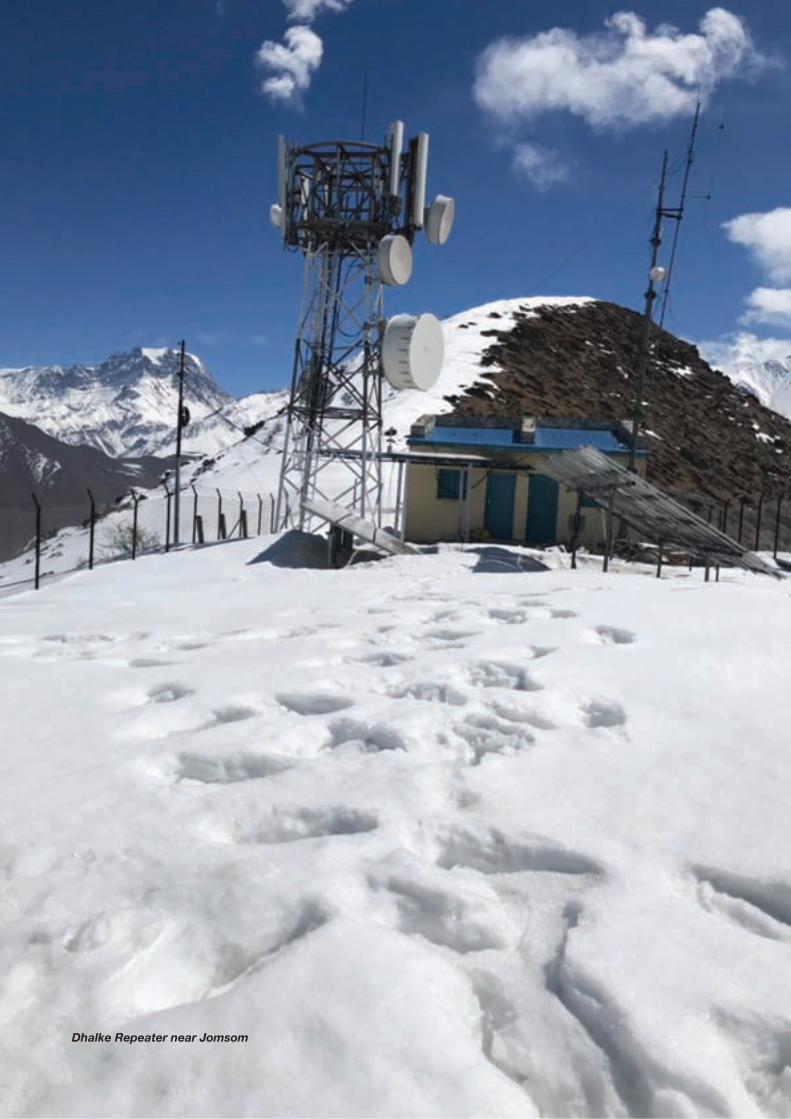
2018 Operation of Optical Fiber link between Kerung border of Nepal and China Dhalke Repeater near Jomsom

1Annual Report 2017/18
TABLE OF CONTENTS
About the Company 2-3Performance Highlights 4Key Performance Indicators 5Vision, Mission and Goal 6-7Organizational Structure 8Board of Directors 10-11Message from the Chairman 12-13Report of the Board of Directors 18-29Business Perspective 30-38Our Services 40-45Corporate Social Responsibility 46-48Financial Statements 50-95Key Indicators of the Last Five Years 96Customer Base of the Company 97Definition of Terms 99-100
Nepal Doorsanchar Company Limited
Annual Report 2017/2018
2 Annual Report 2017/18
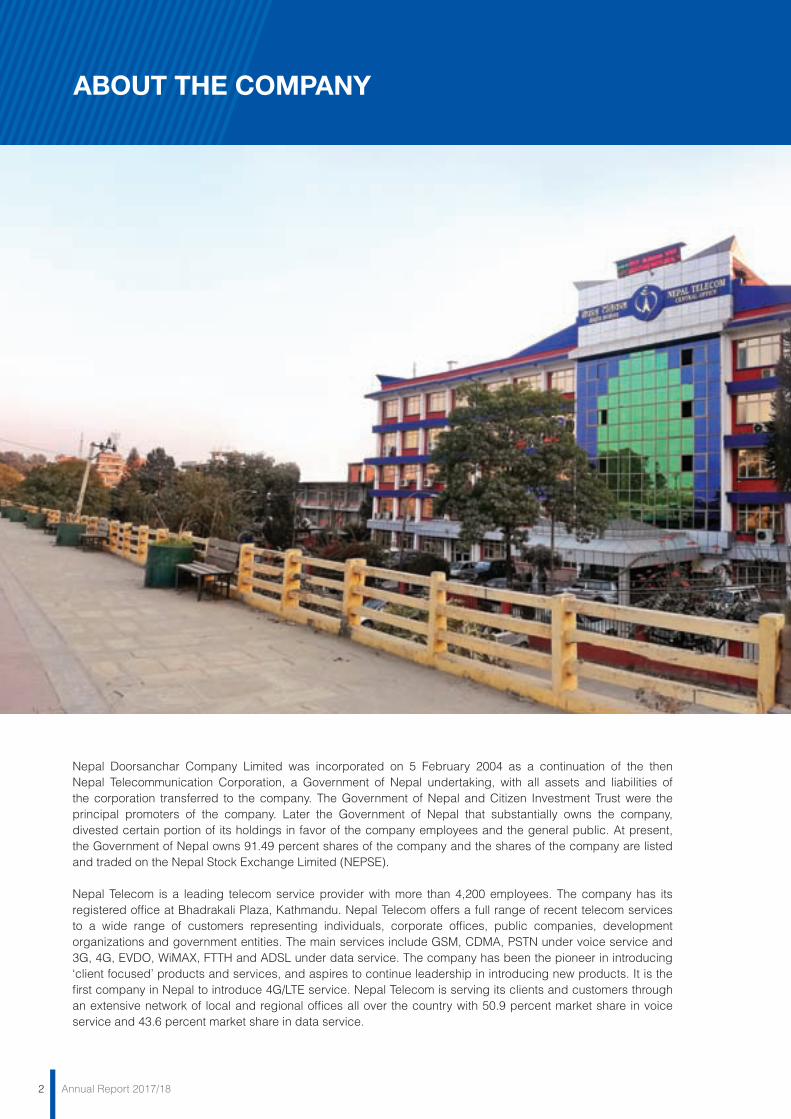
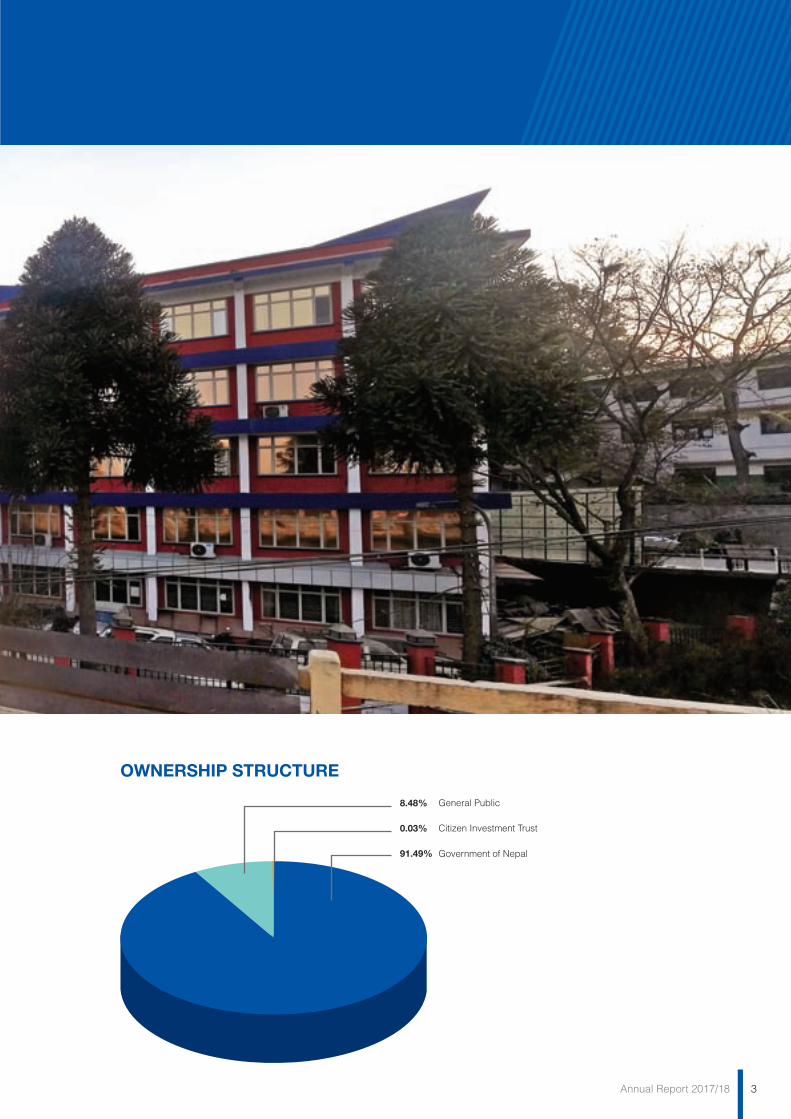
Nepal Doorsanchar Company Limited was incorporated on 5 February 2004 as a continuation of the then Nepal Telecommunication Corporation, a Government of Nepal undertaking, with all assets and liabilities of the corporation transferred to the company. The Government of Nepal and Citizen Investment Trust were the principal promoters of the company. Later the Government of Nepal that substantially owns the company, divested certain portion of its holdings in favor of the company employees and the general public. At present, the Government of Nepal owns 91.49 percent shares of the company and the shares of the company are listed and traded on the Nepal Stock Exchange Limited (NEPSE).
Nepal Telecom is a leading telecom service provider with more than 4,200 employees. The company has its registered office at Bhadrakali Plaza, Kathmandu. Nepal Telecom offers a full range of recent telecom services to a wide range of customers representing individuals, corporate offices, public companies, development organizations and government entities. The main services include GSM, CDMA, PSTN under voice service and 3G, 4G, EVDO, WiMAX, FTTH and ADSL under data service. The company has been the pioneer in introducing ‘client focused’ products and services, and aspires to continue leadership in introducing new products. It is the first company in Nepal to introduce 4G/LTE service. Nepal Telecom is serving its clients and customers through an extensive network of local and regional offices all over the country with 50.9 percent market share in voice service and 43.6 percent market share in data service.
ABOUT THE COMPANY
3Annual Report 2017/18
8.48%
0.03%
91.49% Government of Nepal
Citizen Investment Trust
General Public
OWNERSHIP STRUCTURE
4 Annual Report 2017/18
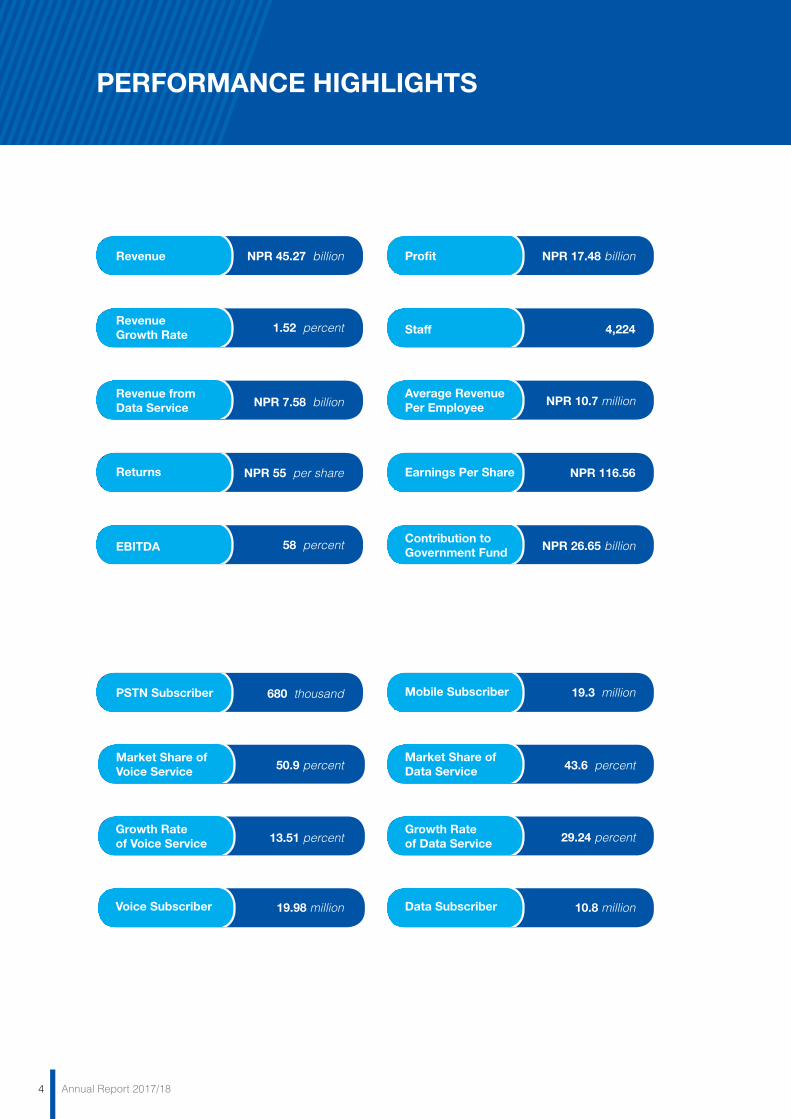
Revenue NPR 45.27 billion
RevenueGrowth Rate 1.52 percent
Mobile Subscriber 19.3 millionPSTN Subscriber 680 thousand
Earnings Per Share NPR 116.56
Profit NPR 17.48 billion
Returns NPR 55 per share
Staff 4,224
Contribution toGovernment Fund NPR 26.65 billion
Revenue fromData Service NPR 7.58 billion
Voice Subscriber 19.98 million Data Subscriber 10.8 million
Average Revenue Per Employee NPR 10.7 million
Market Share of Voice Service 50.9 percent
Growth Rate of Voice Service 13.51 percent
Market Share of Data Service 43.6 percent
Growth Rateof Data Service 29.24 percent
58 percentEBITDA
PERFORMANCE HIGHLIGHTS
5Annual Report 2017/18
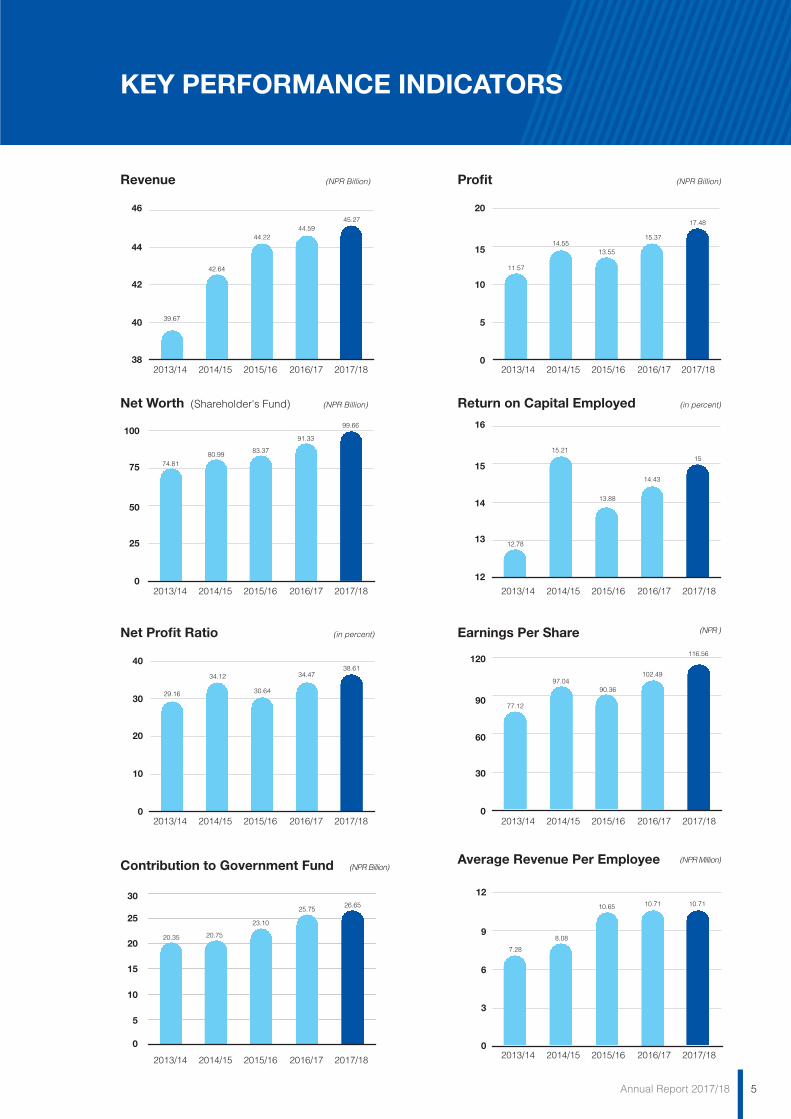
KEY PERFORMANCE INDICATORS
Profit (NPR Billion)Revenue
038
12
0
0
0
0
540
13
30
3
25
10
1042
14
60
6
50
20
1544
15
90
9
75
30
2046
16
120
12
100
40
2013/14 2014/15 2015/16 2016/17 2017/18 2013/14 2014/15 2015/16 2016/17 2017/18
2013/14 2014/15 2015/16 2016/17 2017/18 2013/14 2014/15 2015/16 2016/17 2017/18
2013/14 2014/15 2015/16 2016/17 2017/18 2013/14 2014/15 2015/16 2016/17 2017/18
2013/14 2014/15 2015/16 2016/17 2017/18
Net Worth (Shareholder's Fund) (NPR Billion) Return on Capital Employed
Net Profit Ratio Earnings Per Share(in percent)
(NPR Million)(NPR Billion)
(NPR )
0
5
15
10
25
20
30
2013/14 2014/15 2015/16 2016/17 2017/18
Contribution to Government Fund Average Revenue Per Employee
(in percent)
(NPR Billion)
39.67
11.57
74.81
29.16
77.12
20.35
7.28
8.08
10.65 10.71 10.71
20.75
23.10
25.7526.65
97.0490.36
102.49
116.56
34.12
30.64
34.4738.61
80.99 83.37
91.33
99.66
12.78
15.21
13.88
14.43
15
14.5513.55
15.37
17.48
44.2244.59
45.27
42.64

6 Annual Report 2017/18
VISION, MISSION AND GOAL

7Annual Report 2017/18
VISIONVision of Nepal Telecom is to remain a dominant player in telecommunication sector in the country while also extending reliable and cost effective services to all.
MISSIONNepal Telecom as a progressive, customer spirited and consumer responsive entity is committed to provide nation-wide reliable telecommunication service to serve as an impetus to the social, political and economic development of the country.
GOALGoal of Nepal Telecom is to provide cost effective telecommunication services to every nook and corner of the country.
8 Annual Report 2017/18
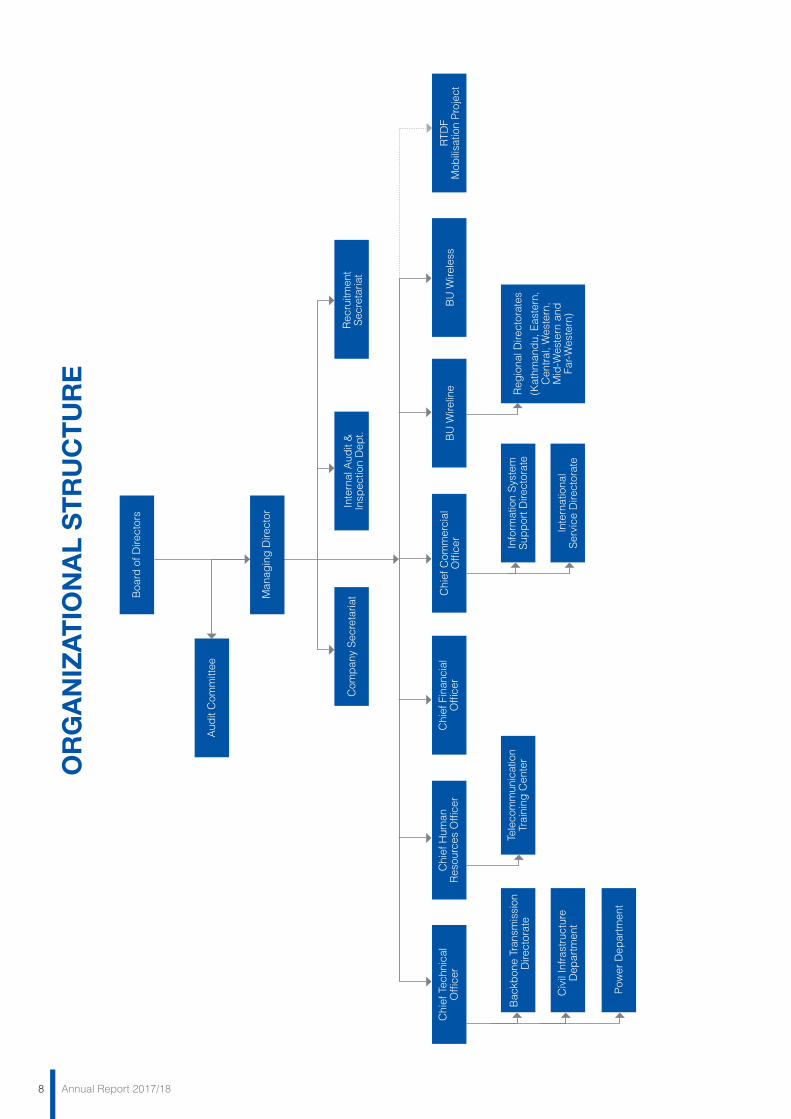
OR
GA
NIZ
AT
ION
AL
ST
RU
CT
UR
E
Aud
it C
omm
ittee
Boa
rd o
f Dire
ctor
s
Man
agin
g D
irect
or
Com
pan
y S
ecre
taria
tR
ecru
itmen
tS
ecre
taria
tIn
tern
al A
udit
&In
spec
tion
Dep
t.
Pow
er D
epar
tmen
t
Bac
kbon
e Tr
ansm
issi
on
Dire
ctor
ate
Tele
com
mun
icat
ion
Trai
ning
Cen
ter
Info
rmat
ion
Sys
tem
Sup
por
t Dire
ctor
ate
Reg
iona
l Dire
ctor
ates
(Kat
hman
du,
Eas
tern
,C
entr
al, W
este
rn,
Mid
-Wes
tern
and
Far-
Wes
tern
)In
tern
atio
nal
Ser
vice
Dire
ctor
ate
Civ
il In
fras
truc
ture
Dep
artm
ent
Chi
ef T
echn
ical
Offi
cer
Chi
ef H
uman
Res
ourc
es O
ffice
rC
hief
Fin
anci
alO
ffice
rC
hief
Com
mer
cial
Offi
cer
BU
Wire
line
BU
Wire
less
RTD
FM
obili
satio
n P
roje
ct
9Annual Report 2017/18

Company SecretaryShailja RaiDeputy Managing DirectorNepal Telecom
MemberUttar Kumar KhatriJoint SecretaryMinistry of Finance
MemberDhanraj GnyawaliJoint SecretaryMinistry of Law, Justice and Parliamentary Affairs
MemberSurya Bhakta PokharelFor Managing DirectorNepal Telecom
From Left
BOARD OF DIRECTORS

ChairmanMahendra Man GurungSecretaryMinistry of Communication and Information Technology
MemberRadhika AryalJoint SecretaryMinistry of Communication and Information Technology
MemberVishnu Prasad KasajuRepresentativeGeneral Shareholder
MemberRaj Bahadur RawalEmployee Representative
12 Annual Report 2017/18
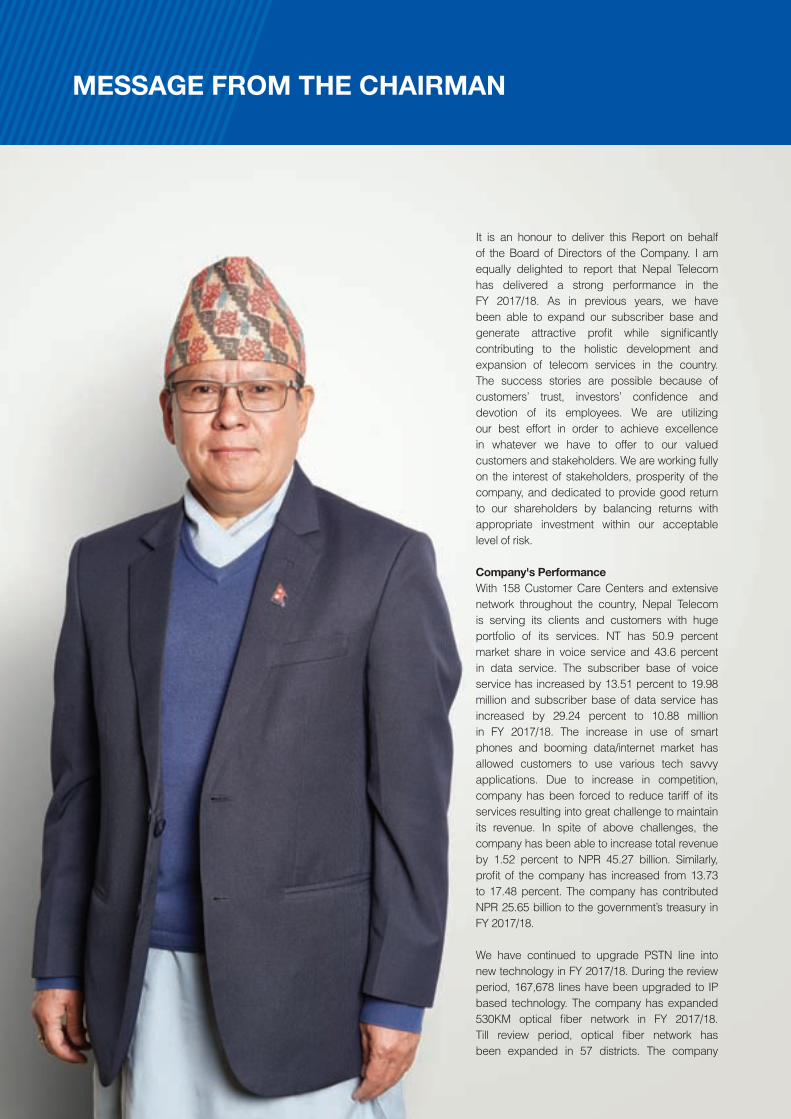
It is an honour to deliver this Report on behalf of the Board of Directors of the Company. I am equally delighted to report that Nepal Telecom has delivered a strong performance in the FY 2017/18. As in previous years, we have been able to expand our subscriber base and generate attractive profit while significantly contributing to the holistic development and expansion of telecom services in the country. The success stories are possible because of customers’ trust, investors’ confidence and devotion of its employees. We are utilizing our best effort in order to achieve excellence in whatever we have to offer to our valued customers and stakeholders. We are working fully on the interest of stakeholders, prosperity of the company, and dedicated to provide good return to our shareholders by balancing returns with appropriate investment within our acceptable level of risk.
Company's PerformanceWith 158 Customer Care Centers and extensive network throughout the country, Nepal Telecom is serving its clients and customers with huge portfolio of its services. NT has 50.9 percent market share in voice service and 43.6 percent in data service. The subscriber base of voice service has increased by 13.51 percent to 19.98 million and subscriber base of data service has increased by 29.24 percent to 10.88 million in FY 2017/18. The increase in use of smart phones and booming data/internet market has allowed customers to use various tech savvy applications. Due to increase in competition, company has been forced to reduce tariff of its services resulting into great challenge to maintain its revenue. In spite of above challenges, the company has been able to increase total revenue by 1.52 percent to NPR 45.27 billion. Similarly, profit of the company has increased from 13.73 to 17.48 percent. The company has contributed NPR 25.65 billion to the government’s treasury in FY 2017/18.
We have continued to upgrade PSTN line into new technology in FY 2017/18. During the review period, 167,678 lines have been upgraded to IP based technology. The company has expanded 530KM optical fiber network in FY 2017/18. Till review period, optical fiber network has been expanded in 57 districts. The company
MESSAGE FROM THE CHAIRMAN

has planned to expand optical fiber network in all 77 districts and optical fiber network in the remaining 20 districts will be expanded phase-wise in the coming year. Total 491 BTS have been brought into operation under 10 million GSM project all over the country in the FY 2017/18. Our obligation is to carry out our business in a way which not only provides returns for our shareholders, but also delivers good things for society, our clients, communities and our people. We have not limited our service expansion to profitable areas and are happily serving remote and otherwise inaccessible areas where profit margin is relatively thin. The expansion efforts are through the deployment of various technologies like VSAT, 3G, WiMAX, and Microwave Radio links.
Our Future Plans and StrategyThe company continues to work hard to identify and seize opportunities as they arise, becoming more competitive, embracing technological change and innovation. We are also building faster and more reliable telecom networks for which we are continuously upgrading our technologies. The use of voice service has been declining and use of data service has been increasing. It is evident that imagining life without Internet is next to impossible. Along with providing access to information, the internet also offers new opportunities for economic, academic and social activities. Considering this fact, we have been paying special attention to develop infrastructure for nationwide expansion and improvement in quality of data service. We have concentrated our efforts towards quantitative expansion and qualitative improvement so as to retain market leadership and achieve our business objectives by making our services reliable and affordable. We are expanding 4G/LTE network all over the country very soon and we have made target to upgrade 4G/LTE equipment to 5G in the years to come. The company has also made plans to expand FTTH service based on Next Generation Network Technology all over the country.
In order to address customer grievances effectively, new customer inquiry and customer care centre has been brought into operation. Currently, this service is through voice, SMS, email and web chat. In future, other social media like Facebook and Twitter will be available for lodging complaints and grievances.
ConclusionNEPAL TELECOM is working on to draft required changes in its Financial By-laws in-line with the provisions of the Public Procurement Act, 2063 and its First Amendment, 2073. Once the modified by-laws are effective, it is believed that company will be able to provide faster, better quality and more transparent services in the competitive market.
Globally, technology in general and telecom industry in particular is changing at an unprecedented rate. In order to cope with these changes, it is imperative that NEPAL TELECOM has to improve its decision making processes, work culture and organizational structure to retain its leadership position and to establish it as a change oriented, dynamic, professional institution. As per decision of the Government of Nepal (GoN), a consultant has been appointed to facilitate selection of Strategic Partner. The consultant has already submitted Due Diligence Audit (DDA) report. We hope that the Government will take necessary action at the appropriate time.
Implementation of Project Monitoring System is one of our top priorities to make reward and punishment systems effective. We have initiated to include relevant provisions in the procurement related contracts that are important to develop and improve services and to make suppliers, consultants and contractors more responsible towards quality, quantity and timeframe.
We would like to express our sincere gratitude to all stakeholders who have been part of our business success. Our valued customers have been in the heart of our business model and we do appreciate their long-standing loyalty that provides us with the opportunity to serve them in a more meaningful way. We are confident that NEPAL TELECOM will continue to make all round progress in the days to come with the continued trust of shareholders and constructive suggestions from well-wishers.
Let me also take this opportunity to appreciate hard work, diligence and commitment of employees along with the management team. We trust that the dedicated workforce will continue to work with team spirit and make best use of their individual knowledge and skills for betterment of the company.
I would like to extend sincere gratitude to the Government of Nepal, government agencies, Securities Board of Nepal, Nepal Telecommunications Authority, Office of the Company Registrar, all stakeholders and our well-wishers for their generous support and guidance without which we would not, perhaps, be able to make our business ventures successful. In this competitive environment, we heartily appreciate patronage of all well-wishers that has helped us to maintain market leadership and we do expect that the support will be continued in the days to come.
Thank You.
Mahendra Man GurungChairman
14 January 2019Kathmandu, Nepal
13Annual Report 2017/18
14 Annual Report 2017/18
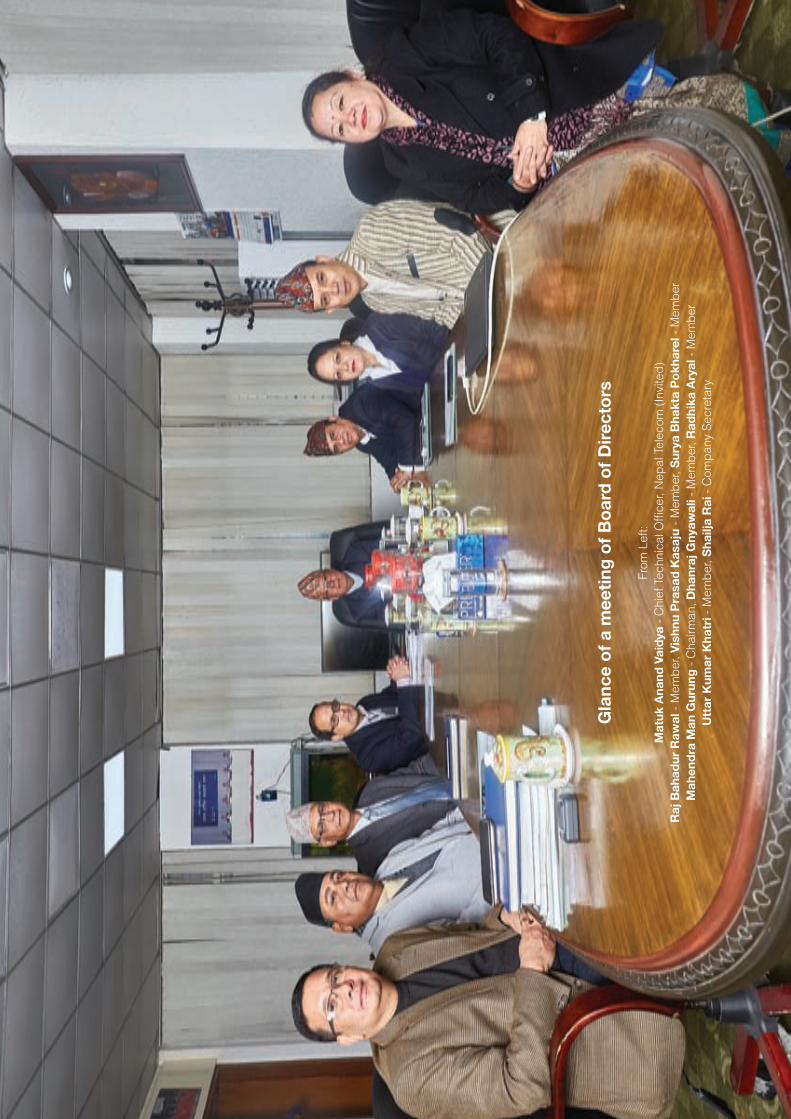
Gla
nce
of
a m
eeti
ng o
f B
oar
d o
f D
irec
tors
From
Lef
t:M
atuk
Ana
nd V
aid
ya -
Chi
ef T
echn
ical
Offi
cer,
Nep
al T
elec
om (
Invi
ted
)R
aj B
ahad
ur R
awal
- M
emb
er, V
ishn
u P
rasa
d K
asaj
u -
Mem
ber
, Sur
ya B
hakt
a P
okh
arel
- M
emb
erM
ahen
dra
Man
Gur
ung
- C
hairm
an, D
hanr
aj G
nyaw
ali -
Mem
ber
, Rad
hika
Ary
al -
Mem
ber
Utt
ar K
umar
Kha
tri -
Mem
ber
, Sha
ilja
Rai
- C
omp
any
Sec
reta
ry

15Annual Report 2017/18
MANAGEMENT
Surya Bhakta PokharelFor Managing Director
Pradeep Raj UpadhyayChief Commercial Officer &
Chief Financial Officer
Gokarna Prasad SitaulaDeputy Managing Director
Internal Audit & Inspection Department
Raju Babu AryalChief Human Resources Officer
Matuk Anand VaidyaChief Technical Officer
Shailja RaiDeputy Managing Director
Company Secretary
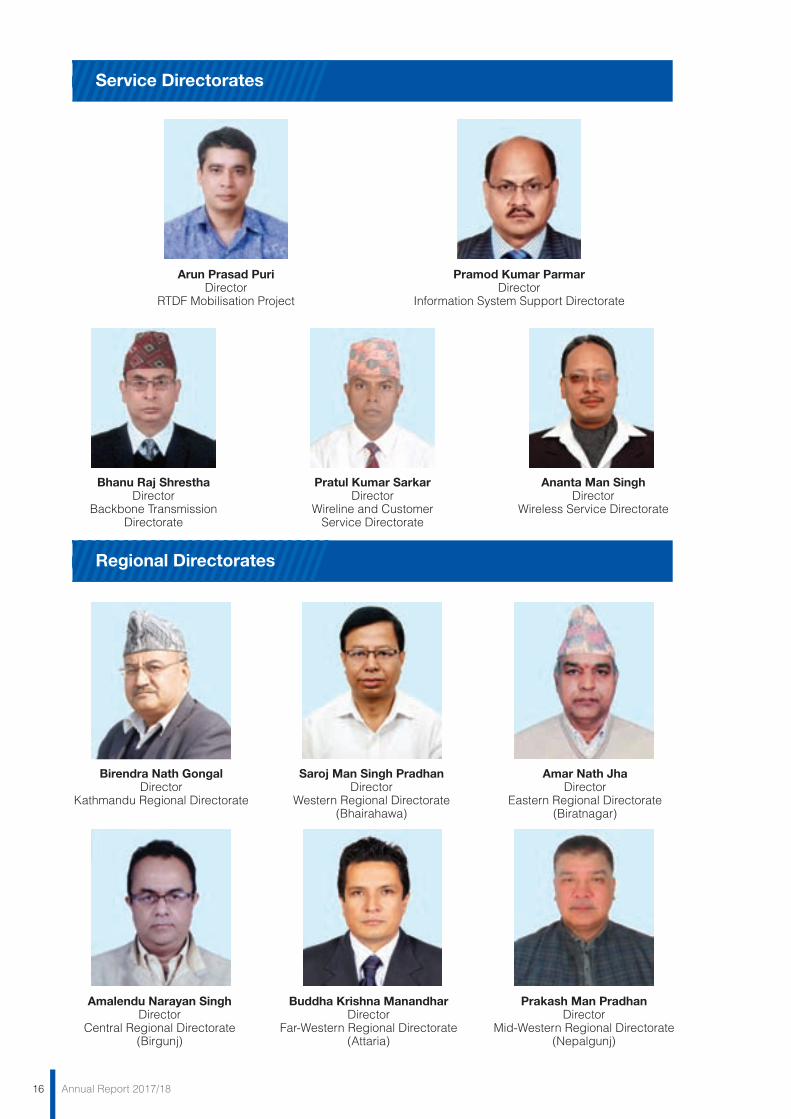
16 Annual Report 2017/18
Pratul Kumar SarkarDirector
Wireline and CustomerService Directorate
Ananta Man SinghDirector
Wireless Service Directorate
Bhanu Raj ShresthaDirector
Backbone Transmission Directorate
Pramod Kumar ParmarDirector
Information System Support Directorate
Arun Prasad PuriDirector
RTDF Mobilisation Project
Regional Directorates
Service Directorates
Birendra Nath GongalDirector
Kathmandu Regional Directorate
Amar Nath JhaDirector
Eastern Regional Directorate(Biratnagar)
Buddha Krishna ManandharDirector
Far-Western Regional Directorate(Attaria)
Saroj Man Singh PradhanDirector
Western Regional Directorate(Bhairahawa)
Amalendu Narayan SinghDirector
Central Regional Directorate(Birgunj)
Prakash Man PradhanDirector
Mid-Western Regional Directorate(Nepalgunj)
17Annual Report 2017/18
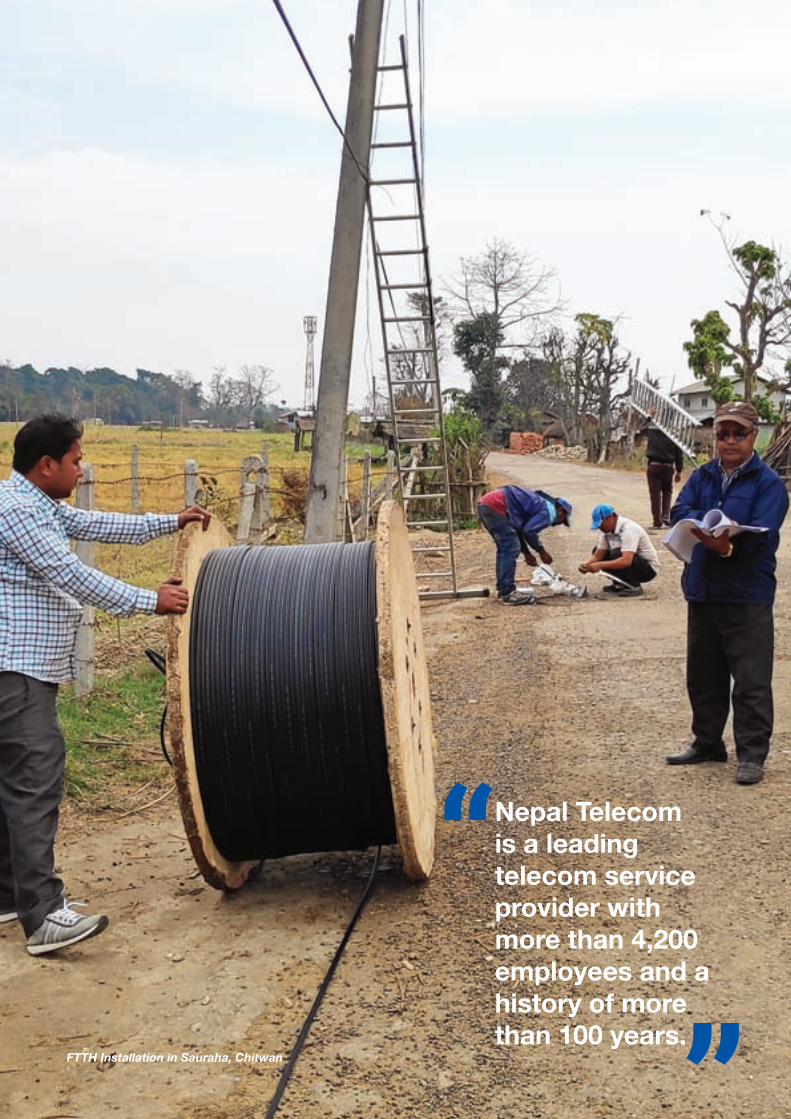
Nepal Telecom is a leading telecom service provider with more than 4,200 employees and a history of more than 100 years.
FTTH Installation in Sauraha, Chitwan
18 Annual Report 2017/18
REPORT OF THE BOARD OF DIRECTORS
Respected Shareholders,
We would like to welcome all shareholders, representatives and staffs in the 11th Annual General Meeting of Nepal Doorsanchar Company Limited. We are delighted to share that company is able to maintain customer trust and render excellent services in the FY 2017/18. We are committed to launch new schemes and services based on customer expectation for being the best brand in telecom sector. We are utilizing our best effort in order to achieve excellence in whatever we have to offer to our valued customers and stakeholders.
PERFORMANCE OF THE COMPANY
Financial Performance
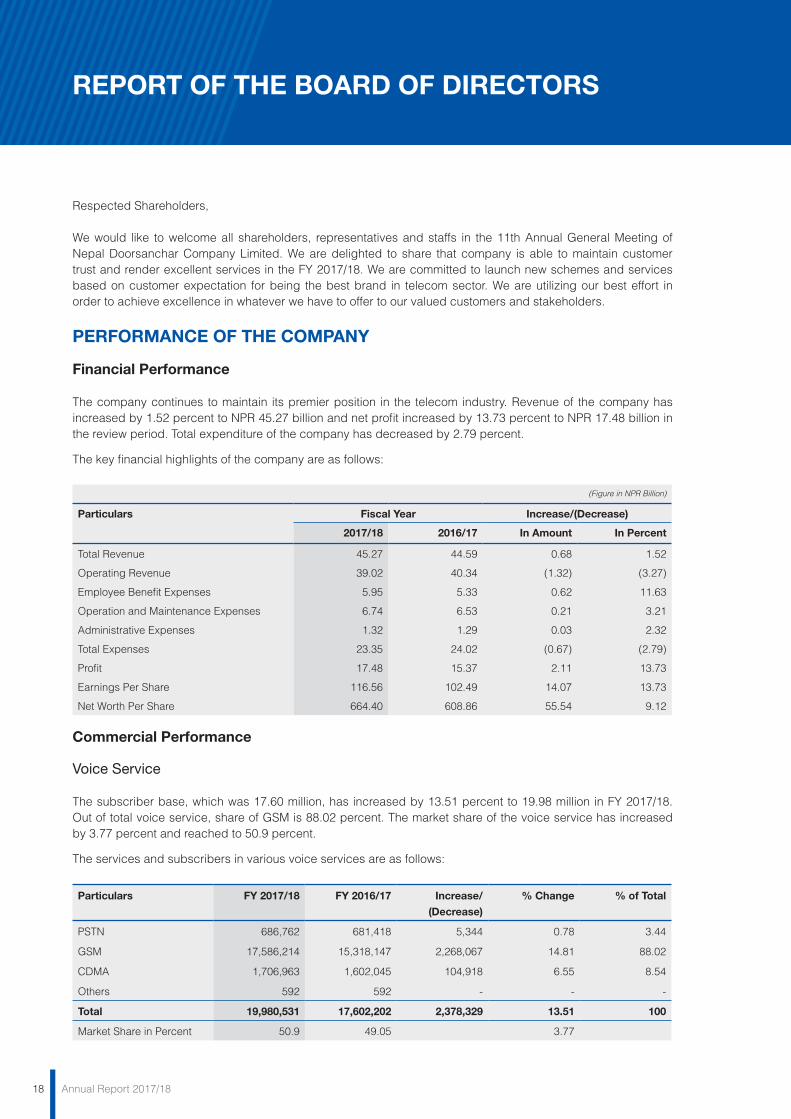
The company continues to maintain its premier position in the telecom industry. Revenue of the company has increased by 1.52 percent to NPR 45.27 billion and net profit increased by 13.73 percent to NPR 17.48 billion in the review period. Total expenditure of the company has decreased by 2.79 percent.
The key financial highlights of the company are as follows:
(Figure in NPR Billion)
Particulars Fiscal Year Increase/(Decrease)
2017/18 2016/17 In Amount In Percent
Total Revenue 45.27 44.59 0.68 1.52
Operating Revenue 39.02 40.34 (1.32) (3.27)
Employee Benefit Expenses 5.95 5.33 0.62 11.63
Operation and Maintenance Expenses 6.74 6.53 0.21 3.21
Administrative Expenses 1.32 1.29 0.03 2.32
Total Expenses 23.35 24.02 (0.67) (2.79)
Profit 17.48 15.37 2.11 13.73
Earnings Per Share 116.56 102.49 14.07 13.73
Net Worth Per Share 664.40 608.86 55.54 9.12
Commercial Performance
Voice Service
The subscriber base, which was 17.60 million, has increased by 13.51 percent to 19.98 million in FY 2017/18. Out of total voice service, share of GSM is 88.02 percent. The market share of the voice service has increased by 3.77 percent and reached to 50.9 percent.
The services and subscribers in various voice services are as follows:
Particulars FY 2017/18 FY 2016/17 Increase/
(Decrease)
% Change % of Total
PSTN 686,762 681,418 5,344 0.78 3.44
GSM 17,586,214 15,318,147 2,268,067 14.81 88.02
CDMA 1,706,963 1,602,045 104,918 6.55 8.54
Others 592 592 - - -
Total 19,980,531 17,602,202 2,378,329 13.51 100
Market Share in Percent 50.9 49.05 3.77
19Annual Report 2017/18
Data Service
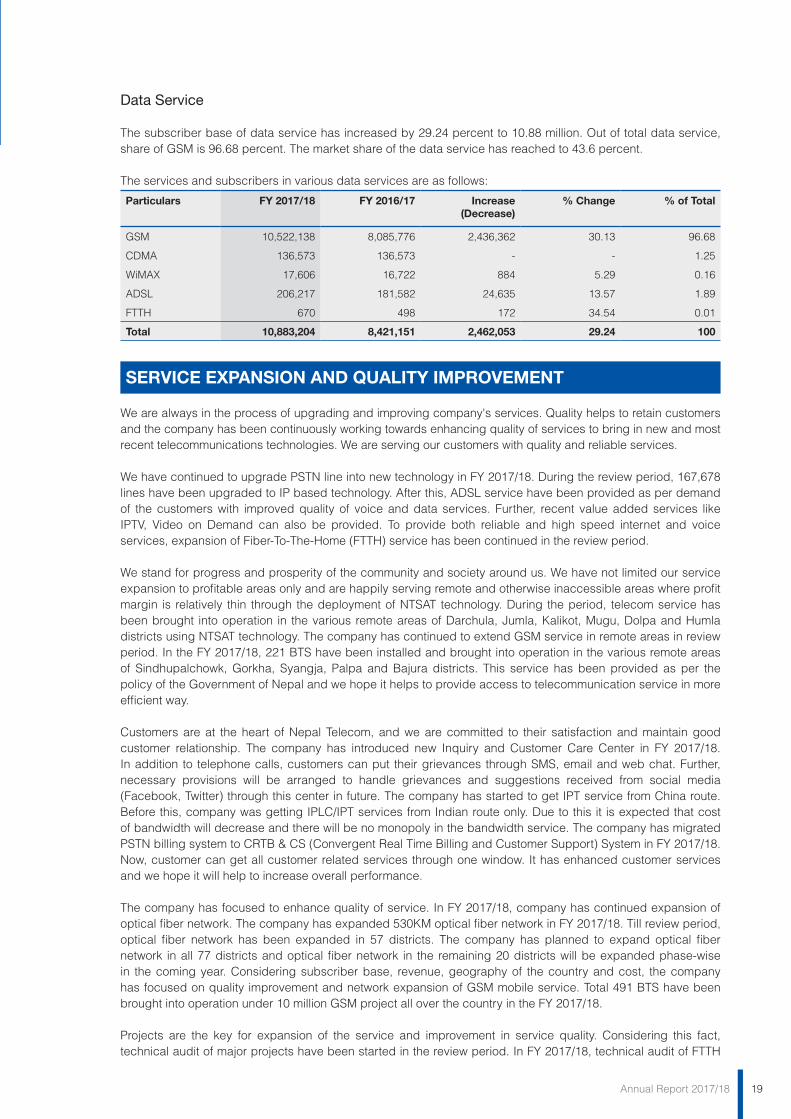
The subscriber base of data service has increased by 29.24 percent to 10.88 million. Out of total data service, share of GSM is 96.68 percent. The market share of the data service has reached to 43.6 percent.
The services and subscribers in various data services are as follows:
Particulars FY 2017/18 FY 2016/17 Increase(Decrease)
% Change % of Total
GSM 10,522,138 8,085,776 2,436,362 30.13 96.68
CDMA 136,573 136,573 - - 1.25
WiMAX 17,606 16,722 884 5.29 0.16
ADSL 206,217 181,582 24,635 13.57 1.89
FTTH 670 498 172 34.54 0.01
Total 10,883,204 8,421,151 2,462,053 29.24 100
SERVICE EXPANSION AND QUALITY IMPROVEMENT
We are always in the process of upgrading and improving company's services. Quality helps to retain customers and the company has been continuously working towards enhancing quality of services to bring in new and most recent telecommunications technologies. We are serving our customers with quality and reliable services.
We have continued to upgrade PSTN line into new technology in FY 2017/18. During the review period, 167,678 lines have been upgraded to IP based technology. After this, ADSL service have been provided as per demand of the customers with improved quality of voice and data services. Further, recent value added services like IPTV, Video on Demand can also be provided. To provide both reliable and high speed internet and voice services, expansion of Fiber-To-The-Home (FTTH) service has been continued in the review period.
We stand for progress and prosperity of the community and society around us. We have not limited our service expansion to profitable areas only and are happily serving remote and otherwise inaccessible areas where profit margin is relatively thin through the deployment of NTSAT technology. During the period, telecom service has been brought into operation in the various remote areas of Darchula, Jumla, Kalikot, Mugu, Dolpa and Humla districts using NTSAT technology. The company has continued to extend GSM service in remote areas in review period. In the FY 2017/18, 221 BTS have been installed and brought into operation in the various remote areas of Sindhupalchowk, Gorkha, Syangja, Palpa and Bajura districts. This service has been provided as per the policy of the Government of Nepal and we hope it helps to provide access to telecommunication service in more efficient way.
Customers are at the heart of Nepal Telecom, and we are committed to their satisfaction and maintain good customer relationship. The company has introduced new Inquiry and Customer Care Center in FY 2017/18. In addition to telephone calls, customers can put their grievances through SMS, email and web chat. Further, necessary provisions will be arranged to handle grievances and suggestions received from social media (Facebook, Twitter) through this center in future. The company has started to get IPT service from China route. Before this, company was getting IPLC/IPT services from Indian route only. Due to this it is expected that cost of bandwidth will decrease and there will be no monopoly in the bandwidth service. The company has migrated PSTN billing system to CRTB & CS (Convergent Real Time Billing and Customer Support) System in FY 2017/18. Now, customer can get all customer related services through one window. It has enhanced customer services and we hope it will help to increase overall performance.
The company has focused to enhance quality of service. In FY 2017/18, company has continued expansion of optical fiber network. The company has expanded 530KM optical fiber network in FY 2017/18. Till review period, optical fiber network has been expanded in 57 districts. The company has planned to expand optical fiber network in all 77 districts and optical fiber network in the remaining 20 districts will be expanded phase-wise in the coming year. Considering subscriber base, revenue, geography of the country and cost, the company has focused on quality improvement and network expansion of GSM mobile service. Total 491 BTS have been brought into operation under 10 million GSM project all over the country in the FY 2017/18.
Projects are the key for expansion of the service and improvement in service quality. Considering this fact, technical audit of major projects have been started in the review period. In FY 2017/18, technical audit of FTTH
20 Annual Report 2017/18
Implementation, use of Dedicated Feeder, Generator and City Supply, Optical Fiber and KPI of GSM have been done. Technical audit of other major projects will be continued in coming years.
ECONOMIC ENVIRONMENT
Global Economy
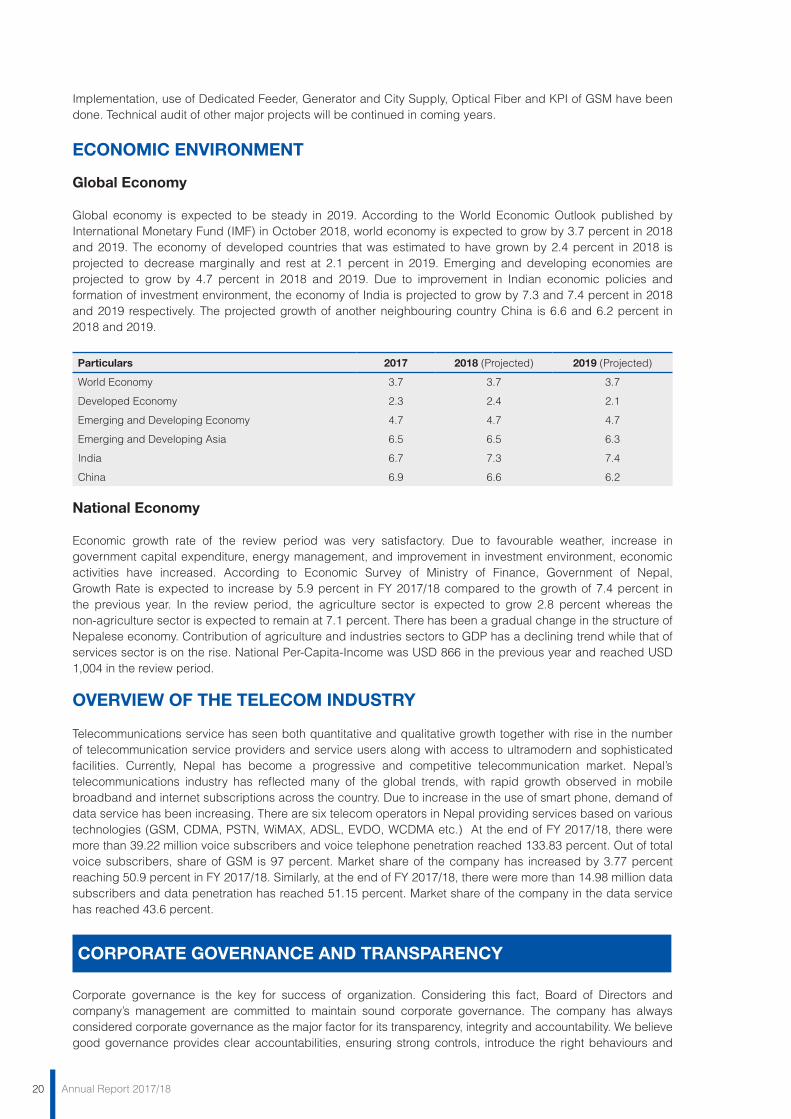
Global economy is expected to be steady in 2019. According to the World Economic Outlook published by International Monetary Fund (IMF) in October 2018, world economy is expected to grow by 3.7 percent in 2018 and 2019. The economy of developed countries that was estimated to have grown by 2.4 percent in 2018 is projected to decrease marginally and rest at 2.1 percent in 2019. Emerging and developing economies are projected to grow by 4.7 percent in 2018 and 2019. Due to improvement in Indian economic policies and formation of investment environment, the economy of India is projected to grow by 7.3 and 7.4 percent in 2018 and 2019 respectively. The projected growth of another neighbouring country China is 6.6 and 6.2 percent in 2018 and 2019.
Particulars 2017 2018 (Projected) 2019 (Projected)
World Economy 3.7 3.7 3.7
Developed Economy 2.3 2.4 2.1
Emerging and Developing Economy 4.7 4.7 4.7
Emerging and Developing Asia 6.5 6.5 6.3
India 6.7 7.3 7.4
China 6.9 6.6 6.2
National Economy
Economic growth rate of the review period was very satisfactory. Due to favourable weather, increase in government capital expenditure, energy management, and improvement in investment environment, economic activities have increased. According to Economic Survey of Ministry of Finance, Government of Nepal, Growth Rate is expected to increase by 5.9 percent in FY 2017/18 compared to the growth of 7.4 percent in the previous year. In the review period, the agriculture sector is expected to grow 2.8 percent whereas the non-agriculture sector is expected to remain at 7.1 percent. There has been a gradual change in the structure of Nepalese economy. Contribution of agriculture and industries sectors to GDP has a declining trend while that of services sector is on the rise. National Per-Capita-Income was USD 866 in the previous year and reached USD 1,004 in the review period.
OVERVIEW OF THE TELECOM INDUSTRY
Telecommunications service has seen both quantitative and qualitative growth together with rise in the number of telecommunication service providers and service users along with access to ultramodern and sophisticated facilities. Currently, Nepal has become a progressive and competitive telecommunication market. Nepal’s telecommunications industry has reflected many of the global trends, with rapid growth observed in mobile broadband and internet subscriptions across the country. Due to increase in the use of smart phone, demand of data service has been increasing. There are six telecom operators in Nepal providing services based on various technologies (GSM, CDMA, PSTN, WiMAX, ADSL, EVDO, WCDMA etc.) At the end of FY 2017/18, there were more than 39.22 million voice subscribers and voice telephone penetration reached 133.83 percent. Out of total voice subscribers, share of GSM is 97 percent. Market share of the company has increased by 3.77 percent reaching 50.9 percent in FY 2017/18. Similarly, at the end of FY 2017/18, there were more than 14.98 million data subscribers and data penetration has reached 51.15 percent. Market share of the company in the data service has reached 43.6 percent.
CORPORATE GOVERNANCE AND TRANSPARENCY
Corporate governance is the key for success of organization. Considering this fact, Board of Directors and company’s management are committed to maintain sound corporate governance. The company has always considered corporate governance as the major factor for its transparency, integrity and accountability. We believe good governance provides clear accountabilities, ensuring strong controls, introduce the right behaviours and
21Annual Report 2017/18
reinforce good performance. Good governance practices are essential for a sustainable business model to generate long-term value to all of its stakeholders. A strong commitment and adoption of ethical practices are major features of Good Corporate Governance, and this depends upon organization’s practices in its dealings with the stakeholders. Increasing complexity in modern day business has made it even more necessary for companies to have sound governance practices in order to build and sustain trust in its stakeholders.
The company has been regularly publishing its transactions and financial statements based on requirements of national and international standards. The company has also been adhering to various laws, circulars and directives given by the Government of Nepal and regulatory authority. We are committed to prevent corruption and for this we have put in place effective control measures. Particulars of the property held in the name of staff and their relatives have been obtained after completion of the fiscal year and submitted to Government of Nepal as per prevailing corruption prevention laws. Required authority has been delegated and job description has been provided to all officer level employees. To prevent unlawful activities, adequate provisions have been made in the employee by-laws. In case of unlawful activities necessary action are taken as per employee by-laws. The company has put the code of ethics in place for strict adherence by all of its employees. In order to manage and maintain transparency in purchasing processes, the company has been continuously practicing E-bidding.
BOARD OF DIRECTORS
The company has formed Board of Directors as per provisions of Companies Act, 2006, Memorandum of Association and Articles of Association of the company. The function of the board is governed by Companies Act, 2006, Memorandum of Association and Articles of Association of the company.
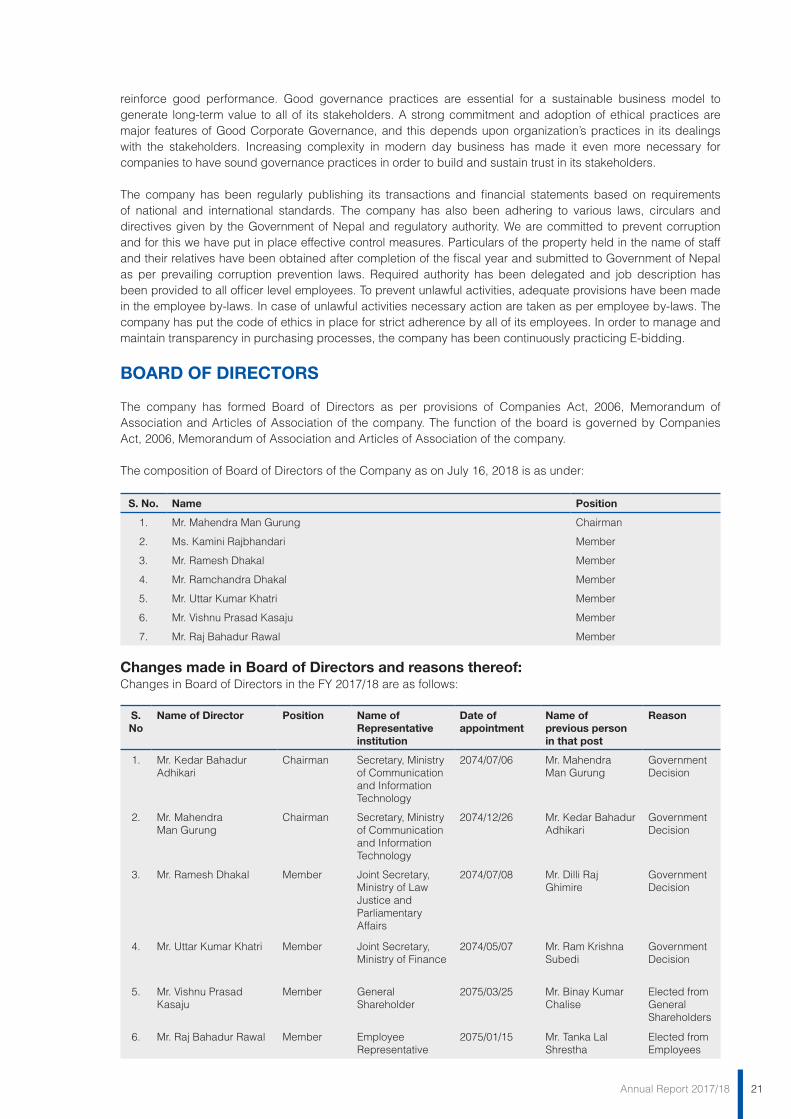
The composition of Board of Directors of the Company as on July 16, 2018 is as under:
S. No. Name Position
1. Mr. Mahendra Man Gurung Chairman
2. Ms. Kamini Rajbhandari Member
3. Mr. Ramesh Dhakal Member
4. Mr. Ramchandra Dhakal Member
5. Mr. Uttar Kumar Khatri Member
6. Mr. Vishnu Prasad Kasaju Member
7. Mr. Raj Bahadur Rawal Member
Changes made in Board of Directors and reasons thereof:Changes in Board of Directors in the FY 2017/18 are as follows:
S. No
Name of Director Position Name of Representative institution
Date of appointment
Name of previous person in that post
Reason
1. Mr. Kedar Bahadur Adhikari
Chairman Secretary, Ministry of Communication and Information Technology
2074/07/06 Mr. Mahendra Man Gurung
Government Decision
2. Mr. Mahendra Man Gurung
Chairman Secretary, Ministry of Communication and Information Technology
2074/12/26 Mr. Kedar Bahadur Adhikari
Government Decision
3. Mr. Ramesh Dhakal Member Joint Secretary, Ministry of Law Justice and Parliamentary Affairs
2074/07/08 Mr. Dilli Raj Ghimire
Government Decision
4. Mr. Uttar Kumar Khatri Member Joint Secretary, Ministry of Finance
2074/05/07 Mr. Ram Krishna Subedi
Government Decision
5. Mr. Vishnu Prasad Kasaju
Member General Shareholder
2075/03/25 Mr. Binay Kumar Chalise
Elected from General Shareholders
6. Mr. Raj Bahadur Rawal Member Employee Representative
2075/01/15 Mr. Tanka Lal Shrestha
Elected from Employees
22 Annual Report 2017/18
Remunerations, Allowances and Facilities to the Board of DirectorsTotal 50 meetings were conducted in the FY 2017/18 and meeting fee is paid as per provisions in Articles of Association.
Please refer to Note 26.2.2 (a) of Notes to Financial Statements for compensation paid to Board of Directors.
AUDIT COMMITTEE
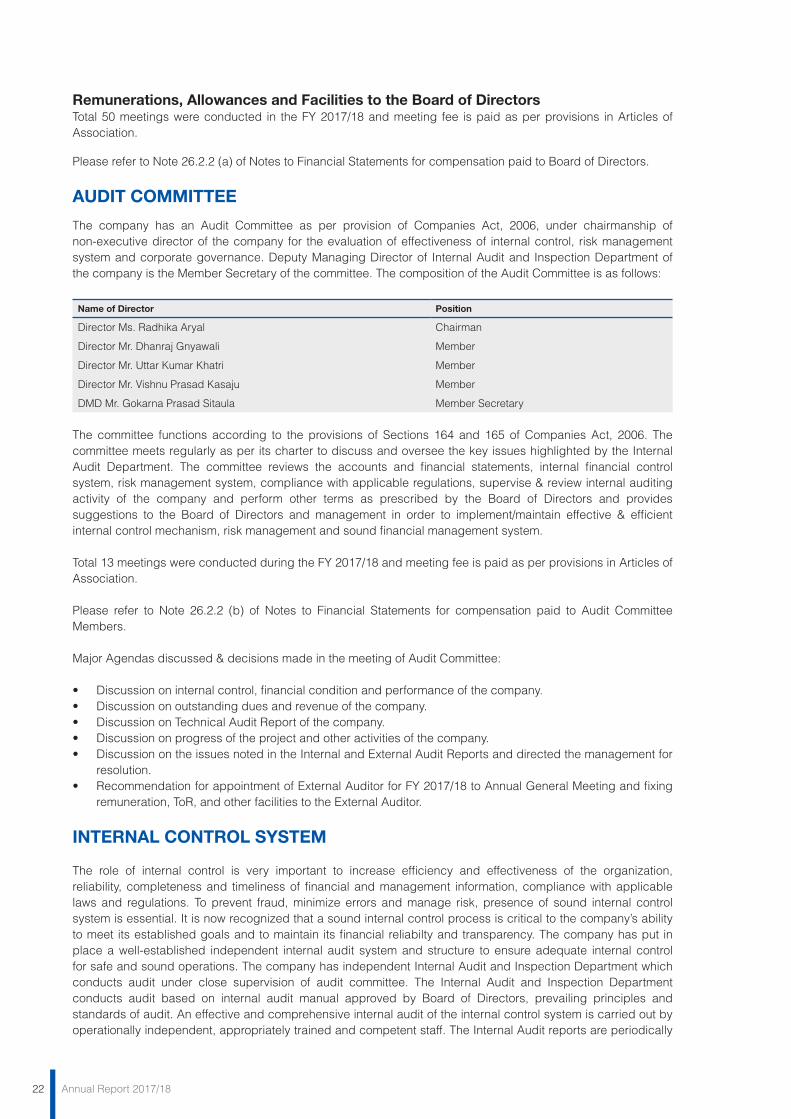
The company has an Audit Committee as per provision of Companies Act, 2006, under chairmanship of non-executive director of the company for the evaluation of effectiveness of internal control, risk management system and corporate governance. Deputy Managing Director of Internal Audit and Inspection Department of the company is the Member Secretary of the committee. The composition of the Audit Committee is as follows:
Name of Director Position
Director Ms. Radhika Aryal Chairman
Director Mr. Dhanraj Gnyawali Member
Director Mr. Uttar Kumar Khatri Member
Director Mr. Vishnu Prasad Kasaju Member
DMD Mr. Gokarna Prasad Sitaula Member Secretary
The committee functions according to the provisions of Sections 164 and 165 of Companies Act, 2006. The committee meets regularly as per its charter to discuss and oversee the key issues highlighted by the Internal Audit Department. The committee reviews the accounts and financial statements, internal financial control system, risk management system, compliance with applicable regulations, supervise & review internal auditing activity of the company and perform other terms as prescribed by the Board of Directors and provides suggestions to the Board of Directors and management in order to implement/maintain effective & efficient internal control mechanism, risk management and sound financial management system.
Total 13 meetings were conducted during the FY 2017/18 and meeting fee is paid as per provisions in Articles of Association.
Please refer to Note 26.2.2 (b) of Notes to Financial Statements for compensation paid to Audit Committee Members.
Major Agendas discussed & decisions made in the meeting of Audit Committee:
• Discussiononinternalcontrol,financialconditionandperformanceofthecompany.• Discussiononoutstandingduesandrevenueofthecompany.• DiscussiononTechnicalAuditReportofthecompany.• Discussiononprogressoftheprojectandotheractivitiesofthecompany.• DiscussionontheissuesnotedintheInternalandExternalAuditReportsanddirectedthemanagementfor
resolution.• RecommendationforappointmentofExternalAuditorforFY2017/18toAnnualGeneralMeetingandfixing
remuneration, ToR, and other facilities to the External Auditor.
INTERNAL CONTROL SYSTEM
The role of internal control is very important to increase efficiency and effectiveness of the organization, reliability, completeness and timeliness of financial and management information, compliance with applicable laws and regulations. To prevent fraud, minimize errors and manage risk, presence of sound internal control system is essential. It is now recognized that a sound internal control process is critical to the company’s ability to meet its established goals and to maintain its financial reliabilty and transparency. The company has put in place a well-established independent internal audit system and structure to ensure adequate internal control for safe and sound operations. The company has independent Internal Audit and Inspection Department which conducts audit under close supervision of audit committee. The Internal Audit and Inspection Department conducts audit based on internal audit manual approved by Board of Directors, prevailing principles and standards of audit. An effective and comprehensive internal audit of the internal control system is carried out by operationally independent, appropriately trained and competent staff. The Internal Audit reports are periodically
23Annual Report 2017/18
forwarded to the Audit Committee and the findings of all audits are reported to the management for initiating immediate corrective measures. Appropriate action has been taken on the issues raised in the audit reports.
Employee regulation and financial regulation are enacted with motive to maintain financial, business and managerial discipline in the company. Employees designated with concerned responsibilities will be held liable for punishment upon any misconduct or misuse of authority provided to him as per the provision of employee regulation of the company. Revenue monitoring and inspection committee is active to control revenue leakages.
STATUTORY AUDITOR
CA. (Dr.) Suvod Kumar Karn and CA. Achyut Raj Joshi have jointly conducted Statutory Audit for the FY 2017/18. This AGM will appoint auditor for FY 2018/19 as recommended by Office of the Auditor General and Audit Committee.
CUSTOMER SERVICE
We are committed to handle customer complaints and inquiries. The company handles complaints from customers with priority. The company treats customers fairly at all times. Any complaints raised by customers are dealt with courtesy and on time. The company has always been acting in good faith and without prejudice to the interest of the customers. To address the customer complaints on time, we have managed 24/7 customer care centre. The company has an inbuilt system for handling customers’ complaints and suggestions on priorities. Customers can place their complaints/inquiry as follows:
• ComplaintsofGSM,CDMA,andWiMAXthrough1498.• ComplaintsofPSTN,FTTH,ADSL,LeasedlineandVSATthrough198.• Telephonenumberinquiryofanyorganizationthrough197.Further, customers can place their complaints from company's 158 Customer Care Centres available all over the country. Company's customer care centre is available in 77 districts. The company has also been providing the necessary solutions to their grievances via a help desk named “Hello Sarkar” meaning “Hello Government” in the Prime Minister’s Office. The company has designated Spokesperson and Joint Spokesperson, and one Information Officer pursuant to the Right to Information Act, 2008, which provides access to information to every citizen as per the prevailing laws. Moreover, the company has been providing necessary information through media for the information to the public.
RISK MANAGEMENT
We are committed to managing risks and controlling its operations and financial activities in a manner, which enables it to maximize profitable business opportunities, avoid or reduce risks, ensuring compliance with applicable laws and regulations. For this, the company has adopted appropriate policy and processes for identification, appraisal, removal and control of risk. The increase in use of smart phones and booming data/internet market has allowed customers to use various tech savvy applications to communicate both verbally as well as in writing at cheap price. Similarly, increase in the use of smart phone, demand of data service and change in technology, customer interests and choices are changing. Company has considered this as an opportunity, and have introduced pocket friendly data packages. We have also been providing data services by increasing bandwidth capacity at competitive price. The use of such applications has hampered revenue of the company to some extent. To compete with this situation, the company has focused to expand its network, availability and quality of its services throughout the country. The company has been investing heavily to develop dependable optical fiber network and microwave radio infrastructure throughout the country. This effort has helped to provide telecommunication services all over the country even in remote regions and extremely difficult terrains.
In spite of all these efforts by the company that have directly benefitted the nation from service and revenue aspects, a few specific groups of people have been found to illegally use company’s network to bypass legal routes and terminate international traffic by using the latest VOIP technology. Although this has the potential to massively impact Nepal Telecom and its revenue, Nepal Telecom has been actively employing advanced technologies to control and minimize such illegal activities by closely collaborating with the government, regulatory and security agencies.
24 Annual Report 2017/18
It has been great challenge to the telecom company to maintain the revenue due to OTT players. However, as use of data is increasing, we have made strategy to recover the lost revenue by encouraging data service. Moreover, to increase the average revenue per user, we have been providing recent value added services and content at competitive price.
CONTRIBUTION AND RESPONSIBILITY OF THE COMPANY TO EMPLOYEE
For the company to be successful in its mission and vision, the support of the staff is essential. We believe that skilled and qualified manpower can improve the works and generate new ideas and technologies at workplace. Knowing this, special attention is given to efficient management of human resources. Long-term development and capacity enhancement of human capital is always given top priority in the company. Company has been continuously providing training to its employees for human resource development.
RecruitmentThe company's recruitment process follows a strictly structured and competitive procedure with clear criteria with regards to job descriptions, qualifications, experiences and aptitudes, where the selection is made solely based on merit. Moreover, the company’s recruitment policy is set on the principle of inclusion as per spirit of the Constitution of Nepal. Benefits and FacilitiesThe remuneration packages of the company are aligned with current status of the country’s economy. The package normally includes basic pay, allowances, incentives and bonus etc. Besides regular salary and allowance, vehicle facility has been provided to level 10 & 11. The packages are reviewed to ascertain that they are in line with the current economic condition of the country. The company also provides Dress Allowance, Medical Expense, Accidental Insurance and Loans. In addition to financial benefits, company provides various types of leaves to employees. Similarly, employees completing 20 years of service are rewarded with gold medal as a part of employee recognition. In FY 2017/18 total NPR 5.95 billion has been incurred for employee benefits. Details of employee benefits have been disclosed in Notes to Financial Statement section of Audit Report.
Awards and RecognitionThe company always aims to improve and encourage high performance not only on the individual level but as a team as well. In order to support such policy, the company has in place a well structured process to evaluate employee performance on an annual basis. Performance evaluation is assessed through certain criteria, such as knowledge, dedication, discipline, punctuality and attitude. There is also provision of awarding staffs based on performance as per specified criteria approved by the Board of Directors.
Training and DevelopmentThe company believes that employees are its core strength and they play a very significant role in the success of the company. Therefore, the employees are periodically provided with training opportunities in order to develop necessary skills to not only survive but also compete in this dynamic industry. Employees are provided with sufficient opportunities to participate in advanced level trainings and workshops abroad to enhance their knowledge and skills required for the operation of installed equipment based on the type of service. In addition, with the changing scenario and change in technology the company provides various opportunities for international trainings, seminars, conferences etc. Total 178 staffs have participated in international trainings, seminars, conferences in FY 2017/18. Further, to enhance skill and capacity of the staff, various national level trainings have been provided on Financial Management, Audit, Revenue Assurance, Risk Management and New technology.
25Annual Report 2017/18
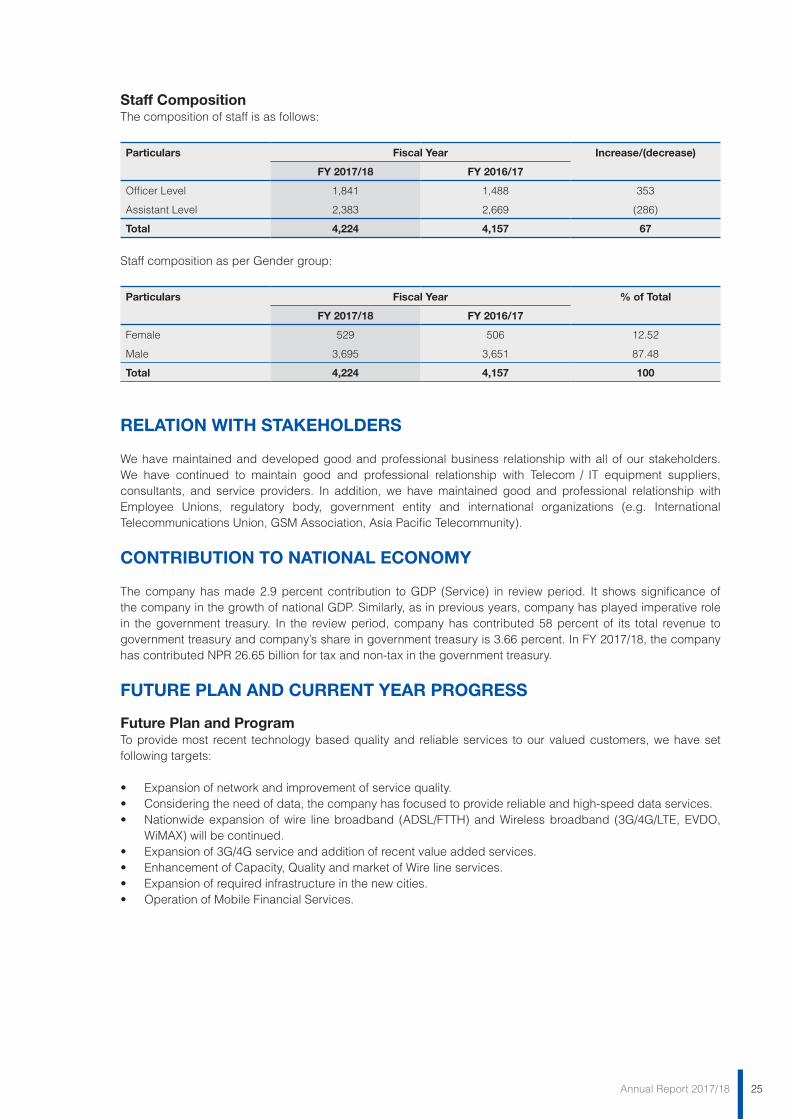
Staff CompositionThe composition of staff is as follows:
Particulars Fiscal Year Increase/(decrease)
FY 2017/18 FY 2016/17
Officer Level 1,841 1,488 353
Assistant Level 2,383 2,669 (286)
Total 4,224 4,157 67
Staff composition as per Gender group:
Particulars Fiscal Year % of Total
FY 2017/18 FY 2016/17
Female 529 506 12.52
Male 3,695 3,651 87.48
Total 4,224 4,157 100
RELATION WITH STAKEHOLDERS
We have maintained and developed good and professional business relationship with all of our stakeholders. We have continued to maintain good and professional relationship with Telecom / IT equipment suppliers, consultants, and service providers. In addition, we have maintained good and professional relationship with Employee Unions, regulatory body, government entity and international organizations (e.g. International Telecommunications Union, GSM Association, Asia Pacific Telecommunity).
CONTRIBUTION TO NATIONAL ECONOMY
The company has made 2.9 percent contribution to GDP (Service) in review period. It shows significance of the company in the growth of national GDP. Similarly, as in previous years, company has played imperative role in the government treasury. In the review period, company has contributed 58 percent of its total revenue to government treasury and company’s share in government treasury is 3.66 percent. In FY 2017/18, the company has contributed NPR 26.65 billion for tax and non-tax in the government treasury.
FUTURE PLAN AND CURRENT YEAR PROGRESS
Future Plan and ProgramTo provide most recent technology based quality and reliable services to our valued customers, we have set following targets:
• Expansionofnetworkandimprovementofservicequality.• Consideringtheneedofdata,thecompanyhasfocusedtoprovidereliableandhigh-speeddataservices.• Nationwideexpansionofwire linebroadband (ADSL/FTTH)andWirelessbroadband (3G/4G/LTE,EVDO,
WiMAX) will be continued. • Expansionof3G/4Gserviceandadditionofrecentvalueaddedservices.• EnhancementofCapacity,QualityandmarketofWirelineservices.• Expansionofrequiredinfrastructureinthenewcities.• OperationofMobileFinancialServices.
26 Annual Report 2017/18
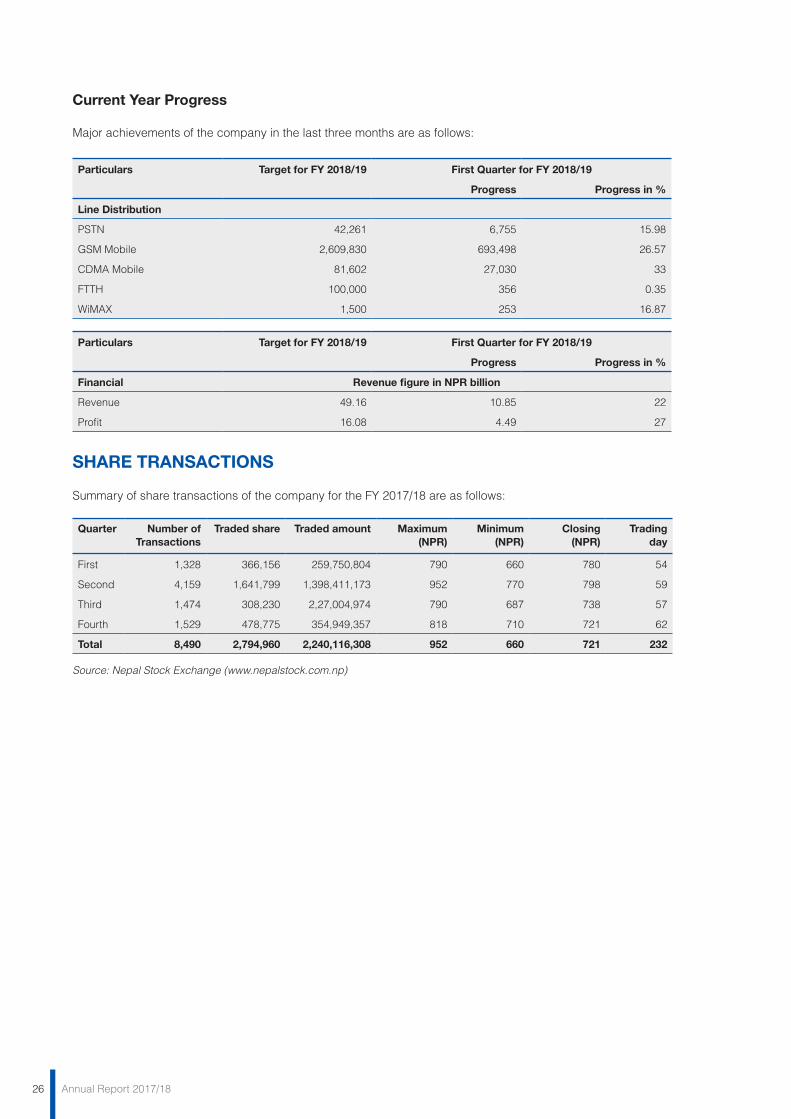
Current Year Progress
Major achievements of the company in the last three months are as follows:
Particulars Target for FY 2018/19 First Quarter for FY 2018/19
Progress Progress in %
Line Distribution
PSTN 42,261 6,755 15.98
GSM Mobile 2,609,830 693,498 26.57
CDMA Mobile 81,602 27,030 33
FTTH 100,000 356 0.35
WiMAX 1,500 253 16.87
Particulars Target for FY 2018/19 First Quarter for FY 2018/19
Progress Progress in %
Financial Revenue figure in NPR billion
Revenue 49.16 10.85 22
Profit 16.08 4.49 27
SHARE TRANSACTIONS
Summary of share transactions of the company for the FY 2017/18 are as follows:
Quarter Number of Transactions
Traded share Traded amount Maximum (NPR)
Minimum (NPR)
Closing (NPR)
Trading day
First 1,328 366,156 259,750,804 790 660 780 54
Second 4,159 1,641,799 1,398,411,173 952 770 798 59
Third 1,474 308,230 2,27,004,974 790 687 738 57
Fourth 1,529 478,775 354,949,357 818 710 721 62
Total 8,490 2,794,960 2,240,116,308 952 660 721 232
Source: Nepal Stock Exchange (www.nepalstock.com.np)
27Annual Report 2017/18
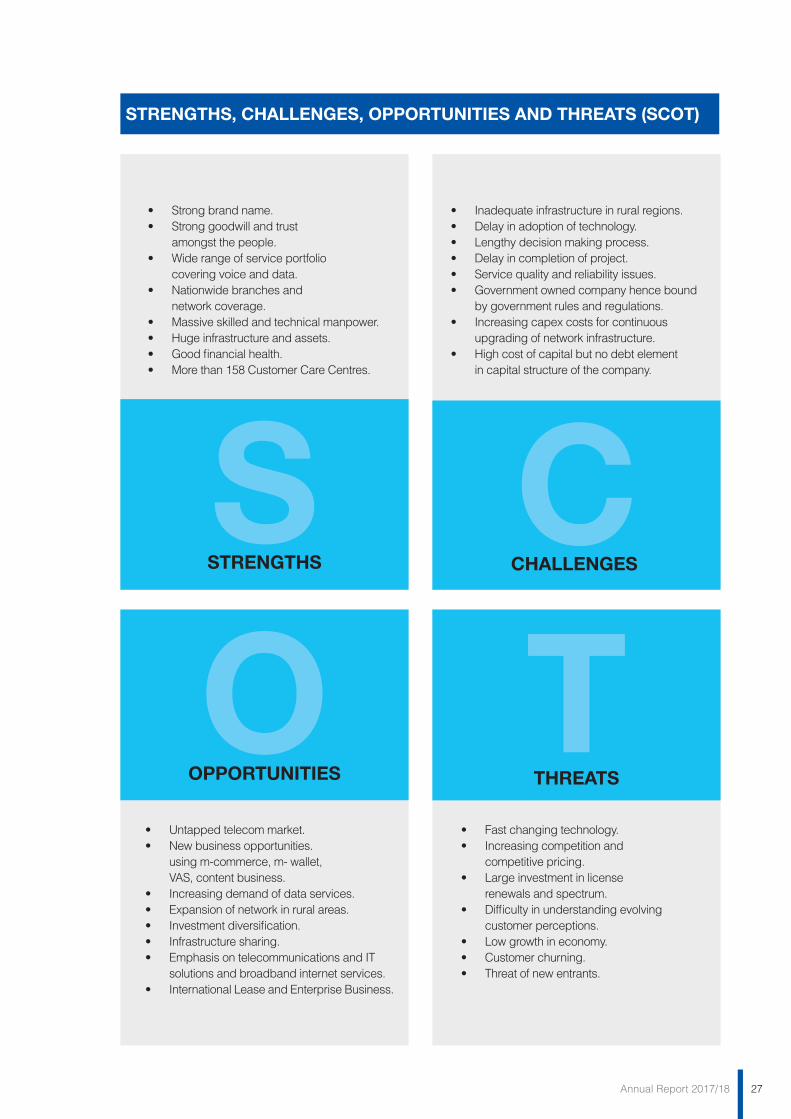
• Strongbrandname.• Stronggoodwillandtrust
amongst the people.• Widerangeofserviceportfolio
covering voice and data.• Nationwidebranchesand
network coverage.• Massiveskilledandtechnicalmanpower.• Hugeinfrastructureandassets.• Goodfinancialhealth.• Morethan158CustomerCareCentres.
• Inadequateinfrastructureinruralregions.• Delayinadoptionoftechnology.• Lengthydecisionmakingprocess.• Delayincompletionofproject.• Servicequalityandreliabilityissues.• Governmentownedcompanyhencebound
by government rules and regulations.• Increasingcapexcostsforcontinuous
upgrading of network infrastructure.• Highcostofcapitalbutnodebtelement
in capital structure of the company.
• Untappedtelecommarket.• Newbusinessopportunities.
using m-commerce, m- wallet, VAS, content business.
• Increasingdemandofdataservices.• Expansionofnetworkinruralareas.• Investmentdiversification.• Infrastructuresharing.• EmphasisontelecommunicationsandIT
solutions and broadband internet services.• InternationalLeaseandEnterpriseBusiness.
• Fastchangingtechnology.• Increasingcompetitionand
competitive pricing.• Largeinvestmentinlicense
renewals and spectrum.• Difficultyinunderstandingevolving
customer perceptions.• Lowgrowthineconomy.• Customerchurning.• Threatofnewentrants.
SSTRENGTHS
CCHALLENGES
TTHREATS
OOPPORTUNITIES
STRENGTHS, CHALLENGES, OPPORTUNITIES AND THREATS (SCOT)
28 Annual Report 2017/18
LEGAL PROCEEDINGSIn FY 2017/18, five law suits have been filed by the company and 17 law suits have been filed against the company. No law suit has been filed by or against the promoter or director of the company involving statutory or criminal offence. Similarly, no law suit has been filed by or against the promoter or director of the company for committing financial crimes.
ADDITIONAL INFORMATION
DISCLOSURE OF INFORMATION UNDER SECTION 109 OF COMPANIES ACT (FIRST AMENDMENT), 2006
Remunerations and Facilities to the Managing Director and other Office-bearers:NPR 21,410,234 as remuneration and travelling allowances has been paid to level 11 and above in the FY 2017/18.
Effect of internal and external factors on the company’s business: The following effects have been observed on the company’s transactions due to the internal and external elements:
• Increasingcompetitionandcompetitivepricinghavenegativelyaffectedrevenueofthecompany.• Duetorapidchangeintelecomtechnology,companyisfacingproblemtoprovidemostrecenttechnology
based services. • Lateadoptionsoftechnologyanddelayinthecompletionofprojectshaveaffectedqualityandreliabilityof
service. • Customersinterestsandchoicesarechanginganddemandsofthecustomersarealsoboundless.Dueto
this, there is problem to provide service as per demand of the customer. • Being a government owned company, it is the obligation of Nepal Telecom to follow all the rules and
regulations applicable to government agencies. • Geographicaldiversityandchallengeshaveheavilyaffected thespeedofdeploymentandexpansionof
services. In addition to this, the inherent characteristics of wireless technology make it difficult to provide comparable quality of service even in nearby places.
• Slowgrowtheconomyandunstablepoliticalsituationhaveaffectedoveralleconomyofthecountry.
The amount recommended for distribution as dividend:The Board has recommended cash dividend of NPR 55 per share after taking approval from the Government of Nepal as per requirement of Companies Act, 2006.
Details of shares forfeited (number of share, face value, amount received by the company prior to forfeiture, amount received by the company after putting such forfeited shares into subscription and amount refunded on account of forfeited shares) :The company has not forfeited any shares.
Transactions, progress and financial position of the company and its subsidiary company during the period:Transaction and progress of the company are disclosed in the Board of Director’s Report. Financial positions of the company are disclosed in the financial statement section. The company does not have any subsidiary company.
Main transactions carried out by the company and its subsidiary company during the fiscal year and any important changes in the business of the company during the period:Major transactions of the company have been disclosed in the Board of Director’s Report. The Company does not have any subsidiary company and there is no significant change in the business of the company during the period.
Any information given to the Company by its substantial shareholders during the fiscal year:No such information received from substantial shareholders.
Particulars of the ownership of shares taken up by the Directors and office-bearers of the company during the previous fiscal year, and information received by the company from them about their involvement, if any, in the transactions of the shares of the company:Directors and office bearers were not involved in the shares transactions of the company in FY 2017/18 as per the declaration provided by them to the company.

29Annual Report 2017/18
Particulars of information furnished by any Director or any of his close relatives about his personal interest in any agreement connected with the company signed during the previous fiscal year:The company has not received any such information.
Buyback of share by the Company, reason thereof for buyback, and number of shares bought back, face value of share and amount paid during the buyback:The company has not bought back any share during the period.
Whether or not there is an internal control system, and if there is any such system, details thereof:Please refer Report of the Board of Directors.
Details of management expenses incurred during the year:The management expense of the fiscal year is NPR 14,022,986,120. Please refer Notes to Financial Statement section of Audit Report for details of management expenses.Any remarks and observation stated in the Auditors’ Report and Board of Directors’ response thereon:No material issues and observation are noted in the audit report and necessary action has been taken for resolution.
Payments due, if any, to the company from any Director, Managing Director, Executive Chief or basic shareholder of the company or any of their close relatives, or from any firm, company or corporate body in which he is involved:The company has no such dues.
Dividends yet to be collected by Shareholders:Total dividends yet to be collected by the shareholders are NPR 281,650,932 at the end of the FY 2017/18. Company is constantly using various mediums such as banks in order to ease the process of dividend payment to its shareholders. Company has been publishing notices in national level newspapers to collect remaining dividend.
Detail of buy or sell of property with subsidiary company as per Clause 141:The company does not have a subsidiary company. Any matter to be mentioned in the Board of Directors’ report under Companies Act, 2006:All required matters are disclosed in the appropriate part of this report and financial statements section.
AcknowledgementThe Board of Directors is grateful to the valued customers, shareholders, employees, regulatory authorities for their support and guidance. We would like to thank you to all for their support and guidance. We have a good and valuable financial strength, customer trust, support, and the right team of staff. We promise to utilize our all resources to improve service quality, network expansion, and most recent technology based services in future. We promise to be more committed to increase our strong relationship with our stakeholders and deliver better service in future. We believe that shareholders are our partners in each endeavour we take. We need your suggestions for overall progress of the company. Finally, we would once again like to thank our clients and shareholders for their continued support and our staff for their tremendous effort and dedication.
Thank you.
Mahendra Man GurungChairman
Radhika AryalDirector
Raj Bahadur RawalDirector
Dhanaraj GnyawaliDirector
Uttar Kumar KhatriDirector
Surya Bhakta Pokharel For Managing Director
Vishnu Prasad KasajuDirector
Date: January 14, 2019 Place: Kathmandu

30 Annual Report 2017/18
BUSINESS PERSPECTIVE

31Annual Report 2017/18
32 Annual Report 2017/18
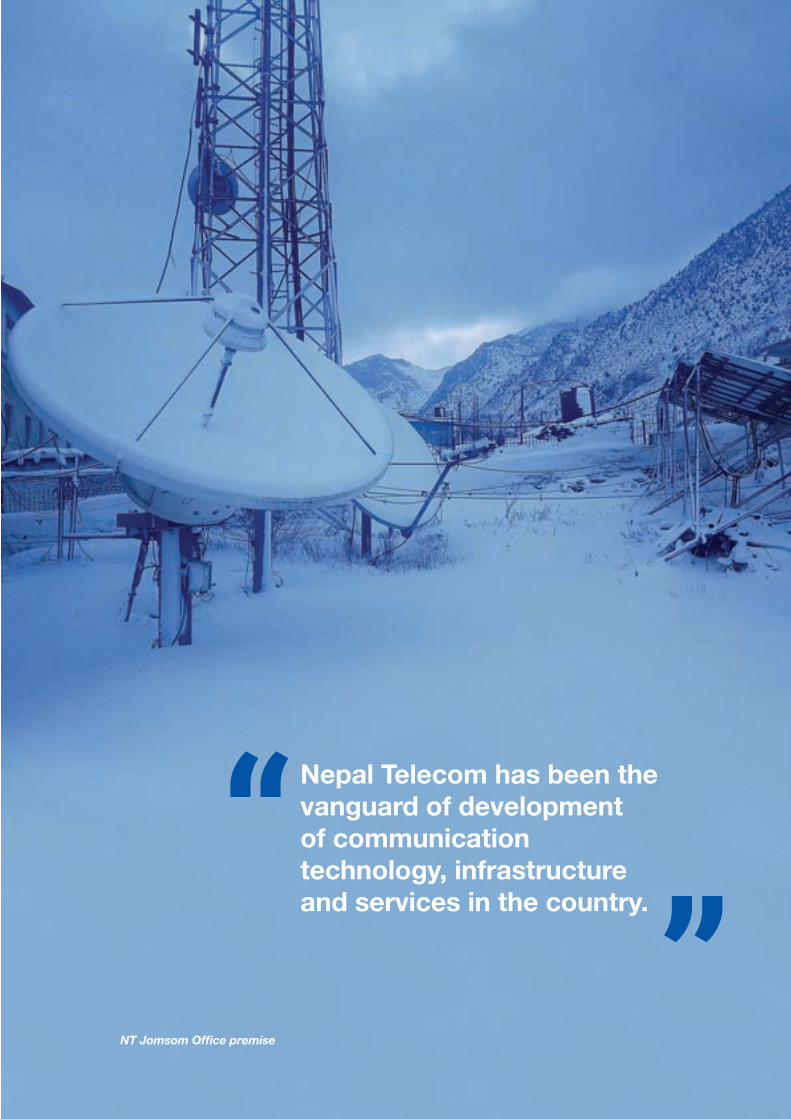
Communication is a vital and critical infrastructure of modern society as it provides a means for dissemination of information and connecting people together. The communication industry and infrastructure provides valuable contribution towards overall national development and social welfare.
Nepal Telecom has been the vanguard of development of communication technology, infrastructure and services in the country. With a journey spanning more than a century in different identities, the company has played a pivotal role in the development of telecommunication and IT sector in the country.
First as a fully government owned entity and at present as a company with major stake owned by the government, the company has been able to maintain its business viability, market leadership and customer confidence despite tough competition from the private and multinational sector. The company takes pride in its achievements and is committed to provide transparent, affordable and quality services across the nooks and corners of the country. Dedication of employees, trust of the valued customers, commitment of the shareholders and the cooperation of business partners have been the driving force behind continued success of the company. With the most diverse service portfolio and the largest customer base among the service providers in the country, Nepal Telecom has been introducing the latest and the most advanced technologies and services.
Despite the challenges posed by rapidly evolving technology, need to get quick return on investment, stiff and growing competition in the market and consistently decreasing revenue per user, the company has been able to maintain its leading position in the market. The company is committed to maintain trust and confidence extended by its valued customers and well-wishers.
At the end of Poush 2075 (i.e. mid-January 2019), the total subscriber base of Nepal Telecom has exceeded 21.29 million and the tele-density has reached 73.17 percent. Out of the total subscriber base, the GSM Mobile base was 18.86 million, CDMA was 1.75 million and PSTN was 0.67 million. The total Internet subscriber base including mobile data, ADSL, FTTH, WiMAX and Lease lines stood at 12.23 million. Nepal Telecom has earned reputation as a transparent service provider committed more to the service and national development than mere profit making. This has helped the company to retain its status as the chosen and preferred service provider across the length and breadth of the country.
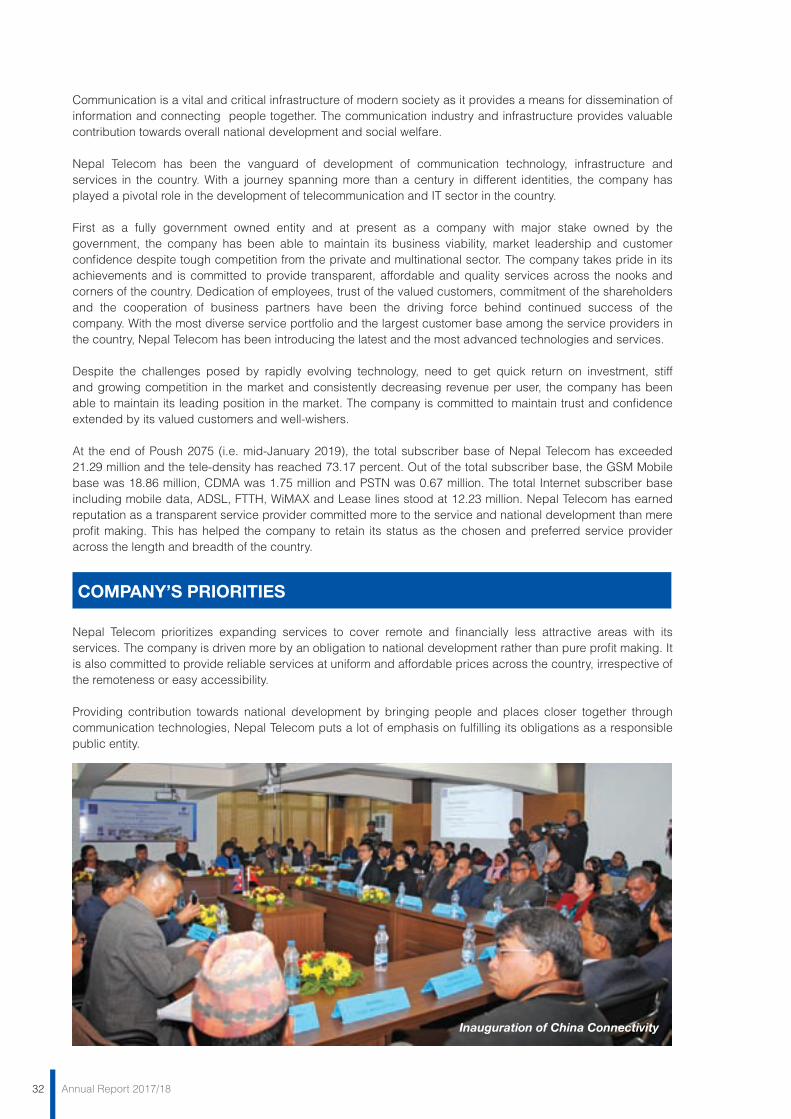
COMPANY’S PRIORITIES
Nepal Telecom prioritizes expanding services to cover remote and financially less attractive areas with its services. The company is driven more by an obligation to national development rather than pure profit making. It is also committed to provide reliable services at uniform and affordable prices across the country, irrespective of the remoteness or easy accessibility.
Providing contribution towards national development by bringing people and places closer together through communication technologies, Nepal Telecom puts a lot of emphasis on fulfilling its obligations as a responsible public entity.
Inauguration of China Connectivity
33Annual Report 2017/18
Nepal Telecom has been the vanguard of development of communication technology, infrastructure and services in the country.
NT Jomsom Office premise
34 Annual Report 2017/18
CONTRIBUTION TOWARDS NATIONAL DEVELOPMENT Nepal Telecom is continuously investing significant financial and human capital for introducing the latest technologies, services and facilities in the sector of telecommunication and information technology. The company plays a pivotal role in enhancing connectivity and bridging the digital divide.
While playing a critical role in development of one of the most important aspects of national and social development, the company also provides significant contribution towards national treasury in terms of income taxes, dividends, other taxes and duties. In that way, the company makes a significant contribution towards generation of revenue for the government and prop up the economy.
CUSTOMER SERVICEBeing a service provider, customers are at the foundation of the success of Nepal Telecom. Accordingly, the company puts maximum effort in providing reliable service at affordable price to its customers across the country. The services of the company have connected people and transformed lives in cities, towns, villages and communities in very remote villages as well as urban population centers of the country. It is committed to provide the latest, state-of-the-art technologies and services at affordable price through continued investment, technology transformation and adoption of the best practices.
TRANSPARENCYAs a responsible public entity, Nepal Telecom transparently publishes relevant information and data about its services, financial status, commercial activities, financial transactions, project operations and activities of corporate social responsibilities. It also transparently publishes and strictly follows the tariff, packages and plans offered to the customers as per the prevailing rules and regulations.
All the procurement activities are conducted according to the public procurement regulations of the country and the company follows competitive national and international bidding procedures for all its major purchases. As a result, there are a lot of business entities that can do business with the company in free and fair manner according to the public procurement rules and procedures. In this manner Nepal Telecom plays an important role in promoting small and medium sized businesses and enterprises in the country.
LATEST TECHNOLOGYNepal Telecom is a commercial business organization in the rapidly evolving and high-tech sector of telecommunications and IT. As a result, Nepal Telecom has to continuously invest money and manpower in introducing the latest technologies and services in the market to stay competitive and provide the latest services to its valued customers.
Along with its services and infrastructures, the company also invests in the latest technologies, systems and services to enhance its operational practices, improve employee productivity and enhance overall productivity. Operational automation, training and vocational development of employees, use of the latest systems and applications in HR management, project management, customer relationship management etc are some of the important examples of use of the latest technologies in its operational practices.
BUSINESS STRATEGY
CUSTOMERS Nepal Telecom is committed to provide quality customer service according to the evolving market trends, technologies and customer expectations. With a customer base of more than 20 million, Nepal Telecom is committed to maintain that trust and confidence of customers in the days to come. For this, the company shall continuously invest its money, material and manpower.
MEDIUM OF SERVICE AND INFORMATION DISSEMINATION Nepal Telecom has a wide network of branch offices and outlets across the country. More than 164 branch offices across the country work diligently in provisioning of services to customers including sales, revenue collection, maintenance, after sales support and dealer management.
Along with the branch offices and outlets, the company also employs the latest technologies such as electronic media, bank outlets, electronic wallets, web portals and others to provide prompt services to its customers.

35Annual Report 2017/18
With a customer base of more than 20 million, Nepal Telecom is committed to maintain the trust and confidence of customers.
Maintenance work in PSTN Cabinet at Pokhara
Maintenance work in PSTN Cabinet at Pokhara
36 Annual Report 2017/18
Nepal Telecom also uses various media to make its customers aware of its services, tariff and offerings. All major news media including radio, TV and print media are used to spread the messages through advertisements and other means. Modern media such as social networking, web portals, online media etc are also being increasingly utilized to enhance visibility in the market. Company is continuously working to enhance effectiveness and relevance of its promotional activities.
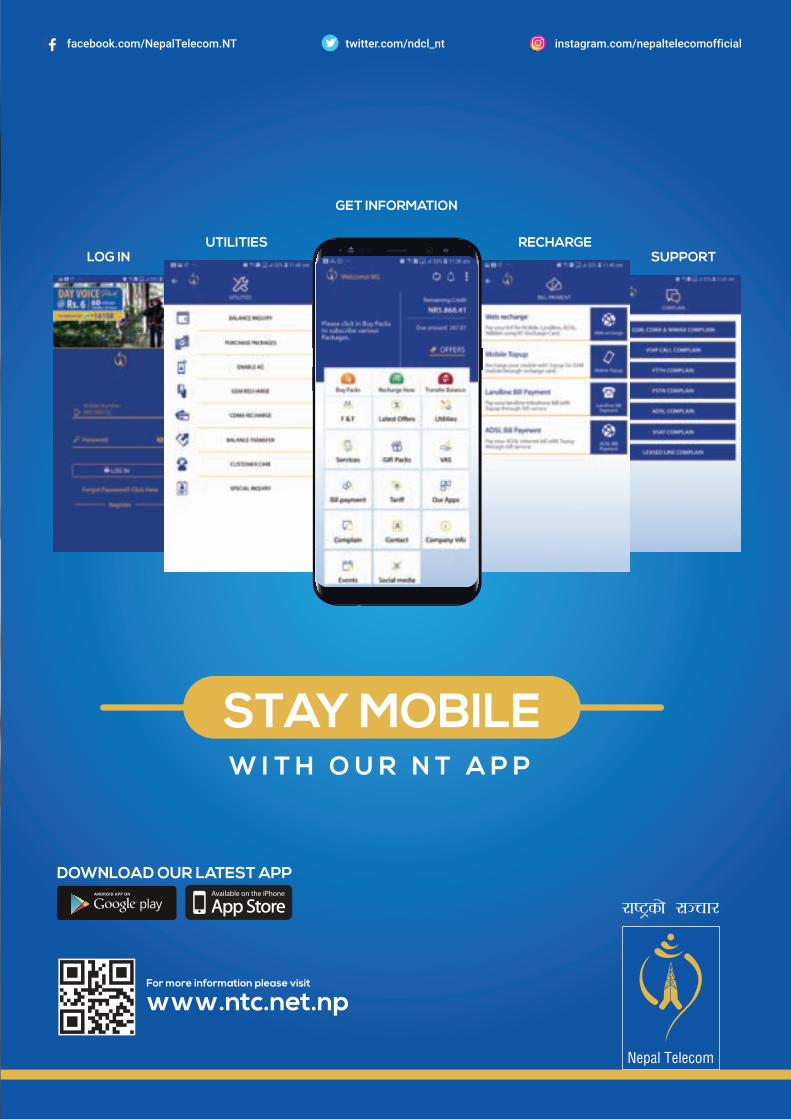
CUSTOMER RELATIONSHIPCustomers are at the foundation of the company’s business success. As a result, the company is working diligently to enhance customer engagement and make it easier for the customers to avail its services. Moreover, the company has been working continuously to enhance overall relationship and engagement with the customers. New tools have been deployed to enable customers to avail Nepal Telecom service without having to go to the company’s office and other outlets. For this, the channels such as SMS, web, USSD and mobile app have been developed and deployed. The dedicated customer complaint numbers such as 198 and 1498 are deployed for quick and convenient complaint lodging for various services of Nepal Telecom. Both these channels are empowered by the high-tech Customer Complaint Center (CCC) system deployed by the company. Similarly, 197 inquiry service has been effective in providing efficient inquiry service to customers across the nation.
INCOME SOURCESCompany’s various services including wired, wireless and value added services are the major sources of revenue. These include Voice, SMS, Internet, broadband and other value added and content-based services.
92.6 percent of the total revenue is from services and the remaining revenue is from other sources. Since an overwhelming majority of services are provided on prepaid credit-limit basis, the revenue risk for the company is minimal. To improve revenue stream and diversify income sources, the company has been investing in some projects of national pride such as Trishuli 3B, Upper Tamakoshi and Hydropower Investment and Development Company Limited (HIDCL). Faced with diminishing revenue from traditional services and continuous evolution of new services, reducing price and revenue per user of existing services and rapid evolution in technology, the company has taken up strategy of diversifying its investment and ensuring long term revenue sources. At the same time, the company is also making significant contribution in development of critical power sector in the country.
MAJOR TASKS Nepal Telecom puts high priority in developing and maintaining high quality telecom infrastructure in the country to provide reliable and quality services to customers across the country. Accordingly, the company has been continuously developing robust transmission network, mobile tower infrastructure and other infrastructure across the country. Similarly, parallel projects and activities are continued for the development of core networks, equipment and systems such as mobile network, fixed network, billing systems, enterprise resource management, customer relationship management and others. Regular training and motivational programs to enhance skill, efficiency and effectiveness of the workforce are also major activities for the company.
MAJOR RESOURCESMajor resources for the company include manpower, financial liquidity, countrywide physical infrastructure, equipment, systems, frequency spectrum etc.
Manpower is an essential resource for the company to run and manage its systems, develop and maintain infrastructure, manage customers, collect revenue, provide customer service and work with suppliers and business partners in various projects. Similarly, manpower is needed in accounting, financial management, procurement, project management and running the daily administration of the company. The company is working continuously to motivate the staff and enhance their overall productivity.
The financial liquidity in the company helps in conducting financial transactions smoothly. It also helps in making timely investment in development and expansion of services and thereby create more revenue sources. Healthy financial liquidity is critical in ensuring that the company can invest in various sectors without difficulty and thus create more avenues of revenue generation and business expansion.
The national network and service infrastructure is vital for making the services available to consumers across the country. The smooth operation of the services is the single most important factor to ensure continued customer satisfaction and uninterrupted revenue inflow for the company. Hence, continuous effort is put to make
37Annual Report 2017/18
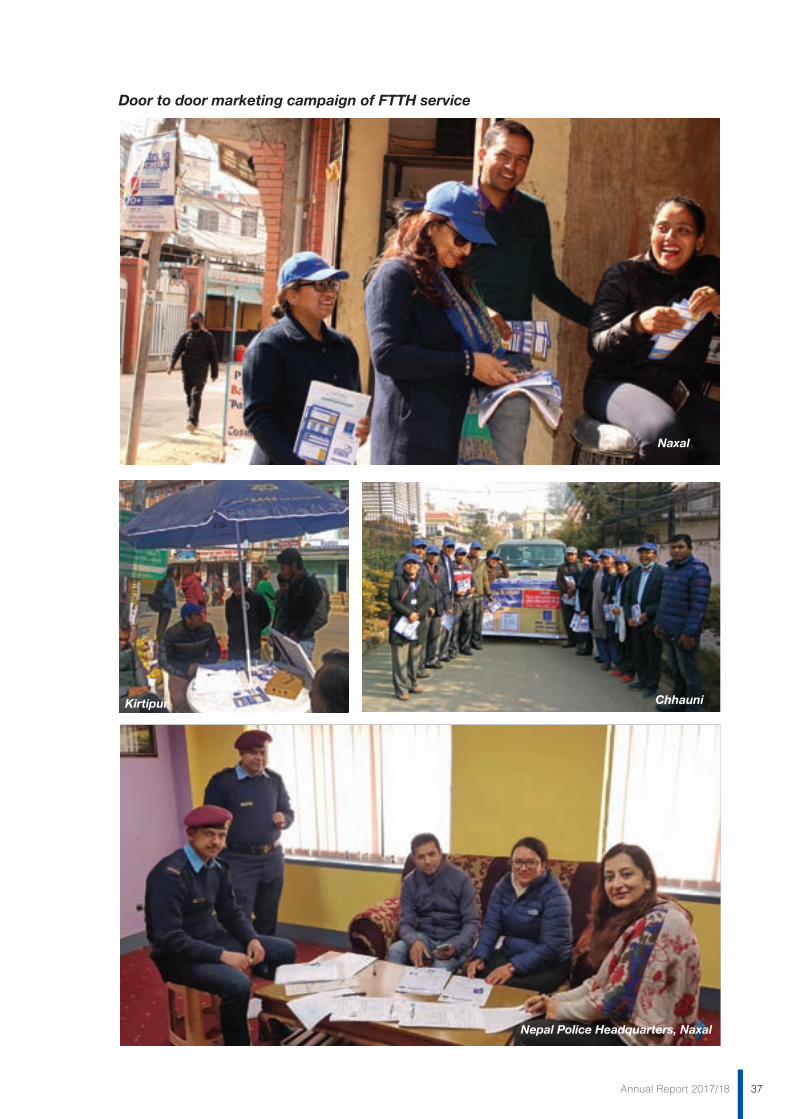
Door to door marketing campaign of FTTH service
Kirtipur Chhauni
Naxal
Nepal Police Headquarters, Naxal
38 Annual Report 2017/18
sure that the networks and infrastructures are properly and timely managed and maintained so that the service interruptions are minimized. The national network of branch offices and outlets is vital for this activity as well.
For the operation of wireless services and for the operation of wireless transmission network, frequency spectrum is needed. The various frequency bands obtained from the regulators for various purpose are also a vital resource for the company.
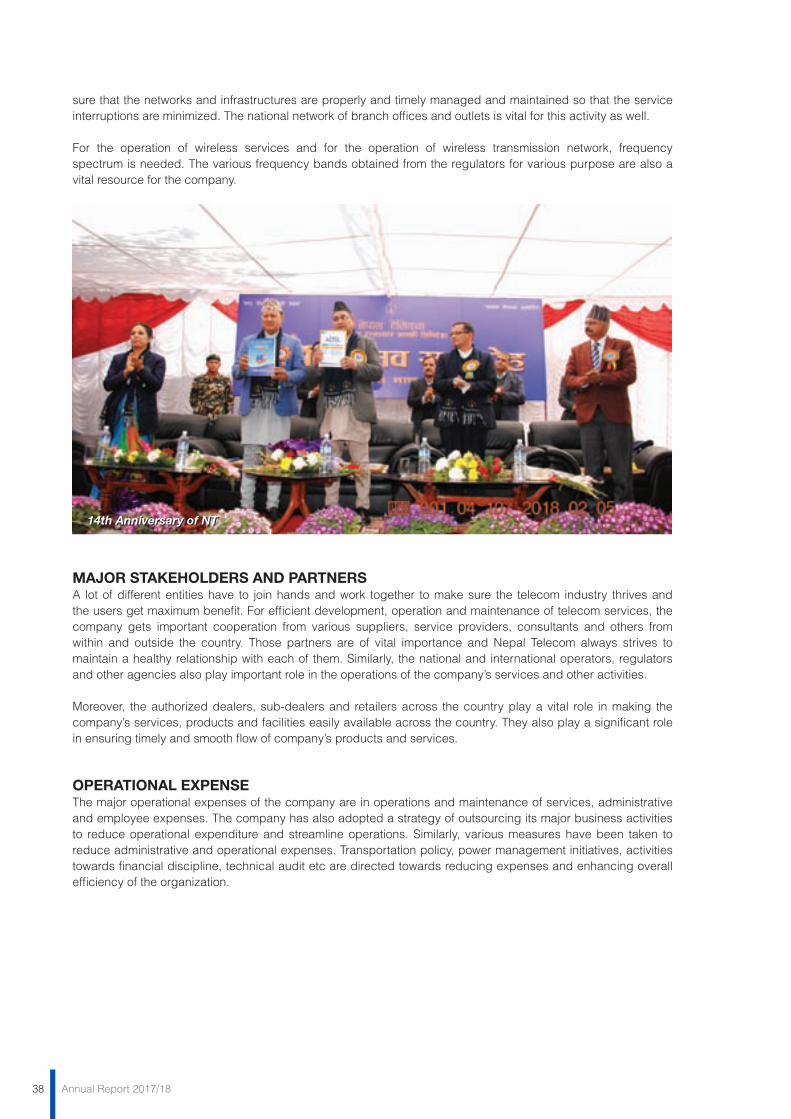
14th Anniversary of NT14th Anniversary of NT
MAJOR STAKEHOLDERS AND PARTNERS A lot of different entities have to join hands and work together to make sure the telecom industry thrives and the users get maximum benefit. For efficient development, operation and maintenance of telecom services, the company gets important cooperation from various suppliers, service providers, consultants and others from within and outside the country. Those partners are of vital importance and Nepal Telecom always strives to maintain a healthy relationship with each of them. Similarly, the national and international operators, regulators and other agencies also play important role in the operations of the company’s services and other activities.
Moreover, the authorized dealers, sub-dealers and retailers across the country play a vital role in making the company’s services, products and facilities easily available across the country. They also play a significant role in ensuring timely and smooth flow of company’s products and services.
OPERATIONAL EXPENSE The major operational expenses of the company are in operations and maintenance of services, administrative and employee expenses. The company has also adopted a strategy of outsourcing its major business activities to reduce operational expenditure and streamline operations. Similarly, various measures have been taken to reduce administrative and operational expenses. Transportation policy, power management initiatives, activities towards financial discipline, technical audit etc are directed towards reducing expenses and enhancing overall efficiency of the organization.

39Annual Report 2017/18
40 Annual Report 2017/18
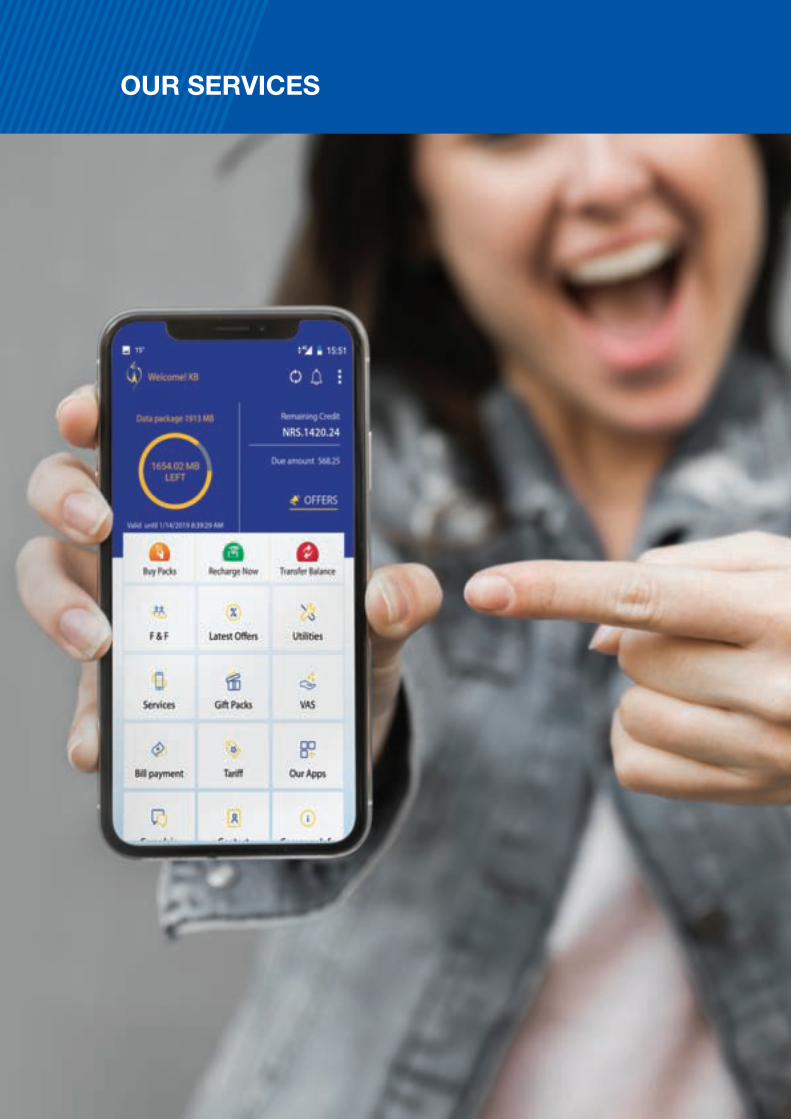
OUR SERVICES
41Annual Report 2017/18
42 Annual Report 2017/18
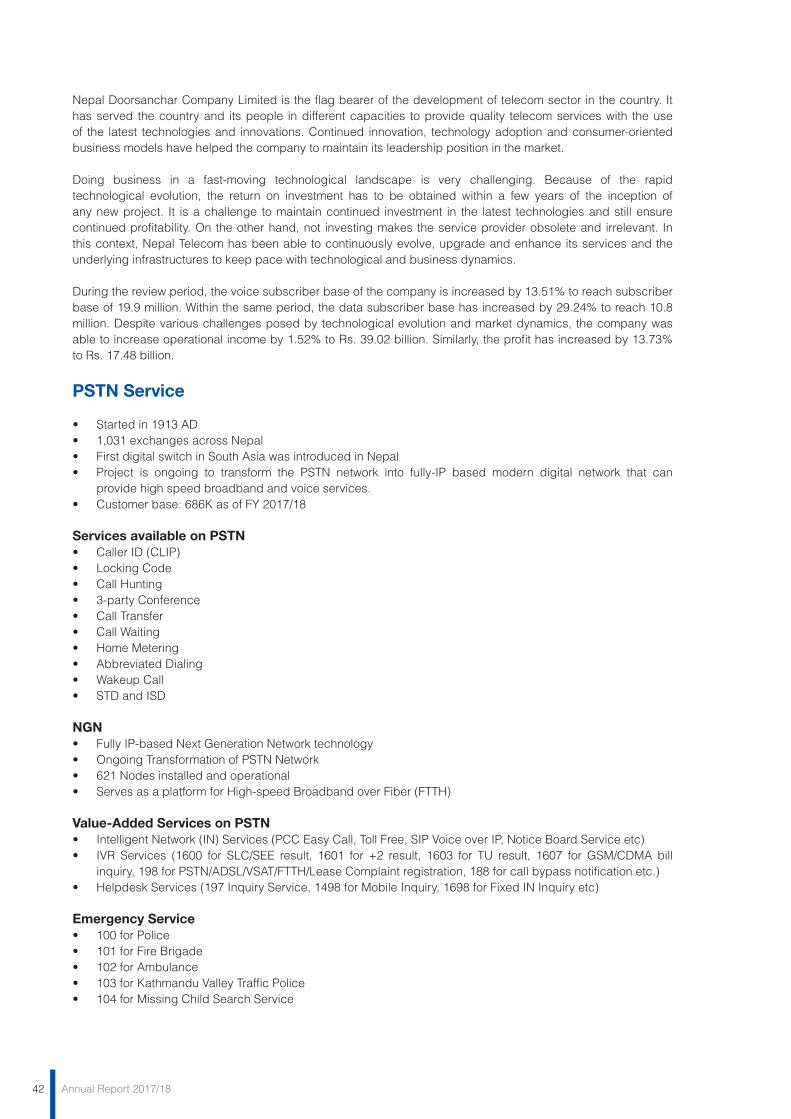
Nepal Doorsanchar Company Limited is the flag bearer of the development of telecom sector in the country. It has served the country and its people in different capacities to provide quality telecom services with the use of the latest technologies and innovations. Continued innovation, technology adoption and consumer-oriented business models have helped the company to maintain its leadership position in the market.
Doing business in a fast-moving technological landscape is very challenging. Because of the rapid technological evolution, the return on investment has to be obtained within a few years of the inception of any new project. It is a challenge to maintain continued investment in the latest technologies and still ensure continued profitability. On the other hand, not investing makes the service provider obsolete and irrelevant. In this context, Nepal Telecom has been able to continuously evolve, upgrade and enhance its services and the underlying infrastructures to keep pace with technological and business dynamics.
During the review period, the voice subscriber base of the company is increased by 13.51% to reach subscriber base of 19.9 million. Within the same period, the data subscriber base has increased by 29.24% to reach 10.8 million. Despite various challenges posed by technological evolution and market dynamics, the company was able to increase operational income by 1.52% to Rs. 39.02 billion. Similarly, the profit has increased by 13.73% to Rs. 17.48 billion.
PSTN Service
• Startedin1913AD• 1,031exchangesacrossNepal• FirstdigitalswitchinSouthAsiawasintroducedinNepal• Project is ongoing to transform the PSTN network into fully-IP based modern digital network that can
provide high speed broadband and voice services.• Customerbase:686KasofFY2017/18
Services available on PSTN• CallerID(CLIP)• LockingCode• CallHunting• 3-partyConference• CallTransfer• CallWaiting• HomeMetering• AbbreviatedDialing• WakeupCall• STDandISD
NGN • FullyIP-basedNextGenerationNetworktechnology• OngoingTransformationofPSTNNetwork• 621Nodesinstalledandoperational• ServesasaplatformforHigh-speedBroadbandoverFiber(FTTH)
Value-Added Services on PSTN• IntelligentNetwork(IN)Services(PCCEasyCall,TollFree,SIPVoiceoverIP,NoticeBoardServiceetc)• IVR Services (1600 for SLC/SEE result, 1601 for +2 result, 1603 for TU result, 1607 forGSM/CDMAbill
inquiry, 198 for PSTN/ADSL/VSAT/FTTH/Lease Complaint registration, 188 for call bypass notification etc.)• HelpdeskServices(197InquiryService,1498forMobileInquiry,1698forFixedINInquiryetc)
Emergency Service• 100forPolice• 101forFireBrigade• 102forAmbulance• 103forKathmanduValleyTrafficPolice• 104forMissingChildSearchService
43Annual Report 2017/18
Easyphone (IP Call) Service • BasedonSessionInitiationProtocol• EnablesvoicecommunicationoverInternet• UsesmobileorPCbasedsoftclient• Usefulwhiletravellingabroad• StandardSIPApponmobilecanbeused
Cheap International Calls over 1424 • UsedfromPSTN,GSM,CDMAnumbers.• UsedfromPCC,PCLaccounts• Callchargesmuchmoreeconomicalthanthestandard‘00’accesscodeforinternationalcalls
Notice Board Service • UsefultoproviderepetitivemessagestocallerscallingonaPSTNnumber• Usefulforcorporates,schools,collegesetc• Customerscanrecordtheirmessagesandstoreinthesystemtoplaybacktocallers• AvailableforallPSTNuserswithoutaddinganyequipmentorlicense
Advanced Free-phone Service (AFS) or Toll-free• Usedbycorporatestoencouragecustomers,potentialclientsandotherpeoplecallintothecorporatenumber.• Freeforthecaller.• Variousvalueaddedfeaturesandflexibilitiestomakethisserviceattractiveandusefulfordifferenttypesof
corporate users.
Mobile Service
• Largestcustomerbaseandmostwidespreadnetwork.• Startedwith2Gandnowexpandingfrom3Gnetworkto4G.• ConsistsofGSM,CDMAtechnologies• NationwidedatanetworkofGPRS,3G,EVDO• 4Genteringnextphaseofnationwideexpansion• Differenttypesofvalue-addedservices• Biggestrevenueearnerforcompany• TotalcustomerbaseinFY2017/18:20million
Mobile Value Added ServiceWithin the review period, the company focused its attention on continuation of existing value added services as well as introducing new ones. The airtime credit service is one of the major value added services started in this period. It is provided free of cost to GSM Prepaid users to make sure they can continue their call even after their balance becomes zero.
During this period, the Missed Call Alert (MCA) service was resumed after in-house development of the system. Earlier, the service was run in partnership with a VAS provider and was discontinued due to unavoidable circumstances.
NT Service found to be better in Service Quality Survey by NTAIn a detailed report published by Nepal Telecom Authority based on extensive drive tests, the mobile service quality of Nepal Telecom was found to be better than the competitors in terms of quality and coverage. The study was conducted between 11 and 25 Ashwin 2075 and included detailed drive test in 38 locations in Kathmandu. The tests were conducted in busy hours of morning and evening. The study analyzed quality indicators such as call success rate, grade of service, call setup time and data connection quality.
Internet Service
• StartedwithDialupin2000AD.• Comprisesofmobileaswellasfixedbroadbandservices.ExpansionofopticalbroadbandFTTHservice
and transformation of ADSL into FTTH is ongoing. • Company’s share indomesticBroadBand InternetServicemarket is46.34%basedon reportsofNepal
Telecommunications Authority (NTA,MIS Mansir 2075).• Totalcustomerbase:12.23million.
44 Annual Report 2017/18
Inter-operator and International Service Domestic Inter-operator connectivity• Ncell• Smart• UTL• NepalSatellite• CGCommunications
International inter-operator connectivity • Directandpop-basedinterconnections• NepalTelecomPOPinSingapore,HongKongandDoha
Trend of International Interconnection BusinessWith the rapid technological development in telecom equipment as well as bringing in state-of-the-art smartphones within the reach of the masses, the evolving trend of Over-The-Top (OTT) applications and changing user behavior, Telecom Industry worldwide is experiencing turmoil. Telcos worldwide is seeing a shift in the revenue pattern, with the revenue from the voice service gradually moving in to data service revenue. Nepal Telecom is also experiencing the same. Nepal Telecom is adapting to the changing dynamics and introducing more data-centric and other value-added services as per the changing user-behavior. In addition, Nepal Telecom is also adapting to the changing trend of fraudsters.
Nepal Telecom has been studying on newer avenues for business, through the current trend of operators worldwide and the changing user-behavior. With the understanding that content and data are the demand for today and the future, Nepal Telecom has initiated various new data and content services. One of such new ventures is the International Lease Service targeted for the enterprises, to connect them to some location overseas. Nepal Telecom started International Lease Service on November 1,2018 for Honxi Shivam Cement situated in Nawalparasi, in cooperation with China Telecom in China. Nepal Telecom is in process of providing other similar services in coordination with other partners. Similarly, NT has also been in process to implement new attractive Value Added Services based on content, as per the changed user behavior and the subsequent huge requirement.
Controlling Illegal Call Bypass • CoordinationwithCBI• RevenueVigilanceUnitformedtomonitorandcontrolfraud• Usingthelatestautomatedtechnologiestodetectandcontrolillegalcallbypass.• Useoftechnologieshasshownpositiveimpactonoverallstandingofinternationalinter-operatorbusiness
and revenue protection.
Enhancing Connectivity and Traffic Exchange with Neighboring CountriesWith the continued consolidation in the inter-operator relationships and timely review of tariff, there has been significant positive impact in traffic with neighboring countries. This has been beneficial to hundreds of thousands of users including Nepalese expats living and working in those countries.
Useful Information about NT Services
Services available over SMS Short Code
Service Syntax
Outstanding balance query Type “CB” and send to 1415
Data Volume query Type “VL” and send to 1415
Free Resource query Type “FR” and send to 1415
Night call Package (CDMA only) Type “Night” and send to 1415
Friends and Family (FNF) service subscription Type “FNFSUB*MDN” and send to 1415
Friends and Family (FNF) add memberNote: 1 MDN at a time
Type “FNFADD*and send to 1415
Friends and Family (FNF) modify memberNote : Maximum 5 MDN numbers
Type “FNFMOD*oldMDN*newMDN” and send to 1415 and send to 1415
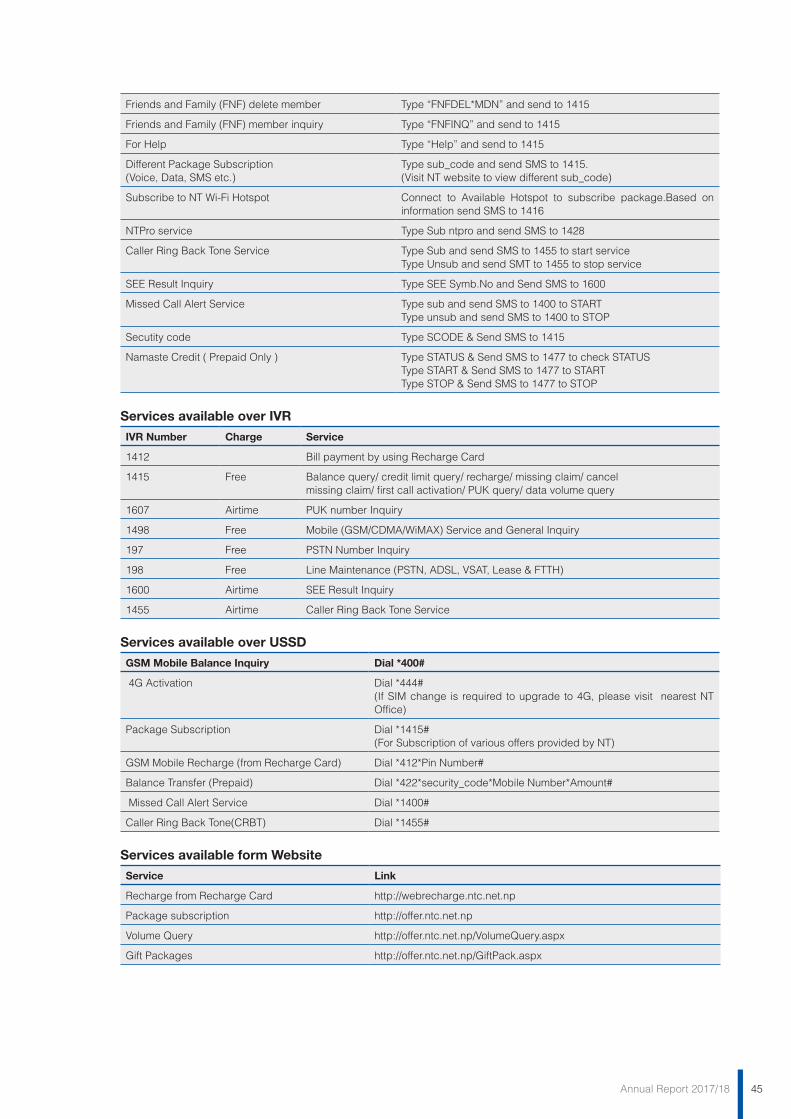
45Annual Report 2017/18
Friends and Family (FNF) delete member Type “FNFDEL*MDN” and send to 1415
Friends and Family (FNF) member inquiry Type “FNFINQ” and send to 1415
For Help Type “Help” and send to 1415
Different Package Subscription(Voice, Data, SMS etc.)
Type sub_code and send SMS to 1415. (Visit NT website to view different sub_code)
Subscribe to NT Wi-Fi Hotspot Connect to Available Hotspot to subscribe package.Based on information send SMS to 1416
NTPro service Type Sub ntpro and send SMS to 1428
Caller Ring Back Tone Service Type Sub and send SMS to 1455 to start serviceType Unsub and send SMT to 1455 to stop service
SEE Result Inquiry Type SEE Symb.No and Send SMS to 1600
Missed Call Alert Service Type sub and send SMS to 1400 to STARTType unsub and send SMS to 1400 to STOP
Secutity code Type SCODE & Send SMS to 1415
Namaste Credit ( Prepaid Only ) Type STATUS & Send SMS to 1477 to check STATUSType START & Send SMS to 1477 to STARTType STOP & Send SMS to 1477 to STOP
Services available over IVR
IVR Number Charge Service
1412 Bill payment by using Recharge Card
1415 Free Balance query/ credit limit query/ recharge/ missing claim/ cancelmissing claim/ first call activation/ PUK query/ data volume query
1607 Airtime PUK number Inquiry
1498 Free Mobile (GSM/CDMA/WiMAX) Service and General Inquiry
197 Free PSTN Number Inquiry
198 Free Line Maintenance (PSTN, ADSL, VSAT, Lease & FTTH)
1600 Airtime SEE Result Inquiry
1455 Airtime Caller Ring Back Tone Service
Services available over USSD
GSM Mobile Balance Inquiry Dial *400#
4G Activation Dial *444#(If SIM change is required to upgrade to 4G, please visit nearest NT Office)
Package Subscription Dial *1415#(For Subscription of various offers provided by NT)
GSM Mobile Recharge (from Recharge Card) Dial *412*Pin Number#
Balance Transfer (Prepaid) Dial *422*security_code*Mobile Number*Amount#
Missed Call Alert Service Dial *1400#
Caller Ring Back Tone(CRBT) Dial *1455#
Services available form Website
Service Link
Recharge from Recharge Card http://webrecharge.ntc.net.np
Package subscription http://offer.ntc.net.np
Volume Query http://offer.ntc.net.np/VolumeQuery.aspx
Gift Packages http://offer.ntc.net.np/GiftPack.aspx

46 Annual Report 2017/18
CORPORATE SOCIAL RESPONSIBILITY (CSR)
Maitighar-Tinkune Greenery maintained by NT
47Annual Report 2017/18
Our contribution for the betterment of society has positive impact on the organizational image and that leads to better business prospects and prosperity.
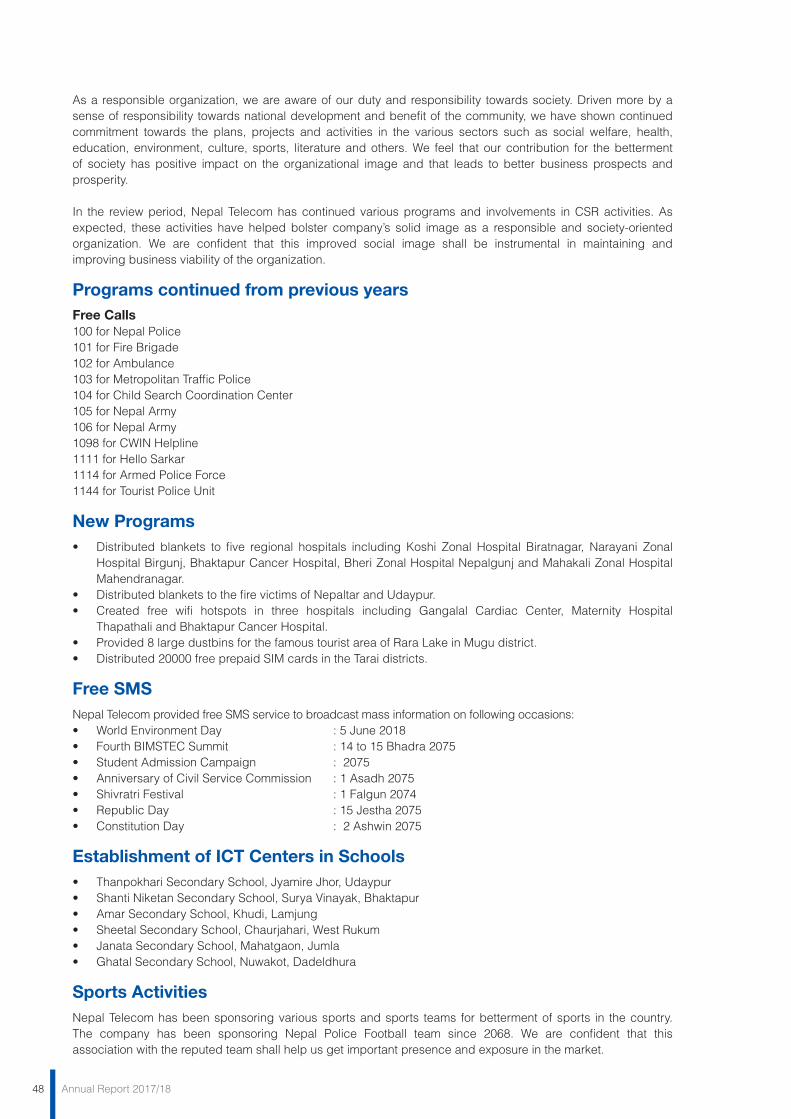
48 Annual Report 2017/18
As a responsible organization, we are aware of our duty and responsibility towards society. Driven more by a sense of responsibility towards national development and benefit of the community, we have shown continued commitment towards the plans, projects and activities in the various sectors such as social welfare, health, education, environment, culture, sports, literature and others. We feel that our contribution for the betterment of society has positive impact on the organizational image and that leads to better business prospects and prosperity.
In the review period, Nepal Telecom has continued various programs and involvements in CSR activities. As expected, these activities have helped bolster company’s solid image as a responsible and society-oriented organization. We are confident that this improved social image shall be instrumental in maintaining and improving business viability of the organization.
Programs continued from previous yearsFree Calls100 for Nepal Police101 for Fire Brigade102 for Ambulance103 for Metropolitan Traffic Police 104 for Child Search Coordination Center 105 for Nepal Army106 for Nepal Army1098 for CWIN Helpline1111 for Hello Sarkar1114 for Armed Police Force1144 for Tourist Police Unit
New Programs • Distributed blankets to five regional hospitals including Koshi Zonal Hospital Biratnagar, Narayani Zonal
HospitalBirgunj,BhaktapurCancerHospital,BheriZonalHospitalNepalgunjandMahakaliZonalHospitalMahendranagar.
• DistributedblanketstothefirevictimsofNepaltarandUdaypur.• Created free wifi hotspots in three hospitals including Gangalal Cardiac Center, Maternity Hospital
Thapathali and Bhaktapur Cancer Hospital. • Provided8largedustbinsforthefamoustouristareaofRaraLakeinMugudistrict.• Distributed20000freeprepaidSIMcardsintheTaraidistricts.
Free SMS Nepal Telecom provided free SMS service to broadcast mass information on following occasions:• WorldEnvironmentDay :5June2018• FourthBIMSTECSummit :14to15Bhadra2075• StudentAdmissionCampaign :2075• AnniversaryofCivilServiceCommission :1Asadh2075• ShivratriFestival :1Falgun2074• RepublicDay :15Jestha2075• ConstitutionDay :2Ashwin2075
Establishment of ICT Centers in Schools
• ThanpokhariSecondarySchool,JyamireJhor,Udaypur• ShantiNiketanSecondarySchool,SuryaVinayak,Bhaktapur• AmarSecondarySchool,Khudi,Lamjung• SheetalSecondarySchool,Chaurjahari,WestRukum• JanataSecondarySchool,Mahatgaon,Jumla• GhatalSecondarySchool,Nuwakot,Dadeldhura
Sports Activities Nepal Telecom has been sponsoring various sports and sports teams for betterment of sports in the country. The company has been sponsoring Nepal Police Football team since 2068. We are confident that this association with the reputed team shall help us get important presence and exposure in the market.

49Annual Report 2017/18
3rd Nepali Music Video Award sponsored by NT in Malaysia
Plantation at NT Head Office premise
NT Stall at CAN InfoTech
3rd Nepali Music Video Award sponsored by NT in Malaysia

50 Annual Report 2017/18
FINANCIAL STATEMENTS

51Annual Report 2017/18
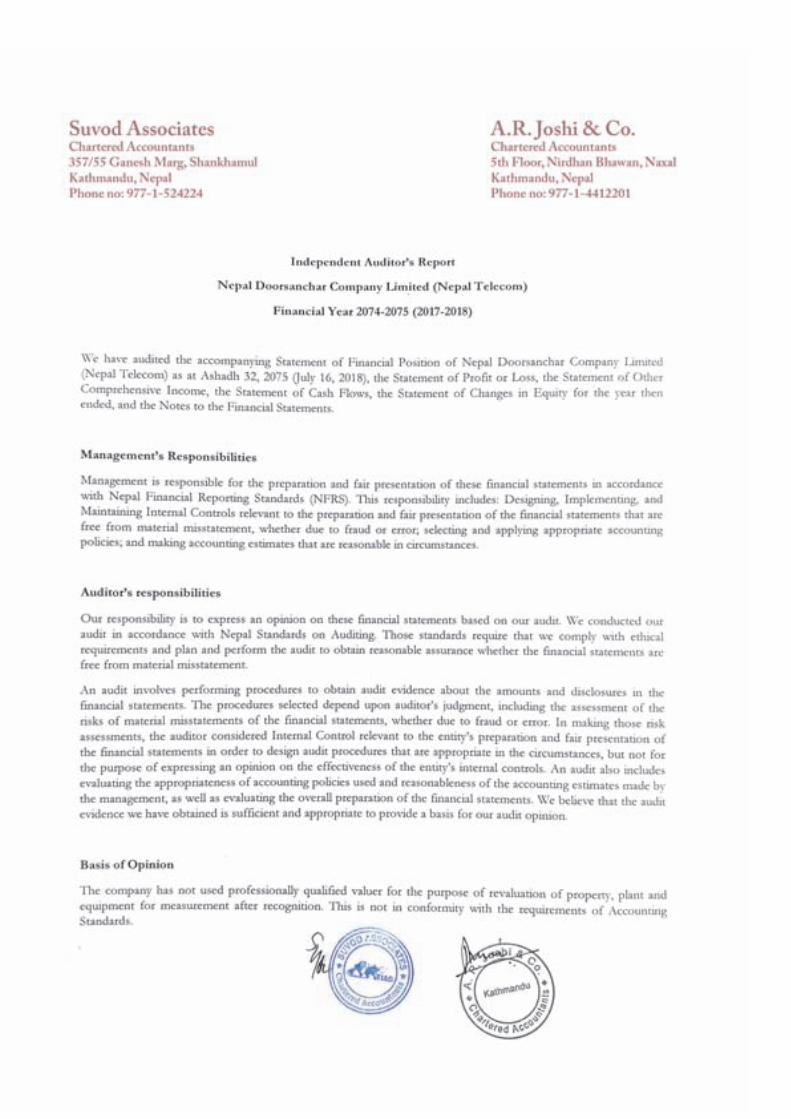
52 Annual Report 2017/18
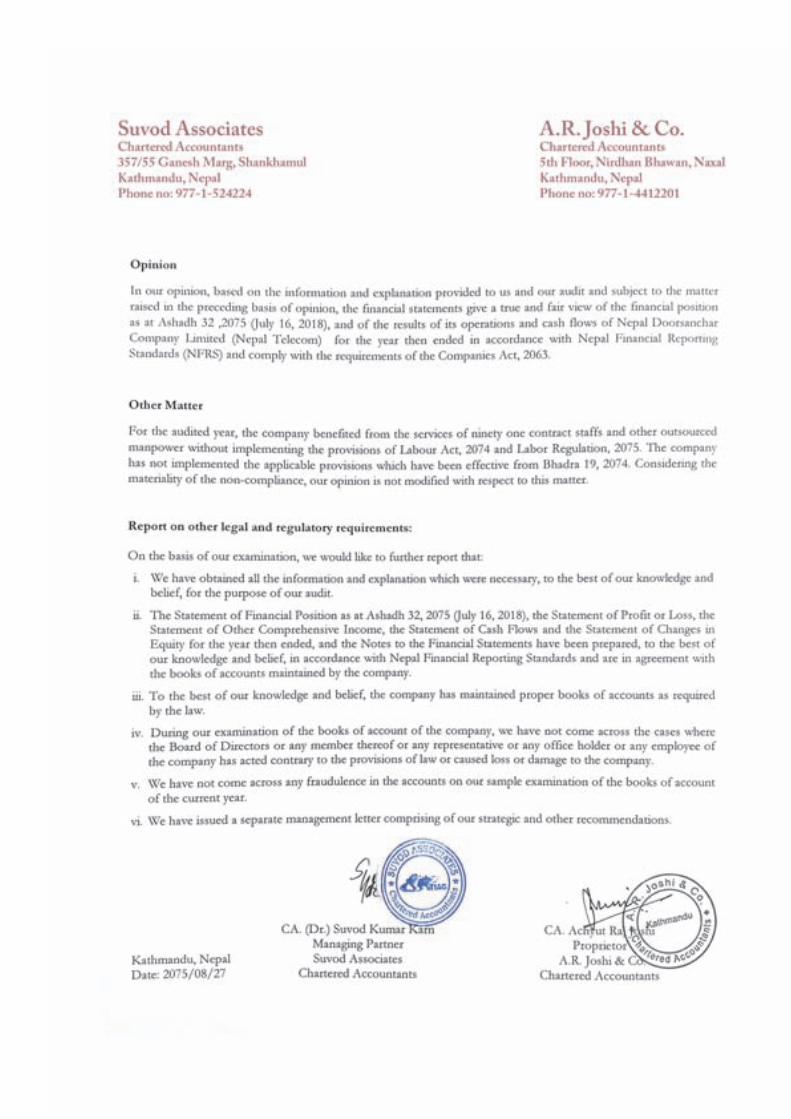
53Annual Report 2017/18
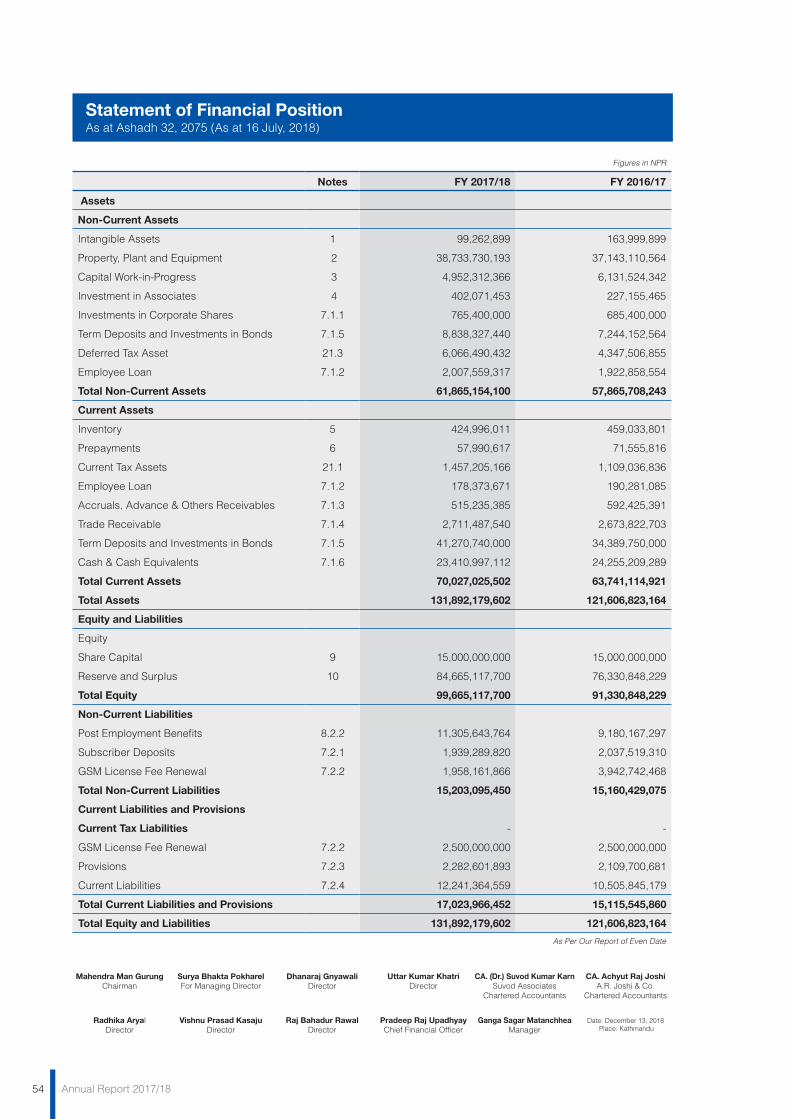
54 Annual Report 2017/18
Statement of Financial PositionAs at Ashadh 32, 2075 (As at 16 July, 2018)
Figures in NPR
Notes FY 2017/18 FY 2016/17
Assets
Non-Current Assets
Intangible Assets 1 99,262,899 163,999,899
Property, Plant and Equipment 2 38,733,730,193 37,143,110,564
Capital Work-in-Progress 3 4,952,312,366 6,131,524,342
Investment in Associates 4 402,071,453 227,155,465
Investments in Corporate Shares 7.1.1 765,400,000 685,400,000
Term Deposits and Investments in Bonds 7.1.5 8,838,327,440 7,244,152,564
Deferred Tax Asset 21.3 6,066,490,432 4,347,506,855
Employee Loan 7.1.2 2,007,559,317 1,922,858,554
Total Non-Current Assets 61,865,154,100 57,865,708,243
Current Assets
Inventory 5 424,996,011 459,033,801
Prepayments 6 57,990,617 71,555,816
Current Tax Assets 21.1 1,457,205,166 1,109,036,836
Employee Loan 7.1.2 178,373,671 190,281,085
Accruals, Advance & Others Receivables 7.1.3 515,235,385 592,425,391
Trade Receivable 7.1.4 2,711,487,540 2,673,822,703
Term Deposits and Investments in Bonds 7.1.5 41,270,740,000 34,389,750,000
Cash & Cash Equivalents 7.1.6 23,410,997,112 24,255,209,289
Total Current Assets 70,027,025,502 63,741,114,921
Total Assets 131,892,179,602 121,606,823,164
Equity and Liabilities
Equity
Share Capital 9 15,000,000,000 15,000,000,000
Reserve and Surplus 10 84,665,117,700 76,330,848,229
Total Equity 99,665,117,700 91,330,848,229
Non-Current Liabilities
Post Employment Benefits 8.2.2 11,305,643,764 9,180,167,297
Subscriber Deposits 7.2.1 1,939,289,820 2,037,519,310
GSM License Fee Renewal 7.2.2 1,958,161,866 3,942,742,468
Total Non-Current Liabilities 15,203,095,450 15,160,429,075
Current Liabilities and Provisions
Current Tax Liabilities - -
GSM License Fee Renewal 7.2.2 2,500,000,000 2,500,000,000
Provisions 7.2.3 2,282,601,893 2,109,700,681
Current Liabilities 7.2.4 12,241,364,559 10,505,845,179
Total Current Liabilities and Provisions 17,023,966,452 15,115,545,860
Total Equity and Liabilities 131,892,179,602 121,606,823,164
As Per Our Report of Even Date
Mahendra Man GurungChairman
Radhika AryalDirector
Raj Bahadur RawalDirector
Dhanaraj GnyawaliDirector
Pradeep Raj UpadhyayChief Financial Officer
Uttar Kumar KhatriDirector
Surya Bhakta PokharelFor Managing Director
Vishnu Prasad KasajuDirector
CA. (Dr.) Suvod Kumar KarnSuvod Associates
Chartered Accountants
Ganga Sagar MatanchheaManager
CA. Achyut Raj JoshiA.R. Joshi & Co.
Chartered Accountants
Date: December 13, 2018 Place: Kathmandu
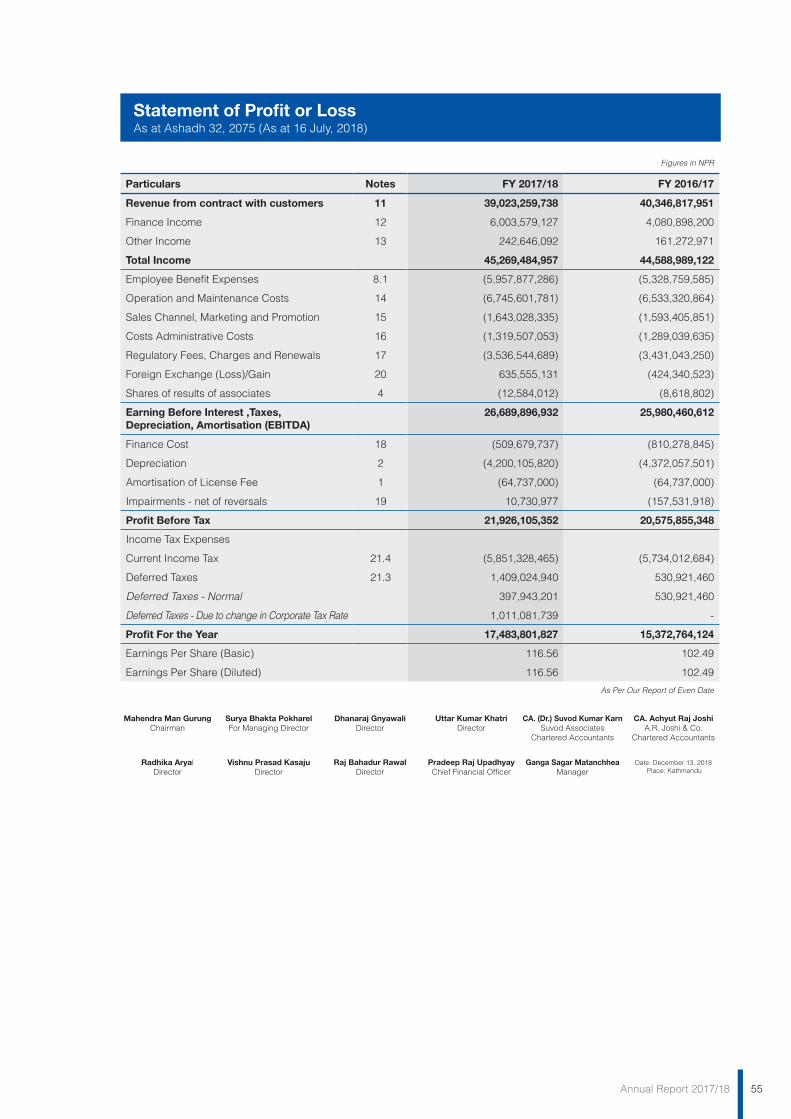
55Annual Report 2017/18
Statement of Profit or LossAs at Ashadh 32, 2075 (As at 16 July, 2018)
Figures in NPR
Particulars Notes FY 2017/18 FY 2016/17
Revenue from contract with customers 11 39,023,259,738 40,346,817,951
Finance Income 12 6,003,579,127 4,080,898,200
Other Income 13 242,646,092 161,272,971
Total Income 45,269,484,957 44,588,989,122
Employee Benefit Expenses 8.1 (5,957,877,286) (5,328,759,585)
Operation and Maintenance Costs 14 (6,745,601,781) (6,533,320,864)
Sales Channel, Marketing and Promotion 15 (1,643,028,335) (1,593,405,851)
Costs Administrative Costs 16 (1,319,507,053) (1,289,039,635)
Regulatory Fees, Charges and Renewals 17 (3,536,544,689) (3,431,043,250)
Foreign Exchange (Loss)/Gain 20 635,555,131 (424,340,523)
Shares of results of associates 4 (12,584,012) (8,618,802)
Earning Before Interest ,Taxes, Depreciation, Amortisation (EBITDA)
26,689,896,932 25,980,460,612
Finance Cost 18 (509,679,737) (810,278,845)
Depreciation 2 (4,200,105,820) (4,372,057,501)
Amortisation of License Fee 1 (64,737,000) (64,737,000)
Impairments - net of reversals 19 10,730,977 (157,531,918)
Profit Before Tax 21,926,105,352 20,575,855,348
Income Tax Expenses
Current Income Tax 21.4 (5,851,328,465) (5,734,012,684)
Deferred Taxes 21.3 1,409,024,940 530,921,460
Deferred Taxes - Normal 397,943,201 530,921,460
Deferred Taxes - Due to change in Corporate Tax Rate 1,011,081,739 -
Profit For the Year 17,483,801,827 15,372,764,124
Earnings Per Share (Basic) 116.56 102.49
Earnings Per Share (Diluted) 116.56 102.49
As Per Our Report of Even Date
Mahendra Man GurungChairman
Radhika AryalDirector
Raj Bahadur RawalDirector
Dhanaraj GnyawaliDirector
Pradeep Raj UpadhyayChief Financial Officer
Uttar Kumar KhatriDirector
Surya Bhakta PokharelFor Managing Director
Vishnu Prasad KasajuDirector
CA. (Dr.) Suvod Kumar KarnSuvod Associates
Chartered Accountants
Ganga Sagar MatanchheaManager
CA. Achyut Raj JoshiA.R. Joshi & Co.
Chartered Accountants
Date: December 13, 2018 Place: Kathmandu

56 Annual Report 2017/18
Statement of Other Comprehensive IncomeAs at Ashadh 32, 2075 (As at 16 July, 2018)
Figures in NPR
Particulars Notes FY 2017/18 FY 2016/17
Profit for the year 17,483,801,827 15,372,764,124
Other comprehensive income/(expense)
Items that may be reclassified subsequently to profit or loss
Exchange difference of translation of foreign operation
Cash Flow Hedges
Income Taxes relating to items that may be reclassified
Items that will not be reclassified subsequently to profit or loss
Gains on Property Revaluation 1 - 2,166,382,142
Investments in Equity Instruments (FV changes)
Remeasurements of defined retirement benefit plans of employees
8.2.2 (1,033,195,455) (1,837,383,106)
Shares of Other Comprehensive Income of Associates
Income Taxes relating to items that will not be reclassified
21.3 309,958,637 459,345,777
Total Comprehensive Income for the Year 16,760,565,009 16,161,108,937
As Per Our Report of Even Date
Mahendra Man GurungChairman
Radhika AryalDirector
Raj Bahadur RawalDirector
Dhanaraj GnyawaliDirector
Pradeep Raj UpadhyayChief Financial Officer
Uttar Kumar KhatriDirector
Surya Bhakta PokharelFor Managing Director
Vishnu Prasad KasajuDirector
CA. (Dr.) Suvod Kumar KarnSuvod Associates
Chartered Accountants
Ganga Sagar MatanchheaManager
CA. Achyut Raj JoshiA.R. Joshi & Co.
Chartered Accountants
Date: December 13, 2018 Place: Kathmandu
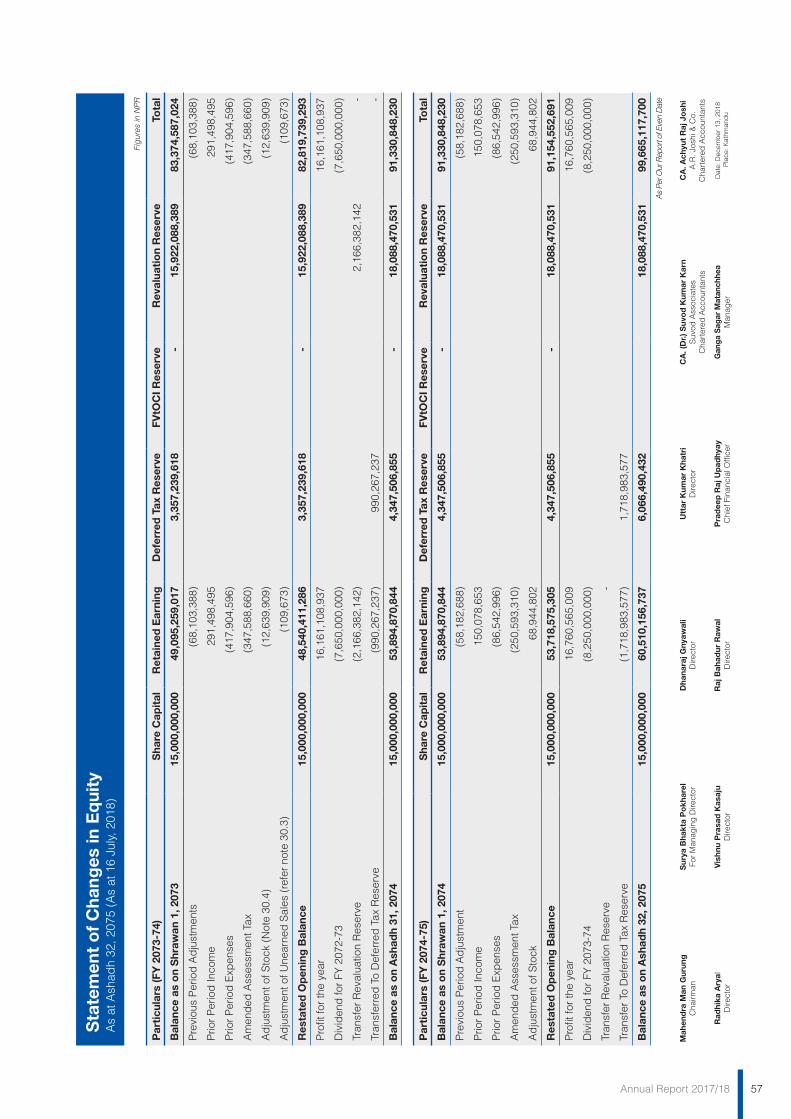
57Annual Report 2017/18
Sta
tem
ent
of
Cha
nges
in E
qui
ty
As
at A
shad
h 32
, 207
5 (A
s at
16
July
, 201
8)
Fig
ures
in N
PR
Par
ticu
lars
(FY
207
3-74
)S
hare
Cap
ital
Ret
aine
d E
arni
ngD
efer
red
Tax
Res
erve
FVtO
CI R
eser
veR
eval
uati
on
Res
erve
Tota
l
Bal
ance
as
on
Shr
awan
1, 2
073
15,0
00,0
00,0
0049
,095
,259
,017
3,35
7,23
9,61
8-
15,9
22,0
88,3
8983
,374
,587
,024
Pre
viou
s P
erio
d A
dju
stm
ents
(68,
103,
388)
(6
8,10
3,38
8)
Prio
r P
erio
d In
com
e29
1,49
8,49
529
1,49
8,49
5
Prio
r P
erio
d E
xpen
ses
(417
,904
,596
)(4
17,9
04,5
96)
Am
end
ed A
sses
smen
t Tax
(347
,588
,660
)(3
47,5
88,6
60)
Ad
just
men
t of S
tock
(N
ote
30.4
)(1
2,63
9,90
9)(1
2,63
9,90
9)
Ad
just
men
t of U
near
ned
Sal
es (
refe
r no
te 3
0.3)
(109
,673
)(1
09,6
73)
Res
tate
d O
pen
ing
Bal
ance
15,0
00,0
00,0
0048
,540
,411
,286
3,35
7,23
9,61
8-
15,9
22,0
88,3
8982
,819
,739
,293
Pro
fit fo
r th
e ye
ar16
,161
,108
,937
16,1
61,1
08,9
37
Div
iden
d fo
r FY
207
2-73
(7,6
50,0
00,0
00)
(7,6
50,0
00,0
00)
Tran
sfer
Rev
alua
tion
Res
erve
(2,1
66,3
82,1
42)
2,16
6,38
2,14
2-
Tran
sfer
red
To
Def
erre
d T
ax R
eser
ve(9
90,2
67,2
37)
990,
267,
237
-
Bal
ance
as
on
Ash
adh
31, 2
074
15,0
00,0
00,0
0053
,894
,870
,844
4,34
7,50
6,85
5-
18,0
88,4
70,5
3191
,330
,848
,230
Par
ticu
lars
(FY
207
4-75
)S
hare
Cap
ital
Ret
aine
d E
arni
ngD
efer
red
Tax
Res
erve
FVtO
CI R
eser
veR
eval
uati
on
Res
erve
Tota
l
Bal
ance
as
on
Shr
awan
1, 2
074
15,0
00,0
00,0
0053
,894
,870
,844
4,34
7,50
6,85
5-
18,0
88,4
70,5
3191
,330
,848
,230
Pre
viou
s P
erio
d A
dju
stm
ent
(58,
182,
688)
(5
8,18
2,68
8)
Prio
r P
erio
d In
com
e15
0,07
8,65
315
0,07
8,65
3
Prio
r P
erio
d E
xpen
ses
(86,
542,
996)
(86,
542,
996)
Am
end
ed A
sses
smen
t Tax
(250
,593
,310
)(2
50,5
93,3
10)
Ad
just
men
t of S
tock
68,9
44,8
0268
,944
,802
Res
tate
d O
pen
ing
Bal
ance
15,0
00,0
00,0
0053
,718
,575
,305
4,34
7,50
6,85
5-
18,0
88,4
70,5
3191
,154
,552
,691
Pro
fit fo
r th
e ye
ar16
,760
,565
,009
16,7
60,5
65,0
09
Div
iden
d fo
r FY
207
3-74
(8,2
50,0
00,0
00)
(8,2
50,0
00,0
00)
Tran
sfer
Rev
alua
tion
Res
erve
-
Tran
sfer
To
Def
erre
d T
ax R
eser
ve(1
,718
,983
,577
)1,
718,
983,
577
Bal
ance
as
on
Ash
adh
32, 2
075
15,0
00,0
00,0
0060
,510
,156
,737
6,06
6,49
0,43
218
,088
,470
,531
9
9,66
5,11
7,70
0
As
Per O
ur R
epor
t of E
ven
Dat
e
Mah
end
ra M
an G
urun
gC
hairm
an
Rad
hika
Ary
alD
irect
orR
aj B
ahad
ur R
awal
Dire
ctor
Dha
nara
j Gny
awal
iD
irect
or
Pra
dee
p R
aj U
pad
hyay
Chi
ef F
inan
cial
Offi
cer
Utt
ar K
umar
Kha
tri
Dire
ctor
Sur
ya B
hakt
a P
okh
arel
For
Man
agin
g D
irect
or
Vis
hnu
Pra
sad
Kas
aju
Dire
ctor
CA
. (D
r.) S
uvo
d K
umar
Kar
nS
uvod
Ass
ocia
tes
Cha
rter
ed A
ccou
ntan
ts
Gan
ga S
agar
Mat
anch
hea
Man
ager
CA
. Ach
yut
Raj
Jo
shi
A.R
. Jos
hi &
Co.
Cha
rter
ed A
ccou
ntan
ts
Dat
e: D
ecem
ber
13,
201
8 P
lace
: Kat
hman
du
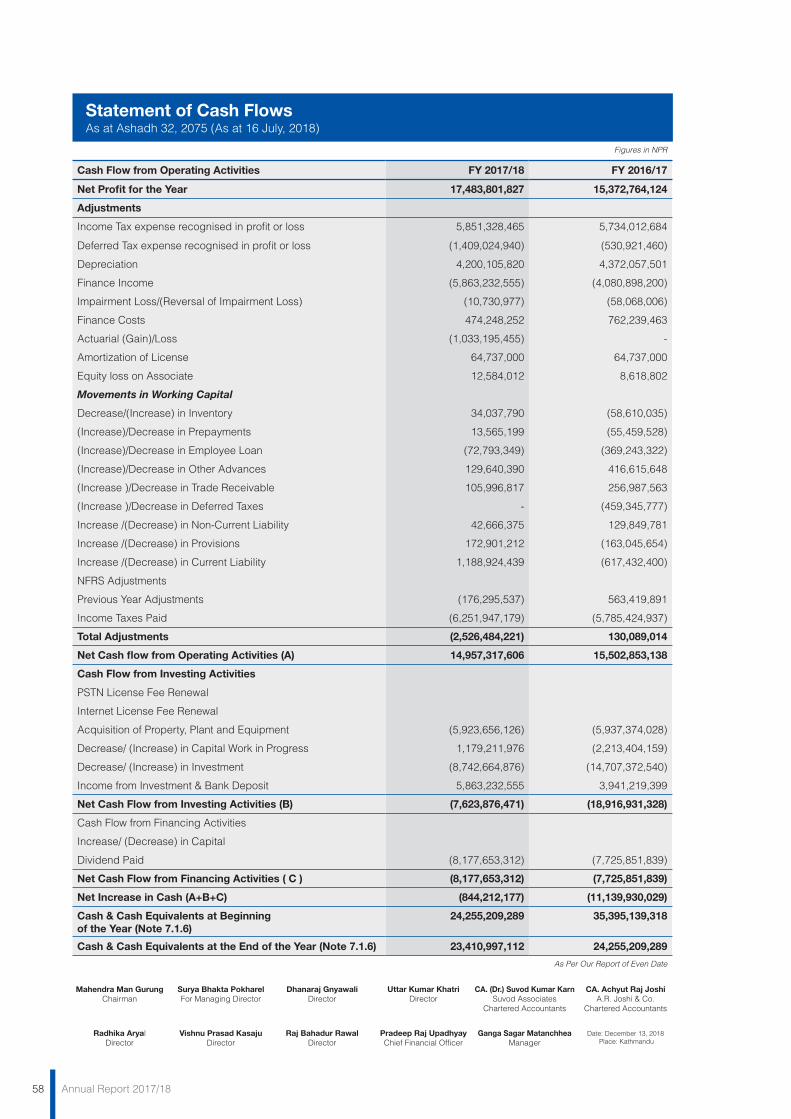
58 Annual Report 2017/18
Statement of Cash FlowsAs at Ashadh 32, 2075 (As at 16 July, 2018)
Figures in NPR
Cash Flow from Operating Activities FY 2017/18 FY 2016/17
Net Profit for the Year 17,483,801,827 15,372,764,124
Adjustments
Income Tax expense recognised in profit or loss 5,851,328,465 5,734,012,684
Deferred Tax expense recognised in profit or loss (1,409,024,940) (530,921,460)
Depreciation 4,200,105,820 4,372,057,501
Finance Income (5,863,232,555) (4,080,898,200)
Impairment Loss/(Reversal of Impairment Loss) (10,730,977) (58,068,006)
Finance Costs 474,248,252 762,239,463
Actuarial (Gain)/Loss (1,033,195,455) -
Amortization of License 64,737,000 64,737,000
Equity loss on Associate 12,584,012 8,618,802
Movements in Working Capital
Decrease/(Increase) in Inventory 34,037,790 (58,610,035)
(Increase)/Decrease in Prepayments 13,565,199 (55,459,528)
(Increase)/Decrease in Employee Loan (72,793,349) (369,243,322)
(Increase)/Decrease in Other Advances 129,640,390 416,615,648
(Increase )/Decrease in Trade Receivable 105,996,817 256,987,563
(Increase )/Decrease in Deferred Taxes - (459,345,777)
Increase /(Decrease) in Non-Current Liability 42,666,375 129,849,781
Increase /(Decrease) in Provisions 172,901,212 (163,045,654)
Increase /(Decrease) in Current Liability 1,188,924,439 (617,432,400)
NFRS Adjustments
Previous Year Adjustments (176,295,537) 563,419,891
Income Taxes Paid (6,251,947,179) (5,785,424,937)
Total Adjustments (2,526,484,221) 130,089,014
Net Cash flow from Operating Activities (A) 14,957,317,606 15,502,853,138
Cash Flow from Investing Activities
PSTN License Fee Renewal
Internet License Fee Renewal
Acquisition of Property, Plant and Equipment (5,923,656,126) (5,937,374,028)
Decrease/ (Increase) in Capital Work in Progress 1,179,211,976 (2,213,404,159)
Decrease/ (Increase) in Investment (8,742,664,876) (14,707,372,540)
Income from Investment & Bank Deposit 5,863,232,555 3,941,219,399
Net Cash Flow from Investing Activities (B) (7,623,876,471) (18,916,931,328)
Cash Flow from Financing Activities
Increase/ (Decrease) in Capital
Dividend Paid (8,177,653,312) (7,725,851,839)
Net Cash Flow from Financing Activities ( C ) (8,177,653,312) (7,725,851,839)
Net Increase in Cash (A+B+C) (844,212,177) (11,139,930,029)
Cash & Cash Equivalents at Beginning of the Year (Note 7.1.6)
24,255,209,289 35,395,139,318
Cash & Cash Equivalents at the End of the Year (Note 7.1.6) 23,410,997,112 24,255,209,289
As Per Our Report of Even Date
Mahendra Man GurungChairman
Radhika AryalDirector
Raj Bahadur RawalDirector
Dhanaraj GnyawaliDirector
Pradeep Raj UpadhyayChief Financial Officer
Uttar Kumar KhatriDirector
Surya Bhakta PokharelFor Managing Director
Vishnu Prasad KasajuDirector
CA. (Dr.) Suvod Kumar KarnSuvod Associates
Chartered Accountants
Ganga Sagar MatanchheaManager
CA. Achyut Raj JoshiA.R. Joshi & Co.
Chartered Accountants
Date: December 13, 2018 Place: Kathmandu
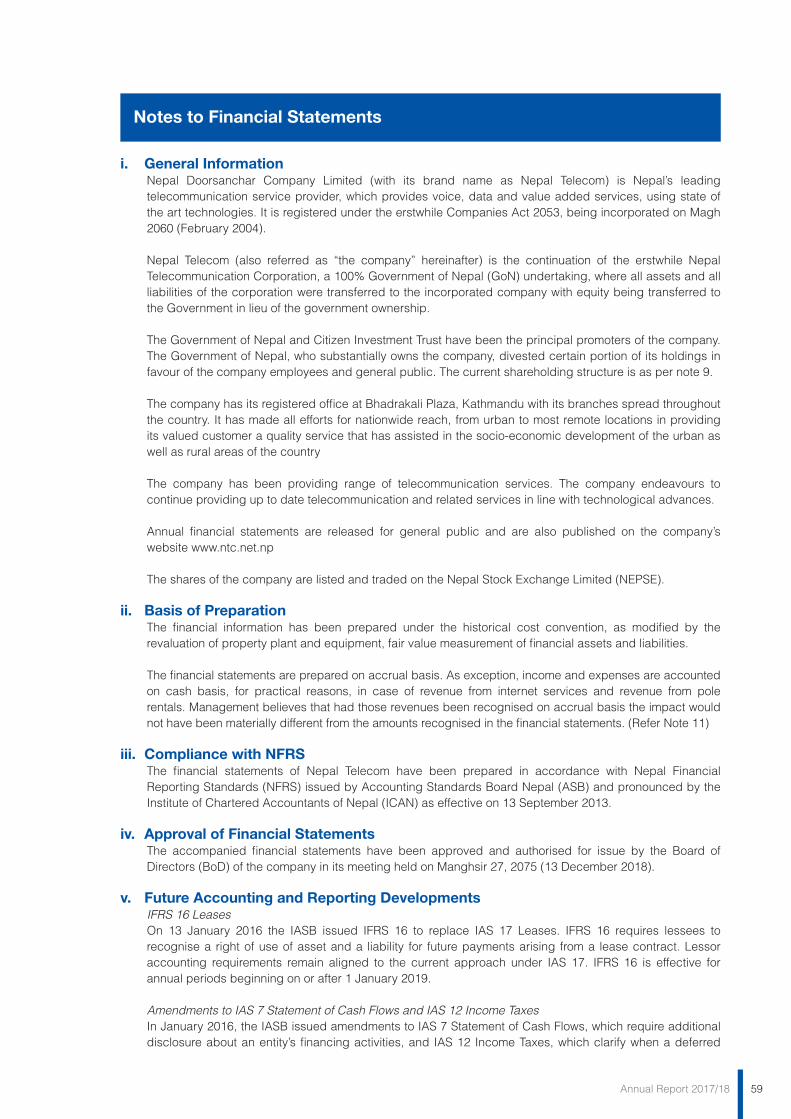
59Annual Report 2017/18
Notes to Financial Statements
i. General InformationNepal Doorsanchar Company Limited (with its brand name as Nepal Telecom) is Nepal’s leading telecommunication service provider, which provides voice, data and value added services, using state of the art technologies. It is registered under the erstwhile Companies Act 2053, being incorporated on Magh 2060 (February 2004).
Nepal Telecom (also referred as “the company” hereinafter) is the continuation of the erstwhile Nepal Telecommunication Corporation, a 100% Government of Nepal (GoN) undertaking, where all assets and all liabilities of the corporation were transferred to the incorporated company with equity being transferred to the Government in lieu of the government ownership.
The Government of Nepal and Citizen Investment Trust have been the principal promoters of the company. The Government of Nepal, who substantially owns the company, divested certain portion of its holdings in favour of the company employees and general public. The current shareholding structure is as per note 9.
The company has its registered office at Bhadrakali Plaza, Kathmandu with its branches spread throughout the country. It has made all efforts for nationwide reach, from urban to most remote locations in providing its valued customer a quality service that has assisted in the socio-economic development of the urban as well as rural areas of the country
The company has been providing range of telecommunication services. The company endeavours to continue providing up to date telecommunication and related services in line with technological advances.
Annual financial statements are released for general public and are also published on the company’s website www.ntc.net.np
The shares of the company are listed and traded on the Nepal Stock Exchange Limited (NEPSE).
ii. Basis of PreparationThe financial information has been prepared under the historical cost convention, as modified by the revaluation of property plant and equipment, fair value measurement of financial assets and liabilities.
The financial statements are prepared on accrual basis. As exception, income and expenses are accounted on cash basis, for practical reasons, in case of revenue from internet services and revenue from pole rentals. Management believes that had those revenues been recognised on accrual basis the impact would not have been materially different from the amounts recognised in the financial statements. (Refer Note 11)
iii. Compliance with NFRSThe financial statements of Nepal Telecom have been prepared in accordance with Nepal Financial Reporting Standards (NFRS) issued by Accounting Standards Board Nepal (ASB) and pronounced by the Institute of Chartered Accountants of Nepal (ICAN) as effective on 13 September 2013.
iv. Approval of Financial StatementsThe accompanied financial statements have been approved and authorised for issue by the Board of Directors (BoD) of the company in its meeting held on Manghsir 27, 2075 (13 December 2018).
v. Future Accounting and Reporting DevelopmentsIFRS 16 LeasesOn 13 January 2016 the IASB issued IFRS 16 to replace IAS 17 Leases. IFRS 16 requires lessees to recognise a right of use of asset and a liability for future payments arising from a lease contract. Lessor accounting requirements remain aligned to the current approach under IAS 17. IFRS 16 is effective for annual periods beginning on or after 1 January 2019.
Amendments to IAS 7 Statement of Cash Flows and IAS 12 Income TaxesIn January 2016, the IASB issued amendments to IAS 7 Statement of Cash Flows, which require additional disclosure about an entity’s financing activities, and IAS 12 Income Taxes, which clarify when a deferred
60 Annual Report 2017/18
tax asset should be recognised for unrealised losses. These revised requirements, are not expected to have a significant impact on the company.
vi. Presentation of Financial Statements1. The statement of profit or loss has been prepared using classification ‘by nature’ method. 2. The cash flows from operation within the statement of cash flows have been derived using the ‘indirect’
method.
vii. Presentation CurrencyThe financial statements have been presented in the nearest Nepalese Rupees (NPR). Nepalese Rupees (NPR) is the functional and presentation currency.
viii. Current and Non-Current DistinctionAssets and liabilities, wherever applicable, are bifurcated in current and non-current based on their respective maturity. Such information has been disclosed in respective notes as applicable.
ix. DiscountingWhen the realisation of assets and settlement of obligation is for more than one year, the company considers the discounting of such assets and liabilities where the impact is material. Various internal and external factors have been considered for determining the discount rate to be applied to the cash flows of the company. The appropriate discount rate is also used to determine the value in use for assessment of asset impairment as well.
Weighted Average Cost of Capital (WACC), with risk adjustment, is generally used in determining such rates. For this purpose, Capital Asset Pricing Model (CAPM) is generally used to determine the cost of equity. The fact that the company does not have any debt, weighted average cost of capital would in fact mean cost of equity only. Besides utilisation of CAPM model for expected rate of return would in turn require beta to be determined. Since the company is the only listed company, from the telecom industry, market beta may not give the appropriate picture of the movement of the market and the company’s rate of return. This is further evidenced by the near stable price of the company’s shares as against the volatile movement in the stock market.
Therefore, the risk adjusted dividend growth model has been used in determining the discount rate to be applied for preparation of the financial statements. The rate derived for discounting the liabilities is 8%.
The discount rate used for assets and receivable have been used as the average rate of earning from the company’s investment which is taken as 8%.
x. Accounting Polices, Critical Accounting Estimates and JudgementsAccounting PoliciesNFRS requires the company to adopt accounting policies that are most appropriate to the company’s circumstances. In determining and applying accounting policies, management is required to make judgements in respect of items where the choice of specific policy, accounting estimate or assumption to be followed could materially affect the company’s reported financial position, results or cash flows. These accounting policies are consistently applied by the company.
Specific accounting policies have been included in the specific section of the notes for each items of financial statements which requires disclosures of accounting policies or changes in accounting policies. Effect and nature of the changes, if any, have been disclosed.
Accounting Estimates and JudgementsThe preparation of the financial statements in accordance with NFRS requires the management to make judgements, estimates and assumptions in applying the accounting policies that affect the reported amounts of assets, liabilities, income and expenses, including contingencies and commitments. Due to the inherent uncertainty in making estimates, actual results reported in future periods may differ from those estimates. The estimates and the underlying assumptions are reviewed on on-going basis based on historical experience and other factors, including expectations of future events that are believed to be reasonable under the circumstances. Revision to accounting estimates are recognised in the period in which the estimates are revised, if the revision affects only that period; they are recognised in the period of revision and the future periods if the revision affects both current and future periods.
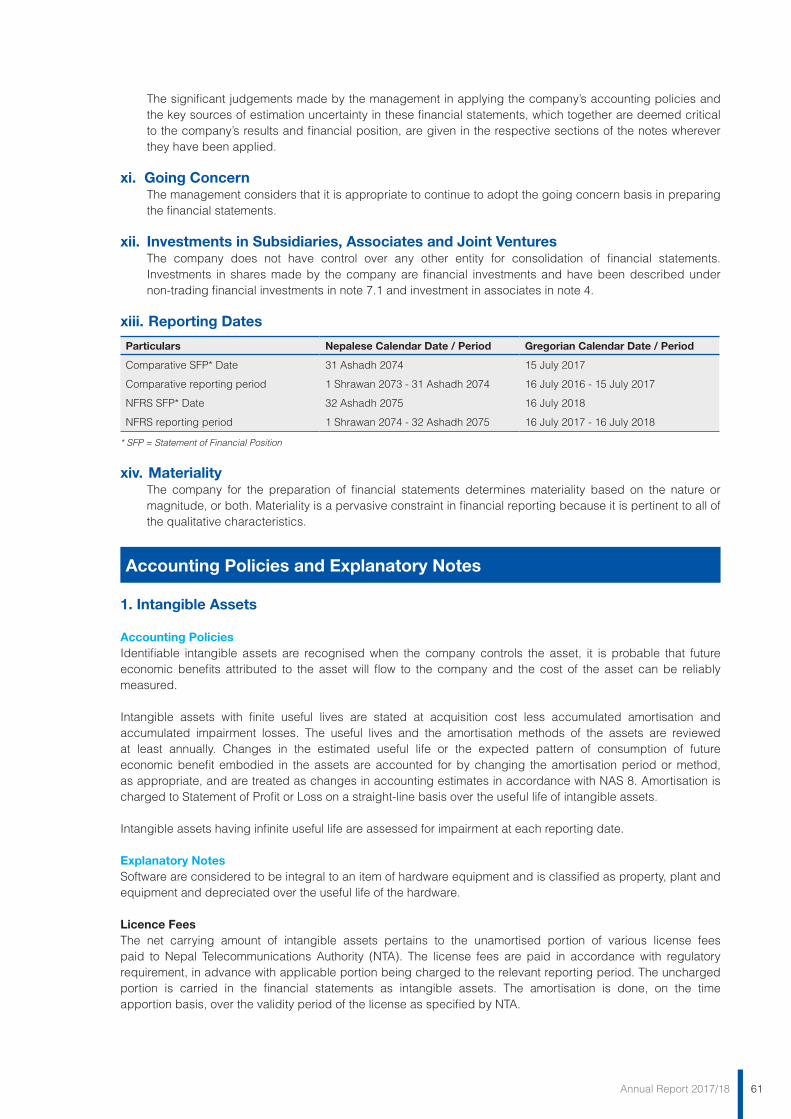
61Annual Report 2017/18
The significant judgements made by the management in applying the company’s accounting policies and the key sources of estimation uncertainty in these financial statements, which together are deemed critical to the company’s results and financial position, are given in the respective sections of the notes wherever they have been applied.
xi. Going ConcernThe management considers that it is appropriate to continue to adopt the going concern basis in preparing the financial statements.
xii. Investments in Subsidiaries, Associates and Joint VenturesThe company does not have control over any other entity for consolidation of financial statements. Investments in shares made by the company are financial investments and have been described under non-trading financial investments in note 7.1 and investment in associates in note 4.
xiii. Reporting Dates
Particulars Nepalese Calendar Date / Period Gregorian Calendar Date / Period
Comparative SFP* Date 31 Ashadh 2074 15 July 2017
Comparative reporting period 1 Shrawan 2073 - 31 Ashadh 2074 16 July 2016 - 15 July 2017
NFRS SFP* Date 32 Ashadh 2075 16 July 2018
NFRS reporting period 1 Shrawan 2074 - 32 Ashadh 2075 16 July 2017 - 16 July 2018
* SFP = Statement of Financial Position
xiv. MaterialityThe company for the preparation of financial statements determines materiality based on the nature or magnitude, or both. Materiality is a pervasive constraint in financial reporting because it is pertinent to all of the qualitative characteristics.
Accounting Policies and Explanatory Notes 1. Intangible Assets
Accounting PoliciesIdentifiable intangible assets are recognised when the company controls the asset, it is probable that future economic benefits attributed to the asset will flow to the company and the cost of the asset can be reliably measured.
Intangible assets with finite useful lives are stated at acquisition cost less accumulated amortisation and accumulated impairment losses. The useful lives and the amortisation methods of the assets are reviewed at least annually. Changes in the estimated useful life or the expected pattern of consumption of future economic benefit embodied in the assets are accounted for by changing the amortisation period or method, as appropriate, and are treated as changes in accounting estimates in accordance with NAS 8. Amortisation is charged to Statement of Profit or Loss on a straight-line basis over the useful life of intangible assets.
Intangible assets having infinite useful life are assessed for impairment at each reporting date.
Explanatory NotesSoftware are considered to be integral to an item of hardware equipment and is classified as property, plant and equipment and depreciated over the useful life of the hardware.
Licence FeesThe net carrying amount of intangible assets pertains to the unamortised portion of various license fees paid to Nepal Telecommunications Authority (NTA). The license fees are paid in accordance with regulatory requirement, in advance with applicable portion being charged to the relevant reporting period. The uncharged portion is carried in the financial statements as intangible assets. The amortisation is done, on the time apportion basis, over the validity period of the license as specified by NTA.
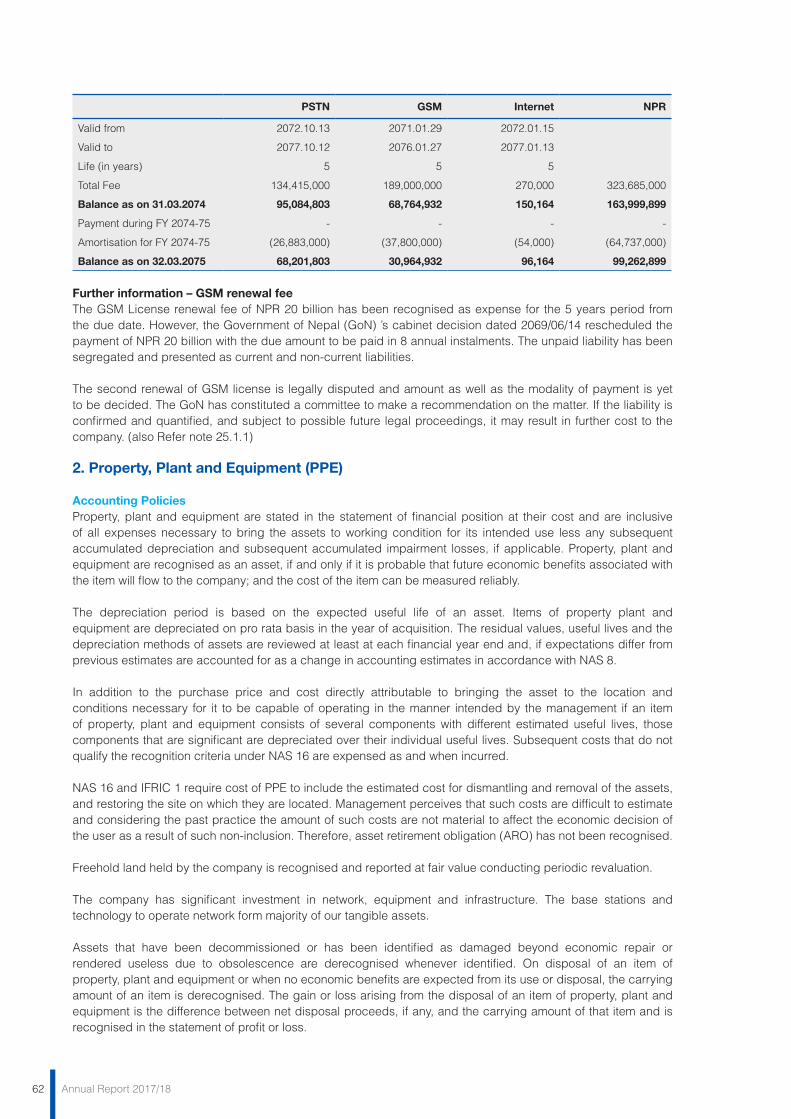
62 Annual Report 2017/18
PSTN GSM Internet NPR
Valid from 2072.10.13 2071.01.29 2072.01.15
Valid to 2077.10.12 2076.01.27 2077.01.13
Life (in years) 5 5 5
Total Fee 134,415,000 189,000,000 270,000 323,685,000
Balance as on 31.03.2074 95,084,803 68,764,932 150,164 163,999,899
Payment during FY 2074-75 - - - -
Amortisation for FY 2074-75 (26,883,000) (37,800,000) (54,000) (64,737,000)
Balance as on 32.03.2075 68,201,803 30,964,932 96,164 99,262,899
Further information – GSM renewal feeThe GSM License renewal fee of NPR 20 billion has been recognised as expense for the 5 years period from the due date. However, the Government of Nepal (GoN) ’s cabinet decision dated 2069/06/14 rescheduled the payment of NPR 20 billion with the due amount to be paid in 8 annual instalments. The unpaid liability has been segregated and presented as current and non-current liabilities.
The second renewal of GSM license is legally disputed and amount as well as the modality of payment is yet to be decided. The GoN has constituted a committee to make a recommendation on the matter. If the liability is confirmed and quantified, and subject to possible future legal proceedings, it may result in further cost to the company. (also Refer note 25.1.1)
2. Property, Plant and Equipment (PPE)
Accounting Policies Property, plant and equipment are stated in the statement of financial position at their cost and are inclusive of all expenses necessary to bring the assets to working condition for its intended use less any subsequent accumulated depreciation and subsequent accumulated impairment losses, if applicable. Property, plant and equipment are recognised as an asset, if and only if it is probable that future economic benefits associated with the item will flow to the company; and the cost of the item can be measured reliably.
The depreciation period is based on the expected useful life of an asset. Items of property plant and equipment are depreciated on pro rata basis in the year of acquisition. The residual values, useful lives and the depreciation methods of assets are reviewed at least at each financial year end and, if expectations differ from previous estimates are accounted for as a change in accounting estimates in accordance with NAS 8.
In addition to the purchase price and cost directly attributable to bringing the asset to the location and conditions necessary for it to be capable of operating in the manner intended by the management if an item of property, plant and equipment consists of several components with different estimated useful lives, those components that are significant are depreciated over their individual useful lives. Subsequent costs that do not qualify the recognition criteria under NAS 16 are expensed as and when incurred.
NAS 16 and IFRIC 1 require cost of PPE to include the estimated cost for dismantling and removal of the assets, and restoring the site on which they are located. Management perceives that such costs are difficult to estimate and considering the past practice the amount of such costs are not material to affect the economic decision of the user as a result of such non-inclusion. Therefore, asset retirement obligation (ARO) has not been recognised.
Freehold land held by the company is recognised and reported at fair value conducting periodic revaluation.
The company has significant investment in network, equipment and infrastructure. The base stations and technology to operate network form majority of our tangible assets.
Assets that have been decommissioned or has been identified as damaged beyond economic repair or rendered useless due to obsolescence are derecognised whenever identified. On disposal of an item of property, plant and equipment or when no economic benefits are expected from its use or disposal, the carrying amount of an item is derecognised. The gain or loss arising from the disposal of an item of property, plant and equipment is the difference between net disposal proceeds, if any, and the carrying amount of that item and is recognised in the statement of profit or loss.
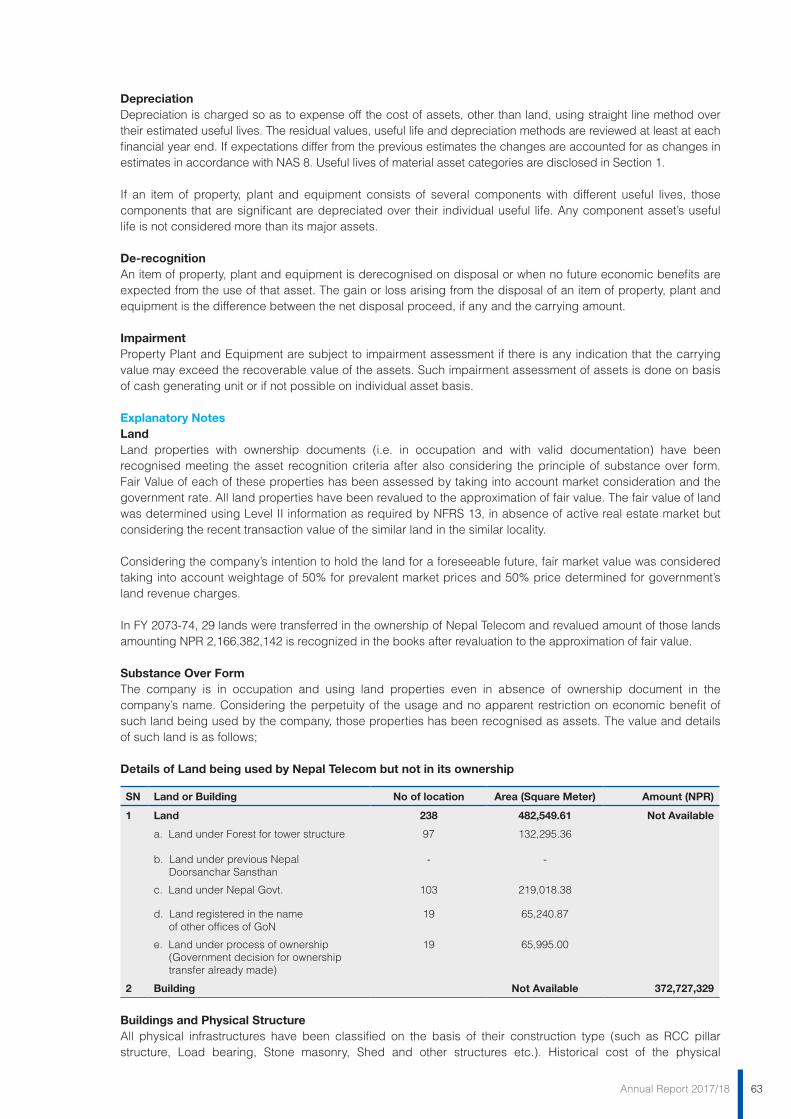
63Annual Report 2017/18
DepreciationDepreciation is charged so as to expense off the cost of assets, other than land, using straight line method over their estimated useful lives. The residual values, useful life and depreciation methods are reviewed at least at each financial year end. If expectations differ from the previous estimates the changes are accounted for as changes in estimates in accordance with NAS 8. Useful lives of material asset categories are disclosed in Section 1.
If an item of property, plant and equipment consists of several components with different useful lives, those components that are significant are depreciated over their individual useful life. Any component asset’s useful life is not considered more than its major assets.
De-recognitionAn item of property, plant and equipment is derecognised on disposal or when no future economic benefits are expected from the use of that asset. The gain or loss arising from the disposal of an item of property, plant and equipment is the difference between the net disposal proceed, if any and the carrying amount.
ImpairmentProperty Plant and Equipment are subject to impairment assessment if there is any indication that the carrying value may exceed the recoverable value of the assets. Such impairment assessment of assets is done on basis of cash generating unit or if not possible on individual asset basis.
Explanatory Notes LandLand properties with ownership documents (i.e. in occupation and with valid documentation) have been recognised meeting the asset recognition criteria after also considering the principle of substance over form. Fair Value of each of these properties has been assessed by taking into account market consideration and the government rate. All land properties have been revalued to the approximation of fair value. The fair value of land was determined using Level II information as required by NFRS 13, in absence of active real estate market but considering the recent transaction value of the similar land in the similar locality.
Considering the company’s intention to hold the land for a foreseeable future, fair market value was considered taking into account weightage of 50% for prevalent market prices and 50% price determined for government’s land revenue charges.
In FY 2073-74, 29 lands were transferred in the ownership of Nepal Telecom and revalued amount of those lands amounting NPR 2,166,382,142 is recognized in the books after revaluation to the approximation of fair value.
Substance Over FormThe company is in occupation and using land properties even in absence of ownership document in the company’s name. Considering the perpetuity of the usage and no apparent restriction on economic benefit of such land being used by the company, those properties has been recognised as assets. The value and details of such land is as follows;
Details of Land being used by Nepal Telecom but not in its ownership
SN Land or Building No of location Area (Square Meter) Amount (NPR)
1 Land 238 482,549.61 Not Available
a. Land under Forest for tower structure 97 132,295.36
b. Land under previous Nepal Doorsanchar Sansthan
- -
c. Land under Nepal Govt. 103 219,018.38
d. Land registered in the name of other offices of GoN
19 65,240.87
e. Land under process of ownership (Government decision for ownership transfer already made)
19 65,995.00
2 Building Not Available 372,727,329
Buildings and Physical StructureAll physical infrastructures have been classified on the basis of their construction type (such as RCC pillar structure, Load bearing, Stone masonry, Shed and other structures etc.). Historical cost of the physical
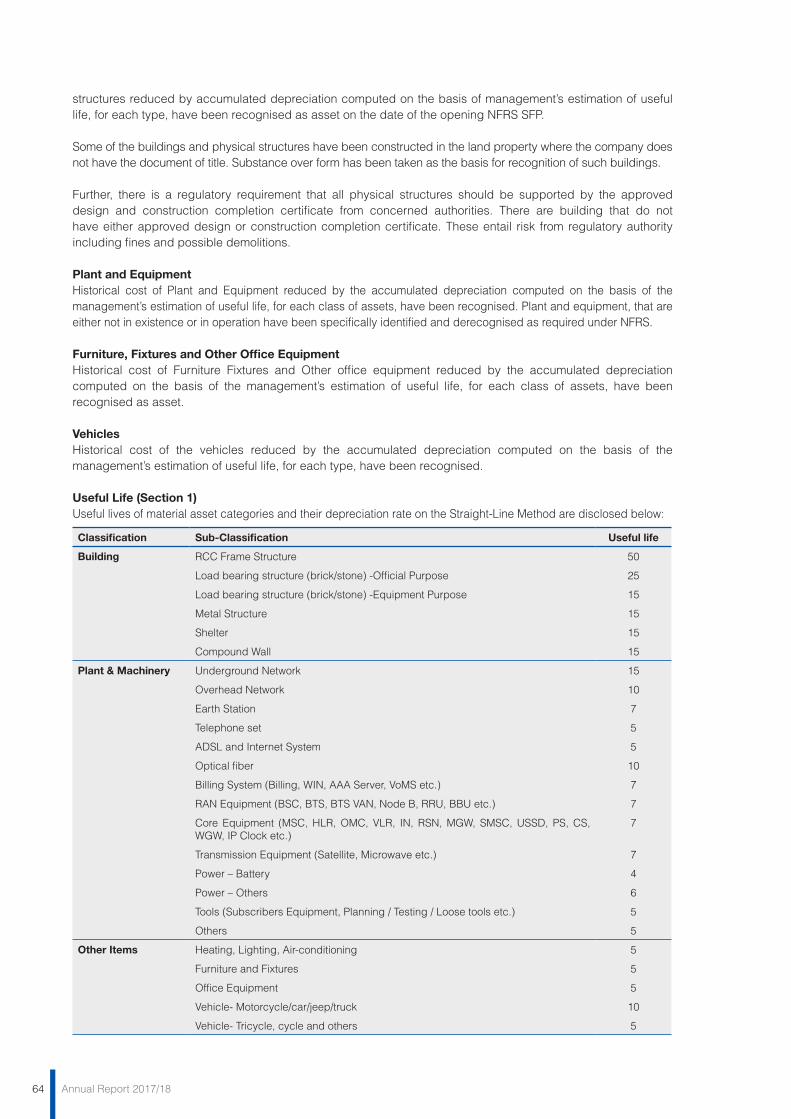
64 Annual Report 2017/18
structures reduced by accumulated depreciation computed on the basis of management’s estimation of useful life, for each type, have been recognised as asset on the date of the opening NFRS SFP.
Some of the buildings and physical structures have been constructed in the land property where the company does not have the document of title. Substance over form has been taken as the basis for recognition of such buildings.
Further, there is a regulatory requirement that all physical structures should be supported by the approved design and construction completion certificate from concerned authorities. There are building that do not have either approved design or construction completion certificate. These entail risk from regulatory authority including fines and possible demolitions.
Plant and EquipmentHistorical cost of Plant and Equipment reduced by the accumulated depreciation computed on the basis of the management’s estimation of useful life, for each class of assets, have been recognised. Plant and equipment, that are either not in existence or in operation have been specifically identified and derecognised as required under NFRS.
Furniture, Fixtures and Other Office EquipmentHistorical cost of Furniture Fixtures and Other office equipment reduced by the accumulated depreciation computed on the basis of the management’s estimation of useful life, for each class of assets, have been recognised as asset.
VehiclesHistorical cost of the vehicles reduced by the accumulated depreciation computed on the basis of the management’s estimation of useful life, for each type, have been recognised.
Useful Life (Section 1)Useful lives of material asset categories and their depreciation rate on the Straight-Line Method are disclosed below:
Classification Sub-Classification Useful life
Building RCC Frame Structure 50
Load bearing structure (brick/stone) -Official Purpose 25
Load bearing structure (brick/stone) -Equipment Purpose 15
Metal Structure 15
Shelter 15
Compound Wall 15
Plant & Machinery Underground Network 15
Overhead Network 10
Earth Station 7
Telephone set 5
ADSL and Internet System 5
Optical fiber 10
Billing System (Billing, WIN, AAA Server, VoMS etc.) 7
RAN Equipment (BSC, BTS, BTS VAN, Node B, RRU, BBU etc.) 7
Core Equipment (MSC, HLR, OMC, VLR, IN, RSN, MGW, SMSC, USSD, PS, CS, WGW, IP Clock etc.)
7
Transmission Equipment (Satellite, Microwave etc.) 7
Power – Battery 4
Power – Others 6
Tools (Subscribers Equipment, Planning / Testing / Loose tools etc.) 5
Others 5
Other Items Heating, Lighting, Air-conditioning 5
Furniture and Fixtures 5
Office Equipment 5
Vehicle- Motorcycle/car/jeep/truck 10
Vehicle- Tricycle, cycle and others 5
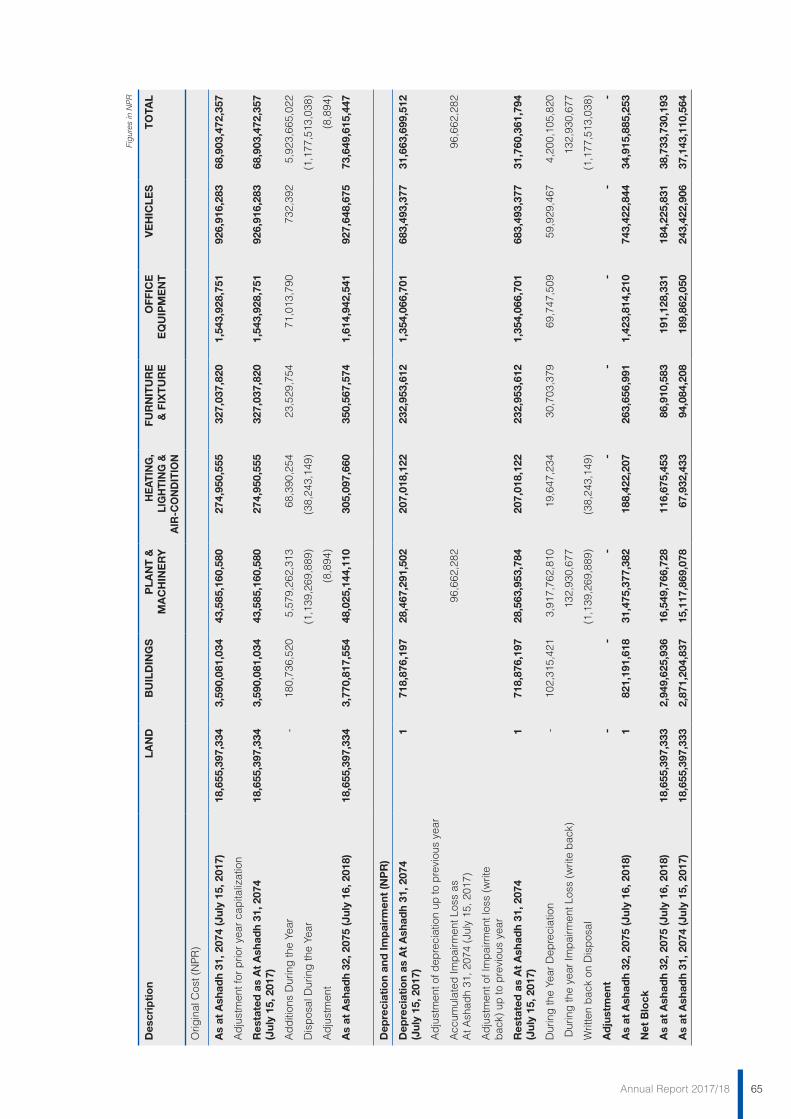
65Annual Report 2017/18
Fig
ures
in N
PR
Des
crip
tio
nLA
ND
BU
ILD
ING
SP
LAN
T &
M
AC
HIN
ER
YH
EAT
ING
, LI
GH
TIN
G &
A
IR-C
ON
DIT
ION
FUR
NIT
UR
E
& F
IXT
UR
EO
FFIC
E
EQ
UIP
ME
NT
VE
HIC
LES
TO
TAL
Orig
inal
Cos
t (N
PR
)
As
at A
shad
h 31
, 207
4 (J
uly
15, 2
017)
18,6
55,3
97,3
343,
590,
081,
034
43,5
85,1
60,5
8027
4,95
0,55
532
7,03
7,82
01,
543,
928,
751
926,
916,
283
68,9
03,4
72,3
57
Ad
just
men
t for
prio
r ye
ar c
apita
lizat
ion
Res
tate
d a
s A
t A
shad
h 31
, 207
4(J
uly
15, 2
017)
18,6
55,3
97,3
343,
590,
081,
034
43,5
85,1
60,5
8027
4,95
0,55
532
7,03
7,82
01,
543,
928,
751
926,
916,
283
68,9
03,4
72,3
57
Ad
diti
ons
Dur
ing
the
Year
-18
0,73
6,52
05,
579,
262,
313
68,3
90,2
5423
,529
,754
71,0
13,7
9073
2,39
25,
923,
665,
022
Dis
pos
al D
urin
g th
e Ye
ar(1
,139
,269
,889
)(3
8,24
3,14
9)(1
,177
,513
,038
)
Ad
just
men
t(8
,894
)(8
,894
)
As
at A
shad
h 32
, 207
5 (J
uly
16, 2
018)
18,6
55,3
97,3
343,
770,
817,
554
48,0
25,1
44,1
1030
5,09
7,66
035
0,56
7,57
41,
614,
942,
541
927,
648,
675
73,6
49,6
15,4
47
Dep
reci
atio
n an
d Im
pai
rmen
t (N
PR
)
Dep
reci
atio
n as
At
Ash
adh
31, 2
074
(Jul
y 15
, 201
7)1
718,
876,
197
28,4
67,2
91,5
0220
7,01
8,12
223
2,95
3,61
21,
354,
066,
701
683,
493,
377
31,6
63,6
99,5
12
Ad
just
men
t of d
epre
ciat
ion
up to
pre
viou
s ye
ar
Acc
umul
ated
Imp
airm
ent L
oss
asA
t Ash
adh
31, 2
074
(Jul
y 15
, 201
7)96
,662
,282
96,6
62,2
82
Ad
just
men
t of I
mp
airm
ent l
oss
(writ
e b
ack)
up
to p
revi
ous
year
Res
tate
d a
s A
t A
shad
h 31
, 207
4(J
uly
15, 2
017)
171
8,87
6,19
728
,563
,953
,784
207,
018,
122
232,
953,
612
1,35
4,06
6,70
168
3,49
3,37
731
,760
,361
,794
Dur
ing
the
Year
Dep
reci
atio
n-
102,
315,
421
3,91
7,76
2,81
019
,647
,234
30,7
03,3
7969
,747
,509
59,9
29,4
674,
200,
105,
820
Dur
ing
the
year
Imp
airm
ent L
oss
(writ
e b
ack)
132,
930,
677
132,
930,
677
Writ
ten
bac
k on
Dis
pos
al(1
,139
,269
,889
)(3
8,24
3,14
9)(1
,177
,513
,038
)
Ad
just
men
t-
--
--
--
-
As
at A
shad
h 32
, 207
5 (J
uly
16, 2
018)
182
1,19
1,61
831
,475
,377
,382
188,
422,
207
263,
656,
991
1,42
3,81
4,21
074
3,42
2,84
434
,915
,885
,253
Net
Blo
ck
As
at A
shad
h 32
, 207
5 (J
uly
16, 2
018)
18,6
55,3
97,3
332,
949,
625,
936
16,5
49,7
66,7
2811
6,67
5,45
386
,910
,583
191,
128,
331
184,
225,
831
38,7
33,7
30,1
93
As
at A
shad
h 31
, 207
4 (J
uly
15, 2
017)
18,6
55,3
97,3
332,
871,
204,
837
15,1
17,8
69,0
7867
,932
,433
94,0
84,2
0818
9,86
2,05
024
3,42
2,90
637
,143
,110
,564
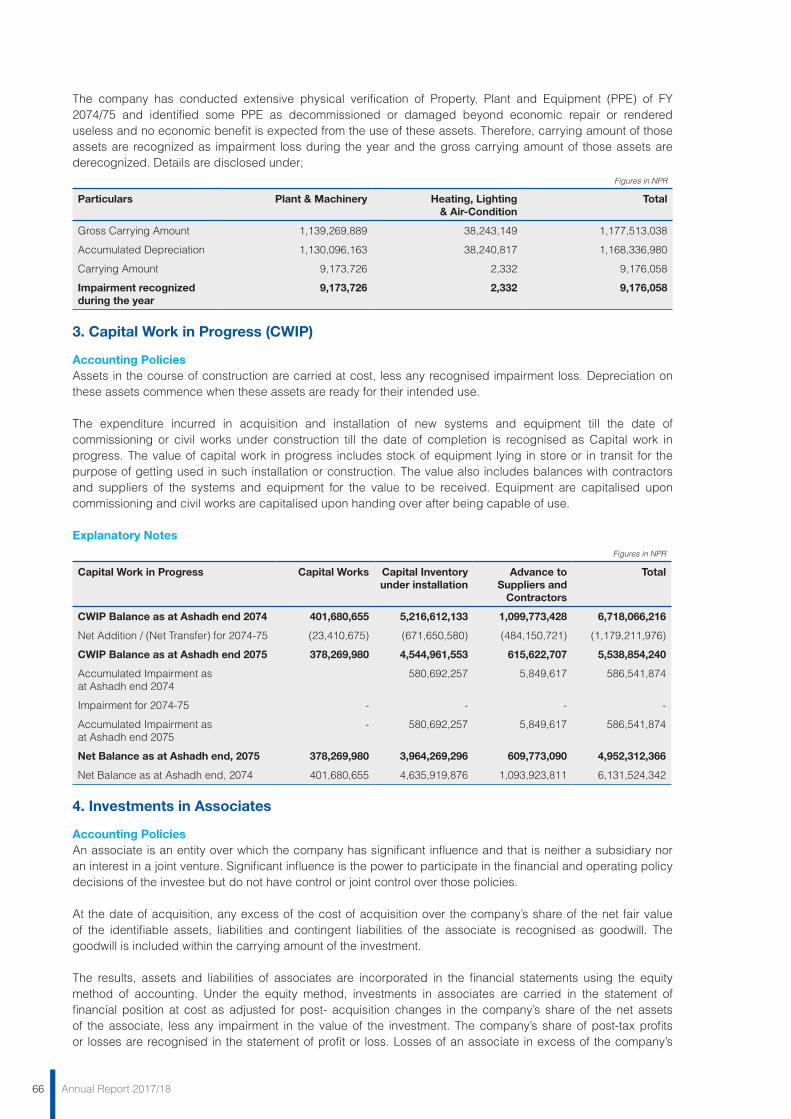
66 Annual Report 2017/18
The company has conducted extensive physical verification of Property, Plant and Equipment (PPE) of FY 2074/75 and identified some PPE as decommissioned or damaged beyond economic repair or rendered useless and no economic benefit is expected from the use of these assets. Therefore, carrying amount of those assets are recognized as impairment loss during the year and the gross carrying amount of those assets are derecognized. Details are disclosed under;
Figures in NPR
Particulars Plant & Machinery Heating, Lighting & Air-Condition
Total
Gross Carrying Amount 1,139,269,889 38,243,149 1,177,513,038
Accumulated Depreciation 1,130,096,163 38,240,817 1,168,336,980
Carrying Amount 9,173,726 2,332 9,176,058
Impairment recognized during the year
9,173,726 2,332 9,176,058
3. Capital Work in Progress (CWIP)
Accounting Policies Assets in the course of construction are carried at cost, less any recognised impairment loss. Depreciation on these assets commence when these assets are ready for their intended use.
The expenditure incurred in acquisition and installation of new systems and equipment till the date of commissioning or civil works under construction till the date of completion is recognised as Capital work in progress. The value of capital work in progress includes stock of equipment lying in store or in transit for the purpose of getting used in such installation or construction. The value also includes balances with contractors and suppliers of the systems and equipment for the value to be received. Equipment are capitalised upon commissioning and civil works are capitalised upon handing over after being capable of use.
Explanatory NotesFigures in NPR
Capital Work in Progress Capital Works Capital Inventory under installation
Advance to Suppliers and
Contractors
Total
CWIP Balance as at Ashadh end 2074 401,680,655 5,216,612,133 1,099,773,428 6,718,066,216
Net Addition / (Net Transfer) for 2074-75 (23,410,675) (671,650,580) (484,150,721) (1,179,211,976)
CWIP Balance as at Ashadh end 2075 378,269,980 4,544,961,553 615,622,707 5,538,854,240
Accumulated Impairment as at Ashadh end 2074
580,692,257 5,849,617 586,541,874
Impairment for 2074-75 - - - -
Accumulated Impairment as at Ashadh end 2075
- 580,692,257 5,849,617 586,541,874
Net Balance as at Ashadh end, 2075 378,269,980 3,964,269,296 609,773,090 4,952,312,366
Net Balance as at Ashadh end, 2074 401,680,655 4,635,919,876 1,093,923,811 6,131,524,342
4. Investments in Associates
Accounting Policies An associate is an entity over which the company has significant influence and that is neither a subsidiary nor an interest in a joint venture. Significant influence is the power to participate in the financial and operating policy decisions of the investee but do not have control or joint control over those policies.
At the date of acquisition, any excess of the cost of acquisition over the company’s share of the net fair value of the identifiable assets, liabilities and contingent liabilities of the associate is recognised as goodwill. The goodwill is included within the carrying amount of the investment.
The results, assets and liabilities of associates are incorporated in the financial statements using the equity method of accounting. Under the equity method, investments in associates are carried in the statement of financial position at cost as adjusted for post- acquisition changes in the company’s share of the net assets of the associate, less any impairment in the value of the investment. The company’s share of post-tax profits or losses are recognised in the statement of profit or loss. Losses of an associate in excess of the company’s
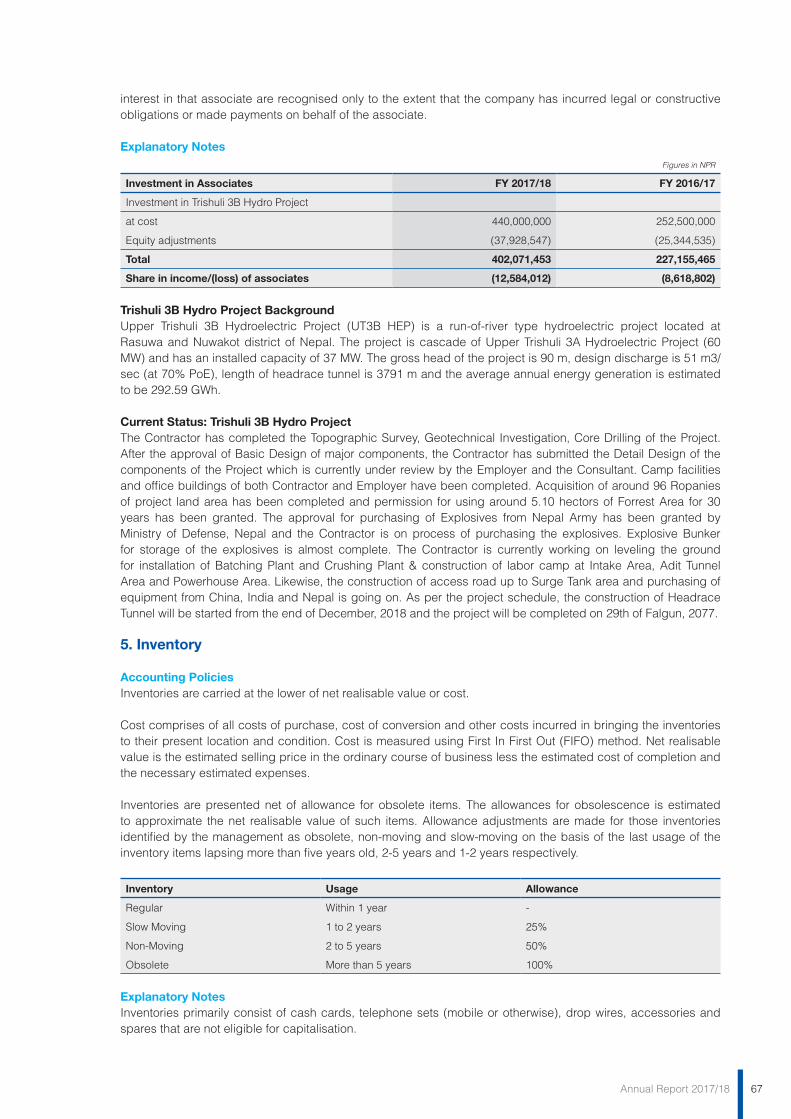
67Annual Report 2017/18
interest in that associate are recognised only to the extent that the company has incurred legal or constructive obligations or made payments on behalf of the associate.
Explanatory NotesFigures in NPR
Investment in Associates FY 2017/18 FY 2016/17
Investment in Trishuli 3B Hydro Project
at cost 440,000,000 252,500,000
Equity adjustments (37,928,547) (25,344,535)
Total 402,071,453 227,155,465
Share in income/(loss) of associates (12,584,012) (8,618,802)
Trishuli 3B Hydro Project BackgroundUpper Trishuli 3B Hydroelectric Project (UT3B HEP) is a run-of-river type hydroelectric project located at Rasuwa and Nuwakot district of Nepal. The project is cascade of Upper Trishuli 3A Hydroelectric Project (60 MW) and has an installed capacity of 37 MW. The gross head of the project is 90 m, design discharge is 51 m3/sec (at 70% PoE), length of headrace tunnel is 3791 m and the average annual energy generation is estimated to be 292.59 GWh.
Current Status: Trishuli 3B Hydro ProjectThe Contractor has completed the Topographic Survey, Geotechnical Investigation, Core Drilling of the Project. After the approval of Basic Design of major components, the Contractor has submitted the Detail Design of the components of the Project which is currently under review by the Employer and the Consultant. Camp facilities and office buildings of both Contractor and Employer have been completed. Acquisition of around 96 Ropanies of project land area has been completed and permission for using around 5.10 hectors of Forrest Area for 30 years has been granted. The approval for purchasing of Explosives from Nepal Army has been granted by Ministry of Defense, Nepal and the Contractor is on process of purchasing the explosives. Explosive Bunker for storage of the explosives is almost complete. The Contractor is currently working on leveling the ground for installation of Batching Plant and Crushing Plant & construction of labor camp at Intake Area, Adit Tunnel Area and Powerhouse Area. Likewise, the construction of access road up to Surge Tank area and purchasing of equipment from China, India and Nepal is going on. As per the project schedule, the construction of Headrace Tunnel will be started from the end of December, 2018 and the project will be completed on 29th of Falgun, 2077.
5. Inventory
Accounting Policies Inventories are carried at the lower of net realisable value or cost.
Cost comprises of all costs of purchase, cost of conversion and other costs incurred in bringing the inventories to their present location and condition. Cost is measured using First In First Out (FIFO) method. Net realisable value is the estimated selling price in the ordinary course of business less the estimated cost of completion and the necessary estimated expenses.
Inventories are presented net of allowance for obsolete items. The allowances for obsolescence is estimated to approximate the net realisable value of such items. Allowance adjustments are made for those inventories identified by the management as obsolete, non-moving and slow-moving on the basis of the last usage of the inventory items lapsing more than five years old, 2-5 years and 1-2 years respectively.
Inventory Usage Allowance
Regular Within 1 year -
Slow Moving 1 to 2 years 25%
Non-Moving 2 to 5 years 50%
Obsolete More than 5 years 100%
Explanatory Notes Inventories primarily consist of cash cards, telephone sets (mobile or otherwise), drop wires, accessories and spares that are not eligible for capitalisation.
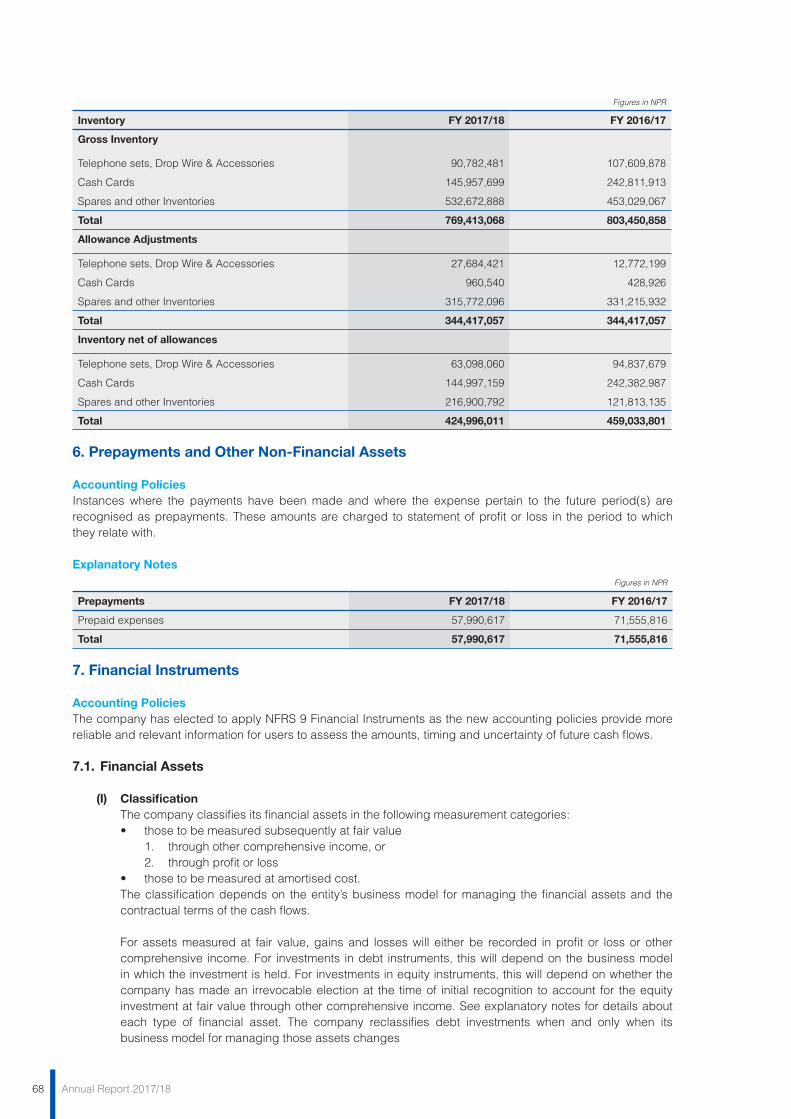
68 Annual Report 2017/18
Figures in NPR
Inventory FY 2017/18 FY 2016/17
Gross Inventory
Telephone sets, Drop Wire & Accessories 90,782,481 107,609,878
Cash Cards 145,957,699 242,811,913
Spares and other Inventories 532,672,888 453,029,067
Total 769,413,068 803,450,858
Allowance Adjustments
Telephone sets, Drop Wire & Accessories 27,684,421 12,772,199
Cash Cards 960,540 428,926
Spares and other Inventories 315,772,096 331,215,932
Total 344,417,057 344,417,057
Inventory net of allowances
Telephone sets, Drop Wire & Accessories 63,098,060 94,837,679
Cash Cards 144,997,159 242,382,987
Spares and other Inventories 216,900,792 121,813,135
Total 424,996,011 459,033,801
6. Prepayments and Other Non-Financial Assets
Accounting Policies Instances where the payments have been made and where the expense pertain to the future period(s) are recognised as prepayments. These amounts are charged to statement of profit or loss in the period to which they relate with.
Explanatory Notes Figures in NPR
Prepayments FY 2017/18 FY 2016/17
Prepaid expenses 57,990,617 71,555,816
Total 57,990,617 71,555,816
7. Financial Instruments
Accounting Policies The company has elected to apply NFRS 9 Financial Instruments as the new accounting policies provide more reliable and relevant information for users to assess the amounts, timing and uncertainty of future cash flows.
7.1. Financial Assets
(I) Classification The company classifies its financial assets in the following measurement categories: • thosetobemeasuredsubsequentlyatfairvalue 1. through other comprehensive income, or 2. through profit or loss • thosetobemeasuredatamortisedcost. The classification depends on the entity’s business model for managing the financial assets and the
contractual terms of the cash flows.
For assets measured at fair value, gains and losses will either be recorded in profit or loss or other comprehensive income. For investments in debt instruments, this will depend on the business model in which the investment is held. For investments in equity instruments, this will depend on whether the company has made an irrevocable election at the time of initial recognition to account for the equity investment at fair value through other comprehensive income. See explanatory notes for details about each type of financial asset. The company reclassifies debt investments when and only when its business model for managing those assets changes

69Annual Report 2017/18
(II) Measurement At initial recognition, the company measures a financial asset at its fair value plus, in the case of a
financial asset not at fair value through profit or loss, transaction costs that are directly attributable to the acquisition of the financial asset. Transaction costs of financial assets carried at fair value through profit or loss are charged in profit or loss.
Investments and Other Financial Assets
Debt Instruments Subsequent measurement of debt instruments depends on the company’s business model for
managing the asset and the cash flow characteristics of the asset. There are three measurement categories into which the company classifies its debt instruments:
1. Amortised cost: Assets that are held for collection of contractual cash flows where those cash flows represent solely payments of principal and interest are measured at amortised cost. A gain or loss on a debt investment that is subsequently measured at amortised cost and is not part of a hedging relationship is recognised in profit or loss when the asset is derecognised or impaired. Interest income from these financial assets is included in finance income using the effective interest rate method.
2. Fair value through other comprehensive income (FVOCI): Assets that are held for collection of contractual cash flows and for selling the financial assets, where the assets’ cash flows represent solely payments of principal and interest, are measured at fair value through other comprehensive income (FVOCI). Movements in the carrying amount are taken through OCI, except for the recognition of impairment gains or losses, interest revenue and foreign exchange gains and losses which are recognised in profit and loss. When the financial asset is derecognised, the cumulative gain or loss previously recognised in OCI is reclassified from equity to profit or loss and recognised in other gains/(losses). Interest income from these financial assets is included in finance income using the effective interest rate method.
3. Fair value through profit or loss: Assets that do not meet the criteria for amortised cost or FVOCI are measured at fair value through profit or loss. A gain or loss on a debt investment that is subsequently measured at fair value through profit or loss and is not part of a hedging relationship is recognised in profit or loss and presented net in the statement of profit or loss within other gains/(losses) in the period in which it arises. Interest income from these financial assets is included in the finance income.
Equity Instruments The company subsequently measures all equity investments at fair value. Where the company’s
management has elected to present fair value gains and losses on equity investments in other comprehensive income, there is no subsequent reclassification of fair value gains and losses to profit or loss. Dividends from such investments continue to be recognised in profit or loss as other income when the company’s right to receive payments is established.
Changes in the fair value of financial assets at fair value through profit or loss are recognised in other gain/(losses) in the statement of profit or loss as applicable. Impairment losses (and reversal of impairment losses) on equity investments measured at FVOCI are not reported separately from other changes in fair value.
(III) Impairment of Financial Assets The company assesses on a forward-looking basis the expected credit losses associated with
its assets carried at amortised cost and FVOCI. The impairment methodology applied depends on whether there has been a significant increase in credit risk. Note 19 details how the company determines whether there has been a significant increase in credit risk.
For trade receivables only, the company applies the simplified approach permitted by NFRS 9, which requires expected lifetime losses to be recognised from initial recognition of the receivables.
The company has applied NFRS 9 retrospectively, and has elected to restate comparative information. As a result, the comparative information provided have been accounted for in accordance with the new policies.
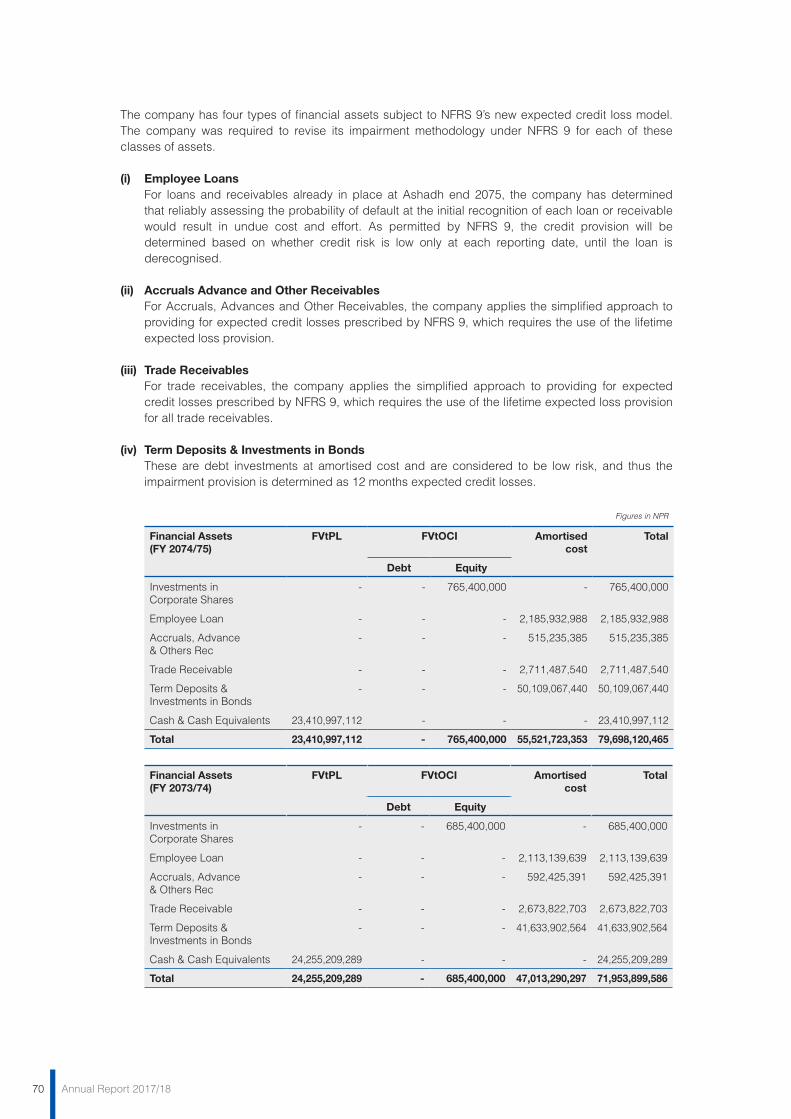
70 Annual Report 2017/18
The company has four types of financial assets subject to NFRS 9’s new expected credit loss model. The company was required to revise its impairment methodology under NFRS 9 for each of these classes of assets.
(i) Employee Loans For loans and receivables already in place at Ashadh end 2075, the company has determined
that reliably assessing the probability of default at the initial recognition of each loan or receivable would result in undue cost and effort. As permitted by NFRS 9, the credit provision will be determined based on whether credit risk is low only at each reporting date, until the loan is derecognised.
(ii) Accruals Advance and Other Receivables For Accruals, Advances and Other Receivables, the company applies the simplified approach to
providing for expected credit losses prescribed by NFRS 9, which requires the use of the lifetime expected loss provision.
(iii) Trade Receivables For trade receivables, the company applies the simplified approach to providing for expected
credit losses prescribed by NFRS 9, which requires the use of the lifetime expected loss provision for all trade receivables.
(iv) Term Deposits & Investments in Bonds These are debt investments at amortised cost and are considered to be low risk, and thus the
impairment provision is determined as 12 months expected credit losses.
Figures in NPR
Financial Assets (FY 2074/75)
FVtPL FVtOCI Amortised cost
Total
Debt Equity
Investments in Corporate Shares
- - 765,400,000 - 765,400,000
Employee Loan - - - 2,185,932,988 2,185,932,988
Accruals, Advance & Others Rec
- - - 515,235,385 515,235,385
Trade Receivable - - - 2,711,487,540 2,711,487,540
Term Deposits & Investments in Bonds
- - - 50,109,067,440 50,109,067,440
Cash & Cash Equivalents 23,410,997,112 - - - 23,410,997,112
Total 23,410,997,112 - 765,400,000 55,521,723,353 79,698,120,465
Financial Assets (FY 2073/74)
FVtPL FVtOCI Amortised cost
Total
Debt Equity
Investments in Corporate Shares
- - 685,400,000 - 685,400,000
Employee Loan - - - 2,113,139,639 2,113,139,639
Accruals, Advance & Others Rec
- - - 592,425,391 592,425,391
Trade Receivable - - - 2,673,822,703 2,673,822,703
Term Deposits & Investments in Bonds
- - - 41,633,902,564 41,633,902,564
Cash & Cash Equivalents 24,255,209,289 - - - 24,255,209,289
Total 24,255,209,289 - 685,400,000 47,013,290,297 71,953,899,586
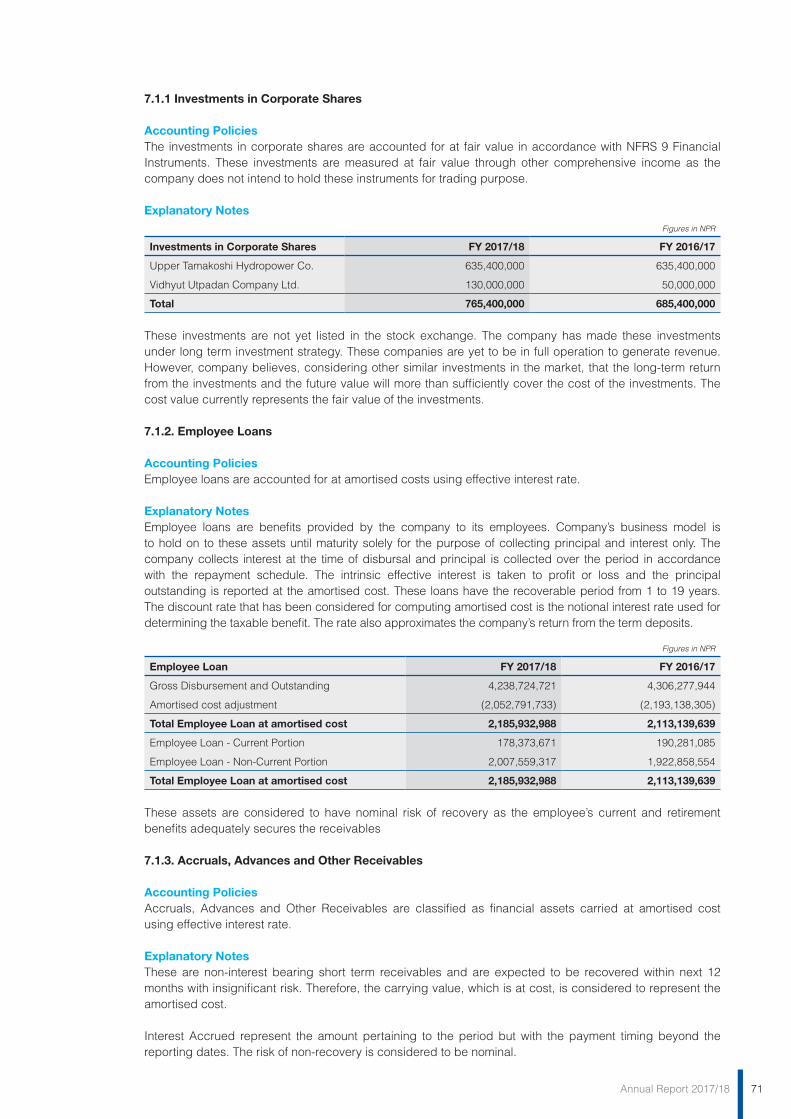
71Annual Report 2017/18
7.1.1 Investments in Corporate Shares
Accounting Policies The investments in corporate shares are accounted for at fair value in accordance with NFRS 9 Financial Instruments. These investments are measured at fair value through other comprehensive income as the company does not intend to hold these instruments for trading purpose.
Explanatory NotesFigures in NPR
Investments in Corporate Shares FY 2017/18 FY 2016/17
Upper Tamakoshi Hydropower Co. 635,400,000 635,400,000
Vidhyut Utpadan Company Ltd. 130,000,000 50,000,000
Total 765,400,000 685,400,000
These investments are not yet listed in the stock exchange. The company has made these investments under long term investment strategy. These companies are yet to be in full operation to generate revenue. However, company believes, considering other similar investments in the market, that the long-term return from the investments and the future value will more than sufficiently cover the cost of the investments. The cost value currently represents the fair value of the investments.
7.1.2. Employee Loans
Accounting Policies Employee loans are accounted for at amortised costs using effective interest rate.
Explanatory Notes Employee loans are benefits provided by the company to its employees. Company’s business model is to hold on to these assets until maturity solely for the purpose of collecting principal and interest only. The company collects interest at the time of disbursal and principal is collected over the period in accordance with the repayment schedule. The intrinsic effective interest is taken to profit or loss and the principal outstanding is reported at the amortised cost. These loans have the recoverable period from 1 to 19 years. The discount rate that has been considered for computing amortised cost is the notional interest rate used for determining the taxable benefit. The rate also approximates the company’s return from the term deposits.
Figures in NPR
Employee Loan FY 2017/18 FY 2016/17
Gross Disbursement and Outstanding 4,238,724,721 4,306,277,944
Amortised cost adjustment (2,052,791,733) (2,193,138,305)
Total Employee Loan at amortised cost 2,185,932,988 2,113,139,639
Employee Loan - Current Portion 178,373,671 190,281,085
Employee Loan - Non-Current Portion 2,007,559,317 1,922,858,554
Total Employee Loan at amortised cost 2,185,932,988 2,113,139,639
These assets are considered to have nominal risk of recovery as the employee’s current and retirement benefits adequately secures the receivables
7.1.3. Accruals, Advances and Other Receivables
Accounting Policies Accruals, Advances and Other Receivables are classified as financial assets carried at amortised cost using effective interest rate.
Explanatory Notes These are non-interest bearing short term receivables and are expected to be recovered within next 12 months with insignificant risk. Therefore, the carrying value, which is at cost, is considered to represent the amortised cost.
Interest Accrued represent the amount pertaining to the period but with the payment timing beyond the reporting dates. The risk of non-recovery is considered to be nominal.
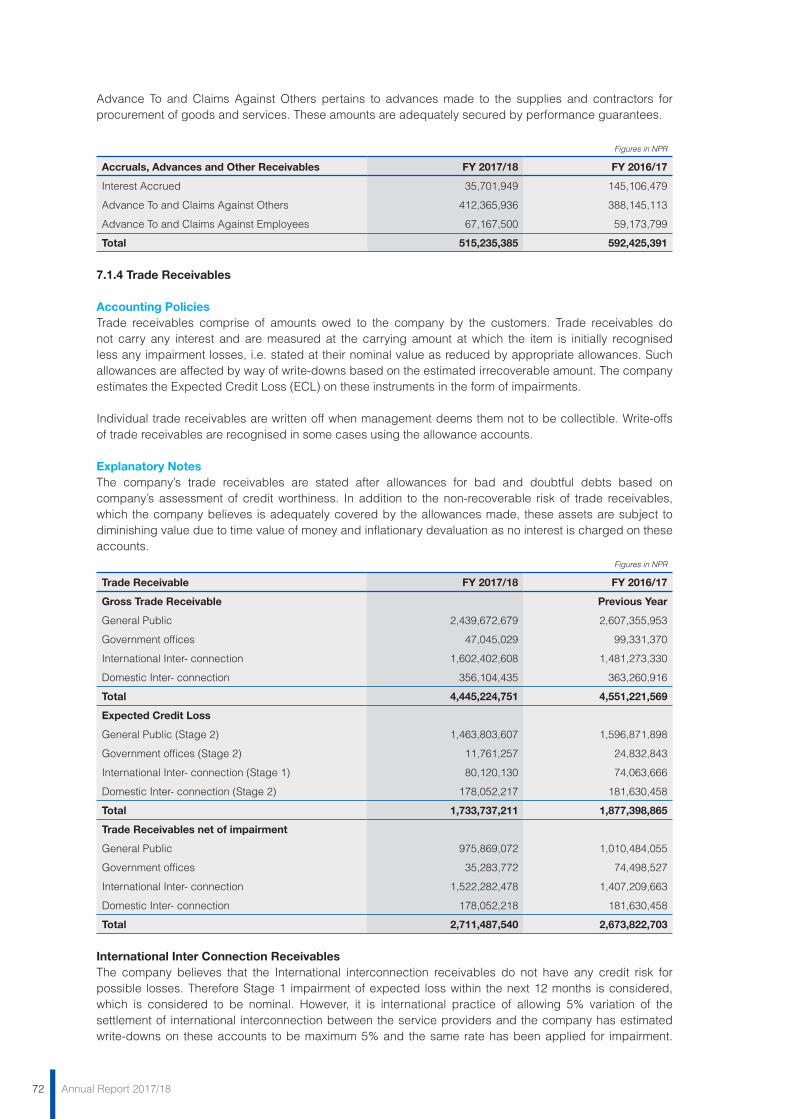
72 Annual Report 2017/18
Advance To and Claims Against Others pertains to advances made to the supplies and contractors for procurement of goods and services. These amounts are adequately secured by performance guarantees.
Figures in NPR
Accruals, Advances and Other Receivables FY 2017/18 FY 2016/17
Interest Accrued 35,701,949 145,106,479
Advance To and Claims Against Others 412,365,936 388,145,113
Advance To and Claims Against Employees 67,167,500 59,173,799
Total 515,235,385 592,425,391
7.1.4 Trade Receivables
Accounting Policies Trade receivables comprise of amounts owed to the company by the customers. Trade receivables do not carry any interest and are measured at the carrying amount at which the item is initially recognised less any impairment losses, i.e. stated at their nominal value as reduced by appropriate allowances. Such allowances are affected by way of write-downs based on the estimated irrecoverable amount. The company estimates the Expected Credit Loss (ECL) on these instruments in the form of impairments.
Individual trade receivables are written off when management deems them not to be collectible. Write-offs of trade receivables are recognised in some cases using the allowance accounts.
Explanatory Notes The company’s trade receivables are stated after allowances for bad and doubtful debts based on company’s assessment of credit worthiness. In addition to the non-recoverable risk of trade receivables, which the company believes is adequately covered by the allowances made, these assets are subject to diminishing value due to time value of money and inflationary devaluation as no interest is charged on these accounts.
Figures in NPR
Trade Receivable FY 2017/18 FY 2016/17
Gross Trade Receivable Previous Year
General Public 2,439,672,679 2,607,355,953
Government offices 47,045,029 99,331,370
International Inter- connection 1,602,402,608 1,481,273,330
Domestic Inter- connection 356,104,435 363,260,916
Total 4,445,224,751 4,551,221,569
Expected Credit Loss
General Public (Stage 2) 1,463,803,607 1,596,871,898
Government offices (Stage 2) 11,761,257 24,832,843
International Inter- connection (Stage 1) 80,120,130 74,063,666
Domestic Inter- connection (Stage 2) 178,052,217 181,630,458
Total 1,733,737,211 1,877,398,865
Trade Receivables net of impairment
General Public 975,869,072 1,010,484,055
Government offices 35,283,772 74,498,527
International Inter- connection 1,522,282,478 1,407,209,663
Domestic Inter- connection 178,052,218 181,630,458
Total 2,711,487,540 2,673,822,703
International Inter Connection ReceivablesThe company believes that the International interconnection receivables do not have any credit risk for possible losses. Therefore Stage 1 impairment of expected loss within the next 12 months is considered, which is considered to be nominal. However, it is international practice of allowing 5% variation of the settlement of international interconnection between the service providers and the company has estimated write-downs on these accounts to be maximum 5% and the same rate has been applied for impairment.
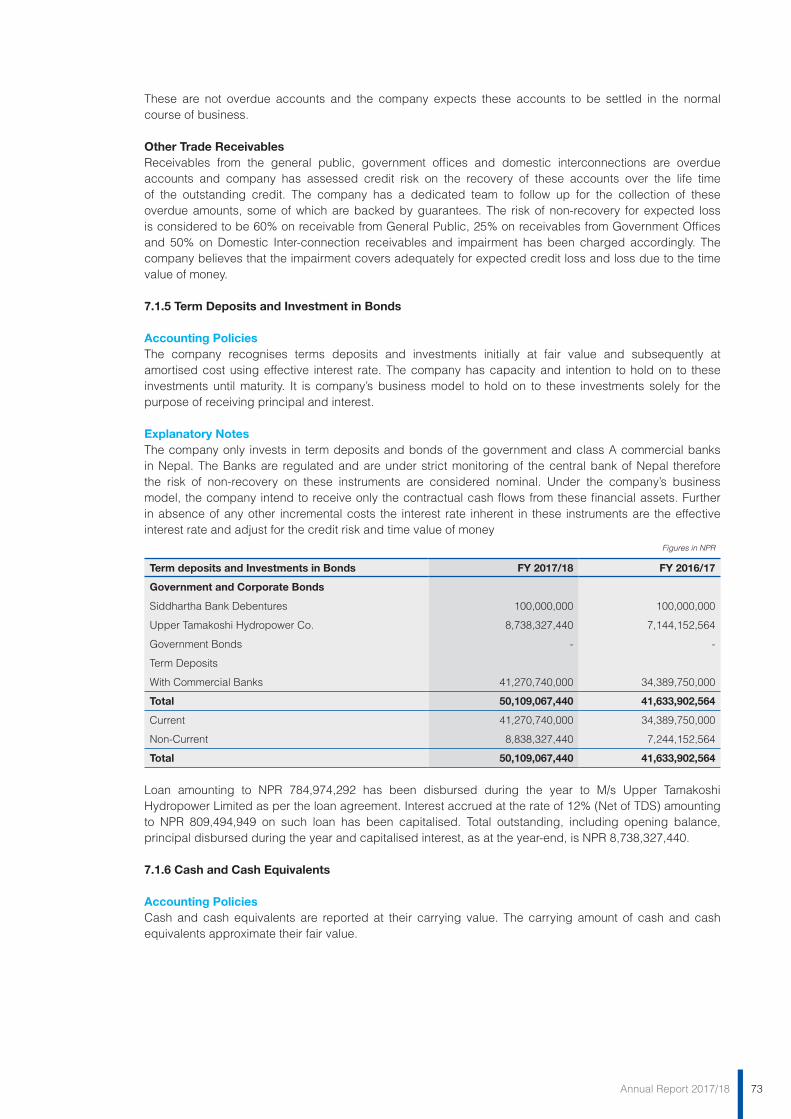
73Annual Report 2017/18
These are not overdue accounts and the company expects these accounts to be settled in the normal course of business.
Other Trade ReceivablesReceivables from the general public, government offices and domestic interconnections are overdue accounts and company has assessed credit risk on the recovery of these accounts over the life time of the outstanding credit. The company has a dedicated team to follow up for the collection of these overdue amounts, some of which are backed by guarantees. The risk of non-recovery for expected loss is considered to be 60% on receivable from General Public, 25% on receivables from Government Offices and 50% on Domestic Inter-connection receivables and impairment has been charged accordingly. The company believes that the impairment covers adequately for expected credit loss and loss due to the time value of money.
7.1.5 Term Deposits and Investment in Bonds
Accounting Policies The company recognises terms deposits and investments initially at fair value and subsequently at amortised cost using effective interest rate. The company has capacity and intention to hold on to these investments until maturity. It is company’s business model to hold on to these investments solely for the purpose of receiving principal and interest.
Explanatory Notes The company only invests in term deposits and bonds of the government and class A commercial banks in Nepal. The Banks are regulated and are under strict monitoring of the central bank of Nepal therefore the risk of non-recovery on these instruments are considered nominal. Under the company’s business model, the company intend to receive only the contractual cash flows from these financial assets. Further in absence of any other incremental costs the interest rate inherent in these instruments are the effective interest rate and adjust for the credit risk and time value of money
Figures in NPR
Term deposits and Investments in Bonds FY 2017/18 FY 2016/17
Government and Corporate Bonds
Siddhartha Bank Debentures 100,000,000 100,000,000
Upper Tamakoshi Hydropower Co. 8,738,327,440 7,144,152,564
Government Bonds - -
Term Deposits
With Commercial Banks 41,270,740,000 34,389,750,000
Total 50,109,067,440 41,633,902,564
Current 41,270,740,000 34,389,750,000
Non-Current 8,838,327,440 7,244,152,564
Total 50,109,067,440 41,633,902,564
Loan amounting to NPR 784,974,292 has been disbursed during the year to M/s Upper Tamakoshi Hydropower Limited as per the loan agreement. Interest accrued at the rate of 12% (Net of TDS) amounting to NPR 809,494,949 on such loan has been capitalised. Total outstanding, including opening balance, principal disbursed during the year and capitalised interest, as at the year-end, is NPR 8,738,327,440.
7.1.6 Cash and Cash Equivalents
Accounting Policies Cash and cash equivalents are reported at their carrying value. The carrying amount of cash and cash equivalents approximate their fair value.
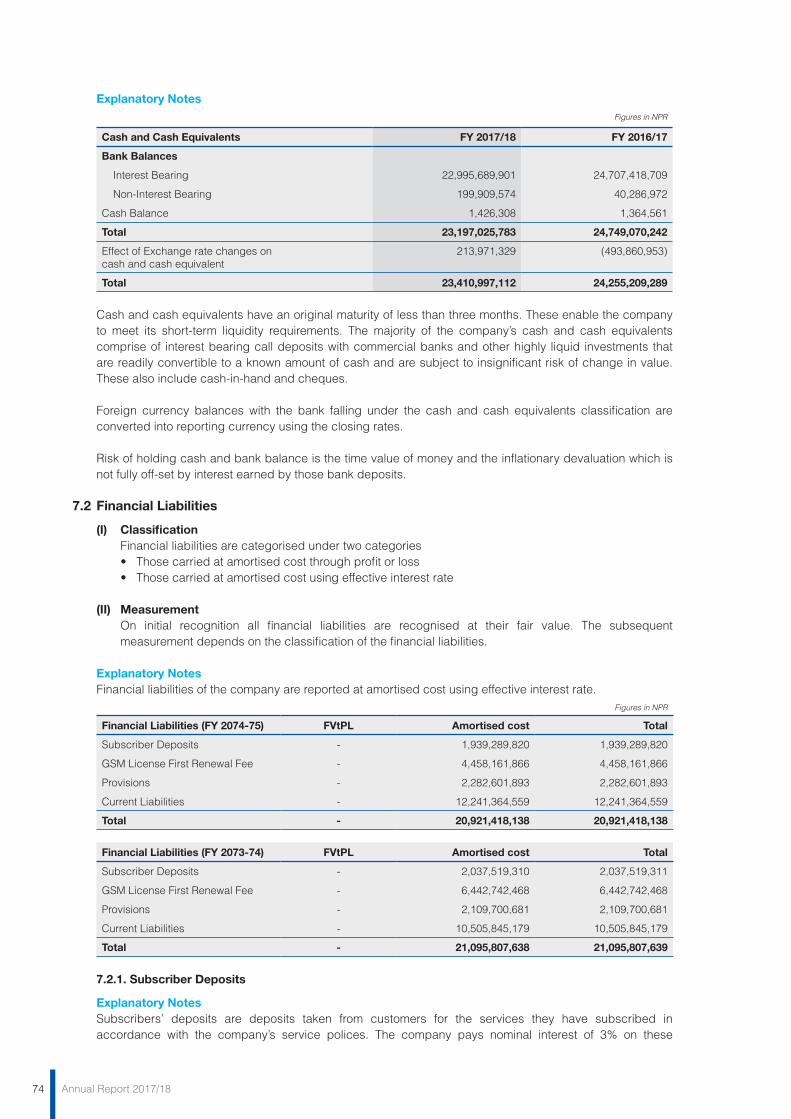
74 Annual Report 2017/18
Explanatory Notes Figures in NPR
Cash and Cash Equivalents FY 2017/18 FY 2016/17
Bank Balances
Interest Bearing 22,995,689,901 24,707,418,709
Non-Interest Bearing 199,909,574 40,286,972
Cash Balance 1,426,308 1,364,561
Total 23,197,025,783 24,749,070,242
Effect of Exchange rate changes on cash and cash equivalent
213,971,329 (493,860,953)
Total 23,410,997,112 24,255,209,289
Cash and cash equivalents have an original maturity of less than three months. These enable the company to meet its short-term liquidity requirements. The majority of the company’s cash and cash equivalents comprise of interest bearing call deposits with commercial banks and other highly liquid investments that are readily convertible to a known amount of cash and are subject to insignificant risk of change in value. These also include cash-in-hand and cheques.
Foreign currency balances with the bank falling under the cash and cash equivalents classification are converted into reporting currency using the closing rates.
Risk of holding cash and bank balance is the time value of money and the inflationary devaluation which is not fully off-set by interest earned by those bank deposits.
7.2 Financial Liabilities
(I) Classification Financial liabilities are categorised under two categories •Thosecarriedatamortisedcostthroughprofitorloss •Thosecarriedatamortisedcostusingeffectiveinterestrate
(II) Measurement On initial recognition all financial liabilities are recognised at their fair value. The subsequent
measurement depends on the classification of the financial liabilities.
Explanatory Notes Financial liabilities of the company are reported at amortised cost using effective interest rate.
Figures in NPR
Financial Liabilities (FY 2074-75) FVtPL Amortised cost Total
Subscriber Deposits - 1,939,289,820 1,939,289,820
GSM License First Renewal Fee - 4,458,161,866 4,458,161,866
Provisions - 2,282,601,893 2,282,601,893
Current Liabilities - 12,241,364,559 12,241,364,559
Total - 20,921,418,138 20,921,418,138
Financial Liabilities (FY 2073-74) FVtPL Amortised cost Total
Subscriber Deposits - 2,037,519,310 2,037,519,311
GSM License First Renewal Fee - 6,442,742,468 6,442,742,468
Provisions - 2,109,700,681 2,109,700,681
Current Liabilities - 10,505,845,179 10,505,845,179
Total - 21,095,807,638 21,095,807,639
7.2.1. Subscriber Deposits
Explanatory Notes Subscribers’ deposits are deposits taken from customers for the services they have subscribed in accordance with the company’s service polices. The company pays nominal interest of 3% on these
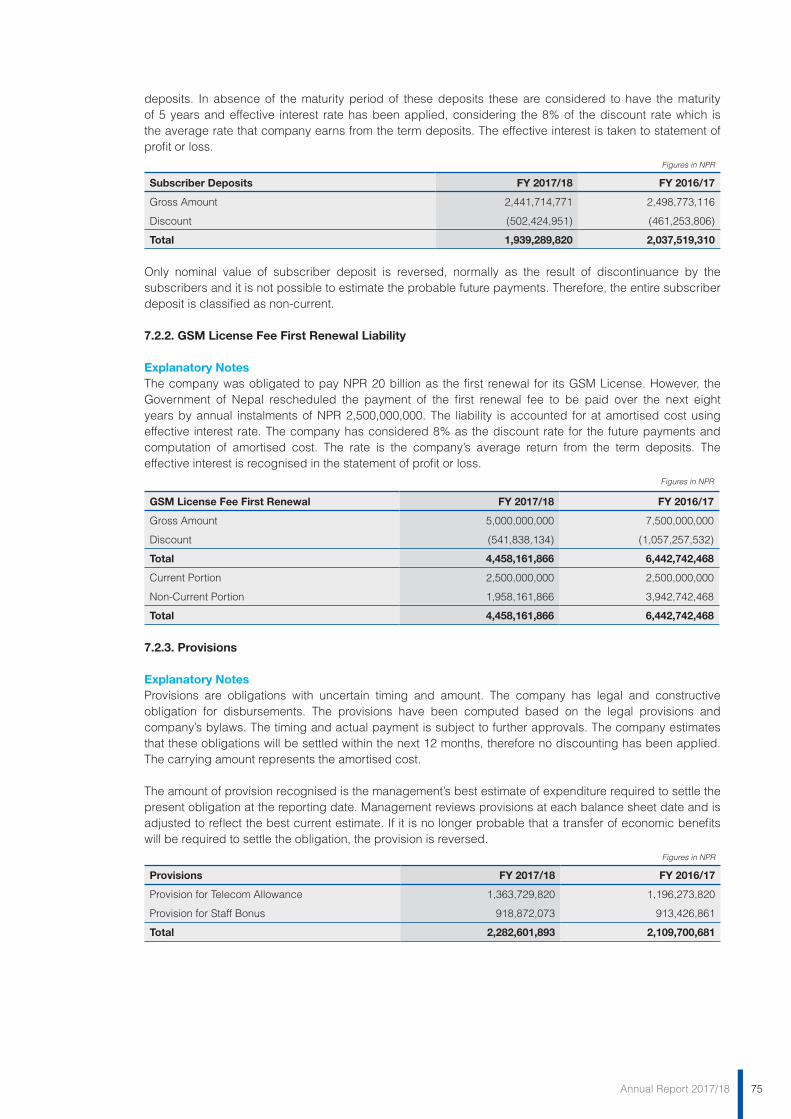
75Annual Report 2017/18
deposits. In absence of the maturity period of these deposits these are considered to have the maturity of 5 years and effective interest rate has been applied, considering the 8% of the discount rate which is the average rate that company earns from the term deposits. The effective interest is taken to statement of profit or loss.
Figures in NPR
Subscriber Deposits FY 2017/18 FY 2016/17
Gross Amount 2,441,714,771 2,498,773,116
Discount (502,424,951) (461,253,806)
Total 1,939,289,820 2,037,519,310
Only nominal value of subscriber deposit is reversed, normally as the result of discontinuance by the subscribers and it is not possible to estimate the probable future payments. Therefore, the entire subscriber deposit is classified as non-current.
7.2.2. GSM License Fee First Renewal Liability
Explanatory Notes The company was obligated to pay NPR 20 billion as the first renewal for its GSM License. However, the Government of Nepal rescheduled the payment of the first renewal fee to be paid over the next eight years by annual instalments of NPR 2,500,000,000. The liability is accounted for at amortised cost using effective interest rate. The company has considered 8% as the discount rate for the future payments and computation of amortised cost. The rate is the company’s average return from the term deposits. The effective interest is recognised in the statement of profit or loss.
Figures in NPR
GSM License Fee First Renewal FY 2017/18 FY 2016/17
Gross Amount 5,000,000,000 7,500,000,000
Discount (541,838,134) (1,057,257,532)
Total 4,458,161,866 6,442,742,468
Current Portion 2,500,000,000 2,500,000,000
Non-Current Portion 1,958,161,866 3,942,742,468
Total 4,458,161,866 6,442,742,468
7.2.3. Provisions
Explanatory Notes Provisions are obligations with uncertain timing and amount. The company has legal and constructive obligation for disbursements. The provisions have been computed based on the legal provisions and company’s bylaws. The timing and actual payment is subject to further approvals. The company estimates that these obligations will be settled within the next 12 months, therefore no discounting has been applied. The carrying amount represents the amortised cost.
The amount of provision recognised is the management’s best estimate of expenditure required to settle the present obligation at the reporting date. Management reviews provisions at each balance sheet date and is adjusted to reflect the best current estimate. If it is no longer probable that a transfer of economic benefits will be required to settle the obligation, the provision is reversed.
Figures in NPR
Provisions FY 2017/18 FY 2016/17
Provision for Telecom Allowance 1,363,729,820 1,196,273,820
Provision for Staff Bonus 918,872,073 913,426,861
Total 2,282,601,893 2,109,700,681
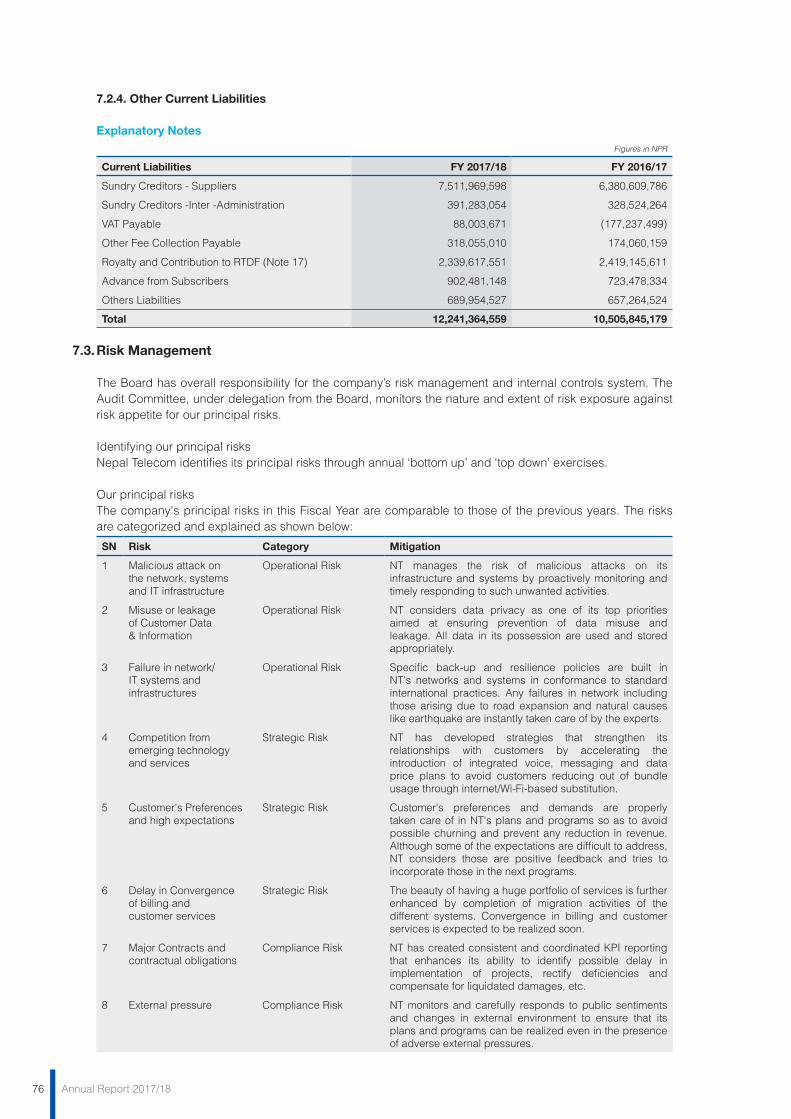
76 Annual Report 2017/18
7.2.4. Other Current Liabilities
Explanatory Notes Figures in NPR
Current Liabilities FY 2017/18 FY 2016/17
Sundry Creditors - Suppliers 7,511,969,598 6,380,609,786
Sundry Creditors -Inter -Administration 391,283,054 328,524,264
VAT Payable 88,003,671 (177,237,499)
Other Fee Collection Payable 318,055,010 174,060,159
Royalty and Contribution to RTDF (Note 17) 2,339,617,551 2,419,145,611
Advance from Subscribers 902,481,148 723,478,334
Others Liabilities 689,954,527 657,264,524
Total 12,241,364,559 10,505,845,179
7.3. Risk Management
The Board has overall responsibility for the company’s risk management and internal controls system. The Audit Committee, under delegation from the Board, monitors the nature and extent of risk exposure against risk appetite for our principal risks.
Identifying our principal risks Nepal Telecom identifies its principal risks through annual ‘bottom up’ and ‘top down’ exercises.
Our principal risks The company's principal risks in this Fiscal Year are comparable to those of the previous years. The risks are categorized and explained as shown below:
SN Risk Category Mitigation
1 Malicious attack on the network, systems and IT infrastructure
Operational Risk NT manages the risk of malicious attacks on its infrastructure and systems by proactively monitoring and timely responding to such unwanted activities.
2 Misuse or leakage of Customer Data & Information
Operational Risk NT considers data privacy as one of its top priorities aimed at ensuring prevention of data misuse and leakage. All data in its possession are used and stored appropriately.
3 Failure in network/IT systems and infrastructures
Operational Risk Specific back-up and resilience policies are built in NT's networks and systems in conformance to standard international practices. Any failures in network including those arising due to road expansion and natural causes like earthquake are instantly taken care of by the experts.
4 Competition from emerging technology and services
Strategic Risk NT has developed strategies that strengthen its relationships with customers by accelerating the introduction of integrated voice, messaging and data price plans to avoid customers reducing out of bundle usage through internet/Wi-Fi-based substitution.
5 Customer's Preferences and high expectations
Strategic Risk Customer's preferences and demands are properly taken care of in NT's plans and programs so as to avoid possible churning and prevent any reduction in revenue. Although some of the expectations are difficult to address, NT considers those are positive feedback and tries to incorporate those in the next programs.
6 Delay in Convergence of billing and customer services
Strategic Risk The beauty of having a huge portfolio of services is further enhanced by completion of migration activities of the different systems. Convergence in billing and customer services is expected to be realized soon.
7 Major Contracts and contractual obligations
Compliance Risk NT has created consistent and coordinated KPI reporting that enhances its ability to identify possible delay in implementation of projects, rectify deficiencies and compensate for liquidated damages, etc.
8 External pressure Compliance Risk NT monitors and carefully responds to public sentiments and changes in external environment to ensure that its plans and programs can be realized even in the presence of adverse external pressures.
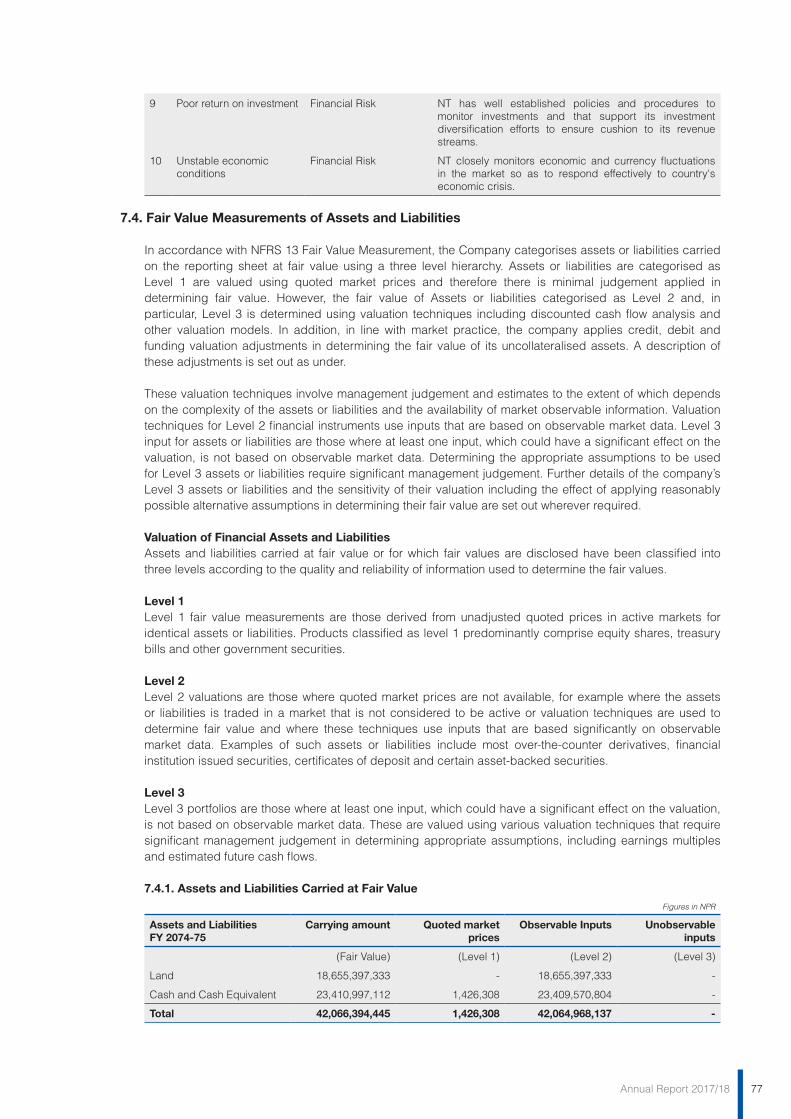
77Annual Report 2017/18
9 Poor return on investment Financial Risk NT has well established policies and procedures to monitor investments and that support its investment diversification efforts to ensure cushion to its revenue streams.
10 Unstable economic conditions
Financial Risk NT closely monitors economic and currency fluctuations in the market so as to respond effectively to country's economic crisis.
7.4. Fair Value Measurements of Assets and Liabilities
In accordance with NFRS 13 Fair Value Measurement, the Company categorises assets or liabilities carried on the reporting sheet at fair value using a three level hierarchy. Assets or liabilities are categorised as Level 1 are valued using quoted market prices and therefore there is minimal judgement applied in determining fair value. However, the fair value of Assets or liabilities categorised as Level 2 and, in particular, Level 3 is determined using valuation techniques including discounted cash flow analysis and other valuation models. In addition, in line with market practice, the company applies credit, debit and funding valuation adjustments in determining the fair value of its uncollateralised assets. A description of these adjustments is set out as under.
These valuation techniques involve management judgement and estimates to the extent of which depends on the complexity of the assets or liabilities and the availability of market observable information. Valuation techniques for Level 2 financial instruments use inputs that are based on observable market data. Level 3 input for assets or liabilities are those where at least one input, which could have a significant effect on the valuation, is not based on observable market data. Determining the appropriate assumptions to be used for Level 3 assets or liabilities require significant management judgement. Further details of the company’s Level 3 assets or liabilities and the sensitivity of their valuation including the effect of applying reasonably possible alternative assumptions in determining their fair value are set out wherever required.
Valuation of Financial Assets and LiabilitiesAssets and liabilities carried at fair value or for which fair values are disclosed have been classified into three levels according to the quality and reliability of information used to determine the fair values.
Level 1Level 1 fair value measurements are those derived from unadjusted quoted prices in active markets for identical assets or liabilities. Products classified as level 1 predominantly comprise equity shares, treasury bills and other government securities.
Level 2Level 2 valuations are those where quoted market prices are not available, for example where the assets or liabilities is traded in a market that is not considered to be active or valuation techniques are used to determine fair value and where these techniques use inputs that are based significantly on observable market data. Examples of such assets or liabilities include most over-the-counter derivatives, financial institution issued securities, certificates of deposit and certain asset-backed securities.
Level 3Level 3 portfolios are those where at least one input, which could have a significant effect on the valuation, is not based on observable market data. These are valued using various valuation techniques that require significant management judgement in determining appropriate assumptions, including earnings multiples and estimated future cash flows.
7.4.1. Assets and Liabilities Carried at Fair ValueFigures in NPR
Assets and Liabilities FY 2074-75
Carrying amount Quoted market prices
Observable Inputs Unobservable inputs
(Fair Value) (Level 1) (Level 2) (Level 3)
Land 18,655,397,333 - 18,655,397,333 -
Cash and Cash Equivalent 23,410,997,112 1,426,308 23,409,570,804 -
Total 42,066,394,445 1,426,308 42,064,968,137 -
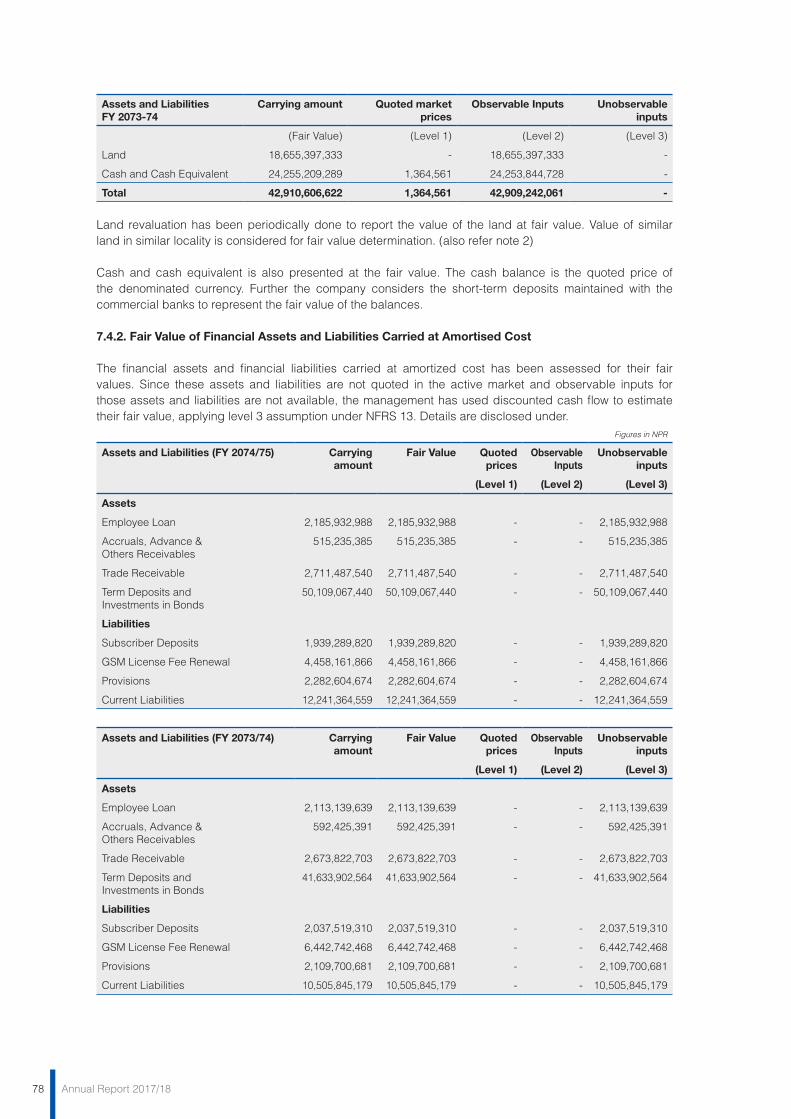
78 Annual Report 2017/18
Assets and Liabilities FY 2073-74
Carrying amount Quoted market prices
Observable Inputs Unobservable inputs
(Fair Value) (Level 1) (Level 2) (Level 3)
Land 18,655,397,333 - 18,655,397,333 -
Cash and Cash Equivalent 24,255,209,289 1,364,561 24,253,844,728 -
Total 42,910,606,622 1,364,561 42,909,242,061 -
Land revaluation has been periodically done to report the value of the land at fair value. Value of similar land in similar locality is considered for fair value determination. (also refer note 2)
Cash and cash equivalent is also presented at the fair value. The cash balance is the quoted price of the denominated currency. Further the company considers the short-term deposits maintained with the commercial banks to represent the fair value of the balances.
7.4.2. Fair Value of Financial Assets and Liabilities Carried at Amortised Cost
The financial assets and financial liabilities carried at amortized cost has been assessed for their fair values. Since these assets and liabilities are not quoted in the active market and observable inputs for those assets and liabilities are not available, the management has used discounted cash flow to estimate their fair value, applying level 3 assumption under NFRS 13. Details are disclosed under.
Figures in NPR
Assets and Liabilities (FY 2074/75) Carrying amount
Fair Value Quoted prices
Observable Inputs
Unobservable inputs
(Level 1) (Level 2) (Level 3)
Assets
Employee Loan 2,185,932,988 2,185,932,988 - - 2,185,932,988
Accruals, Advance & Others Receivables
515,235,385 515,235,385 - - 515,235,385
Trade Receivable 2,711,487,540 2,711,487,540 - - 2,711,487,540
Term Deposits and Investments in Bonds
50,109,067,440 50,109,067,440 - - 50,109,067,440
Liabilities
Subscriber Deposits 1,939,289,820 1,939,289,820 - - 1,939,289,820
GSM License Fee Renewal 4,458,161,866 4,458,161,866 - - 4,458,161,866
Provisions 2,282,604,674 2,282,604,674 - - 2,282,604,674
Current Liabilities 12,241,364,559 12,241,364,559 - - 12,241,364,559
Assets and Liabilities (FY 2073/74) Carrying amount
Fair Value Quoted prices
Observable Inputs
Unobservable inputs
(Level 1) (Level 2) (Level 3)
Assets
Employee Loan 2,113,139,639 2,113,139,639 - - 2,113,139,639
Accruals, Advance & Others Receivables
592,425,391 592,425,391 - - 592,425,391
Trade Receivable 2,673,822,703 2,673,822,703 - - 2,673,822,703
Term Deposits and Investments in Bonds
41,633,902,564 41,633,902,564 - - 41,633,902,564
Liabilities
Subscriber Deposits 2,037,519,310 2,037,519,310 - - 2,037,519,310
GSM License Fee Renewal 6,442,742,468 6,442,742,468 - - 6,442,742,468
Provisions 2,109,700,681 2,109,700,681 - - 2,109,700,681
Current Liabilities 10,505,845,179 10,505,845,179 - - 10,505,845,179
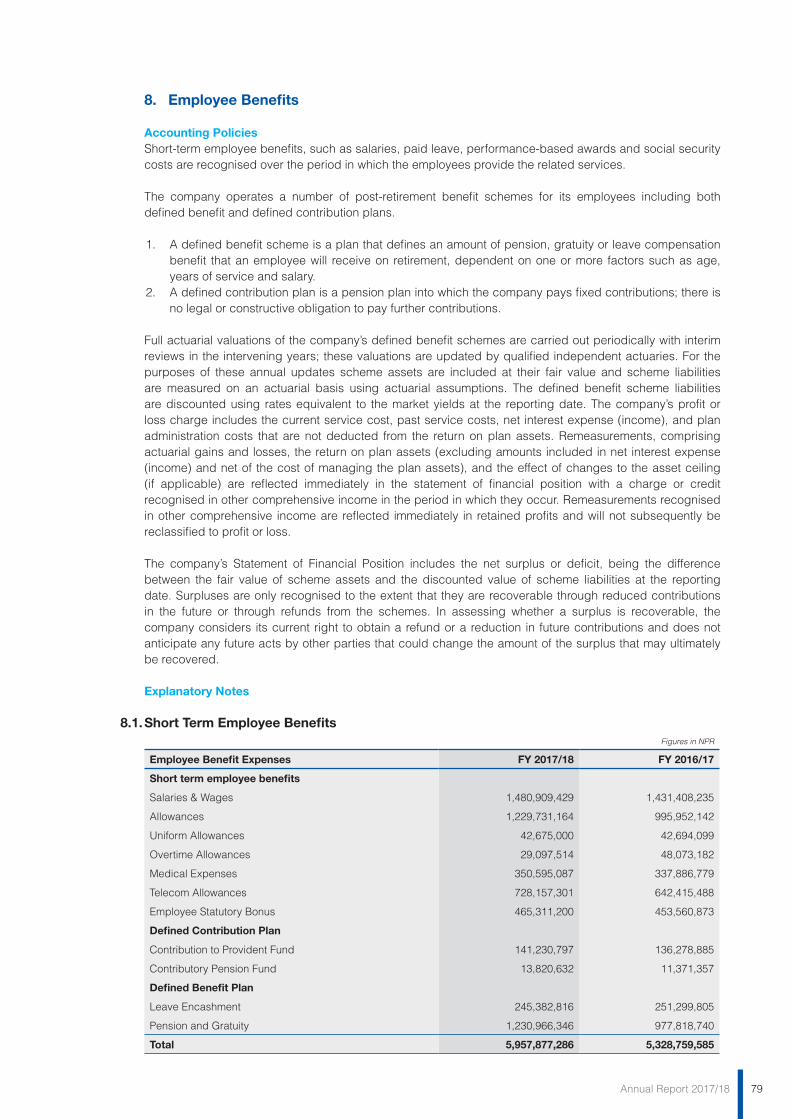
79Annual Report 2017/18
8. Employee Benefits
Accounting Policies Short-term employee benefits, such as salaries, paid leave, performance-based awards and social security costs are recognised over the period in which the employees provide the related services.
The company operates a number of post-retirement benefit schemes for its employees including both defined benefit and defined contribution plans.
1. A defined benefit scheme is a plan that defines an amount of pension, gratuity or leave compensation benefit that an employee will receive on retirement, dependent on one or more factors such as age, years of service and salary.
2. A defined contribution plan is a pension plan into which the company pays fixed contributions; there is no legal or constructive obligation to pay further contributions.
Full actuarial valuations of the company’s defined benefit schemes are carried out periodically with interim reviews in the intervening years; these valuations are updated by qualified independent actuaries. For the purposes of these annual updates scheme assets are included at their fair value and scheme liabilities are measured on an actuarial basis using actuarial assumptions. The defined benefit scheme liabilities are discounted using rates equivalent to the market yields at the reporting date. The company’s profit or loss charge includes the current service cost, past service costs, net interest expense (income), and plan administration costs that are not deducted from the return on plan assets. Remeasurements, comprising actuarial gains and losses, the return on plan assets (excluding amounts included in net interest expense (income) and net of the cost of managing the plan assets), and the effect of changes to the asset ceiling (if applicable) are reflected immediately in the statement of financial position with a charge or credit recognised in other comprehensive income in the period in which they occur. Remeasurements recognised in other comprehensive income are reflected immediately in retained profits and will not subsequently be reclassified to profit or loss.
The company’s Statement of Financial Position includes the net surplus or deficit, being the difference between the fair value of scheme assets and the discounted value of scheme liabilities at the reporting date. Surpluses are only recognised to the extent that they are recoverable through reduced contributions in the future or through refunds from the schemes. In assessing whether a surplus is recoverable, the company considers its current right to obtain a refund or a reduction in future contributions and does not anticipate any future acts by other parties that could change the amount of the surplus that may ultimately be recovered.
Explanatory Notes
8.1. Short Term Employee BenefitsFigures in NPR
Employee Benefit Expenses FY 2017/18 FY 2016/17
Short term employee benefits
Salaries & Wages 1,480,909,429 1,431,408,235
Allowances 1,229,731,164 995,952,142
Uniform Allowances 42,675,000 42,694,099
Overtime Allowances 29,097,514 48,073,182
Medical Expenses 350,595,087 337,886,779
Telecom Allowances 728,157,301 642,415,488
Employee Statutory Bonus 465,311,200 453,560,873
Defined Contribution Plan
Contribution to Provident Fund 141,230,797 136,278,885
Contributory Pension Fund 13,820,632 11,371,357
Defined Benefit Plan
Leave Encashment 245,382,816 251,299,805
Pension and Gratuity 1,230,966,346 977,818,740
Total 5,957,877,286 5,328,759,585
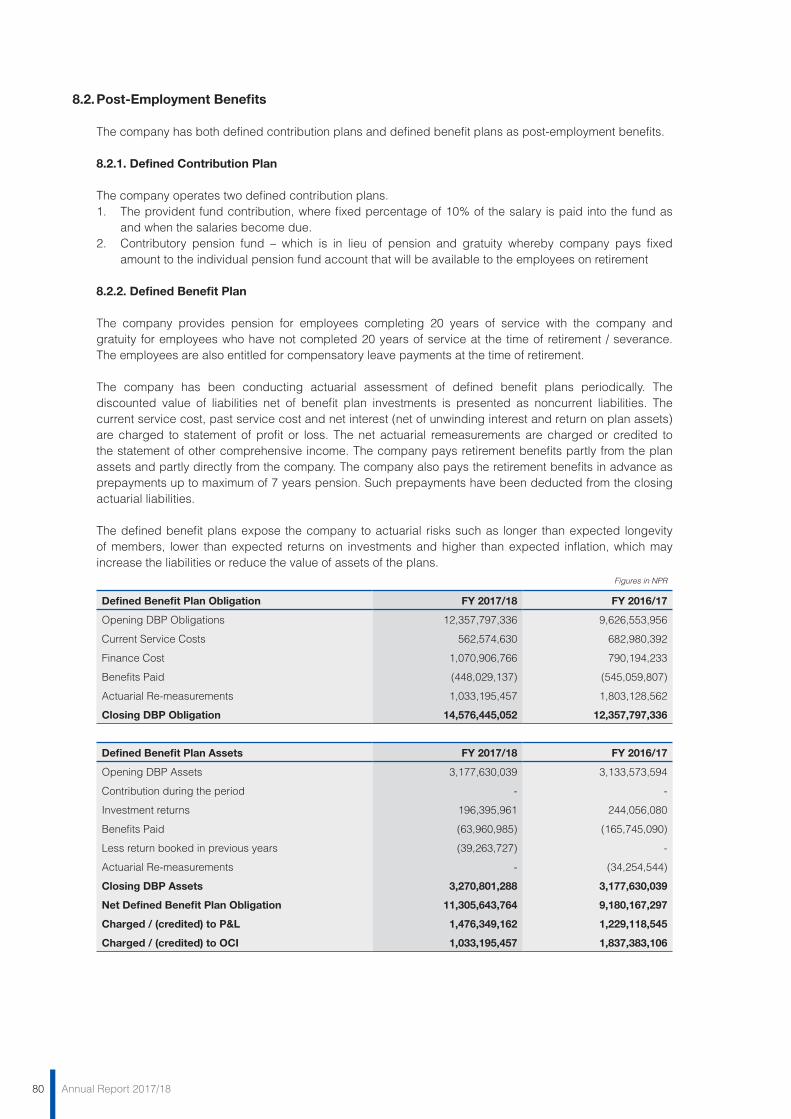
80 Annual Report 2017/18
8.2. Post-Employment Benefits
The company has both defined contribution plans and defined benefit plans as post-employment benefits.
8.2.1. Defined Contribution Plan
The company operates two defined contribution plans.1. The provident fund contribution, where fixed percentage of 10% of the salary is paid into the fund as
and when the salaries become due.2. Contributory pension fund – which is in lieu of pension and gratuity whereby company pays fixed
amount to the individual pension fund account that will be available to the employees on retirement
8.2.2. Defined Benefit Plan
The company provides pension for employees completing 20 years of service with the company and gratuity for employees who have not completed 20 years of service at the time of retirement / severance. The employees are also entitled for compensatory leave payments at the time of retirement.
The company has been conducting actuarial assessment of defined benefit plans periodically. The discounted value of liabilities net of benefit plan investments is presented as noncurrent liabilities. The current service cost, past service cost and net interest (net of unwinding interest and return on plan assets) are charged to statement of profit or loss. The net actuarial remeasurements are charged or credited to the statement of other comprehensive income. The company pays retirement benefits partly from the plan assets and partly directly from the company. The company also pays the retirement benefits in advance as prepayments up to maximum of 7 years pension. Such prepayments have been deducted from the closing actuarial liabilities.
The defined benefit plans expose the company to actuarial risks such as longer than expected longevity of members, lower than expected returns on investments and higher than expected inflation, which may increase the liabilities or reduce the value of assets of the plans.
Figures in NPR
Defined Benefit Plan Obligation FY 2017/18 FY 2016/17
Opening DBP Obligations 12,357,797,336 9,626,553,956
Current Service Costs 562,574,630 682,980,392
Finance Cost 1,070,906,766 790,194,233
Benefits Paid (448,029,137) (545,059,807)
Actuarial Re-measurements 1,033,195,457 1,803,128,562
Closing DBP Obligation 14,576,445,052 12,357,797,336
Defined Benefit Plan Assets FY 2017/18 FY 2016/17
Opening DBP Assets 3,177,630,039 3,133,573,594
Contribution during the period - -
Investment returns 196,395,961 244,056,080
Benefits Paid (63,960,985) (165,745,090)
Less return booked in previous years (39,263,727) -
Actuarial Re-measurements - (34,254,544)
Closing DBP Assets 3,270,801,288 3,177,630,039
Net Defined Benefit Plan Obligation 11,305,643,764 9,180,167,297
Charged / (credited) to P&L 1,476,349,162 1,229,118,545
Charged / (credited) to OCI 1,033,195,457 1,837,383,106
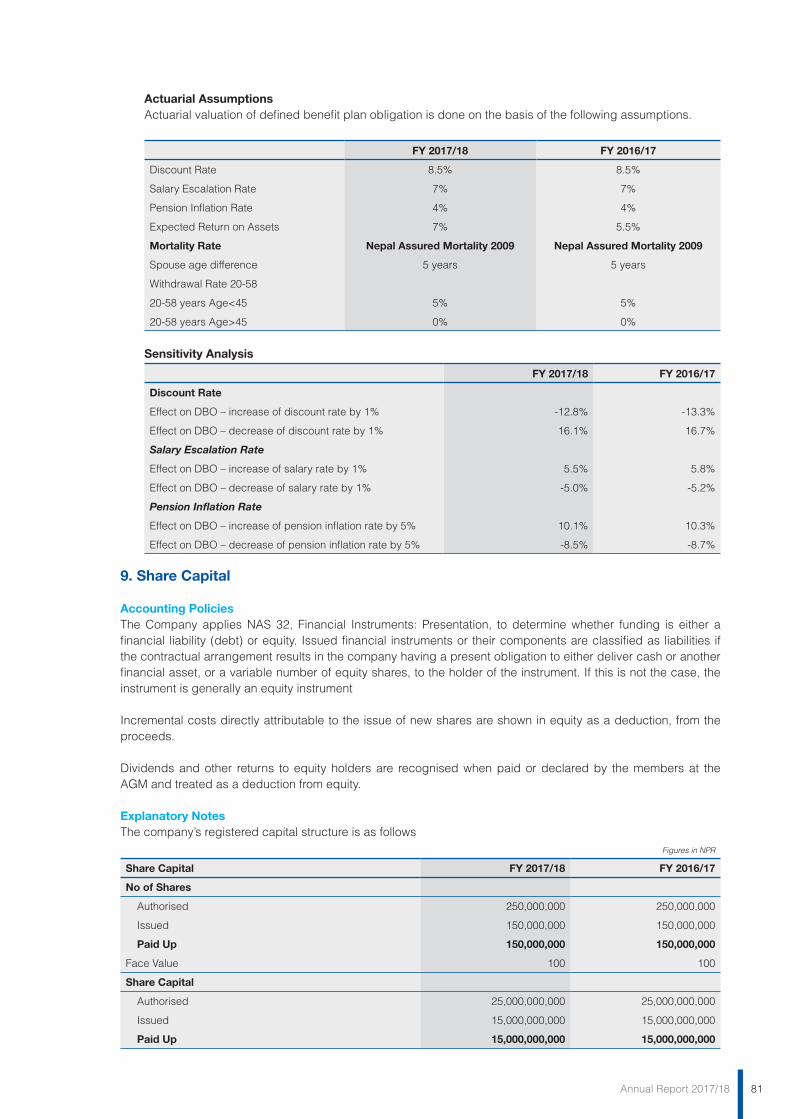
81Annual Report 2017/18
Actuarial AssumptionsActuarial valuation of defined benefit plan obligation is done on the basis of the following assumptions.
FY 2017/18 FY 2016/17
Discount Rate 8.5% 8.5%
Salary Escalation Rate 7% 7%
Pension Inflation Rate 4% 4%
Expected Return on Assets 7% 5.5%
Mortality Rate Nepal Assured Mortality 2009 Nepal Assured Mortality 2009
Spouse age difference 5 years 5 years
Withdrawal Rate 20-58
20-58 years Age<45 5% 5%
20-58 years Age>45 0% 0%
Sensitivity Analysis
FY 2017/18 FY 2016/17
Discount Rate
Effect on DBO – increase of discount rate by 1% -12.8% -13.3%
Effect on DBO – decrease of discount rate by 1% 16.1% 16.7%
Salary Escalation Rate
Effect on DBO – increase of salary rate by 1% 5.5% 5.8%
Effect on DBO – decrease of salary rate by 1% -5.0% -5.2%
Pension Inflation Rate
Effect on DBO – increase of pension inflation rate by 5% 10.1% 10.3%
Effect on DBO – decrease of pension inflation rate by 5% -8.5% -8.7%
9. Share Capital
Accounting Policies The Company applies NAS 32, Financial Instruments: Presentation, to determine whether funding is either a financial liability (debt) or equity. Issued financial instruments or their components are classified as liabilities if the contractual arrangement results in the company having a present obligation to either deliver cash or another financial asset, or a variable number of equity shares, to the holder of the instrument. If this is not the case, the instrument is generally an equity instrument
Incremental costs directly attributable to the issue of new shares are shown in equity as a deduction, from the proceeds.
Dividends and other returns to equity holders are recognised when paid or declared by the members at the AGM and treated as a deduction from equity.
Explanatory Notes The company’s registered capital structure is as follows
Figures in NPR
Share Capital FY 2017/18 FY 2016/17
No of Shares
Authorised 250,000,000 250,000,000
Issued 150,000,000 150,000,000
Paid Up 150,000,000 150,000,000
Face Value 100 100
Share Capital
Authorised 25,000,000,000 25,000,000,000
Issued 15,000,000,000 15,000,000,000
Paid Up 15,000,000,000 15,000,000,000
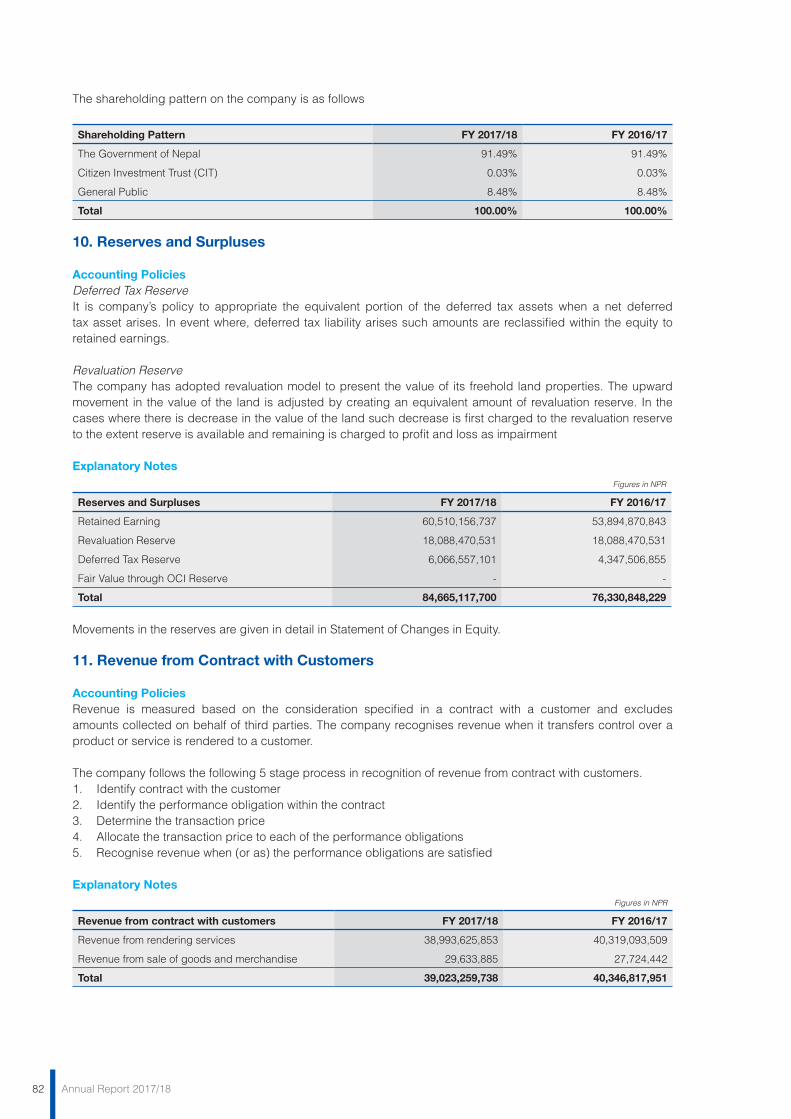
82 Annual Report 2017/18
The shareholding pattern on the company is as follows
Shareholding Pattern FY 2017/18 FY 2016/17
The Government of Nepal 91.49% 91.49%
Citizen Investment Trust (CIT) 0.03% 0.03%
General Public 8.48% 8.48%
Total 100.00% 100.00%
10. Reserves and Surpluses
Accounting Policies Deferred Tax ReserveIt is company’s policy to appropriate the equivalent portion of the deferred tax assets when a net deferred tax asset arises. In event where, deferred tax liability arises such amounts are reclassified within the equity to retained earnings.
Revaluation ReserveThe company has adopted revaluation model to present the value of its freehold land properties. The upward movement in the value of the land is adjusted by creating an equivalent amount of revaluation reserve. In the cases where there is decrease in the value of the land such decrease is first charged to the revaluation reserve to the extent reserve is available and remaining is charged to profit and loss as impairment
Explanatory Notes Figures in NPR
Reserves and Surpluses FY 2017/18 FY 2016/17
Retained Earning 60,510,156,737 53,894,870,843
Revaluation Reserve 18,088,470,531 18,088,470,531
Deferred Tax Reserve 6,066,557,101 4,347,506,855
Fair Value through OCI Reserve - -
Total 84,665,117,700 76,330,848,229
Movements in the reserves are given in detail in Statement of Changes in Equity.
11. Revenue from Contract with Customers
Accounting Policies Revenue is measured based on the consideration specified in a contract with a customer and excludes amounts collected on behalf of third parties. The company recognises revenue when it transfers control over a product or service is rendered to a customer.
The company follows the following 5 stage process in recognition of revenue from contract with customers.1. Identify contract with the customer2. Identify the performance obligation within the contract 3. Determine the transaction price4. Allocate the transaction price to each of the performance obligations5. Recognise revenue when (or as) the performance obligations are satisfied
Explanatory Notes Figures in NPR
Revenue from contract with customers FY 2017/18 FY 2016/17
Revenue from rendering services 38,993,625,853 40,319,093,509
Revenue from sale of goods and merchandise 29,633,885 27,724,442
Total 39,023,259,738 40,346,817,951
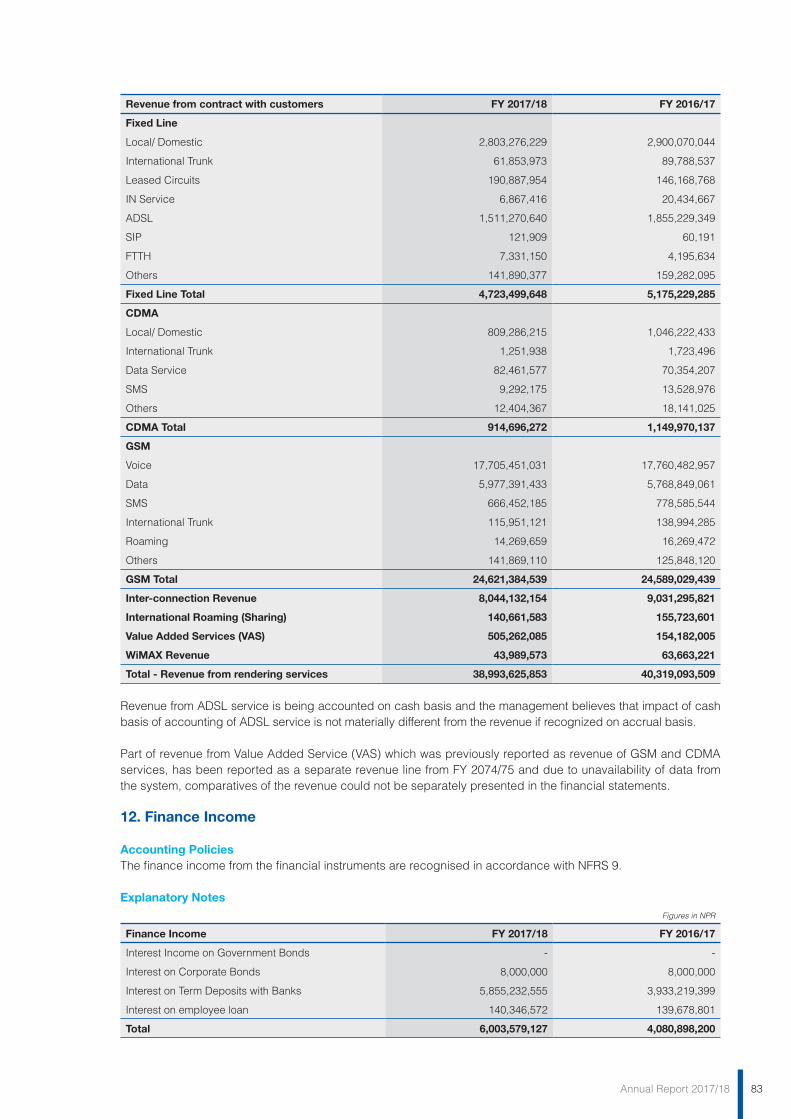
83Annual Report 2017/18
Revenue from contract with customers FY 2017/18 FY 2016/17
Fixed Line
Local/ Domestic 2,803,276,229 2,900,070,044
International Trunk 61,853,973 89,788,537
Leased Circuits 190,887,954 146,168,768
IN Service 6,867,416 20,434,667
ADSL 1,511,270,640 1,855,229,349
SIP 121,909 60,191
FTTH 7,331,150 4,195,634
Others 141,890,377 159,282,095
Fixed Line Total 4,723,499,648 5,175,229,285
CDMA
Local/ Domestic 809,286,215 1,046,222,433
International Trunk 1,251,938 1,723,496
Data Service 82,461,577 70,354,207
SMS 9,292,175 13,528,976
Others 12,404,367 18,141,025
CDMA Total 914,696,272 1,149,970,137
GSM
Voice 17,705,451,031 17,760,482,957
Data 5,977,391,433 5,768,849,061
SMS 666,452,185 778,585,544
International Trunk 115,951,121 138,994,285
Roaming 14,269,659 16,269,472
Others 141,869,110 125,848,120
GSM Total 24,621,384,539 24,589,029,439
Inter-connection Revenue 8,044,132,154 9,031,295,821
International Roaming (Sharing) 140,661,583 155,723,601
Value Added Services (VAS) 505,262,085 154,182,005
WiMAX Revenue 43,989,573 63,663,221
Total - Revenue from rendering services 38,993,625,853 40,319,093,509
Revenue from ADSL service is being accounted on cash basis and the management believes that impact of cash basis of accounting of ADSL service is not materially different from the revenue if recognized on accrual basis.
Part of revenue from Value Added Service (VAS) which was previously reported as revenue of GSM and CDMA services, has been reported as a separate revenue line from FY 2074/75 and due to unavailability of data from the system, comparatives of the revenue could not be separately presented in the financial statements.
12. Finance Income
Accounting Policies The finance income from the financial instruments are recognised in accordance with NFRS 9.
Explanatory Notes Figures in NPR
Finance Income FY 2017/18 FY 2016/17
Interest Income on Government Bonds - -
Interest on Corporate Bonds 8,000,000 8,000,000
Interest on Term Deposits with Banks 5,855,232,555 3,933,219,399
Interest on employee loan 140,346,572 139,678,801
Total 6,003,579,127 4,080,898,200
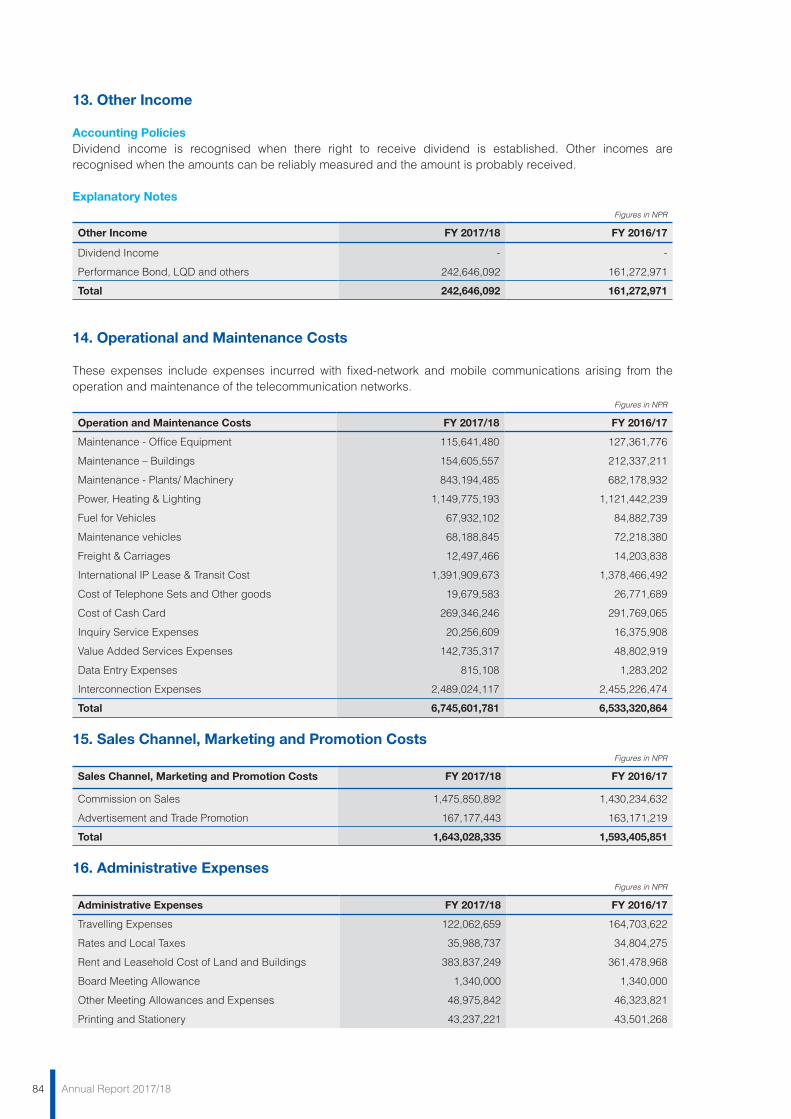
84 Annual Report 2017/18
13. Other Income
Accounting Policies Dividend income is recognised when there right to receive dividend is established. Other incomes are recognised when the amounts can be reliably measured and the amount is probably received.
Explanatory Notes Figures in NPR
Other Income FY 2017/18 FY 2016/17
Dividend Income - -
Performance Bond, LQD and others 242,646,092 161,272,971
Total 242,646,092 161,272,971
14. Operational and Maintenance Costs
These expenses include expenses incurred with fixed-network and mobile communications arising from the operation and maintenance of the telecommunication networks.
Figures in NPR
Operation and Maintenance Costs FY 2017/18 FY 2016/17
Maintenance - Office Equipment 115,641,480 127,361,776
Maintenance – Buildings 154,605,557 212,337,211
Maintenance - Plants/ Machinery 843,194,485 682,178,932
Power, Heating & Lighting 1,149,775,193 1,121,442,239
Fuel for Vehicles 67,932,102 84,882,739
Maintenance vehicles 68,188,845 72,218,380
Freight & Carriages 12,497,466 14,203,838
International IP Lease & Transit Cost 1,391,909,673 1,378,466,492
Cost of Telephone Sets and Other goods 19,679,583 26,771,689
Cost of Cash Card 269,346,246 291,769,065
Inquiry Service Expenses 20,256,609 16,375,908
Value Added Services Expenses 142,735,317 48,802,919
Data Entry Expenses 815,108 1,283,202
Interconnection Expenses 2,489,024,117 2,455,226,474
Total 6,745,601,781 6,533,320,864
15. Sales Channel, Marketing and Promotion CostsFigures in NPR
Sales Channel, Marketing and Promotion Costs FY 2017/18 FY 2016/17
Commission on Sales 1,475,850,892 1,430,234,632
Advertisement and Trade Promotion 167,177,443 163,171,219
Total 1,643,028,335 1,593,405,851
16. Administrative ExpensesFigures in NPR
Administrative Expenses FY 2017/18 FY 2016/17
Travelling Expenses 122,062,659 164,703,622
Rates and Local Taxes 35,988,737 34,804,275
Rent and Leasehold Cost of Land and Buildings 383,837,249 361,478,968
Board Meeting Allowance 1,340,000 1,340,000
Other Meeting Allowances and Expenses 48,975,842 46,323,821
Printing and Stationery 43,237,221 43,501,268
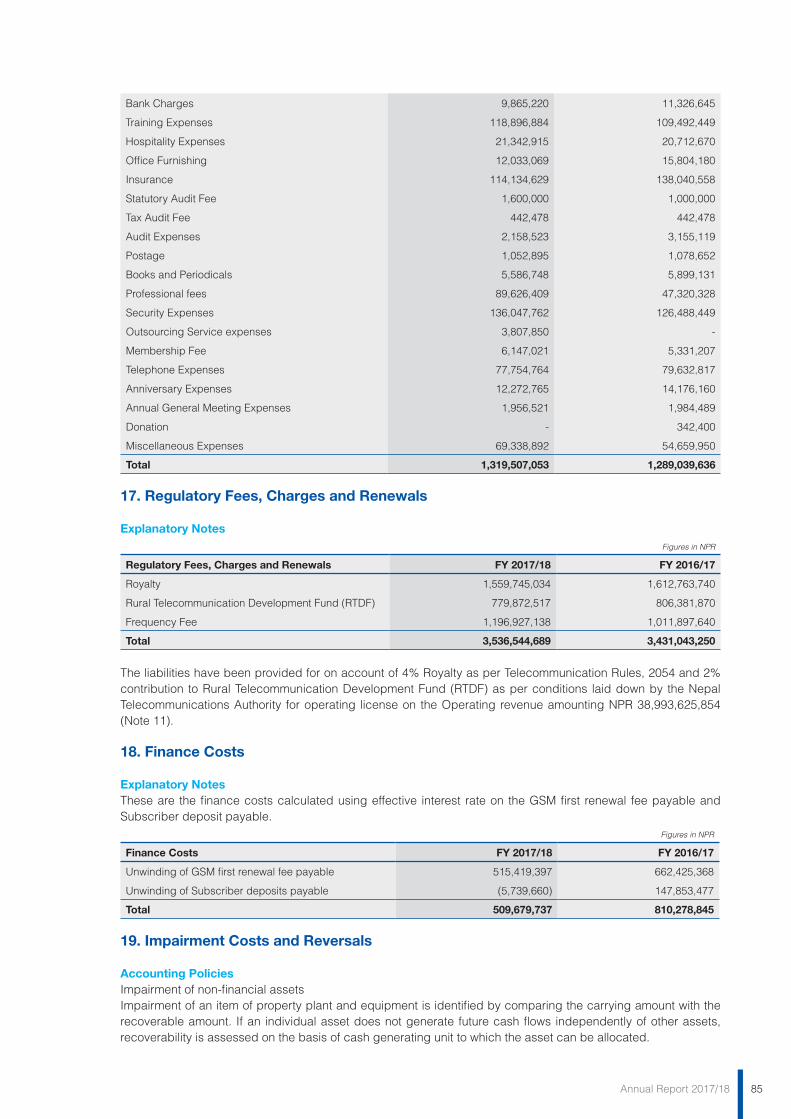
85Annual Report 2017/18
Bank Charges 9,865,220 11,326,645
Training Expenses 118,896,884 109,492,449
Hospitality Expenses 21,342,915 20,712,670
Office Furnishing 12,033,069 15,804,180
Insurance 114,134,629 138,040,558
Statutory Audit Fee 1,600,000 1,000,000
Tax Audit Fee 442,478 442,478
Audit Expenses 2,158,523 3,155,119
Postage 1,052,895 1,078,652
Books and Periodicals 5,586,748 5,899,131
Professional fees 89,626,409 47,320,328
Security Expenses 136,047,762 126,488,449
Outsourcing Service expenses 3,807,850 -
Membership Fee 6,147,021 5,331,207
Telephone Expenses 77,754,764 79,632,817
Anniversary Expenses 12,272,765 14,176,160
Annual General Meeting Expenses 1,956,521 1,984,489
Donation - 342,400
Miscellaneous Expenses 69,338,892 54,659,950
Total 1,319,507,053 1,289,039,636
17. Regulatory Fees, Charges and Renewals
Explanatory Notes Figures in NPR
Regulatory Fees, Charges and Renewals FY 2017/18 FY 2016/17
Royalty 1,559,745,034 1,612,763,740
Rural Telecommunication Development Fund (RTDF) 779,872,517 806,381,870
Frequency Fee 1,196,927,138 1,011,897,640
Total 3,536,544,689 3,431,043,250
The liabilities have been provided for on account of 4% Royalty as per Telecommunication Rules, 2054 and 2% contribution to Rural Telecommunication Development Fund (RTDF) as per conditions laid down by the Nepal Telecommunications Authority for operating license on the Operating revenue amounting NPR 38,993,625,854 (Note 11).
18. Finance Costs
Explanatory Notes These are the finance costs calculated using effective interest rate on the GSM first renewal fee payable and Subscriber deposit payable.
Figures in NPR
Finance Costs FY 2017/18 FY 2016/17
Unwinding of GSM first renewal fee payable 515,419,397 662,425,368
Unwinding of Subscriber deposits payable (5,739,660) 147,853,477
Total 509,679,737 810,278,845
19. Impairment Costs and Reversals
Accounting Policies Impairment of non-financial assetsImpairment of an item of property plant and equipment is identified by comparing the carrying amount with the recoverable amount. If an individual asset does not generate future cash flows independently of other assets, recoverability is assessed on the basis of cash generating unit to which the asset can be allocated.
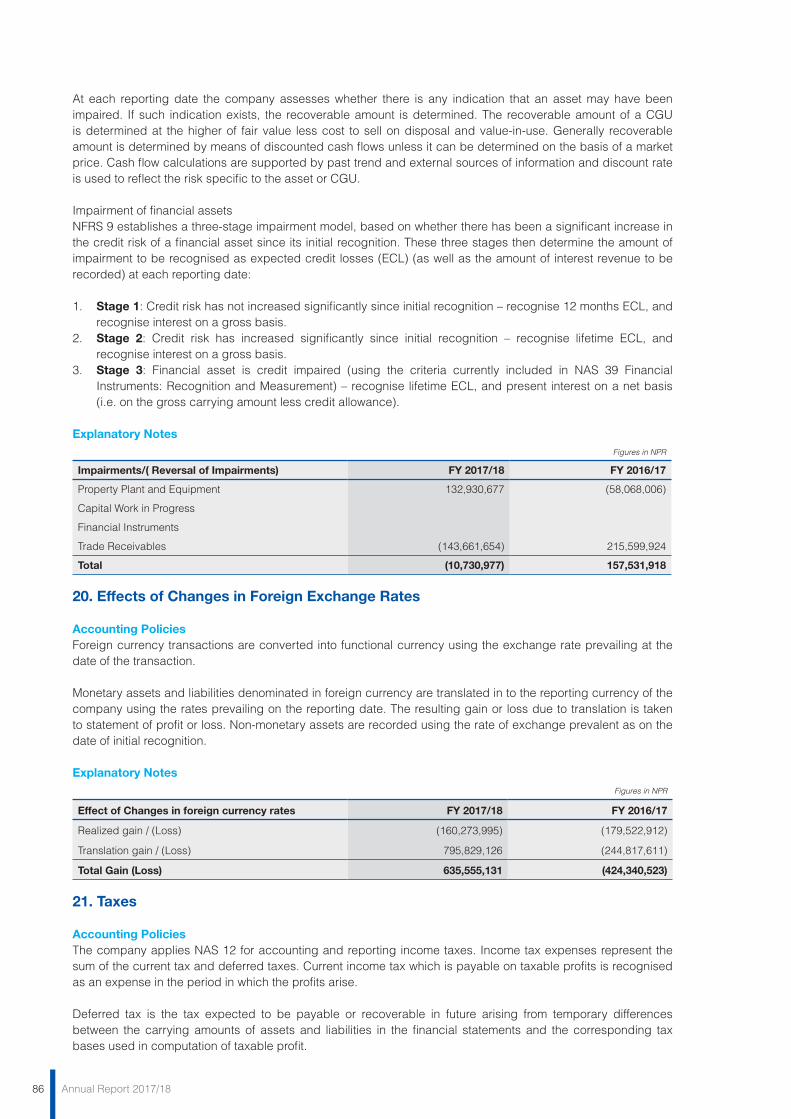
86 Annual Report 2017/18
At each reporting date the company assesses whether there is any indication that an asset may have been impaired. If such indication exists, the recoverable amount is determined. The recoverable amount of a CGU is determined at the higher of fair value less cost to sell on disposal and value-in-use. Generally recoverable amount is determined by means of discounted cash flows unless it can be determined on the basis of a market price. Cash flow calculations are supported by past trend and external sources of information and discount rate is used to reflect the risk specific to the asset or CGU.
Impairment of financial assetsNFRS 9 establishes a three-stage impairment model, based on whether there has been a significant increase in the credit risk of a financial asset since its initial recognition. These three stages then determine the amount of impairment to be recognised as expected credit losses (ECL) (as well as the amount of interest revenue to be recorded) at each reporting date:
1. Stage 1: Credit risk has not increased significantly since initial recognition – recognise 12 months ECL, and recognise interest on a gross basis.
2. Stage 2: Credit risk has increased significantly since initial recognition – recognise lifetime ECL, and recognise interest on a gross basis.
3. Stage 3: Financial asset is credit impaired (using the criteria currently included in NAS 39 Financial Instruments: Recognition and Measurement) – recognise lifetime ECL, and present interest on a net basis (i.e. on the gross carrying amount less credit allowance).
Explanatory Notes Figures in NPR
Impairments/( Reversal of Impairments) FY 2017/18 FY 2016/17
Property Plant and Equipment 132,930,677 (58,068,006)
Capital Work in Progress
Financial Instruments
Trade Receivables (143,661,654) 215,599,924
Total (10,730,977) 157,531,918
20. Effects of Changes in Foreign Exchange Rates
Accounting Policies Foreign currency transactions are converted into functional currency using the exchange rate prevailing at the date of the transaction.
Monetary assets and liabilities denominated in foreign currency are translated in to the reporting currency of the company using the rates prevailing on the reporting date. The resulting gain or loss due to translation is taken to statement of profit or loss. Non-monetary assets are recorded using the rate of exchange prevalent as on the date of initial recognition.
Explanatory Notes Figures in NPR
Effect of Changes in foreign currency rates FY 2017/18 FY 2016/17
Realized gain / (Loss) (160,273,995) (179,522,912)
Translation gain / (Loss) 795,829,126 (244,817,611)
Total Gain (Loss) 635,555,131 (424,340,523)
21. Taxes
Accounting Policies The company applies NAS 12 for accounting and reporting income taxes. Income tax expenses represent the sum of the current tax and deferred taxes. Current income tax which is payable on taxable profits is recognised as an expense in the period in which the profits arise.
Deferred tax is the tax expected to be payable or recoverable in future arising from temporary differences between the carrying amounts of assets and liabilities in the financial statements and the corresponding tax bases used in computation of taxable profit.
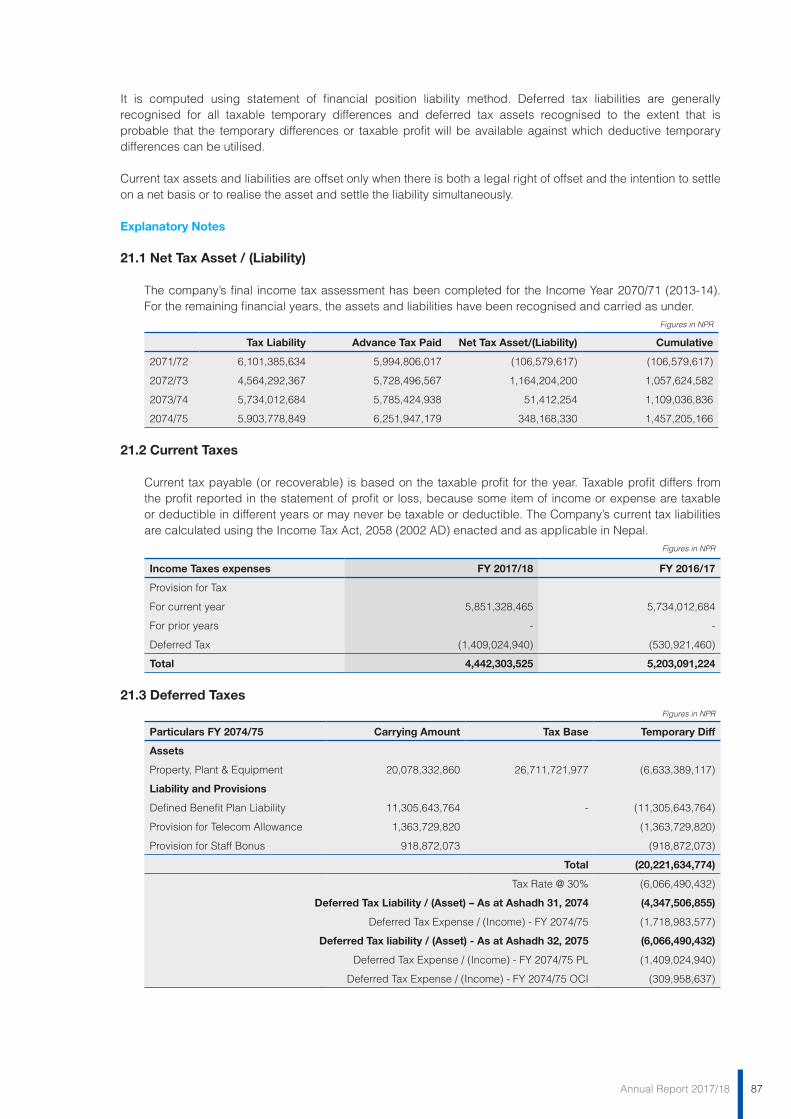
87Annual Report 2017/18
It is computed using statement of financial position liability method. Deferred tax liabilities are generally recognised for all taxable temporary differences and deferred tax assets recognised to the extent that is probable that the temporary differences or taxable profit will be available against which deductive temporary differences can be utilised.
Current tax assets and liabilities are offset only when there is both a legal right of offset and the intention to settle on a net basis or to realise the asset and settle the liability simultaneously.
Explanatory Notes
21.1 Net Tax Asset / (Liability)
The company’s final income tax assessment has been completed for the Income Year 2070/71 (2013-14). For the remaining financial years, the assets and liabilities have been recognised and carried as under.
Figures in NPR
Tax Liability Advance Tax Paid Net Tax Asset/(Liability) Cumulative
2071/72 6,101,385,634 5,994,806,017 (106,579,617) (106,579,617)
2072/73 4,564,292,367 5,728,496,567 1,164,204,200 1,057,624,582
2073/74 5,734,012,684 5,785,424,938 51,412,254 1,109,036,836
2074/75 5,903,778,849 6,251,947,179 348,168,330 1,457,205,166
21.2 Current Taxes
Current tax payable (or recoverable) is based on the taxable profit for the year. Taxable profit differs from the profit reported in the statement of profit or loss, because some item of income or expense are taxable or deductible in different years or may never be taxable or deductible. The Company’s current tax liabilities are calculated using the Income Tax Act, 2058 (2002 AD) enacted and as applicable in Nepal.
Figures in NPR
Income Taxes expenses FY 2017/18 FY 2016/17
Provision for Tax
For current year 5,851,328,465 5,734,012,684
For prior years - -
Deferred Tax (1,409,024,940) (530,921,460)
Total 4,442,303,525 5,203,091,224
21.3 Deferred Taxes Figures in NPR
Particulars FY 2074/75 Carrying Amount Tax Base Temporary Diff
Assets
Property, Plant & Equipment 20,078,332,860 26,711,721,977 (6,633,389,117)
Liability and Provisions
Defined Benefit Plan Liability 11,305,643,764 - (11,305,643,764)
Provision for Telecom Allowance 1,363,729,820 (1,363,729,820)
Provision for Staff Bonus 918,872,073 (918,872,073)
Total (20,221,634,774)
Tax Rate @ 30% (6,066,490,432)
Deferred Tax Liability / (Asset) – As at Ashadh 31, 2074 (4,347,506,855)
Deferred Tax Expense / (Income) - FY 2074/75 (1,718,983,577)
Deferred Tax liability / (Asset) - As at Ashadh 32, 2075 (6,066,490,432)
Deferred Tax Expense / (Income) - FY 2074/75 PL (1,409,024,940)
Deferred Tax Expense / (Income) - FY 2074/75 OCI (309,958,637)
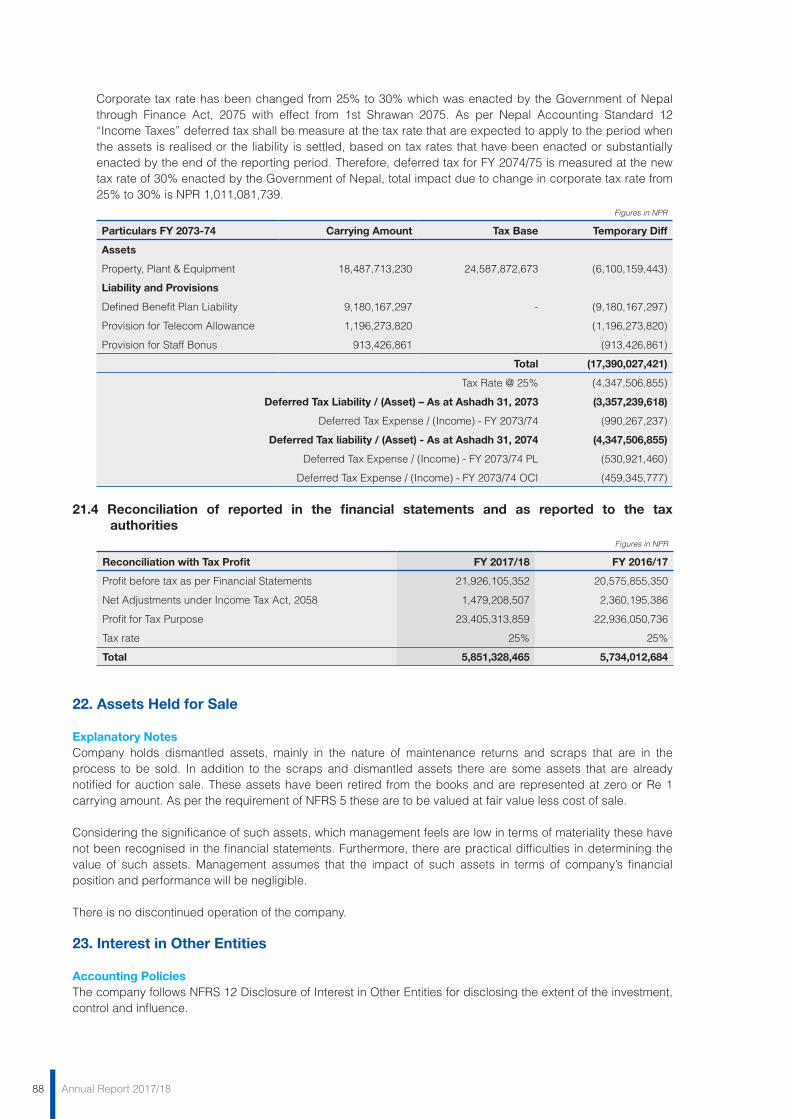
88 Annual Report 2017/18
Corporate tax rate has been changed from 25% to 30% which was enacted by the Government of Nepal through Finance Act, 2075 with effect from 1st Shrawan 2075. As per Nepal Accounting Standard 12 “Income Taxes” deferred tax shall be measure at the tax rate that are expected to apply to the period when the assets is realised or the liability is settled, based on tax rates that have been enacted or substantially enacted by the end of the reporting period. Therefore, deferred tax for FY 2074/75 is measured at the new tax rate of 30% enacted by the Government of Nepal, total impact due to change in corporate tax rate from 25% to 30% is NPR 1,011,081,739.
Figures in NPR
Particulars FY 2073-74 Carrying Amount Tax Base Temporary Diff
Assets
Property, Plant & Equipment 18,487,713,230 24,587,872,673 (6,100,159,443)
Liability and Provisions
Defined Benefit Plan Liability 9,180,167,297 - (9,180,167,297)
Provision for Telecom Allowance 1,196,273,820 (1,196,273,820)
Provision for Staff Bonus 913,426,861 (913,426,861)
Total (17,390,027,421)
Tax Rate @ 25% (4,347,506,855)
Deferred Tax Liability / (Asset) – As at Ashadh 31, 2073 (3,357,239,618)
Deferred Tax Expense / (Income) - FY 2073/74 (990,267,237)
Deferred Tax liability / (Asset) - As at Ashadh 31, 2074 (4,347,506,855)
Deferred Tax Expense / (Income) - FY 2073/74 PL (530,921,460)
Deferred Tax Expense / (Income) - FY 2073/74 OCI (459,345,777)
21.4 Reconciliation of reported in the financial statements and as reported to the tax authorities
Figures in NPR
Reconciliation with Tax Profit FY 2017/18 FY 2016/17
Profit before tax as per Financial Statements 21,926,105,352 20,575,855,350
Net Adjustments under Income Tax Act, 2058 1,479,208,507 2,360,195,386
Profit for Tax Purpose 23,405,313,859 22,936,050,736
Tax rate 25% 25%
Total 5,851,328,465 5,734,012,684
22. Assets Held for Sale
Explanatory Notes Company holds dismantled assets, mainly in the nature of maintenance returns and scraps that are in the process to be sold. In addition to the scraps and dismantled assets there are some assets that are already notified for auction sale. These assets have been retired from the books and are represented at zero or Re 1 carrying amount. As per the requirement of NFRS 5 these are to be valued at fair value less cost of sale.
Considering the significance of such assets, which management feels are low in terms of materiality these have not been recognised in the financial statements. Furthermore, there are practical difficulties in determining the value of such assets. Management assumes that the impact of such assets in terms of company’s financial position and performance will be negligible.
There is no discontinued operation of the company.
23. Interest in Other Entities
Accounting Policies The company follows NFRS 12 Disclosure of Interest in Other Entities for disclosing the extent of the investment, control and influence.
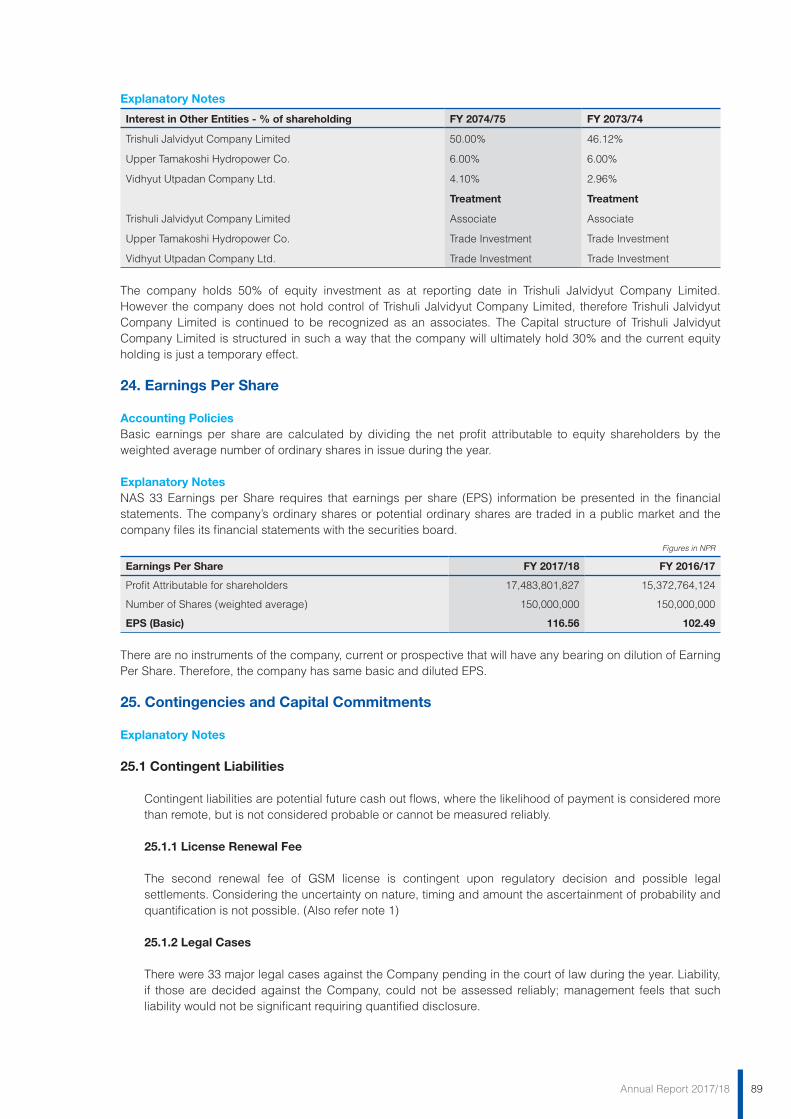
89Annual Report 2017/18
Explanatory Notes
Interest in Other Entities - % of shareholding FY 2074/75 FY 2073/74
Trishuli Jalvidyut Company Limited 50.00% 46.12%
Upper Tamakoshi Hydropower Co. 6.00% 6.00%
Vidhyut Utpadan Company Ltd. 4.10% 2.96%
Treatment Treatment
Trishuli Jalvidyut Company Limited Associate Associate
Upper Tamakoshi Hydropower Co. Trade Investment Trade Investment
Vidhyut Utpadan Company Ltd. Trade Investment Trade Investment
The company holds 50% of equity investment as at reporting date in Trishuli Jalvidyut Company Limited. However the company does not hold control of Trishuli Jalvidyut Company Limited, therefore Trishuli Jalvidyut Company Limited is continued to be recognized as an associates. The Capital structure of Trishuli Jalvidyut Company Limited is structured in such a way that the company will ultimately hold 30% and the current equity holding is just a temporary effect.
24. Earnings Per Share
Accounting Policies Basic earnings per share are calculated by dividing the net profit attributable to equity shareholders by the weighted average number of ordinary shares in issue during the year.
Explanatory Notes NAS 33 Earnings per Share requires that earnings per share (EPS) information be presented in the financial statements. The company’s ordinary shares or potential ordinary shares are traded in a public market and the company files its financial statements with the securities board.
Figures in NPR
Earnings Per Share FY 2017/18 FY 2016/17
Profit Attributable for shareholders 17,483,801,827 15,372,764,124
Number of Shares (weighted average) 150,000,000 150,000,000
EPS (Basic) 116.56 102.49
There are no instruments of the company, current or prospective that will have any bearing on dilution of Earning Per Share. Therefore, the company has same basic and diluted EPS.
25. Contingencies and Capital Commitments
Explanatory Notes
25.1 Contingent Liabilities
Contingent liabilities are potential future cash out flows, where the likelihood of payment is considered more than remote, but is not considered probable or cannot be measured reliably.
25.1.1 License Renewal Fee
The second renewal fee of GSM license is contingent upon regulatory decision and possible legal settlements. Considering the uncertainty on nature, timing and amount the ascertainment of probability and quantification is not possible. (Also refer note 1)
25.1.2 Legal Cases
There were 33 major legal cases against the Company pending in the court of law during the year. Liability, if those are decided against the Company, could not be assessed reliably; management feels that such liability would not be significant requiring quantified disclosure.
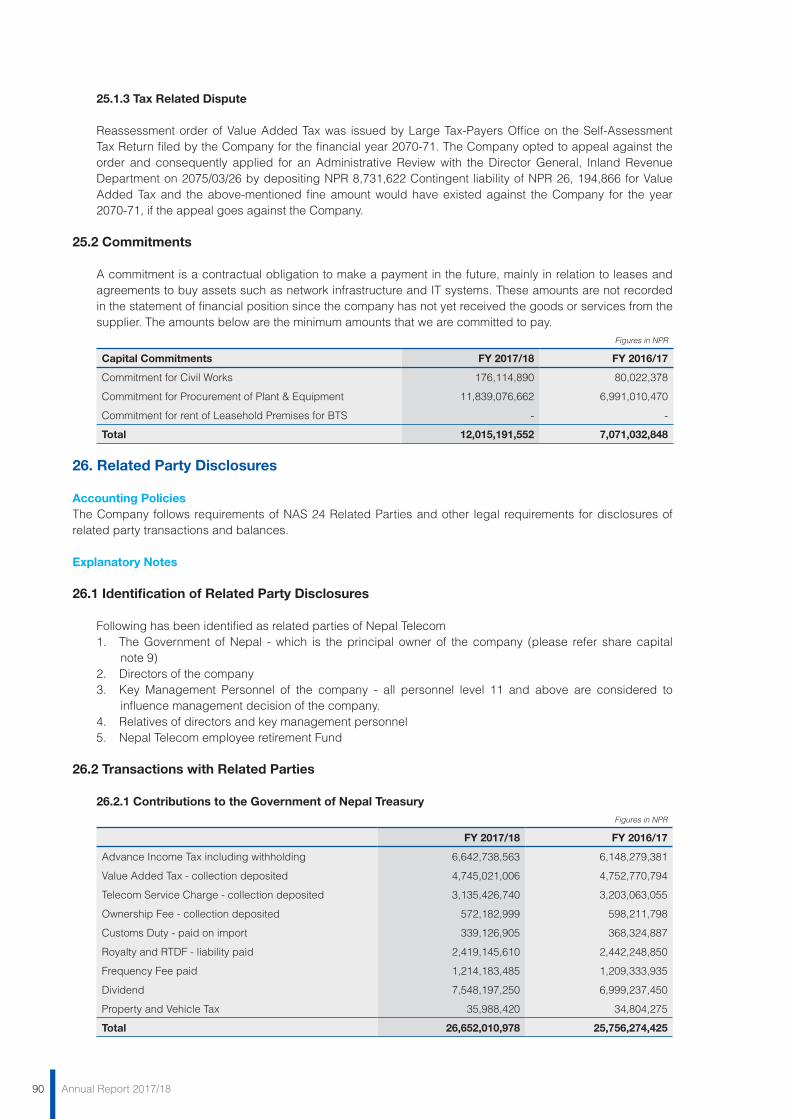
90 Annual Report 2017/18
25.1.3 Tax Related Dispute
Reassessment order of Value Added Tax was issued by Large Tax-Payers Office on the Self-Assessment Tax Return filed by the Company for the financial year 2070-71. The Company opted to appeal against the order and consequently applied for an Administrative Review with the Director General, Inland Revenue Department on 2075/03/26 by depositing NPR 8,731,622 Contingent liability of NPR 26, 194,866 for Value Added Tax and the above-mentioned fine amount would have existed against the Company for the year 2070-71, if the appeal goes against the Company.
25.2 Commitments
A commitment is a contractual obligation to make a payment in the future, mainly in relation to leases and agreements to buy assets such as network infrastructure and IT systems. These amounts are not recorded in the statement of financial position since the company has not yet received the goods or services from the supplier. The amounts below are the minimum amounts that we are committed to pay.
Figures in NPR
Capital Commitments FY 2017/18 FY 2016/17
Commitment for Civil Works 176,114,890 80,022,378
Commitment for Procurement of Plant & Equipment 11,839,076,662 6,991,010,470
Commitment for rent of Leasehold Premises for BTS - -
Total 12,015,191,552 7,071,032,848
26. Related Party Disclosures
Accounting Policies The Company follows requirements of NAS 24 Related Parties and other legal requirements for disclosures of related party transactions and balances.
Explanatory Notes 26.1 Identification of Related Party Disclosures
Following has been identified as related parties of Nepal Telecom1. The Government of Nepal - which is the principal owner of the company (please refer share capital
note 9)2. Directors of the company3. Key Management Personnel of the company - all personnel level 11 and above are considered to
influence management decision of the company.4. Relatives of directors and key management personnel5. Nepal Telecom employee retirement Fund
26.2 Transactions with Related Parties
26.2.1 Contributions to the Government of Nepal TreasuryFigures in NPR
FY 2017/18 FY 2016/17
Advance Income Tax including withholding 6,642,738,563 6,148,279,381
Value Added Tax - collection deposited 4,745,021,006 4,752,770,794
Telecom Service Charge - collection deposited 3,135,426,740 3,203,063,055
Ownership Fee - collection deposited 572,182,999 598,211,798
Customs Duty - paid on import 339,126,905 368,324,887
Royalty and RTDF - liability paid 2,419,145,610 2,442,248,850
Frequency Fee paid 1,214,183,485 1,209,333,935
Dividend 7,548,197,250 6,999,237,450
Property and Vehicle Tax 35,988,420 34,804,275
Total 26,652,010,978 25,756,274,425
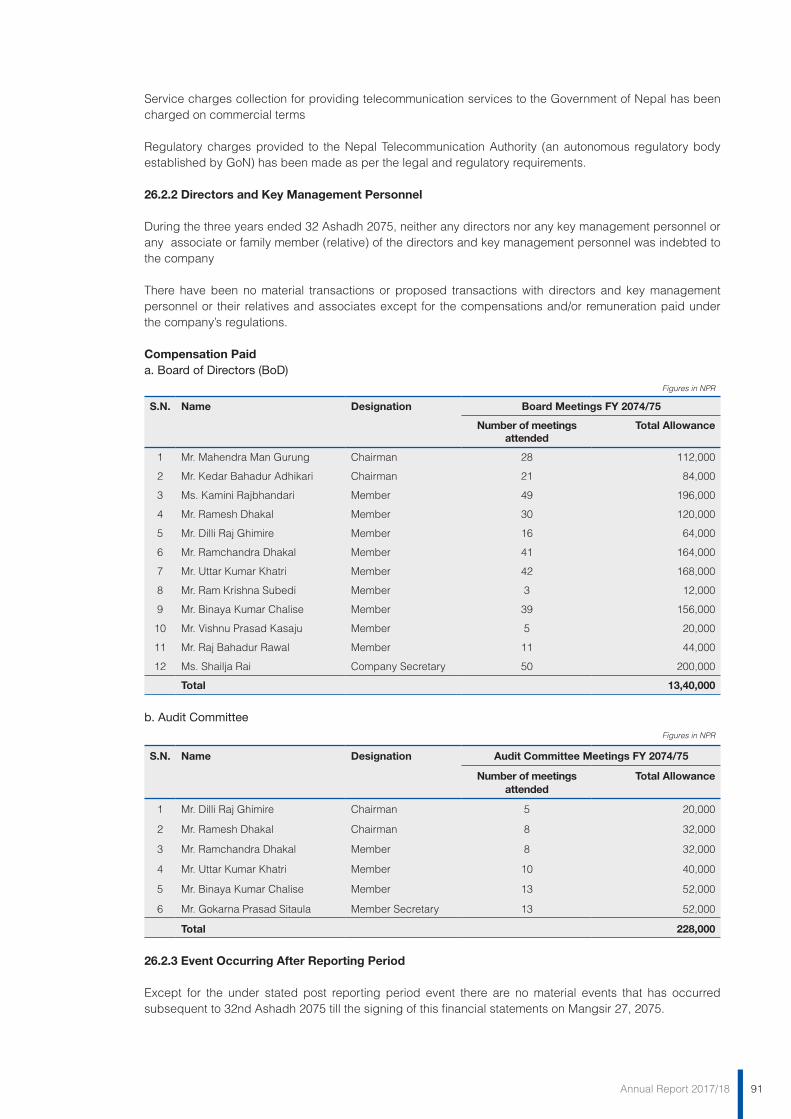
91Annual Report 2017/18
Service charges collection for providing telecommunication services to the Government of Nepal has been charged on commercial terms
Regulatory charges provided to the Nepal Telecommunication Authority (an autonomous regulatory body established by GoN) has been made as per the legal and regulatory requirements.
26.2.2 Directors and Key Management Personnel
During the three years ended 32 Ashadh 2075, neither any directors nor any key management personnel or any associate or family member (relative) of the directors and key management personnel was indebted to the company
There have been no material transactions or proposed transactions with directors and key management personnel or their relatives and associates except for the compensations and/or remuneration paid under the company’s regulations.
Compensation Paida. Board of Directors (BoD)
Figures in NPR
S.N. Name Designation Board Meetings FY 2074/75
Number of meetings attended
Total Allowance
1 Mr. Mahendra Man Gurung Chairman 28 112,000
2 Mr. Kedar Bahadur Adhikari Chairman 21 84,000
3 Ms. Kamini Rajbhandari Member 49 196,000
4 Mr. Ramesh Dhakal Member 30 120,000
5 Mr. Dilli Raj Ghimire Member 16 64,000
6 Mr. Ramchandra Dhakal Member 41 164,000
7 Mr. Uttar Kumar Khatri Member 42 168,000
8 Mr. Ram Krishna Subedi Member 3 12,000
9 Mr. Binaya Kumar Chalise Member 39 156,000
10 Mr. Vishnu Prasad Kasaju Member 5 20,000
11 Mr. Raj Bahadur Rawal Member 11 44,000
12 Ms. Shailja Rai Company Secretary 50 200,000
Total 13,40,000
b. Audit CommitteeFigures in NPR
S.N. Name Designation Audit Committee Meetings FY 2074/75
Number of meetings attended
Total Allowance
1 Mr. Dilli Raj Ghimire Chairman 5 20,000
2 Mr. Ramesh Dhakal Chairman 8 32,000
3 Mr. Ramchandra Dhakal Member 8 32,000
4 Mr. Uttar Kumar Khatri Member 10 40,000
5 Mr. Binaya Kumar Chalise Member 13 52,000
6 Mr. Gokarna Prasad Sitaula Member Secretary 13 52,000
Total 228,000
26.2.3 Event Occurring After Reporting Period
Except for the under stated post reporting period event there are no material events that has occurred subsequent to 32nd Ashadh 2075 till the signing of this financial statements on Mangsir 27, 2075.
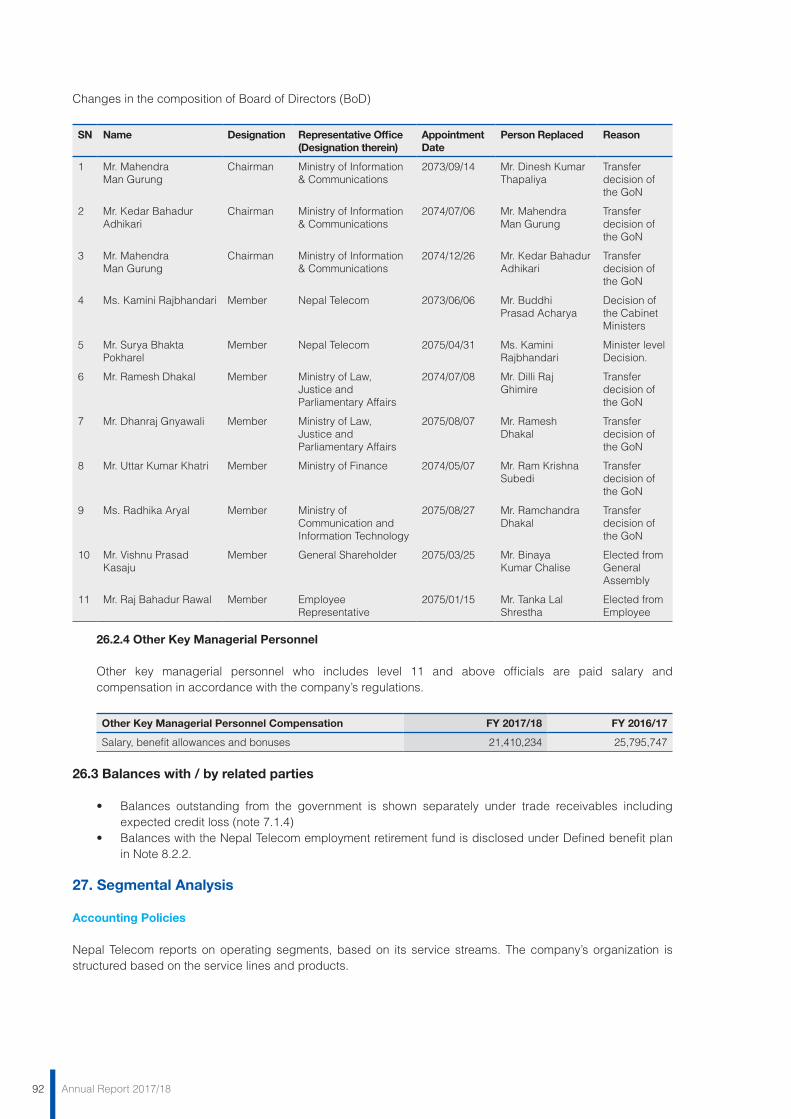
92 Annual Report 2017/18
Changes in the composition of Board of Directors (BoD)
SN Name Designation Representative Office(Designation therein)
Appointment Date
Person Replaced Reason
1 Mr. Mahendra Man Gurung
Chairman Ministry of Information& Communications
2073/09/14 Mr. Dinesh Kumar Thapaliya
Transfer decision of the GoN
2 Mr. Kedar Bahadur Adhikari
Chairman Ministry of Information& Communications
2074/07/06 Mr. Mahendra Man Gurung
Transfer decision of the GoN
3 Mr. Mahendra Man Gurung
Chairman Ministry of Information& Communications
2074/12/26 Mr. Kedar Bahadur Adhikari
Transfer decision of the GoN
4 Ms. Kamini Rajbhandari Member Nepal Telecom 2073/06/06 Mr. Buddhi Prasad Acharya
Decision of the Cabinet Ministers
5 Mr. Surya Bhakta Pokharel
Member Nepal Telecom 2075/04/31 Ms. Kamini Rajbhandari
Minister level Decision.
6 Mr. Ramesh Dhakal Member Ministry of Law, Justice and Parliamentary Affairs
2074/07/08 Mr. Dilli Raj Ghimire
Transfer decision of the GoN
7 Mr. Dhanraj Gnyawali Member Ministry of Law, Justice and Parliamentary Affairs
2075/08/07 Mr. Ramesh Dhakal
Transfer decision of the GoN
8 Mr. Uttar Kumar Khatri Member Ministry of Finance 2074/05/07 Mr. Ram Krishna Subedi
Transfer decision of the GoN
9 Ms. Radhika Aryal Member Ministry of Communication and Information Technology
2075/08/27 Mr. Ramchandra Dhakal
Transfer decision of the GoN
10 Mr. Vishnu Prasad Kasaju
Member General Shareholder 2075/03/25 Mr. Binaya Kumar Chalise
Elected from General Assembly
11 Mr. Raj Bahadur Rawal Member Employee Representative
2075/01/15 Mr. Tanka Lal Shrestha
Elected from Employee
26.2.4 Other Key Managerial Personnel
Other key managerial personnel who includes level 11 and above officials are paid salary and compensation in accordance with the company’s regulations.
Other Key Managerial Personnel Compensation FY 2017/18 FY 2016/17
Salary, benefit allowances and bonuses 21,410,234 25,795,747
26.3 Balances with / by related parties
• Balances outstanding from the government is shown separately under trade receivables includingexpected credit loss (note 7.1.4)
• BalanceswiththeNepalTelecomemploymentretirementfundisdisclosedunderDefinedbenefitplanin Note 8.2.2.
27. Segmental Analysis
Accounting Policies
Nepal Telecom reports on operating segments, based on its service streams. The company’s organization is structured based on the service lines and products.
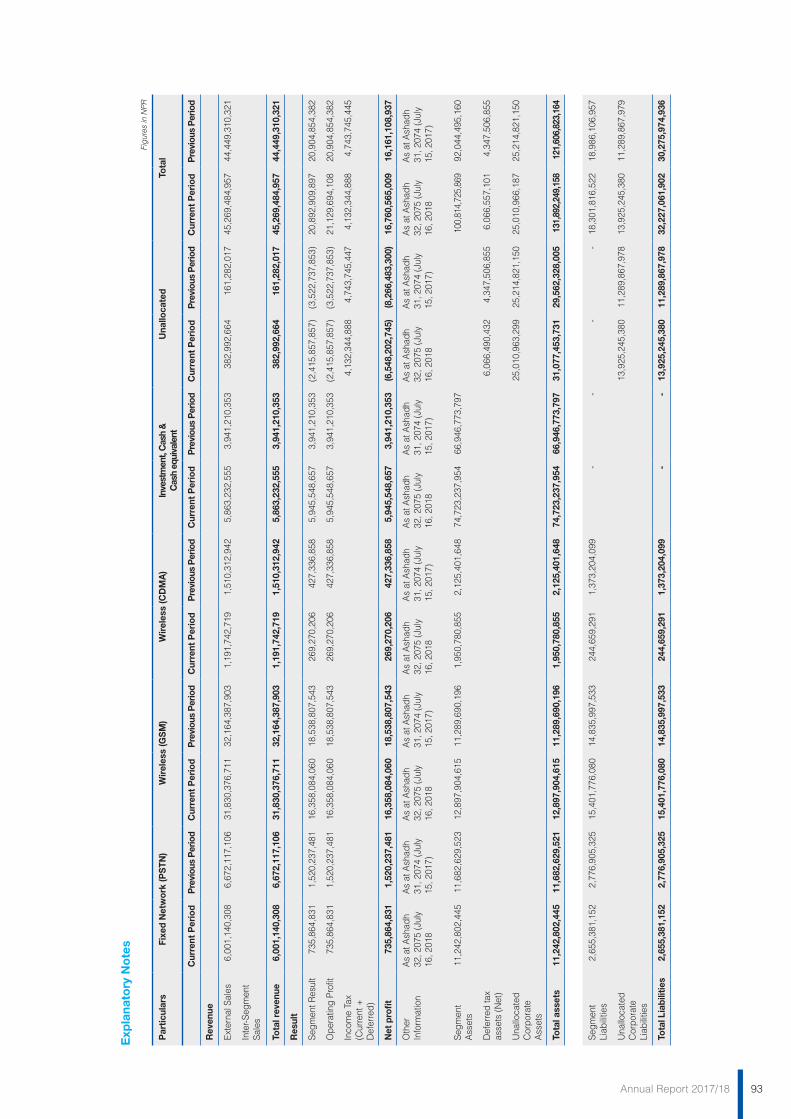
93Annual Report 2017/18
Exp
lana
tory
No
tes
Figu
res
in N
PR
Par
ticul
ars
Fixe
d N
etw
ork
(PS
TN)
Wir
eles
s (G
SM
)W
irel
ess
(CD
MA
)In
vest
men
t, C
ash
&
Cas
h eq
uiva
lent
Una
lloca
ted
Tota
l
Cur
rent
Per
iod
Pre
viou
s P
erio
dC
urre
nt P
erio
dP
revi
ous
Per
iod
Cur
rent
Per
iod
Pre
viou
s P
erio
dC
urre
nt P
erio
dP
revi
ous
Per
iod
Cur
rent
Per
iod
Pre
viou
s P
erio
dC
urre
nt P
erio
dP
revi
ous
Per
iod
Rev
enue
Exte
rnal
Sal
es6,
001,
140,
308
6,67
2,11
7,10
631
,830
,376
,711
32,1
64,3
87,9
031,
191,
742,
719
1,51
0,31
2,94
25,
863,
232,
555
3,94
1,21
0,35
338
2,99
2,66
416
1,28
2,01
745
,269
,484
,957
44,4
49,3
10,3
21
Inte
r-Seg
men
t Sa
les
Tota
l rev
enue
6,00
1,14
0,30
86,
672,
117,
106
31,8
30,3
76,7
1132
,164
,387
,903
1,19
1,74
2,71
91,
510,
312,
942
5,86
3,23
2,55
53,
941,
210,
353
382,
992,
664
161,
282,
017
45,2
69,4
84,9
5744
,449
,310
,321
Res
ult
Segm
ent R
esul
t73
5,86
4,83
11,
520,
237,
481
16,3
58,0
84,0
6018
,538
,807
,543
269,
270,
206
427,
336,
858
5,94
5,54
8,65
73,
941,
210,
353
(2,4
15,8
57,8
57)
(3,5
22,7
37,8
53)
20,8
92,9
09,8
9720
,904
,854
,382
Ope
ratin
g Pr
ofit
735,
864,
831
1,52
0,23
7,48
116
,358
,084
,060
18,5
38,8
07,5
4326
9,27
0,20
642
7,33
6,85
85,
945,
548,
657
3,94
1,21
0,35
3(2
,415
,857
,857
)(3
,522
,737
,853
)21
,129
,694
,108
20,9
04,8
54,3
82
Inco
me
Tax
(Current+
Def
erre
d)
4,13
2,34
4,88
84,
743,
745,
447
4,13
2,34
4,88
84,
743,
745,
445
Net
pro
fit73
5,86
4,83
11,
520,
237,
481
16,3
58,0
84,0
6018
,538
,807
,543
269,
270,
206
427,
336,
858
5,94
5,54
8,65
73,
941,
210,
353
(6,5
48,2
02,7
45)
(8,2
66,4
83,3
00)
16,7
60,5
65,0
0916
,161
,108
,937
Oth
er
Info
rmat
ion
As
at A
shad
h 32
, 207
5 (J
uly
16, 2
018
As
at A
shad
h 31
, 207
4 (J
uly
15, 2
017)
As
at A
shad
h 32
, 207
5 (J
uly
16, 2
018
As
at A
shad
h 31
, 207
4 (J
uly
15, 2
017)
As
at A
shad
h 32
, 207
5 (J
uly
16, 2
018
As
at A
shad
h 31
, 207
4 (J
uly
15, 2
017)
As
at A
shad
h 32
, 207
5 (J
uly
16, 2
018
As
at A
shad
h 31
, 207
4 (J
uly
15, 2
017)
As
at A
shad
h 32
, 207
5 (J
uly
16, 2
018
As
at A
shad
h 31
, 207
4 (J
uly
15, 2
017)
As
at A
shad
h 32
, 207
5 (J
uly
16, 2
018
As
at A
shad
h 31
, 207
4 (J
uly
15, 2
017)
Segm
ent
Ass
ets
11,2
42,8
02,4
4511
,682
,629
,523
12,8
97,9
04,6
1511
,289
,690
,196
1,95
0,78
0,85
52,
125,
401,
648
74,7
23,2
37,9
5466
,946
,773
,797
100,
814,
725,
869
92,0
44,4
95,1
60
Def
erre
d ta
x as
sets
(Net
)6,
066,
490,
432
4,34
7,50
6,85
56,
066,
557,
101
4,34
7,50
6,85
5
Una
lloca
ted
Cor
pora
te
Ass
ets
25,0
10,9
63,2
9925
,214
,821
,150
25,0
10,9
66,1
8725
,214
,821
,150
Tota
l ass
ets
11,2
42,8
02,4
4511
,682
,629
,521
12,8
97,9
04,6
1511
,289
,690
,196
1,95
0,78
0,85
52,
125,
401,
648
74,7
23,2
37,9
5466
,946
,773
,797
31,0
77,4
53,7
3129
,562
,328
,005
131,
892,
249,
158
121,
606,
823,
164
Segm
ent
Liab
ilitie
s2,
655,
381,
152
2,77
6,90
5,32
515
,401
,776
,080
14,8
35,9
97,5
3324
4,65
9,29
11,
373,
204,
099
--
--
18,3
01,8
16,5
2218
,986
,106
,957
Una
lloca
ted
Cor
pora
te
Liab
ilitie
s
13,9
25,2
45,3
8011
,289
,867
,978
13,9
25,2
45,3
8011
,289
,867
,979
Tota
l Lia
bilit
ies
2,65
5,38
1,15
22,
776,
905,
325
15,4
01,7
76,0
8014
,835
,997
,533
244,
659,
291
1,37
3,20
4,09
9-
-13
,925
,245
,380
11,2
89,8
67,9
7832
,227
,061
,902
30,2
75,9
74,9
36

94 Annual Report 2017/18
27.1 Assumptions for Segmental Reporting1. Revenue, expenses, assets and liabilities that relate to the Company as a whole which are not
allocable to segments on direct and/or reasonable basis have been included under “unallocated revenue/expenses/assets/liabilities”.
2. Revenue is taken on the basis of product line for each services. 3. Inter connection revenue is allocated on the basis of revenue before considering inter-connection
revenue.4. Depreciation and Operation and Maintenance expenses are allocated on the basis of Property, Plant
and Equipment for each service.
27.2 Geographical Segments
Nepal Telecom operates from six regional directorates located in six different regions of the country. However, the services delivered from those regional offices are also managed by centrally located service directorates. Therefore, information on regional segments for the purpose of NFRS 8 Operating Segments cannot be segregated and the management feels that the costs to develop such information would be excessive than the benefit that it would derive.
Further the geographical operation is within the single legal jurisdiction and operational environment. Therefore, the company assumes to operate in a single geographical segment.
28. Interim Financial Reporting
The company follows requirement of Security Exchange Board of Nepal (SEBON), Nepal Stock Exchange (NEPSE) and the requirement of Companies Act, 2006 for publishing interim financial reporting in the print media. These requirements are materially aligned with the requirements of NAS 34 and Interim Financial reporting as per NAS 34 is published in the company’s website www.ntc.net.np.
The deferred tax reported in the interim financial statements and its effect on profitability differs from the audited accounts. This is attributed to the change in corporate tax rate from 25% to 30% and its impact on deferred tax and the level of estimation being used in preparation of interim financial reporting as against the precise calculation for the audited financial statements.
29. Prior Period Adjustments and Exceptional Items
Previously reported financial statements and financial statements for the current financial year as reported in the regulatory financial statements has been restated in compliances with the requirements of NFRS.
The following adjustments are made for the identified omissions and misstatements for the financial year 2074-75 as per the provision of NAS 8. Net prior period amount of NPR 63,535,657 has been adjusted to the identified financial year. In case where such identification could not be made, adjustment has been made in the opening equity.
S.N. Particulars Expenditure Income
1 Excess Telecom Allowance provision for 2073 to 2074 written back and deficit provision booked
- 120,509,363
2 Non-Operating Income - 22,171,538
3 Inter-unit adjustment 3,076 -
4 Frequency Fees 77,263,021 -
5 Operating Income (Rental Reversal) 860,347
6 Operating Expenses 9,276,899 6,537,405
Total 86,542,996 150,078,653
Exceptional items wherever they occur are disclosed separately.
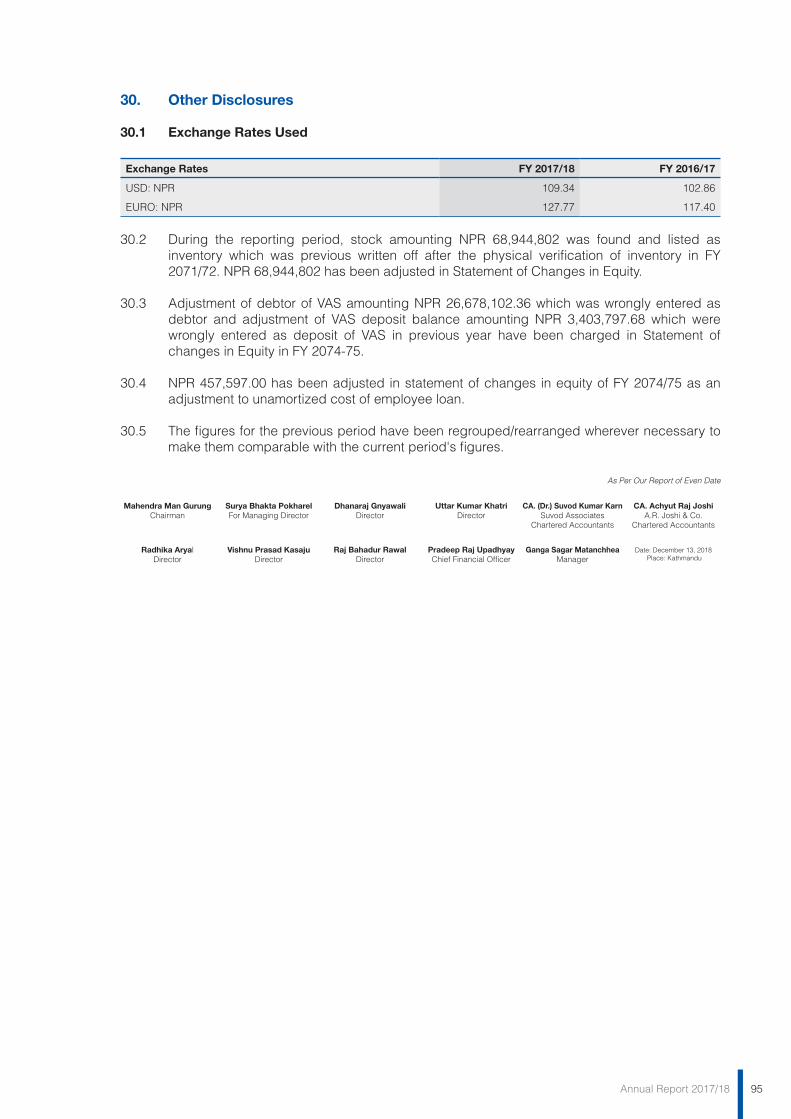
95Annual Report 2017/18
30. Other Disclosures
30.1 Exchange Rates Used
Exchange Rates FY 2017/18 FY 2016/17
USD: NPR 109.34 102.86
EURO: NPR 127.77 117.40
30.2 During the reporting period, stock amounting NPR 68,944,802 was found and listed as inventory which was previous written off after the physical verification of inventory in FY 2071/72. NPR 68,944,802 has been adjusted in Statement of Changes in Equity.
30.3 Adjustment of debtor of VAS amounting NPR 26,678,102.36 which was wrongly entered as debtor and adjustment of VAS deposit balance amounting NPR 3,403,797.68 which were wrongly entered as deposit of VAS in previous year have been charged in Statement of changes in Equity in FY 2074-75.
30.4 NPR 457,597.00 has been adjusted in statement of changes in equity of FY 2074/75 as an adjustment to unamortized cost of employee loan.
30.5 The figures for the previous period have been regrouped/rearranged wherever necessary to make them comparable with the current period's figures.
As Per Our Report of Even Date
Mahendra Man GurungChairman
Radhika AryalDirector
Raj Bahadur RawalDirector
Dhanaraj GnyawaliDirector
Pradeep Raj UpadhyayChief Financial Officer
Uttar Kumar KhatriDirector
Surya Bhakta PokharelFor Managing Director
Vishnu Prasad KasajuDirector
CA. (Dr.) Suvod Kumar KarnSuvod Associates
Chartered Accountants
Ganga Sagar MatanchheaManager
CA. Achyut Raj JoshiA.R. Joshi & Co.
Chartered Accountants
Date: December 13, 2018 Place: Kathmandu
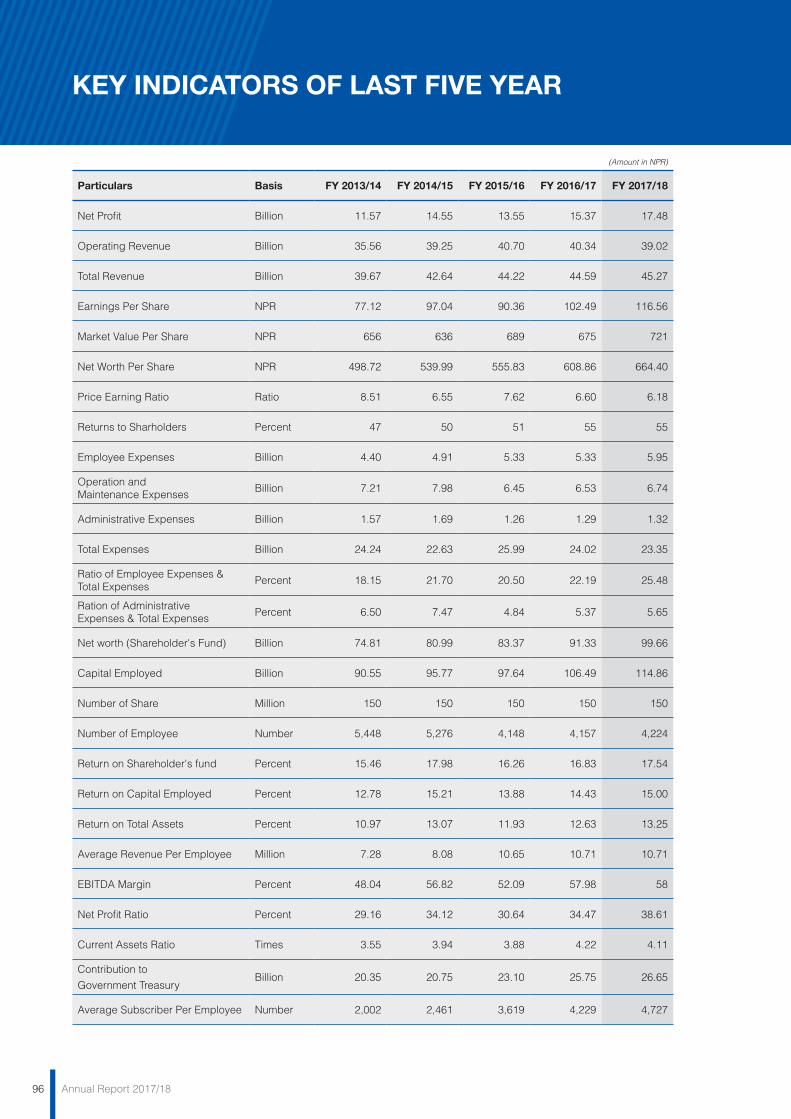
96 Annual Report 2017/18
KEY INDICATORS OF LAST FIVE YEAR
(Amount in NPR)
Particulars Basis FY 2013/14 FY 2014/15 FY 2015/16 FY 2016/17 FY 2017/18
Net Profit Billion 11.57 14.55 13.55 15.37 17.48
Operating Revenue Billion 35.56 39.25 40.70 40.34 39.02
Total Revenue Billion 39.67 42.64 44.22 44.59 45.27
Earnings Per Share NPR 77.12 97.04 90.36 102.49 116.56
Market Value Per Share NPR 656 636 689 675 721
Net Worth Per Share NPR 498.72 539.99 555.83 608.86 664.40
Price Earning Ratio Ratio 8.51 6.55 7.62 6.60 6.18
Returns to Sharholders Percent 47 50 51 55 55
Employee Expenses Billion 4.40 4.91 5.33 5.33 5.95
Operation andMaintenance Expenses
Billion 7.21 7.98 6.45 6.53 6.74
Administrative Expenses Billion 1.57 1.69 1.26 1.29 1.32
Total Expenses Billion 24.24 22.63 25.99 24.02 23.35
Ratio of Employee Expenses &Total Expenses
Percent 18.15 21.70 20.50 22.19 25.48
Ration of Administrative Expenses & Total Expenses
Percent 6.50 7.47 4.84 5.37 5.65
Net worth (Shareholder's Fund) Billion 74.81 80.99 83.37 91.33 99.66
Capital Employed Billion 90.55 95.77 97.64 106.49 114.86
Number of Share Million 150 150 150 150 150
Number of Employee Number 5,448 5,276 4,148 4,157 4,224
Return on Shareholder's fund Percent 15.46 17.98 16.26 16.83 17.54
Return on Capital Employed Percent 12.78 15.21 13.88 14.43 15.00
Return on Total Assets Percent 10.97 13.07 11.93 12.63 13.25
Average Revenue Per Employee Million 7.28 8.08 10.65 10.71 10.71
EBITDA Margin Percent 48.04 56.82 52.09 57.98 58
Net Profit Ratio Percent 29.16 34.12 30.64 34.47 38.61
Current Assets Ratio Times 3.55 3.94 3.88 4.22 4.11
Contribution to
Government TreasuryBillion 20.35 20.75 23.10 25.75 26.65
Average Subscriber Per Employee Number 2,002 2,461 3,619 4,229 4,727
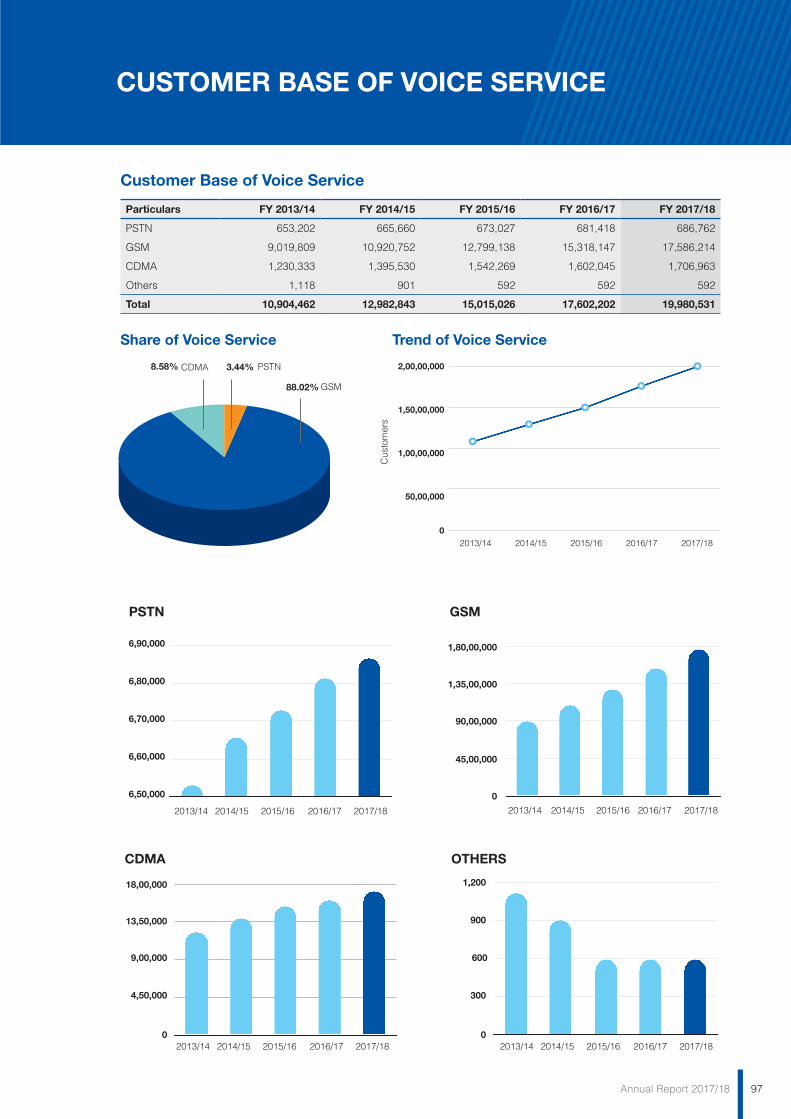
97Annual Report 2017/18
PSTN
Share of Voice Service Trend of Voice Service
CDMA OTHERS
GSM
6,60,000
6,70,000
6,80,000
6,90,000
6,50,000
4,50,000
0
9,00,000
13,50,000
18,00,000 1,200
300
0
600
900
45,00,000
90,00,000
1,35,00,000
1,80,00,000
0
2013/14
2013/14 2013/14
2014/15
2014/15 2014/15
2015/16
2015/16 2015/16
2016/17
2016/17 2016/17
2017/18
2017/18 2017/18
2013/14 2014/15 2015/16 2016/17 2017/18
GSM
CDMA PSTN8.58%
Cus
tom
ers
3.44%
88.02%
Customer Base of Voice Service
Particulars FY 2013/14 FY 2014/15 FY 2015/16 FY 2016/17 FY 2017/18
PSTN 653,202 665,660 673,027 681,418 686,762
GSM 9,019,809 10,920,752 12,799,138 15,318,147 17,586,214
CDMA 1,230,333 1,395,530 1,542,269 1,602,045 1,706,963
Others 1,118 901 592 592 592
Total 10,904,462 12,982,843 15,015,026 17,602,202 19,980,531
CUSTOMER BASE OF VOICE SERVICE
1,50,00,000
1,00,00,000
50,00,000
2,00,00,000
02013/14 2014/15 2015/16 2016/17 2017/18
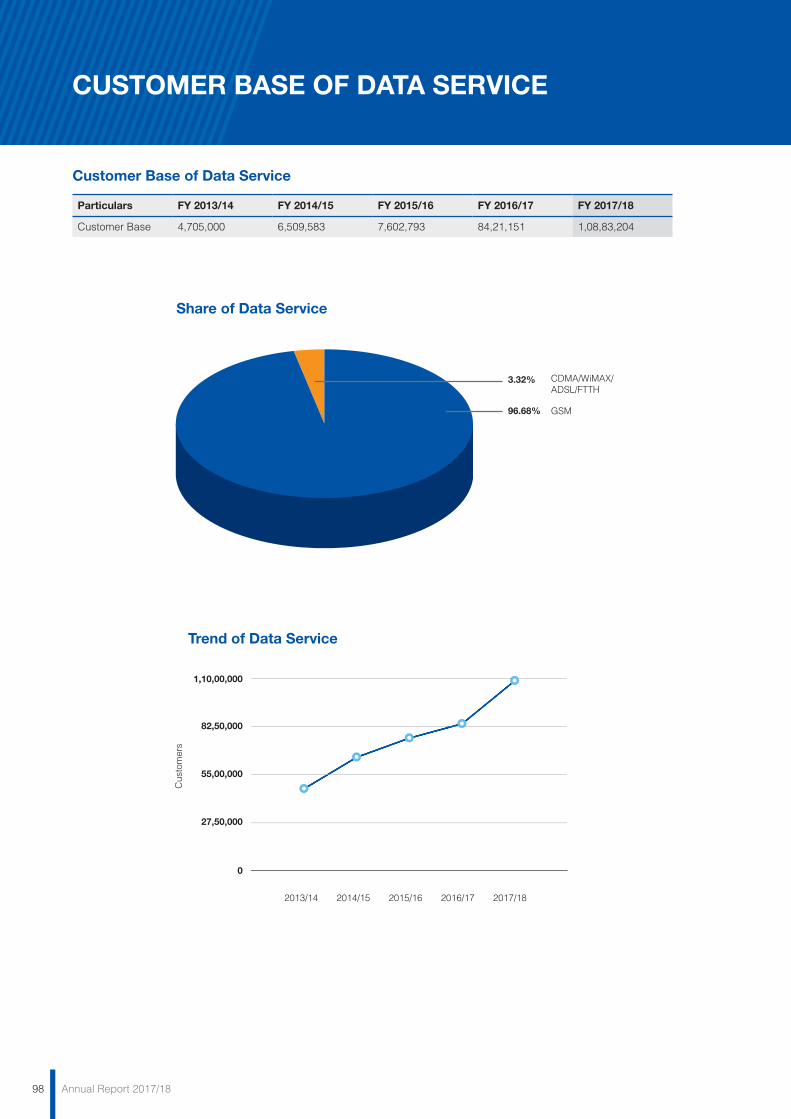
98 Annual Report 2017/18
CUSTOMER BASE OF DATA SERVICE
Particulars FY 2013/14 FY 2014/15 FY 2015/16 FY 2016/17 FY 2017/18
Customer Base 4,705,000 6,509,583 7,602,793 84,21,151 1,08,83,204
Customer Base of Data Service
96.68%
3.32%
GSM
CDMA/WiMAX/ADSL/FTTH
Share of Data Service
82,50,000
55,00,000
27,50,000
1,10,00,000
0
2013/14 2014/15 2015/16 2016/17 2017/18
Cus
tom
ers
Trend of Data Service
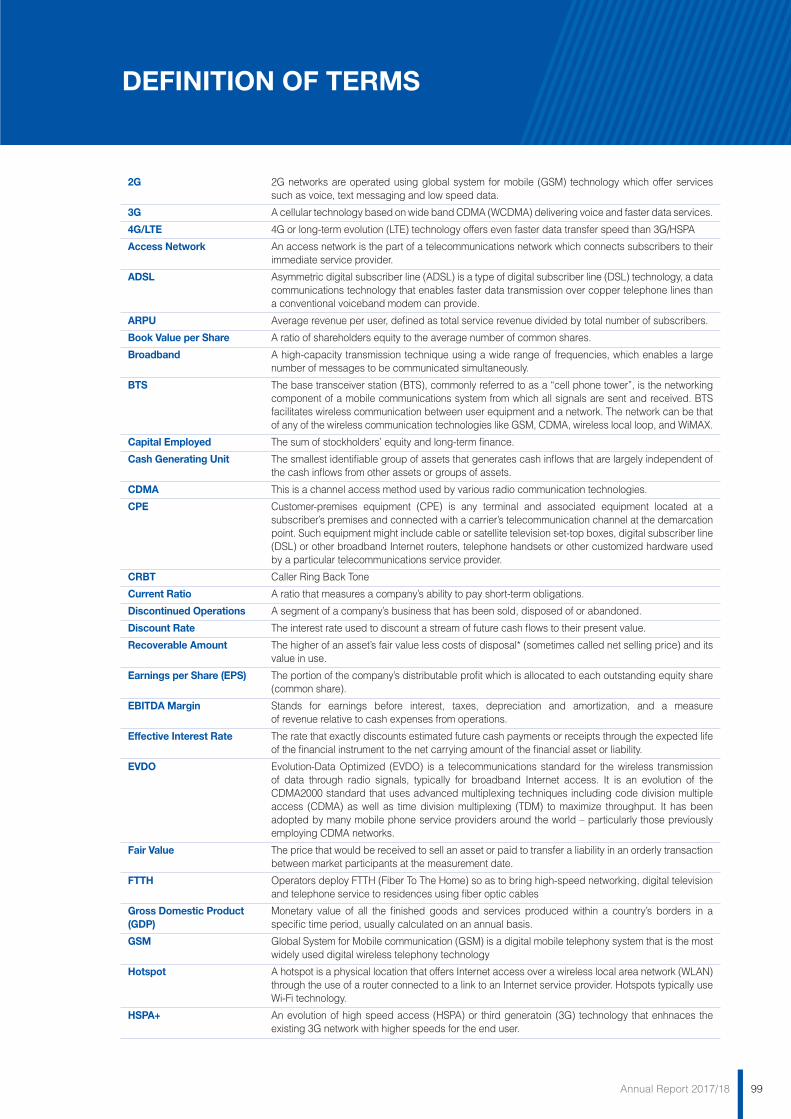
99Annual Report 2017/18
2G 2G networks are operated using global system for mobile (GSM) technology which offer services such as voice, text messaging and low speed data.
3G A cellular technology based on wide band CDMA (WCDMA) delivering voice and faster data services.
4G/LTE 4G or long-term evolution (LTE) technology offers even faster data transfer speed than 3G/HSPA
Access Network An access network is the part of a telecommunications network which connects subscribers to their immediate service provider.
ADSL Asymmetric digital subscriber line (ADSL) is a type of digital subscriber line (DSL) technology, a data communications technology that enables faster data transmission over copper telephone lines than a conventional voiceband modem can provide.
ARPU Average revenue per user, defined as total service revenue divided by total number of subscribers.
Book Value per Share A ratio of shareholders equity to the average number of common shares.
Broadband A high-capacity transmission technique using a wide range of frequencies, which enables a large number of messages to be communicated simultaneously.
BTS The base transceiver station (BTS), commonly referred to as a “cell phone tower”, is the networking component of a mobile communications system from which all signals are sent and received. BTS facilitates wireless communication between user equipment and a network. The network can be that of any of the wireless communication technologies like GSM, CDMA, wireless local loop, and WiMAX.
Capital Employed The sum of stockholders’ equity and long-term finance.
Cash Generating Unit The smallest identifiable group of assets that generates cash inflows that are largely independent of the cash inflows from other assets or groups of assets.
CDMA This is a channel access method used by various radio communication technologies.
CPE Customer-premises equipment (CPE) is any terminal and associated equipment located at a subscriber’s premises and connected with a carrier’s telecommunication channel at the demarcation point. Such equipment might include cable or satellite television set-top boxes, digital subscriber line (DSL) or other broadband Internet routers, telephone handsets or other customized hardware used by a particular telecommunications service provider.
CRBT Caller Ring Back Tone
Current Ratio A ratio that measures a company’s ability to pay short-term obligations.
Discontinued Operations A segment of a company’s business that has been sold, disposed of or abandoned.
Discount Rate The interest rate used to discount a stream of future cash flows to their present value.
Recoverable Amount The higher of an asset’s fair value less costs of disposal* (sometimes called net selling price) and its value in use.
Earnings per Share (EPS) The portion of the company’s distributable profit which is allocated to each outstanding equity share (common share).
EBITDA Margin Stands for earnings before interest, taxes, depreciation and amortization, and a measure of revenue relative to cash expenses from operations.
Effective Interest Rate The rate that exactly discounts estimated future cash payments or receipts through the expected life of the financial instrument to the net carrying amount of the financial asset or liability.
EVDO Evolution-Data Optimized (EVDO) is a telecommunications standard for the wireless transmission of data through radio signals, typically for broadband Internet access. It is an evolution of the CDMA2000 standard that uses advanced multiplexing techniques including code division multiple access (CDMA) as well as time division multiplexing (TDM) to maximize throughput. It has been adopted by many mobile phone service providers around the world – particularly those previously employing CDMA networks.
Fair Value The price that would be received to sell an asset or paid to transfer a liability in an orderly transaction between market participants at the measurement date.
FTTH Operators deploy FTTH (Fiber To The Home) so as to bring high-speed networking, digital television and telephone service to residences using fiber optic cables
Gross Domestic Product Monetary value of all the finished goods and services produced within a country’s borders in a (GDP) specific time period, usually calculated on an annual basis.
GSM Global System for Mobile communication (GSM) is a digital mobile telephony system that is the most widely used digital wireless telephony technology
Hotspot A hotspot is a physical location that offers Internet access over a wireless local area network (WLAN) through the use of a router connected to a link to an Internet service provider. Hotspots typically use Wi-Fi technology.
HSPA+ An evolution of high speed access (HSPA) or third generatoin (3G) technology that enhnaces the existing 3G network with higher speeds for the end user.
DEFINITION OF TERMS
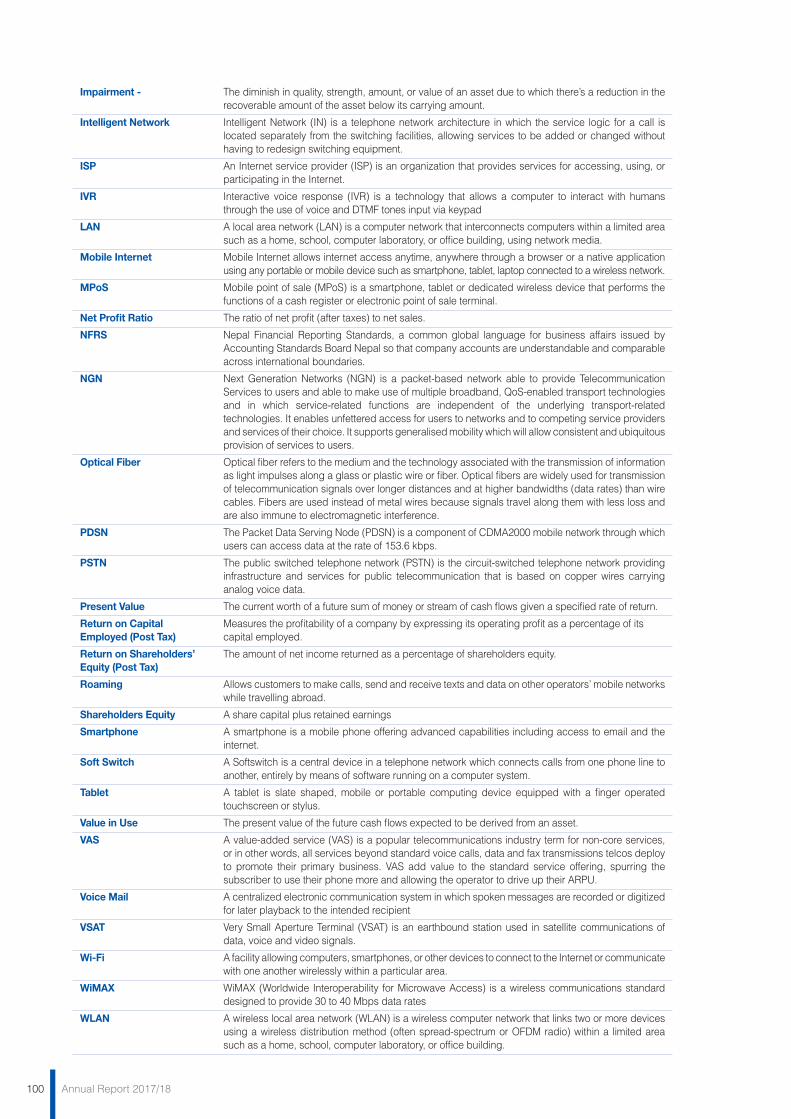
100 Annual Report 2017/18
Impairment - The diminish in quality, strength, amount, or value of an asset due to which there’s a reduction in the recoverable amount of the asset below its carrying amount.
Intelligent Network Intelligent Network (IN) is a telephone network architecture in which the service logic for a call is located separately from the switching facilities, allowing services to be added or changed without having to redesign switching equipment.
ISP An Internet service provider (ISP) is an organization that provides services for accessing, using, or participating in the Internet.
IVR Interactive voice response (IVR) is a technology that allows a computer to interact with humans through the use of voice and DTMF tones input via keypad
LAN A local area network (LAN) is a computer network that interconnects computers within a limited area such as a home, school, computer laboratory, or office building, using network media.
Mobile Internet Mobile Internet allows internet access anytime, anywhere through a browser or a native application using any portable or mobile device such as smartphone, tablet, laptop connected to a wireless network.
MPoS Mobile point of sale (MPoS) is a smartphone, tablet or dedicated wireless device that performs the functions of a cash register or electronic point of sale terminal.
Net Profit Ratio The ratio of net profit (after taxes) to net sales.
NFRS Nepal Financial Reporting Standards, a common global language for business affairs issued by Accounting Standards Board Nepal so that company accounts are understandable and comparable across international boundaries.
NGN Next Generation Networks (NGN) is a packet-based network able to provide Telecommunication Services to users and able to make use of multiple broadband, QoS-enabled transport technologies and in which service-related functions are independent of the underlying transport-related technologies. It enables unfettered access for users to networks and to competing service providers and services of their choice. It supports generalised mobility which will allow consistent and ubiquitous provision of services to users.
Optical Fiber Optical fiber refers to the medium and the technology associated with the transmission of information as light impulses along a glass or plastic wire or fiber. Optical fibers are widely used for transmission of telecommunication signals over longer distances and at higher bandwidths (data rates) than wire cables. Fibers are used instead of metal wires because signals travel along them with less loss and are also immune to electromagnetic interference.
PDSN The Packet Data Serving Node (PDSN) is a component of CDMA2000 mobile network through which users can access data at the rate of 153.6 kbps.
PSTN The public switched telephone network (PSTN) is the circuit-switched telephone network providing infrastructure and services for public telecommunication that is based on copper wires carrying analog voice data.
Present Value The current worth of a future sum of money or stream of cash flows given a specified rate of return.
Return on Capital Measures the profitability of a company by expressing its operating profit as a percentage of itsEmployed (Post Tax) capital employed.
Return on Shareholders’ The amount of net income returned as a percentage of shareholders equity.Equity (Post Tax)
Roaming Allows customers to make calls, send and receive texts and data on other operators’ mobile networks while travelling abroad.
Shareholders Equity A share capital plus retained earnings
Smartphone A smartphone is a mobile phone offering advanced capabilities including access to email and the internet.
Soft Switch A Softswitch is a central device in a telephone network which connects calls from one phone line to another, entirely by means of software running on a computer system.
Tablet A tablet is slate shaped, mobile or portable computing device equipped with a finger operated touchscreen or stylus.
Value in Use The present value of the future cash flows expected to be derived from an asset.
VAS A value-added service (VAS) is a popular telecommunications industry term for non-core services, or in other words, all services beyond standard voice calls, data and fax transmissions telcos deploy to promote their primary business. VAS add value to the standard service offering, spurring the subscriber to use their phone more and allowing the operator to drive up their ARPU.
Voice Mail A centralized electronic communication system in which spoken messages are recorded or digitized for later playback to the intended recipient
VSAT Very Small Aperture Terminal (VSAT) is an earthbound station used in satellite communications of data, voice and video signals.
Wi-Fi A facility allowing computers, smartphones, or other devices to connect to the Internet or communicate with one another wirelessly within a particular area.
WiMAX WiMAX (Worldwide Interoperability for Microwave Access) is a wireless communications standard designed to provide 30 to 40 Mbps data rates
WLAN A wireless local area network (WLAN) is a wireless computer network that links two or more devices using a wireless distribution method (often spread-spectrum or OFDM radio) within a limited area such as a home, school, computer laboratory, or office building.
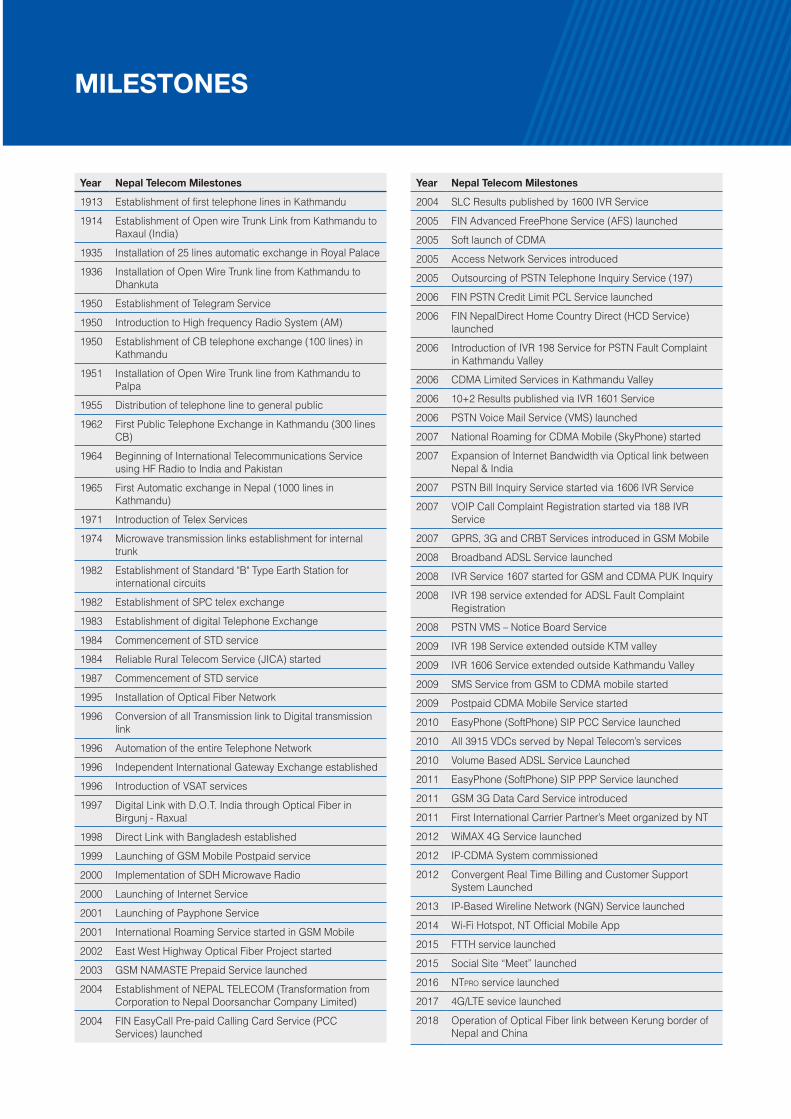
MILESTONES
Year Nepal Telecom Milestones
1913 Establishment of first telephone lines in Kathmandu
1914 Establishment of Open wire Trunk Link from Kathmandu to Raxaul (India)
1935 Installation of 25 lines automatic exchange in Royal Palace
1936 Installation of Open Wire Trunk line from Kathmandu to Dhankuta
1950 Establishment of Telegram Service
1950 Introduction to High frequency Radio System (AM)
1950 Establishment of CB telephone exchange (100 lines) in Kathmandu
1951 Installation of Open Wire Trunk line from Kathmandu to Palpa
1955 Distribution of telephone line to general public
1962 First Public Telephone Exchange in Kathmandu (300 lines CB)
1964 Beginning of International Telecommunications Service using HF Radio to India and Pakistan
1965 First Automatic exchange in Nepal (1000 lines in Kathmandu)
1971 Introduction of Telex Services
1974 Microwave transmission links establishment for internal trunk
1982 Establishment of Standard "B" Type Earth Station for international circuits
1982 Establishment of SPC telex exchange
1983 Establishment of digital Telephone Exchange
1984 Commencement of STD service
1984 Reliable Rural Telecom Service (JICA) started
1987 Commencement of STD service
1995 Installation of Optical Fiber Network
1996 Conversion of all Transmission link to Digital transmission link
1996 Automation of the entire Telephone Network
1996 Independent International Gateway Exchange established
1996 Introduction of VSAT services
1997 Digital Link with D.O.T. India through Optical Fiber in Birgunj - Raxual
1998 Direct Link with Bangladesh established
1999 Launching of GSM Mobile Postpaid service
2000 Implementation of SDH Microwave Radio
2000 Launching of Internet Service
2001 Launching of Payphone Service
2001 International Roaming Service started in GSM Mobile
2002 East West Highway Optical Fiber Project started
2003 GSM NAMASTE Prepaid Service launched
2004 Establishment of NEPAL TELECOM (Transformation from Corporation to Nepal Doorsanchar Company Limited)
2004 FIN EasyCall Pre-paid Calling Card Service (PCC Services) launched
Year Nepal Telecom Milestones
2004 SLC Results published by 1600 IVR Service
2005 FIN Advanced FreePhone Service (AFS) launched
2005 Soft launch of CDMA
2005 Access Network Services introduced
2005 Outsourcing of PSTN Telephone Inquiry Service (197)
2006 FIN PSTN Credit Limit PCL Service launched
2006 FIN NepalDirect Home Country Direct (HCD Service) launched
2006 Introduction of IVR 198 Service for PSTN Fault Complaint in Kathmandu Valley
2006 CDMA Limited Services in Kathmandu Valley
2006 10+2 Results published via IVR 1601 Service
2006 PSTN Voice Mail Service (VMS) launched
2007 National Roaming for CDMA Mobile (SkyPhone) started
2007 Expansion of Internet Bandwidth via Optical link between Nepal & India
2007 PSTN Bill Inquiry Service started via 1606 IVR Service
2007 VOIP Call Complaint Registration started via 188 IVR Service
2007 GPRS, 3G and CRBT Services introduced in GSM Mobile
2008 Broadband ADSL Service launched
2008 IVR Service 1607 started for GSM and CDMA PUK Inquiry
2008 IVR 198 service extended for ADSL Fault Complaint Registration
2008 PSTN VMS – Notice Board Service
2009 IVR 198 Service extended outside KTM valley
2009 IVR 1606 Service extended outside Kathmandu Valley
2009 SMS Service from GSM to CDMA mobile started
2009 Postpaid CDMA Mobile Service started
2010 EasyPhone (SoftPhone) SIP PCC Service launched
2010 All 3915 VDCs served by Nepal Telecom’s services
2010 Volume Based ADSL Service Launched
2011 EasyPhone (SoftPhone) SIP PPP Service launched
2011 GSM 3G Data Card Service introduced
2011 First International Carrier Partner’s Meet organized by NT
2012 WiMAX 4G Service launched
2012 IP-CDMA System commissioned
2012 Convergent Real Time Billing and Customer Support System Launched
2013 IP-Based Wireline Network (NGN) Service launched
2014 Wi-Fi Hotspot, NT Official Mobile App
2015 FTTH service launched
2015 Social Site “Meet” launched
2016 NTpro service launched
2017 4G/LTE sevice launched
2018 Operation of Optical Fiber link between Kerung border of Nepal and China Dhalke Repeater near Jomsom

Nepal Doorsanchar Company LimitedCentral Office, Bhadrakaliplaza, Kathmandu
twitter.com/ndcl_nt
facebook.com/NepalTelecom.NT
www.ntc.net.np
Nepal Telecom
Annual Report2017-2018
Nepal Doorsanchar Company Limited
Nepal Telecom


![g]kfn ^]lnsd - Nepal Telecom :: Nepal Doorsanchar … 4 3459 BHOOP RAJ SHARMA 4 3 3610 DAMBAR DEV OJHA 5 1 7174 HOM BAHADUR SHUSLING 6 8 6995 LAXMI BHUJEL CHHETRI 7 10 4488 PRAMOD](https://static.fdocuments.net/doc/165x107/5ab50d7e7f8b9ab47e8c813e/gkfn-lnsd-nepal-telecom-nepal-doorsanchar-4-3459-bhoop-raj-sharma-4.jpg)

