
NEONODE, INC - AnnualReports.com · Neonode Inc. (collectively with its subsidiaries, i s referred...
68
NEONODE, INC FORM 10-K (Annual Report) Filed 03/12/15 for the Period Ending 12/31/14 Telephone 46 0 8 667 17 17 CIK 0000087050 Symbol NEON SIC Code 3679 - Electronic Components, Not Elsewhere Classified Industry Electronic Equipment & Parts Sector Technology Fiscal Year 12/31 http://www.edgar-online.com © Copyright 2016, EDGAR Online, Inc. All Rights Reserved. Distribution and use of this document restricted under EDGAR Online, Inc. Terms of Use.
Transcript of NEONODE, INC - AnnualReports.com · Neonode Inc. (collectively with its subsidiaries, i s referred...

NEONODE, INC
FORM 10-K(Annual Report)
Filed 03/12/15 for the Period Ending 12/31/14
Telephone 46 0 8 667 17 17
CIK 0000087050Symbol NEON
SIC Code 3679 - Electronic Components, Not Elsewhere ClassifiedIndustry Electronic Equipment & Parts
Sector TechnologyFiscal Year 12/31
http://www.edgar-online.com© Copyright 2016, EDGAR Online, Inc. All Rights Reserved.
Distribution and use of this document restricted under EDGAR Online, Inc. Terms of Use.

UNITED STATES
SECURITIES AND EXCHANGE COMMISSION Washington, D.C. 20549
FORM 10-K
Commission File No. 1-35526
NEONODE INC. (Exact name of Registrant as specified in its charter)
Storgatan 23C, 114 55 Stockholm, Sweden
(Address of Principal Executive Office and Zip Code)
+46 (0) 8 667 17 17 (Registrant’s Telephone Number, including Area Code)
Securities registered pursuant to Section 12(b) of the Act:
Securities registered pursuant to Section 12(g) of the Act: None
Indicate by check mark if the registrant is a well-known seasoned issuer, as defined in Rule 405 of the Securities Act. Yes � No �
Indicate by check mark if the registrant is not required to file reports pursuant to Section 13 or Section 15(d) of the Act. Yes � No � Indicate by check mark whether the registrant: (1) has filed all reports required to be filed by Section 13 or 15(d) of the Securities Exchange Act of 1934 during the preceding 12 months (or such shorter period that the registrant was required to file such reports), and (2) has been subject to such filing requirements for the past 90 days. Yes � No �
Indicate by check mark whether the registrant has submitted electronically and posted on its corporate Web site, if any, every Interactive Data File required to be submitted and posted pursuant to Rule 405 of Regulation S-T during the preceding 12 months (or for such shorter period that the registrant was required to submit and post such files). Yes � No � Indicate by check mark if disclosure of delinquent filers pursuant to Item 405 of Regulation S-K is not contained herein and will not be contained, to the best of the registrant’s knowledge, in definitive proxy or information statements incorporated by reference in Part III of this Form 10-K or any amendment to this Form 10-K. � Indicate by check mark whether the registrant is a large accelerated filer, an accelerated filer, a non-accelerated filer or a smaller reporting company. See the definitions of “large accelerated filer”, “accelerated filer” and “smaller reporting company” in Rule 12b-2 of the Exchange Act.
Indicate by check mark whether the registrant is a shell company (as defined in Rule 12b-2 of the Act. Yes � No � The approximate aggregate market value of voting and non-voting common equity held by non-affiliates of the registrant, based on the closing price for the registrant’s common stock on June 30, 2014 (the last business day of the registrant’s most recently completed second fiscal quarter) as reported on the NASDAQ Stock Market, was $106,591,762. The number of shares of the registrant’s common stock outstanding as of March 9, 2015 was 40,455,352.
DOCUMENTS INCORPORATED BY REFERENCE
Portions of the registrant’s definitive proxy statement for the registrant’s 2015 Annual Meeting of Stockholders are incorporated by reference as set forth in Part III of this Annual Report. The registrant intends to file such definitive proxy statement with the Securities and Exchange Commission within 120 days of
� � � � ANNUAL REPORT PURSUANT TO SECTION 13 OR 15(d) OF THE SECURITIES EXCHANGE ACT OF 1934 For the fiscal year ended December 31, 2014
or
� � � � TRANSITION REPORT PURSUANT TO SECTION 13 OR 15(d) OF THE SECURITIES EXCHANGE ACT OF 1934
For the transition period from ________ to _________
Delaware 94-1517641 (State or Other Jurisdiction of (I.R.S. Employer Incorporation or Organization) Identification Number)
Title of Each Class Name of Each Exchange on Which Registered Common Stock, par value $0.001 per share The NASDAQ Stock Market LLC
Large accelerated filer � Accelerated filer � Non-accelerated filer � Smaller reporting company �

the registrant’s fiscal year ended December 31, 2014.

NEONODE INC.
2014 ANNUAL REPORT ON FORM 10-K
TABLE OF CONTENTS
PART I SPECIAL NOTE ON FORWARD-LOOKING STATEMENTS 3 Item 1. BUSINESS 4 Item 1A. RISK FACTORS 11 Item 1B. UNRESOLVED STAFF COMMENTS 16 Item 2. PROPERTIES 17 Item 3. LEGAL PROCEEDINGS 17 Item 4. MINE SAFETY DISCLOSURES 17
PART II Item 5. MARKET FOR REGISTRANT’S COMMON EQUITY, RELATED STOCKHOLDER MATTERS AND ISSUER PURCHASES
OF EQUITY SECURITIES 17 Item 6. SELECTED FINANCIAL DATA 18 Item 7. MANAGEMENT’S DISCUSSION AND ANALYSIS OF FINANCIAL CONDITION AND RESULTS OF OPERATIONS 19 Item 7A. QUANTITATIVE AND QUALITATIVE DISCLOSURES ABOUT MARKET RISK 29 Item 8. FINANCIAL STATEMENTS AND SUPPLEMENTARY DATA 30 Item 9. CHANGES IN AND DISAGREEMENTS WITH ACCOUNTANTS ON ACCOUNTING AND FINANCIAL DISCLOSURE 57 Item 9A. CONTROLS AND PROCEDURES 57 Item 9B. OTHER INFORMATION 59
PART III Item 10. DIRECTORS, EXECUTIVE OFFICERS AND CORPORATE GOVERNANCE 59 Item 11. EXECUTIVE COMPENSATION 59 Item 12. SECURITY OWNERSHIP OF CERTAIN BENEFICIAL OWNERS AND MANAGEMENT AND RELATED STOCKHOLDER
MATTERS 59 Item 13. CERTAIN RELATIONSHIPS AND RELATED TRANSACTIONS, AND DIRECTOR INDEPENDENCE 59 Item 14. PRINCIPAL ACCOUNTING FEES AND SERVICES 59
PART IV Item 15. EXHIBITS, FINANCIAL STATEMENT SCHEDULES 59 SIGNATURES 61
2

SPECIAL NOTE ON FORWARD-LOOKING STATEMENTS
This Annual Report contains forward-looking statements within the meaning of Section 27A of the Securities Act of 1933, as amended, and Section
21E of the Securities Exchange Act of 1934, as amended, adopted pursuant to the Private Securities Litigation Reform Act of 1995. Statements that are not purely historical may be forward-looking. You can identify some forward-looking statements by the use of words such as “believes,” “anticipates,” “expects,” “intends” and similar expressions. Forward-looking statements involve inherent risks and uncertainties regarding events, conditions and financial trends that may affect our future plans of operation, business strategy, results of operations and financial position. A number of important factors could cause actual results to differ materially from those included within or contemplated by such forward-looking statements, including, but not limited to risks relating to the uncertainty of growth in market acceptance for our technology, our history of losses since inception, our ability to remain competitive in response to new technologies, the costs to defend, as well as risks of losing, patents and intellectual property rights, our customer concentration and dependence on a limited number of customers, a reliance on our future customers’ ability to develop and sell products that incorporate our technology, the uncertainty of demand for our technology in certain markets, the length of a product development and release cycle, our ability to manage growth effectively, our dependence on key members of our management and development team, our remediation and detection of material weaknesses in our internal control over financial reporting, and our ability to obtain adequate capital to fund future operations, For a discussion of these and other factors that could cause actual results to differ from those contemplated in the forward-looking statements, please see ‘‘Item 1A. Risk Factors’’ and elsewhere in this Annual Report, and in our publicly available filings with the Securities and Exchange Commission. Forward-looking statements reflect our analysis only as of the date of this Annual Report. Because actual events or results may differ materially from those discussed in or implied by forward-looking statements made by us or on our behalf, you should not place undue reliance on any forward-looking statement. We do not undertake responsibility to update or revise any of these factors or to announce publicly any revision to forward-looking statements, whether as a result of new information, future events or otherwise.
3

PART I
Neonode Inc. (collectively with its subsidiaries, is referred to in this Annual Report as “Neonode”, “we”, “us”, “our”, “registrant”, or “Company”)
develops and licenses user interfaces and optical infrared touch technology. Our patented technology offers multiple features including the ability to sense an object’s size, depth, velocity, pressure, and proximity to any type of surface. We license our multi-touch technology to Original Equipment Manufacturers (“OEMs”) and Original Design Manufacturers (“ODMs”) who incorporate it into devices that they produce and sell. OEMs and ODMs use our touch technology in controller designed specifically for our touch technology. Our technology licensing model allows us to focus on the development of solutions for touchscreens and touch-enabled surfaces. We do not manufacture products or components.
As of December 31, 2014, we had thirty-five technology license agreements with global OEMs and ODMs. Sixteen of our customers are currently
shipping products and we anticipate other customers will initiate product shipments as they complete their final product development and release cycle throughout 2015 and onwards. In addition, we are currently developing prototype products and are engaged in product engineering design discussions with numerous global OEMs and ODMs who are in the process of qualifying our touch technology for incorporation in various products. The development and release cycle for these products typically takes six to thirty-six months.
Our Company
Neonode Inc., formerly known as SBE, Inc., was incorporated in the State of Delaware on September 4, 1997. SBE’s name was changed to Neonode Inc. upon the completion of a merger on August 10, 2007 between SBE and the parent company of Neonode AB, a company founded in February 2004 and incorporated in Sweden. As a result of the merger, the business and operations of Neonode AB became the primary business and operations of Neonode Inc. Our principal executive office is located in Stockholm, Sweden. Our office in the United States is located in Santa Clara, California.
ITEM 1. BUSINESS
4

In 2008, we established a subsidiary Neonode Technologies AB to develop and license touchscreen technology. In 2013, we established additional
subsidiaries: Neonode Japan Inc., (Japan); Neno User Interface Solutions AB (Sweden); NEON Technology Inc. (U.S.); and Neonode Americas Inc. (U.S.). In 2014, we established one additional subsidiary: Neonode Korea Ltd. (South Korea). In 2015, we have established one additional subsidiary as of the filing date of this Annual Report: Neonode Taiwan Ltd.
Our Touch Solution
We develop and license user interface and touch solutions. We offer our patented family of touch solutions under the registered trademarks
MultiSensing ® and zForce ® . Our optical touch technology is capable of projecting a full plane of light beams in free air or over any flat touch surface. Our technology can also send light into a fluid or a glass to achieve a flush design without a bezel. An object touching the touch surface obstructs a portion of the projected light beams. This small variance of signal is detected with sensitive light sensors connected to our touch controllers that process the analog signals and produce touch object coordinates.
For users, our solution provides “sense enablement” through touch and proximity sensing. Consumers experience our technology in products such as
laptop computers, all-in-one computers and stand-alone monitors running on Microsoft Windows and Google Chrome operating systems, printer products, GPS devices, e-Readers, tablets, touch panels for automobiles, household appliances, mobile phones, wearable electronics, games and toys. In addition to traditional screens, our technology can make any surface – including water and air – touch functional.
For OEMs and ODMs, our solution offers industrial design flexibility, low power consumption, and cost-effective manufacturing. OEMS and
ODMs can incorporate our touch technology into a wide range of devices such as tablets and e-Readers, printers, computers, mobile phones, wearables, toys and gaming consoles, and advanced automotive infotainment systems. We also offer engineering consulting services to our OEM and ODM customers on a flat rate or hourly rate basis.
Touch Technologies There are various technologies for touchscreen and touch-enabled surfaces available in the market with differing profiles, power consumption, level
of maturity, and cost:
The two dominant types of touchscreen technologies available are capacitive and resistive. A capacitive touchscreen reacts to a conductive object by
sensing the difference in capacitance between two areas on the sensor surface or between the finger and the ground. Capacitive touchscreens are suitable if the user has unimpeded contact between the finger and the screen. A resistive touchscreen is pressure-sensitive. Resistive touchscreens are suitable for detailed work and for selection of particular spot on a screen. Resistive technology is not useful for sweeping gestures or motion, such as zooming in and out.
Optical Touch Advantages Our optical technology projects light across the touch surface or detection area without any need for an extra physical layer to be added. It can be
used with thick gloves or any other object. Our optical touch technology also can be fully waterproofed and will provide touch functionality even when fully submerged. In addition to traditional touch interaction on the screen, our optional touch technology can be used in the free space around the screen or product using proximity sensing.
• Optical touch technology uses light beams that are broken, reflected by a finger or other non-conductive object to detect a touch. • Capacitive touchscreens typically use one or several layers of transparent conductive material typically indium tin oxide applied to the inner
structure of the LCD or on a glass or plastic layer in front on the LCD to sense touch activation. • Resistive touchscreens use conductive and resistive layers separated by thin space. • Acoustic pulse recognition touch technology uses piezoelectric transducers at positions of the screen to turn the mechanical energy of a touch
vibration into an electronic signal. • Surface acoustic wave touchscreens use ultrasonic waves that pass over the screen.
• In-cell optical touch technology embeds photo sensors or conductive sensors directly into a Liquid Crystal Display (“LCD”) glass to act like a low-resolution camera to “see” the shadow of the finger.
• Dispersive signal touch technology uses sensors to detect the mechanical energy in the glass occurring due to a touch.
5

We believe our optical touch technology has a number of key advantages over other touch screen technologies:
Unlike competing technologies, our optical touch screen technology does not require glass. The removal of the glass reduces glare, enhances image
clarity, optimizes power consumption, lightens weight, and lowers cost. In contrast, other touch technologies such as capacitive and resistive require a physical touch sensor layer, typically covering the display, in order to detect touches. Layering technology required to activate the capacitive and resistive sensors can be very costly. Glass or plastic layers used in capacitive touch may also increase the friction of the touch surface giving a less enjoyable feel.
Controller Chips
We develop, but do not produce controller chips or other components. Under our licensing model, our OEM and ODM customers use customized single optical controller chips developed in collaboration with Texas Instruments designed specifically for our optical touch technology. These controller chips can only be sold to customers who have a technology license agreement with Neonode.
The NN1001, the first generation optical controller chip, was developed pursuant to an Analog Device Development Agreement between Neonode
and Texas Instruments entered into on February 4, 2011 and effective as of January 24, 2010. The NN1001 began shipping to customers in May 2012. The NN1002, the second generation optical controller chip, was developed pursuant to an Analog Device Development Agreement between
Neonode and Texas Instruments entered into on April 25, 2013 effective December 6, 2012. The NN1002 is currently in development and has not been released to mass production. Through December 31, 2014, we had made no payments under the NN1002 agreement.
The NN1003 is the third generation controller chip and is currently in development with a major global chip component supplier. The NN1003 is
designed for large screen applications. The NN1001, NN1002, and NN1003 controller chips are designed to simplify integration, reduce cost, and increase performance.
● Our optical technology does not require additional layers that may dilute the image quality of the display or cause unwanted reflections and glare making reading the display difficult;
● Our optical technology is more responsive than capacitive sensor technology and, as a result, is quicker and less prone to misread; ● Our optical technology requires no downward pressure on the touch surface in order to select or move items on the touch surface in stark
contrast to resistive touch screens; ● Our optical technology is cost-efficient due to the lower cost of materials and simple and high yield manufacturing process; ● Our optical technology enables multiple methods of input, such as continuous tracking of multiple fingers, taps to hit keys, sweeps to zoom in
or out, and gestures to write text or symbols directly on the touch surface; ● Our optical technology works in all climates and environments and does not require any special properties from the object used; and ● Our optical technology does not require any black space or borders on the sides of the display and can therefore enable a slimmer design
around a display leading to smaller and better looking devices.
• The NN1001 and NN1002 have scanning speeds of 1000 Hz (latency down to 1ms). • The NN1002 is designed to support advanced power management and enables touch detection even when the device is in sleep or off mode. • The NN1002 is designed to consume less than 1mW at 100Hz.
6
Our Market
E-Readers and Tablets
Our touch technology is widely used in e-Readers and tablets. Since 2011, nearly 18 million e-Reader and tablet units have been shipped containing our touch technology by customers such as Amazon, Kobo, Barnes & Noble, Sony and Deutsche Telekom. Sony discontinued its e-Reader products in 2014 and is no longer manufacturing or shipping any e-Readers. However, Sony is currently shipping a 13.3 inch writing tablet named “Digital Paper” that integrates our technology. Customers such as LeapFrog Enterprises, Oregon Scientific and LG are shipping tablets with our technology integrated to enhance the process of children’s learnings.
Printers and Office Equipment
Photo printers and printers combining printer/scanner/fax functions typically require feature-rich menus and settings to deliver the best user experience, and OEMs increasingly are replacing mechanical buttons with touchscreen displays. We have signed agreements with the top three global leading printers and office equipment OEMs including Hewlett Packard (“HP”). HP started shipping the first consumer printer with our touch technology integrated in early 2014 and today they have more than twenty printer models on the market using our technology. Other customers currently in development phase are expected to have printers and office equipment ready for retail rollouts throughout 2016.
Computers and Monitors
Our touch technology is suitable for laptops, all-in-one computers and stand-alone monitors. Our technology provides for a state of the art modern looking industrial design with no bezels and a flush edge to edge design optimized for the new generation of LCD panels with only a few millimeters of black frame. Because it does not require any expensive and brittle glass in front of the LCD to carry the touch sensors, our touch solution can result in a 50% or more reduction in the cost to implement touch functionality and in a glare free product with up to two kilograms less weight. In addition, our technology scales over different display sizes and can handle curved displays. We have technology license agreements and are in product design phase with tier one computer and monitor OEMs that we expect will begin shipping products in the second half of 2015. We are also in the process of attaining Microsoft Windows 10 certification on top of our already received Windows 8.1 certification.
Automotive
Touch interface displays are becoming standard equipment in vehicles. Our touch technology is able to fulfill stringent requirements to operate in an
automotive environment, including electrical, temperature, moisture and vibration standards. Unlike competing technologies such as resistive and projected capacitive, our optical touch solutions does not require an additional layer to be placed in front of the screen which otherwise would reduce the readability of the screen and causes glare and reflections. In the second quarter of 2013, Volvo began offering a touch-enabled Human Machine Interfaces (“HMI”) infotainment system as a dealer installed aftermarket retrofit product that uses our touch technology. In the fourth quarter of 2013, a leading Brazilian bus manufacturer, Marcopolo S.A., launched its Torino Series incorporating our touch technology. In the fourth quarter 2014, Volvo launched their new XC-90 incorporating a 9.7 inch display using our touch technology. In the fourth quarter 2014, the new MG GT was launched also using our technology. We believe that our optical touch solutions are positioned to make inroads in the automotive market by providing brighter, more readable displays, with a full operating temperature range that are easily usable while wearing gloves. We are currently engaged with several global automotive OEMs and their tier one suppliers developing automotive HMI, infotainment and innovative entry systems. These projects typically have long development cycles that can take as long as four to five years before any meaningful production and license fee generation will occur.
• The NN1002 and NN1003 are designed to be synchronized to touch enabled larger areas by using multiple chips. • The NN1002 and NN1003 are designed to support simultaneous scanning leading to significantly higher scanning speeds and reduced power
consumption.
7

Mobile Phones, Wearables and Accessories, Games
Our touch and proximity sensor technology platform for mobile phones can be integrated in the phone or in a phone mobile phone protective case that enables an interaction with applications not only on the screen but also in the space around and above the mobile phone. We also believe our touch technology is suitable for smart watches, fitness devices, activity trackers, medical monitors, multifunction keyboards and GPS tracking devices, gaming and toy products. These market segments benefit from our touch solutions low power consumption and bill of material, geometrical design freedom (circular touch) and independence from a brittle, glossy, heavy and costly glass.
Home Electronics
Mechanical buttons, dials and membrane switches still mostly control machines in the kitchen and laundry room. New designs can make use of our touch technology with or without an underlying display. For example, touch sensitive buttons can now be a pre-printed array on metal, glass or any other material providing for easy cleaning and extremely long life without the failures and wear-out mechanisms found in mechanical buttons, switches and dials. A touch panel can include illumination without a display. A feature-rich device, like a high-end dryer design, can be streamlined and user friendly with a touch-enabled display or interaction surface. We are in discussions with OEMs in the home electronics market who are designing touch enabled products such as kitchen fans and stovetops, ovens and laundry room washers and dryers.
Distribution, Sales and Marketing
We consider OEMs and ODMs to be our primary customers. OEMs and ODMs determine the design requirements and make the overall decision regarding the use of our user interface and touch technology in their products. The use and pricing of our user interface and touch technology are governed by a technology licensing agreement.
Our sales staff solicits prospective customers and receives substantial technical assistance and support from our internal engineering resources
because of the highly technical nature of our product solutions. We expect that sales will frequently result from our sales efforts that involve executive/senior management, design engineers, and our sales personnel interacting with our potential customers’ decision-makers throughout the product development and order process.
Our sales are normally negotiated and executed in U.S. Dollars.
Our sales force and marketing operations are managed out of our office in Stockholm, Sweden. Our current sales force is comprised of sales offices
located in the U.S., Sweden, South Korea, Taiwan and Japan.
Technology Agreements
As of December 31, 2014, we have entered into thirty-five technology license agreements compared to thirty-three and twenty-four license agreements as of December 31, 2013 and 2012, respectively. The products related to these license agreements include e-Readers, tablets, mobile phones, commercial and consumer printers, automotive consoles, home appliances, toys and games and GPS devices.
We are dependent on a limited number of OEM and ODM customers and the loss of any one of these customers could have a material adverse effect
on our future revenue stream. In the short term, we anticipate that we remain dependent on a limited number of customers for substantially all of our future revenues. Failure to anticipate or respond adequately to technological developments in our industry, changes in customer or supplier requirements or changes in regulatory requirements or industry standards, or any significant delays in the development or introduction of products or services could have a material adverse effect on our business, operating results and cash flows.
Our customers are located in the United States of America (“U.S.”), Europe and Asia. As of December 31, 2014 three customers represented approximately 87% of the Company’s consolidated accounts receivable.
8

As of December 31, 2013 two customers represented approximately 56% of the Company’s consolidated accounts receivable.
Our net revenues for the year ended December 31, 2014 were earned from thirty-two customers. Customers who accounted for 10% or more of our
net revenues during the year ended December 31, 2014 are as follows. • Hewlett-Packard Company – 24% • KOBO Inc. – 10% • Leap Frog Enterprises Inc. – 11% • Sony Corporation – 10% Our revenues for the year ended December 31, 2013 were earned from twenty-nine customers. Customers who accounted for 10% or more of our net
revenues during the year ended December 31, 2013 are as follows. • KOBO Inc. – 28% • Netronix Inc. – 18% • Leap Frog Enterprises Inc. – 12% • Sony Corporation – 11% Our revenues for the year ended December 31, 2012 were earned from twenty customers. Customers who accounted for 10% or more of our net
revenues during the year ended December 31, 2012 are as follows: • Amazon.com Inc. – 32% • KOBO Inc. – 26% • Sony Corporation – 17%
Geographical Data
The following table presents our net revenues by geographic region as a percentage of total revenues for the years ended December 31:
The following table presents our total assets by geographic region for the years ended December 31 (in thousands):
Competition
The touch technologies market is intensely competitive and characterized by rapidly changing technology, evolving standards and new product releases by our competitors. Implementation of resistive touch technologies in consumer devices is exponentially declining due to limitations regarding sweep gestures, limitations on industrial design, and the negative impact on screen clarity due to film overlays.
2014 2013 2012 U.S. 60 % 51 % 73 % Japan 11 % 12 % 19 % China 11 % 9 % 5 % Taiwan 8 % 18 % 1 % South-Korea 4 % -- -- Italy 3 % -- -- Sweden 1 % 9 % 1 % Other 2 % 1 % 1 % Total 100 % 100 % 100 %
2014 2013 2012 U.S. $ 7,314 $ 10,280 $ 10,990 Sweden 1,231 1,161 1,178 Asia 57 30 -- Total $ 8,602 $ 11,471 $ 12,168
9

Neonode is one of few companies that offer optical touch technology. Our major competition are companies offering projected capacitive (“PCAP”)
technologies. PCAP is a prevalent standard in mobiles and tablets offering finger based touch and industrial design flexibility. PCAP has many suppliers competing to offer the same solution with price being a major differentiation point. OEMs regularly change PCAP suppliers in order to maintain the best pricing.
Our competitors, and the interface technology we believe they offer, include the following:
Intellectual Property
We rely on a combination of intellectual property laws and contractual provisions to establish and protect the proprietary rights in our technology.
The number of our issued and pending patents and patents filed in each jurisdiction as of December 31, 2014 is set forth in the following table:
Our patents cover six main categories: user interfaces, optics, controller integrated circuits, drivers, mechanics and applications. The following table
groups our patents into these six categories:
Our user interface software may also be protected by copyright laws in most countries, including Sweden and the European Union, which do not
grant patent protection for the software itself, if the software is deemed new and original. Protection can be claimed from the date of creation.
Research and Development
In fiscal years 2014, 2013 and 2012, we spent $7.4 million, $7.2 million and $5.7 million, respectively, on research and development activities. Our research and development is predominantly in-house, but is also done in collaboration with external partners and specialists.
Company Technology Synaptics Capacitive; In-cell ATMEL Capacitive; In-cell Cypress Capacitive; In-cell Maxim Capacitive; In-cell Tyco Electronics Capacitive; Resistive; Surface acoustic wave Touch International Resistive; Capacitive
Jurisdiction No. of Issued Patents No. of Patents Pending United States 28 32 Europe 2 13 Japan 6 10 China 4 12 South Korea 3 8 Canada 5 11 Australia 7 12 Singapore 4 13 Patent Convention Treaty Not Applicable 6 Total: 59 117
Patents UI Optics ASICs Drivers Mechanical Applications Total Issued 11 16 2 9 2 19 59 Pending 22 60 2 6 8 19 117 Total 33 76 4 15 10 38 176
10

Employees
On December 31, 2014, we had fifty-two employees and eleven part-time or full-time consultants. There were a total of seven employees in our
general and administrative group, seven in our sales and marketing group and thirty-eight in our engineering group. We have employees located in the U.S., Sweden, Israel and Japan. None of our employees are represented by a labor union. We have experienced no work stoppages. We believe our employee relations are positive.
Additional Information
We are subject to the informational requirements of the Securities Exchange Act of 1934, as amended (the “Exchange Act”) and we file or furnish reports, proxy statements, and other information with the Securities and Exchange Commission (“SEC”). The SEC maintains an Internet site that contains reports, proxy and information statements and other information regarding issuers that file electronically with the SEC at www.sec.gov. The reports and other information filed by us with the SEC are available free of charge on the SEC’s website. The public may read and copy any materials we file with the SEC at the SEC’s Public Reference Room at 100 F Street, NE, Washington, DC 20549. The public may obtain information on the operation of the Public Reference Room by calling the SEC at 1-800-SEC-0330.
Our website is www.neonode.com . Through our website, we make available free of charge all of our filings with the SEC, including our annual
reports on Form 10-K, quarterly reports on Form 10-Q, and current reports on Form 8-K as well as Form 3, Form 4, and Form 5 reports for the Company’s directors, officers, and principal stockholders, together with amendments to those reports filed or furnished pursuant to Sections 13(a), 15(d), or 16 under the Exchange Act. These reports are available as soon as reasonably practicable after their electronic filing or furnishing with the SEC. Our website also includes corporate governance information, such as our Code of Business Conduct (including Code of Ethics for the Chief Executive Officer and Senior Financial Officers) and Board Committee Charters. We are not including the information contained on our website as part of, nor incorporating it by reference into, this Annual Report.
An investment in our common stock involves a high degree of risk. Before deciding to purchase, hold, or sell our common stock, you should consider
carefully the risks described below in addition to the cautionary statements and risks described elsewhere and the other information contained in this Annual Report and in our other filings with the SEC, including subsequent reports on Forms 10-Q and 8-K. The risks and uncertainties described below are not the only ones we face. Additional risks and uncertainties not presently known to us or that we currently deem immaterial may also impair our business operations. If any of these known or unknown risks or uncertainties actually occurs, our business, financial condition, results of operations or cash flows could be seriously harmed. This could cause the trading price of our common stock to decline, resulting in a loss of all or part of your investment. Risks Related To Our Business
We are dependent on a limited number of customers. Our net revenues for the year ended December 31, 2014 were earned from thirty-two customers. During the year ended December 31, 2014, four
customers represented approximately 55% of our consolidated net revenues.
Our customer concentration may change significantly from period-to-period depending on a customer’s product cycle and changes in our industry. The loss of a major customer, a reduction in net revenues of a major customer for any reason, or a failure of a major customer to fulfill its financial or other obligations due to us could have a material adverse effect on our business, financial condition, and future revenue stream.
We are dependent on the ability of our customers to design, manufacture and sell their products that incorporate our touch technology,
particularly in markets other than e-Readers and tablets.
We generate revenue through technology licensing agreements with companies which must be successful in designing, manufacturing and selling their products that incorporate our touch technology. The majority of our license fees earned in 2014, 2013 and 2012 were from customer shipments of e-Reader and tablet products. We expect that customer shipments of e-Readers and tablet products will decline in the future. If we are unable to expand our licenses beyond e-Readers and tablets or if our customers are not able to design, manufacture or sell their products, or are delayed in producing their products, our revenues, profitability, and liquidity, as well as our brand image, may be adversely affected.
ITEM 1A. RISK FACTORS
11

The length of a customer’s product development and release cycle depends on many factors outside of our control and could cause us to incur
significant expenses without offsetting revenues, or revenues that vary significantly from quarter to quarter.
The development and release cycle for customer products is lengthy and unpredictable. Our customers often undertake significant evaluation and design in the qualification of our products, which contributes to a lengthy product release cycle. A customer’s decision to purchase our technology often requires a lengthy approval process undertaken by several decision makers at the customer. The typical product development and release cycle is six to thirty-six months with new customers while existing customer lead times are typically six to nine months. The development and release cycle may be longer in some cases, particularly for automotive vehicle products. There is no assurance that a customer will adopt our technology after the evaluation or design phase. The lengthy and variable development and release cycle for products may also have a negative impact on the timing of our revenues, causing our revenues and results of operations to vary significantly from quarter to quarter.
If we fail to develop and introduce new touch technology successfully and in a cost effective and timely manner, we will not be able to compete effectively and our ability to generate revenues will suffer .
We operate in a highly competitive, rapidly evolving environment, and our success depends on our ability to develop and introduce new touch
technology that our customers and end users choose to buy. If we are unsuccessful at developing new touch technology that are appealing to our customers and end users with acceptable functionality, quality, prices and terms, we will not be able to compete effectively and our ability to generate revenues will suffer. The development of new touch technology is very difficult and requires high levels of innovation and competence. The development process is also lengthy and costly. If we fail to anticipate our end users’ needs or technological trends accurately or if we are unable to complete development in a cost effective and timely fashion, we will be unable to introduce new touch technology into the market or successfully compete with other providers. As we introduce new or enhanced touch technology or integrate new touch technology into new or existing customer products, we face risks including, among other things, disruption in customers’ ordering patterns, inability to deliver new touch technology to meet customers’ demand, possible product and technology defects, and potentially unfamiliar sales and support environments. Premature announcements or leaks of new products, features, or technologies may exacerbate some of these risks. Our failure to manage the transition to newer touch technology or the integration of newer technology into new or existing customer products could adversely affect our business, results of operations, and financial condition.
We are dependent on Texas Instruments as a component supplier for our technology. Our business operates upon a technology licensing model. We do not manufacture products or components. Under our licensing model, OEMs and
ODMs manufacture or contract to manufacture controller chips containing our touch technology. As an alternative to sourcing controller chips, our customers may opt to use customized NN1001 and NN1002 optical controller chips developed in collaboration with Texas Instruments designed specifically for our optical touch technology. These controller chips can only be sold to customers who have a technology license agreement with us. As part of their product development process, our customers must qualify the chip components used in our products. If the controller chips provided by Texas Instruments experience quality control problems, our technology may be disqualified by one or more of our customers. Our dependence on Texas Instruments to supply controller chips with our touch technology exposes us to a number of risks including their inability to obtain an adequate supply of components, the failure to meet our customer requirements, or their failure to remain in business or adjust to market conditions. If our customers are unable to obtain controller chips with our touch technology, we may not be able to meet demand, which could have a material adverse effect on our business, financial condition, results of operations and cash flows.
Our operating results may fluctuate significantly as a result of a variety of factors, many of which are outside of our control. As a result of our limited operating history and the nature of the markets in which we compete, it is extremely difficult for us to forecast accurately.
We base our current and future expense levels largely on our investment plans and estimates of future events, although certain of our expense levels are, to a large extent, fixed. We may be unable to adjust spending in a timely manner to compensate for any unexpected revenue shortfall. Accordingly, any significant shortfall in revenues relative to our planned expenditures would have an immediate adverse effect on our business, results of operations and financial condition.
12

In addition, we are subject to the following factors, among others, that may negatively affect and cause fluctuations in our operating results:
Further, as a strategic response to changes in the competitive environment, we may from time to time make certain pricing, service, or marketing
decisions that could have a material and adverse effect on our business, results of operations, and financial condition. Due to the foregoing factors, our revenues and operating results are and will remain difficult to forecast.
We have had a history of losses and may require additional capital to fund our operations, which capital may not be available on commercially attractive terms or at all.
We have experienced substantial net losses in each fiscal period since our inception. These net losses resulted from a lack of substantial revenues
and the significant costs incurred in the development and acceptance of our technology. We may in the future require sources of capital in addition to cash on hand to continue operations and to implement our business plan. We project that we have sufficient liquid assets to continue operating for at least the next twelve months. However, if our operations do not become cash flow positive, we may be forced to seek credit line facilities from financial institutions, equity investments, or debt arrangements. No assurances can be given that we will be successful in obtaining such additional financing on reasonable terms, or at all. If adequate funds are not available when needed on acceptable terms, or at all, we may be unable to adequately fund our business plan, which could have a negative effect on our business, results of operations, and financial condition.
We must significantly enhance our sales and technology development organizations. We will need to improve the effectiveness and breadth of our sales efforts in order to increase market awareness and sales of our technology,
especially as we expand into new market segments. Competition for qualified sales personnel is intense, and we may not be able to hire the kind and number of sales personnel we are targeting. Likewise, our efforts to improve and refine our technology require skilled engineers and programmers. Competition for professionals capable of expanding our research and development efforts is intense due to the limited number of people available with the necessary technical skills. If we are unable to identify, hire, or retain qualified sales, marketing, and technical personnel, our ability to achieve future revenue may be adversely affected.
We will need to increase the size of our organization, and we may be unable to manage our growth effectively. Our failure to manage growth effectively could have a material and adverse effect on our business, results of operations and financial condition. We
anticipate that expansion of our organization will be required to address internal growth to handle licensing and research activities. This expansion may place a significant strain on management, operational, and financial resources. To manage the expected growth of our operations and personnel, we must both improve our existing operational and financial systems, procedures, and controls, and implement new systems, procedures, and controls. We must also expand our finance, administrative, and operations staff. Our current personnel, systems, procedures, and controls may not adequately support future operations. Management may be unable to hire, train, retain, motivate, and manage the necessary personnel, or to identify, manage and exploit existing and potential strategic relationships and market opportunities .
• the announcement or introduction of new products or technologies by our competitors; • our ability to upgrade and develop our infrastructure to accommodate growth; • our ability to attract and retain key personnel in a timely and cost effective manner; • technical difficulties; • the amount and timing of operating costs and capital expenditures relating to the expansion of our business, operations, and infrastructure; and • general economic conditions as well as economic conditions specific to the touchscreen industry.
13

We may make acquisitions and strategic investments that are dilutive to existing shareholders, resulting in unanticipated accounting charges or
otherwise adversely affect our results of operations.
We may decide to grow our business through business combinations or other acquisitions of businesses, products or technologies that allow us to complement our existing touch technology offerings, expand our market coverage, increase our workforce or enhance our technological capabilities. If we make any future acquisitions, we could issue stock that would dilute our shareholders’ percentage ownership or we may incur substantial debt, reduce our cash reserves and/or assume contingent liabilities. Further, acquisitions and strategic investments may result in material charges, adverse tax consequences, substantial depreciation, deferred compensation charges, in-process research and development charges, and the amortization of amounts related to deferred compensation and identifiable purchased intangible assets or impairment of goodwill. Any of these could negatively impact our results of operations.
We are dependent on the services of our key personnel.
Our senior management team consists of two executive officers. Our Chief Executive Officer is one of the founders of our Company. The unplanned
loss of the services of any member of management could have a materially adverse effect on our operations and future prospects.
Our revenues and growth are dependent on licensing fees from our intellectual property.
Our success depends in large part on our proprietary technology and other intellectual property rights. We rely on a combination of patents, copyrights, trademarks and trade secrets, confidentiality provisions, and licensing arrangements to establish and protect our proprietary rights. Our intellectual property, particularly our patents, may not provide us with a significant competitive advantage. If we fail to protect or to enforce our intellectual property rights successfully, our competitive position could suffer, which could harm our results of operations. Our pending patent applications for registration may not be allowed, or others may challenge the validity or scope of our patents. Even if our patents registrations are issued and maintained, these patents may not be of adequate scope or benefit to us or may be held invalid and unenforceable against third parties. We may need to expend significant resources to secure and protect our intellectual property. The loss of intellectual property rights may adversely impact our ability to generate revenues and expand our business.
If third parties infringe upon our intellectual property, we may expend significant resources enforcing our rights or suffer competitive injury. Existing laws, contractual provisions and remedies afford only limited protection for our intellectual property. We may be required to spend
significant resources to monitor and police our intellectual property rights. Effective policing of the unauthorized use of our technology or intellectual property is difficult and litigation may be necessary in the future to enforce our intellectual property rights. Intellectual property litigation is not only expensive, but time-consuming, regardless of the merits of any claim, and could divert attention of our management from operating the business. Intellectual property lawsuits are subject to inherent uncertainties due to, among other things, the complexity of the technical issues involved, and we cannot assure you that we will be successful in asserting our intellectual property rights. Attempts may be made to copy or reverse engineer aspects of our technology or to obtain and use information that we regard as proprietary. We may not be able to detect infringement and may lose competitive position in the market before they do so. In addition, competitors may design around our technology or develop competing technologies. We cannot assure you that we will be able to protect our proprietary rights against unauthorized third party copying or use. The unauthorized use of our technology or of our proprietary information by competitors could have an adverse effect on our ability to sell our technology.
The laws of foreign countries may not provide protection of our intellectual property rights to the same extent as the laws of the United States,
which may make it more difficult for us to protect our intellectual property. As part of our business strategy, we target customers and relationships with suppliers and original equipment manufacturers in countries with large
populations and propensities for adopting new technologies. However, many of these countries do not address misappropriation of intellectual property nor deter others from developing similar, competing technologies or intellectual property. Effective protection of patents, copyrights, trademarks, trade secrets and other intellectual property may be unavailable or limited in some foreign countries. In particular, the laws of some foreign countries in which we do business may not protect our intellectual property rights to the same extent as the laws of the United States. As a result, we may not be able to effectively prevent competitors in these regions from infringing our intellectual property rights, which could reduce our competitive advantage and ability to compete in those regions and negatively impact our business.
14

We have an international presence in countries and must manage currency risks. A significant portion of our business is conducted in currencies other than the U.S. dollar (the currency in which our consolidated financial
statements are reported), primarily the Swedish Krona and, to a lesser extent, the Euro, Japanese Yen and Korean Won. For the year ended December 31, 2014, our revenues from the U.S., Asia, and Europe were 60%, 35%, and 5% respectively. We incur a significant portion of our expenses in Swedish Krona, including a significant portion of our research and development expenses and a substantial portion of our general and administrative expenses. As a result, appreciation of the value of the Swedish Krona relative to the other currencies, particularly the U.S. dollar, could adversely affect operating results. We do not currently undertake hedging transactions to cover our currency exposure, but we may choose to hedge a portion of our currency exposure in the future as it deems appropriate.
If we are unable to remediate and detect material weaknesses in our internal control, our financial report and our Company may be adversely
affected.
As discussed in “Part II—Item 9A—Controls and Procedures,” our management has concluded that we did not have adequate controls designed and in place for our quarterly and annual financial close processes relating to intercompany adjustments and accounting for complex transactions. Although this control deficiency did not result in a material misstatement in the consolidated financial statements, we have concluded that material weaknesses exist in our internal control over financial reporting. We are currently working to remediate the material weaknesses. We cannot be sure when we will successfully remediate the material weaknesses or whether compensating controls will be effective before then in preventing or detecting material errors. The remediation may require substantial time and resources to successfully implement. Moreover, these material weaknesses and the financial statement errors we have had in the past or may have in the future could cause investors, creditors, distributors, customers, rating agencies, regulators and others to lose confidence in the effectiveness of our internal controls and the accuracy of our financial statements and other information, all of which could have a material adverse impact on our business, results of operations and financial condition. Risks Related to Owning Our Stock
Our certificate of incorporation and bylaws and the Delaware General Corporation Law contain provisions that could delay or prevent a change
in control.
Our Board of Directors has the authority to issue up to 1,000,000 shares of preferred stock and to determine the price, rights, preferences and privileges of those shares without any further vote or action by the stockholders. The rights of the holders of common stock will be subject to, and may be materially adversely affected by, the rights of the holders of any preferred stock that may be issued in the future. The issuance of preferred stock could have the effect of making it more difficult for a third party to acquire a majority of our outstanding voting stock. Furthermore, certain other provisions of our certificate of incorporation and bylaws may have the effect of delaying or preventing changes in control or management, which could adversely affect the market price of our common stock. In addition, we are subject to the provisions of Section 203 of the Delaware General Corporation Law, an anti-takeover law.
Our stock price has been volatile, and your investment in our common stock could suffer a decline in value.
There has been significant volatility in the market price and trading volume of equity securities, which is unrelated to the financial performance of
the companies issuing the securities. These broad market fluctuations may negatively affect the market price of our common stock. You may not be able to resell your shares at or above the price you pay for those shares due to fluctuations in the market price of our common stock caused by changes in our operating performance or prospects, and other factors.
Some factors that may have a significant effect on our common stock market price include:
• actual or anticipated fluctuations in our operating results or future prospects; • our announcements or our competitors’ announcements of new technology;
15
Future sales of our common stock by our stockholders could negatively affect our stock price.
During 2011 and 2013, officers and directors of Neonode sold shares of our common stock in public offerings. In May 2014, Neonode sold to an
institutional investor 2,500,000 shares of common stock and a warrant that may be exercised by November 15, 2015 to purchase an additional 2,500,000 shares of our common stock at an exercise price of $5.09 per share. The common stock and shares issuable upon exercise of the warrant from the May 2014 offering can be resold pursuant to a registration statement that we filed which became effective in June 2014. Sales of a substantial number of shares of our common stock in the public market by insiders or large stockholders, or the perception that these sales might occur, could depress the market price of our common stock and could impair our ability to raise capital through the sale of additional equity securities.
Future sales of our common stock by us could adversely affect its price, and our future capital-raising activities could involve the issuance of equity securities, which would dilute your investment and could result in a decline in the trading price of our common stock.
Our long-term success is dependent on us obtaining sufficient capital to fund our operations and to develop our touch technology, and bringing our
technology to the worldwide market to obtain sufficient sales volume to be profitable. We may sell securities in the public or private equity markets if and when conditions are favorable, even if we do not have an immediate need for additional capital at that time. Sales of substantial amounts of common stock, or the perception that such sales could occur, could adversely affect the prevailing market price of our common stock and our ability to raise capital. We may issue additional common stock in future financing transactions or as incentive compensation for our executive management and other key personnel, consultants and advisors. Issuing any equity securities would be dilutive to the equity interests represented by our then-outstanding shares of common stock. The market price for our common stock could decrease as the market takes into account the dilutive effect of any of these issuances. Furthermore, we may enter into financing transactions at prices that represent a substantial discount to the market price of our common stock. A negative reaction by investors and securities analysts to any discounted sale of our equity securities could result in a decline in the trading price of our common stock.
If securities analysts do not publish research or if securities analysts or other third parties publish inaccurate or unfavorable research about us,
the price of our common stock could decline. The trading market for our common stock will rely in part on the research and reports that securities analysts and other third parties choose to
publish about us. We do not control these analysts or other third parties. The price of our common stock could decline if one or more securities analysts downgrade our common stock or if one or more securities analysts or other third parties publish inaccurate or unfavorable research about us or cease publishing reports about us.
None.
• the public’s reaction to our press releases, our other public announcements, and our filings with the SEC; • strategic actions by us or our competitors, such as acquisitions or restructurings; • new laws or regulations or new interpretations of existing laws or regulations applicable to our business; • changes in accounting standards, policies, guidance, interpretations or principles; • changes in our growth rates or our competitors’ growth rates; • developments regarding our patents or proprietary rights or those of our competitors; • our inability to raise additional capital as needed; • concern as to the efficacy of our technology; • changes in financial markets or general economic conditions; • sales of common stock by us or members of our management team; and • changes in stock market analyst recommendations or earnings estimates regarding our common stock, other comparable companies, or our
industry generally.
ITEM 1B. UNRESOLVED STAFF COMMENTS
16

We lease 3,185 square feet of office space located at 2350 Mission College Blvd, Suite 190, Santa Clara, CA 95054 USA. The annual payment for
this space equates to approximately $86,000 per year. This lease is valid through July 31, 2015. We are currently reviewing alternative office space location nearby our current location.
Our subsidiary Neonode Technologies AB leases 6,520 square feet of office space located at Storgatan 23C, Stockholm, Sweden. The annual payment for this space is approximately $443,000 per year including property tax (excluding VAT). This lease is valid through November 30, 2017. The lease can be extended on a yearly basis.
Our subsidiary Neonode Japan K.K. leases 430 square feet of office space located at 608 Bureau Shinagawa, 4-1-6 Konan, Minato-ku, 108-0075
Tokyo, Japan. This lease is valid through October 31, 2016. The annual payment for this space equates to approximately $28,000 per year. Our subsidiary Neonode Korea Ltd. entered into a lease agreement located at B-1807, Daesung D-Polis. 543-1, Seoul , South Korea in January,
2015. This lease is valid through February 13, 2017. The annual payment for this space equates to approximately $24,000 per year.
We believe our existing facilities are in good condition and suitable for the conduct of our business.
We are not currently involved in any material legal proceedings. However, from time to time, we may become subject to legal proceedings, claims,
and litigation arising in the ordinary course of business, including, but not limited to, employee, customer and vendor disputes.
Not applicable.
PART II
Market Information
Our common stock is quoted on the NASDAQ Stock Market under the symbol NEON. Shares of our common stock commenced trading on the
NASDAQ Stock Market on May 1, 2012. Set forth below are the high and low sales prices for our common stock for the quarterly periods indicated.
Holders
As of March 9, 2015, there were approximately 114 stockholders of record of our common stock. We estimate that there were approximately 5,400 stockholders as of February 23, 2015 whose shares were held in “street name” by brokers and other institutions on behalf of stockholders of record.
ITEM 2. PROPERTIES
ITEM 3. LEGAL PROCEEDINGS
ITEM 4. MINE SAFETY DISCLOSURES
ITEM 5. MARKET FOR THE REGISTRANT ’S COMMON EQUITY, RELATED STOCKHOLDER MATTERS AND ISSUER PURCHASES OF EQUITY SECURITIES
Fiscal Quarter Ended
March 31 June 30 September 30 December 31 Fiscal 2014
High $ 7.80 $ 6.20 $ 3.50 $ 3.48 Low $ 5.50 $ 2.44 $ 1.94 $ 1.72
Fiscal 2013 High $ 6.39 $ 6.21 $ 8.84 $ 6.82 Low $ 4.48 $ 5.02 $ 5.75 $ 4.96
17

Dividends
There are no restrictions on our ability to pay dividends. It is currently the intention of the Board of Directors to retain all earnings, if any, for use in our business and we do not anticipate paying cash dividends in the foreseeable future. Any future determination as to the payment of dividends will depend, among other factors, upon our earnings, capital requirements, operating results and financial condition. Stock Performance Graph
The graph below compares the cumulative total shareholder return on our common stock with the cumulative total returns of the Russell MicroCap index and the S&P Information Technology index. The graph tracks the performance of a $100 investment in our common stock and in each index (with the reinvestment of all dividends) from December 31, 2009 to December 31, 2014. The stock price performance included in this graph is not necessarily indicative of future stock price performance.
The stock performance graph above shall not be deemed incorporated by reference into any filing by us under the Securities Act of 1933, as
amended, or the Securities Exchange Act of 1934, as amended, except to the extent that we specifically incorporate such information by reference, and shall not otherwise be deemed filed under such Acts.
The following table of selected financial information should be read in conjunction with our consolidated financial statements and related notes
thereto included elsewhere in this Annual Report.
12/09 12/10 12/11 12/12 12/13 12/14 Neonode Inc. 100.00 349.50 950.00 972.00 1264.00 676.00 Russell MicroCap 100.00 128.89 116.93 140.02 203.90 211.34 S&P Information Technology 100.00 110.19 112.84 129.57 166.41 199.89
ITEM 6. SELECTED FINANCIAL DATA
18

The following discussion and analysis should be read in conjunction with our consolidated financial statements and the related notes thereto
included elsewhere in this Annual Report.
Overview Neonode develops and licenses user interfaces and optical infrared touch technology. Our patented technology offers multiple features including the
ability to sense an object’s size, depth, velocity, pressure, and proximity to any type of surface. We offer our family of touch solutions under the name MultiSensing. Our MultiSensing offerings are based upon our patented technology we call zForce. We license our multi-touch technology to OEMs and ODMs who incorporate it into devices that they produce and sell. Our technology licensing model allows us to focus on the development of solutions for touchscreens and touch-enabled surfaces. We do not manufacture products or components.
As of December 31, 2014, we had thirty-five technology license agreements with global OEMs and ODMs. This compares with thirty-three and
twenty-four technology license agreements as of December 31, 2013 and 2012, respectively. During the year ended December 31, 2014, we had sixteen customers using our touch technology in products that were being shipped to customers. In 2014, we received license fees from customers such as HP (printers), Leap Frog and Oregon Scientific (children’s tablets) and Volvo (after-market installed touch for their automobile infotainment systems).
The majority of our license fees earned in 2014, 2013 and 2012 were from customer shipments of e-Reader and tablets and printer products. We
expect license fees earned from customer shipments of e-Readers and tablets to decrease as a percentage of total revenue as other customer products are introduced to the market. In the fourth quarter of 2012, Amazon discontinued shipping a Kindle e-Reader product that incorporated our touch technology. Amazon reintroduce it latest e-Reader product using our touch technology in the fourth quarter 2014. Revenue related to this product will be recorded in Q1 2015. We anticipate other customers will initiate product shipments as they complete their final product development and manufacturing cycle throughout 2015 and onwards.
Current and future drivers of the touch technology market include laptop computers, all-in-one and computer monitors running Microsoft Windows
8.1 and 10 and Google Chrome operating systems, printers, mobile phone cases, automotive, household appliances, tablets, e-Readers, navigation and wearables. The proliferation and mass market acceptance of touch technology have prompted new applications and uses for existing and new offerings, thus making the production and utilization of these modules one of the fastest growing tech segments.
As of or for the Year Ended December 31, 2014 2013 2012 2011 2010 (In thousands, except per share data)
Financial Results: Total net revenues $ 4,740 $ 3,717 $ 7,137 $ 6,067 $ 440 Net loss (14,234 ) (13,080 ) (9,287 ) (17,145 ) (31,626 ) Per Share: Basic and diluted loss per share $ (0.36 ) $ (0.37 ) $ (0.28 ) $ (0.64 ) $ (1.73 ) Weighted average number of shares outstanding 39,532 35,266 33,003 26,784 18,293 Financial Position: Total assets $ 8,602 $ 11,471 $ 12,168 $ 16,627 $ 1,251 Total liabilities 5,332 5,123 4,068 2,954 11,115
ITEM 7. MANAGEMENT ’S DISCUSSION AND ANALYSIS OF FINANCIAL CONDITION AN D RESULTS OF OPERATIONS
19

The typical product development and release cycle is six to thirty-six months with new customers while existing customer lead times are typically
six to nine months. During the initial cycle, there are three phases: evaluation, design, and commercialization. In the evaluation phase, prospects validate our technology and may produce short runs of prototype products. During the design phase, product development and solution definition begins. This design phase tends to be the longest and delays typically occur which may extend the term of the overall cycle. In the final phase, commercialization, the customer enters into full production mode, ships products to the market and we earn license revenue. Critical Accounting Policies and Estimates
The consolidated financial statements have been prepared in accordance with accounting principles generally accepted in the United States of
America (“U.S. GAAP”) and include the accounts of Neonode Inc. and its wholly owned subsidiaries. All inter-company accounts and transactions have been eliminated in consolidation.
The consolidated statements of operations, comprehensive loss and cash flows for the year ended December 31, 2012 include our accounts and those
of our wholly owned subsidiary, Neonode Technologies AB (Sweden). The consolidated balance sheet at December 31, 2013 and the consolidated statements of operations, comprehensive loss and cash flows for the year
ended December 31, 2013 include our accounts and those of our wholly owned subsidiaries, Neonode Technologies AB (Sweden), Neonode Americas Inc. (U.S.), Neonode Japan Inc. (Japan), NEON Technology Inc. (U.S.) and Neno User Interface Solutions AB (Sweden).
The consolidated balance sheet at December 31, 2014 and the consolidated statements of operations, comprehensive loss and cash flows for the year ended December 31, 2014 include our accounts and those of our wholly owned subsidiaries, Neonode Technologies AB (Sweden), Neonode Americas Inc. (U.S.), Neonode Japan Inc. (Japan), NEON Technology Inc. (U.S.), Neno User Interface Solutions AB (Sweden) and Neonode Korea Ltd. (South Korea).
The accounting policies affecting our financial condition and results of operations are more fully described in Note 2 to our consolidated financial
statements. Certain of our accounting policies require the application of judgment by management in selecting appropriate assumptions for calculating financial estimates, which inherently contain some degree of uncertainty. Management bases its estimates on historical experience and various other assumptions that are believed to be reasonable under the circumstances. The historical experience and assumptions form the basis for making judgments about the reported carrying values of assets and liabilities and the reported amounts of revenue and expenses that may not be readily apparent from other sources. Actual results may differ from these estimates under different assumptions or conditions. We believe the following are critical accounting policies and related judgments and estimates used in the preparation of our consolidated financial statements.
Estimates
The preparation of financial statements in conformity with U.S. GAAP requires making estimates and assumptions that affect, at the date of the
consolidated financial statements, the reported amounts of assets and liabilities, disclosure of contingent assets and liabilities and the reported amounts of revenue and expenses. Actual results could differ from these estimates. Significant estimates include, but are not limited to, collectability of accounts receivable, recoverability of capitalized project costs and long-lived assets, the valuation allowance related to our deferred tax assets and the fair value of options and warrants issued for stock-based compensation.
20
Revenue Recognition
Licensing Revenues:
We derive revenue from the licensing of internally developed intellectual property (“IP”). We enter into IP licensing agreements that generally
provide licensees the right to incorporate our IP components in their products with terms and conditions that vary by licensee. Fees under these agreements may include license fees relating to our IP and royalties payable following the distribution by our licensees of products incorporating the licensed technology. The license for our IP has standalone value and can be used by the licensee without maintenance and support. We follow U.S. GAAP for revenue recognition as per unit royalty products are distributed or licensed by our customers. For technology license arrangements that do not require significant modification or customization of the underlying technology, we recognize technology license revenue when: (1) we enter into a legally binding arrangement with a customer for the license of technology; (2) the customer distributes or licenses the products; (3) the customer payment is deemed fixed or determinable and free of contingencies or significant uncertainties; and (4) collection is reasonably assured. Our customers report to us the quantities of products distributed or licensed by them after the end of the reporting period stipulated in the contract, generally 30 to 45 days after the end of the month or quarter. Effective October 16, 2013, we determined it was appropriate to recognize licensing revenue in the period in which royalty reports are received, rather than the period in which the products are distributed or to which the license relates.
Explicit return rights are not offered to customers. There were no returns through December 31, 2014. Engineering Services: We may sell engineering consulting services to our customers on a flat rate or hourly rate basis. We recognize revenue from these services when all
of the following conditions are met: (1) evidence existed of an arrangement with the customer, typically consisting of a purchase order or contract; (2) our services were performed and risk of loss passed to the customer; (3) we completed all of the necessary terms of the contract; (4) the amount of revenue to which we were entitled was fixed or determinable; and (5) we believed it was probable that we would be able to collect the amount due from the customer. To the extent that one or more of these conditions has not been satisfied, we defer recognition of revenue. Generally, we recognize revenue as the engineering services stipulated under the contract are completed and accepted by our customers. Engineering services performed under a signed statement of work (“SOW”) with a customer are accounted for under the completed contract method, as these SOW’s are short-term in nature and our total contract costs are difficult to estimate. Estimated losses on SOW projects are recognized in full as soon as they become evident.
Accounts Receivable and Allowance for Doubtful Accounts
Our accounts receivable are stated at net realizable value. Our policy is to maintain allowances for estimated losses resulting from the inability of our customers to make required payments. Credit limits are established through a process of reviewing the financial history and stability of each customer. Where appropriate, we obtain credit rating reports and financial statements of the customer when determining or modifying its credit limits. We regularly evaluate the collectability of our trade receivable balances based on a combination of factors. When a customer’s account balance becomes past due, we initiate dialogue with the customer to determine the cause. If it is determined that the customer will be unable to meet its financial obligation, such as in the case of a bankruptcy filing, deterioration in the customer’s operating results or financial position or other material events impacting its business, we record a specific allowance to reduce the related receivable to the amount we expect to recover. Should all efforts fail to recover the related receivable, we will write-off the account. We also record an allowance for all customers based on certain other factors including the length of time the receivables are past due and historical collection experience with customers.
Projects in Process
Projects in process consist of costs incurred toward the completion of various projects for certain customers. These costs are primarily comprised of direct engineering labor costs and project-specific equipment costs. These costs are capitalized on our balance sheet as an asset and deferred until revenue for each project is recognized in accordance with our revenue recognition policy.
Property and Equipment
Property and equipment are stated at cost, net of accumulated depreciation and amortization. Depreciation and amortization are computed using the straight-line method based upon estimated useful lives of the assets as follows:
Estimated useful lives
Computer equipment 3 years Furniture and fixtures 5 years
21

Equipment purchased under capital leases is amortized on a straight-line basis over the estimated useful life of the asset or the term of the lease,
whichever is shorter. Upon retirement or sale of property and equipment, cost and accumulated depreciation and amortization are removed from the accounts and any gains or losses are reflected in the consolidated statement of operations. Maintenance and repairs are charged to expense as incurred.
Long-lived Assets
We assess any impairment by estimating the future cash flow from the associated asset in accordance with relevant accounting guidance. If the
estimated undiscounted future cash flow related to these assets decreases or the useful life is shorter than originally estimated, we may incur charges for impairment of these assets. As of December 31, 2014, we believe there was no impairment of our long-lived assets. There can be no assurance, however, that market conditions will not change or sufficient demand for our products and services will continue, which could result in impairment of long-lived assets in the future.
Research and Development
Research and development (“R&D”) costs are expensed as incurred. R&D costs consist mainly of personnel related costs in addition to some external consultancy costs such as testing, certifying and measurements.
Stock-Based Compensation Expense
We measure the cost of employee services received in exchange for an award of equity instruments, including share options, based on the estimated fair value of the award on the grant date, and recognize the value as compensation expense over the period the employee is required to provide services in exchange for the award, usually the vesting period, net of estimated forfeitures.
We account for equity instruments issued to non-employees at their estimated fair value. The measurement date for the fair estimated value for the
equity instruments issued is determined at the earlier of (1) the date at which a commitment for performance by the consultant or vendor is reached, or (2) the date at which the consultant or vendor’s performance is complete. In the case of equity instruments issued to consultants, the estimated fair value of the equity instruments is primarily recognized over the term of the consulting agreement. The estimated fair value of the stock-based compensation is periodically re-measured and income or expense is recognized during the vesting term.
When determining stock-based compensation expense involving options and warrants, we determine the estimated fair value of options and warrants using the Black-Scholes option pricing model.
Foreign Currency Translation and Transaction Gains and Losses
The functional currency of our foreign subsidiaries is the applicable local currency, the Swedish Krona, the Japanese Yen and the South-Korean Won. The translation from Swedish Krona, Japanese Yen or South-Korean Won to U.S. Dollars is performed for balance sheet accounts using current exchange rates in effect at the balance sheet date and for income statement accounts using a weighted average exchange rate during the period. Gains or (losses) resulting from translation are included as a separate component of accumulated other comprehensive income (loss). Gains or (losses) resulting from foreign currency transactions are included in general and administrative expenses in the accompanying consolidated statements of operations and were ($37,000), ($155,000) and ($50,000) during the years ended December 31, 2014, 2013 and 2012, respectively. Foreign currency translation gains or (losses) were $138,000, $6,000 and ($8,000) during the years ended December 31, 2014, 2013 and 2012, respectively.
Net Loss per Share
Net loss per share amounts have been computed based on the weighted-average number of shares of common stock outstanding during the years ended December 31, 2014, 2013 and 2012. Net loss per share, assuming dilution amounts from common stock equivalents, is computed based on the weighted average number of shares of common stock and potential common stock equivalents outstanding during the period. The weighted average number of shares of common stock and potential common stock equivalents used in computing the net loss per share for years ended December 31, 2014, 2013 and 2012 exclude the potential common stock equivalents, as the effect would be anti-dilutive.
22

Comprehensive Loss
Our comprehensive loss includes foreign currency translation gains and losses. The cumulative amount of translation gains and losses are reflected as a separate component of stockholders’ equity in the consolidated balance sheets, as accumulated other comprehensive income.
Cash Flow Information
Cash flows in foreign currencies have been converted to U.S. Dollars at an approximate weighted average exchange rate for the respective reporting periods. The weighted average exchange rate for the consolidated statements of operations was 6.86, 6.51 and 6.78 Swedish Krona to one U.S. Dollar for the years ended December 31, 2014, 2013 and 2012, respectively. The exchange rate for the consolidated balance sheets was 7.80 and 6.48 Swedish Krona to one U.S. Dollar as of December 31, 2014 and 2013, respectively. The weighted-average exchange rate for the consolidated statement of operations and of comprehensive loss was 105.84 and 97.58 Japanese Yen to one U.S. Dollar for the year ended December 31, 2014 and 2013, respectively. The exchange rate for the consolidated balance sheet was 119.93 and 105.22 Japanese Yen to one U.S. Dollar as of December 31, 2014 and 2013, respectively. The weighted-average exchange rate for the consolidated statement of operations and of comprehensive loss was 1,050.63 South Korean Won to one U.S. Dollar for the year ended December 31, 2014. The exchange rate for the consolidated balance sheet was 1,096.73 South Korean Won to one U.S. Dollar as of December 31, 2014.
Deferred Revenue s
From time-to-time, we receive pre-payments from our customers related to future services or future license fee revenues. We defer the license fees
until we have met all accounting requirements for revenue recognition as per unit royalty products are distributed or licensed by our customers and the engineering development fee revenue until such time as the engineering work has been completed and accepted by our customers. As of December 31, 2014 and 2013, we have $3.0 million and $2.5 million, respectively, of deferred license fee revenue related to prepayments for future license fees from five and three customers, respectively and a total of $0.4 million and $1.2 million, respectively, of deferred engineering development fees from five and twenty-one customers, respectively.
New Accounting Pronouncements In July 2013, the Financial Accounting Standards Board (“FASB”) issued Accounting Standards Update (“ASU”) No. 2013-11, “Presentation of an
Unrecognized Tax Benefit When a Net Operating Loss Carryforward, a Similar Tax Loss, or a Tax Credit Carryforward Exists”. ASU 2013-11 provides explicit guidance on the financial statement presentation of an unrecognized tax benefit when a net operating loss carryforward, a similar tax loss, or a tax credit carryforward exists. The guidance is effective prospectively for fiscal years, and interim periods within those years, beginning after December 15, 2013, with an option for early adoption. We adopted this guidance at the beginning of our first quarter of fiscal year 2014, and did not determine there is any impact on our consolidated financial statements and disclosures.
In May 2014, the FASB issued ASU No. 2014-09, “ Revenue from Contracts with Customers (Topic 606)” (“ASU 2014-09”). ASU 2014-09 amends
the guidance for revenue recognition to replace numerous, industry specific requirements and converges areas under this topic with those of the International Financial Reporting Standards. The ASU implements a five-step process for customer contract revenue recognition that focuses on transfer of control, as opposed to transfer of risk and rewards. The amendment also requires enhanced disclosures regarding the nature, amount, timing and uncertainty of revenues and cash flows from contracts with customers. Other major provisions include the capitalization and amortization of certain contract costs, ensuring the time value of money is considered in the transaction price, and allowing estimates of variable consideration to be recognized before contingencies are resolved in certain circumstances. The amendments in this ASU are effective for reporting periods beginning after December 15, 2016, and early adoption is prohibited. Entities can transition to the standard either retrospectively or as a cumulative-effect adjustment as of the date of adoption. We have not yet selected a transition method and are currently assessing the impact the adoption of ASU 2014-09 will have on our consolidated financial statements and disclosures.
23

In August 2014, the FASB issued ASU No. 2014-15, “ Presentation of Financial Statements - Going Concern ”. The amendments in this update
provide guidance in U.S. GAAP about management's responsibilities to evaluate whether there is substantial doubt about an entity's ability to continue as a going concern and to provide related footnote disclosures. The main provision of the amendments are for an entity's management, in connection with the preparation of financial statements, to evaluate whether there are conditions or events, considered in the aggregate, that raise substantial doubt about the entity's ability to continue as a going concern within one year after the date that the financial statements are issued. Management's evaluation should be based on relevant conditions and events that are known or reasonably knowable at the date the consolidated financial statements are issued. When management identifies conditions or events that raise substantial doubt about an entity's ability to continue as a going concern, the entity should disclose information that enables users of the consolidated financial statements to understand all of the following: (1) principal conditions or events that raised substantial doubt about the entity's ability to continue as a going concern (before consideration of management's plans); (2) management's evaluation of the significance of those conditions or events in relation to the entity's ability to meet its obligations; and (3) management's plans that alleviated substantial doubt about the entity's ability to continue as a going concern or management's plans that are intended to mitigate the conditions or events that raise substantial doubt about the entity's ability to continue as a going concern. The amendments in this update are effective for interim and annual reporting periods after December 15, 2016 and early application is permitted. We are currently assessing this guidance for future implementation. Results of Operations
Net Revenues
Net revenues for the year ended December 31, 2014 were $4.7 million, compared to $3.7 million and $7.1 million for the years ended December 31, 2013 and 2012, respectively. Our net revenues for the year ended December 31, 2014 included $3.1 million from technology license fees due to product shipments from sixteen customers and $1.6 million in non-recurring engineering services related to our touch technology from twenty-two customers. Our net revenues for the year ended December 31, 2013 included $2.9 million from technology license fees due to product shipments from twelve customers and $800,000 in non-recurring engineering services related to our touch technology from twenty-two customers. Our net revenues for the year ended December 31, 2012 included $6.2 million from technology license fees due to product shipments from eight customers and $925,000 in non-recurring engineering services related to our touch technology from fifteen customers.
The increase in overall net revenues in the year ended December 31, 2014 compared to the year ended December 31, 2013 is primarily due to an
increase in license fees from HP in the printer market. In addition, on October 16, 2013, we determined it was appropriate to recognize licensing revenue in the period in which royalty reports are received, rather than the period in which the products are distributed or to which the license relates. The effect of this change is $713,000 of license fees related to customer products shipped or distributed in the fourth quarter of 2013 was recognized in the first quarter of 2014.
Customer prepayments are included in deferred revenues and are amortized to net revenues as a customer’s products are shipped or distributed. For
the years ended December 31, 2014, 2013 and 2012, $596,000, $258,000 and $536,000 in license fees related to units licensed or distributed were recognized as revenue, respectively, and as of December 31, 2014, $3.0 million remained in deferred revenues from customers’ license fee prepayments.
As of December 31, 2014, we had thirty-five technology license agreements with global OEMs. This compares with thirty-three and twenty-four technology license agreements with global OEMs as of December 31, 2013 and 2012, respectively. Sixteen of our customers are currently shipping products and we anticipate others will initiate product shipments as they complete their final product development and manufacturing cycle throughout 2015 and onwards.
Gross Margin
Gross margin was $3.2 million for the year ended December 31, 2014 compared to $2.1 million and $5.7 million for the years ended December 31, 2013 and 2012, respectively. Our cost of revenues includes the direct cost of production of certain customer prototypes, costs of company employed engineering personnel and engineering consultants to complete the engineering design contract. Our gross margin has increased due to the increase in our total revenue, particularly our non-recurring engineering services revenue. There has also been a small decrease in cost of revenues in 2014 compared to 2013 resulting from a shift from external consultants and external prototype services to more internal resources in 2014, including an in-house prototype lab and milling-machine. The gross margin related to our license fees is 100%. As license fees as a percentage of our total revenue increase, our gross margin will increase.
24

Research and Development
Research and development (“R&D”) expenses for each of the years ended December 31, 2014 were $7.4 million compared to $7.2 million and $5.7
million for the years ended December 31, 2013 and 2012. R&D costs mainly consist of personnel related costs, in addition to some external consultancy costs such as testing, certifying and measurements along with costs related to developing and building new product prototypes.
We continue to pursue and expand R&D expenditures on the development of our touch technology and other technologies. As of December 31, 2014, our R&D department had thirty-eight full-time employees. Our R&D department had twenty-seven full-time employees compared to twenty-six full-time employees as of December 31, 2013 and 2012, respectively. Included in R&D expenses are approximately $510,000 of non-cash stock option and warrant expense for the year ended December 31, 2014 compared to approximately $267,000 and $315,000 for the same periods in 2013 and 2012, respectively.
Sales and Marketing
Sales and marketing expenses for the year ended December 31, 2014 were $3.3 million, compared to $2.7 million and $4.4 million for the years ended December 31, 2013 and 2012, respectively. The increase in 2014 as compared to 2013 is primarily related to an increase in sales personnel, marketing and travel expenses in addition to a decrease in non-cash stock option expense. The decrease in 2013 as compared to 2012 is primarily related to a decrease in sales personnel, marketing and travel expenses in addition to a decrease in non-cash stock option and warrant expense. As of December 31, 2014, our sales and marketing department had seven full-time employees compared to nine full-time employees and twelve employees as of December 31, 2013 and 2012, respectively. Included in sales and marketing expenses is approximately $353,000 of non-cash stock expense for the year ended December 31, 2014 compared to approximately $909,000 and $1.4 million for the same periods in 2013 and 2012, respectively.
Our sales activities focus primarily on OEM customers who will integrate our touch technology into their products. Our OEM customers will then sell and market their products incorporating our technology to their customers.
General and Administrative
General and administrative (“G&A”) expenses for the year ended December 31, 2014 were $6.8 million compared to $5.1 million and $4.7 million for the years ended December 31, 2013 and 2012, respectively. This overall increase in 2014 as compared to 2013 was primarily related to salary expense, legal expenses related to patent filings, corporate and SEC compliance and customer contracts. The increases in G&A expenses was partially offset by a decrease in non-cash stock option expense in 2014 related to stock options issued to employees and members of our Board of Directors. As of December 31, 2014, we had seven full-time employees in our G&A department fulfilling management and accounting responsibilities compared to eight employees as of December 31, 2013 and 2012. Included in G&A expenses are approximately $0.9 million of non-cash stock option expense for the year ended December 31, 2014 compared to approximately $1.5 million and $1.8 million for the same periods in 2013 and 2012, respectively.
Interest Expense
Interest expense for the year ended December 31, 2014 was $14,000. The interest expense was related to a capital lease. We did not have any interest expense for the years ended December 31, 2013 or 2012.
25

Foreign Currency Translation and Transaction Gains and Losses
The functional currency of our foreign subsidiaries is the applicable local currency, the Swedish Krona, the Japanese Yen and the South Korean Won. The translation from Swedish Krona, Japanese Yen or South Korean Won to U.S. Dollars is performed for balance sheet accounts using current exchange rates in effect at the balance sheet date and for income statement accounts using a weighted average exchange rate during the period. Gains or (losses) resulting from translation are included as a separate component of accumulated other comprehensive income (loss). Gains or (losses) resulting from foreign currency transactions are included in general and administrative expenses in the accompanying consolidated statements of operations and were ($37,000), ($155,000) and ($50,000) during the years ended December 31, 2014, 2013 and 2012, respectively. Foreign currency translation gains (losses) were $138,000, $6,000 and ($8,000) during the years ended December 31, 2014, 2013 and 2012, respectively.
Income Taxes
Our effective tax rate was 0% in the year ended December 31, 2014 and (1%) in the years ended 2013 and 2012, respectively. We recorded
valuation allowances in 2014, 2013 and 2012 for deferred tax assets related to net operating losses due to the uncertainty of realization. Net Loss
As a result of the factors discussed above, we recorded a net loss of $14.2 million for the year ended December 31, 2014, compared to a net loss of
$13.1 million and $9.3 million for the years ended December 31, 2013 and 2012, respectively.
Contractual Obligation and Off-Balance Sheet Arrangements
We do not have any transactions, arrangements, or other relationships with unconsolidated entities that are reasonably likely to affect our liquidity or capital resources other than the operating leases incurred in the normal course of business.
A summary of future minimum payments under non-cancellable lease commitments as of December 31, 2014 is as follows (in thousands):
We have no special purpose or limited purpose entities that provide off-balance sheet financing, liquidity, or market or credit risk support. We do not
engage in leasing, hedging, research and development services, or other relationships that expose us to liability that is not reflected on the face of the consolidated financial statements.
Operating Leases
On March 22, 2012, we entered into a three year lease for 3,185 square feet of office space located at 2350 Mission College Blvd, Suite 190, Santa
Clara, CA 95054 USA. The initial lease payment is $7,007 per month, increasing to $7,657 per month over the term of the lease. This lease is valid through July 31, 2015. The annual payment for this space equates to approximately $86,000 per year.
On April 15, 2012, NTAB entered into a lease for 2,853 square feet of office space located at Storgatan 23C, Stockholm, Sweden for approximately
$14,000 per month including property tax (excluding VAT). The annual payment for this space equates to approximately $174,000 per year including property tax (excluding VAT). This lease was valid through April 15, 2013. On April 16, 2013, this lease was extended for one year until April 15, 2014 under the same terms and conditions. Rent remained at approximately $14,000 per month including property tax (excluding VAT). This lease was terminated on July 1, 2013.
On October 12, 2012, we entered into a two year lease for office space located at 608 Bureau Shinagawa, 4-1-6 Konan, Minato-ku, 108-0075 Tokyo,
Japan. The lease payment is approximately $3,000 per month. This lease was valid through October 12, 2014. The lease was extended for two years and is valid until October 31, 2016 under the same terms and conditions. The annual payment for this space equates to approximately $36,000 per year.
Total Less than
1 year 1-3 years 3-5 years More than
5 years Operating lease obligations $ 1,437 $ 538 $ 899 $ - $ - Capital lease 481 79 237 158 7
Total $ 1,918 $ 617 $ 1,136 $ 158 $ 7
26

On July 1, 2013, NTAB entered into a lease for 5,480 square feet of office space located at Storgatan 23C, Stockholm, Sweden for approximately
$38,000 per month including property tax (excluding VAT). The annual payment for this space equates to approximately $458,000 per year including property tax (excluding VAT). This lease was valid through June 30, 2014. On July 1, 2014, the lease was extended and is valid through November 30, 2017 for approximately $443,000 per year. The lease can be extended on a yearly basis with three months written notice.
In January 2015, our subsidiary Neonode Korea Ltd. entered into a lease agreement located at B-1807, Daesung D-Polis. 543-1, Seoul, South Korea
in January, 2015. This lease is valid through February 13, 2017. The annual payment for this space is approximately $24,000 per year. For the years ended December 31, 2014, 2013 and 2012, we recorded approximately $633,000, $556,000 and $400,000, respectively, for rent
expense. A summary of future minimum payments under non-cancellable operating lease commitments as of December 31, 2014 is as follows (in thousands):
Equipment Subject to Capital Lease
In April 2014, we entered into a lease for certain specialized milling equipment. Under the terms of the lease agreement we are obligated to purchase
the equipment at the end of the original 6 year lease term for 10% of the original purchase price of the equipment. In accordance with relevant accounting guidance the lease is classified as a capital lease. The lease payments and depreciation period began on July 1, 2014 when the equipment went into service. The interest rate of the lease is 4% per annum.
Non-Recurring Engineering Development Costs
On February 4, 2011, we entered into an Analog Device Development Agreement with an effective date of January 24, 2010 (the “NN1001
Agreement”) with Texas Instruments (“TI”) pursuant to which TI integrated Neonode’s intellectual property into an Application Specific Integrated Circuit (“ASIC”). The NN1001ASIC only can be sold by TI exclusively to licensees of Neonode. Under the terms of the NN1001 Agreement, we will reimburse TI up to $500,000 of non-recurring engineering (“NRE”) development costs based on shipments of the NN1001. Under the terms of the NN1001 Agreement, we will reimburse TI an NRE fee of $0.08 per unit for each of the first one million units sold and $0.05 for the next eight million units sold. During the years ended December 31, 2014 and 2013, approximately $93,000 and $387,000, respectively of NRE expense related to the NN1001 Agreement is included in research and development in the consolidated statements of operations. Through December 31, 2014, we made total payments of approximately $419,000 under the NN1001 Agreement and there is approximately $61,000 included in our accrued expenses as of December 31, 2014.
On April 25, 2013, we entered into an additional Analog Device Development Agreement with an effective date of December 6, 2012 (the “NN1002
Agreement”) with TI pursuant to which TI will integrate Neonode’s intellectual property into an ASIC. The NN1002 ASIC only can be sold by TI exclusively to licensees of Neonode. Under the terms of the NN1002 Agreement, we will reimburse TI up to $500,000 of NRE costs based on shipments of the NN1002. Under the terms of the NN1002 Agreement we will reimburse TI an NRE fee of $0.25 per unit for each of the first two million units sold. The NN1002 is currently in development and has not been released to mass production. Through December 31, 2014, we had made no payments under the NN1002 Agreement. Liquidity and Capital Resources
Our liquidity is dependent on many factors, including sales volume, operating profit and the efficiency of asset use and turnover. Our future liquidity
will be affected by, among other things:
Years ending December 31, Total 2015 $ 538 2016 489 2017 410 $ 1,437
● actual versus anticipated licensing of our technology;
27

As of December 31, 2014, we had cash of $6.1 million, as compared to $8.8 million as of December 31, 2013. Working capital (current assets less current liabilities) was $3.0 million as of December 31, 2014, compared to working capital of $6.0 million as of
December 31, 2013. Net cash used in operating activities for the year ended December 31, 2014 of $11.8 million was primarily the result of (1) a net loss of
approximately $14.2 million and (2) approximately $0.3 million in net cash provided by changes in operating assets and liabilities, primarily accounts receivable, projects in process, accounts payable, accrued expenses and deferred revenue. Cash used to fund net losses is reduced by approximately $2.1 million in non-cash operating expenses, mainly comprised of depreciation and amortization and stock-based compensation.
Accounts receivable increased approximately $0.3 million as of December 31, 2014 compared with December 31, 2013, primarily as a result of net
revenues of approximately $1.8 million in the fourth quarter of 2014 compared to approximately $1.0 million in the fourth quarter of 2013. During 2014 and 2013, we were successful in collecting cash from sales to our customers substantially in accordance with our standard payment terms to those customers.
Deferred revenue decreased approximately $0.2 million during 2014 mainly related to finalization of development projects and net increase in
revenue recognition of prepaid license fees and NRE during 2014 as compared to 2013. Net cash used in operating activities for the year ended December 31, 2013 of $8.8 million was primarily the result of (1) a net loss of approximately
$13.1 million and (2) approximately $1.5 million in net cash provided by changes in operating assets and liabilities, primarily accounts receivable and deferred revenue. Cash used to fund net losses is reduced by approximately $2.8 million in non-cash operating expenses, mainly comprised of depreciation and amortization and stock-based compensation.
Accounts receivable decreased approximately $1.2 million as of December 31, 2013 compared with December 31, 2012, primarily as a result of net
revenues of approximately $1.7 million in the fourth quarter of 2013 compared to approximately $2.3 million in the fourth quarter of 2012. During 2013 and 2012, we were successful in collecting cash from sales to our customers substantially in accordance with our standard payment terms to those customers.
Deferred revenue increased approximately $0.9 million during 2013 primarily as a result of additional license technology agreements and
engineering projects entered into during 2013 as compared to 2012. Net cash used in operating activities for the year ended December 31, 2012 of $3.7 million was primarily the result of (i) a net loss of approximately
$9.3 million and (ii) approximately $1.9 million in net cash used by changes in operating assets and liabilities, primarily accounts receivable and deferred revenue. Cash used to fund net losses is reduced by approximately $3.6 million in net non-cash operating expenses, mainly comprised of depreciation and amortization and stock-based compensation.
Accounts receivable decreased approximately $1.3 million as of December 31, 2012 compared with December 31, 2011, primarily as a result of net
revenues of approximately $2.3 million in the fourth quarter of 2012 compared to approximately $4.0 million in the fourth quarter of 2011. During 2012 and 2011, we were successful in collecting cash from sales to our customers substantially in accordance with our standard payment terms to those customers.
● actual versus anticipated operating expenses; ● timing of our OEM customer product shipments; ● timing of payment for our technology licensing agreements; ● actual versus anticipated gross profit margin; ● ability to raise additional capital, if necessary; and ● ability to secure credit facilities, if necessary.
28

Deferred revenue increased approximately $0.8 million during 2012 primarily as a result of additional license technology agreements and
engineering projects entered into during 2012 as compared to 2011. In the years ended December 31, 2014, 2013 and 2012, we purchased $115,000, $155,000 and $310,000, respectively of fixed assets, consisting
primarily of computer software, computers and engineering equipment. Net cash provided by financing activities during the year ended December 31, 2014 was the result of net proceeds of approximately $9.3 million
from the sale of our common stock and $36,000 received in connection with the exercise of warrants to purchase 11,500 shares of our common stock. These increases were offset by repayments of $34,000 on our capital lease obligations during the year ended December 31, 2014.
Net cash provided by financing activities for the year ended December 31, 2013 was $8.7 million and was due to net proceeds of $1.8 million
received in connection with the exercise of stock options and warrants for shares of our common stock. In addition, we issued 1,168,939 shares of our common stock to investors in connection with an equity financing transaction in which we raised approximately $7.7 million and received approximately $6.9 million in cash, net of commissions, direct selling costs including legal, audit and other regulatory costs of approximately $0.8 million.
Net cash provided by financing activities totaled approximately $200,000 during the year ended December 31, 2012 from the exercise of warrants
for shares of our common stock.
We believe we have sufficient cash to operate for at least the next twelve months. In May 2014, we issued a warrant to an investor that may be exercised by November 15, 2015 to purchase up to an aggregate of 2,500,000 shares of
our common stock at an exercise price of $5.09 per share. Full exercise of the investor warrant will result in us receiving $12,725,000 in gross proceeds, excluding any placement agent fee paid as described below. The holder may exercise the warrant in whole or in part. The terms of the investor warrant require that exercise may only be for cash and not a cashless basis unless, after November 15, 2014, there has been a failure to maintain the effective registration of the common shares issuable upon exercise of the investor warrant shares. We filed a registration statement with the SEC to register the common shares issuable upon exercise of the investor warrant that became effective on June 12, 2014. The exercise price of the investor warrant is subject to adjustment for stock splits, stock dividends, recapitalizations, and similar transactions a “fundamental event” or “stock combination event” as provided for in the terms of the investor warrant. We have agreed to pay a placement agent fee of up to $600,000 in connection with exercises of the investor warrant. In addition, we issued to the placement agent a warrant to acquire up to an aggregate of 75,000 shares of our common stock. The agent warrant is subject to the same terms and provisions of the investor warrant described above.
In June 2014, we filed a shelf registration statement with the SEC that became effective on June 12, 2014. We may from time to time issue shares
of our common stock under our shelf registration in amounts, at prices, and on terms to be announced when and if the securities are offered. The specifics of any future offerings, along with the use of proceeds of any securities offered, will be described in a prospectus supplement and any other offering materials, at the time of the offering. There are 5,000,000 shares registered and available for issuance under our shelf registration.
In the future, we may require sources of capital in addition to cash on hand to continue operations and to implement our strategy. If our operations do not become cash flow positive, we may be forced to seek credit line facilities from financial institutions, equity investments or debt arrangements. No assurances can be given that we will be successful in obtaining such additional financing on reasonable terms, or at all. If adequate funds are not available on acceptable terms, or at all, we may be unable to adequately fund our business plans and it could have a negative effect on our business, results of operations and financial condition. In addition, if funds are available, the issuance of equity securities or securities convertible into equity could dilute the value of shares of our common stock and cause the market price to fall, and the issuance of debt securities could impose restrictive covenants that could impair our ability to engage in certain business transactions.
The functional currency of our foreign subsidiaries is the applicable local currency, the Swedish Krona, the Japanese Yen and the South Korean
Won, and is subject to foreign currency exchange rate risk. Any increase or decrease in the exchange rate of the U.S. Dollar compared to the Swedish Krona, Japanese Yen or South Korean Won will impact our future operating results. The majority of our consolidated net revenues, 90%, are denominated in US Dollars and approximately 56% of our consolidated operating costs are denominated in Swedish Krona and Japanese Yen. We do not currently enter into forward-exchange contracts to hedge exposure denominated in foreign currencies or any other derivative financial instruments for trading or speculative purposes. In the future, if our operations change and we determine that our foreign exchange exposure has increased, we may consider entering into hedging transactions to mitigate such risk.
ITEM 7A. QUANTITATIVE AND QUALITATIVE DISCLOSURES ABOUT MARK ET RISK
29
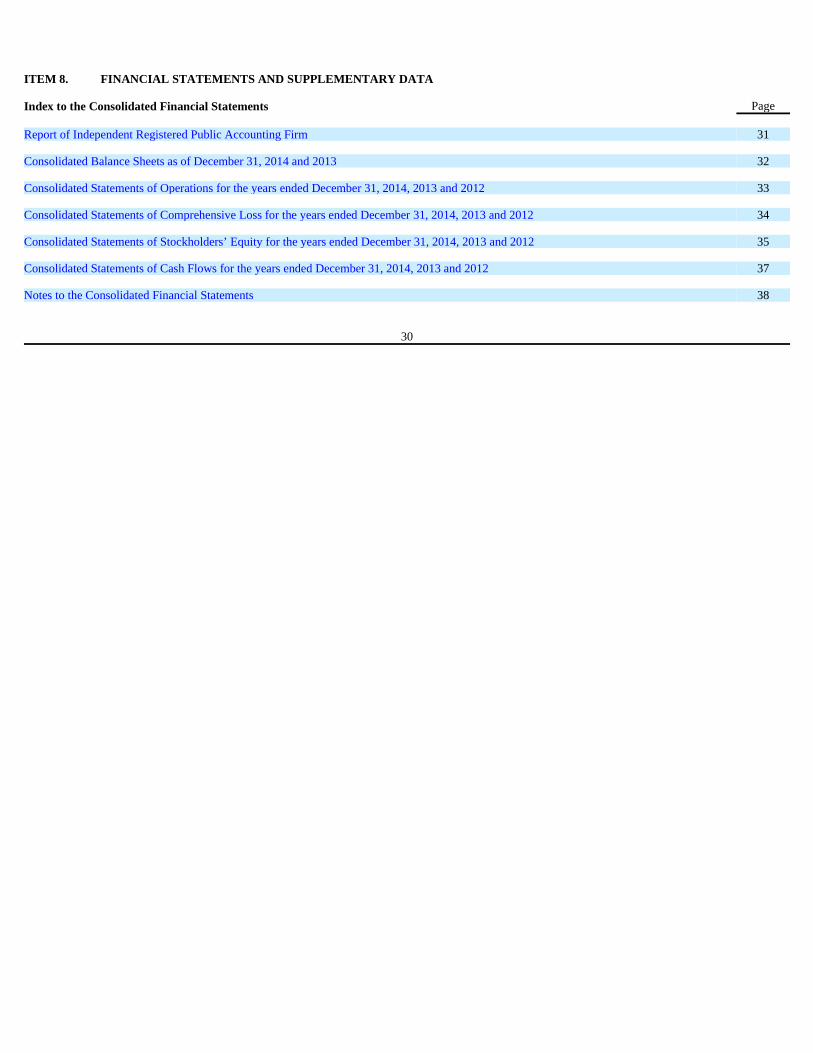
ITEM 8. FINANCIAL STATEMENTS AND SUPPLEMENTARY DATA
Index to the Consolidated Financial Statements Page Report of Independent Registered Public Accounting Firm 31 Consolidated Balance Sheets as of December 31, 2014 and 2013 32 Consolidated Statements of Operations for the years ended December 31, 2014, 2013 and 2012 33 Consolidated Statements of Comprehensive Loss for the years ended December 31, 2014, 2013 and 2012 34 Consolidated Statements of Stockholders’ Equity for the years ended December 31, 2014, 2013 and 2012 35 Consolidated Statements of Cash Flows for the years ended December 31, 2014, 2013 and 2012 37 Notes to the Consolidated Financial Statements 38
30

REPORT OF INDEPENDENT REGISTERED PUBLIC ACCOUNTING FIRM
Board of Directors and Stockholders Neonode Inc.
We have audited the accompanying consolidated balance sheets of Neonode Inc. (a Delaware corporation) and subsidiaries (the “Company”) as of December 31, 2014 and 2013, and the related consolidated statements of operations, comprehensive loss, stockholders’ equity, and cash flows for each of the years in the three-year period ended December 31, 2014. These consolidated financial statements are the responsibility of the Company’s management. Our responsibility is to express an opinion on these consolidated financial statements based on our audits.
We conducted our audits in accordance with the standards of the Public Company Accounting Oversight Board (United States). Those standards require that we plan and perform the audit to obtain reasonable assurance about whether the financial statements are free of material misstatement. An audit includes examining, on a test basis, evidence supporting the amounts and disclosures in the financial statements. An audit also includes assessing the accounting principles used and significant estimates made by management, as well as evaluating the overall financial statement presentation. We believe that our audits provide a reasonable basis for our opinion.
In our opinion, the consolidated financial statements referred to above present fairly, in all material respects, the financial position of Neonode Inc. and subsidiaries as of December 31, 2014 and 2013, and the results of its operations and its cash flows for each of the years in the three-year period ended December 31, 2014, in conformity with accounting principles generally accepted in the United States of America.
We have also audited, in accordance with the standards of the Public Company Accounting Oversight Board (United States), the Company’s internal control over financial reporting as of December 31, 2014, based on criteria established in Internal Control – Integrated Framework (2013) issued by the Committee of Sponsoring Organizations of the Treadway Commission (COSO) and our report dated March 12, 2015 expressed an adverse opinion on the effectiveness of the Company’s internal control over financial reporting.
/s/ KMJ Corbin & Company LLP Costa Mesa, California March 12, 2015
31

NEONODE INC.
CONSOLIDATED BALANCE SHEETS (In thousands, except share and per share amounts)
The accompanying notes are an integral part of these consolidated financial statements.
As of As of December 31, December 31, 2014 2013
ASSETS Current assets:
Cash $ 6,129 $ 8,815 Accounts receivable, net 1,106 969 Projects in process 200 736 Prepaid expenses and other current assets 513 616
Total current assets 7,948 11,136 Property and equipment, net 654 335
Total assets $ 8,602 $ 11,471
LIABILITIES AND STOCKHOLDERS ’ EQUITY Current liabilities:
Accounts payable $ 566 $ 479 Accrued expenses 935 978 Deferred revenues 3,403 3,666 Current portion of capital lease obligation 61 -
Total current liabilities 4,965 5,123 Capital lease obligation, net of current portion 367 -
Total liabilities 5,332 5,123 Commitments and contingencies (Note 10) Stockholders’ equity:
Series B Preferred stock, 54,425 shares authorized with par value of $0.001 per share; 83 shares issued and outstanding at December 31, 2014 and 2013, respectively. (In the event of dissolution, each share of Series B Preferred stock has a liquidation preference equal to par value of $0.001 per share over the shares of common stock) -- --
Common stock, 70,000,000 shares authorized at December 31, 2014 and 2013, with par value of $0.001 per share; 40,455,352 and 37,933,799 shares issued and outstanding at December 31, 2014 and 2013, respectively 40 38
Additional paid-in capital 169,010 157,994 Accumulated other comprehensive income 149 11 Accumulated deficit (165,929 ) (151,695 )
Total stockholders’ equity 3,270 6,348 Total liabilities and stockholders’ equity $ 8,602 $ 11,471
32

NEONODE INC.
CONSOLIDATED STATEMENTS OF OPERATIONS (In thousands, except per share amounts)
The accompanying notes are an integral part of these consolidated financial statements.
Years Ended December 31,
2014 2013 2012 Net revenues $ 4,740 $ 3,717 $ 7,137 Cost of revenues 1,509 1,642 1,465 Gross margin 3,231 2,075 5,672 Operating expenses: Research and development 7,373 7,235 5,741 Sales and marketing 3,250 2,732 4,372 General and administrative 6,799 5,079 4,721
Total operating expenses 17,422 15,046 14,834 Operating loss (14,191 ) (12,971 ) (9,162 ) Other expense: Other expense, net (30 ) -- -- Total other expense (30 ) -- -- Loss before provision for income taxes (14,221 ) (12,971 ) (9,162 ) Provision for income taxes 13 109 125 Net loss $ (14,234 ) $ (13,080 ) $ (9,287 )
Loss per common share: Basic and diluted loss per share $ (0.36 ) $ (0.37 ) $ (0.28 )
Basic and diluted – weighted average number of common shares outstanding 39,532 35,266 33,003
33

NEONODE INC.
CONSOLIDATED STATEMENTS OF COMPREHENSIVE LOSS (In thousands)
The accompanying notes are an integral part of these consolidated financial statements.
Years ended December 31, 2014 2013 2012 Net loss $ (14,234 ) $ (13,080 ) $ (9,287 ) Other comprehensive income (loss): Foreign currency translation gain (loss) 138 6 (8 ) Total comprehensive loss $ (14,096 ) $ (13,074 ) $ (9,295 )
34
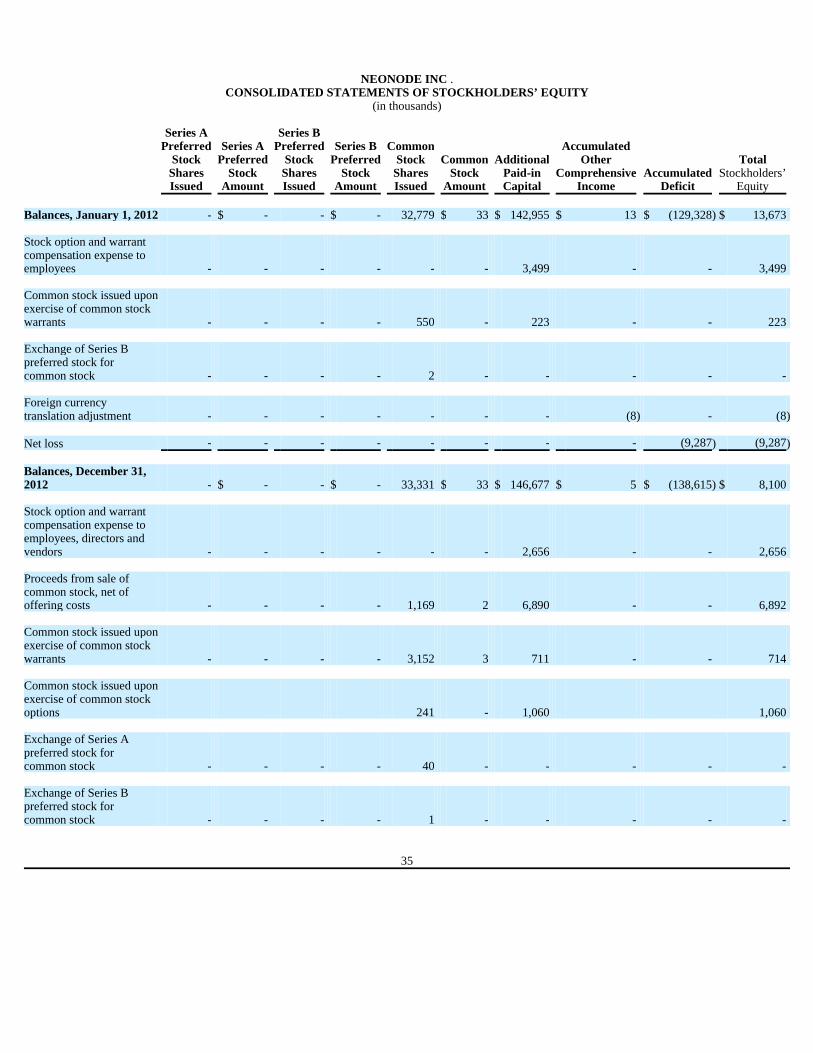
NEONODE INC .
CONSOLIDATED STATEMENTS OF STOCKHOLDERS’ EQUITY (in thousands)
Series A Preferred
Stock Shares Issued
Series A Preferred
Stock Amount
Series B Preferred
Stock Shares Issued
Series B Preferred
Stock Amount
Common Stock Shares Issued
Common Stock
Amount
Additional Paid-in Capital
Accumulated Other
Comprehensive Income
Accumulated Deficit
Total Stockholders’
Equity Balances, January 1, 2012 - $ - - $ - 32,779 $ 33 $ 142,955 $ 13 $ (129,328 ) $ 13,673 Stock option and warrant compensation expense to employees - - - - - - 3,499 - - 3,499 Common stock issued upon exercise of common stock warrants - - - - 550 - 223 - - 223 Exchange of Series B preferred stock for common stock - - - - 2 - - - - - Foreign currency translation adjustment - - - - - - - (8 ) - (8 ) Net loss - - - - - - - - (9,287 ) (9,287 ) Balances, December 31, 2012 - $ - - $ - 33,331 $ 33 $ 146,677 $ 5 $ (138,615 ) $ 8,100 Stock option and warrant compensation expense to employees, directors and vendors - - - - - - 2,656 - - 2,656 Proceeds from sale of common stock, net of offering costs - - - - 1,169 2 6,890 - - 6,892 Common stock issued upon exercise of common stock warrants - - - - 3,152 3 711 - - 714 Common stock issued upon exercise of common stock options 241 - 1,060 1,060 Exchange of Series A preferred stock for common stock - - - - 40 - - - - - Exchange of Series B preferred stock for common stock - - - - 1 - - - - -
35

NEONODE INC.
CONSOLIDATED STATEMENTS OF STOCKHOLDERS’ EQUITY, CO NTINUED (in thousands)
The accompanying notes are an integral part of these consolidated financial statements.
Series A Preferred
Stock Shares Issued
Series A Preferred
Stock Amount
Series B Preferred
Stock Shares Issued
Series B Preferred
Stock Amount
Common Stock Shares Issued
Common Stock
Amount
Additional Paid-in Capital
Accumulated Other
Comprehensive Income
Accumulated Deficit
Total Stockholders’
Equity Foreign currency translation adjustment - - - - - - - 6 - 6 Net loss - - - - - - - - (13,080 ) (13,080 ) Balances, December 31, 2013 - $ - - $ - 37,934 $ 38 $ 157,994 $ 11 $ (151,695 ) $ 6,348 Stock based compensation expense to employees, directors and vendors - - - - - - 1,729 - - 1,729 Proceeds from sale of common stock, net of offering costs - - - - 2,500 2 9,251 - - 9,253 Common stock issued upon exercise of common stock warrants - - - - 21 - 36 - - 36 Foreign currency translation adjustment - - - - - - - 138 - 138 Net loss - - - - - - - - (14,234 ) (14,234 ) Balances, December 31, 2014 - $ - - $ - 40,455 $ 40 $ 169,010 $ 149 $ (165,929 ) $ 3,270
36
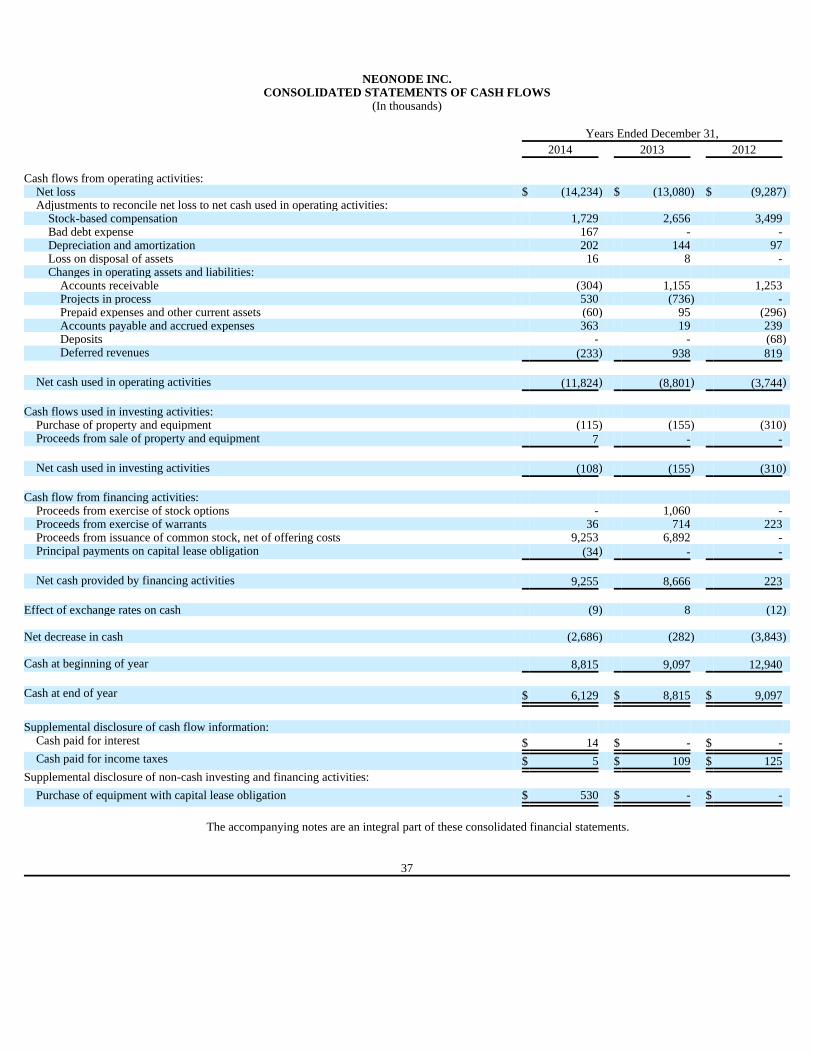
NEONODE INC.
CONSOLIDATED STATEMENTS OF CASH FLOWS (In thousands)
The accompanying notes are an integral part of these consolidated financial statements.
Years Ended December 31,
2014 2013 2012 Cash flows from operating activities:
Net loss $ (14,234 ) $ (13,080 ) $ (9,287 ) Adjustments to reconcile net loss to net cash used in operating activities:
Stock-based compensation 1,729 2,656 3,499 Bad debt expense 167 - - Depreciation and amortization 202 144 97 Loss on disposal of assets 16 8 - Changes in operating assets and liabilities:
Accounts receivable (304 ) 1,155 1,253 Projects in process 530 (736 ) - Prepaid expenses and other current assets (60 ) 95 (296 ) Accounts payable and accrued expenses 363 19 239 Deposits - - (68 ) Deferred revenues (233 ) 938 819
Net cash used in operating activities (11,824 ) (8,801 ) (3,744 ) Cash flows used in investing activities:
Purchase of property and equipment (115 ) (155 ) (310 ) Proceeds from sale of property and equipment 7 - -
Net cash used in investing activities (108 ) (155 ) (310 )
Cash flow from financing activities:
Proceeds from exercise of stock options - 1,060 - Proceeds from exercise of warrants 36 714 223 Proceeds from issuance of common stock, net of offering costs 9,253 6,892 - Principal payments on capital lease obligation (34 ) - -
Net cash provided by financing activities 9,255 8,666 223
Effect of exchange rates on cash (9 ) 8 (12 ) Net decrease in cash (2,686 ) (282 ) (3,843 ) Cash at beginning of year 8,815 9,097 12,940 Cash at end of year $ 6,129 $ 8,815 $ 9,097
Supplemental disclosure of cash flow information:
Cash paid for interest $ 14 $ - $ -
Cash paid for income taxes $ 5 $ 109 $ 125
Supplemental disclosure of non-cash investing and financing activities:
Purchase of equipment with capital lease obligation $ 530 $ - $ -
37

NEONODE INC.
Notes to the Consolidated Financial Statements
1. Nature of the business and operations
Background and Organization
Neonode Inc. (“we”, “us”, “our”, or the “Company”) was incorporated in the State of Delaware in 1997 as the parent of Neonode AB, a company
founded in February 2004 and incorporated in Sweden. On December 29, 2008, we entered into a share exchange agreement with AB Cypressen nr 9683 (renamed Neonode Technologies AB), a Swedish engineering company, and Neonode Technologies AB became our wholly owned subsidiary. In 2013, we established additional subsidiaries: Neonode Japan Inc. (Japan); Neno User Interface Solutions AB (Sweden); NEON Technology Inc. (U.S.); and Neonode Americas Inc. (U.S.). In 2014, we established one additional subsidiary: Neonode Korea Ltd. (South Korea).
Operations
Neonode Inc., collectively with its subsidiaries, is referred to as “Neonode”, develops and licenses user interfaces and optical touch technology to
Original Equipment Manufacturers (“OEMs”) and Original Design Manufacturers (“ODMs”) who embed the Neonode technology into devices that they produce and sell.
Reclassifications
Projects in process as of December 31, 2013 are now reported under their own caption, separate from prepaid expenses and other current assets, in the accompanying consolidated balance sheet and as a separate component of cash flows from operating activities in the consolidated statement of cash flows for the year ended December 31, 2013, in order to conform to the current period presentation.
Liquidity
The Company incurred net losses of approximately $14.2 million, $13.1 million and $9.3 million for the years ended December 31, 2014, 2013 and
2012, respectively and had an accumulated deficit of approximately $165.9 million and $151.7 million for the years ended December 31, 2014 and 2013, respectively. In addition, the Company used cash in operating activities of approximately $11.8 million, $8.8 million and $3.7 million for the years ended December 31, 2014, 2013 and 2012, respectively.
In May 2014, we issued a warrant to an investor that may be exercised by November 15, 2015 to purchase up to an aggregate of 2,500,000 shares of our common stock at an exercise price of $5.09 per share. Full exercise of the investor warrant will result in us receiving $12,725,000 in gross proceeds, excluding any placement agent fee paid as described below. The holder may exercise the warrant in whole or in part. The terms of the investor warrant require that exercise may only be for cash and not a cashless basis unless, after November 15, 2014, there has been a failure to maintain the effective registration of the common shares issuable upon exercise of the investor warrant shares. We filed a registration statement with the SEC to register the common shares issuable upon exercise of the investor warrant that became effective on June 12, 2014. The exercise price of the investor warrant is subject to adjustment for stock splits, stock dividends, recapitalizations, and similar transactions a “fundamental event” or “stock combination event” as provided for in the terms of the investor warrant. We have agreed to pay a placement agent fee of up to $600,000 in connection with exercises of the investor warrant. In addition, we issued to the placement agent a warrant to acquire up to an aggregate of 75,000 shares of our common stock. The agent warrant is subject to the same terms and provisions of the investor warrant described above.
In June 2014, we filed a shelf registration statement with the SEC that became effective on June 12, 2014. We may from time to time issue shares of our common stock under our shelf registration in amounts, at prices, and on terms to be announced when and if the securities are offered. The specifics of any future offerings, along with the use of proceeds of any securities offered, will be described in a prospectus supplement and any other offering materials, at the time of the offering. There are 5,000,000 shares registered and available for issuance under our shelf registration. 2. Summary of significant accounting policies
Principles of Consolidation
The consolidated financial statements have been prepared in accordance with accounting principles generally accepted in the United States of
America (“U.S. GAAP”) and include the accounts of Neonode Inc. and its wholly owned subsidiaries. All inter-company accounts and transactions have been eliminated in consolidation.
38

The consolidated statements of operations, comprehensive loss and cash flows for the year ended December 31, 2012 include our accounts and those of our wholly owned subsidiary, Neonode Technologies AB (Sweden).
The consolidated balance sheet at December 31, 2013 and the consolidated statements of operations, comprehensive loss and cash flows for the year
ended December 31, 2013 include our accounts and those of our wholly owned subsidiaries, Neonode Technologies AB (Sweden), Neonode Americas Inc. (U.S.), Neonode Japan Inc. (Japan), NEON Technology Inc. (U.S.) and Neno User Interface Solutions AB (Sweden).
The consolidated balance sheet at December 31, 2014 and the consolidated statements of operations, comprehensive loss and cash flows for the year
ended December 31, 2014 include our accounts and those of our wholly owned subsidiaries, Neonode Technologies AB (Sweden), Neonode Americas Inc. (U.S.), Neonode Japan Inc. (Japan), NEON Technology Inc. (U.S.), Neno User Interface Solutions AB (Sweden) and Neonode Korea Ltd. (South Korea).
Estimates
The preparation of financial statements in conformity with U.S. GAAP requires making estimates and assumptions that affect, at the date of the financial statements, the reported amounts of assets and liabilities, disclosure of contingent assets and liabilities and the reported amounts of revenue and expenses. Actual results could differ from these estimates. Significant estimates include, but are not limited to, collectability of accounts receivable, recoverability of capitalized project costs and long-lived assets, the valuation allowance related to our deferred tax assets, and the fair value of options and warrants issued for stock-based compensation.
Cash and Cash Equivalents
We have not had any liquid investments other than normal cash deposits with bank institutions to date. The Company considers all highly liquid investments with original maturities of three months of less to be cash equivalents.
Concentration of Cash Balance Risks
Cash balances are maintained at various banks in the U.S., Japan, Sweden and South Korea. At times, deposits held with financial institutions in the
U.S may exceed the amount of insurance provided by the Federal Deposit Insurance Corporation, which provides basic deposit coverage with limits up to $250,000 per owner. The Swedish government provides insurance coverage up to 100,000 euro per customer and covers deposits in all types of accounts. The Japanese government provides insurance coverage up to 10,000,000 Yen per customer. The Korea Deposit Insurance Corporation provides insurance coverage up to 50,000,000 Won per customer. As of December 31, 2014, we had approximately $5.7 million in excess of insurance limits.
Accounts Receivable and Allowance for Doubtful Accounts
Our accounts receivable are stated at net realizable value. Our policy is to maintain allowances for estimated losses resulting from the inability of
our customers to make required payments. Credit limits are established through a process of reviewing the financial history and stability of each customer. Where appropriate, we obtain credit rating reports and financial statements of the customer when determining or modifying its credit limits. We regularly evaluate the collectability of our trade receivable balances based on a combination of factors. When a customer’s account balance becomes past due, we initiate dialogue with the customer to determine the cause. If it is determined that the customer will be unable to meet its financial obligation, such as in the case of a bankruptcy filing, deterioration in the customer’s operating results or financial position or other material events impacting its business, we record a specific allowance to reduce the related receivable to the amount we expect to recover. Should all efforts fail to recover the related receivable, we will write-off the account. We also record an allowance for all customers based on certain other factors including the length of time the receivables are past due and historical collection experience with customers. Our allowance for doubtful accounts was approximately $167,000 as of December 31, 2014. An allowance for doubtful accounts was not necessary as of December 31, 2013.
Projects in Process
Projects in process consist of costs incurred toward the completion of various projects for certain customers. These costs are primarily comprised of
direct engineering labor costs and project-specific equipment costs. These costs are capitalized on our balance sheet as an asset and deferred until revenue for each project is recognized in accordance with our revenue recognition policy. Costs capitalized in projects in process were $200,000 and $736,000 as of December 31, 2014 and 2013, respectively.
Property and Equipment
Property and equipment are stated at cost, net of accumulated depreciation and amortization. Depreciation and amortization are computed using the straight-line method based upon estimated useful lives of the assets as follows:
Equipment purchased under capital leases is amortized on a straight-line basis over the estimated useful life of the asset or term of the lease,
whichever is shorter.
Upon retirement or sale of property and equipment, cost and accumulated depreciation and amortization are removed from the accounts and any gains or losses are reflected in the consolidated statements of operations. Maintenance and repairs are charged to expense as incurred.
Estimated useful lives Computer equipment 3 years Furniture and fixtures 5 years
39

Long-Lived Assets
We assess any impairment by estimating the future cash flow from the associated asset in accordance with relevant accounting guidance. If the estimated undiscounted future cash flow related to these assets decreases or the useful life is shorter than originally estimated, we may incur charges for impairment of these assets. The impairment is based on the estimated discounted cash flow associated with the asset. As of December 31, 2014, we believe there is no impairment of our long-lived assets. There can be no assurance, however, that market conditions will not change or sufficient demand for our products and services will continue, which could result in impairment of long-lived assets in the future.
Foreign Currency Translation and Transaction Gains and Losses
The functional currency of our foreign subsidiaries is the applicable local currency, the Swedish Krona, the Japanese Yen and the South Korean Won. The translation from Swedish Krona, Japanese Yen or South Korean won to U.S. Dollars is performed for balance sheet accounts using current exchange rates in effect at the balance sheet date and for income statement accounts using a weighted average exchange rate during the period. Gains or (losses) resulting from translation are included as a separate component of accumulated other comprehensive income (loss). Gains or (losses) resulting from foreign currency transactions are included in general and administrative expenses in the accompanying consolidated statements of operations and were ($37,000), ($155,000) and ($50,000) during the years ended December 31, 2014, 2013 and 2012, respectively. Foreign currency translation gains (losses) were $138,000, $6,000 and ($8,000) during the years ended December 31, 2014, 2013 and 2012, respectively.
Concentration of Credit and Business Risks
Our customers are located in U.S., Europe and Asia. As of December 31, 2014, three customers represented approximately 87% of the Company’s consolidated accounts receivable. As of December 31, 2013, two customers represented approximately 56% of the Company’s consolidated accounts receivable. Our net revenues for the year ended December 31, 2014 were earned from thirty-two customers. Customers who accounted for 10% or more of our
net revenues during the year ended December 31, 2014 are as follows. • Hewlett-Packard Company – 24% • KOBO Inc. – 10% • Leap Frog Enterprises Inc. – 11% • Sony Corporation – 10% Our revenues for the year ended December 31, 2013 were earned from twenty-nine customers. Customers who accounted for 10% or more of our net
revenues during the year ended December 31, 2013 are as follows. • KOBO Inc. – 28% • Netronix Inc. – 18% • Leap Frog Enterprises Inc. – 12% • Sony Corporation – 11% Our revenues for the year ended December 31, 2012 were earned from twenty customers. Customers who accounted for 10% or more of our net
revenues during the year ended December 31, 2012 are as follows: • Amazon.com Inc. – 32% • KOBO Inc. – 26% Sony Corporation – 17% • Sony Corporation – 17%
Revenue Recognition
Licensing Revenues: We derive revenue from the licensing of internally developed intellectual property (“IP”). We enter into IP licensing agreements that generally
provide licensees the right to incorporate our IP components in their products with terms and conditions that vary by licensee. The IP licensing agreements generally include a nonexclusive license for the underlying IP. Fees under these agreements may include license fees relating to our IP and royalties payable following the distribution by our licensees of products incorporating the licensed technology. The license for our IP has standalone value and can be used by the licensee without maintenance and support. We follow U.S. GAAP for revenue recognition as per unit royalty products are distributed or licensed by our customers. For technology license arrangements that do not require significant modification or customization of the underlying technology, we recognize technology license revenue when: (1) we enter into a legally binding arrangement with a customer for the license of technology; (2) the customer distributes or licenses the products; (3) the customer payment is deemed fixed or determinable and free of contingencies or significant uncertainties; and (4) collection is reasonably assured. Our customers report to us the quantities of products distributed or licensed by them after the end of the reporting period stipulated in the contract, generally 30 to 45 days after the end of the month or quarter. Effective October 16, 2013, our management determined it was appropriate to recognize licensing revenue in the period in which royalty reports are received, rather than the period in which the products are distributed or to which the license relates.
Explicit return rights are not offered to customers. There have been no returns through December 31, 2014.
40

Engineering Services:
We may sell engineering consulting services to our customers on a flat rate or hourly rate basis. We recognize revenue from these services when all
of the following conditions are met: (1) evidence existed of an arrangement with the customer, typically consisting of a purchase order or contract; (2) our services were performed and risk of loss passed to the customer; (3) we completed all of the necessary terms of the contract; (4) the amount of revenue to which we were entitled was fixed or determinable; and (5) we believed it was probable that we would be able to collect the amount due from the customer. To the extent that one or more of these conditions has not been satisfied, we defer recognition of revenue. Generally, we recognize revenue as the engineering services stipulated under the contract are completed and accepted by our customers. Engineering services performed under a signed statement of work (“SOW”) with a customer are accounted for under the completed contract method, as these SOW’s are short-term in nature and our total contract costs are difficult to estimate. Estimated losses on SOW projects are recognized in full as soon as they become evident.
Deferred Revenues
From time-to-time we receive prepayments from our customers related to future services or future license fee revenues. We defer the license fees until we have met all accounting requirements for revenue recognition as per unit royalty products are distributed and royalty reports are received. Engineering development fee revenues are deferred until such time as the engineering work has been completed and accepted by our customers.
Advertising
Advertising costs are expensed as incurred. Advertising costs amounted to approximately $172,000, $141,000 and $312,000 for the years ended December 31, 2014, 2013 and 2012, respectively.
Research and Development
Research and development (“R&D”) costs are expensed as incurred. R&D costs consist mainly of personnel related costs in addition to some external consultancy costs such as testing, certifying and measurements.
Stock-Based Compensation Expense
We measure the cost of employee services received in exchange for an award of equity instruments, including share options, based on the estimated fair value of the award on the grant date, and recognize the value as compensation expense over the period the employee is required to provide services in exchange for the award, usually the vesting period, net of estimated forfeitures.
We account for equity instruments issued to non-employees at their estimated fair value. The measurement date for the estimated fair value for the
equity instruments issued is determined at the earlier of (1) the date at which a commitment for performance by the consultant or vendor is reached, or (2) the date at which the consultant or vendor’s performance is complete. In the case of equity instruments issued to consultants, the estimated fair value of the equity instruments is primarily recognized over the term of the consulting agreement. The estimated fair value of the stock-based compensation is periodically re-measured and income or expense is recognized during the vesting term.
When determining stock-based compensation expense involving options and warrants, we determine the estimated fair value of options and warrants
using the Black-Scholes option pricing model.
41

Income Taxes
We recognize deferred tax liabilities and assets for the expected future tax consequences of items that have been included in the consolidated financial statements or tax returns. We estimate income taxes based on rates in effect in each of the jurisdictions in which we operate. Deferred income tax assets and liabilities are determined based upon differences between the financial statement and income tax bases of assets and liabilities using enacted tax rates in effect for the year in which the differences are expected to reverse. The realization of deferred tax assets is based on historical tax positions and expectations about future taxable income. Valuation allowances are recorded against net deferred tax assets when, in our opinion, realization is uncertain based on the “more likely than not” criteria of the accounting guidance.
Based on the uncertainty of future pre-tax income, we fully reserved our net deferred tax assets as of December 31, 2014 and 2013. In the event we
were to determine that we would be able to realize our deferred tax assets in the future, an adjustment to the deferred tax asset would increase income in the period such determination was made. The provision for income taxes represents the net change in deferred tax amounts, plus income taxes payable for the current period.
We follow U.S. GAAP related to uncertain tax positions, which provisions include a two-step approach to recognizing, de-recognizing and
measuring uncertain tax positions. As a result, we did not recognize a liability for unrecognized tax benefits. As of December 31, 2014 and 2013, we had no unrecognized tax benefits.
Net Loss per Share
Net loss per share amounts have been computed based on the weighted-average number of shares of common stock outstanding during the years ended December 31, 2014, 2013 and 2012. Net loss per share, assuming dilution amounts from common stock equivalents, is computed based on the weighted average number of shares of common stock and potential common stock equivalents outstanding during the period. The weighted average number of shares of common stock and potential common stock equivalents used in computing the net loss per share for years ended December 31, 2014, 2013 and 2012 exclude the potential common stock equivalents, as the effect would be anti-dilutive (see Note 14).
Comprehensive Loss
Our comprehensive loss includes foreign currency translation gains and losses. The cumulative amount of translation gains and losses are reflected as a separate component of stockholders’ equity in the consolidated balance sheets, as accumulated other comprehensive income.
Cash Flow Information
Cash flows in foreign currencies have been converted to U.S. Dollars at an approximate weighted average exchange rate for the respective reporting periods. The weighted average exchange rate for the consolidated statements of operations was 6.86, 6.51 and 6.78 Swedish Krona to one U.S. Dollar for the years ended December 31, 2014, 2013 and 2012, respectively. The exchange rate for the consolidated balance sheets was 7.80 and 6.48 Swedish Krona to one U.S. Dollar as of December 31, 2014 and 2013, respectively. The weighted-average exchange rate for the consolidated statement of operations and of comprehensive loss was 105.84 and 97.58 Japanese Yen to one U.S. Dollar for the year ended December 31, 2014 and 2013. The exchange rate for the consolidated balance sheet was 119.93 and 105.22 Japanese Yen to one U.S. Dollar as of December 31, 2014 and 2013. The weighted-average exchange rate for the consolidated statement of operations and of comprehensive loss was 1,050.63 South Korean won to one U.S. Dollar for the year ended December 31, 2014. The exchange rate for the consolidated balance sheet was 1,096.73 South Korean Won to one U.S. Dollar as of December 31, 2014.
Fair Value of Financial Instruments
We disclose the estimated fair values for all financial instruments for which it is practicable to estimate fair value. Financial instruments including cash, accounts receivable, accounts payable and accrued expenses and are deemed to approximate fair value due to their short maturities.
42

New Accounting Pronouncements
In July 2013, the Financial Accounting Standards Board (“FASB”) issued Accounting Standards Update (“ASU”) No. 2013-11, “Presentation of an
Unrecognized Tax Benefit When a Net Operating Loss Carryforward, a Similar Tax Loss, or a Tax Credit Carryforward Exists”. ASU 2013-11 provides explicit guidance on the financial statement presentation of an unrecognized tax benefit when a net operating loss carryforward, a similar tax loss, or a tax credit carryforward exists. The guidance is effective prospectively for fiscal years, and interim periods within those years, beginning after December 15, 2013, with an option for early adoption. We adopted this guidance at the beginning of our first quarter of fiscal year 2014, and did not determine there is any impact on our consolidated financial statements and disclosures.
In May 2014, the FASB issued ASU No. 2014-09, “ Revenue from Contracts with Customers (Topic 606)” (“ASU 2014-09”). ASU 2014-09 amends
the guidance for revenue recognition to replace numerous, industry specific requirements and converges areas under this topic with those of the International Financial Reporting Standards. The ASU implements a five-step process for customer contract revenue recognition that focuses on transfer of control, as opposed to transfer of risk and rewards. The amendment also requires enhanced disclosures regarding the nature, amount, timing and uncertainty of revenues and cash flows from contracts with customers. Other major provisions include the capitalization and amortization of certain contract costs, ensuring the time value of money is considered in the transaction price, and allowing estimates of variable consideration to be recognized before contingencies are resolved in certain circumstances. The amendments in this ASU are effective for reporting periods beginning after December 15, 2016, and early adoption is prohibited. Entities can transition to the standard either retrospectively or as a cumulative-effect adjustment as of the date of adoption. We have not yet selected a transition method and are currently assessing the impact the adoption of ASU 2014-09 will have on our consolidated financial statements and disclosures.
In August 2014, the FASB issued ASU No. 2014-15, “ Presentation of Financial Statements - Going Concern ”. The amendments in this update
provide guidance in U.S. GAAP about management's responsibilities to evaluate whether there is substantial doubt about an entity's ability to continue as a going concern and to provide related footnote disclosures. The main provision of the amendments are for an entity's management, in connection with the preparation of financial statements, to evaluate whether there are conditions or events, considered in the aggregate, that raise substantial doubt about the entity's ability to continue as a going concern within one year after the date that the financial statements are issued. Management's evaluation should be based on relevant conditions and events that are known or reasonably knowable at the date the consolidated financial statements are issued. When management identifies conditions or events that raise substantial doubt about an entity's ability to continue as a going concern, the entity should disclose information that enables users of the consolidated financial statements to understand all of the following: (1) principal conditions or events that raised substantial doubt about the entity's ability to continue as a going concern (before consideration of management's plans); (2) management's evaluation of the significance of those conditions or events in relation to the entity's ability to meet its obligations; and (3) management's plans that alleviated substantial doubt about the entity's ability to continue as a going concern or management's plans that are intended to mitigate the conditions or events that raise substantial doubt about the entity's ability to continue as a going concern. The amendments in this update are effective for interim and annual reporting periods after December 15, 2016 and early application is permitted. The Company is currently assessing this guidance for future implementation.
3. Prepaid Expenses and Other Current Assets
Prepaid expense and other current assets consist of the following (in thousands):
As of December 31, 2014 2013 Prepaid insurance $ 122 $ 91 Prepaid rent 39 75 VAT receivable 137 250 Other 215 200
Total prepaid expenses and other current assets $ 513 $ 616
43

4. Property and Equipment
Property and equipment consist of the following (in thousands):
Depreciation and amortization expense was $202,000, $144,000 and $97,000 for the years ended December 31, 2014, 2013 and 2012, respectively.
5. Accrued Expenses
Accrued expenses consist of the following (in thousands):
6. Fair Value Measurements
Accounting guidance defines fair value, establishes a framework for measuring fair value, and expands disclosure requirements about fair value
measurements. The accounting guidance does not mandate any new fair value measurements and is applicable to assets and liabilities that are required to be recorded at fair value under other accounting pronouncements.
There were no assets or liabilities recorded at fair value on a recurring basis in 2014 and 2013.
The three levels of the fair value hierarchy are described as follows:
Level 1: Applies to assets or liabilities for which there are quoted prices (unadjusted) in active markets for identical assets and liabilities. We had no
Level 1 assets or liabilities. Level 2: Applies to assets or liabilities for which there are inputs other than quoted prices that are included in Level 1 observable, either directly or
indirectly. We had no Level 2 assets or liabilities. Level 3: Applies to assets or liabilities for which there are unobservable inputs to the valuation methodology that are significant to the measurement
of the fair value of the assets or liabilities. We had no Level 3 assets or liabilities.
7. Deferred Revenues We defer the license fees until we have met all accounting requirements for revenue recognition as per unit royalty products are distributed and
royalty reports are received. Engineering development fee revenues are deferred until such time as the engineering work has been completed and accepted by our customers. As of December 31, 2014 and 2013, we had $3.0 million and $2.5 million, respectively, of deferred license fee revenue related to prepayments for future license fees from five and three customers, respectively, and a total of $0.4 million and $1.2 million, respectively, of deferred engineering development fees from five and twenty-one customers, respectively.
As of December 31, 2014 2013 Computers, software, furniture and fixtures $ 546 $ 549 Equipment under capital lease 458 - Less accumulated depreciation and amortization (350 ) (214 )
Property and equipment, net $ 654 $ 335
As of December 31, 2014 2013 Salaries, payroll taxes, vacation and benefits $ 686 $ 706 Accrued consulting fees and other 249 272
Total accrued expenses $ 935 $ 978
44

8. Stockholders’ Equity
Common Stock
During the year ended December 31, 2014, we sold 2,500,000 shares of our common stock at a price of $4.00 per share to an accredited institutional investor for an aggregate purchase price of $10,000,000 in gross proceeds and net proceeds of approximately $9.3 million after expenses and fees, including a $600,000 placement agent fee.
In addition, we issued a warrant to the investor that may be exercised by November 15, 2015 to purchase up to an aggregate of 2,500,000 shares of
our common stock at an exercise price of $5.09 per share (see note 9). Full exercise of the investor warrant will result in us receiving $12,725,000 in gross proceeds, excluding any placement agent fee paid as described below. The holder may exercise the warrant in whole or in part. The terms of the investor warrant require that exercise may only be for cash and not a cashless basis unless, after November 15, 2014, there has been a failure to maintain the effective registration of the common shares issuable upon exercise of the investor warrant shares. We filed a registration statement with the SEC to register the common shares issuable upon exercise of the investor warrant that became effective on June 12, 2014. The exercise price of the investor warrant is subject to adjustment for stock splits, stock dividends, recapitalizations, and similar transactions a “fundamental event” or “stock combination event” as provided for in the terms of the investor warrant. We have agreed to pay a placement agent fee of up to $600,000 in connection with exercises of the investor warrant. In addition, we issued to the placement agent a warrant to acquire up to an aggregate of 75,000 shares of our common stock. The agent warrant is subject to the same terms and provisions of the investor warrant described above.
During the year ended December 31, 2014, warrant holder’s exercised warrants to purchase 17,000 shares of common stock using the cashless net
exercise provision allowed in the warrant and received 10,053 shares of our common stock. In addition, warrant holders exercised warrants to purchase 11,500 shares of common stock at an exercise price of $3.13 per share for total cash proceeds of approximately $36,000.
During the year ended December 31, 2013, warrant holder’s exercised warrants to purchase 1,815,368 shares of common stock using the cashless
exercise provision allowed in the warrant and received 1,384,719 shares of our common stock. In addition, warrant holders exercised warrants to purchase 429,536 shares of common stock and paid a cash exercise price ranging between $1.00 and $3.13 per share for total cash proceeds of approximately $714,000.
On February 26, 2013, David Brunton, our former Chief Financial Officer, exercised warrants to purchase 320,000 shares of common stock using
the cashless exercise provision allowed in the warrant and received 266,228 shares of our common stock.
On April 4, 2013, we extended a 40,000 stock purchase warrant with an exercise price of $1.00 per share that expired on January 28, 2013 that was issued to an investor in a previous convertible debt financing. The estimated fair value of the warrant was $166,000 on the date of grant, using the Black-Scholes option pricing model, which was expensed during the year ended December 31, 2013. The warrant holder exercised the warrant on April 4, 2013 and the Company received cash proceeds of $40,000 (see Note 9).
On August 12, 2013, Thomas Eriksson, our Chief Executive Officer, exercised warrants to purchase 400,000 shares of common stock using the
cashless net exercise provision allowed in the warrant and received 326,608 shares of our common stock.
On August 12, 2013, Per Bystedt, the Chairman of our Board, exercised warrants to purchase 387,773 shares of common stock using the cashless exercise provision allowed in the warrant and received 316,624 shares of our common stock.
On August 12, 2013, Phenning Holdings Ltd, a company controlled by Per Bystedt, the Chairman of our Board, exercised warrants to purchase 227,661 shares of common stock using the cashless net exercise provision allowed in the warrant and received 182,890 shares of our common stock.
On August 12, 2013, Davisa Ltd, a company controlled by Mats Dahlin, a member of our Board, exercised warrants to purchase 215,724 shares of common stock using the cashless net exercise provision allowed in the warrant and received 176,143 shares of our common stock.
On August 12, 2013, John Reardon, a member of our Board, exercised warrants to purchase 80,000 shares of common stock using the cashless net
exercise provision allowed in the warrant and received 65,322 shares of our common stock.
45

On September 16, 2013, we issued 1,168,939 shares of our common stock to investors in connection with an equity financing transaction in which
we raised approximately $7.7 million and received approximately $6.9 million in cash, net of commissions, direct offering costs including legal, audit and other regulatory costs of approximately $0.8 million.
On March 16, 2012, John Reardon, a member of our board of directors, exercised a warrant to purchase 200,000 shares of common stock using the
net exercise provision allowed in the warrant and received 174,798 shares of our common stock.
During the year ended December 31, 2012, warrant holders (excluding members of our board of directors) exercised warrants to purchase 361,000 shares of common stock using the net exercise provision allowed in the warrant and received 235,144 shares of our common stock. Warrant holders exercised warrants to purchase 17,500 shares of common stock and paid a cash exercise price of $3.13 per share for total proceeds of $54,775. In addition, during 2012 a warrant holder exercised a warrant to purchase 122,238 shares of common stock and paid a cash exercise price of $1.38 per share for total proceeds of $168,668.
Preferred Stock
On March 21, 2013, Series A Preferred stockholders exchanged 83 shares of Series A Preferred stock for 39,790 shares of our common stock, eliminating all Series A Preferred shares outstanding.
On February 27, 2013, Series B Preferred stockholders exchanged 4 shares of Series B Preferred stock for 528 shares of our common stock. On March 21, 2013, Series B Preferred stockholders exchanged 8 shares of Series B Preferred stock for 929 shares of our common stock.
During the year ended December 31, 2012, Series B Preferred stockholders exchanged 19 shares of Series B Preferred stock for 2,509 shares of our
common stock.
The terms of the Series B Preferred stock are as follows:
Dividends and Distributions The holders of shares of Series B Preferred stock are entitled to participate with the holders of our common stock with respect to any dividends
declared on the common stock in proportion to the number of shares of common stock issuable upon conversion of the shares of Series B Preferred stock held by them.
Liquidation Preference
In the event of any liquidation, dissolution, or winding up of our operations, either voluntary or involuntary, subject to the rights of the Series B
Preferred stock and Senior Preferred stock, shall be entitled to receive, after any distribution to the holders of senior preferred stock and prior to and in preference to any distribution to the holders of common stock, $0.001 for each share of Series B Preferred stock then outstanding.
Voting
The holders of shares of Series B Preferred stock have one vote for each share of Series B Preferred stock held by them.
Conversion
Initially, each share of Series B Preferred stock was convertible into one share of our common stock. On March 31, 2009, our stockholders approved a resolution to increase the authorized share capital, and to increase the conversion ratio to 132.07 shares of our common stock for each share of Series B Preferred stock.
46

Conversion of Preferred Stock Issued to Common Stock
The following table summarizes the amounts as of December 31, 2014:
9. Stock-Based Compensation
We have adopted equity incentive plans for which stock options and restricted stock awards are available to grant to employees, consultants and
directors. All employee and director stock options granted under our stock option plans have an exercise price equal to the market value of the underlying common stock on the grant date. There are no vesting provisions tied to performance conditions for any options, as vesting for all outstanding option grants was based only on continued service as an employee, consultant or director. All of our outstanding stock options and restricted stock awards are classified as equity instruments.
Stock Options
As of December 31, 2014, we had two equity incentive plans:
We also had one non-employee director stock option plan as of December 31, 2014:
The following table summarizes information with respect to all options to purchase shares of common stock outstanding under the 1998 Plan, the
2006 Plan and the Director Plan at December 31, 2014:
Shares of Preferred Stock Not
Exchanged as of December
31, 2014 Conversion
Ratio
Shares of Common Stock
after Conversion of
all Outstanding
Shares of Preferred
Stock Not yet Exchanged at December 31,
2014 Series B Preferred Stock 83 132.07 10,962
• The 1998 Non-Officer Stock Option Plan (the “1998 Plan”), which expired in June 2008; and • The 2006 Equity Incentive Plan (the “2006 Plan”).
• The 2001 Non-Employee Director Stock Option Plan (the “Director Plan” ), which expired in March 2011.
Options Outstanding Options Exercisable
Range of Exercise Price
Number Outstanding at
12/31/14
Weighted Average
Remaining Contractual Life (years)
Weighted Average
Exercise Price
Number Exercisable at
12/31/14
Weighted Average
Exercise Price
$ 2.08 - $ 3.50 70,200 6.70 $ 2.61 - $ - $ 3.51 - $ 5.00 1,221,000 4.33 $ 4.24 1,211,834 $ 4.25 $ 5.01 - $ 6.50 245,000 5.57 $ 5.90 91,383 $ 5.62 $ 6.51 - $ 10.00 170,000 3.79 $ 7.83 138,334 $ 7.93 $ 10.01 - $ 86.25 3,200 0.01 $ 86.25 3,200 $ 86.25
1,709,400 4.54 $ 4.92 1,444,751 $ 4.87
47

A summary of the combined activity under all of the stock option plans is set forth below:
The assumptions used to value stock options granted to directors, employees and consultants during the years ended December 31, 2014 and 2013
are as follows:
The aggregate intrinsic value of the 1,709,400 stock options that are outstanding, vested and expected to vest as of December 31, 2014 is $54,060. During the years ended December 31, 2014, 2013 and 2012, we recorded $1.7 million, $2.5 million and $3.4 million, respectively, of compensation
expense related to the vesting of stock options. The estimated fair value of the stock-based compensation was calculated using the Black-Scholes option pricing model as of the grant date of the stock option.
Weighted Average
Number of Shares
Exercise Price Per Share
Weighted-Average
Exercise Price Outstanding at January 1, 2012 19,324 $ 35.39 – 368.75 $ 92.19 Granted 1,704,000 $ 4.02 – 6.28 $ 4.35 Cancelled or expired (8,124 ) $ 35.39 – 368.75 $ 69.36 Exercised -- -- $ -- Outstanding, vested and expected to vest at December 31, 2012 1,715,200 $ 4.02 – 125.00 $ 5.04 Granted 145,000 $ 5.54 - 7.70 $ 6.06 Cancelled or expired (18,256 ) $ 4.25- 125.00 $ 5.57 Exercised (241,361 ) $ 4.25 – 6.28 $ 4.39 Outstanding, vested and expected to vest at December 31, 2013 1,600,583 $ 4.02 – 122.50 $ 5.22 Granted 405,200 $ 2.08-8.21 $ 6.31 Cancelled or expired (296,383 ) $ 4.65- 122.50 $ 5.46 Exercised -- $ -- $ -- Outstanding, vested and expected to vest at December 31, 2014 1,709,400 $ 2.08 – 86.25 $ 4.92
For the year ended December 31, 2014 Annual dividend yield - Expected life (years) 3.5 Risk-free interest rate 0.28% - 1.47% Expected volatility 60.68% - 108.75%
For the year ended December 31, 2013 Annual dividend yield - Expected life (years) 4.3 Risk-free interest rate 0.65% - 2.15% Expected volatility 117% - 154%
For the year ended December 31, 2012 Annual dividend yield - Expected life (years) 3.8 - 4.3 Risk-free interest rate 0.43% - 0.62% Expected volatility 169% - 187%
48

The 1998 Plan terminated effective June 15, 2008. Although we can no longer issue stock options out of the plans, the outstanding options at the
date of termination will remain outstanding and vest in accordance with their terms. Options granted under the Director Plan vest over a one to four-year period, expire five to seven years after the date of grant and have exercise prices reflecting market value of the shares of our common stock on the date of grant. Stock options granted under the 1998 and 2006 Plans are exercisable over a maximum term of ten years from the date of grant, vest in various installments over a one to four-year period and have exercise prices reflecting the market value of the shares of common stock on the date of grant.
During the year ended December 31, 2014, we granted options to purchase 395,200 shares of our common stock to employees and an option to
purchase 10,000 shares of our common stock to a former member of our board of directors with total grant date estimated fair value of $1.3 million computed using the Black-Scholes option pricing model. The weighted-average grant date fair value of the options granted during year ended December 31, 2014 was $3.14 per share.
During the year ended December 31, 2013, we received an aggregate of $1.1 million from five employees in connection with the exercise of stock
options into 241,361 shares of common stock. The intrinsic value of the options exercised was $502,000 on the date of exercise.
We granted options to purchase 145,000 shares of our common stock to three employees during the year ended December 31, 2013 with an aggregate grant date fair value of approximately $748,000 computed using the Black-Scholes option pricing model. The options have a 7-year life and 1/3 of the options are vested on the one year anniversary date of grant with the remaining to vest monthly over the remaining 24-months.
During the year ended December 31, 2012, we granted 1,175,000 options to purchase shares of our common stock to employees and 360,000 options to purchase shares of our common stock to members of our Board. During the year ended December 31, 2012, we granted 169,000 options to purchase shares of our common stock to a consultant.
Warrants During the year ended December 31, 2014 and 2013, certain warrant holders exercised their warrants under the cash and cashless
exercise provisions, as defined in the agreements. See Note 8 for details of such exercises and number of common stock shares issued. On December 3, 2010, we issued 120,000 warrants at an exercise price of $1.63 per share to an employee. The estimated fair value of the warrants
was $198,000 on the date of grant, using the Black-Scholes option pricing model, which has been amortized to expense over 24 months. During the year ended December 31, 2012, we recorded $91,000 of stock based compensation expense related to vesting of such warrants.
We issued 20,000 three-year stock purchase warrants at an exercise price of $3.90 per share with a vesting period over 24 months to an employee
during the year ended December 31, 2011. The unvested warrant granted to an employee had an estimated fair value on the date of grant of $75,000. This amount was expensed over the vesting period and $26,000 and $38,000 of expense related to this warrant is included in research and development expense for the years ended December 31, 2013 and 2012, respectively. The estimated fair value of stock-based compensation related to the issuance of warrants is calculated using the Black-Scholes option pricing model as of the grant date of the underlying warrant.
The stock-based compensation expense for the years ended December 31, 2014, 2013 and 2012 reflects the estimated fair value of the vested portion of options and warrants granted to directors, employees and non-employees.
(In thousands) Years ended December 31, 2014 2013 2012 Research and development $ 510 $ 267 $ 315 Sales and marketing 353 909 1,407 General and administrative 866 1,480 1,777 Stock compensation expense $ 1,729 $ 2,656 $ 3,499
49

The remaining unamortized expense related to stock options and warrants will be recognized on a straight line basis monthly as compensation
expense over the remaining vesting period which approximates 1.7 years.
A summary of all warrant activity is set forth below:
The estimated fair value of stock-based awards is calculated using the Black-Scholes option pricing model, even though this model was developed to
estimate the fair value of freely tradable, fully transferable options without vesting restrictions, which differ significantly from our stock options. The Black-Scholes model also requires subjective assumptions, including future stock price volatility and expected time to exercise, which greatly affect the calculated values. The expected term and forfeiture rate of options granted is derived from historical data on employee exercises and post-vesting employment termination behavior, as well as expected behavior on outstanding options and warrants. The risk-free rate is based on the U.S. Treasury rates in effect during the corresponding period of grant. The expected volatility is based on the historical volatility of our stock price. These factors could change in the future, which would affect fair values of stock options granted in such future periods, and could cause volatility in the total amount of the stock-based compensation expense reported in future periods.
(In thousands)
Remaining unamortized expense at
December 31, 2014
Stock-based compensation $ 880
Outstanding and exercisable Warrants
Weighted Average
Exercise Price
Weighted Average
Remaining Contractual
Life January 1, 2012 5,405,606 $ 1.57 2.45 Issued - - - Expired/forfeited (232 ) 31.75 - Exercised (700,738 ) 1.18 - December 31, 2012 4,704,636 1.61 1.41 Issued - - - Expired/forfeited - - - Exercised (3,876,063 ) 1.45 - December 31, 2013 828,573 2.39 2.06 Issued 2,575,000 5.09 - Expired/forfeited (40,000 ) 3.98 - Exercised (28,500 ) 2.85 - Outstanding and exercisable, December 31, 2014 3,335,073 $ 4.45 0.93
50

10. Commitments and Contingencies
Indemnities and Guarantees
We have agreed to indemnify each of our executive officers and directors for certain events or occurrences arising as a result of the officer or director serving in such capacity. The term of the indemnification period is for the officer’s or director’s lifetime. The maximum potential amount of future payments we could be required to make under these indemnification agreements is unlimited. However, we have a directors’ and officers’ liability insurance policy that should enable us to recover a portion of future amounts paid. As a result of our insurance policy coverage, we believe the estimated fair value of these indemnification agreements is minimal and we have no liabilities recorded for these agreements as of December 31, 2014 and 2013.
We enter into indemnification provisions under our agreements with other companies in the ordinary course of business, typically with business
partners, contractors, customers and landlords. Under these provisions we generally indemnify and hold harmless the indemnified party for losses suffered or incurred by the indemnified party as a result of our activities or, in some cases, as a result of the indemnified party’s activities under the agreement. These indemnification provisions often include indemnifications relating to representations made by us with regard to intellectual property rights. These indemnification provisions generally survive termination of the underlying agreement. The maximum potential amount of future payments we could be required to make under these indemnification provisions is unlimited. We have not incurred material costs to defend lawsuits or settle claims related to these indemnification agreements. As a result, we believe the estimated fair value of these agreements is minimal. Accordingly, we have no liabilities recorded for these indemnification provisions as of December 31, 2014 and 2013.
Non-Recurring Engineering Development Costs
On February 4, 2011, we ente red into an Analog Device Development Agreement with an effective date of January 24, 2010 (the “NN1001
Agreement”) with Texas Instruments (“TI”) pursuant to which TI integrated Neonode’s intellectual property into an Application Specific Integrated Circuit (“ASIC”) developed by TI. The NN1001 ASIC only can be sold by TI exclusively to licensees of Neonode. Under the terms of the NN1001 Agreement, we will reimburse TI up to $500,000 of non-recurring engineering (“NRE”) development costs based on shipments of the NN1001. Under the terms of the NN1001 Agreement, we will reimburse TI an NRE fee of $0.08 per unit for each of the first one million units sold and $0.05 for the next eight million units sold. During the years ended December 31, 2014 and 2013, approximately $93,000 and $387,000, respectively of NRE expense related to the NN1001 Agreement is included in research and development in the condensed consolidated statements of operations. Through December 31, 2014, we made total payments of approximately $419,000 under the NN1001 Agreement and there is approximately $61,000 included in our accrued expenses as of December 31, 2014. No amounts were recorded in the year ended December 31, 2012 because no shipments occurred during that period.
On April 25, 2013, we entered into an additional Analog Device Development Agreement with an effective date of December 6, 2012 (the “NN1002
Agreement”) with TI pursuant to which TI will integrate our intellectual property into an ASIC developed by TI. The NN1002 ASIC only can be sold by TI exclusively to licensees of Neonode. Under the terms of the NN1002 Agreement, we will reimburse TI up to $500,000 of NRE costs based on shipments of the NN1002. Under the terms of the NN1002 Agreement we will reimburse TI an NRE fee of $0.25 per unit for each of the first two million units sold. The NN1002 is currently in development and has not been released to mass production. Through December 31, 2014, we had made no payments under the NN1002 Agreement.
Outstanding Warrants to Purchase Common Stock as of December 31, 2014:
Description Issue Date Exercise Price Shares Expiration
Date August 2009 Employee Warrants 8/25/2009 $ 0.50 80,000 8/25/2016 2007 Debt Extension Warrants 9/22/2010 $ 1.00 16,000 9/22/2015 December 2010 Employee Warrants 12/3/2010 $ 1.63 200,000 12/3/2015 February 2011 Legal Advisor Warrant 2/22/2011 $ 2.50 80,000 2/22/2016 March 2011 Investor Warrants 3/9/2011 $ 3.13 349,973 3/9/2016 March 2011 Investor Warrants 4/7/2011 $ 3.13 34,100 4/7/2016 May 2014 Agent Warrant 5/15/2014 $ 5.09 75,000 11/15/2015 May 2014 Investor Warrant 5/15/2014 $ 5.09 2,500,000 11/15/2015 Total Warrants Outstanding 3,335,073
51

Operating Leases
We lease 3,185 square feet of office space located at 2350 Mission College Blvd, Suite 190, Santa Clara, CA 95054 USA. The annual payment for
this space equates to approximately $86,000 per year. This lease is valid through July 31, 2015. We are currently searching for alternative office space nearby our current location.
Our subsidiary Neonode Technologies AB leases 6,520 square feet of office space located at Storgatan 23C, Stockholm, Sweden. The annual
payment for this space equates to approximately $443,000 per year including property tax (excluding VAT). This lease is valid through November 30, 2017. The lease can be extended on a yearly basis.
Our subsidiary Neonode Japan Inc. leases 430 square feet of office space located at 608 Bureau Shinagawa, 4-1-6 Konan, Minato-ku, 108-0075
Tokyo, Japan. This lease is valid through October 31, 2016. The annual expense for this space is approximately $28,000 per year. Our subsidiary Neonode Korea Ltd. entered into a lease agreement located at B-1807, Daesung D-Polis. 543-1, Seoul , South Korea in January,
2015. This lease is valid through February 13, 2017. The annual expense for this space is approximately $24,000 per year.
We believe our existing facilities are in good condition and suitable for the conduct of our business. For the years ended December 31, 2014, 2013 and 2012, we recorded approximately $633,000, $556,000 and $400,000, respectively, for rent
expense. A summary of future minimum payments under non-cancellable operating lease commitments as of December 31, 2014 is as follows (in thousands):
Equipment Subject to Capital Lease
In April 2014, we entered into a lease for certain specialized milling equipment. Under the terms of the lease agreement we are obligated to purchase
the equipment at the end of the original 6 year lease term for 10% of the original purchase price of the equipment. In accordance with relevant accounting guidance the lease is classified as a capital lease. The lease payments and depreciation period began on July 1, 2014 when the equipment went into service. The equipment will be amortized to research and development expense on a straight line basis over 6 years at the rate of approximately $20,000 per quarter. The interest rate of the lease is 4% per annum.
The following is a schedule of minimum future rentals on the non-cancelable capital lease as of December 31, 2014 (in thousands):
Years ending December 31, Total 2015 $ 538 2016 489 2017 410 $ 1,437
Year ending December 31, Total 2015 $ 79 2016 79
2017 79 2018 79
2019 79 Thereafter 86 Total minimum payments required: 481 Less amount representing interest: (53 ) Present value of net minimum lease payments: 428 Less current portion (61 ) $ 367
The following is a schedule of equipment under capital lease as of December 31, 2014 (in thousands): Equipment under capital lease $ 458 Less: accumulated depreciation (34 ) Net book value $ 424
52

11. Segment Information
Our Company has one reportable segment, which is comprised of the touch technology licensing business. All of our sales for the years ended
December 31, 2014, 2013 and 2012 were to customers located in the U.S., Europe and Asia. Of our total assets, 85% and 90% were held in the U.S. as of December 31, 2014 and 2013, respectively, and 14% and 10% were held in Sweden, respectively.
The following table presents net revenues by geographic region for the years ended December 31, 2014, 2013 and 2012 (dollars in thousands):
12. Income Taxes
Loss before provision for income taxes was distributed geographically for the years ended December 31, as follows (in thousands):
2014 Amount Percentage Net revenues from customers in the U.S. $ 2,833 60 % Net revenue from customers in Europe 228 5 % Net revenues from customers in Asia 1,679 35 % Total $ 4,740 100 %
2013 Amount Percentage Net revenues from customers in the U.S. $ 1,896 51 % Net revenues from customers in Europe 308 9 % Net revenues from customers in Asia 1,513 40 % Total $ 3,717 100 %
2012 Amount Percentage Net revenues from customers in the U.S. $ 5,178 73 % Net revenues from customers in Europe 153 2 % Net revenues from customers in Asia 1,806 25 % Total $ 7,137 100 %
2014 2013 2012 Domestic $ (13,993 ) $ (12,877 ) $ (10,283 ) Foreign (228 ) (94 ) 1,121 Total $ (14,221 ) $ (12,971 ) $ (9,162 )
53

The provision for income taxes is as follows for the years ended December 31 (in thousands):
The differences between our effective income tax rate and the U.S. federal statutory federal income tax rate for the years ended December 31, are:
Significant components of the deferred tax asset balances at December 31 are as follows (in thousands):
Valuation allowances are recorded to offset certain deferred tax assets due to management’s uncertainty of realizing the benefits of these items.
Management applies a full valuation allowance for the accumulated losses of Neonode Inc., and its subsidiaries, since it is not determinable using the “more likely than not” criteria that there will be any future benefit of our deferred tax assets. This is mainly due to our history of operating losses. As of December 31, 2014, we had federal, state and foreign net operating losses of $41.7 million, $16.1 million and $0, respectively. The federal loss carryforward begins to expire in 2028, the California loss carryforward begins to expire in 2020 and the foreign loss carryforward is indefinite.
Utilization of the net operating loss and tax credit carryforwards is subject to an annual limitation due to the ownership percentage change
limitations provided by Section 382 of the Internal Revenue Code and similar state provisions. The annual limitation may result in the expiration of the net operating losses and tax credit carryforwards before utilization. As of December 31, 2014, we had not completed the determination of the amount to be limited under the provision.
As of December 31, 2014, we did not recognize $533,000 and $27,000 of federal and state deferred tax assets relating to excess tax benefits for
stock-based compensation deductions. Unrecognized deferred tax benefits will be accounted for as a credit to additional paid-in capital when realized through a reduction in income taxes payable.
2014 2013 2012 Current
Federal $ - $ - $ -- State 3 2 2 Foreign 10 107 123
Change in deferred Federal (4,214 ) (3,794 ) (3,653 ) Federal valuation allowance 4,214 3,794 3,653 State (460 ) 129 453 State valuation allowance 460 (129 ) (453 ) Foreign 64 111 276 Foreign valuation allowance (64 ) (111 ) (276 ) Total current $ 13 $ 109 $ 125
2014 2013 2012 Amounts at statutory tax rates 34 % 34 % 34 % Foreign losses taxed at different rates (1 )% -- 1 % Stock-based compensation (2 )% (3 )% (7 )% Other (1 )% (1 )% -- Total 30 % 30 % 28 % Valuation allowance (31 )% (31 )% (29 )% Effective tax rate (1) % (1 )% (1 )%
2014 2013 Deferred tax assets: Accruals $ 1,053 $ 1,519 Stock compensation 1,210 1,070 Net operating losses 14,681 9,760 Total deferred tax assets $ 16,944 $ 12,349 Basis difference in fixed assets 2 (14 ) Valuation allowance (16,946 ) (12,335 ) Total net deferred tax assets $ -- $ --
54
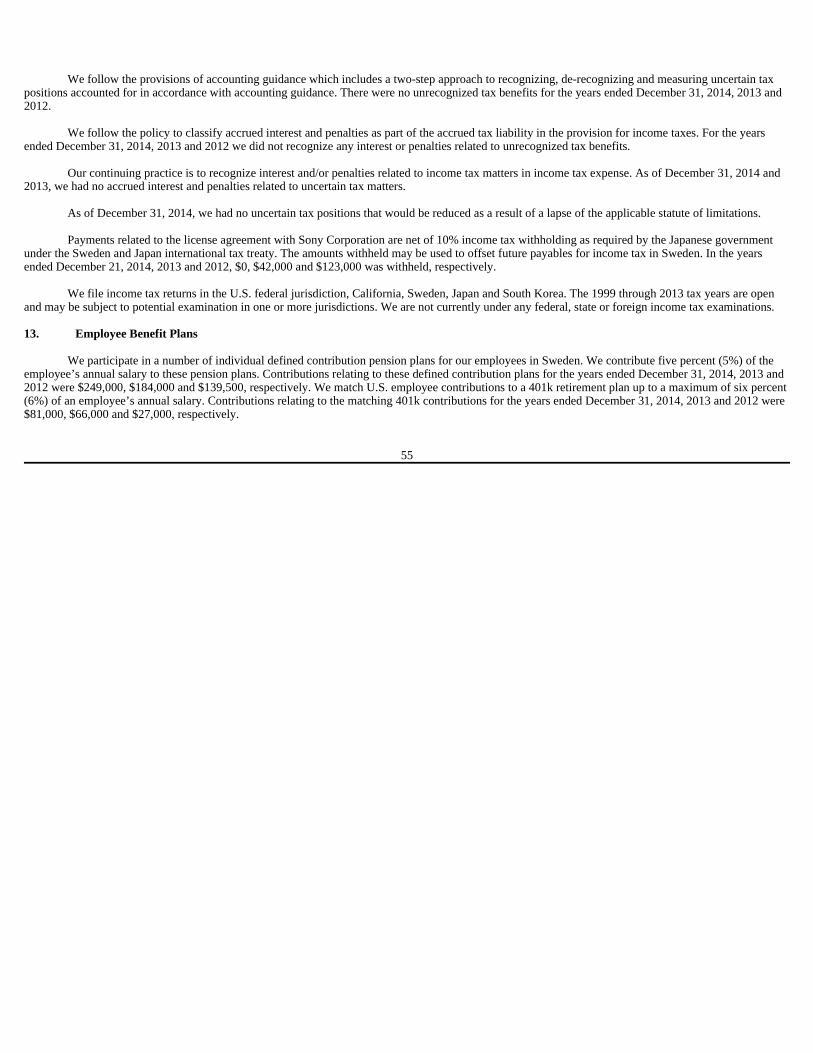
We follow the provisions of accounting guidance which includes a two-step approach to recognizing, de-recognizing and measuring uncertain tax
positions accounted for in accordance with accounting guidance. There were no unrecognized tax benefits for the years ended December 31, 2014, 2013 and 2012.
We follow the policy to classify accrued interest and penalties as part of the accrued tax liability in the provision for income taxes. For the years
ended December 31, 2014, 2013 and 2012 we did not recognize any interest or penalties related to unrecognized tax benefits. Our continuing practice is to recognize interest and/or penalties related to income tax matters in income tax expense. As of December 31, 2014 and
2013, we had no accrued interest and penalties related to uncertain tax matters. As of December 31, 2014, we had no uncertain tax positions that would be reduced as a result of a lapse of the applicable statute of limitations. Payments related to the license agreement with Sony Corporation are net of 10% income tax withholding as required by the Japanese government
under the Sweden and Japan international tax treaty. The amounts withheld may be used to offset future payables for income tax in Sweden. In the years ended December 21, 2014, 2013 and 2012, $0, $42,000 and $123,000 was withheld, respectively.
We file income tax returns in the U.S. federal jurisdiction, California, Sweden, Japan and South Korea. The 1999 through 2013 tax years are open
and may be subject to potential examination in one or more jurisdictions. We are not currently under any federal, state or foreign income tax examinations. 13. Employee Benefit Plans
We participate in a number of individual defined contribution pension plans for our employees in Sweden. We contribute five percent (5%) of the
employee’s annual salary to these pension plans. Contributions relating to these defined contribution plans for the years ended December 31, 2014, 2013 and 2012 were $249,000, $184,000 and $139,500, respectively. We match U.S. employee contributions to a 401k retirement plan up to a maximum of six percent (6%) of an employee’s annual salary. Contributions relating to the matching 401k contributions for the years ended December 31, 2014, 2013 and 2012 were $81,000, $66,000 and $27,000, respectively.
55

14. Net Loss per Share
Basic net loss per common share for the years ended December 31, 2014, 2013 and 2012 was computed by dividing the net loss by the weighted
average number of shares of common stock outstanding during the year. Diluted loss per common share is computed by dividing net loss by the weighted average number of shares of common stock and common stock equivalents outstanding during the year.
Potential common stock equivalents of approximately 0.3 million, 0.8 million and 4.7 million outstanding stock warrants, 11,000, 11,000 and 52,000
shares issuable upon conversion of preferred stock, 24,000, 1.6 million and 1.7 million stock options are excluded from the diluted earnings per share calculation for the years ended December 31, 2014, 2013 and 2012, respectively, due to their anti-dilutive effect.
15. Quarterly Financial Information
Quarterly and year-to-date computations of per share amounts are made independently. Therefore, the sum of per share amounts for the quarters may
not agree with the per share amounts for the year. 16. Subsequent Events
On January 9, 2015, we incorporated the subsidiary Neonode Taiwan Ltd.
(In thousands, except per share amounts) Years ended December 31,
2014 2013 2012 BASIC AND DILUTED Weighted average number of common shares outstanding 39,532 35,266 33,003 Net loss $ (14,234 ) $ (13,080 ) $ (9,287 )
Net loss per shares basic and diluted $ (0.36 ) $ (0.37 ) $ (0.28 )
For the Quarter Ended March 31, June 30, September 30, December 31, (unaudited, in thousands except per share amounts)
2014 Net revenues $ 1,014 $ 865 $ 1,126 $ 1,735 Cost of revenues 166 452 422 469 Gross margin 848 413 704 1,266 Net loss (4,008 ) (3,874 ) (3,245 ) (3,107 ) Net loss per basic and diluted common share $ (0.11 ) $ (0.10 ) $ (0.08 ) $ (0.08 )
2013 Net revenues $ 548 $ 1,084 $ 1,076 $ 1,009 Cost of revenues 16 662 765 199 Gross margin 532 422 311 810 Net loss (3,570 ) (3,120 ) (3,343 ) (3,047 ) Net loss per basic and diluted common share $ (0.11 ) $ (0.09 ) $ (0.09 ) $ (0.08 )
2012 Net revenues $ 1,164 $ 1,974 $ 1,679 $ 2,320 Cost of revenues 249 494 337 385 Gross margin 915 1,480 1,342 1,935 Net loss (1,588 ) (3,427 ) (2,144 ) (2,128 ) Net loss per basic and diluted common share $ (0.05 ) $ (0.10 ) $ (0.06 ) $ (0.07 )
56

None.
Evaluation of Disclosure Controls and Procedures
Under the supervision of and with the participation of our management, including our Chief Executive Officer and Chief Financial Officer, we
evaluated the effectiveness of our disclosure controls and procedures (as such term is defined in Rules 13a-15(e) and 15d-15(e) under the Exchange Act) as of December 31, 2014. Based upon that evaluation, our Chief Executive Officer and Chief Financial Officer concluded that our disclosure controls and procedures were not effective because of the material weaknesses in our internal control over financial reporting described below.
Notwithstanding the ineffectiveness of our Company’s disclosure controls and procedures as of December 31, 2014, our management believes that
the consolidated financial statements and other financial information contained in this Annual Report present fairly, in all material respects, our financial condition results of operations and cash flows as of, and for, the dates and periods presented. Management’s Annual Report on Internal Control over Financial Reporting
Our management is responsible for establishing and maintaining adequate internal control over financial reporting as defined in Rules 13a-15(f) and 15d-15(f) under the Exchange Act. Our internal control over financial reporting has been designed to provide reasonable assurance with respect to the reliability of financial reporting and the presentation of financial statements for external purposes in accordance with generally accepted accounting principles. A control system, no matter how well designed and operated, can provide only reasonable, not absolute, assurance that the control system’s objectives will be met. Further, the design of a control system must reflect the fact that there are resource constraints. Because of the inherent limitations in all control systems, no evaluation of controls can provide absolute assurance that all control issues and instances of fraud, if any, within our Company have been detected.
Under the supervision and with the participation of our Chief Executive Officer and Chief Financial Officer, our management assessed the
effectiveness of our internal control over financial reporting as of December 31, 2014. In making their assessment, our management used criteria established in the framework on Internal Control – Integrated Framework (2013) issued by the Committee of Sponsoring Organizations of the Treadway Commission (COSO). Based upon that assessment, our management concluded that our internal control over financial reporting was not effective at the reasonable assurance level as of December 31, 2014 because of the material weaknesses in our internal control over financial reporting described below.
A material weakness is a deficiency, or combination of deficiencies, in internal control over financial reporting, such that there is a reasonable
possibility that a material misstatement of the company’s annual or interim financial statements will not be prevented or detected on a timely basis. During the audit of our consolidated financial statements for the year ended December 31, 2014, management determined that we had material
weaknesses in our quarterly and annual financial close processes relating to intercompany adjustments and accounting for complex transactions. There were no changes in our internal control over financial reporting during the quarter ended December 31, 2014 that have materially affected, or
are reasonably likely to materially affect, our internal control over financial reporting. Management has worked, and continues to work, to strengthen our internal control over financial reporting. We are committed to designing,
implementing and operating effective controls. To remediate our Company’s material weaknesses in internal control over financial reporting, our planned steps include:
Management will periodically assess the progress and sufficiency of the ongoing initiatives and make adjustments as and when necessary.
KMJ Corbin & Company LLP, our independent registered public accounting firm, has audited our consolidated financial statements and the
effectiveness of our internal control over financial reporting as of December 31, 2014. Their report on the consolidated financial statements appears in this Annual Report in Item 8 on Form 10-K and their report on the effectiveness of our internal control over financial reporting appears below.
ITEM 9. CHANGES IN AND DISAGREEMENTS WITH ACCOUNTANTS ON AC COUNTING AND FINANCIAL DISCLOSURE
ITEM 9A. CONTROLS AND PROCEDURES
• engaging additional external resources with public company accounting and reporting experience to enhance our policies and procedures, including those related to complex accounting issues; and
• preparing additional written policies and procedures for accounting and financial reporting to establish a formal process to close our books and account for all transactions.
57

REPORT OF INDEPENDENT REGISTERED PUBLIC ACCOUNTING FIRM
ON INTERNAL CONTROL OVER FINANCIAL REPORTING Board of Directors and Stockholders Neonode Inc.
We have audited the internal control over financial reporting of Neonode Inc. and subsidiaries (the “Company”) as of December 31, 2014, based on criteria established in Internal Control - Integrated Framework (2013) issued by the Committee of Sponsoring Organizations of the Treadway Commission (COSO). The Company’s management is responsible for maintaining effective internal control over financial reporting, and for its assessment of the effectiveness of internal control over financial reporting, included in the accompanying Management’s Annual Report on Internal Control over Financial Reporting. Our responsibility is to express an opinion on the Company’s internal control over financial reporting based on our audit.
We conducted our audit in accordance with the standards of the Public Company Accounting Oversight Board (United States). Those standards require that we plan and perform the audit to obtain reasonable assurance about whether effective internal control over financial reporting was maintained in all material respects. Our audit of internal control over financial reporting included obtaining an understanding of internal control over financial reporting, assessing the risk that a material weakness exists, testing and evaluating the design and operating effectiveness of internal control based on that risk, and performing such other procedures as we considered necessary in the circumstances. We believe that our audit provides a reasonable basis for our opinion.
A company’s internal control over financial reporting is a process designed to provide reasonable assurance regarding the reliability of financial reporting and the preparation of financial statements for external purposes in accordance with accounting principles generally accepted in the United States of America. A company’s internal control over financial reporting includes those policies and procedures that (1) pertain to the maintenance of records that, in reasonable detail, accurately and fairly reflect the transactions and dispositions of the assets of the company; (2) provide reasonable assurance that transactions are recorded as necessary to permit preparation of financial statements in accordance with accounting principles generally accepted in the United States of America, and that receipts and expenditures of the company are being made only in accordance with authorizations of management and directors of the company; and (3) provide reasonable assurance regarding prevention or timely detection of unauthorized acquisition, use, or disposition of the company’s assets that could have a material effect on the financial statements.
Because of the inherent limitations, internal control over financial reporting may not prevent or detect misstatements. Also, projections of any evaluation of effectiveness to future periods are subject to the risk that controls may become inadequate because of changes in conditions, or that the degree of compliance with the policies or procedures may deteriorate.
A material weakness is a deficiency, or a combination of deficiencies, in internal control over financial reporting, such that there is a reasonable
possibility that a material misstatement of a company’s annual or interim financial statements will not be prevented or detected on a timely basis. Two material weaknesses were identified and included in management’s assessment related to controls over the quarterly and annual financial close process surrounding intercompany adjustments and controls over accounting for complex transactions. These material weaknesses were considered in determining the nature, timing and extent of audit tests applied to our audit in the 2014 consolidated financial statements.
In our opinion, because of the effects of the above mentioned material weaknesses on the achievement of the objectives of the control criteria,
Neonode Inc. and subsidiaries did not maintain, in all material respects, effective internal control over financial reporting as of December 31, 2014, based on criteria established in Internal Control - Integrated Framework (2013) issued by the Committee of Sponsoring Organizations of the Treadway Commission (COSO). Our opinion on the effectiveness of internal control over financial reporting does not affect our opinion on the consolidated financial statements.
We have also audited, in accordance with the standards of the Public Company Accounting Oversight Board (United States), the consolidated
balance sheets of Neonode Inc. and subsidiaries as of December 31, 2014 and 2013, and the related consolidated statements of operations, comprehensive loss, stockholders’ equity and cash flows for each of the years in the three-year period ended December 31, 2014 and our report dated March 12, 2015 expressed an unqualified opinion on those consolidated financial statements.
Costa Mesa, California March 12, 2015
/s/ KMJ Corbin & Company LLP
58

None
PART III
ITEM 10. DIRECTORS, EXECUTIVE OFFICERS AND CORPORATE GOVERNANCE
The information required by this Item will be included in our definitive proxy statement for the 2015 Annual Meeting of Stockholders and is incorporated herein by reference. ITEM 11 . EXECUTIVE CO MPENSATION
The information required by this Item will be included in our definitive proxy statement for the 2015 Annual Meeting of Stockholders and is incorporated herein by reference. ITEM 12. SECURITY OWNERSHIP OF CERTAIN BENEF ICIAL OWNERS AND MANAGEMENT AND RELATED STOCKHOLDER MATTERS
The information required by this Item will be included in our definitive proxy statement for the 2015 Annual Meeting of Stockholders and is incorporated herein by reference. ITEM 13. CERTAIN RELATIONSHIPS AND RELATED T RANSACTIONS, AND DIRECTOR INDEPENDENCE
The information required by this Item will be included in our definitive proxy statement for the 2015 Annual Meeting of Stockholders and is incorporated herein by reference.
The information required by this Item will be included in our definitive proxy statement for the 2015 Annual Meeting of Stockholders and is
incorporated herein by reference.
PART IV
Financial Statements
The consolidated financial statements of the registrant are listed in the index to the consolidated financial statements and filed under Item 8 of this
Annual Report. Financial Statement Schedules
All financial statement schedules are omitted because the relevant information is not applicable or not present in amounts sufficient to require submission of the schedule or the required information is shown in the consolidated financial statements and the notes thereto included in this Annual Report.
ITEM 9B. OTHER INFORMATION
ITEM 14 PRINCIPAL ACCOUNTING FEES AND SERVICES
ITEM 15. EXHIBITS, FINANCIAL STATEMENT SCHEDULES
59

Exhibits
+ Management contract or compensatory plan or arrangement
Number Description 3.1 Amended and Restated Certificate of Incorporation of Neonode Inc., dated April 17, 2009 ( incorporated by reference to Exhibit 10.22 of
the registrant’s quarterly report on Form 10-Q filed on August 4, 2009 (file no. 0-08419) ) 3.1.1 Certificate of Amendment, dated December 13, 2010 ( incorporated by reference to Exhibit 3.1.1 of the registrant’s annual report on
Form 10-K filed on March 31, 2011 (file no. 0-08419) ) 3.1.2 Certificate of Amendment, dated March 18, 2011 ( incorporated by reference to Exhibit 3.1 of the registrant’s current report on Form 8-K
filed on March 28, 2011 (file no. 0-08419) ) 3.1.3 Certificate of Correction, dated February 28, 2012 ( incorporated by reference to Exhibit 3.1.3 of the registrant’s annual report on Form
10-K filed on March 30, 2012 (file no. 0-08419) ) 3.2 Bylaws, as amended through December 5, 2007 ( incorporated by reference to Exhibit 3.2 of the registrant’s annual report on Form 10-K
filed on April 15, 2008 (file no. 0-08419) ) 4.1 Certificate of Designations, Preferences and Rights of the Series A and Series B Preferred Stock dated December 29, 2008 ( incorporated
by reference to Exhibit 4.1 of the registrant’s current report on Form 8-K filed on December 31, 2008 (file no. 0-08419) ) 4.2 Certificate of Increase of Designation of Series B Preferred Stock dated January 2, 2009 ( incorporated by reference to Exhibit 4.2 of the
registrant’s quarterly report on Form 10-Q filed on October 31, 2011 (file no. 0-08419) ) 4.3 Certificate of Increase of Designation of Series B Preferred Stock dated January 28, 2009 ( incorporated by reference to Exhibit 4.3 of the
registrant’s quarterly report on Form 10-Q filed on October 31, 2011 (file no. 0-08419) ) 10.1 Securities Purchase Agreement, dated May 9, 2014 ( incorporated by reference to Exhibit 10.1 of the registrant’s current report on Form
8-K filed on May 12, 2014 (file no. 1-35526) ) 10.2 Registration Rights Agreement ( incorporated by reference to Exhibit 10.2 of the registrant’s current report on Form 8-K filed on May 12,
2014 (file no. 1-35526) ) 10.3 Investor Warrant ( incorporated by reference to Exhibit 10.3 of the registrant’s current report on Form 8-K, as amended, filed on May 19,
2014 (file no. 1-35526) ) 10.4 Agent Warrant ( incorporated by reference to Exhibit 10.4 of the registrant’s current report on Form 8-K, as amended, filed on May 19,
2014 (file no. 1-35526) ) 10.5 Form of Common Stock Purchase Warrant ( incorporated by reference to Exhibit 10.20 of the registrant’s annual report on Form 10-K
filed on March 31, 2011 (file no. 0-08419) ) 10.6 Form of Common Stock Purchase Warrant ( incorporated by reference to Exhibit 10.4 of the registrant’s annual report on Form 10-K
filed on March 14, 2013 (file no. 1-35526) ) 10.7 Employment Agreement of Thomas Eriksson, dated March 5, 2014 ( incorporated by reference to Exhibit 10.1 of the registrant’s current
report on Form 8-K filed on March 11, 2014 (file no. 1-35526) ) + 10.8 Employment Agreement of Lars Lindqvist, dated August 5, 2014 ( incorporated by reference to Exhibit 10.1 of the registrant’s current
report on Form 8-K filed on August 6, 2014 (file no. 1-35526) ) + 10.9 Consulting Agreement of Per Bystedt, dated January 28, 2011 ( incorporated by reference to Exhibit 10.17 of the registrant’s annual
report on Form 10-K filed on March 31, 2011 (file no. 0-08419) ) + 10.10 Employment Agreement of David W. Brunton, dated July 1, 2010 ( incorporated by reference to Exhibit 10.5 of the registrant’s annual
report on Form 10-K filed on March 14, 2013 (file no. 1-35526) ) + 10.11 Separation Agreement of David Brunton, dated August 5, 2014 ( incorporated by reference to Exhibit 10.2 of the registrant’s current
report on Form 8-K filed on August 6, 2014 (file no. 1-35526) ) + 10.12 Consulting Agreement of David Brunton, dated August 5, 2014 ( incorporated by reference to Exhibit 10.3 of the registrant’s current
report on Form 8-K, as amended, filed on August 6, 2014 (file no. 1-35526) ) 10.13 Neonode Inc. 2006 Equity Incentive Plan, as amended ( incorporated by reference to Exhibit 99.1 of the registrant’s registration statement
on Form S-8 filed on November 22, 2013 (file no. 333-192505) ) 10.14 Form of Option used in connection with the 2006 Equity Incentive Plan ( incorporated by reference to Exhibit 10.8 of the registrant’s
annual report on Form 10-K filed on March 14, 2013 (file no. 1-35526) ) 21 Subsidiaries of the registrant 23.1 Consent of Independent Registered Public Accounting Firm 31.1 Certification of Principal Executive Officer pursuant to Section 302 of the Sarbanes-Oxley Act Of 2002 31.2 Certification of Principal Financial Officer pursuant to Section 302 of the Sarbanes-Oxley Act Of 2002 32 Certifications pursuant to 18 U.S.C. Section 1350, as adopted pursuant to Section 906 of the Sarbanes-Oxley Act of 2002 101.INS XBRL Instance Document 101.SCH XBRL Taxonomy Extension Schema Document 101.CAL XBRL Taxonomy Extension Calculation Linkbase Document 101.DEF XBRL Taxonomy Extension Definition Linkbase Document 101.LAB XBRL Taxonomy Extension Label Linkbase Document 101.PRE XBRL Taxonomy Extension Presentation Linkbase Document
60

SIGNATURES
Pursuant to the requirements of Section 13 or 15(d) of the Securities Exchange Act of 1934, the registrant has duly caused this report to be signed on
its behalf by the undersigned, thereunto duly authorized.
Pursuant to the requirements for the Securities Exchange Act of 1934, this report has been signed by the following persons on behalf of the registrant
and in the capacity and dates indicated.
61
NEONODE INC. (Registrant)
Date: March 12, 2015 By: /s/ Lars Lindqvist Lars Lindqvist
Chief Financial Officer, Vice President, Finance, Treasurer and Secretary
Name Title Date /s/ Thomas Eriksson Chief Executive Officer, and Director March 12, 2015 Thomas Eriksson (Principal Executive Officer) /s/ Lars Lindqvist Chief Financial Officer, Vice President, Finance March 12, 2015 Lars Lindqvist Treasurer and Secretary (Principal Financial and Accounting Officer) /s/ Per Bystedt Chairman of the Board of Directors March 12, 2015 Per Bystedt /s/ John Reardon Director March 12, 2015 John Reardon /s/ Mats Dahlin Director March 12, 2015 Mats Dahlin /s/ Per Löfgren
Director
March 12, 2015
Per Löfgren

Exhibit 21
SUBSIDIARIES OF THE REGISTRAN T
Name Jurisdiction Neonode Technologies AB Sweden Neno User Interface Solutions AB Sweden Neonode Japan Inc. Japan Neonode Americas Inc. U.S. NEON Technology Inc. Neonode Korea Ltd. U.S.
South Korea Neonode Taiwan Ltd. Taiwan

Exhibit 23.1
CONSENT OF INDEPENDENT REGISTERED PUBLIC ACCOUNTING FIRM
We consent to the incorporation by reference in Registration Statement Nos 333-192505, 333-179313, 333-150346, 333-132713, 333-114161, 333-87828, 333-63228, 333-43532, 333-32896, 333-65767, 333-63377, 33-45998 and 33-59167 on Form S-8 and Registration Statement Nos 333-196441, 333-196426, 333-177726, 333-153634, 333-152163 and 333-147425 on Form S-3 of our reports dated March 12, 2015, relating to the consolidated financial statements of Neonode Inc. and subsidiaries and the effectiveness of the Company’s internal control over financial reporting appearing in this Annual Report on Form 10-K of Neonode Inc. for the year ended December 31, 2014.
Costa Mesa, California
March 12, 2015
/s/ KMJ Corbin & Company LLP

Exhibit 31.1
CERTIFICATION OF PRINCIPAL EXECUTIVE OFFICER PURSUANT TO SECTION 302 OF THE SARBANES-OXLEY ACT OF 2002
I, Thomas Eriksson, certify that:
1. I have reviewed this annual report on Form 10-K of Neonode Inc.; 2. Based on my knowledge, this report does not contain any untrue statement of a material fact or omit to state a material fact necessary to make the
statements made, in light of the circumstances under which such statements were made, not misleading with respect to the period covered by this report; 3. Based on my knowledge, the financial statements, and other financial information included in this report, fairly present in all material respects the
financial condition, results of operations and cash flows of the registrant as of, and for, the periods presented in this report; 4. The registrant’s other certifying officer and I are responsible for establishing and maintaining disclosure controls and procedures (as defined in
Exchange Act Rules 13a-15(e) and 15d-15(e)) and internal control over financial reporting (as defined in Exchange Act Rules 13a-15(f) and 15d-15(f)) for the registrant and have:
a) Designed such disclosure controls and procedures, or caused such disclosure controls and procedures to be designed under our supervision, to ensure that material information relating to the registrant, including its consolidated subsidiaries, is made known to us by others within those entities, particularly during the period in which this report is being prepared;
b) Designed such internal control over financial reporting, or caused such internal control over financial reporting to be designed under our supervision, to provide reasonable assurance regarding the reliability of financial reporting and the preparation of financial statements for external purposes in accordance with generally accepted accounting principles; c) Evaluated the effectiveness of the registrant’s disclosure controls and procedures and presented in this report our conclusions about the effectiveness of the disclosure controls and procedures, as of the end of the period covered by this report based on such evaluation; d) Disclosed in this report any change in the registrant’s internal control over financial reporting that occurred during the registrant’s most recent fiscal quarter (the registrant’s fourth fiscal quarter in the case of an annual report) that has materially affected, or is reasonably likely to materially affect, the registrant’s internal control over financial reporting; and
5. The registrant’s other certifying officer and I have disclosed, based on our most recent evaluation of internal control over financial reporting, to the
registrant’s auditors and the audit committee of the registrant’s board of directors (or persons performing the equivalent functions):
a) All significant deficiencies and material weaknesses in the design or operation of internal control over financial reporting which are reasonably likely to adversely affect the registrant’s ability to record, process, summarize and report financial information; and b) Any fraud, whether or not material, that involves management or other employees who have a significant role in the registrant’s internal control over financial reporting.
Date: March 12, 2015
/s/ Thomas Eriksson Thomas Eriksson Chief Executive Officer

Exhibit 31.2
CERTIFICATION OF PRINCIPAL FINANCIAL OFFICER PURSUANT TO SECTION 302 OF THE SARBANES-OXLEY ACT OF 2002
I, Lars Lindqvist certify that:
1. I have reviewed this annual report on Form 10-K of Neonode Inc.; 2. Based on my knowledge, this report does not contain any untrue statement of a material fact or omit to state a material fact necessary to make the
statements made, in light of the circumstances under which such statements were made, not misleading with respect to the period covered by this report; 3. Based on my knowledge, the financial statements, and other financial information included in this report, fairly present in all material respects the
financial condition, results of operations and cash flows of the registrant as of, and for, the periods presented in this report; 4. The registrant’s other certifying officer and I are responsible for establishing and maintaining disclosure controls and procedures (as defined in
Exchange Act Rules 13a-15(e) and 15d-15(e)) and internal control over financial reporting (as defined in Exchange Act Rules 13a-15(f) and 15d-15(f)) for the registrant and have:
a) Designed such disclosure controls and procedures, or caused such disclosure controls and procedures to be designed under our supervision, to ensure that material information relating to the registrant, including its consolidated subsidiaries, is made known to us by others within those entities, particularly during the period in which this report is being prepared; b) Designed such internal control over financial reporting, or caused such internal control over financial reporting to be designed under our supervision, to provide reasonable assurance regarding the reliability of financial reporting and the preparation of financial statements for external purposes in accordance with generally accepted accounting principles; c) Evaluated the effectiveness of the registrant’s disclosure controls and procedures and presented in this report our conclusions about the effectiveness of the disclosure controls and procedures, as of the end of the period covered by this report based on such evaluation; d) Disclosed in this report any change in the registrant’s internal control over financial reporting that occurred during the registrant’s most recent fiscal quarter (the registrant’s fourth fiscal quarter in the case of an annual report) that has materially affected, or is reasonably likely to materially affect, the registrant’s internal control over financial reporting; and
5. The registrant’s other certifying officer and I have disclosed, based on our most recent evaluation of internal control over financial reporting, to the registrant’s auditors and the audit committee of the registrant’s board of directors (or persons performing the equivalent functions):
a) All significant deficiencies and material weaknesses in the design or operation of internal control over financial reporting which are reasonably likely to adversely affect the registrant’s ability to record, process, summarize and report financial information; and b) Any fraud, whether or not material, that involves management or other employees who have a significant role in the registrant’s internal control over financial reporting.
Date: March 12, 2015
/s/ Lars Lindqvist Lars Lindqvist
Chief Financial Officer, Vice President, Treasurer, Finance and Secretary

Exhibit 32
CERTIFICATIONS PURSUANT TO 18 U.S.C. SECTION 1350, AS ADOPTED PURSUANT TO SECTION 906 OF THE SARBANES-OXLEY ACT OF 2002
In connection with the annual report of Neonode Inc. (the “Company”) on Form 10-K for the fiscal year ended December 31, 2014 as filed with the
Securities and Exchange Commission (the “Report”), the undersigned principal executive officer and principal financial officer of the Company, each hereby certify, solely for purposes of 18 U.S.C. Section 1350, as adopted pursuant to Section 906 of the Sarbanes-Oxley Act of 2002, that to our knowledge:
This certification is not deemed filed with the Securities and Exchange Commission and is not to be incorporated by reference into any filing of the Company under the Securities Act of 1933, as amended, or the Securities Act of 1934, as amended, whether made before or after the date of the Report, irrespective of any general incorporation language contained in such filing.
1. The Report fully complies with the requirements of Section 13(a) or Section 15(d) of the Securities Exchange Act of 1934, as amended; and 2. The information contained in the Report fairly presents, in all material respects, the financial condition and results of operation of the Company.
/s/ Thomas Eriksson /s/ Lars Lindqvist Thomas Eriksson Lars Lindqvist Chief Executive Officer March 12, 2015
Chief Financial Officer, Vice President Finance, Treasurer and Secretary March 12, 2015


