MELISSA NELSON, MD NEONATAL-PERINATAL FELLOW YALE-NEW HAVEN HOSPITAL Neonatal Hyperbilirubinemia.
1
Neonatal hyperbilirubinemia: in vivo characterization of the mechanisms
of bilirubin neurotoxicity and pharmacological treatments
Simone Vodret
A Thesis submitted in fulfilment of the requirements of the Open
University (UK) for the degree of Doctor of Philosophy
The Open University (UK)
International Centre for Genetic Engineering and Biotechnology (ICGEB), Trieste, Italy
Director of the studies: Dr. Andrés Fernando Muro External supervisor: Dr. Libor Vitek
29th November 2016
2
ACKNOWLEDGEMENTS
I would like to thank Dr. Andrés Fernando Muro, the director of the study, for the
opportunity to work in his lab. The shared knowledge and the constructive
discussions over the last four years make me grow not only from the scientific point
of view, but also as a person. I would also like to thank Dr. Giulia Bortolussi, for her
patience in teaching and the assistance in performing experiments. Also without
her, this work would not have been possible. I would like to thank the ICGEB for the
financial support.
My gratitude goes to Dr. Libor Vitek, my external supervisor, for the support and the
discussions during our meeting and the preparation of the manuscript. I would like
to thank Prof. Henkjan Verkade, for the successful collaboration. My
acknowledgements also go to Jana Jašprová and Andrea Schreuder, for the
determination of tissue UCB and free bilirubin, respectively.
I would also like to thank all the past and present colleagues of the Mouse Molecular
Genetics lab, Fabiola Porro, Luka Bockor, Alessia De Caneva, Alessandra Iaconcig,
Vipin Singh Rawat, Riccardo ‘Seppia’ Sola, for the help and the laughs at the end
of each Internal Internal Seminar session. My gratitude goes to the staff of the
ICGEB animal facility, Willy De Mattia and Stefano Artico (also the captain of the
ICGEB football team), for their help.
I would like to thank Lucìa, for all the time and the books we shared, Zain, who
provided me half of the lunches of the last year, Chiara, for her carelessness we all
need in our life, and Andrea, who shared with me any given Sunday supporting
Roma.
I would like to thank my sisters, Cecilia and Caterina, for being together despite the
distance, and Lucia and Carlo, for their support in the darkest moments. Thanks to
my friends, Dino, Frinky, Miglio, Bob, Giorgio and Gino, you guys are my family.
My gratitude goes also to Giulia, I am lucky to share my life with her.
Finally, I would like to thank Arturo, without you there would not have been me.
3
TABLE OF CONTENTS
ACKNOWLEDGEMENTS ................................................................................ 2
TABLE OF CONTENTS ................................................................................... 3
LIST OF FIGURES .......................................................................................... 7
LIST OF TABLES ............................................................................................. 9
ABBREVIATIONS .......................................................................................... 10
ABSTRACT .................................................................................................... 12
INTRODUCTION ........................................................................................... 14
1.1 Bilirubin metabolism .................................................................................... 15
1.2 UGT1 gene locus ........................................................................................ 17
1.3 Bilirubin toxicity and disease ....................................................................... 18
1.3.1 Hereditary causes of unconjugated hyperbilirubinemia......................... 18
1.3.2 Non-genetic causes of unconjugated hyperbilirubinemia ...................... 19
1.3.3 Neonatal jaundice ................................................................................. 20
1.3.4 Management of hyperbilirubinemia ....................................................... 21
1.3.5 Bf .......................................................................................................... 22
1.3.6 Bilirubin-induced neurological dysfunction (BIND) ................................ 23
1.3.7 Kernicterus ............................................................................................ 24
1.4 Animal models to study hyperbilirubinemia ................................................. 24
1.4.1 Non-genetic animal models of hyperbilirubinemia ................................ 25
1.4.2 Gunn rat ................................................................................................ 25
1.4.3 Ugt1-/- mouse model (gene disruption by a neomycin cassette) ........... 26
1.4.4 Ugt1-/- mouse model (1 base deletion) .................................................. 27
1.5 Standard therapeutic treatments for hyperbilirubinemia .............................. 30
1.5.1 Phenobarbital treatment ........................................................................ 30
1.5.2 Phototherapy ........................................................................................ 30
1.5.3 Immunoglobulins ................................................................................... 31
1.5.4 Exchange transfusion ........................................................................... 32
1.6 Experimental treatments .............................................................................. 32
1.6.1 Orlistat and ursodeoxycholic acid ......................................................... 33
1.6.2 Human serum albumin .......................................................................... 33
1.6.3 Minocycline ........................................................................................... 35
1.6.4 Other treatments ................................................................................... 36
1.7 Mechanisms of bilirubin neurotoxicity .......................................................... 37
1.7.1 Neurodegeneration ............................................................................... 37
1.7.2 Oxidative stress .................................................................................... 38
1.7.3 ER stress .............................................................................................. 41

4
1.7.4 Neuroinflammation ................................................................................ 43
1.7.5 Autophagy ............................................................................................. 45
AIM OF THE THESIS .................................................................................... 47
MATERIALS AND METHODS ....................................................................... 48
2.1 Chemicals and standard solutions: .............................................................. 49
2.2 Animals........................................................................................................ 50
2.3 Genomic DNA extraction from mouse tail biopsies ..................................... 51
2.4 Polymerase chain reaction protocol to detect and discriminate different genotypes .......................................................................................................... 51
2.5 Animals treatments ...................................................................................... 52
2.5.1 Phototherapy treatment ........................................................................ 53
2.5.2 Minocycline treatment ........................................................................... 53
2.5.3 Human serum albumin treatment .......................................................... 53
2.5.4 Carbon tetrachloride treatment ............................................................. 53
2.6 Biochemical analyses of plasma samples ................................................... 54
2.6.1 Plasma total bilirubin measurement ...................................................... 54
2.6.2 Free bilirubin measurement .................................................................. 54
2.6.3 Plasma albumin measurement ............................................................. 55
2.6.4 Aminotransferases ................................................................................ 55
2.7 Tissue bilirubin measurement ...................................................................... 56
2.8 Preparation of total RNA from the mouse cerebellum ................................. 57
2.8.1 Quantification and quality control of RNA ............................................. 57
2.8.2 Reverse transcription (RT) .................................................................... 57
2.9 Quantitative real-time RT-PCR .................................................................... 58
2.10 Preparation of total protein extracts ........................................................... 61
2.11 SDS-PAGE and Western blot .................................................................... 61
2.12 Histological analysis .................................................................................. 62
2.12.1 Nissl staining ....................................................................................... 63
2.12.2 Immunofluorescence analysis ............................................................. 63
2.13 Rotarod test ............................................................................................... 64
2.14 Open field test ........................................................................................... 64
2.15 Statistics .................................................................................................... 66
2.16 Collaborators ............................................................................................. 66
RESULTS ...................................................................................................... 67
3.1 Albumin supplementation demonstrates that Bf is the cause of bilirubin neurotoxicity ...................................................................................................... 68
3.1.1 Experimental plan ................................................................................. 68
3.1.2 Survival of the HSA-treated Ugt1-/- mice ............................................... 69
3.1.3 Assessment of the HSA-treatment side effects ..................................... 70
5
3.1.4 Effects of HSA administration on plasma levels .................................... 72
3.1.5 Effects of HSA administration in the first 24 hours after injection .......... 74
3.1.6 Long-term effects of HSA administration in rescued Ugt1-/- mice .......... 78
3.1.7 The second 24 hours after HSA administration are crucial ................... 80
3.1.8 Predictive markers of bilirubin-induced neurological dysfunction .......... 83
3.2 Molecular basis of neurotoxicity in neonatal hyperbilirubinemia .................. 85
3.2.1. Experimental plan ................................................................................ 85
3.2.2. Susceptibility to bilirubin depends on the neuronal type and its developmental stage ...................................................................................... 85
3.2.3. Bilirubin-induced gliosis in Ugt1-/- mice cerebella ................................. 90
3.2.4 Time-dependent decrease of M2 is inversely proportional to M1 activation ........................................................................................................ 95
3.2.5 Amplifiers genes of bilirubin-induces inflammatory response ............... 96
3.2.6 Early stages of BIND are characterized by ER and oxidative stress activation ........................................................................................................ 98
3.2.7 Autophagy is a late event triggered by bilirubin .................................. 100
3.3 Mitigation of neuroinflammation by minocycline treatment ameliorates bilirubin neurotoxicity ....................................................................................... 102
3.3.1 MNC treatment improves survival of the Ugt1-/- mice .......................... 102
3.3.2 Evaluation of MNC effect on mice health ............................................ 104
3.3.3 MNC administration does not affect bilirubin and albumin plasma values ..................................................................................................................... 105
3.3.4 Motor-coordination and activity parameters of MNC rescued Ugt1-/- mice are comparable to WT mice, but anxiety features are only partially rescued ..................................................................................................................... 106
3.3.5 Minocycline reduces apoptosis and protects cerebellar neurons ........ 108
3.3.6 MNC attenuates neuro-inflammation in the cerebellum of mutant mice ..................................................................................................................... 113
3.3.7 MNC attenuates M1 but not M2 microglia activation ........................... 118
3.3.8 MNC attenuates inflammatory mediators ............................................ 118
3.3.9 MNC effect on ER and oxidative stress .............................................. 119
DISCUSSION ............................................................................................... 123
4.1 Albumin supplementation studies demonstrate that Bf is the cause of bilirubin neurotoxicity ....................................................................................... 124
4.1.1 Previous studies in Gunn rats ............................................................. 124
4.1.2 Proof of principle in Ugt1-/- mouse model ............................................ 124
4.1.3 HSA long-term effectiveness .............................................................. 126
4.1.4 Frequency of HSA administration is crucial ........................................ 126
4.1.5 Albumin half-life .................................................................................. 127
4.1.6 Doses and routes of administration .................................................... 127
4.1.7 Predictive markers of BIND ................................................................. 128
6
4.1.8 HSA administration as a potential alternative to ET ............................ 129
4.2 Bilirubin neurotoxicity is the result of concerted pathways misregulation .. 132
4.2.1 Neurodegeneration and neuro-apoptosis ............................................ 134
4.2.2 Oxidative stress response ................................................................... 135
4.2.3 UPR and ER stress response ............................................................. 136
4.2.4 Inflammatory mediators ...................................................................... 137
4.2.5 Implication of inflammatory cell mediators .......................................... 139
4.2.6 Autophagy is the final deathblow ........................................................ 141
4.2.7 Future directions ................................................................................. 142
4.3 MNC decreases neurodegeneration and neuroinflammation resulting in increased lifespan and partial rescue of neonatal hyperbilirubinemia lethality 143
4.3.1 MNC lifespan extension ...................................................................... 143
4.3.2 MNC route of administration ............................................................... 144
4.3.3 MNC side effects ................................................................................ 145
4.3.4 Timing of administration is crucial to obtain MNC beneficial effects ... 146
4.3.5 MNC effectively reduces neurodegeneration ...................................... 147
4.3.6 MNC attenuation of inflammation ameliorates neurodegenerative disease ........................................................................................................ 149
4.3.7 M1 and M2 microglia........................................................................... 149
4.3.8 Markers of inflammation ...................................................................... 150
4.3.9 Bilirubin alters anxiety but not activity parameters in MNC rescued animals ........................................................................................................ 153
4.3.10 Effects of MNC on oxidative and ER stress ...................................... 154
4.3.11 MNC administration could open future therapeutic approaches for neonatal hyperbilirubinemia ......................................................................... 156
CONCLUSIONS ........................................................................................... 157
BIBLIOGRAPHY .......................................................................................... 158
Appendix 1 ................................................................................................... 178
7
LIST OF FIGURES
Figure 1. Metabolic reactions of bilirubin pathway ......................................... 15
Figure 2. Schematic representation of bilirubin conjugation within the hepatocytes
....................................................................................................................... 16
Figure 3. The Ugt1 locus ............................................................................... 17
Figure 4. Hyperbilirubinemia features of Ugt1-/- mice in the C57BL/6 background
strain .............................................................................................................. 28
Figure 5. Hyperbilirubinemia features of Ugt1-/- mice in the FVB/NJ background
strain .............................................................................................................. 29
Figure 6. Rationale of HSA administration .................................................... 34
Figure 7. Bilirubin-induced oxidative stress ................................................... 40
Figure 8. Bilirubin causes ER stress ............................................................. 42
Figure 9. Bilirubin triggers neuroinflammation ............................................... 45
Figure 10. Scheme of PCR steps .................................................................. 52
Figure 11. Primer pairs quality control ........................................................... 59
Figure 12. Open field test arena .................................................................... 65
Figure 13. HSA experimental plan ................................................................ 69
Figure 14. Survival of HSA-treated Ugt1-/- mice ............................................ 70
Figure 15. Weight curve of HSA-treated mice ............................................... 71
Figure 16. HSA administration has no effect on transaminases activity in HSA-
treated Ugt1-/- mice ........................................................................................ 72
Figure 17. Dose-dependent effect of HSA administration on plasma values 24 hours
after last injection ........................................................................................... 73
Figure 18. Correlation plot of plasma albumin and TB .................................. 75
Figure 19. Effect of HSA administration on brain bilirubin content ................ 76
Figure 20. Effect of HSA administration on Bf ............................................... 77
Figure 21. Neurological assessment of HSA treatment ................................. 78
Figure 22. Long term evaluation of rescued mutant mice ............................. 79
Figure 23. The second 24h after albumin administration .............................. 80
Figure 24. Comparison of albumin, TB and Bf between P15 and P16 .......... 81
Figure 25. Tissue bilirubin increment at P16 ................................................. 82
Figure 26. Effect of HSA on liver and skeletal muscle ................................... 83
Figure 27. Plasma markers of bilirubin toxicity .............................................. 84
Figure 28. Neurological characterization of the FVB/NJ Ugt1-/- mice ............ 87
Figura 29. Bilirubin affects PCs dendritic arborization and survival ............... 89
8
Figure 30. Bilirubin does not affect survival of differentiated granule cells .... 90
Figura 31. Bilirubin triggers the activation of astrocytes ................................ 92
Figure 32. Bilirubin triggers the activation of microglia .................................. 94
Figure 33. Bilirubin induces activation of pro-inflammatory microglia ............ 96
Figure 34. Inflammatory markers screening .................................................. 97
Figure 35. Relative mRNA expression of inflammatory markers ................... 98
Figure 36. Time-course of mRNA expression levels of ER stress-related markers
....................................................................................................................... 99
Figure 37. Time-course of mRNA expression levels of oxidative stress-related
markers ........................................................................................................ 100
Figure 38. Autophagy is a late event in bilirubin toxicity .............................. 101
Figure 39. Experimental plan and survival of MNC-treated Ugt1-/- .............. 103
Figure 40. Effect of MNC on liquid consumption ......................................... 104
Figure 41. Effect of MNC on mice weight along the first month of life ......... 105
Figure 42. Plasma bilirubin and albumin levels in MNC-trated mice ........... 106
Figure 43. Performance of MNC-treated mice on the rotating rotarod ........ 107
Figure 44. Spontaneus activity of MNC-treated animals in the OF test ....... 108
Figure 45. Effect of MNC on apoptosis and cerebellar morphology ............ 110
Figure 46. Effect of MNC on PCs ................................................................ 112
Figure 47. Effect of MNC on GCs ................................................................ 113
Figure 48. Effect of MNC on astrocytes ...................................................... 115
Figure 49. Effect of MNC on microglia cells ................................................ 117
Figure 50. MNC effect on M1 and M2 microglia markers ............................ 118
Figure 51. Effect of MNC on inflammatory markers .................................... 119
Figure 52. Effect of MNC on ER stress-related genes. ............................... 120
Figure 53. Effect of MNC on relative mRNA expression of oxidative stress-related
genes. .......................................................................................................... 121
Figure 54. Model of the bilirubin-binding capacity in plasma in hyperbilirubinemic
condition ...................................................................................................... 125
Figure 55. Time-line of the molecular events leading to bilirubin-mediated
neurodegeneration in the FVB/NJ Ugt1-/- mouse model of neonatal
hyperbilirubinemia. ....................................................................................... 133

9
LIST OF TABLES
Table 1. Genetic causes of hyperbilirubinemia .............................................. 19
Table 2. Non-genetic hyperbilirubinemia causes ........................................... 20
Table 3. M1 vs M2 microglia markers and effectors. ..................................... 44
Table 4. Primers for genotyping Ugt1-/- mouse model. .................................. 52
Table 5. Mouse primers for qRT-PCR ........................................................... 60
Table 6. Stacking and running gel mixes ....................................................... 61
Table 7. Summary of the antibodies used in WB and IF ................................ 62
Table 8. Plasma total bilirubin and albumin levels.. ....................................... 74

10
ABBREVIATIONS
ABR auditory brainstem response AD Alzheimer’s disease ALS amyotrophic lateral sclerosis ALT alanine aminotransferase ARE antioxidant response elements Arg1 arginase 1 AST aspartate aminotransferase ATF activating transcription factor B/A bilirubin/albumin BAEP brainstem auditory evoked potential BBB blood-brain barrier BCG bromocresolgreen Bf UCB free fraction BIND bilirubin-induced neurological dysfunction BMEC brain microvascular endothelial cell bp base pair CAR constitutive androstane receptor CB cerebellum CCl4 carbon tetrachloride CD cluster of differentiation cDNA complementary DNA CHOP C/EBP-Homologous Protein CGN cerebellar granule neuron CNS central nervous system CNSI Crigler-Najjar syndrome type I CNSII Crigler-Najjar syndrome type II DCs dendritic cells DR5 death receptor 5 EGL external germinal layer ER endoplasmic reticulum ERO1L endoplasmic reticulum oxidoreductase 1-like ET exchange transfusion Et-OH ethanol FB forebrain g/kg grams/kilograms G6PD glucose 6-phosphate dehydrogenase GCs granule cells gDNA genomic DNA GFAP glial fibrillary acidic protein GRP glucose-regulated protein GS Gilbert's syndrome HD Huntington’s disease HO heme oxygenase HSA human serum albumin hUGT1 humanized Ugt1 Iba1 ionized calcium-binding adapter molecule 1 IF immunofluorescence IGL internal granular layer IL interleukin INFγ interferon γ

11
iNOS inducible nitric oxide synthase i.p. intraperitoneal i.v. intravenous IRE1 inositol requiring 1 kD kilodalton LC3 microtubule-associated protein 1A/1B-light chain 3 LIV liver MAPK mitogen-activated protein kinase Met-OH methanol ML molecular layer MMP matrix metalloproteinase MNC minocycline Mps metalloporphyrins MRC mannose receptor complex MS multiple sclerosis NFKβ nuclear factor kappa-light-chain-enhancer of activated B cells NO nitric oxide Nrf2 nuclear factor (erythroid-derived 2)-like 2 OF open field ORF open reading frame P postnatal day PCR polymerase chain reaction PCs Purkinje cells PCL Purkinje cells layer PD Parkinson’s disease PERK protein kinase RNA-like endoplasmic reticulum kinase PHZ phenylhydrazine PXR pregnane X receptor qRT-PCR quantitative real-time RT-PCR ROS reactive oxygen species RT reverse transcription SM skeletal muscle SOD superoxide dismutase Sulpha sulphadimethoxine TB total bilirubin TBI traumatic brain injury TLR2 toll-like receptor 2 TNFα tumor necrosis factor α UCB unconjugated bilirubin UDCA ursodeoxycholic acid UGT1A1 UDP-glucuronosyl transferase 1A1 UPR unfolded protein response WB western blot WT wild type
12
ABSTRACT
Neonatal jaundice or hyperbilirubinemia is the result of alterations in the bilirubin
metabolism. Prolonged and uncontrolled high levels of unconjugated bilirubin lead
to bilirubin-induced neurological dysfunction and, if untreated, eventually death by
kernicterus. Severe hyperbilirubinemia results in the saturation of the bilirubin
binding capacity of plasma albumin, with the consequent increase in the fraction of
unconjugated bilirubin (UCB) not bound to albumin (free bilirubin, Bf) that, due to its
lipophilicity, crosses the blood brain barrier accumulating in the brain and triggering
the neuronal injury. In the developing central nervous system, a wide range of
cellular functions are affected and the concerted disruption of their regulation results
in cellular damage. Patients experiencing prolonged toxic bilirubin levels are
characterized by a number of neurological deficits, such as abnormalities in motor,
sensitive and cognitive functions. Despite intensive studies, several aspects of the
mechanisms operating at the onset of the disease are still partially understood.
To study severe neonatal hyperbilirubinemia and possible therapies, I took
advantage of the Ugt1-/- mouse model previously generated in my laboratory.
Homozygous mutant mice develop jaundice and accumulate bilirubin in the brain
due to the lack of the Ugt1a1 enzyme. If untreated, mutant mice show neurological
deficits leading to early neonatal lethality.
The work performed in this Thesis explores three different aspects of bilirubin
neurotoxicity:
1. The role of Bf in vivo by the administration of human serum albumin;
2. The events preceding death by a time-course analysis of mutant pups;
3. The investigation of the role of neuroinflammation by the administration of a
neuroprotective and anti-inflammatory drug.
The obtained results showed that increasing plasma bilirubin-binding capacity by
albumin supplementation decreases bilirubin neurotoxicity. In fact, daily albumin
administration avoided the accumulation of Bf in the brain by its mobilization from
tissues to plasma, resulting in the complete rescue of bilirubin-induced brain
impairment and lethality. Moreover, this study highlighted the reliability of Bf as the
best marker to predict neurotoxicity risk.
The time-course investigation of the events occurring in the cerebellum of Ugt1-/-
pups leading to bilirubin-brain damage showed the prevalence of ER stress,
oxidative stress and neuroinflammation at the onset of neonatal hyperbilirubinemia
13
that, in turn, affected brain integrity by their concerted effect resulting in
neurodegeneration.
Finally, the administration of minocycline (MNC), an antibiotic with neuroprotective
and anti-inflammatory properties, partially prevented lethality by hyperbilirubinemia
and rescued animals by significantly reducing neurodegenerative and
neuroinflammatory features that characterized the untreated Ugt1-/- mouse model.
This study demonstrates the contribution of ER stress and inflammation in the onset
of the disease, the relevance of these mechanisms during the attenuation of
neurodegeneration by MNC administration, and that albumin supplementation is a
potential therapeutic alternative to treat bilirubin neurotoxicity in acute cases in
which prompt exchange transfusion is required.

14
INTRODUCTION
15
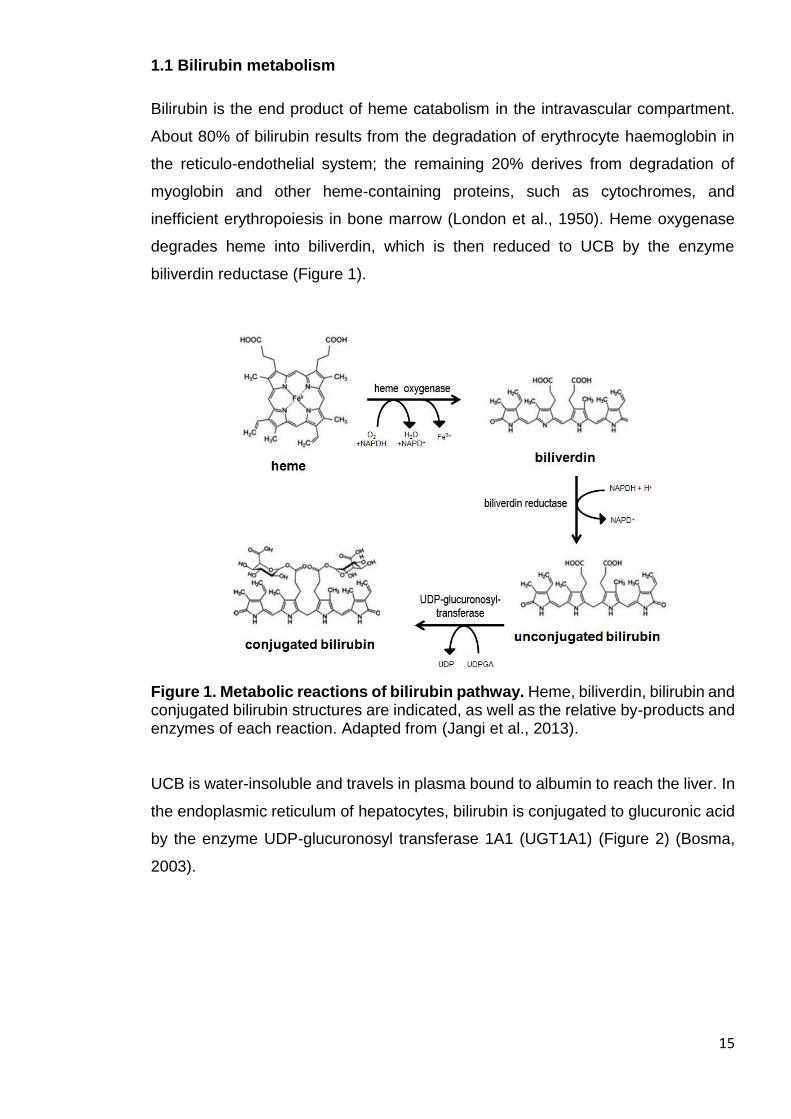
1.1 Bilirubin metabolism
Bilirubin is the end product of heme catabolism in the intravascular compartment.
About 80% of bilirubin results from the degradation of erythrocyte haemoglobin in
the reticulo-endothelial system; the remaining 20% derives from degradation of
myoglobin and other heme-containing proteins, such as cytochromes, and
inefficient erythropoiesis in bone marrow (London et al., 1950). Heme oxygenase
degrades heme into biliverdin, which is then reduced to UCB by the enzyme
biliverdin reductase (Figure 1).
Figure 1. Metabolic reactions of bilirubin pathway. Heme, biliverdin, bilirubin and conjugated bilirubin structures are indicated, as well as the relative by-products and enzymes of each reaction. Adapted from (Jangi et al., 2013). UCB is water-insoluble and travels in plasma bound to albumin to reach the liver. In
the endoplasmic reticulum of hepatocytes, bilirubin is conjugated to glucuronic acid
by the enzyme UDP-glucuronosyl transferase 1A1 (UGT1A1) (Figure 2) (Bosma,
2003).
16
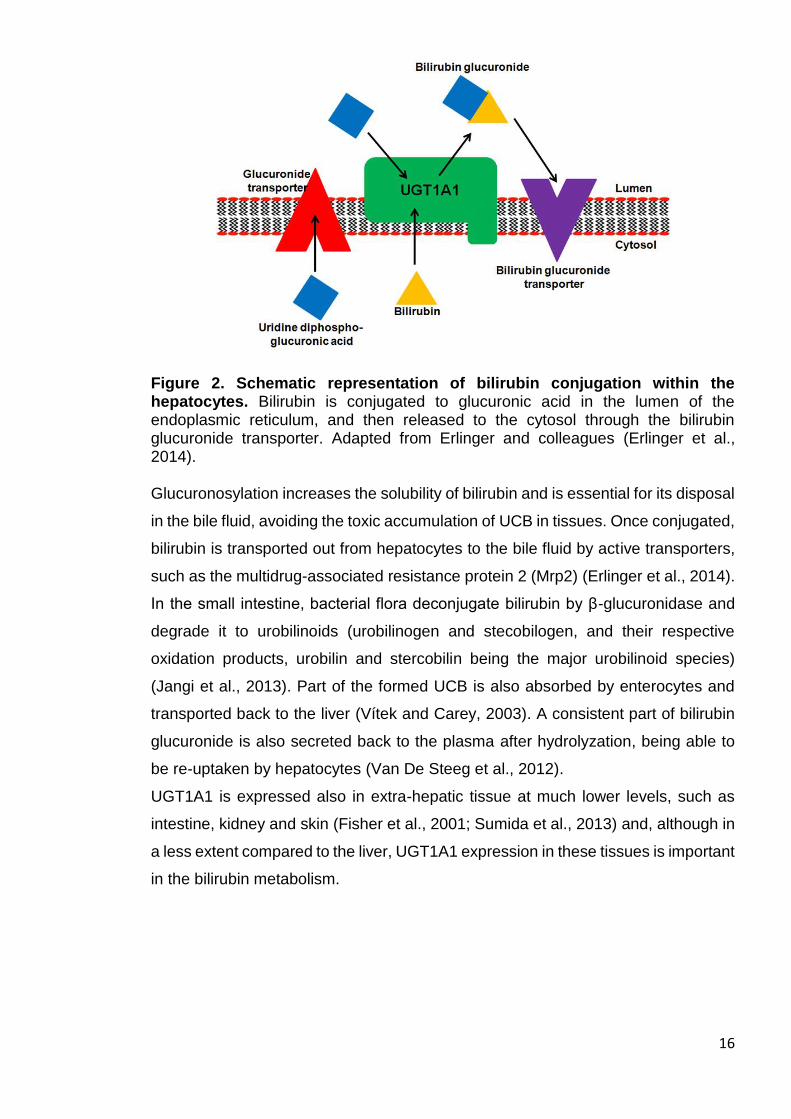
Figure 2. Schematic representation of bilirubin conjugation within the hepatocytes. Bilirubin is conjugated to glucuronic acid in the lumen of the endoplasmic reticulum, and then released to the cytosol through the bilirubin glucuronide transporter. Adapted from Erlinger and colleagues (Erlinger et al., 2014). Glucuronosylation increases the solubility of bilirubin and is essential for its disposal
in the bile fluid, avoiding the toxic accumulation of UCB in tissues. Once conjugated,
bilirubin is transported out from hepatocytes to the bile fluid by active transporters,
such as the multidrug-associated resistance protein 2 (Mrp2) (Erlinger et al., 2014).
In the small intestine, bacterial flora deconjugate bilirubin by β-glucuronidase and
degrade it to urobilinoids (urobilinogen and stecobilogen, and their respective
oxidation products, urobilin and stercobilin being the major urobilinoid species)
(Jangi et al., 2013). Part of the formed UCB is also absorbed by enterocytes and
transported back to the liver (Vítek and Carey, 2003). A consistent part of bilirubin
glucuronide is also secreted back to the plasma after hydrolyzation, being able to
be re-uptaken by hepatocytes (Van De Steeg et al., 2012).
UGT1A1 is expressed also in extra-hepatic tissue at much lower levels, such as
intestine, kidney and skin (Fisher et al., 2001; Sumida et al., 2013) and, although in
a less extent compared to the liver, UGT1A1 expression in these tissues is important
in the bilirubin metabolism.
17
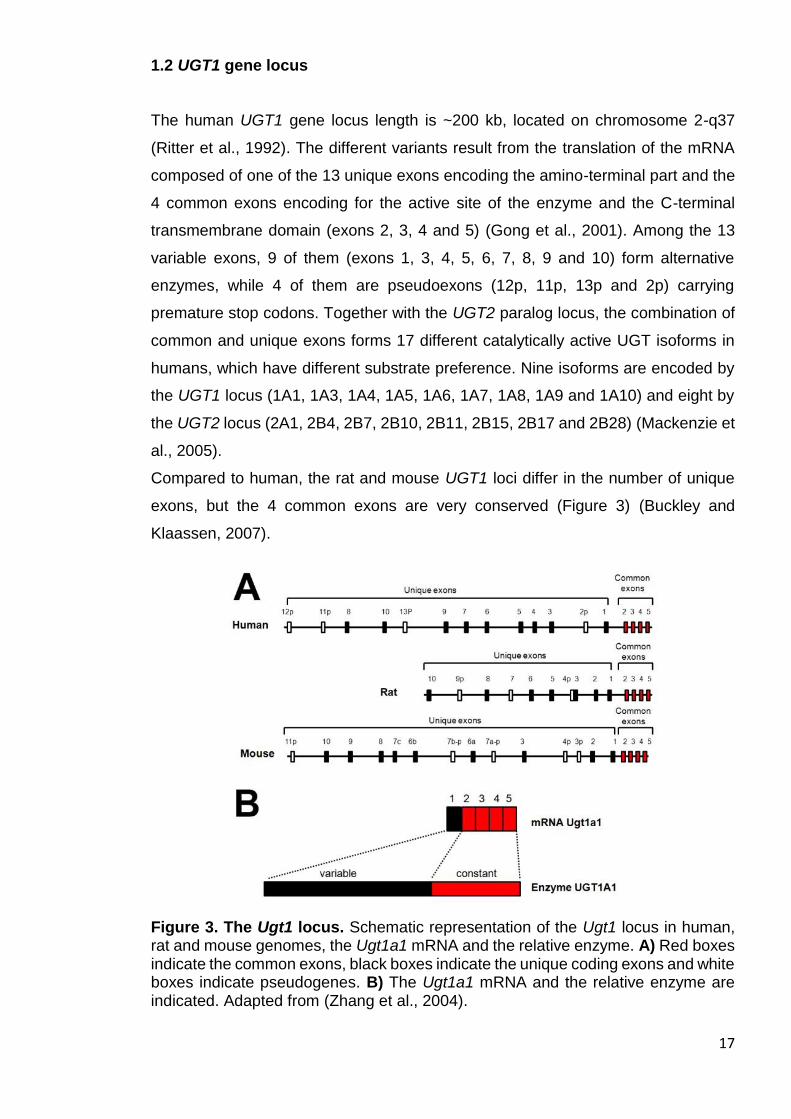
1.2 UGT1 gene locus
The human UGT1 gene locus length is ~200 kb, located on chromosome 2-q37
(Ritter et al., 1992). The different variants result from the translation of the mRNA
composed of one of the 13 unique exons encoding the amino-terminal part and the
4 common exons encoding for the active site of the enzyme and the C-terminal
transmembrane domain (exons 2, 3, 4 and 5) (Gong et al., 2001). Among the 13
variable exons, 9 of them (exons 1, 3, 4, 5, 6, 7, 8, 9 and 10) form alternative
enzymes, while 4 of them are pseudoexons (12p, 11p, 13p and 2p) carrying
premature stop codons. Together with the UGT2 paralog locus, the combination of
common and unique exons forms 17 different catalytically active UGT isoforms in
humans, which have different substrate preference. Nine isoforms are encoded by
the UGT1 locus (1A1, 1A3, 1A4, 1A5, 1A6, 1A7, 1A8, 1A9 and 1A10) and eight by
the UGT2 locus (2A1, 2B4, 2B7, 2B10, 2B11, 2B15, 2B17 and 2B28) (Mackenzie et
al., 2005).
Compared to human, the rat and mouse UGT1 loci differ in the number of unique
exons, but the 4 common exons are very conserved (Figure 3) (Buckley and
Klaassen, 2007).
Figure 3. The Ugt1 locus. Schematic representation of the Ugt1 locus in human, rat and mouse genomes, the Ugt1a1 mRNA and the relative enzyme. A) Red boxes indicate the common exons, black boxes indicate the unique coding exons and white boxes indicate pseudogenes. B) The Ugt1a1 mRNA and the relative enzyme are indicated. Adapted from (Zhang et al., 2004).
18
Despite the identified overlapping in enzyme activity of the different UGT variants,
UGT1A1 is the only enzyme responsible for bilirubin glucuronosylation (Bosma et
al., 1994).
1.3 Bilirubin toxicity and disease
The alteration in bilirubin metabolism results in the accumulation of UCB.
Hyperbilirubinemia can be triggered by genetic and non-genetic causes, or by their
combination (Table 1 and 2).
1.3.1 Hereditary causes of unconjugated hyperbilirubinemia
High levels of UCB can be the result of genetic disorders (Table 1).
The Crigler-Najjar syndrome is an extremely rare recessive genetic disease, owing
a prevalence of 1 in 1,000,000 births. It is characterized by the deficiency of hepatic
UGT1A1 activity due to mutations in the UGT1A1 gene, resulting in
hyperbilirubinemia, severe neurological damage and death, if untreated (Crigler and
Najjar, 1952). Depending on the severity of the symptoms, the syndrome is
classified in two different forms, although there is a continuum of phenotypes:
Crigler-Najjar syndrome type I (CNSI) (OMIM 218800) and type II (CNSII) (OMIM
606785).
In CNSI, hyperbilirubinemia is caused by the complete absence of the UGT1A1
activity and bilirubin glucuronides in bile, which result in bilirubin neurotoxicity and
death if untreated.
CNSII is a milder form of the disease, distinguished from CNSI by the presence of
residual activity of UGT1A1 enzyme due to missense mutations in the gene that
reduce the expression or the enzyme affinity for the substrate (Arias, 1962). CNSII
patients present low levels of bilirubin glucuronosides in bile, as bilirubin levels are
decreased upon phenobarbital administration that induces UGT1A1 gene
expression (see Chapter 1.5.1).
Gilbert’s syndrome (GS) is the milder genetic form of unconjugated
hyperbilirubinemia. In GS, a mutation in the promoter of the UGT1A1 gene can
cause the decreased expression of the enzyme. Although milder, bilirubin levels in
the GS condition may rise by different stress factors, placing GS patient at risk of
high UCB levels.
19
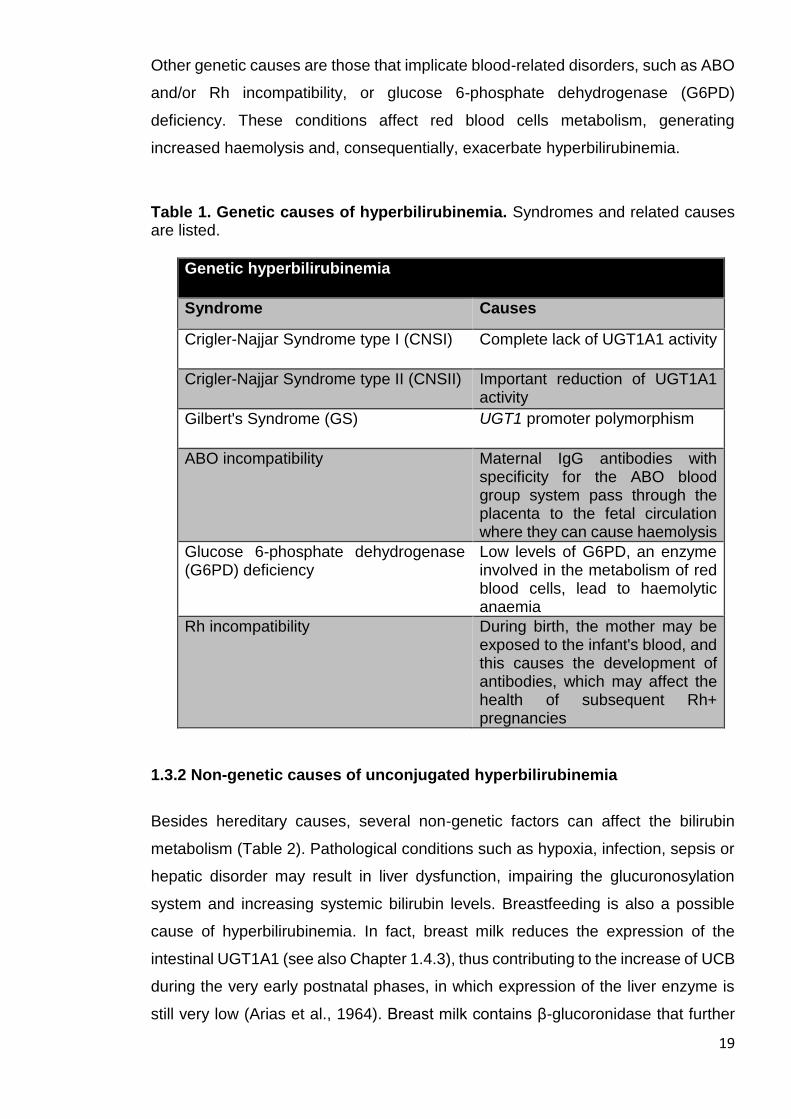
Other genetic causes are those that implicate blood-related disorders, such as ABO
and/or Rh incompatibility, or glucose 6-phosphate dehydrogenase (G6PD)
deficiency. These conditions affect red blood cells metabolism, generating
increased haemolysis and, consequentially, exacerbate hyperbilirubinemia.
Table 1. Genetic causes of hyperbilirubinemia. Syndromes and related causes are listed.
Genetic hyperbilirubinemia
Syndrome Causes
Crigler-Najjar Syndrome type I (CNSI) Complete lack of UGT1A1 activity
Crigler-Najjar Syndrome type II (CNSII) Important reduction of UGT1A1 activity
Gilbert's Syndrome (GS) UGT1 promoter polymorphism
ABO incompatibility Maternal IgG antibodies with specificity for the ABO blood group system pass through the placenta to the fetal circulation where they can cause haemolysis
Glucose 6-phosphate dehydrogenase (G6PD) deficiency
Low levels of G6PD, an enzyme involved in the metabolism of red blood cells, lead to haemolytic anaemia
Rh incompatibility During birth, the mother may be exposed to the infant's blood, and this causes the development of antibodies, which may affect the health of subsequent Rh+ pregnancies
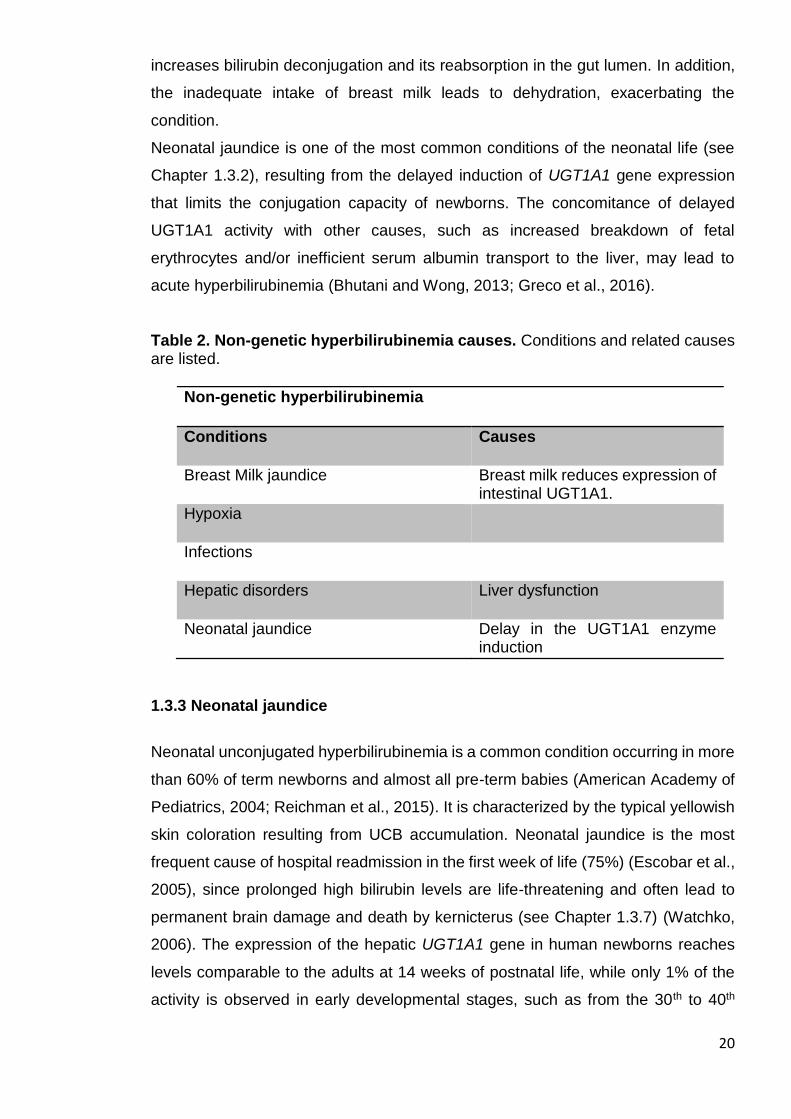
1.3.2 Non-genetic causes of unconjugated hyperbilirubinemia
Besides hereditary causes, several non-genetic factors can affect the bilirubin
metabolism (Table 2). Pathological conditions such as hypoxia, infection, sepsis or
hepatic disorder may result in liver dysfunction, impairing the glucuronosylation
system and increasing systemic bilirubin levels. Breastfeeding is also a possible
cause of hyperbilirubinemia. In fact, breast milk reduces the expression of the
intestinal UGT1A1 (see also Chapter 1.4.3), thus contributing to the increase of UCB
during the very early postnatal phases, in which expression of the liver enzyme is
still very low (Arias et al., 1964). Breast milk contains β-glucoronidase that further
20
increases bilirubin deconjugation and its reabsorption in the gut lumen. In addition,
the inadequate intake of breast milk leads to dehydration, exacerbating the
condition.
Neonatal jaundice is one of the most common conditions of the neonatal life (see
Chapter 1.3.2), resulting from the delayed induction of UGT1A1 gene expression
that limits the conjugation capacity of newborns. The concomitance of delayed
UGT1A1 activity with other causes, such as increased breakdown of fetal
erythrocytes and/or inefficient serum albumin transport to the liver, may lead to
acute hyperbilirubinemia (Bhutani and Wong, 2013; Greco et al., 2016).
Table 2. Non-genetic hyperbilirubinemia causes. Conditions and related causes are listed.
Non-genetic hyperbilirubinemia
Conditions Causes
Breast Milk jaundice Breast milk reduces expression of intestinal UGT1A1.
Hypoxia
Infections
Hepatic disorders Liver dysfunction
Neonatal jaundice Delay in the UGT1A1 enzyme induction
1.3.3 Neonatal jaundice
Neonatal unconjugated hyperbilirubinemia is a common condition occurring in more
than 60% of term newborns and almost all pre-term babies (American Academy of
Pediatrics, 2004; Reichman et al., 2015). It is characterized by the typical yellowish
skin coloration resulting from UCB accumulation. Neonatal jaundice is the most
frequent cause of hospital readmission in the first week of life (75%) (Escobar et al.,
2005), since prolonged high bilirubin levels are life-threatening and often lead to
permanent brain damage and death by kernicterus (see Chapter 1.3.7) (Watchko,
2006). The expression of the hepatic UGT1A1 gene in human newborns reaches
levels comparable to the adults at 14 weeks of postnatal life, while only 1% of the
activity is observed in early developmental stages, such as from the 30th to 40th
21
week of gestation (Coughtrie et al., 1988). Thus, pre-term delivery and delays in
enzyme induction result in neonatal jaundice.
1.3.4 Management of hyperbilirubinemia
Transient neonatal hyperbilirubinemia occurs in the first week of life, and plasma
total bilirubin (TB) usually peaks up to 10 mg/dL (170 µmol/L) (American Academy
of Pediatrics, 2004). Since high levels of bilirubin may produce encephalopathy, the
evaluation of at risk babies is performed by TB measurement. TB measurement
related to the infants’ age in hours gives the indication for the application of the
therapy to reduce the hyperbilirubinemia, such as intensive phototherapy or
exchange transfusion, depending on the severity of the condition (see Chapter 1.5)
(Muchowski, 2014).
It is generally recognized that newborns with less than 35 weeks of gestation are at
greater risk of bilirubin neurotoxicity susceptibility compared to term newborns
(Maisels et al., 2012). In fact, the developing brain of premature babies is particularly
vulnerable to bilirubin neurotoxicity due to neurodevelopmental maturity differences
(Okumura et al., 2009). In particular, the cerebellum is very susceptible to potentially
toxic effects of bilirubin, as its development occurs also in peri- and post-natal period
(Biran et al., 2012; Fonnum and Lock, 2000), thus, providing an optimal target for
bilirubin neurotoxicity. In 2004, the American Academy of Pediatrics indicated the
guidelines for the management of hyperbilirubinemic infants (American Academy of
Pediatrics, 2004), delineating a general approach to tackle neonatal jaundice in
infants with more than 35 weeks of gestation. However, the threshold to predict
bilirubin-induced brain damage is not clear. For instance, a study revealed that TB
values higher than 31 mg/dL (539 µmol/L) in non-haemolytic jaundice babies
resulted in bilirubin encephalopathy (Gamaleldin et al., 2011). On the contrary,
another study presenting babies with values ≥ 30 mg/dL (≥ 513 µmol/L) did not show
evidences of brain injury or neurodevelopmental sequelae (Newman et al., 2003).
Bilirubin/albumin (B/A) ratio can be used as an alternative to TB. The employment
of the B/A ratio in conjunction with TB can improve the accuracy of brain damage
prediction and prevent unnecessary invasive therapies, such as exchange
transfusion in jaundice neonates (Ardakani et al., 2011). In fact, B/A ratio can be
employed as a surrogate parameter to estimate the free fraction of bilirubin (Bf,
Chapter 1.3.5), which, in some conditions, is a more precise marker to evaluate the
potential brain damage. Several protocols have been proposed to trace guidelines
22
for free bilirubin threshold (Yokota et al., 2013). Unfortunately, reliable and readily
accessible assays for evaluating serum free bilirubin are not yet available. Thus,
further investigations are needed to set a valid and reliable parameter to
discriminate the at-risk babies.
1.3.5 Bf
The biochemical determination of bilirubin in plasma is divided into direct and
indirect measurement. The direct fraction (conjugated bilirubin) is composed by
bilirubin mono- and di-glucuronosides, while the indirect fraction is the subtraction
of direct bilirubin from the total bilirubin value, also referred as UCB.
Bilirubin is poorly water-soluble at physiological pH and it needs to be up-taken in
the liver to be metabolized by hepatocytes. Normally, the majority of UCB travels in
the bloodstream bound to albumin, due to the high affinity of binding (Ostrow et al.,
1994). As TB levels increase, the UCB amount may rise above the binding capacity
supplied by the plasma protein, leading to the increase of UCB free fraction (Bf)
(Wennberg et al., 1979). Bf is normally present at levels lower than 0.1% of total
bilirubin in plasma. Due to its chemical lipophilic nature, the small fraction of UCB
(or Bf) crosses cellular membranes and diffuses into tissues, especially those having
high lipid content, being the cause of the neurological damage in the brain. In
particular, when the albumin binding capacity is saturated by UCB, Bf is capable of
crossing the blood-brain-barrier (BBB), and disrupting several essential neuronal
functions, resulting in neuronal cell death (Ostrow et al., 2004). Bilirubin alters the
composition, permeability and functions of the cellular membrane, leading to cellular
energy failure (Keshavan et al., 2004), oxidative stress (Qaisiya et al., 2014; Vaz et
al., 2010) and glutamate excitotoxicity (Brito et al., 2010). All these defects might, in
turn, lead to several cell responses such as inflammation, abnormal intracellular
calcium levels and effects on others possible cellular necrosis/apoptosis signalling
pathways (Watchko, 2006). In premature newborns Bf, but not TB, has been shown
to correlate with the development of kernicterus (Amin et al., 2001), which is the
characteristic sign of toxic levels of prolonged bilirubin accumulation in the brain. Bf
was shown to be a determinant of bilirubin toxicity in animal model of
hyperbilirubinemia (Wennberg and Hance, 1986). Thus, Bf plays a key role in the
pathogenesis of bilirubin-induced brain damage. However, Bf concentrations are
not routinely evaluated in jaundiced patients (Ahlfors et al., 2006), and a reliable

23
marker to assess the state of patients and to predict damage, especially in jaundice
newborns, is still needed.
1.3.6 Bilirubin-induced neurological dysfunction (BIND)
For the great majority of neonates the outcome of jaundice is benign, but prevention
must be carried out to keep under control the potential neurodamage.
During neonatal jaundice UCB concentration may rise exceeding the binding
capacity of albumin, and can reach life-threatening levels. In the past years, interest
in bilirubin encephalopathy has been reawakened due to an increase in its
prevalence (Bhutani et al., 2013; Kaplan and Hammerman, 2005). If untreated,
newborns with very high UCB levels may eventually develop bilirubin-induced
neurological dysfunction (BIND) in the CNS (Wennberg et al., 2006). Based on time
of bilirubin exposure and symptoms, BIND can be divided into mild, moderate and
severe BIND. Mild and moderate BIND symptoms are reversible, while severe BIND
can lead to irreversible brain damage. Newborns that experience prolonged bilirubin
toxicity show clinical features of lethargy, ophthalmoplegia (ocular muscle
paralysis), high-pitch crying, opisthotonus (bowed body and rigid extremities or
dystonia), and seizures, as well as mental retardation, and often death by
kernicterus (Shapiro, 2003; Smitherman et al., 2006). In fact, in the developing brain,
bilirubin targets specific regions such as basal ganglia, cochlear, and oculomotor
nuclei and cerebellum, including granule and Purkinje neurons (Lauer and Spector,
2011; Watchko, 2006). Even moderate levels of UCB have been associated with
developmental delay, attention-deficit disorders, autism, and isolated neural hearing
loss (Shapiro, 2010). In any case, long-lasting exposure to high levels of bilirubin
may lead to neurological sequelae, and it could have a permanent impact on the
infant’s learning and memory.
The degree of BIND in babies is measured by magnetic resonance images of the
brain (Shah et al., 2003) and by brainstem auditory evoked potential (BAEPs, or
auditory brainstem response ABRs), as the auditory system is particularly sensitive
to bilirubin toxicity (Shapiro and Nakamura, 2001). Hence the response to auditory
stimuli represents a reliable method that reflects neuronal activity.
Clearly, the detailed identification of the neurological events and molecular targets
triggering bilirubin neurotoxicity will help to the understanding and management of
BIND.
24
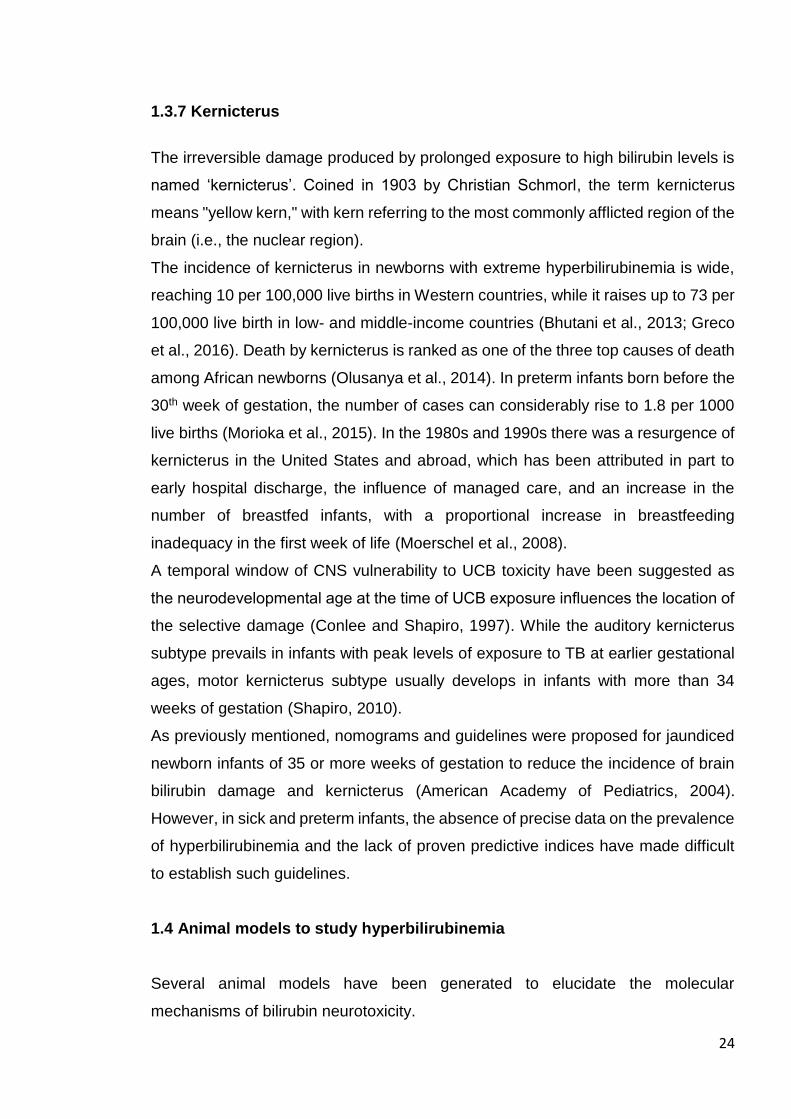
1.3.7 Kernicterus
The irreversible damage produced by prolonged exposure to high bilirubin levels is
named ‘kernicterus’. Coined in 1903 by Christian Schmorl, the term kernicterus
means "yellow kern," with kern referring to the most commonly afflicted region of the
brain (i.e., the nuclear region).
The incidence of kernicterus in newborns with extreme hyperbilirubinemia is wide,
reaching 10 per 100,000 live births in Western countries, while it raises up to 73 per
100,000 live birth in low- and middle-income countries (Bhutani et al., 2013; Greco
et al., 2016). Death by kernicterus is ranked as one of the three top causes of death
among African newborns (Olusanya et al., 2014). In preterm infants born before the
30th week of gestation, the number of cases can considerably rise to 1.8 per 1000
live births (Morioka et al., 2015). In the 1980s and 1990s there was a resurgence of
kernicterus in the United States and abroad, which has been attributed in part to
early hospital discharge, the influence of managed care, and an increase in the
number of breastfed infants, with a proportional increase in breastfeeding
inadequacy in the first week of life (Moerschel et al., 2008).
A temporal window of CNS vulnerability to UCB toxicity have been suggested as
the neurodevelopmental age at the time of UCB exposure influences the location of
the selective damage (Conlee and Shapiro, 1997). While the auditory kernicterus
subtype prevails in infants with peak levels of exposure to TB at earlier gestational
ages, motor kernicterus subtype usually develops in infants with more than 34
weeks of gestation (Shapiro, 2010).
As previously mentioned, nomograms and guidelines were proposed for jaundiced
newborn infants of 35 or more weeks of gestation to reduce the incidence of brain
bilirubin damage and kernicterus (American Academy of Pediatrics, 2004).
However, in sick and preterm infants, the absence of precise data on the prevalence
of hyperbilirubinemia and the lack of proven predictive indices have made difficult
to establish such guidelines.
1.4 Animal models to study hyperbilirubinemia
Several animal models have been generated to elucidate the molecular
mechanisms of bilirubin neurotoxicity.
25
1.4.1 Non-genetic animal models of hyperbilirubinemia
There are some examples of animal models in which hyperbilirubinemia is artificially
induced by bilirubin injection or by increasing haemolysis. These experimental
methodologies help the investigation of bilirubin toxicity mechanisms, providing in
vivo hyperbilirubinemic conditions and the related features of BIND and kernicterus.
For instance, Gao and colleagues generated high levels of bilirubin by directly
injecting bilirubin to mouse pups (intraperitoneal injection, i.p.) at postnatal day (P)
4 (Gao et al., 2011). More recently, Song and colleague generated a model of
hyperbilirubinemia by the injection of bilirubin in the cistern magna of rat pups (Song
et al., 2014), replicating kernicterus features.
Another model of neonatal jaundice was established by the administration of two
consecutive i.p. injections of phenylhydrazine (PHZ) to wild type mice, which caused
the increase in erythrocyte turnover leading to hyperbilirubinemia (Maity et al.,
2013).
In addition to these transient hyperbilirubinemic models, there are different genetic
models carrying the Ugt1 mutation that resemble the CNSI. These animal models
represent a strategic tool to understand the mechanism of bilirubin toxicity that
affects jaundiced newborns.
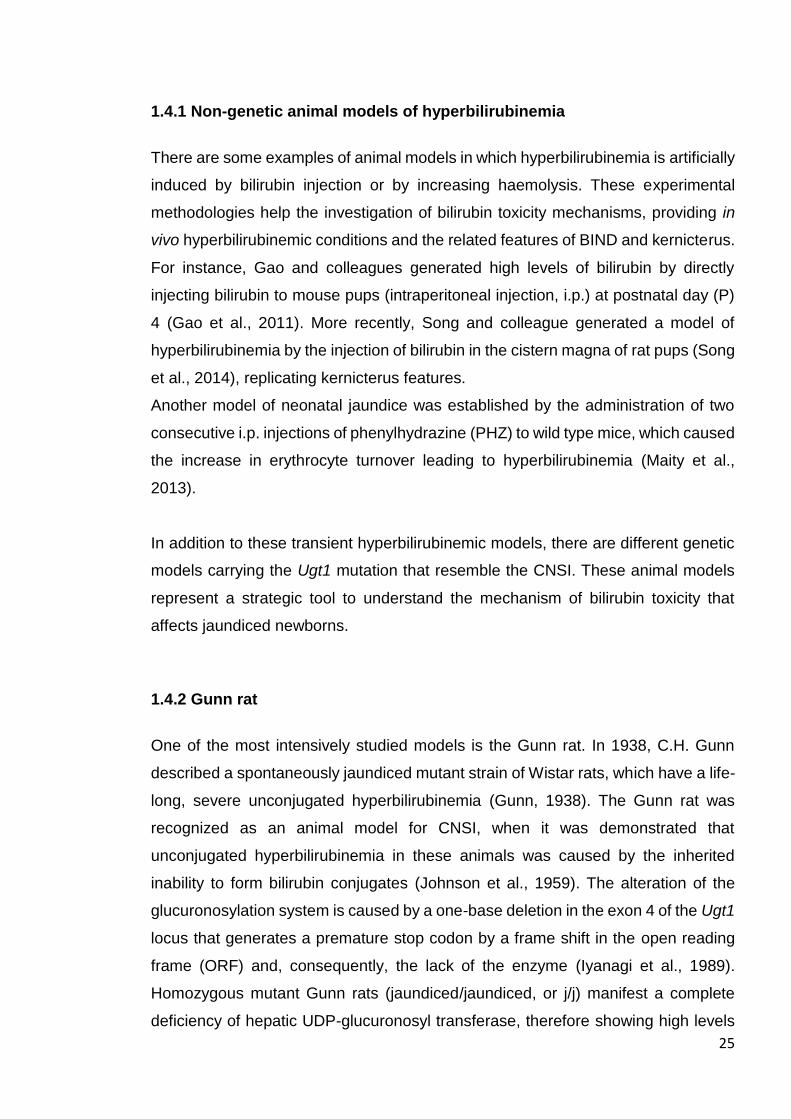
1.4.2 Gunn rat
One of the most intensively studied models is the Gunn rat. In 1938, C.H. Gunn
described a spontaneously jaundiced mutant strain of Wistar rats, which have a life-
long, severe unconjugated hyperbilirubinemia (Gunn, 1938). The Gunn rat was
recognized as an animal model for CNSI, when it was demonstrated that
unconjugated hyperbilirubinemia in these animals was caused by the inherited
inability to form bilirubin conjugates (Johnson et al., 1959). The alteration of the
glucuronosylation system is caused by a one-base deletion in the exon 4 of the Ugt1
locus that generates a premature stop codon by a frame shift in the open reading
frame (ORF) and, consequently, the lack of the enzyme (Iyanagi et al., 1989).
Homozygous mutant Gunn rats (jaundiced/jaundiced, or j/j) manifest a complete
deficiency of hepatic UDP-glucuronosyl transferase, therefore showing high levels
26
of UCB. Since jj rat pups develop jaundice early after birth, they present cerebellar
hypoplasia at P9, marked Granule cells (GCs) and Purkinje cells (PCs) loss and
reduction in the cerebellar layer thickness (Conlee and Shapiro, 1997). Moreover,
toxic bilirubin levels in Gunn rats cause alteration in BAEPs, underlining the brain
impairment (Rice and Shapiro, 2008).
Hence, the Gunn rat represents a good model of bilirubin encephalopathy, neonatal
jaundice and, specifically, CNSI (Chowdhury et al., 1993). However, the Gunn rat
reproduces only some of the features of genetic hyperbilirubinemia. In fact, jj
animals reach adulthood and are fertile if bilirubin levels remain unchallenged. Since
jj rats have a un-lethal hyperbilirubinemic phenotype, drugs are often used to
reproduce the acute hyperbilirubinemic condition, such as PHZ which increases
haemolysis or sulphadimethoxine (Sulpha), a drug that displaces bilirubin from
albumin in the circulation (Rice and Shapiro, 2008).
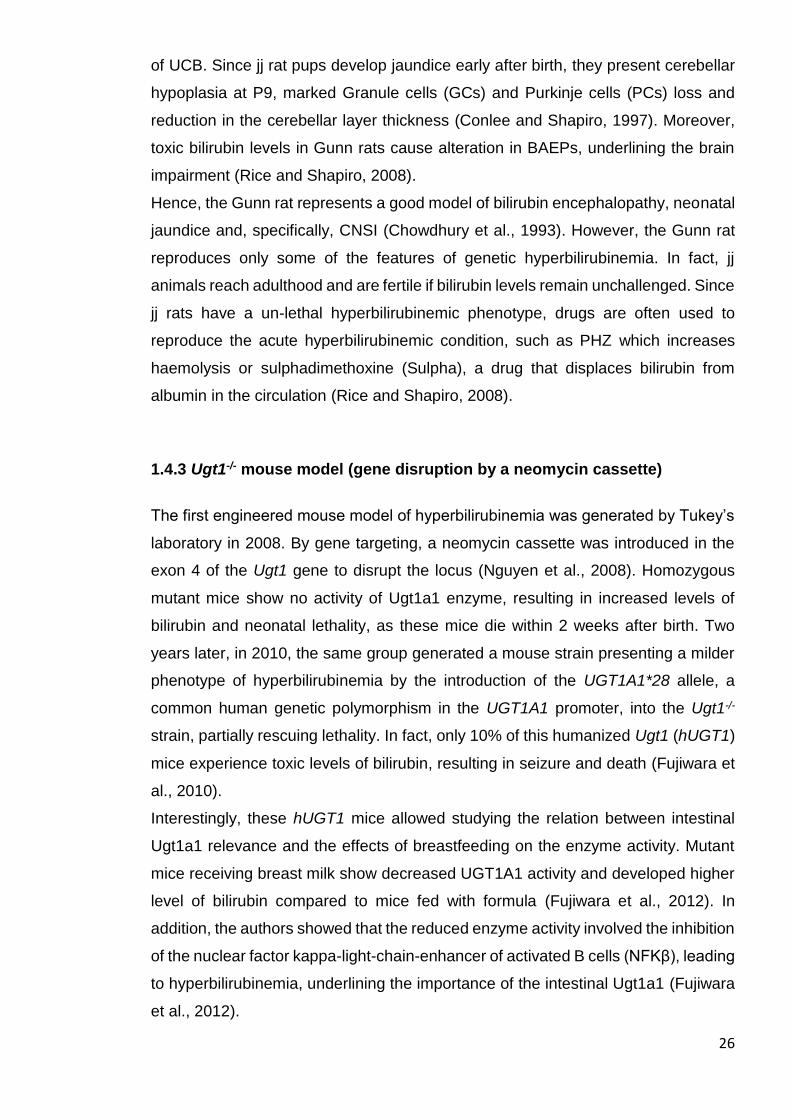
1.4.3 Ugt1-/- mouse model (gene disruption by a neomycin cassette)
The first engineered mouse model of hyperbilirubinemia was generated by Tukey’s
laboratory in 2008. By gene targeting, a neomycin cassette was introduced in the
exon 4 of the Ugt1 gene to disrupt the locus (Nguyen et al., 2008). Homozygous
mutant mice show no activity of Ugt1a1 enzyme, resulting in increased levels of
bilirubin and neonatal lethality, as these mice die within 2 weeks after birth. Two
years later, in 2010, the same group generated a mouse strain presenting a milder
phenotype of hyperbilirubinemia by the introduction of the UGT1A1*28 allele, a
common human genetic polymorphism in the UGT1A1 promoter, into the Ugt1-/-
strain, partially rescuing lethality. In fact, only 10% of this humanized Ugt1 (hUGT1)
mice experience toxic levels of bilirubin, resulting in seizure and death (Fujiwara et
al., 2010).
Interestingly, these hUGT1 mice allowed studying the relation between intestinal
Ugt1a1 relevance and the effects of breastfeeding on the enzyme activity. Mutant
mice receiving breast milk show decreased UGT1A1 activity and developed higher
level of bilirubin compared to mice fed with formula (Fujiwara et al., 2012). In
addition, the authors showed that the reduced enzyme activity involved the inhibition
of the nuclear factor kappa-light-chain-enhancer of activated B cells (NFKβ), leading
to hyperbilirubinemia, underlining the importance of the intestinal Ugt1a1 (Fujiwara
et al., 2012).
27
By Cre-mediated recombination, two conditional knockouts were generated by the
disruption of the Ugt1 locus in the liver (albumin-Cre) or in the intestine (villin-Cre),
to reveal the contribution of different organs to the bilirubin metabolism. Cre-
mediated recombination of the Ugt1F/F mice (Ugt1 intron 2 floxed/intron 4 floxed)
was used to generate hepatocytes (Ugt1ΔHep) or intestinal enterocytes (Ugt1ΔGI)
deficient in Ugt1a1 activity. Ugt1ΔHep mice show much lower bilirubin levels
compared to Ugt1-/- mice (TB was 2 vs 15 mg/dL, respectively), underling the
importance of extrahepatic UGT1A1 activity, while the intestinal KO of Ugt1 in
Ugt1ΔGI results in no abnormalities (Chen et al., 2013).
The hUGT1 mice were also used to underscore the importance of the inflammatory
response contribution, by mating them with a knock-out strain of the toll-like receptor
2 (TLR2). In fact, hUGT1 mice reveal the activation of inflammatory players in the
CNS, such as glia cells and inflammatory markers, while hUGT1/TLR2-/- mice show
the absence of neuro-inflammatory response that resulted in increased death rate
(Yueh et al., 2014). In addition, the analysis of hUGT1 animals is characterized by
the prevalence of astrocytes and microglia cells (Yueh et al., 2014). Two years later,
the same group generated a liver-specific conditional Ugt1a1 knockout mouse
model, in which mice develop kernicterus. Reduced myelination, accompanied by
increased astroglial and microglial reactivity, and marked PCs loss is observed in
these mice (Barateiro et al., 2016).
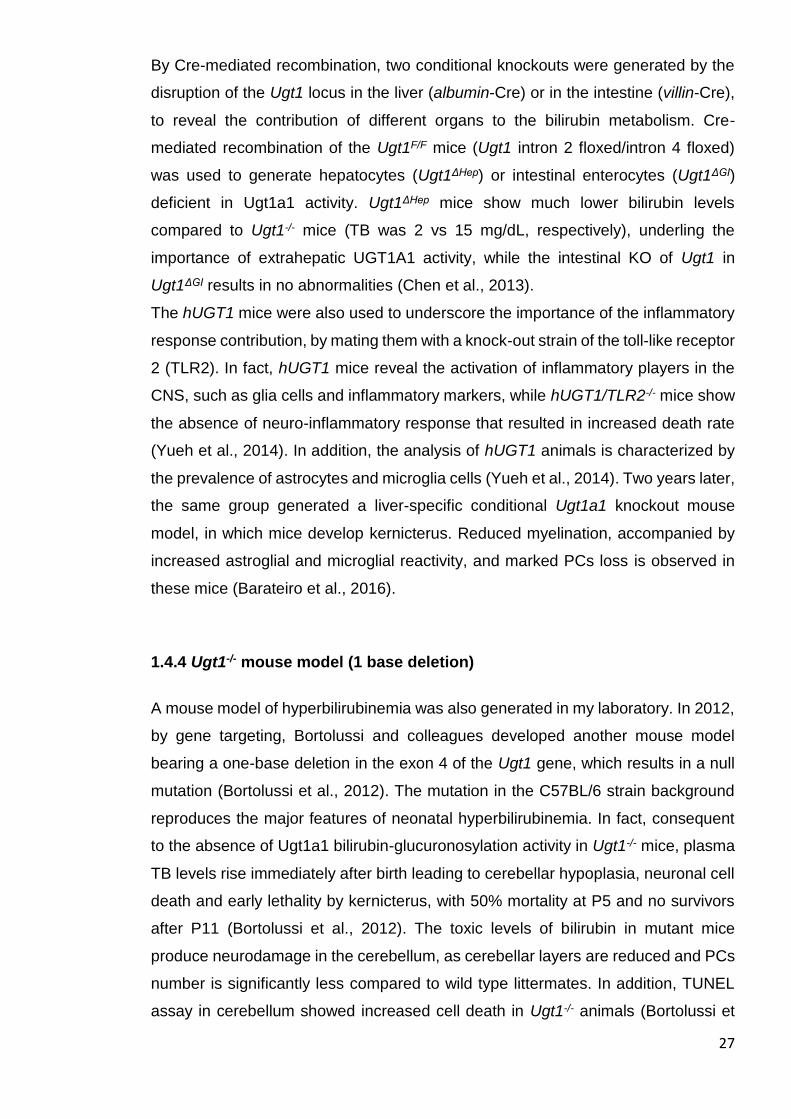
1.4.4 Ugt1-/- mouse model (1 base deletion)
A mouse model of hyperbilirubinemia was also generated in my laboratory. In 2012,
by gene targeting, Bortolussi and colleagues developed another mouse model
bearing a one-base deletion in the exon 4 of the Ugt1 gene, which results in a null
mutation (Bortolussi et al., 2012). The mutation in the C57BL/6 strain background
reproduces the major features of neonatal hyperbilirubinemia. In fact, consequent
to the absence of Ugt1a1 bilirubin-glucuronosylation activity in Ugt1-/- mice, plasma
TB levels rise immediately after birth leading to cerebellar hypoplasia, neuronal cell
death and early lethality by kernicterus, with 50% mortality at P5 and no survivors
after P11 (Bortolussi et al., 2012). The toxic levels of bilirubin in mutant mice
produce neurodamage in the cerebellum, as cerebellar layers are reduced and PCs
number is significantly less compared to wild type littermates. In addition, TUNEL
assay in cerebellum showed increased cell death in Ugt1-/- animals (Bortolussi et
28
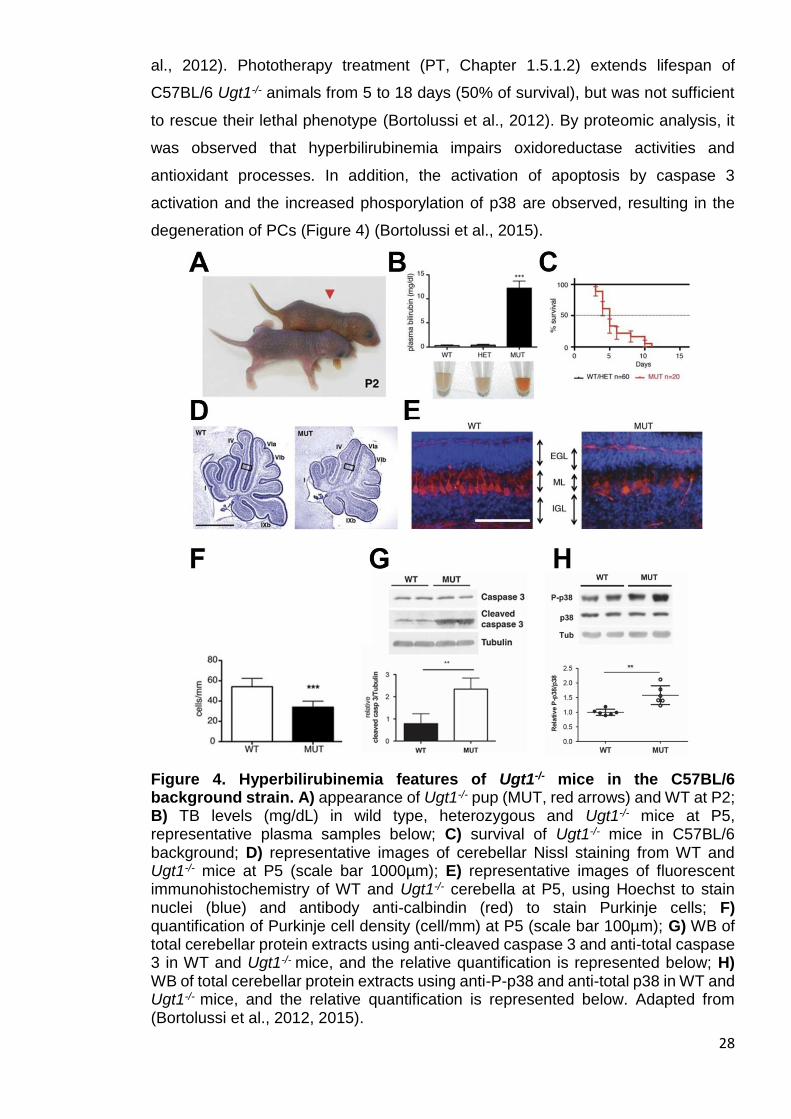
al., 2012). Phototherapy treatment (PT, Chapter 1.5.1.2) extends lifespan of
C57BL/6 Ugt1-/- animals from 5 to 18 days (50% of survival), but was not sufficient
to rescue their lethal phenotype (Bortolussi et al., 2012). By proteomic analysis, it
was observed that hyperbilirubinemia impairs oxidoreductase activities and
antioxidant processes. In addition, the activation of apoptosis by caspase 3
activation and the increased phosporylation of p38 are observed, resulting in the
degeneration of PCs (Figure 4) (Bortolussi et al., 2015).
Figure 4. Hyperbilirubinemia features of Ugt1-/- mice in the C57BL/6 background strain. A) appearance of Ugt1-/- pup (MUT, red arrows) and WT at P2; B) TB levels (mg/dL) in wild type, heterozygous and Ugt1-/- mice at P5, representative plasma samples below; C) survival of Ugt1-/- mice in C57BL/6 background; D) representative images of cerebellar Nissl staining from WT and Ugt1-/- mice at P5 (scale bar 1000µm); E) representative images of fluorescent immunohistochemistry of WT and Ugt1-/- cerebella at P5, using Hoechst to stain nuclei (blue) and antibody anti-calbindin (red) to stain Purkinje cells; F) quantification of Purkinje cell density (cell/mm) at P5 (scale bar 100µm); G) WB of total cerebellar protein extracts using anti-cleaved caspase 3 and anti-total caspase 3 in WT and Ugt1-/- mice, and the relative quantification is represented below; H) WB of total cerebellar protein extracts using anti-P-p38 and anti-total p38 in WT and Ugt1-/- mice, and the relative quantification is represented below. Adapted from (Bortolussi et al., 2012, 2015).
29
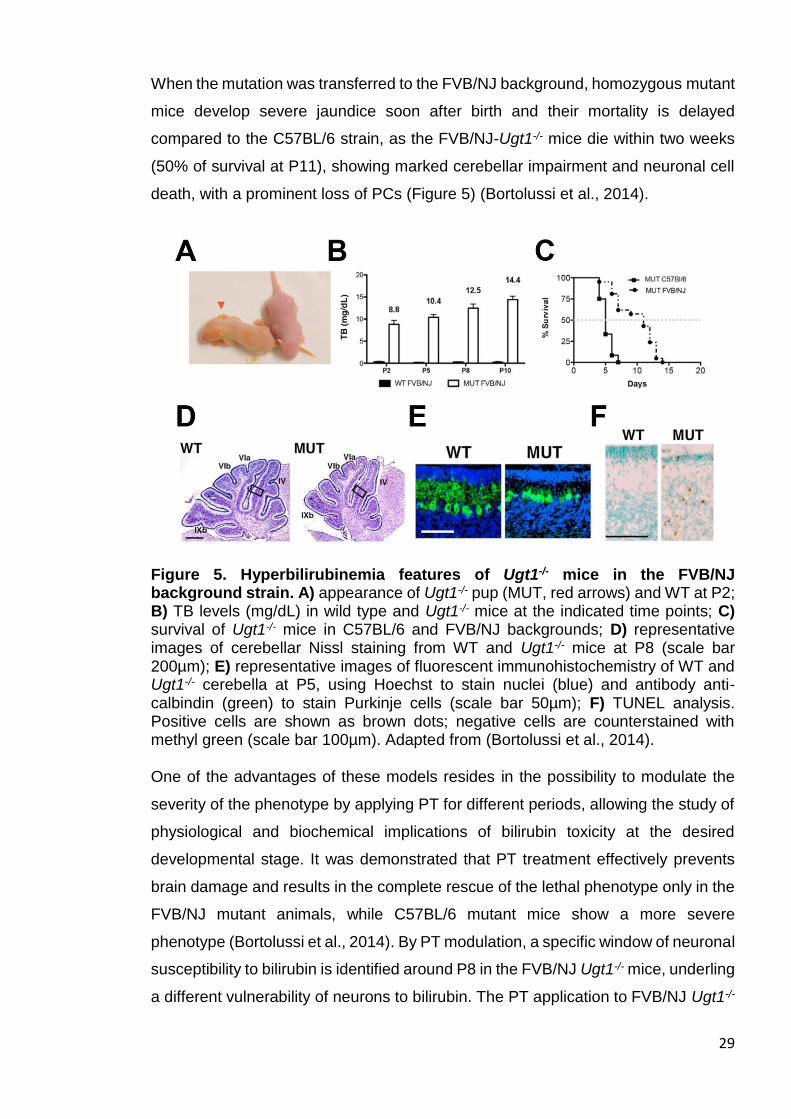
When the mutation was transferred to the FVB/NJ background, homozygous mutant
mice develop severe jaundice soon after birth and their mortality is delayed
compared to the C57BL/6 strain, as the FVB/NJ-Ugt1-/- mice die within two weeks
(50% of survival at P11), showing marked cerebellar impairment and neuronal cell
death, with a prominent loss of PCs (Figure 5) (Bortolussi et al., 2014).
Figure 5. Hyperbilirubinemia features of Ugt1-/- mice in the FVB/NJ background strain. A) appearance of Ugt1-/- pup (MUT, red arrows) and WT at P2; B) TB levels (mg/dL) in wild type and Ugt1-/- mice at the indicated time points; C) survival of Ugt1-/- mice in C57BL/6 and FVB/NJ backgrounds; D) representative images of cerebellar Nissl staining from WT and Ugt1-/- mice at P8 (scale bar 200µm); E) representative images of fluorescent immunohistochemistry of WT and Ugt1-/- cerebella at P5, using Hoechst to stain nuclei (blue) and antibody anti-calbindin (green) to stain Purkinje cells (scale bar 50µm); F) TUNEL analysis. Positive cells are shown as brown dots; negative cells are counterstained with methyl green (scale bar 100µm). Adapted from (Bortolussi et al., 2014). One of the advantages of these models resides in the possibility to modulate the
severity of the phenotype by applying PT for different periods, allowing the study of
physiological and biochemical implications of bilirubin toxicity at the desired
developmental stage. It was demonstrated that PT treatment effectively prevents
brain damage and results in the complete rescue of the lethal phenotype only in the
FVB/NJ mutant animals, while C57BL/6 mutant mice show a more severe
phenotype (Bortolussi et al., 2014). By PT modulation, a specific window of neuronal
susceptibility to bilirubin is identified around P8 in the FVB/NJ Ugt1-/- mice, underling
a different vulnerability of neurons to bilirubin. The PT application to FVB/NJ Ugt1-/-
30
from birth to P8 does not prevent bilirubin neurodegenerative features, while the
accumulation of BIND is not rescued when PT is applied from P8 to P20 (Bortolussi
et al., 2014).
In addition, the importance of Bf in the outcome of BIND and death was also showed
in FVB/NJ Ugt1-/- (see Results and Discussion Chapters for details).
1.5 Standard therapeutic treatments for hyperbilirubinemia
Several treatments have been proposed to avoid the risk of BIND. Standard
therapies focus on the reduction of toxic UCB levels.
1.5.1 Phenobarbital treatment
The first clinical distinction between Crigler-Najjar syndrome types I and II has been
based on the efficacy of phenobarbital therapy to lower plasma bilirubin levels.
Phenobarbital increases the expression of UGT1 genes (Argikar et al., 2009). In
CNSII patients, the basal residual UGT1A1 activity is increased by the
transcriptional induction of the UGT1A1 gene by phenobarbital, maintaining bilirubin
concentration below the neurotoxicity threshold (Jansen, 1999). Conversely,
hyperbilirubinemia is unchanged by this treatment in CNSI patients, as there are no
signs of increase in UGT1A1 activity. These patients are temporarily treated with
phototherapy (see Chapter 1.5.2), as its effectiveness is reduced with age. The only
causal treatment to cure CNSI, so far, is liver transplantation.
1.5.2 Phototherapy
Severe unconjugated hyperbilirubinemia is conventionally treated by intensive
phototherapy (PT). Light energy (emission range 400-525 nm, peak emission: 450-
460 nm) is absorbed by UCB as it circulates in skin capillaries, resulting in the
conversion of insoluble bilirubin into water-soluble photoisomers that can be
eliminated into the bile without the need of liver conjugation, or at smaller rate into
the urine (Maisels and McDonagh, 2008). PT is generally very effective to prevent
transient hyperbilirubinemia in healthy neonates, as the hepatic conjugation system
rapidly matures.
31
The timing of PT intervention impacts on the outcome of preterm at risk infants.
Indeed, the implementation of strategies to rapidly and effectively reduce the
excessive bilirubin load prior to the onset of neurologic signs would prevent chronic
post-icteric sequelae or kernicterus (Smitherman et al., 2006). Prophylactic
phototherapy helps to maintain a lower serum bilirubin concentration and may have
an effect on the rate of exchange transfusion. Despite PT effectiveness, the
condition of neonatal jaundice may still require additional, potentially dangerous,
exchange transfusion (ET, Chapter 1.5.4).
In Crigler–Najjar patients, the permanent unconjugated hyperbilirubinemia requires
a consistent number of hours of phototherapy treatment per day (12-14h). However,
there are different factors that affect the outcome of PT treatment with age, such as
the growth of skin thickness, the increased pigmentation and the increment in the
body surface/volume ratio. Thus, the blue light reaches the capillaries less
efficiently, decreasing the PT efficacy. CNSI patients respond temporarily to PT and
are at constant risk of developing brain damage unless liver transplantation is
performed (Fagiuoli et al., 2013).
Experimental evidences of beneficial PT effects were also observed in animal
models of hyperbilirubinemia. For instance, 24 hours of PT exposure between P4
and P11 prevent hypoplasia in the cerebellum of jj Gunn rat pups (Keino and
Kashiwamata, 1989), while in the FVB/NJ Ugt1-/- mouse model, 15 days of PT
application are necessary to completely rescue BIND and lethality (Bortolussi et al.,
2014). This variability of PT efficacy in rescuing cerebellar abnormalities underlines
the different degree of severity between the two hyperbilirubinemic models.
1.5.3 Immunoglobulins
As previously shown, blood incompatibility results in haemolysis and is, in
consequence, an important risk factor to develop jaundice (Chapter 1.3.1 and Table
1). The combination of PT with intravenous injections of immunoglobulins against
immune-mediated haemolysis (such as antibody against Rh or AB antigens) has
been exploited in cases of hyperbilirubinemia induced by Rh and/or ABO blood
incompatibility. It has been shown that intravenous immunoglobulin injections
significantly reduced the need for exchange transfusion and the duration of PT in
neonatal jaundice (Huizing et al., 2008).
32
1.5.4 Exchange transfusion
Jaundice is normally treated with PT, which has sufficient efficacy, convenience and
high safety. However, to prevent or reduce bilirubin-induced brain damage,
jaundiced infants who fail to respond to PT or are severely hyperbilirubinemic upon
first presentation are treated with the more invasive and dangerous alternative such
as exchange transfusion (ET). This procedure consists in the partial replacement of
the patient blood (hyperbilirubinemic blood, as in the case of neonatal jaundice) with
a compatible fresh one. ET is implemented only in specialized centres and carries
a significant risk of morbidity and mortality, such as biochemical and haematological
disturbances, vascular accidents, hypocalcaemia, necrotizing enterocollitis and
cardiac complications (American Academy of Pediatrics, 2004; Bhutani and Wong,
2013). The overall mortality rate from the procedure ranges between 0.3% and
0.7%, having high variability among the different centres, but it can reach up to 17%
in developing countries (Ibekwe et al., 2012). Adverse events, including catheter-
related complications, sepsis, and thrombocytopenia may amount up to 36%
(Davutoǧlu et al., 2010; Owa et al., 2009).
Schreuder and colleagues provided proofs of the ET effectiveness in Gunn rats,
showing that the combination of ET, PT and albumin administration strongly reduces
plasma bilirubin levels of jj rats (Schreuder et al., 2013a).
It is expected that ET lowers bilirubin levels in a sufficient and quick manner.
However, it has remained unclear whether ET could be successfully replaced by
other more effective and less invasive treatments.
1.6 Experimental treatments
Standard treatments are usually very effective. Nevertheless, specific cases may
require a different approach, in which experimental treatments may be combined
with standard therapies to improve the outcome of neonatal hyperbilirubinemia.
These experimental treatments can be divided in those pointing to avoid the toxic
accumulation of UCB and those which confer neuroprotection without affecting TB
levels
33
1.6.1 Orlistat and ursodeoxycholic acid
UCB can diffuse from the blood compartment into the intestinal lumen across the
intestinal mucosa and it can be reabsorbed from the intestinal lumen. A possible
implementation for standard therapies is the acceleration of UCB gastrointestinal
transit by enhancing the efficacy of transmucosal bilirubin disposal.
Orlistat and ursodeoxycholic acid (UDCA) are compounds designed to increase the
fecal disposal of UCB. The primary function of orlistat is to prevent the absorption
of fats from the diet, whereas UDCA reduces the rate at which the intestine absorbs
cholesterol molecules. It was shown that orlistat and UDCA administration lower
plasma UCB concentrations via the enhancement of fecal excretion of UCB–bile
salt complexes, being effective in bilirubin reduction in Gunn rats (Cuperus et al.,
2009; Hafkamp et al., 2005) and Crigler-Najjar patients (Hafkamp et al., 2007).
Further studies are needed to exclude long-term side effects of these drugs, as both
orlistat and UDCA showed hepatotoxic side effects, rising concerns of cost-
effectiveness.
1.6.2 Human serum albumin
Not all neonates with severe hyperbilirubinemia develop bilirubin encephalopathy.
Many factors may interact with the high TB concentrations, either preventing or
predisposing to kernicterus. Among these factors, human serum albumin (HSA)
plays an important role in the bilirubin pathway (Ahlfors, 2000; Dennery et al., 2001;
Poland, 2002). In fact UCB binds to serum albumin and, in this form, it is transported
to the liver. As long as the bilirubin is bound to albumin, UCB cannot cross the BBB
and enter the brain (Odell, 1973). When bilirubin-binding capacity provided by
plasma albumin is saturated, the unbound fraction (Bf), increases and accumulates
in lipophilic tissues. In principle, increasing the plasma-binding capacity to UCB
should mobilize bilirubin from tissues to plasma, preventing the neurodamage
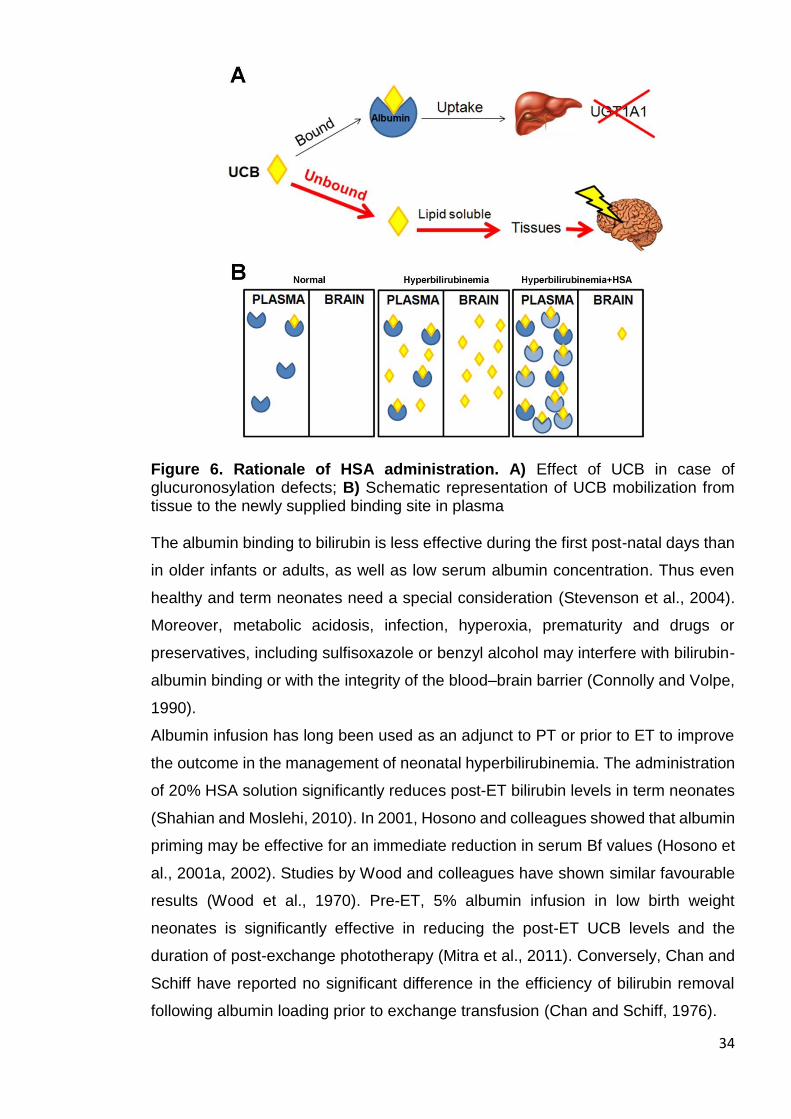
(Figure 6).
34
Figure 6. Rationale of HSA administration. A) Effect of UCB in case of glucuronosylation defects; B) Schematic representation of UCB mobilization from tissue to the newly supplied binding site in plasma The albumin binding to bilirubin is less effective during the first post-natal days than
in older infants or adults, as well as low serum albumin concentration. Thus even
healthy and term neonates need a special consideration (Stevenson et al., 2004).
Moreover, metabolic acidosis, infection, hyperoxia, prematurity and drugs or
preservatives, including sulfisoxazole or benzyl alcohol may interfere with bilirubin-
albumin binding or with the integrity of the blood–brain barrier (Connolly and Volpe,
1990).
Albumin infusion has long been used as an adjunct to PT or prior to ET to improve
the outcome in the management of neonatal hyperbilirubinemia. The administration
of 20% HSA solution significantly reduces post-ET bilirubin levels in term neonates
(Shahian and Moslehi, 2010). In 2001, Hosono and colleagues showed that albumin
priming may be effective for an immediate reduction in serum Bf values (Hosono et
al., 2001a, 2002). Studies by Wood and colleagues have shown similar favourable
results (Wood et al., 1970). Pre-ET, 5% albumin infusion in low birth weight
neonates is significantly effective in reducing the post-ET UCB levels and the
duration of post-exchange phototherapy (Mitra et al., 2011). Conversely, Chan and
Schiff have reported no significant difference in the efficiency of bilirubin removal
following albumin loading prior to exchange transfusion (Chan and Schiff, 1976).
35
Pre-clinical studies performed in adult Gunn rats demonstrated the short-term
efficacy of a single albumin infusion. The group of Dr. Verkade showed that HSA
efficiently lowers plasma Bf, brain bilirubin levels and prevents BAEPs (Cuperus et
al., 2013; Schreuder et al., 2013b). Thus, HSA infusion to treat severe
hyperbilirubinemic conditions may represent a safe and feasible approach. Deeper
investigations are needed to clarify the role of Bf and the long-term effectiveness of
HSA in tackling BIND during post-natal development of newborns at risk.
1.6.3 Minocycline
MNC is a second-generation tetracycline that has anti-inflammatory effects, which
appear to be completely separated and distinct from its anti-microbial action (Ryan
and Ashley, 1998). It is a small (495 kD), highly lipophilic molecule that crosses the
BBB better than other tetracyclines (Macdonald et al., 1973).
MNC is readily absorbed from the gut after oral ingestion and, because of its low
propensity to produce antibiotic resistance, it is commonly used in the management
of chronic conditions such as acne and rosacea. This compound is well tolerated in
teenagers and adults (according to registry records in the United Kingdom). For an
average of 9 months, over 6 million individuals have been treated with MNC to cure
acne. Overall, a good safety record for long-term clinical use has been established
for MNC, justifying its intensive use for over 40 years (Yong et al., 2004). However,
MNC has shown different side effects, such as hyperpigmentation, photosensibility,
vestibular defects, hypersensitivity and tooth discoloration (Smith and Leyden,
2005).
The anti-inflammatory properties of MNC have been reported in various
neurodegenerative conditions such as stroke (Yrjänheikki et al., 1999), Huntington’s
disease (HD) (Chen et al., 2000) and Parkinson’s disease (PD) (Wu et al., 2002),
especially by the inhibition of microglial inflammatory response. MNC exerts its anti-
inflammatory actions by modulating microglia, immune cell activation and
subsequent release of chemokines, lipid mediators of inflammation, matrix
metalloproteinases (MMPs) and nitric oxide (NO) but also pro-inflammatory
cytokines, such as tumor necrosis factor α (TNF-α), interleukin (IL) 1β (IL1β) and
IL6 that are produced by microglial cells, astrocytes, neutrophils and macrophages
(Stirling et al., 2005).
36
The neuroprotective properties of MNC have shown to be due in part to indirect
effects in inhibiting glial (astrocytic/microglial) caspase 1 and inducible nitric oxide
synthase (iNOS) activity (Wu et al., 2002; Yrjänheikki et al., 1999), although direct
neuroprotective effects have also been observed (Lin et al., 2001, 2003).
Apoptosis of both neurons and glia occurs in a variety of neurodegenerative
diseases and following CNS trauma (Ekshyyan and Aw, 2004). MNC is reported to
decrease apoptotic neuronal cell death observed in several experimental models of
neurodegeneration (Kim and Suh, 2009). In addition, MNC treatment delays
mortality in the R6/2 mouse model of HD and amyotrophic lateral sclerosis (ALS),
presumably by inhibiting caspase 1 and caspase 3 expression, as well as iNOS
activity and cytochrome c release (Huang et al., 2009; Zhu et al., 2002).
In 2005, Lin and colleagues reported the first evidence of the in vivo effect of MNC
on bilirubin-induced cerebellar hypoplasia, by the study of the Gunn rats. MNC
treatment of homozygous Gunn rat pups almost completely prevents cerebellar
hypoplasia and loss of cerebellar PCs and GCs, with no effect on total bilirubin
levels. Exposure of cerebellar granule neurons (CGNs) to bilirubin results in a time-
dependent phosphorylation of p38 mitogen-activated protein kinase (MAPK), which
is inhibited by MNC treatment, suggesting a role for p38 MAPK activation in bilirubin
neurotoxicity and the neuroprotective effects of MNC (Lin et al., 2005).
Further evidences on the effect of MNC on the attenuation of bilirubin neurotoxicity
have been provided by the group of Shapiro, by its work on Gunn rats. First, the
authors showed that MNC rescues bilirubin-induced alterations in acute BAEPs
(Geiger et al., 2007). Later, a time-dependent, graded, neuroprotective effect of
MNC was observed when the drug is administered after acute hyperbilirubinemia
obtained by PHZ/Sulpha induction (Rice et al., 2011).
Recently, MNC administration to Gunn rats showed the amelioration of behavioural
abnormalities. After MNC administration, it is observed the amelioration of
performance in the open field, social interaction and prepulse inhibition tests, also
underscoring the anti-psychotic effect of MNC (Liaury et al., 2014).
1.6.4 Other treatments
Other treatments have been experimented in combination with standard therapies
to avoid toxic bilirubin levels in neonatal jaundice.
37
A promising therapy is the inhibition of heme oxygenase 1 (HO1) by
metalloporphyrins (Mps). Mps target is the blockade of HO1 enzyme, which is the
rate-limiting enzyme in the pathway of bilirubin production. The clinical efficacy of
Mps is shown by the reduction of TB in neonatal haemolysis (Schulz et al., 2012).
However, Mps may affect other enzymes and have some side effects, such as
photosensibility, thus further studies on a modified version are required.
An additional experimentation on hyperbilirubinemia has been made by the use of
ethanol extracts of Phyllantus amarus root. The authors showed the efficacy of this
compound in reducing phenylhydrazine-induced neonatal jaundice in mice. In
particular, the bilirubin lowering effect is achieved by the presence of gallic acid
(Maity et al., 2013).
1.7 Mechanisms of bilirubin neurotoxicity
In this section, I will give an overview of the main mechanisms involved in bilirubin-
induced neurological dysfunction.
1.7.1 Neurodegeneration
Neurodegeneration is the umbrella term for the neuronal progressive loss of
structures or functions, including death. Since neurons renewal is tightly restricted,
once developed, neurodegeneration strongly impacts on the CNS. Nowadays, the
attention is mainly focused on conditions such as AD, HD, PD and ALS, which are
the most intensively studied neurodegenerative diseases (Brettschneider et al.,
2015).
However, in humans, many of the clinical and pathological features overlap between
the different neurodegenerative diseases, leading to a misdiagnosis of the disease,
but have neurodegeneration as a shared feature. To overcome such problems in
the phenotypic identification of neurodegenerative diseases, animal models are
useful tools to better characterize neurodegeneration (Harvey et al., 2012). Despite
the extensive efforts made to elucidate the effects, the causes of neurodegeneration
are often not completely understood and the identification of the key mechanisms
initiating the diseases remains unclear.
38
Neurodegenerative diseases are not the only conditions in which the functionality of
neurons is altered. In fact, neurodegeneration is also caused by all the events that
in turn affect the neuron integrity and development. For instance, the lack of oxygen
leads to dendrites loss and extensive fragmentation of the dendritic arbor (Wen et
al., 2013), as well as in traumatic brain injury (Petzold et al., 2011), resulting in
neuronal cell death.
High levels of bilirubin are also a cause of neurodegeneration. As mentioned before,
genetic and non-genetic alterations of the bilirubin metabolism result in high levels
of systemic UCB, affecting the developing CNS. Although transient, the
phenomenon of neonatal jaundice may result in neurotoxic levels of bilirubin, thus
affecting neurons. Neuronal cells are the target of bilirubin toxicity, due to the
capacity of the yellow pigment to bind cellular membranes, specially the myelin-rich
ones (Watchko and Tiribelli, 2013).
In fact, neurons are very susceptible to bilirubin, and UCB exposure causes the
impairment of cellular morphology, resulting in the reduction of nodes and neurites
extensions (Falcão et al., 2007; Vaz et al., 2010). Exposure to bilirubin also causes
cell death both by apoptosis and necrosis (Grojean et al., 2001; Silva et al., 2001).
The alteration of the redox status by UCB affects cellular viability (Tell and
Gustincich, 2009). In fact, the decrease of mitochondrial membrane potential leads
to cell energy failure producing the collapse of mitochondrial structures and the
release of cytochrome c, then activating caspases and consequentially the
programmed cell death (Rodrigues et al., 2002). Moreover, bilirubin has showed an
impact on PCs degeneration in different models of hyperbilirubinemia (Barateiro et
al., 2016; Bortolussi et al., 2012, 2014), and that the presynapsis of glutaminergic
neurons are impaired by UCB (Haustein et al., 2010), giving additional in vivo
evidences that bilirubin triggers neurodegeneration.
1.7.2 Oxidative stress
Oxidative stress is the result of the imbalance between the antioxidant defences in
favour of the production of reactive oxygen species (ROS, more in general, free
radicals) (Uttara et al., 2009). Free radicals are chemical species containing
unpaired electrons. They can be products of the aerobic respiration, by-products
released from chemical reactions or generated by external electromagnetic
radiation. The unpaired number of electrons confers instability to the free radicals,
39
which, in turn, achieve a stable state passing the unpaired electron to other
molecules. The interaction between free radicals and non-radicals molecules
creates a free radical chain reaction, in which the instability of unpaired electrons is
passed between molecules. If intense, the molecular instability may affect cellular
homeostasis by overcoming the mechanism to counteract this kind of stress. Within
cells, the excessive production of electrically instable molecules is avoided by the
mitochondrial cytochrome oxidase, which transports the electrons without the
release of reactive oxygen species. However, oxidative stress is detrimental for
cells, as the oxidation of proteins, lipids and DNA may damage those molecules.
The levels of intracellular ROS are tightly regulated by cells. To overcome
disproportionate free radicals production generated by toxic reactive oxygen
metabolites and H2O2, different enzymes are involved in antioxidant defensive
mechanisms, such as superoxide dismutase (SOD), glutathione peroxidase,
catalase, thioredoxin and glutathione transferases, and HO1 (Cho et al., 2002).
Moreover, non-enzymatic antioxidant molecules contribute to the protection from
ROS. These compounds include β-carotene, vitamins C and E, uric acid and a
tripeptide made of glutamine-cysteine-glycine (Birben et al., 2012).
One of the most intensively studied genes involved in the oxidative stress response
is nuclear factor (erythroid-derived 2)-like 2 (Nrf2). When cells detect the stress, Nrf2
is activated and translocates from the cytoplasm into the nucleus, where it binds to
the antioxidant response elements (ARE) in the upstream region of antioxidant
genes, such as glutathione transferases and oxidoreductases and HO1 (Nguyen et
al., 2003, 2009). Being an antioxidant enzyme, HO1 provides an important
contribution in the bilirubin context, as it is a rate-limiting enzymes of the heme
catabolism.
Mildly elevated bilirubin concentrations are considered beneficial, since UCB has
antioxidant and cytoprotective properties (Stocker et al., 1987). However, high
levels of bilirubin result in oxidative stress. In vitro experiments have shown that
oxidative stress is a major mechanism involved in bilirubin neurotoxicity. ROS
excess affects mitochondrial metabolism and glutathione homeostasis (Giraudi et
al., 2011), generating cellular energetic crisis and the release of cytochrome c
(Rodrigues et al., 2000) and Ca2+ perturbation (Stoeckius et al., 2012). The
exposure of synaptosomes extracted from adult gerbils to bilirubin revealed the
enhanced production of ROS, protein oxidation and lipid peroxidation (Brito et al.,
2004). Similar results are highlighted in immortalized hepatoma cell lines, in which
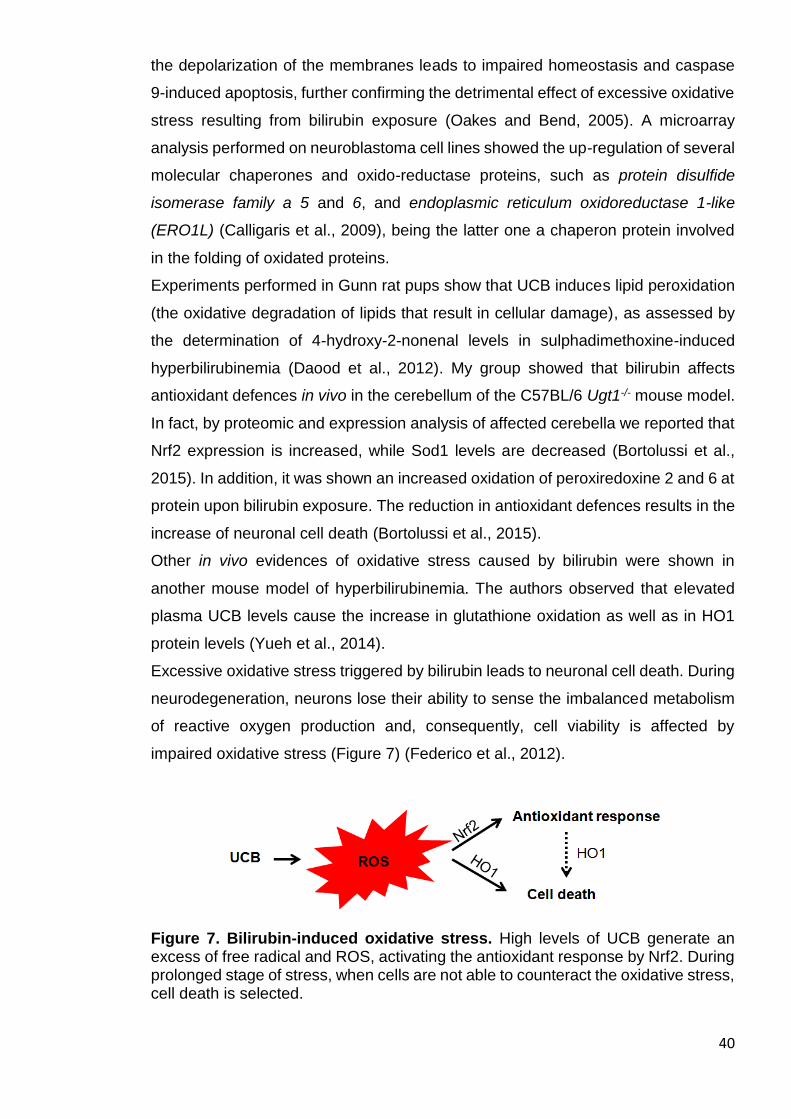
40
the depolarization of the membranes leads to impaired homeostasis and caspase
9-induced apoptosis, further confirming the detrimental effect of excessive oxidative
stress resulting from bilirubin exposure (Oakes and Bend, 2005). A microarray
analysis performed on neuroblastoma cell lines showed the up-regulation of several
molecular chaperones and oxido-reductase proteins, such as protein disulfide
isomerase family a 5 and 6, and endoplasmic reticulum oxidoreductase 1-like
(ERO1L) (Calligaris et al., 2009), being the latter one a chaperon protein involved
in the folding of oxidated proteins.
Experiments performed in Gunn rat pups show that UCB induces lipid peroxidation
(the oxidative degradation of lipids that result in cellular damage), as assessed by
the determination of 4-hydroxy-2-nonenal levels in sulphadimethoxine-induced
hyperbilirubinemia (Daood et al., 2012). My group showed that bilirubin affects
antioxidant defences in vivo in the cerebellum of the C57BL/6 Ugt1-/- mouse model.
In fact, by proteomic and expression analysis of affected cerebella we reported that
Nrf2 expression is increased, while Sod1 levels are decreased (Bortolussi et al.,
2015). In addition, it was shown an increased oxidation of peroxiredoxine 2 and 6 at
protein upon bilirubin exposure. The reduction in antioxidant defences results in the
increase of neuronal cell death (Bortolussi et al., 2015).
Other in vivo evidences of oxidative stress caused by bilirubin were shown in
another mouse model of hyperbilirubinemia. The authors observed that elevated
plasma UCB levels cause the increase in glutathione oxidation as well as in HO1
protein levels (Yueh et al., 2014).
Excessive oxidative stress triggered by bilirubin leads to neuronal cell death. During
neurodegeneration, neurons lose their ability to sense the imbalanced metabolism
of reactive oxygen production and, consequently, cell viability is affected by
impaired oxidative stress (Figure 7) (Federico et al., 2012).
Figure 7. Bilirubin-induced oxidative stress. High levels of UCB generate an excess of free radical and ROS, activating the antioxidant response by Nrf2. During prolonged stage of stress, when cells are not able to counteract the oxidative stress, cell death is selected.

41
1.7.3 ER stress
The endoplasmic reticulum (ER) is a cell organelle involved in protein and lipid
synthesis, composed by a network of branching tubules and sacs. It is contiguous
to the nuclear envelope, and is present in the cytoplasm of all eukaryotic cells. Also,
the ER is a dynamic store of calcium. Modifications of the cellular stability lead to an
excess of unfolded proteins, a condition named ER stress, causing an accumulation
of misfolded proteins.
The ER has a unique oxidizing-folding environment, and ROS may also come from
the alteration of this cellular compartment, underlining a tight connection between
oxidative stress and the ER.
During the initial phases of the loss of balance, cells activate a pro-survival pathway
called unfolded protein response (UPR). Depending on the insult, the ER stress
response takes place by the activation of one of the three major proteins (or the
combination):
a) inositol requiring 1 (IRE1),
b) protein kinase RNA-like endoplasmic reticulum kinase (PERK)
c) activating transcription factor 6 (ATF6).
Each of the three main proteins has a different network cascade, and the activation
of a preferential pathway is the result of different stresses (Doyle et al., 2011). In
any case the aim of this activation is to reinstate the normal condition. The UPR
activation delays the translation process to clear unfolded proteins and, at the same
time, to induce the expression of genes involved in cell survival and protein
degradation.
ER stress stimuli, such as the accumulation of unfolded proteins, cause the
dissociation of an ER chaperone, glucose-regulated protein 78 (GRP78), from IRE1,
PERK and ATF6, leading to the activation of the ER stress pathway (Doyle et al.,
2011). GRP78 is also bound to the newly synthesized proteins, maintaining them in
a competent state to allow the correct folding.
Generally, all these ER stress response pathways aim to restore the normal
functionality of cells by the activation of UPR target genes. However, a sustained
ER stress condition makes cells unable to reach back a steady state over time. In
this case, the accumulation of unfolded proteins culminates with the activation of
the apoptotic pathway. For instance, the activation of the two mediators C/EBP-
Homologous Protein (CHOP) and cluster of differentiation (CD) 95/Fas (CD95/Fas)
is involved in the apoptosis pathways selection through the activation of caspases
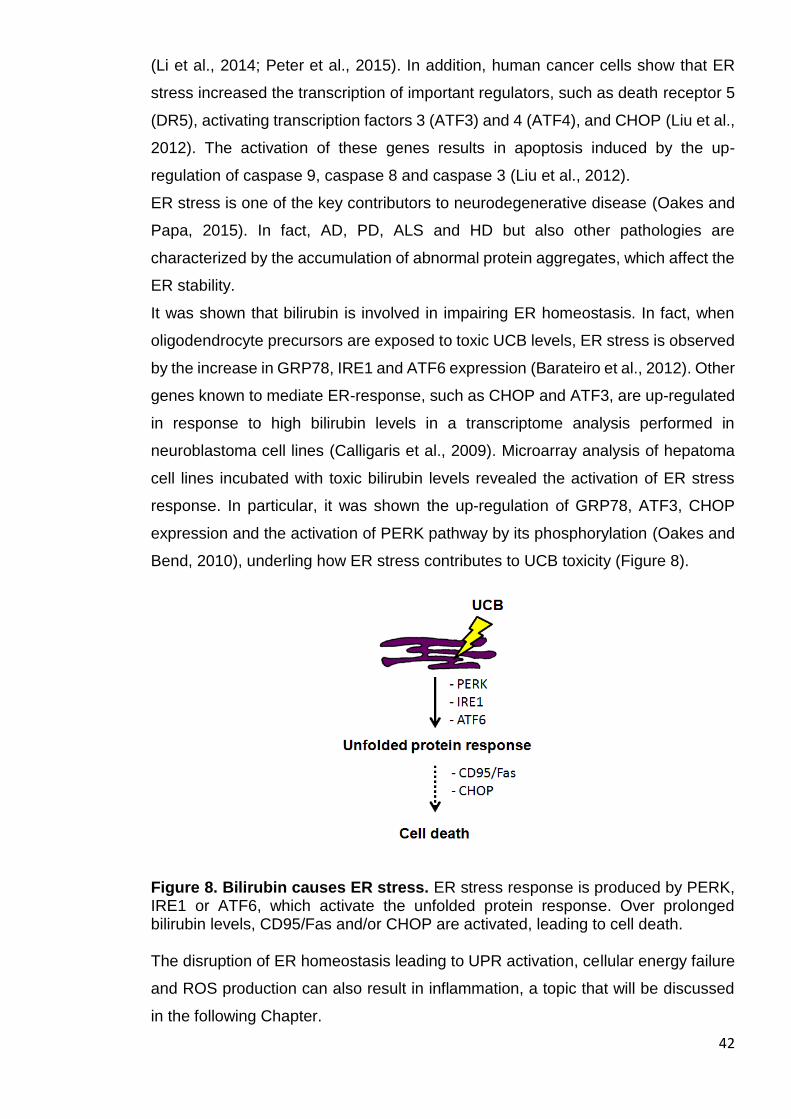
42
(Li et al., 2014; Peter et al., 2015). In addition, human cancer cells show that ER
stress increased the transcription of important regulators, such as death receptor 5
(DR5), activating transcription factors 3 (ATF3) and 4 (ATF4), and CHOP (Liu et al.,
2012). The activation of these genes results in apoptosis induced by the up-
regulation of caspase 9, caspase 8 and caspase 3 (Liu et al., 2012).
ER stress is one of the key contributors to neurodegenerative disease (Oakes and
Papa, 2015). In fact, AD, PD, ALS and HD but also other pathologies are
characterized by the accumulation of abnormal protein aggregates, which affect the
ER stability.
It was shown that bilirubin is involved in impairing ER homeostasis. In fact, when
oligodendrocyte precursors are exposed to toxic UCB levels, ER stress is observed
by the increase in GRP78, IRE1 and ATF6 expression (Barateiro et al., 2012). Other
genes known to mediate ER-response, such as CHOP and ATF3, are up-regulated
in response to high bilirubin levels in a transcriptome analysis performed in
neuroblastoma cell lines (Calligaris et al., 2009). Microarray analysis of hepatoma
cell lines incubated with toxic bilirubin levels revealed the activation of ER stress
response. In particular, it was shown the up-regulation of GRP78, ATF3, CHOP
expression and the activation of PERK pathway by its phosphorylation (Oakes and
Bend, 2010), underling how ER stress contributes to UCB toxicity (Figure 8).
Figure 8. Bilirubin causes ER stress. ER stress response is produced by PERK, IRE1 or ATF6, which activate the unfolded protein response. Over prolonged bilirubin levels, CD95/Fas and/or CHOP are activated, leading to cell death. The disruption of ER homeostasis leading to UPR activation, cellular energy failure
and ROS production can also result in inflammation, a topic that will be discussed
in the following Chapter.
43
1.7.4 Neuroinflammation
Neuroinflammation is used to describe the general inflammatory state that involves
the brain and the spinal cord. Different factors mediate the degree of
neuroinflammation, such as cytokines, chemokines, ROS and secondary
messengers, but also the context, the nature of the insult and the duration of the
inflammatory stimulus.
The CNS immune surveillance is provided mainly by CNS glia cells (microglia,
astrocytes, macrophages and oligodendrocytes), but also by endothelial cells. The
role of CNS inflammation is intended as protective, aiming to solve the impaired
status generated by the stressor agents. However, prolonged neuroinflammatory
response activation may exacerbate and amplify the damage by further increasing
the activation of glia cells.
Microglia cells/macrophages migrating at the site of the injury can exert the opposite
roles of repairing the damage or its intensification, depending on their activation
status. The polarization of microglia/macrophages is important to define the different
reactions at the site of interest. Once activated, glia cells produce different stimuli
that define the neuroinflammatory responses. In fact, different types of peripheral
macrophages have distinct functions depending on the surrounding environment
and the duration of the injury: the inflammatory macrophages (M1 type microglia)
and the anti-inflammatory macrophages (M2 type microglia). As a consequence,
after an acute injury, the ratio of M1 and M2 microglia determines the direction of
the response, whether pro-inflammatory or neuroprotective. The pro-inflammatory
M1 phenotype is commonly associated with clearance of dead tissue (Kigerl et al.,
2009; Martinez et al., 2006), while M2 neuroprotective macrophages facilitate the
control and repair/regeneration of injured tissues, partially by reducing the
inflammatory mediators (Kigerl et al., 2009; Martinez et al., 2006) (Table 3).
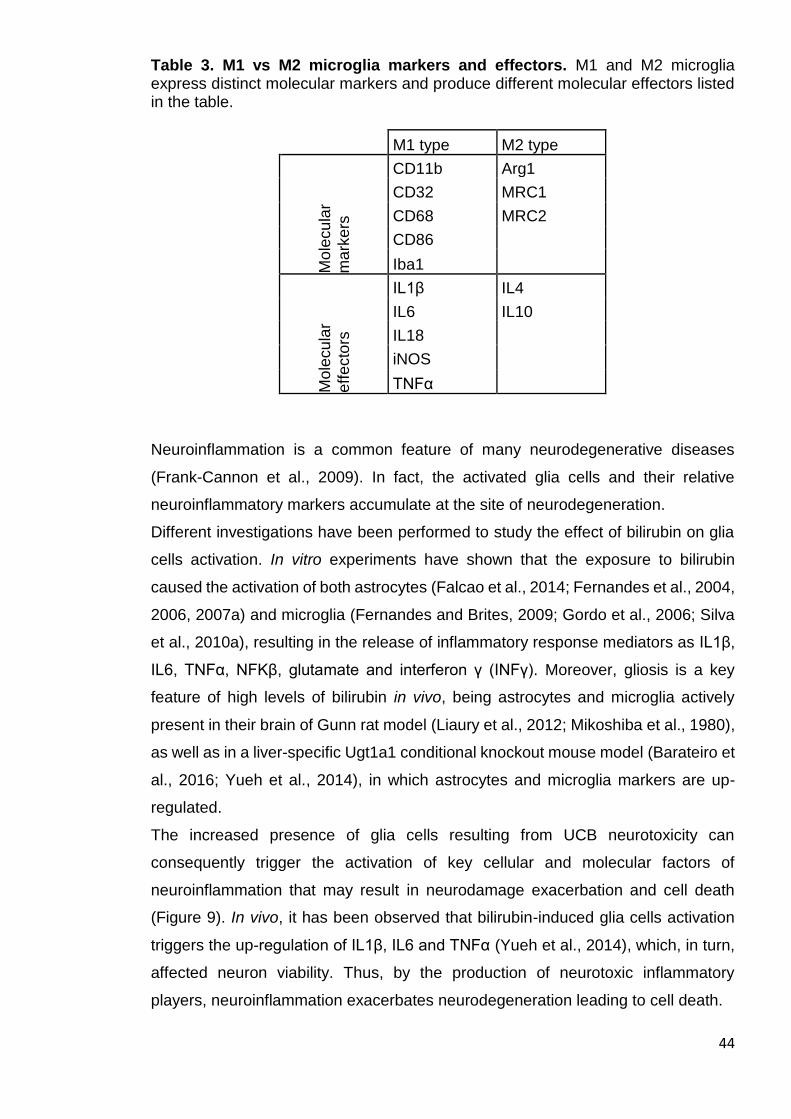
44
Table 3. M1 vs M2 microglia markers and effectors. M1 and M2 microglia express distinct molecular markers and produce different molecular effectors listed in the table.
M1 type M2 type
Mo
lecu
lar
ma
rkers
CD11b Arg1
CD32 MRC1
CD68 MRC2
CD86
Iba1
Mo
lecu
lar
eff
ecto
rs
IL1β IL4
IL6 IL10
IL18
iNOS
TNFα
Neuroinflammation is a common feature of many neurodegenerative diseases
(Frank-Cannon et al., 2009). In fact, the activated glia cells and their relative
neuroinflammatory markers accumulate at the site of neurodegeneration.
Different investigations have been performed to study the effect of bilirubin on glia
cells activation. In vitro experiments have shown that the exposure to bilirubin
caused the activation of both astrocytes (Falcao et al., 2014; Fernandes et al., 2004,
2006, 2007a) and microglia (Fernandes and Brites, 2009; Gordo et al., 2006; Silva
et al., 2010a), resulting in the release of inflammatory response mediators as IL1β,
IL6, TNFα, NFKβ, glutamate and interferon γ (INFγ). Moreover, gliosis is a key
feature of high levels of bilirubin in vivo, being astrocytes and microglia actively
present in their brain of Gunn rat model (Liaury et al., 2012; Mikoshiba et al., 1980),
as well as in a liver-specific Ugt1a1 conditional knockout mouse model (Barateiro et
al., 2016; Yueh et al., 2014), in which astrocytes and microglia markers are up-
regulated.
The increased presence of glia cells resulting from UCB neurotoxicity can
consequently trigger the activation of key cellular and molecular factors of
neuroinflammation that may result in neurodamage exacerbation and cell death
(Figure 9). In vivo, it has been observed that bilirubin-induced glia cells activation
triggers the up-regulation of IL1β, IL6 and TNFα (Yueh et al., 2014), which, in turn,
affected neuron viability. Thus, by the production of neurotoxic inflammatory
players, neuroinflammation exacerbates neurodegeneration leading to cell death.
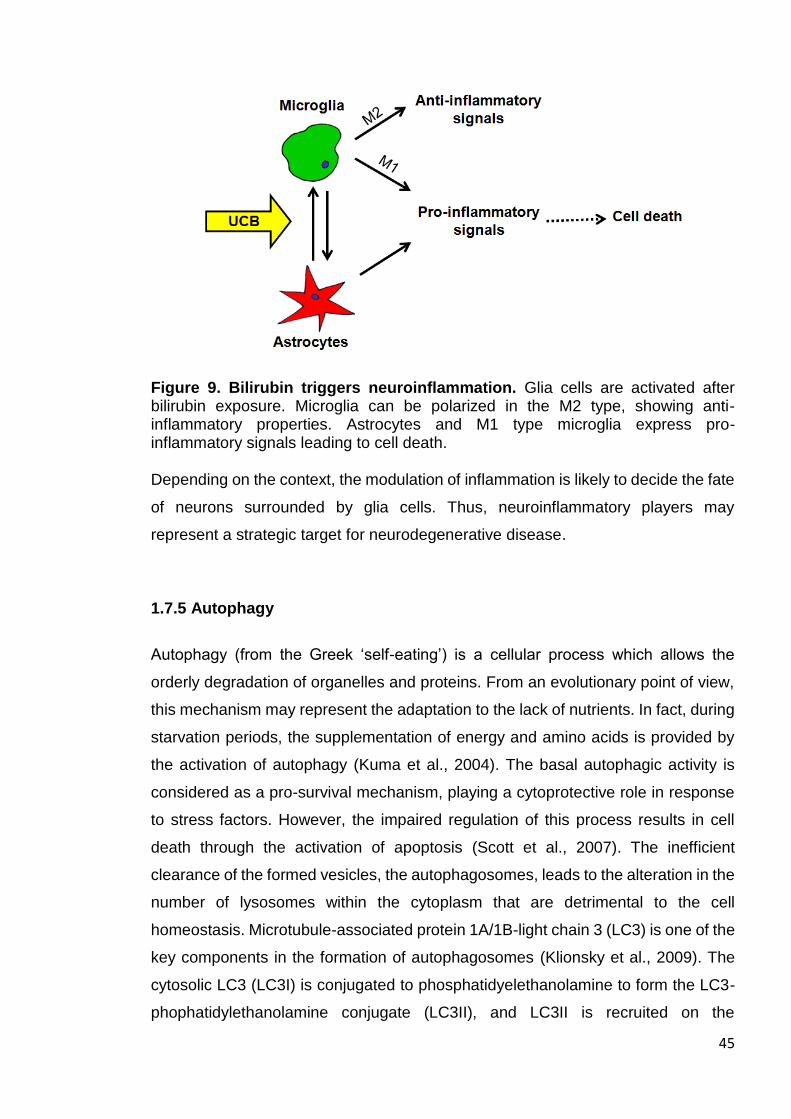
45
Figure 9. Bilirubin triggers neuroinflammation. Glia cells are activated after bilirubin exposure. Microglia can be polarized in the M2 type, showing anti-inflammatory properties. Astrocytes and M1 type microglia express pro-inflammatory signals leading to cell death. Depending on the context, the modulation of inflammation is likely to decide the fate
of neurons surrounded by glia cells. Thus, neuroinflammatory players may
represent a strategic target for neurodegenerative disease.
1.7.5 Autophagy
Autophagy (from the Greek ‘self-eating’) is a cellular process which allows the
orderly degradation of organelles and proteins. From an evolutionary point of view,
this mechanism may represent the adaptation to the lack of nutrients. In fact, during
starvation periods, the supplementation of energy and amino acids is provided by
the activation of autophagy (Kuma et al., 2004). The basal autophagic activity is
considered as a pro-survival mechanism, playing a cytoprotective role in response
to stress factors. However, the impaired regulation of this process results in cell
death through the activation of apoptosis (Scott et al., 2007). The inefficient
clearance of the formed vesicles, the autophagosomes, leads to the alteration in the
number of lysosomes within the cytoplasm that are detrimental to the cell
homeostasis. Microtubule-associated protein 1A/1B-light chain 3 (LC3) is one of the
key components in the formation of autophagosomes (Klionsky et al., 2009). The
cytosolic LC3 (LC3I) is conjugated to phosphatidyelethanolamine to form the LC3-
phophatidylethanolamine conjugate (LC3II), and LC3II is recruited on the

46
autophagosome. The fusion between autophagosomes with lysosomes generates
the autolysosomes, and the hydrolases degrade the vesicle contents (Tanida et al.,
2008). Hence, the ratio of LC3 isoforms represents a reliable marker to detect
vesicles turnover.
Interestingly, mis-regulation of autophagy is involved in many different
neurodegenerative disease, such as spinocerebellar ataxia, PD and HD
(Rubinsztein et al., 2005).
In the context of bilirubin, few in vitro experiments showed the implication of
autophagy activation in response to toxic bilirubin levels. Neuroblastoma cell lines
incubated with bilirubin show the increased expression of regulation involved in the
autophagic pathway, corresponding to the increase of important autophagy
regulators (Calligaris et al., 2009). More recently, Palmela and colleagues showed
the increase of LC3 ratio in brain microvascular endothelial cell (BMEC) cultures
exposed to toxic bilirubin levels (Palmela et al., 2012). However, the two
experiments underlined how this mechanism is activated only after prolonged
bilirubin exposure, such as at the latest analysed time points.
So far, the role of autophagy was not investigated in vivo, thus further experiments
are needed to elucidate the impact of autophagy in the developing brain exposed to
bilirubin.
47
AIM OF THE THESIS
The aim of my PhD Thesis has been to characterize the bilirubin-induced
neurological damage in vivo and to better understand the mechanisms of bilirubin
neurotoxicity by the application of two different pharmacological treatments, such
as the infusion of human serum albumin and the administration of MNC.
Since neonatal hyperbilirubinemia and the consequent death by kernicterus are still
a concern, especially in low- and middle-income countries, a detailed description of
the events leading to bilirubin neurotoxicity and death will give a further contribution
to prevent the disease.
Taking advantage of the FVB/NJ Ugt1-/- mouse model, which resembles the human
neonatal hyperbilirubinemia, it will be shown that free bilirubin is the cause of
irreversible brain damage and death, and that these events can be prevented by
increasing the bilirubin binding capacity in plasma.
Furthermore, I will elucidate the time-course of the molecular events at the onset of
the neuropathological changes triggered by bilirubin.
Finally, I will use a neuroprotective and anti-inflammatory agent to explore the role
of inflammation in the bilirubin neurotoxicity process.

48
MATERIALS AND METHODS
49
2.1 Chemicals and standard solutions:
2-butanol (Sigma-Aldrich)
Acetic acid (Sigma-Aldrich)
Albuman® (Sanquin, Amsterdam, the Netherlands)
Ascorbic acid (Sigma-Aldrich)
Bromo Cresol Green (Sigma-Aldrich)
Blue bromo Phenol (Sigma-Aldrich)
CCl4 (Sigma-Aldrich)
Cresyl violet (Sigma-Aldrich)
dNTPs (Rovalab GmbH)
DOC (Sigma-Aldrich)
EDTA (Sigma-Aldrich)
EGTA (Sigma-Aldrich)
Ethanol (Sigma-Aldrich)
Glycine (Sigma-Aldrich)
Heparin (Sigma-Aldrich)
HPO4 (Sigma-Aldrich)
KCl (Sigma-Aldrich)
KH2PO4 (Sigma-Aldrich)
Methanol (Sigma-Aldrich)
Minocin® (Teofarma, Pavia, Italy)
Na2, HPO4 (Sigma-Aldrich)
Na3VO4 (Sigma-Aldrich)
NaCl (Sigma-Aldrich)
NaN3 (Sigma-Aldrich)
NaF (Sigma-Aldrich)
NaPiro-P (Sigma-Aldrich)
NP-40 (Sigma-Aldrich)
PFA (Sigma-Aldrich)
phosphoSTOP (Roche)
Proteinase K (Roche)
SDS (Sigma-Aldrich)
SIGMAFAST protease inhibitors (Sigma-Aldrich)
50
Succinic acid (Sigma-Aldrich)
Sodium tetraborate (Sigma-Aldrich)
Tris (Invitrogen)
Triton-X 100 (Sigma-Aldrich)
Tween 20 (Sigma-Aldrich)
Xilene (Sigma-Aldrich)
10x protein loading buffer: 20 % SDS, 1 M DTT, 0.63 M Tris pH 7.0, 20 % BBP
(dissolved in 60 % sucrose), 10 mM EDTA;
BCG solution: 26,2 mg of bromo cresol green, 24,4 mg of NaN3, 2,214 g of Succinic
Acid and 1 mL of Triton X-100 dissolved in 250 mL of dH2O, pH 4.2;
Blotting Solution 1: 200 mM Tris, 10 % v/v Met-OH;
Blotting Solution 2: 25 mM Tris, 10 % v/v Met-OH;
Blotting Solution 3: 25 mM Tris, 40 mM Glycine 10 % v/v Met-OH;
Cresyl violet solution: 5 mg/mL cresyl violet in 0.3 % glacial acetic acid;
gDNA extraction buffer: 100 mM Tris pH 8.0, 5 mM EDTA pH 8.0, 0.2 % SDS, 200
mM NaCl and 100 µg/mL proteinase K;
PBS: 137 mM NaCl, 10 mM Na2, HPO4, 2.7 mM KCl, 2 mM KH2PO4, pH 7.4;
Perfusion solution: NaCl 0.9% w/v, 500 IU/mL heparin, 1 mg/mL ascorbic acid, 1
mg/mL EDTA;
Protein buffer: 150 mM NaCl, 1% NP-40, 0.5% DOC, 0.1% SDS, 50 mM Tris HCl
pH 8.0, 2x protease inhibitors, 1 mM EGTA, 1 mM Na3VO4, 1 mM NaF, 1 mM
NaPiro-P, 10 nM phosphoSTOP;
Running buffer 5X for SDS page: 30 g Tris, 147 g Glycine, 5 g SDS, dH2O up to
1 L;
TBE buffer 5X: 1.1 M Tris, 900 mM Borate, 25 mM EDTA, pH 8.3;
TBS 1X: 50 mM Tris, 150 mM NaCl, pH 7.6, dH2O up to 1 L;
TE Buffer: 10 mM Tris pH 8, 0.1 mM EDTA.
2.2 Animals
Ugt1-/- in FVB/NJ background was previously generated in Mouse Molecular
Genetics group at the ICGEB (Bortolussi et al., 2014). Animals used in this study
were at least 99.8% FVB/NJ genetic background, obtained after more than ten

51
backcrosses with wild type FVB/NJ mice. Homozygous mutant animals (Ugt1-/-)
were obtained from heterozygous (Ugt1+/-) mating. Wild type (WT or Ugt1+/+)
littermates were used as control. Average litters were of 9-10 pups and loss of pups
was not observed. Mice were housed and handled according to institutional
guidelines, and experimental procedures approved by the International Centre for
Genetic Engineering and Biotechnology (ICGEB) board, with the full respect of the
EU Directive 2010/63/EU for animal experimentation. Mice were maintained at the
ICGEB bio-experimentation facility in a temperature controlled environment with
12/12h hours of light/dark cycles and received a standard chow diet and water ad
libitum.
2.3 Genomic DNA extraction from mouse tail biopsies
To obtain genomic DNA (gDNA) from tail biopsies, tissue from mice was digested
overnight at 55°C in 600 µL of gDNA extraction buffer. The next day, dissolved tails
were centrifuged for 15 min at 13200 rpm (Eppendorf 5145D, max. speed), and
supernatant was transferred into a new tube and precipitated with an equal volume
of 2-propanol. Tubes were centrifuged for 10 min at 13200 rpm, supernatant was
discarded and pellets were rinsed once with 70% Et-OH. After 5 min centrifugation
at 13200 rpm, pellets were air-dried and re-suspended with an appropriate volume
of TE buffer. Solutions containing gDNA were then transferred to 65°C for 1 hour to
facilitate dissolving. The gDNA was stored at room temperature until further use.
2.4 Polymerase chain reaction protocol to detect and discriminate different
genotypes
GoTaq® Flexi DNA polymerase (Promega) was used for genotyping purposes.
Polymerase chain reaction (PCR) was performed in 20 µL volume, 0.5 µL of gDNA
were added. The PCR mix was composed as described below:
4 µL of 5x polymerase reaction buffer,
3 µL MgCl2 25 mM,
0.2 µL 100 nM dNTPs (25 mM stock),
0.1 µL of GoTaq® DNA Polymerase (0.25 units),
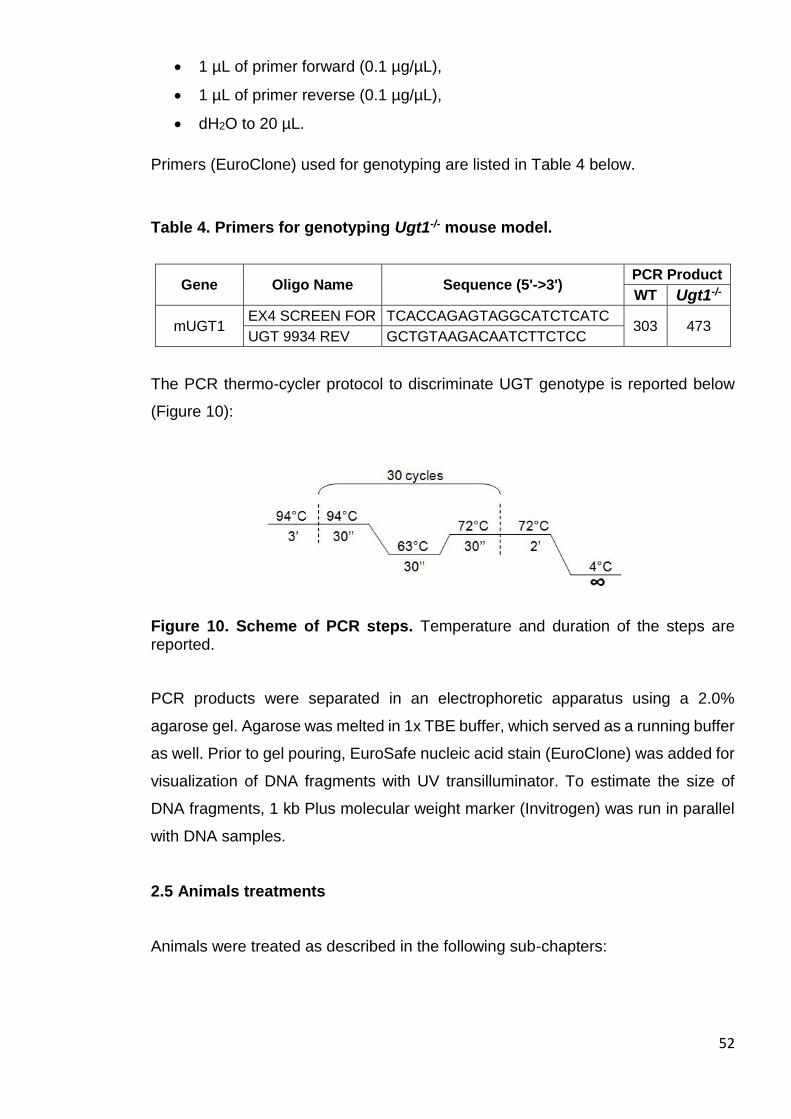
52
1 µL of primer forward (0.1 µg/µL),
1 µL of primer reverse (0.1 µg/µL),
dH2O to 20 µL.
Primers (EuroClone) used for genotyping are listed in Table 4 below.
Table 4. Primers for genotyping Ugt1-/- mouse model.
Gene Oligo Name Sequence (5'->3') PCR Product
WT Ugt1-/-
mUGT1 EX4 SCREEN FOR TCACCAGAGTAGGCATCTCATC
303 473 UGT 9934 REV GCTGTAAGACAATCTTCTCC
The PCR thermo-cycler protocol to discriminate UGT genotype is reported below
(Figure 10):
Figure 10. Scheme of PCR steps. Temperature and duration of the steps are reported.
PCR products were separated in an electrophoretic apparatus using a 2.0%
agarose gel. Agarose was melted in 1x TBE buffer, which served as a running buffer
as well. Prior to gel pouring, EuroSafe nucleic acid stain (EuroClone) was added for
visualization of DNA fragments with UV transilluminator. To estimate the size of
DNA fragments, 1 kb Plus molecular weight marker (Invitrogen) was run in parallel
with DNA samples.
2.5 Animals treatments
Animals were treated as described in the following sub-chapters:

53
2.5.1 Phototherapy treatment
Phototherapy (PT) treatment was performed as previously described (Bortolussi et
al., 2014). Newborn mice treated from postnatal day 0 (P0) to P10 with PT (P0-P10
PT) were exposed to blue fluorescent light (20 μW/cm2/nm, Philips TL 20W/52
lamps; Philips, Amsterdam, The Netherlands) for 12 hours/day since birth for 10
days, then maintained under normal light conditions. PT treatment was
synchronized with the light/dark cycle of the animal housing facility. Intensity of the
PT unit was monitored periodically by Olympic Mark II Bili-Meter (Olympic Medical)
to maintain standard conditions reported above.
2.5.2 Minocycline treatment
Fresh MNC (Minocin®, Teofarma; Pavia, Italy) was prepared every day and
administered to lactating mothers starting on the parturition day, from P0 to P20.
MNC was dissolved in water by gently mixing (in a 50 mL falcon) and then
centrifuged 1 min at 1000 rpm to eliminate excipients, and then the correct dilution
was reconstituted. Bottles were wrapped in aluminium foil to minimize exposure to
light. The reference concentration (1X) was 0.842 mg/mL of MNC. Dams received
0.25X, 1X, 2X and 4X MNC concentrations.
2.5.3 Human serum albumin treatment
Newborn mice were intraperitoneally (i.p.) injected with human serum albumin
(HSA) (Albuman®; solution for infusion, 200 g/L, fatty acid free, Sanquin,
Amsterdam, The Netherlands). WT (injected control group) and Ugt1-/- mice were
injected from P2 up P20, with 2.5 g/kg/48h, 5.0 g/kg/48h, 2.5 g/kg/24h, 5.0 g/kg/24h
and 7.5 g/kg/24h of HSA. Animals treated every 48h received HSA administration
at P2, P4, P6, P8, P10, P12, P14, P16, P18 and P20, while the 24h group every
24h, starting at P2 till P20.
2.5.4 Carbon tetrachloride treatment
Carbon tetrachloride (CCl4) 1:10 v/v dissolved in corn oil, was i.p. injected in an adult
WT mouse at 1 µL/g concentration, to generate liver damage (Domitrovi et al., 2009;
54
Yu et al., 2003). The day after plasma was collected. Alanine aminotransferase
(ALT) and aspartate aminotransferase (AST) activities in plasma sample were
assessed as described in the next chapters.
2.6 Biochemical analyses of plasma samples
Blood samples were collected at different time points in Ugt1-/- and WT littermates
by cardiac puncture or decapitation into collection tubes containing 2 µL of EDTA
(0.5M pH 8.0). Tubes were centrifuged for 15 min at 2000 rpm in a tabletop
centrifuge (Eppendorf 5145D) and plasmas were transferred into new tubes. Before
storing at -80°C, tubes were wrapped in aluminium foil to minimize exposure to light.
2.6.1 Plasma total bilirubin measurement
Total bilirubin (TB) determination in plasma was performed using Direct and Total
Bilirubin Reagent kit (BQ Kits, San Diego, CA) adapting the method to reduce
volumes (10 µL of plasma), but maintaining the original proportions, as previously
described (Bortolussi et al., 2014). As quality control, three commercial bilirubin
standards were included in each analysis: Control Serum I, Control Serum II and
Bilirubin Calibrator (Diazyme Laboratories, Poway, CA). Absorbance values at 560
nm were obtained by using a multiplate reader (Perkin Elmer Envision Plate Reader,
Walthman, MA). Briefly, samples were added to 140 µL of Buffer Reagent into a 96
wells plate (NUNCTM plates), and 2.5 µL of nitrate reagents were added only in one
of the two wells containing one the sample duplicates. The well with no nitrate
reagent serves as background subtraction. Then 150 µL of methanol were added to
start the reaction. Since the calibrator absorbance corresponds to 5 mg/dL, total
bilirubin levels were calculated as follows:
(Asample-Ablank)/(Acalibrator-Ablank)*5= n (mg/dL)
2.6.2 Free bilirubin measurement
Free bilirubin (Bf) was determined in plasma samples by Dr. Henkjan Verkade
laboratories (University of Groningen, Groningen, The Netherlands), using a Zone

55
Fluidics system (Global Flopro, Global Fia Inc, WA), as previously described by
Ahlfors et al (Ahlfors et al., 2006).
2.6.3 Plasma albumin measurement
Plasma albumin levels were determined by modified bromocresol green (BCG)
colorimetric method (Rodkey, 1965), adapting the method to use small plasma
volumes (2 µL). Briefly, 200 µl of BCG solution were added to diluted samples (2 µL
of plasma in 300 µL of dH2O). Standard curve was obtained with different calibration
points from 10 mg/mL of HSA solution. After 10 min at room temperature,
absorbance values at 630 nm were recorded by the use of a multiplate reader
(Perkin Elmer Envision Plate Reader, Walthman, MA). Plasma albumin levels were
obtained by the interpolation of the samples absorbance with the standard curve.
2.6.4 Aminotransferases
Plasma aminotransferase activities were measured in albumin-treated and
untreated animals. CCl4-treated mouse plasma was used as a positive control for
ALT and AST measurements.
2.6.4.1 ALT
Plasma ALT activity was measured with a Diagnostic ALT test kit (Sigma-Aldrich,
Cat. No MAK052, St. Luis, MO), adapting the method to reduce volumes, but
maintaining the same proportion. Briefly, a pyruvate standard solution was diluted
in ALT Assay buffer, and, according to the calibration point, a standard curve was
generated, while 5 µL of plasma were needed per sample. ALT Assay buffer was
then loaded to reach a final total volume of 10 µL. Fifty µL of enzyme mix reaction
was added to each sample. ALT mix was composed as follow:
43 µL of ALT Assay buffer,
1 µL of fluorescent peroxidase substrate,
1 µL of ALT Enzyme mix,
5 µL of ALT substrate.
56
Absorbance values at 570 nm were obtained by using a multiplate reader (Perkin
Elmer Envision Plate Reader, Walthman, MA) at 37°C in a time-course read (every
2 min) for an interval of 20 min. ALT plasma activities were obtained by the
interpolation of the samples absorbance with the standard curve generated in the
recording window before the plateaux of the reaction.
2.6.4.2 AST
Plasma AST activity were measured with a Diagnostic AST test kit (Sigma-Aldrich,
Cat. No MAK055, St. Luis, MO), adapting the method to reduce volumes, but
maintaining the same proportion. Briefly, a glutamate standard solution was diluted
in AST Assay buffer, and, according to the calibration point, standard curve was
created, while 5 µL of plasma were needed per sample. AST Assay buffer was then
loaded to reach a final total volume of 30 µL. 50 µL of enzyme mix reaction was
added to each sample. AST mix was composed as follows:
43 µL of ALT Assay buffer,
1 µL of AST enzyme kit,
4 µL of AST developer,
5 µL of AST substrate.
Absorbance values at 450 nm were obtained by using a multiplate reader (Perkin
Elmer Envision Plate Reader, Walthman, MA) at 37°C in a time-course read (every
2 min) for an interval of 20 min. AST plasma activities were obtained by the
interpolation of the samples absorbance with the standard curve generated in the
recording window before the plateaux of the reaction.
2.7 Tissue bilirubin measurement
Concentration of bilirubin in tissue was measured as described by Zelenka and
colleagues (Zelenka et al., 2008). Measurements were performed by the laboratory
of Prof. Libor Vitek, Charles University, Prague, CZ. Briefly, prior to organ collection
animals were anesthetized, blood was collected by cardiac puncture in EDTA-
containing syringes through the left ventricle. Immediately after, animals were
perfused through the right ventricle with 10 mL of perfusion solution to wash out the
residual blood from tissue. After perfusion organs were harvested, wrapped in
57
aluminium foil to minimize exposure to light, snap frozen in liquid nitrogen and stored
at -80°C until measurements.
2.8 Preparation of total RNA from the mouse cerebellum
Total RNA was prepared with EuroGOLD TriFast solution (EuroClone, Milano, Italy).
Extraction was performed according to instructions of the manufacturer. Integrity of
extracted RNA was verified on 1% agarose gel.
2.8.1 Quantification and quality control of RNA
RNA concentrations were measured by NanoDrop™ 1000 spectrophotometer
(Thermo Scientific) at 260 nm. Ratios of absorbance at 260 /280 nm and 260
nm/230 nm were used as indication of nucleic acids quality. RNA above 1.9 at
260/280 nm and 1.9-2.2 at 260/230 nm was considered of good quality.
2.8.2 Reverse transcription (RT)
For expression analysis by quantitative real-time RT-PCR (qRT-PCR),
complementary DNA (cDNA) was prepared by reverse transcription of total RNA
using M-MLV reverse transcriptase (Invitrogen), according to instructions of the
manufacturer. Total RNA were retro-transcribed in a final volume of 12 µL as follow:
1 µg total RNA,
1 µL of 10 mM dNTP mix (10 mM of each dATP, dTTP, dCTP and dGTP at
neutral pH),
5 µL of oligo dT (0.1 µg/µL)
dH2O up to 12 µL.
Mixture was heated to 65°C for 5 min and quickly chilled on ice. Then, 6 µL of a
second mix were added. Mix was composed as follow:
4 µL of 5x First-Strand buffer
2 µL 0.1 M DTT
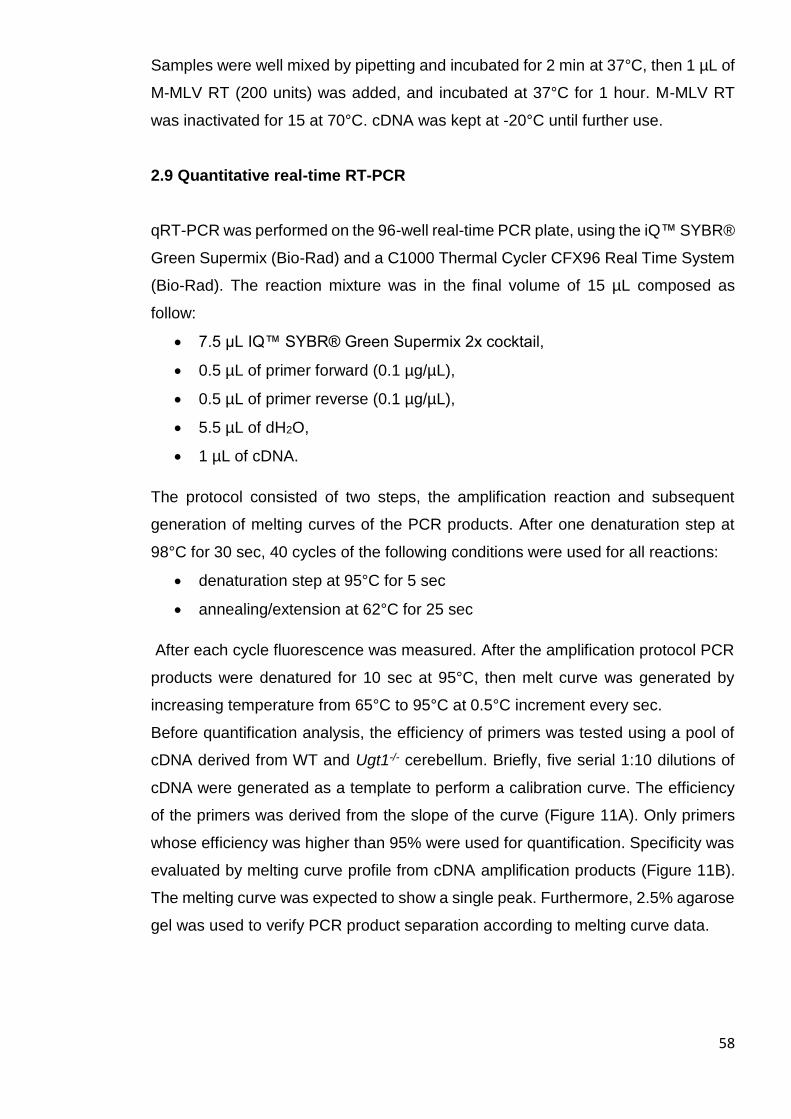
58
Samples were well mixed by pipetting and incubated for 2 min at 37°C, then 1 µL of
M-MLV RT (200 units) was added, and incubated at 37°C for 1 hour. M-MLV RT
was inactivated for 15 at 70°C. cDNA was kept at -20°C until further use.
2.9 Quantitative real-time RT-PCR
qRT-PCR was performed on the 96-well real-time PCR plate, using the iQ™ SYBR®
Green Supermix (Bio-Rad) and a C1000 Thermal Cycler CFX96 Real Time System
(Bio-Rad). The reaction mixture was in the final volume of 15 µL composed as
follow:
7.5 µL IQ™ SYBR® Green Supermix 2x cocktail,
0.5 µL of primer forward (0.1 µg/µL),
0.5 µL of primer reverse (0.1 µg/µL),
5.5 µL of dH2O,
1 µL of cDNA.
The protocol consisted of two steps, the amplification reaction and subsequent
generation of melting curves of the PCR products. After one denaturation step at
98°C for 30 sec, 40 cycles of the following conditions were used for all reactions:
denaturation step at 95°C for 5 sec
annealing/extension at 62°C for 25 sec
After each cycle fluorescence was measured. After the amplification protocol PCR
products were denatured for 10 sec at 95°C, then melt curve was generated by
increasing temperature from 65°C to 95°C at 0.5°C increment every sec.
Before quantification analysis, the efficiency of primers was tested using a pool of
cDNA derived from WT and Ugt1-/- cerebellum. Briefly, five serial 1:10 dilutions of
cDNA were generated as a template to perform a calibration curve. The efficiency
of the primers was derived from the slope of the curve (Figure 11A). Only primers
whose efficiency was higher than 95% were used for quantification. Specificity was
evaluated by melting curve profile from cDNA amplification products (Figure 11B).
The melting curve was expected to show a single peak. Furthermore, 2.5% agarose
gel was used to verify PCR product separation according to melting curve data.
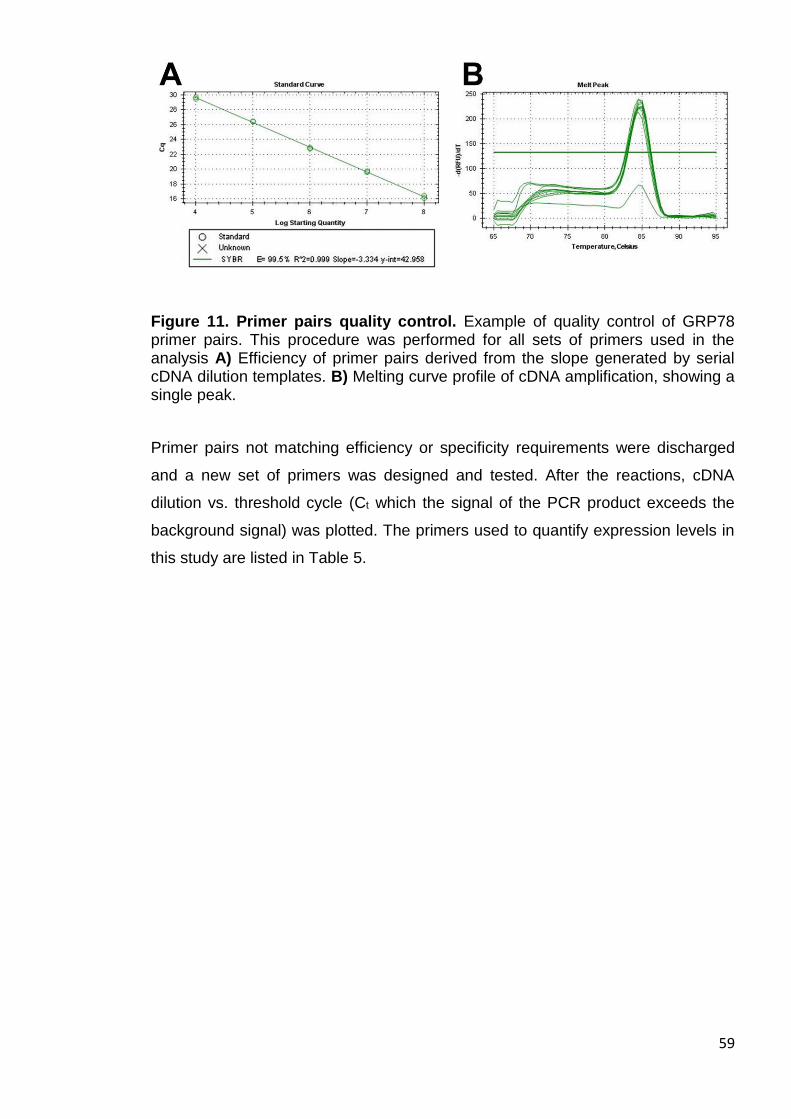
59
Figure 11. Primer pairs quality control. Example of quality control of GRP78 primer pairs. This procedure was performed for all sets of primers used in the analysis A) Efficiency of primer pairs derived from the slope generated by serial cDNA dilution templates. B) Melting curve profile of cDNA amplification, showing a single peak.
Primer pairs not matching efficiency or specificity requirements were discharged
and a new set of primers was designed and tested. After the reactions, cDNA
dilution vs. threshold cycle (Ct which the signal of the PCR product exceeds the
background signal) was plotted. The primers used to quantify expression levels in
this study are listed in Table 5.
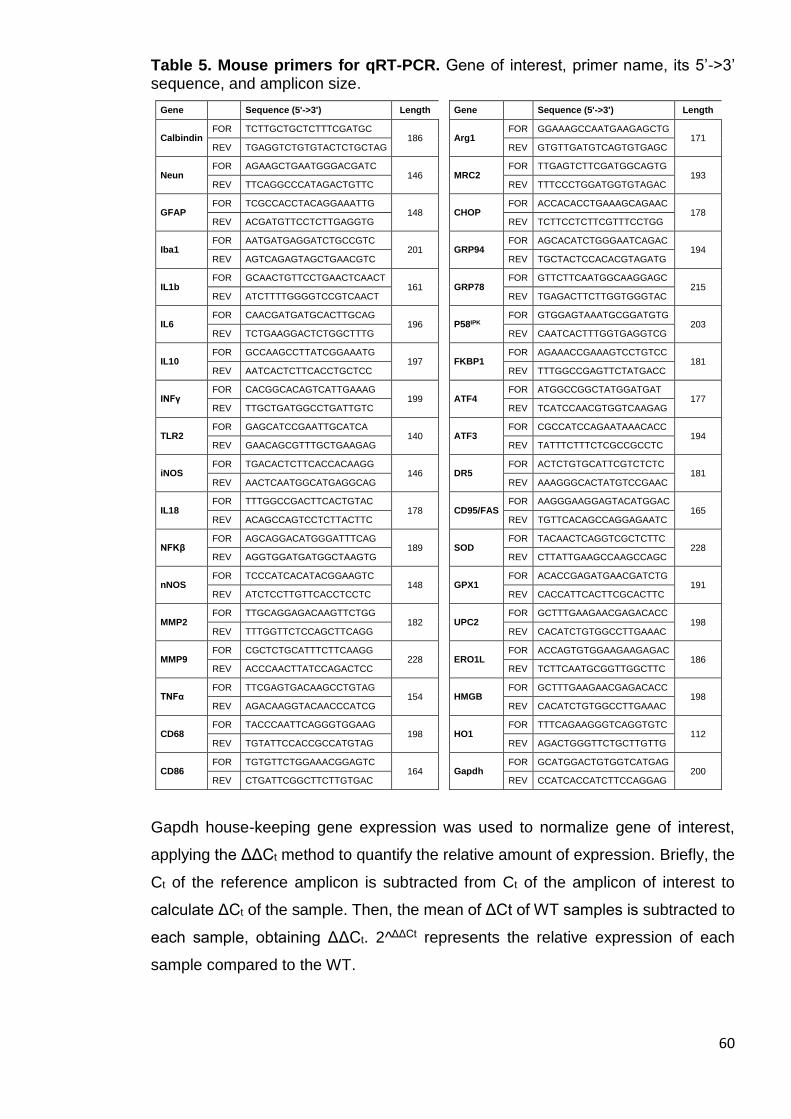
60
Table 5. Mouse primers for qRT-PCR. Gene of interest, primer name, its 5’->3’ sequence, and amplicon size.
Gene Sequence (5'->3') Length Gene Sequence (5'->3') Length
Calbindin FOR TCTTGCTGCTCTTTCGATGC
186
Arg1
FOR GGAAAGCCAATGAAGAGCTG 171
REV TGAGGTCTGTGTACTCTGCTAG REV GTGTTGATGTCAGTGTGAGC
Neun FOR AGAAGCTGAATGGGACGATC
146
MRC2
FOR TTGAGTCTTCGATGGCAGTG 193
REV TTCAGGCCCATAGACTGTTC REV TTTCCCTGGATGGTGTAGAC
GFAP FOR TCGCCACCTACAGGAAATTG
148
CHOP
FOR ACCACACCTGAAAGCAGAAC 178
REV ACGATGTTCCTCTTGAGGTG REV TCTTCCTCTTCGTTTCCTGG
Iba1 FOR AATGATGAGGATCTGCCGTC
201
GRP94
FOR AGCACATCTGGGAATCAGAC 194
REV AGTCAGAGTAGCTGAACGTC REV TGCTACTCCACACGTAGATG
IL1b FOR GCAACTGTTCCTGAACTCAACT
161
GRP78
FOR GTTCTTCAATGGCAAGGAGC 215
REV ATCTTTTGGGGTCCGTCAACT REV TGAGACTTCTTGGTGGGTAC
IL6 FOR CAACGATGATGCACTTGCAG
196
P58IPK
FOR GTGGAGTAAATGCGGATGTG 203
REV TCTGAAGGACTCTGGCTTTG REV CAATCACTTTGGTGAGGTCG
IL10 FOR GCCAAGCCTTATCGGAAATG
197
FKBP1
FOR AGAAACCGAAAGTCCTGTCC 181
REV AATCACTCTTCACCTGCTCC REV TTTGGCCGAGTTCTATGACC
INFγ FOR CACGGCACAGTCATTGAAAG
199
ATF4
FOR ATGGCCGGCTATGGATGAT 177
REV TTGCTGATGGCCTGATTGTC REV TCATCCAACGTGGTCAAGAG
TLR2 FOR GAGCATCCGAATTGCATCA
140
ATF3
FOR CGCCATCCAGAATAAACACC 194
REV GAACAGCGTTTGCTGAAGAG REV TATTTCTTTCTCGCCGCCTC
iNOS FOR TGACACTCTTCACCACAAGG
146
DR5
FOR ACTCTGTGCATTCGTCTCTC 181
REV AACTCAATGGCATGAGGCAG REV AAAGGGCACTATGTCCGAAC
IL18 FOR TTTGGCCGACTTCACTGTAC
178
CD95/FAS
FOR AAGGGAAGGAGTACATGGAC 165
REV ACAGCCAGTCCTCTTACTTC REV TGTTCACAGCCAGGAGAATC
NFKβ FOR AGCAGGACATGGGATTTCAG
189
SOD
FOR TACAACTCAGGTCGCTCTTC 228
REV AGGTGGATGATGGCTAAGTG REV CTTATTGAAGCCAAGCCAGC
nNOS FOR TCCCATCACATACGGAAGTC
148
GPX1
FOR ACACCGAGATGAACGATCTG 191
REV ATCTCCTTGTTCACCTCCTC REV CACCATTCACTTCGCACTTC
MMP2 FOR TTGCAGGAGACAAGTTCTGG
182
UPC2
FOR GCTTTGAAGAACGAGACACC 198
REV TTTGGTTCTCCAGCTTCAGG REV CACATCTGTGGCCTTGAAAC
MMP9 FOR CGCTCTGCATTTCTTCAAGG
228
ERO1L
FOR ACCAGTGTGGAAGAAGAGAC 186
REV ACCCAACTTATCCAGACTCC REV TCTTCAATGCGGTTGGCTTC
TNFα FOR TTCGAGTGACAAGCCTGTAG
154
HMGB
FOR GCTTTGAAGAACGAGACACC 198
REV AGACAAGGTACAACCCATCG REV CACATCTGTGGCCTTGAAAC
CD68 FOR TACCCAATTCAGGGTGGAAG
198
HO1
FOR TTTCAGAAGGGTCAGGTGTC 112
REV TGTATTCCACCGCCATGTAG REV AGACTGGGTTCTGCTTGTTG
CD86 FOR TGTGTTCTGGAAACGGAGTC
164
Gapdh
FOR GCATGGACTGTGGTCATGAG 200
REV CTGATTCGGCTTCTTGTGAC REV CCATCACCATCTTCCAGGAG
Gapdh house-keeping gene expression was used to normalize gene of interest,
applying the ΔΔCt method to quantify the relative amount of expression. Briefly, the
Ct of the reference amplicon is subtracted from Ct of the amplicon of interest to
calculate ΔCt of the sample. Then, the mean of ΔCt of WT samples is subtracted to
each sample, obtaining ΔΔCt. 2^ΔΔCt represents the relative expression of each
sample compared to the WT.
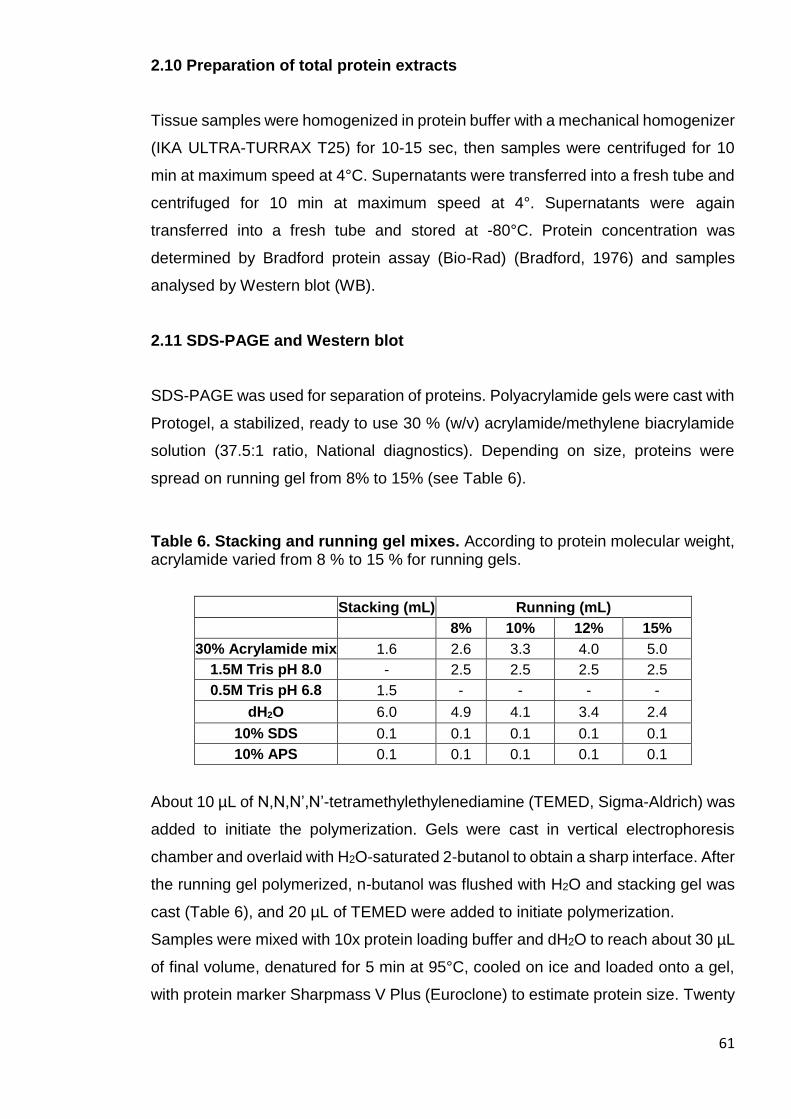
61
2.10 Preparation of total protein extracts
Tissue samples were homogenized in protein buffer with a mechanical homogenizer
(IKA ULTRA-TURRAX T25) for 10-15 sec, then samples were centrifuged for 10
min at maximum speed at 4°C. Supernatants were transferred into a fresh tube and
centrifuged for 10 min at maximum speed at 4°. Supernatants were again
transferred into a fresh tube and stored at -80°C. Protein concentration was
determined by Bradford protein assay (Bio-Rad) (Bradford, 1976) and samples
analysed by Western blot (WB).
2.11 SDS-PAGE and Western blot
SDS-PAGE was used for separation of proteins. Polyacrylamide gels were cast with
Protogel, a stabilized, ready to use 30 % (w/v) acrylamide/methylene biacrylamide
solution (37.5:1 ratio, National diagnostics). Depending on size, proteins were
spread on running gel from 8% to 15% (see Table 6).
Table 6. Stacking and running gel mixes. According to protein molecular weight, acrylamide varied from 8 % to 15 % for running gels.
Stacking (mL) Running (mL)
8% 10% 12% 15%
30% Acrylamide mix 1.6 2.6 3.3 4.0 5.0
1.5M Tris pH 8.0 - 2.5 2.5 2.5 2.5
0.5M Tris pH 6.8 1.5 - - - -
dH2O 6.0 4.9 4.1 3.4 2.4
10% SDS 0.1 0.1 0.1 0.1 0.1
10% APS 0.1 0.1 0.1 0.1 0.1
About 10 µL of N,N,N’,N’-tetramethylethylenediamine (TEMED, Sigma-Aldrich) was
added to initiate the polymerization. Gels were cast in vertical electrophoresis
chamber and overlaid with H2O-saturated 2-butanol to obtain a sharp interface. After
the running gel polymerized, n-butanol was flushed with H2O and stacking gel was
cast (Table 6), and 20 µL of TEMED were added to initiate polymerization.
Samples were mixed with 10x protein loading buffer and dH2O to reach about 30 µL
of final volume, denatured for 5 min at 95°C, cooled on ice and loaded onto a gel,
with protein marker Sharpmass V Plus (Euroclone) to estimate protein size. Twenty
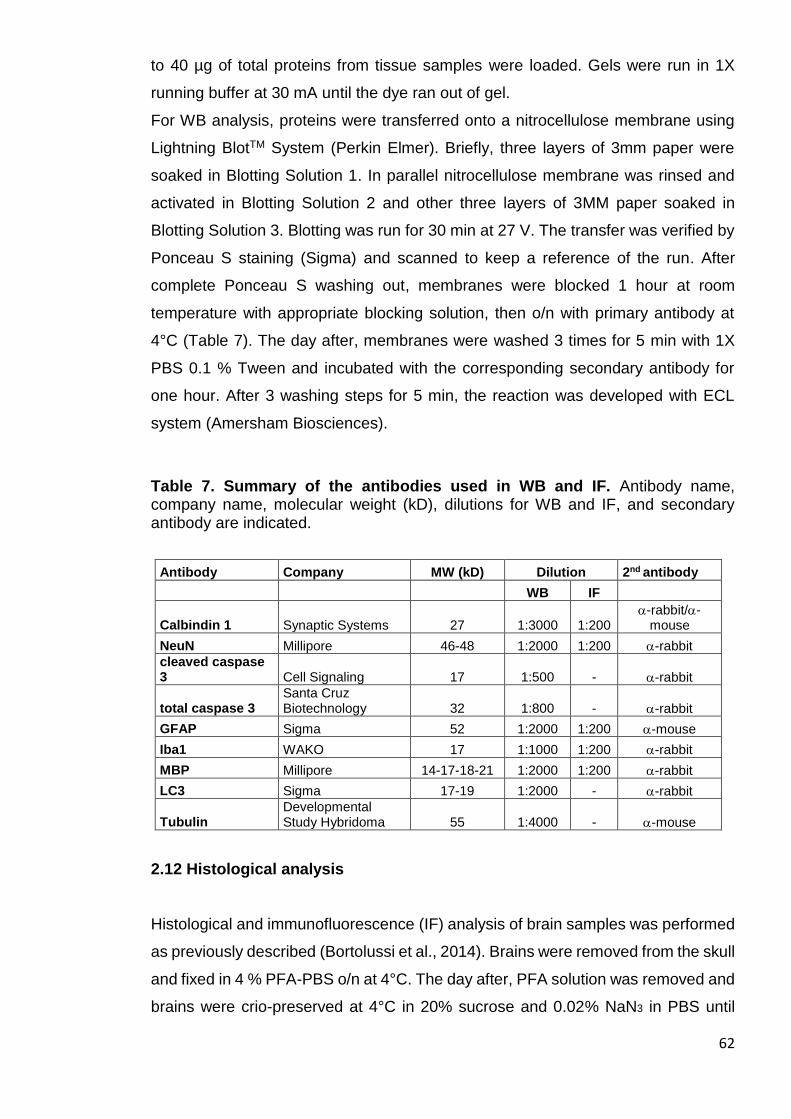
62
to 40 µg of total proteins from tissue samples were loaded. Gels were run in 1X
running buffer at 30 mA until the dye ran out of gel.
For WB analysis, proteins were transferred onto a nitrocellulose membrane using
Lightning BlotTM System (Perkin Elmer). Briefly, three layers of 3mm paper were
soaked in Blotting Solution 1. In parallel nitrocellulose membrane was rinsed and
activated in Blotting Solution 2 and other three layers of 3MM paper soaked in
Blotting Solution 3. Blotting was run for 30 min at 27 V. The transfer was verified by
Ponceau S staining (Sigma) and scanned to keep a reference of the run. After
complete Ponceau S washing out, membranes were blocked 1 hour at room
temperature with appropriate blocking solution, then o/n with primary antibody at
4°C (Table 7). The day after, membranes were washed 3 times for 5 min with 1X
PBS 0.1 % Tween and incubated with the corresponding secondary antibody for
one hour. After 3 washing steps for 5 min, the reaction was developed with ECL
system (Amersham Biosciences).
Table 7. Summary of the antibodies used in WB and IF. Antibody name, company name, molecular weight (kD), dilutions for WB and IF, and secondary antibody are indicated.
Antibody Company MW (kD) Dilution 2nd antibody
WB IF
Calbindin 1 Synaptic Systems 27 1:3000 1:200 -rabbit/-
mouse
NeuN Millipore 46-48 1:2000 1:200 -rabbit
cleaved caspase 3 Cell Signaling 17 1:500 - -rabbit
total caspase 3 Santa Cruz Biotechnology 32 1:800 - -rabbit
GFAP Sigma 52 1:2000 1:200 -mouse
Iba1 WAKO 17 1:1000 1:200 -rabbit
MBP Millipore 14-17-18-21 1:2000 1:200 -rabbit
LC3 Sigma 17-19 1:2000 - -rabbit
Tubulin Developmental Study Hybridoma 55 1:4000 - -mouse
2.12 Histological analysis
Histological and immunofluorescence (IF) analysis of brain samples was performed
as previously described (Bortolussi et al., 2014). Brains were removed from the skull
and fixed in 4 % PFA-PBS o/n at 4°C. The day after, PFA solution was removed and
brains were crio-preserved at 4°C in 20% sucrose and 0.02% NaN3 in PBS until
63
slicing. For slicing, brains were frozen in cryostat embedding medium (Killik, Bio-
optica) and sliced in 14 µm thick sagittal sections in a cryostat. Slices were gently
located on gelatinized slides. Slides were air dried for about 30 min and then stored
at -20°C until use.
The study was performed in a double-blind fashion: the genotype of the animals and
the treatment were unknown to the surgeon, while a different investigator analysed
the data. Measurements were averaged for each animal.
2.12.1 Nissl staining
Slides were air-dried for about 30 min, then rehydrated in 1X PBS for about 20 min
and dipped in cresyl violet solution for 5 min at 37°C. Next steps were performed as
follow:
2 min in dH2O (x2)
3 min in 50 % Et-OH and 50 % dH2O
3 min in 100 % Et-OH
3 min in 50 % Et-OH and 50 % xylene
3 min in 100 % xylene
Then, slides were mounted in Eukitt (Fluka, St Louis, MO). Images were acquired
on Nikon Eclipse E-800 microscope equipped with a charge-coupled device camera
(DMX 1200F; Nikon Amstelveen, The Netherlands). Digital images were collected
using ACT-1 (Nikon) software.
2.12.2 Immunofluorescence analysis
To perform analysis of IF, slides were first air-dried for about 30 min, then rehydrated
in 1X PBS for 20 min. After blocking (bovine serum albumin, BSA, or normal goat
serum, NGS), specimens were incubated with the primary antibody (see dilutions in
Table 5) 2 hours at RT. After 3×5 min washes with blocking solution, specimens
were incubated with secondary antibody (Alexa Fluor; Invitrogen Carlsbad, CA) for
2 hours at RT. Nuclei were visualized by addition of Hoechst (10 μg/ml, Invitrogen)
for 5 min after secondary antibody solution.
64
Images were acquired with a Nikon Eclipse E-800 epifluorescent microscope
equipped with a charge-coupled device camera (DMX 1200F; Nikon Amstelveen,
The Netherlands). Digital images were collected using ACT-1 (Nikon) software.
Calbindin-positive Purkinje cells (PCs) number was calculated as previously
described (Bortolussi et al., 2012) by counting cells in sections located in the vermis
region of the cerebellum. PCs number was expressed as linear density (cell/mm).
2.13 Rotarod test
The coordination and balance ability of mice were tested on a rotating cylinder with
an accelerating apparatus, as previously described (Bortolussi et al., 2014).
Behavioural studies were performed as previously described (Chauhan et al., 2005).
The animals were allowed to acclimate to the testing room for 1 hour prior to the
test. Before testing the apparatus was cleaned with H2O and 50% Et-OH to remove
odours, which could affect the behavioural analysis of the following animal. After the
adaptation period animals were trained with three trials at constant speed:
slow (2.8 rpm) for 1 min,
moderate (5.5 rpm) for 1 min,
fast (8.0 rpm), for 1 min.
After the training session mice were subjected to three trials of accelerating rotarod
test with a linear increase in rotating speed from 2.5 rpm to 48 rpm over a 5 min
period and the latency to fall was recorded. Analysis was performed for two
consecutive days. The second day, animals were tested after 1 hour of acclimation,
then were tested without training session. Tracks and order of animals was changed
between the two days of test. Results represent the average of the three trials of
day 1 mediate by the average the three trials of the day 2.
2.14 Open field test
Open field (OF) test was performed as previously described (Chauhan et al., 2005).
Mice 6-8 weeks old were analysed in the open field test, using an open rectangular
box (60 cm wide × 60 cm long × 30 cm high) made of transparent Plexiglas. The
animals experienced 1 hour of acclimation in the testing room before final test was
performed. After each animal the OF equipment was cleaned with H2O and 50% Et-
OH to remove odours, which could affect the behavioural analysis of the animal. At
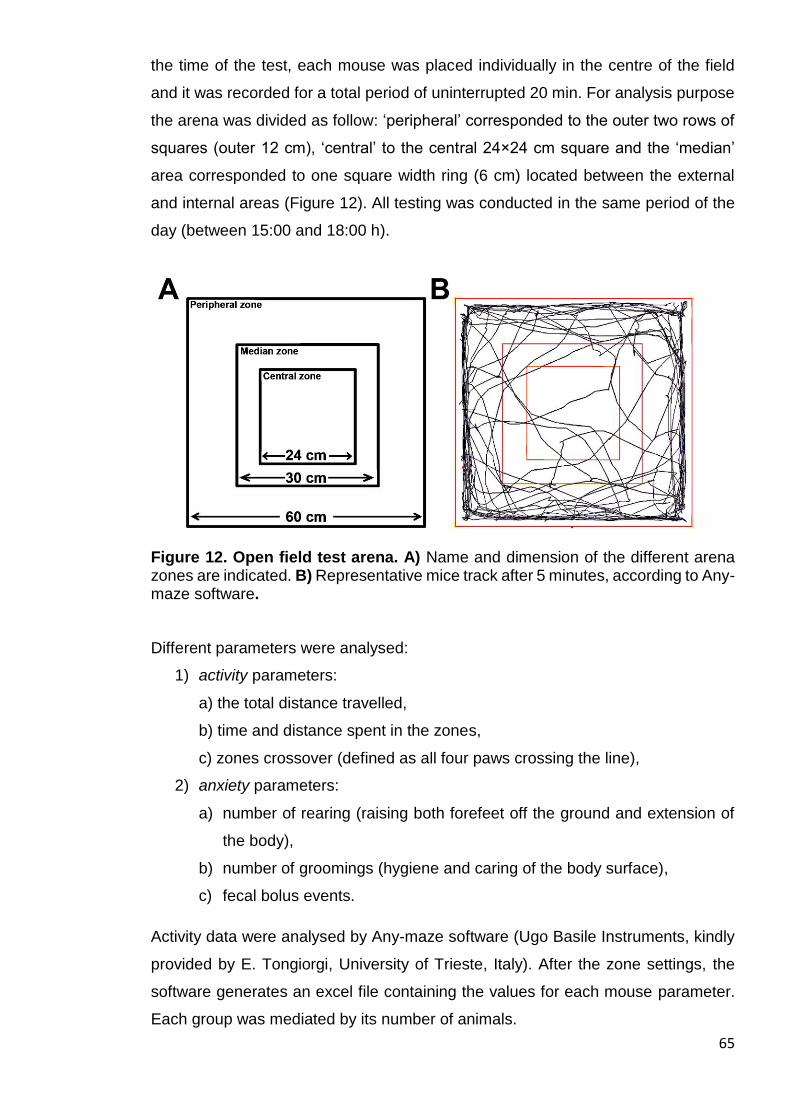
65
the time of the test, each mouse was placed individually in the centre of the field
and it was recorded for a total period of uninterrupted 20 min. For analysis purpose
the arena was divided as follow: ‘peripheral’ corresponded to the outer two rows of
squares (outer 12 cm), ‘central’ to the central 24×24 cm square and the ‘median’
area corresponded to one square width ring (6 cm) located between the external
and internal areas (Figure 12). All testing was conducted in the same period of the
day (between 15:00 and 18:00 h).
Figure 12. Open field test arena. A) Name and dimension of the different arena zones are indicated. B) Representative mice track after 5 minutes, according to Any-maze software.
Different parameters were analysed:
1) activity parameters:
a) the total distance travelled,
b) time and distance spent in the zones,
c) zones crossover (defined as all four paws crossing the line),
2) anxiety parameters:
a) number of rearing (raising both forefeet off the ground and extension of
the body),
b) number of groomings (hygiene and caring of the body surface),
c) fecal bolus events.
Activity data were analysed by Any-maze software (Ugo Basile Instruments, kindly
provided by E. Tongiorgi, University of Trieste, Italy). After the zone settings, the
software generates an excel file containing the values for each mouse parameter.
Each group was mediated by its number of animals.
66
Anxiety parameters were reported manually by examining video record, and values
were mediated by each group.
2.15 Statistics
The Prism package (GraphPad Software, La Jolla, CA) was used to analyse the
data. All the results are expressed as mean ± s.d. Values of p<0.05 were considered
statistically significant. Depending on the experimental design, Student’s t-test, one-
way ANOVA or two-way ANOVA with Bonferroni’s post-hoc comparison tests were
used, as indicated in the legends to the figures and text. Correlation analyses were
done using the Pearson coefficient to assess the linearity between two variables
and calculate two-tailed p value (95% of confidence interval).
2.16 Collaborators
Giulia Bortolussi performed some of the IF experiments (Figures 30C-D, 31C-D,
32C-D, 47C, 48C and 49C). Jana Jašprovà performed the measurement of UCB
content in tissues (Figures 19, 25 and 26). Andrea B. Schreuder performed plasma
measurement of Bf (Figures 20 and 24C).

67
RESULTS
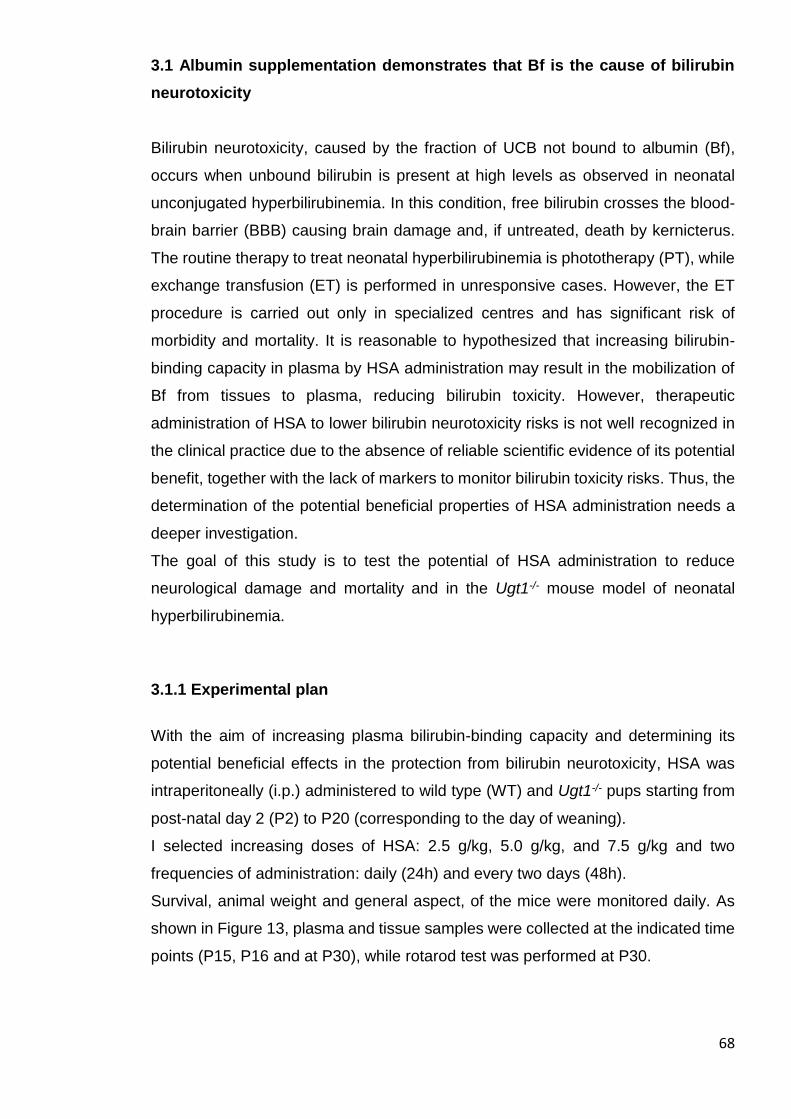
68
3.1 Albumin supplementation demonstrates that Bf is the cause of bilirubin
neurotoxicity
Bilirubin neurotoxicity, caused by the fraction of UCB not bound to albumin (Bf),
occurs when unbound bilirubin is present at high levels as observed in neonatal
unconjugated hyperbilirubinemia. In this condition, free bilirubin crosses the blood-
brain barrier (BBB) causing brain damage and, if untreated, death by kernicterus.
The routine therapy to treat neonatal hyperbilirubinemia is phototherapy (PT), while
exchange transfusion (ET) is performed in unresponsive cases. However, the ET
procedure is carried out only in specialized centres and has significant risk of
morbidity and mortality. It is reasonable to hypothesized that increasing bilirubin-
binding capacity in plasma by HSA administration may result in the mobilization of
Bf from tissues to plasma, reducing bilirubin toxicity. However, therapeutic
administration of HSA to lower bilirubin neurotoxicity risks is not well recognized in
the clinical practice due to the absence of reliable scientific evidence of its potential
benefit, together with the lack of markers to monitor bilirubin toxicity risks. Thus, the
determination of the potential beneficial properties of HSA administration needs a
deeper investigation.
The goal of this study is to test the potential of HSA administration to reduce
neurological damage and mortality and in the Ugt1-/- mouse model of neonatal
hyperbilirubinemia.
3.1.1 Experimental plan
With the aim of increasing plasma bilirubin-binding capacity and determining its
potential beneficial effects in the protection from bilirubin neurotoxicity, HSA was
intraperitoneally (i.p.) administered to wild type (WT) and Ugt1-/- pups starting from
post-natal day 2 (P2) to P20 (corresponding to the day of weaning).
I selected increasing doses of HSA: 2.5 g/kg, 5.0 g/kg, and 7.5 g/kg and two
frequencies of administration: daily (24h) and every two days (48h).
Survival, animal weight and general aspect, of the mice were monitored daily. As
shown in Figure 13, plasma and tissue samples were collected at the indicated time
points (P15, P16 and at P30), while rotarod test was performed at P30.
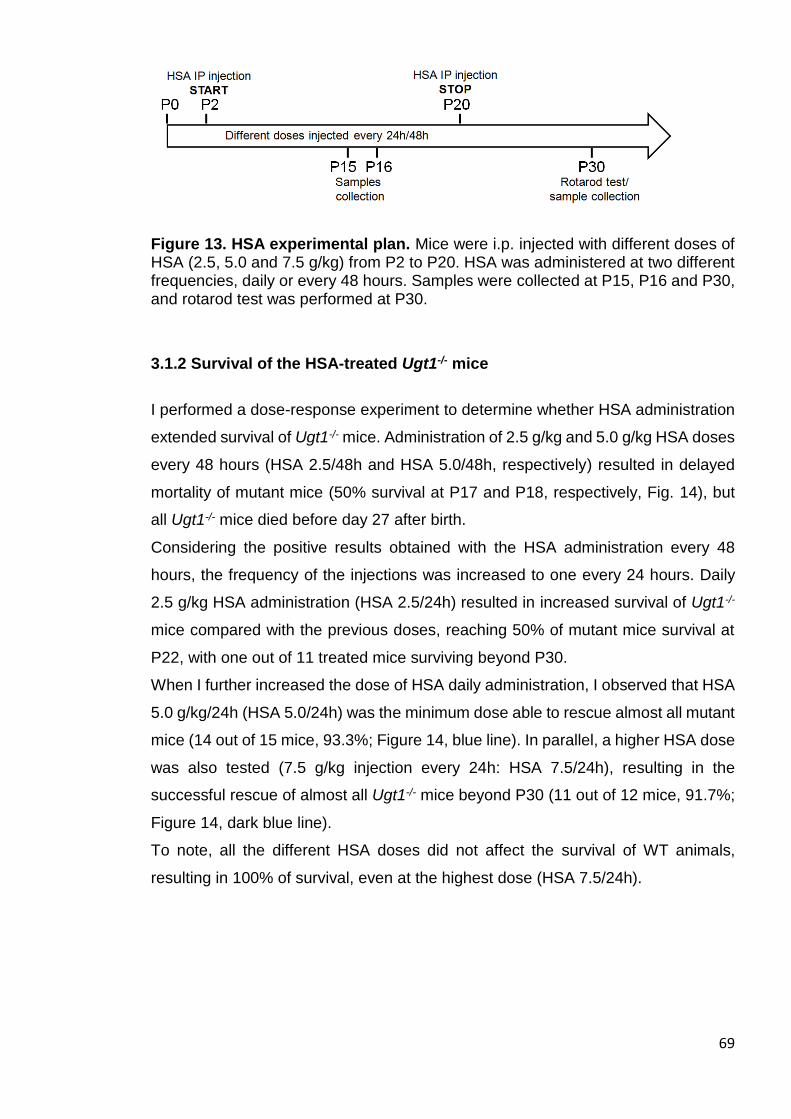
69
Figure 13. HSA experimental plan. Mice were i.p. injected with different doses of HSA (2.5, 5.0 and 7.5 g/kg) from P2 to P20. HSA was administered at two different frequencies, daily or every 48 hours. Samples were collected at P15, P16 and P30, and rotarod test was performed at P30.
3.1.2 Survival of the HSA-treated Ugt1-/- mice
I performed a dose-response experiment to determine whether HSA administration
extended survival of Ugt1-/- mice. Administration of 2.5 g/kg and 5.0 g/kg HSA doses
every 48 hours (HSA 2.5/48h and HSA 5.0/48h, respectively) resulted in delayed
mortality of mutant mice (50% survival at P17 and P18, respectively, Fig. 14), but
all Ugt1-/- mice died before day 27 after birth.
Considering the positive results obtained with the HSA administration every 48
hours, the frequency of the injections was increased to one every 24 hours. Daily
2.5 g/kg HSA administration (HSA 2.5/24h) resulted in increased survival of Ugt1-/-
mice compared with the previous doses, reaching 50% of mutant mice survival at
P22, with one out of 11 treated mice surviving beyond P30.
When I further increased the dose of HSA daily administration, I observed that HSA
5.0 g/kg/24h (HSA 5.0/24h) was the minimum dose able to rescue almost all mutant
mice (14 out of 15 mice, 93.3%; Figure 14, blue line). In parallel, a higher HSA dose
was also tested (7.5 g/kg injection every 24h: HSA 7.5/24h), resulting in the
successful rescue of almost all Ugt1-/- mice beyond P30 (11 out of 12 mice, 91.7%;
Figure 14, dark blue line).
To note, all the different HSA doses did not affect the survival of WT animals,
resulting in 100% of survival, even at the highest dose (HSA 7.5/24h).
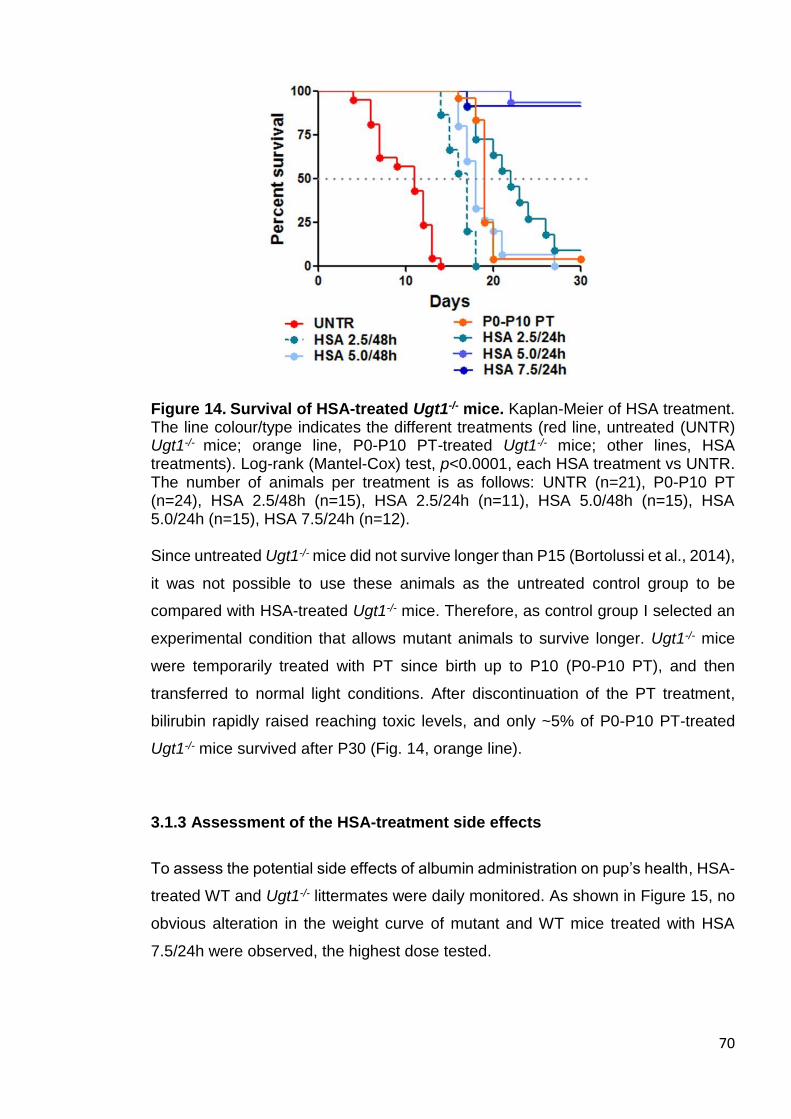
70
Figure 14. Survival of HSA-treated Ugt1-/- mice. Kaplan-Meier of HSA treatment. The line colour/type indicates the different treatments (red line, untreated (UNTR) Ugt1-/- mice; orange line, P0-P10 PT-treated Ugt1-/- mice; other lines, HSA treatments). Log-rank (Mantel-Cox) test, p<0.0001, each HSA treatment vs UNTR. The number of animals per treatment is as follows: UNTR (n=21), P0-P10 PT (n=24), HSA 2.5/48h (n=15), HSA 2.5/24h (n=11), HSA 5.0/48h (n=15), HSA 5.0/24h (n=15), HSA 7.5/24h (n=12). Since untreated Ugt1-/- mice did not survive longer than P15 (Bortolussi et al., 2014),
it was not possible to use these animals as the untreated control group to be
compared with HSA-treated Ugt1-/- mice. Therefore, as control group I selected an
experimental condition that allows mutant animals to survive longer. Ugt1-/- mice
were temporarily treated with PT since birth up to P10 (P0-P10 PT), and then
transferred to normal light conditions. After discontinuation of the PT treatment,
bilirubin rapidly raised reaching toxic levels, and only ~5% of P0-P10 PT-treated
Ugt1-/- mice survived after P30 (Fig. 14, orange line).
3.1.3 Assessment of the HSA-treatment side effects
To assess the potential side effects of albumin administration on pup’s health, HSA-
treated WT and Ugt1-/- littermates were daily monitored. As shown in Figure 15, no
obvious alteration in the weight curve of mutant and WT mice treated with HSA
7.5/24h were observed, the highest dose tested.

71
Figure 15. Weight curve of HSA-treated mice. Weight of untreated (UNTR), wild type/heterozygous (WT – Het) and Ugt1-/- littermates treated with the highest dose of HSA (daily injected HSA 7.5 g/kg) was monitored. Values represent mean ± s.d. (g). Two-way ANOVA, Bonferroni’s post test, not significant; average of analysed families per treatment n=7).
To determine whether HSA treatment may lead to liver damage, alanine
aminotransferase (ALT) were analysed at P15. In addition, to exclude a possible
damage on muscular tissue aspartate aminotransferase (AST) activity was
analysed in WT and Ugt1-/- littermates treated with the highest dose. As positive
control, animals were treated with carbon tetrachloride (CCl4), a compound known
to induce liver damage (Domitrovi et al., 2009).
No significant change in the ALT and AST activities were observed between the
injected and non-injected groups, indicating the absence of liver or muscle damage
caused by HSA daily treatment (Figure 16).
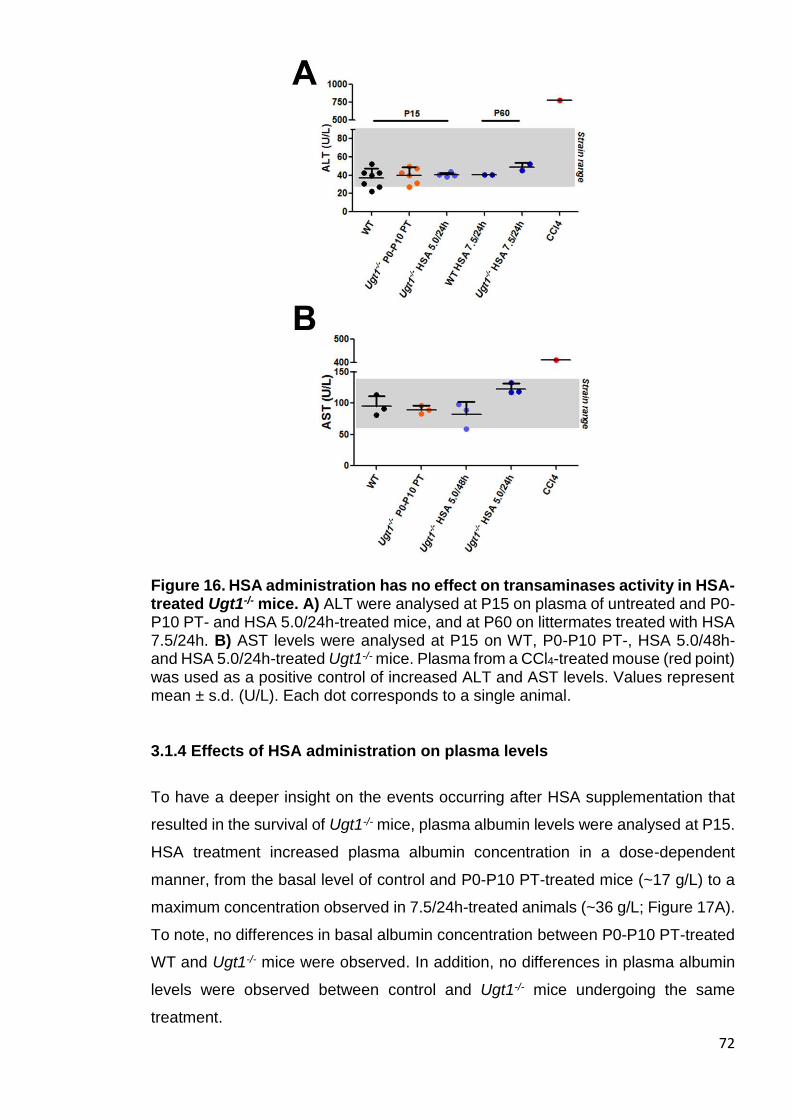
72
Figure 16. HSA administration has no effect on transaminases activity in HSA-treated Ugt1-/- mice. A) ALT were analysed at P15 on plasma of untreated and P0-P10 PT- and HSA 5.0/24h-treated mice, and at P60 on littermates treated with HSA 7.5/24h. B) AST levels were analysed at P15 on WT, P0-P10 PT-, HSA 5.0/48h- and HSA 5.0/24h-treated Ugt1-/- mice. Plasma from a CCl4-treated mouse (red point) was used as a positive control of increased ALT and AST levels. Values represent mean ± s.d. (U/L). Each dot corresponds to a single animal.
3.1.4 Effects of HSA administration on plasma levels
To have a deeper insight on the events occurring after HSA supplementation that
resulted in the survival of Ugt1-/- mice, plasma albumin levels were analysed at P15.
HSA treatment increased plasma albumin concentration in a dose-dependent
manner, from the basal level of control and P0-P10 PT-treated mice (~17 g/L) to a
maximum concentration observed in 7.5/24h-treated animals (~36 g/L; Figure 17A).
To note, no differences in basal albumin concentration between P0-P10 PT-treated
WT and Ugt1-/- mice were observed. In addition, no differences in plasma albumin
levels were observed between control and Ugt1-/- mice undergoing the same
treatment.
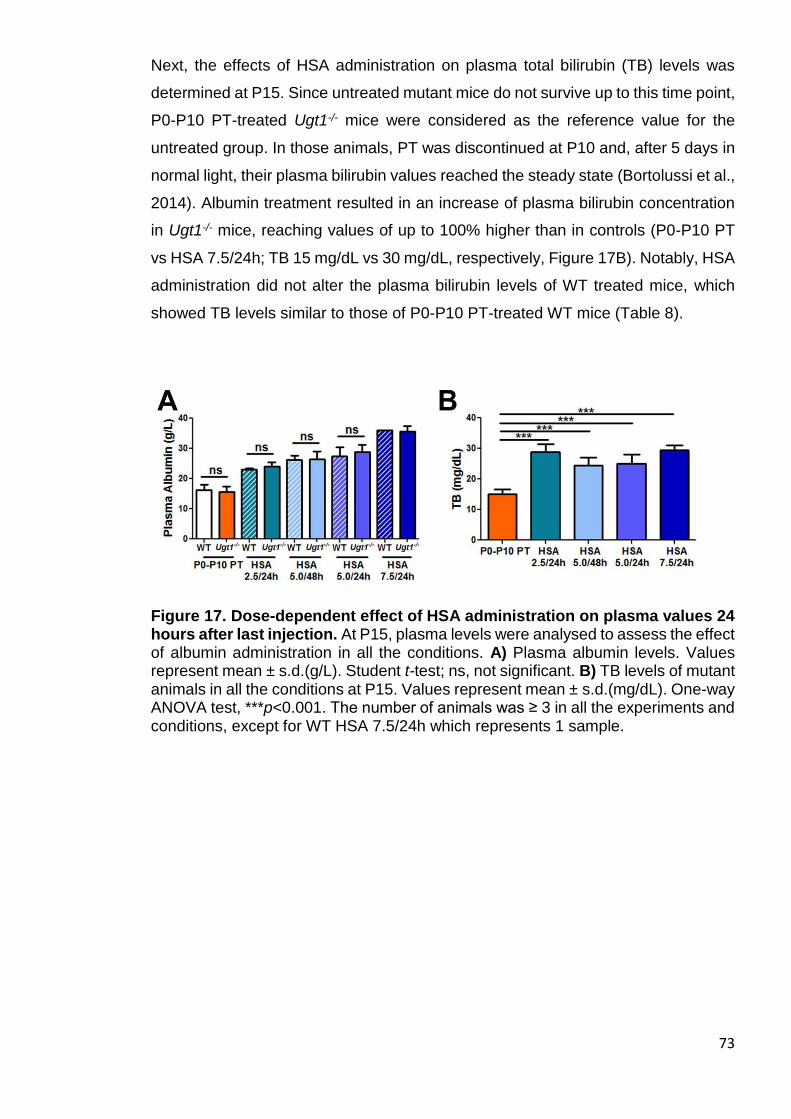
73
Next, the effects of HSA administration on plasma total bilirubin (TB) levels was
determined at P15. Since untreated mutant mice do not survive up to this time point,
P0-P10 PT-treated Ugt1-/- mice were considered as the reference value for the
untreated group. In those animals, PT was discontinued at P10 and, after 5 days in
normal light, their plasma bilirubin values reached the steady state (Bortolussi et al.,
2014). Albumin treatment resulted in an increase of plasma bilirubin concentration
in Ugt1-/- mice, reaching values of up to 100% higher than in controls (P0-P10 PT
vs HSA 7.5/24h; TB 15 mg/dL vs 30 mg/dL, respectively, Figure 17B). Notably, HSA
administration did not alter the plasma bilirubin levels of WT treated mice, which
showed TB levels similar to those of P0-P10 PT-treated WT mice (Table 8).
Figure 17. Dose-dependent effect of HSA administration on plasma values 24 hours after last injection. At P15, plasma levels were analysed to assess the effect of albumin administration in all the conditions. A) Plasma albumin levels. Values represent mean ± s.d.(g/L). Student t-test; ns, not significant. B) TB levels of mutant animals in all the conditions at P15. Values represent mean ± s.d.(mg/dL). One-way ANOVA test, ***p<0.001. The number of animals was ≥ 3 in all the experiments and conditions, except for WT HSA 7.5/24h which represents 1 sample.
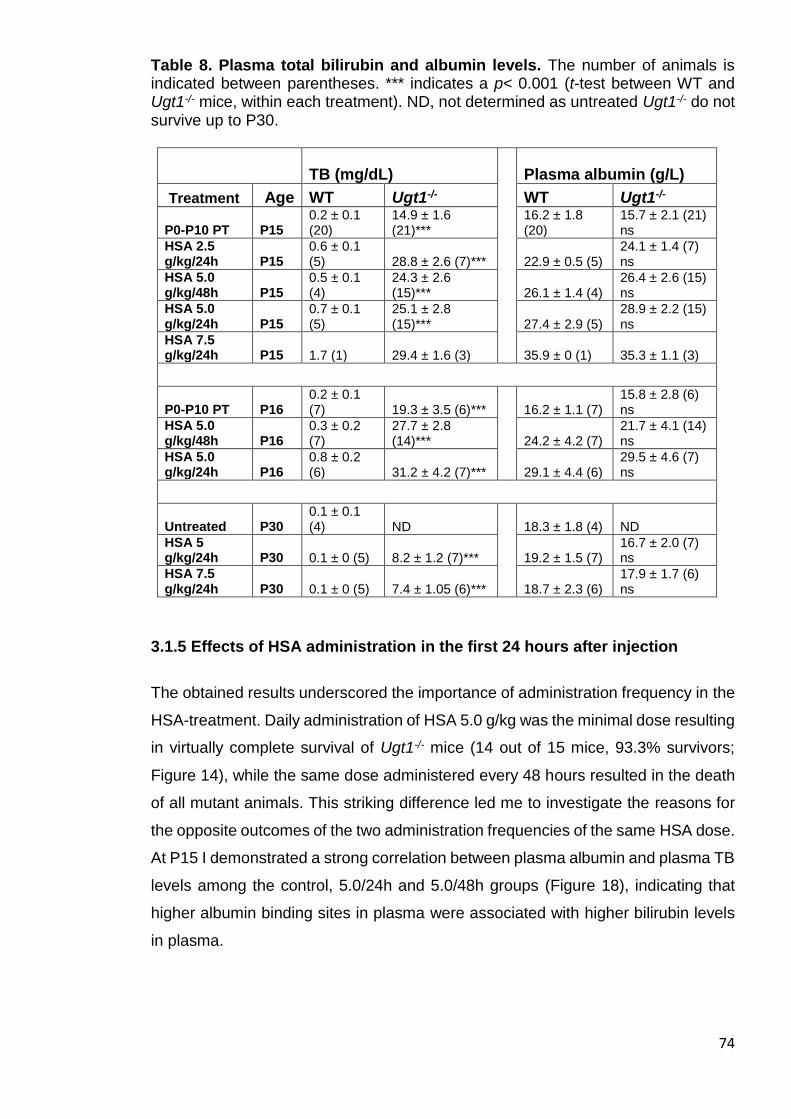
74
Table 8. Plasma total bilirubin and albumin levels. The number of animals is indicated between parentheses. *** indicates a p< 0.001 (t-test between WT and Ugt1-/- mice, within each treatment). ND, not determined as untreated Ugt1-/- do not survive up to P30.
TB (mg/dL) Plasma albumin (g/L)
Treatment Age WT Ugt1-/- WT Ugt1-/-
P0-P10 PT P15 0.2 ± 0.1 (20)
14.9 ± 1.6 (21)***
16.2 ± 1.8 (20)
15.7 ± 2.1 (21) ns
HSA 2.5 g/kg/24h P15
0.6 ± 0.1 (5) 28.8 ± 2.6 (7)*** 22.9 ± 0.5 (5)
24.1 ± 1.4 (7) ns
HSA 5.0 g/kg/48h P15
0.5 ± 0.1 (4)
24.3 ± 2.6 (15)*** 26.1 ± 1.4 (4)
26.4 ± 2.6 (15) ns
HSA 5.0 g/kg/24h P15
0.7 ± 0.1 (5)
25.1 ± 2.8 (15)*** 27.4 ± 2.9 (5)
28.9 ± 2.2 (15) ns
HSA 7.5 g/kg/24h P15 1.7 (1) 29.4 ± 1.6 (3) 35.9 ± 0 (1) 35.3 ± 1.1 (3)
P0-P10 PT P16 0.2 ± 0.1 (7) 19.3 ± 3.5 (6)*** 16.2 ± 1.1 (7)
15.8 ± 2.8 (6) ns
HSA 5.0 g/kg/48h P16
0.3 ± 0.2 (7)
27.7 ± 2.8 (14)*** 24.2 ± 4.2 (7)
21.7 ± 4.1 (14) ns
HSA 5.0 g/kg/24h P16
0.8 ± 0.2 (6) 31.2 ± 4.2 (7)*** 29.1 ± 4.4 (6)
29.5 ± 4.6 (7) ns
Untreated P30 0.1 ± 0.1 (4) ND 18.3 ± 1.8 (4) ND
HSA 5 g/kg/24h P30 0.1 ± 0 (5) 8.2 ± 1.2 (7)*** 19.2 ± 1.5 (7)
16.7 ± 2.0 (7) ns
HSA 7.5 g/kg/24h P30 0.1 ± 0 (5) 7.4 ± 1.05 (6)*** 18.7 ± 2.3 (6)
17.9 ± 1.7 (6) ns
3.1.5 Effects of HSA administration in the first 24 hours after injection
The obtained results underscored the importance of administration frequency in the
HSA-treatment. Daily administration of HSA 5.0 g/kg was the minimal dose resulting
in virtually complete survival of Ugt1-/- mice (14 out of 15 mice, 93.3% survivors;
Figure 14), while the same dose administered every 48 hours resulted in the death
of all mutant animals. This striking difference led me to investigate the reasons for
the opposite outcomes of the two administration frequencies of the same HSA dose.
At P15 I demonstrated a strong correlation between plasma albumin and plasma TB
levels among the control, 5.0/24h and 5.0/48h groups (Figure 18), indicating that
higher albumin binding sites in plasma were associated with higher bilirubin levels
in plasma.
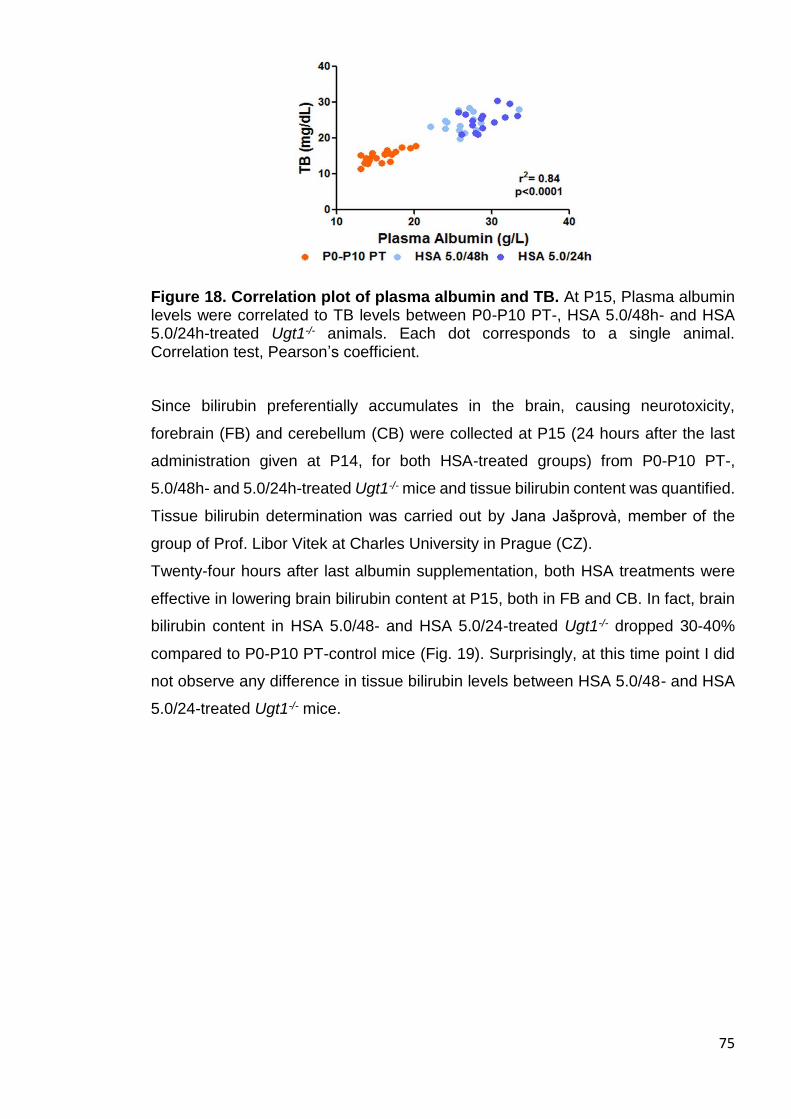
75
Figure 18. Correlation plot of plasma albumin and TB. At P15, Plasma albumin levels were correlated to TB levels between P0-P10 PT-, HSA 5.0/48h- and HSA 5.0/24h-treated Ugt1-/- animals. Each dot corresponds to a single animal. Correlation test, Pearson’s coefficient.
Since bilirubin preferentially accumulates in the brain, causing neurotoxicity,
forebrain (FB) and cerebellum (CB) were collected at P15 (24 hours after the last
administration given at P14, for both HSA-treated groups) from P0-P10 PT-,
5.0/48h- and 5.0/24h-treated Ugt1-/- mice and tissue bilirubin content was quantified.
Tissue bilirubin determination was carried out by Jana Jašprovà, member of the
group of Prof. Libor Vitek at Charles University in Prague (CZ).
Twenty-four hours after last albumin supplementation, both HSA treatments were
effective in lowering brain bilirubin content at P15, both in FB and CB. In fact, brain
bilirubin content in HSA 5.0/48- and HSA 5.0/24-treated Ugt1-/- dropped 30-40%
compared to P0-P10 PT-control mice (Fig. 19). Surprisingly, at this time point I did
not observe any difference in tissue bilirubin levels between HSA 5.0/48- and HSA
5.0/24-treated Ugt1-/- mice.

76
Figure 19. Effect of HSA administration on brain bilirubin content. At P15, forebrain and cerebellum UCB content was analysed in P0-P10 PT-, HSA 5.0/48h- and HSA 5.0/24h-treated Ugt1-/- animals. Values represent mean ± s.d. (nmol/mg). One-way ANOVA test, **p<0.01, ***p<0.001. The number of animals was ≥ 6 in all the experiments and conditions.
Next, Andrea Schreuder, member of the Dr. Henkjan Verkade laboratory (University
of Groningen, Groningen, The Netherlands), determined plasma concentrations of
the free fraction of bilirubin (Bf), which is considered the fraction of bilirubin capable
of crossing the blood-brain barrier and inducing neuro-damage. At P15, a clear
effect of albumin administration on Bf reduction was observed (Figure 20). Bf in
HSA-treated mutant animals was about 1/3 compared to the P0-P10 PT Ugt1-/-
control group. Interestingly, there was no difference between the 5.0/24h- and the
5.0/48h-treated groups, which received different frequencies of injection.
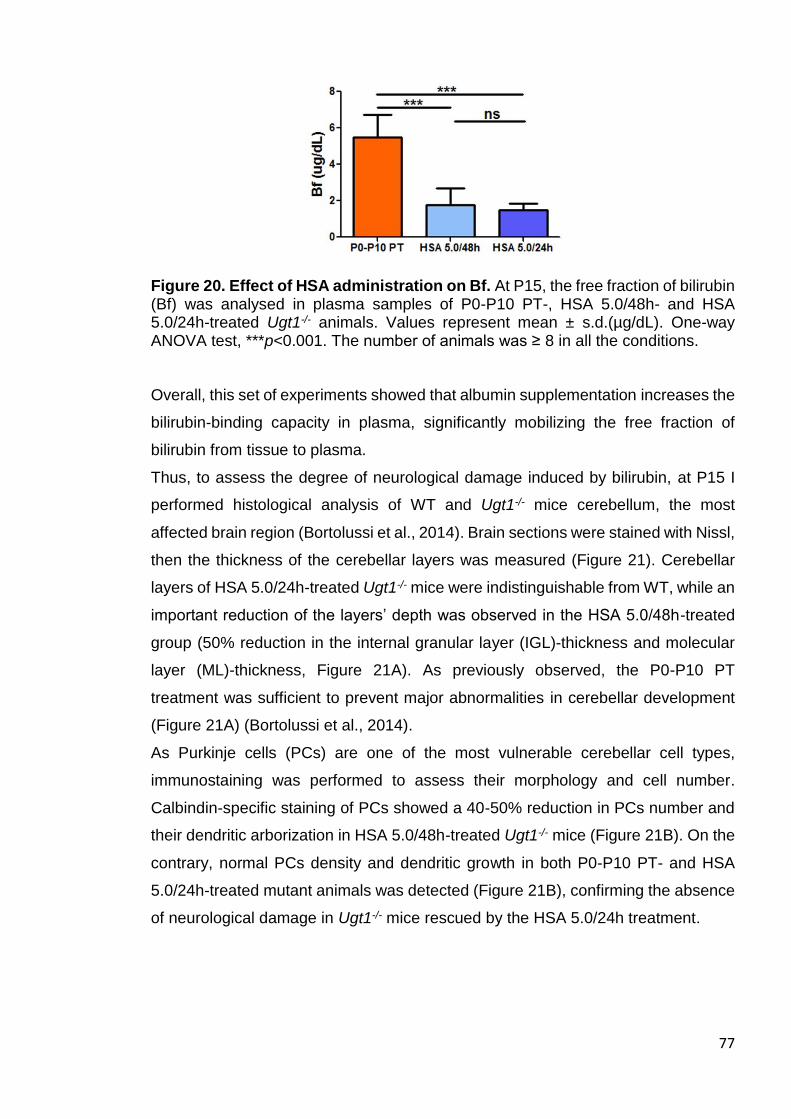
77
Figure 20. Effect of HSA administration on Bf. At P15, the free fraction of bilirubin (Bf) was analysed in plasma samples of P0-P10 PT-, HSA 5.0/48h- and HSA 5.0/24h-treated Ugt1-/- animals. Values represent mean ± s.d.(µg/dL). One-way ANOVA test, ***p<0.001. The number of animals was ≥ 8 in all the conditions.
Overall, this set of experiments showed that albumin supplementation increases the
bilirubin-binding capacity in plasma, significantly mobilizing the free fraction of
bilirubin from tissue to plasma.
Thus, to assess the degree of neurological damage induced by bilirubin, at P15 I
performed histological analysis of WT and Ugt1-/- mice cerebellum, the most
affected brain region (Bortolussi et al., 2014). Brain sections were stained with Nissl,
then the thickness of the cerebellar layers was measured (Figure 21). Cerebellar
layers of HSA 5.0/24h-treated Ugt1-/- mice were indistinguishable from WT, while an
important reduction of the layers’ depth was observed in the HSA 5.0/48h-treated
group (50% reduction in the internal granular layer (IGL)-thickness and molecular
layer (ML)-thickness, Figure 21A). As previously observed, the P0-P10 PT
treatment was sufficient to prevent major abnormalities in cerebellar development
(Figure 21A) (Bortolussi et al., 2014).
As Purkinje cells (PCs) are one of the most vulnerable cerebellar cell types,
immunostaining was performed to assess their morphology and cell number.
Calbindin-specific staining of PCs showed a 40-50% reduction in PCs number and
their dendritic arborization in HSA 5.0/48h-treated Ugt1-/- mice (Figure 21B). On the
contrary, normal PCs density and dendritic growth in both P0-P10 PT- and HSA
5.0/24h-treated mutant animals was detected (Figure 21B), confirming the absence
of neurological damage in Ugt1-/- mice rescued by the HSA 5.0/24h treatment.
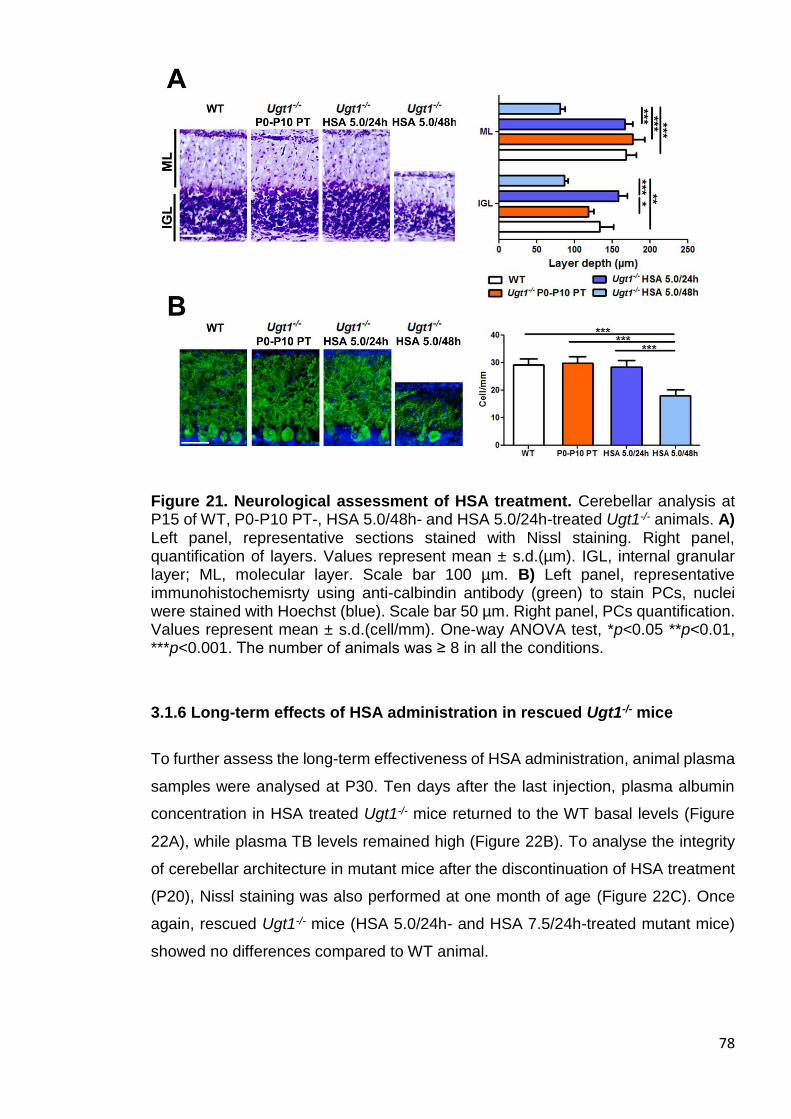
78
Figure 21. Neurological assessment of HSA treatment. Cerebellar analysis at P15 of WT, P0-P10 PT-, HSA 5.0/48h- and HSA 5.0/24h-treated Ugt1-/- animals. A) Left panel, representative sections stained with Nissl staining. Right panel, quantification of layers. Values represent mean ± s.d.(µm). IGL, internal granular layer; ML, molecular layer. Scale bar 100 µm. B) Left panel, representative immunohistochemisrty using anti-calbindin antibody (green) to stain PCs, nuclei were stained with Hoechst (blue). Scale bar 50 µm. Right panel, PCs quantification. Values represent mean ± s.d.(cell/mm). One-way ANOVA test, *p<0.05 **p<0.01, ***p<0.001. The number of animals was ≥ 8 in all the conditions.
3.1.6 Long-term effects of HSA administration in rescued Ugt1-/- mice
To further assess the long-term effectiveness of HSA administration, animal plasma
samples were analysed at P30. Ten days after the last injection, plasma albumin
concentration in HSA treated Ugt1-/- mice returned to the WT basal levels (Figure
22A), while plasma TB levels remained high (Figure 22B). To analyse the integrity
of cerebellar architecture in mutant mice after the discontinuation of HSA treatment
(P20), Nissl staining was also performed at one month of age (Figure 22C). Once
again, rescued Ugt1-/- mice (HSA 5.0/24h- and HSA 7.5/24h-treated mutant mice)
showed no differences compared to WT animal.
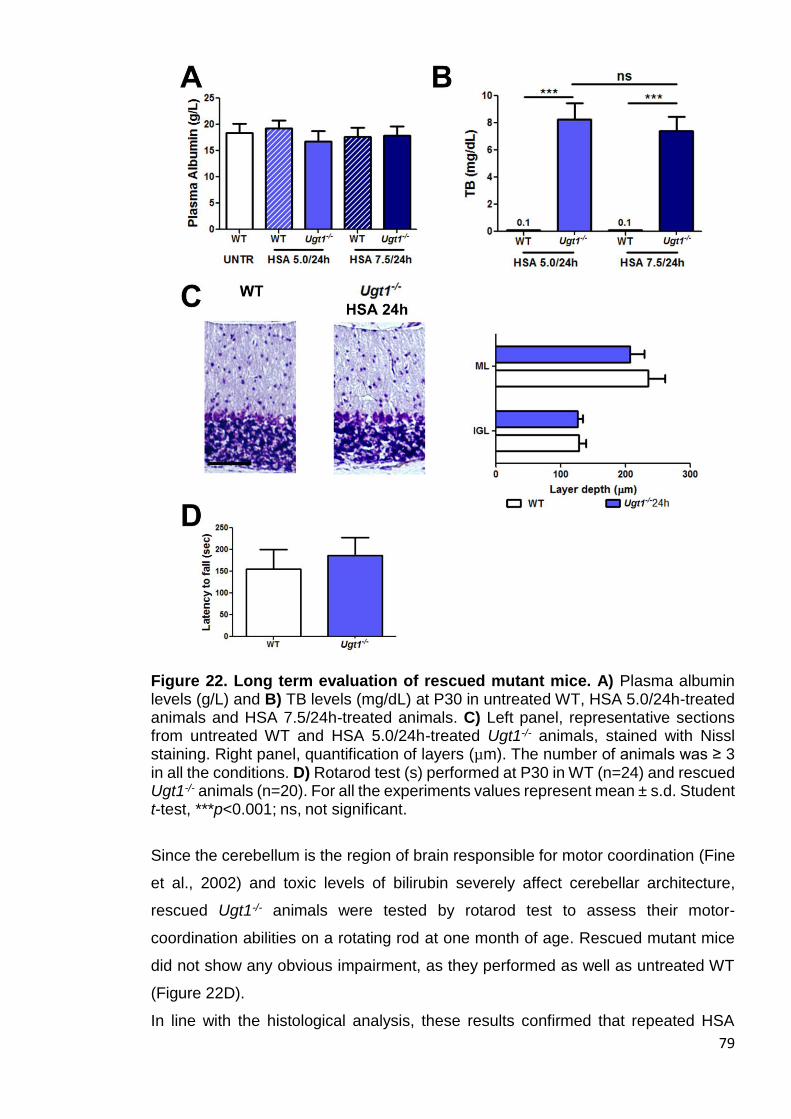
79
Figure 22. Long term evaluation of rescued mutant mice. A) Plasma albumin levels (g/L) and B) TB levels (mg/dL) at P30 in untreated WT, HSA 5.0/24h-treated animals and HSA 7.5/24h-treated animals. C) Left panel, representative sections from untreated WT and HSA 5.0/24h-treated Ugt1-/- animals, stained with Nissl staining. Right panel, quantification of layers (µm). The number of animals was ≥ 3 in all the conditions. D) Rotarod test (s) performed at P30 in WT (n=24) and rescued Ugt1-/- animals (n=20). For all the experiments values represent mean ± s.d. Student t-test, ***p<0.001; ns, not significant.
Since the cerebellum is the region of brain responsible for motor coordination (Fine
et al., 2002) and toxic levels of bilirubin severely affect cerebellar architecture,
rescued Ugt1-/- animals were tested by rotarod test to assess their motor-
coordination abilities on a rotating rod at one month of age. Rescued mutant mice
did not show any obvious impairment, as they performed as well as untreated WT
(Figure 22D).
In line with the histological analysis, these results confirmed that repeated HSA
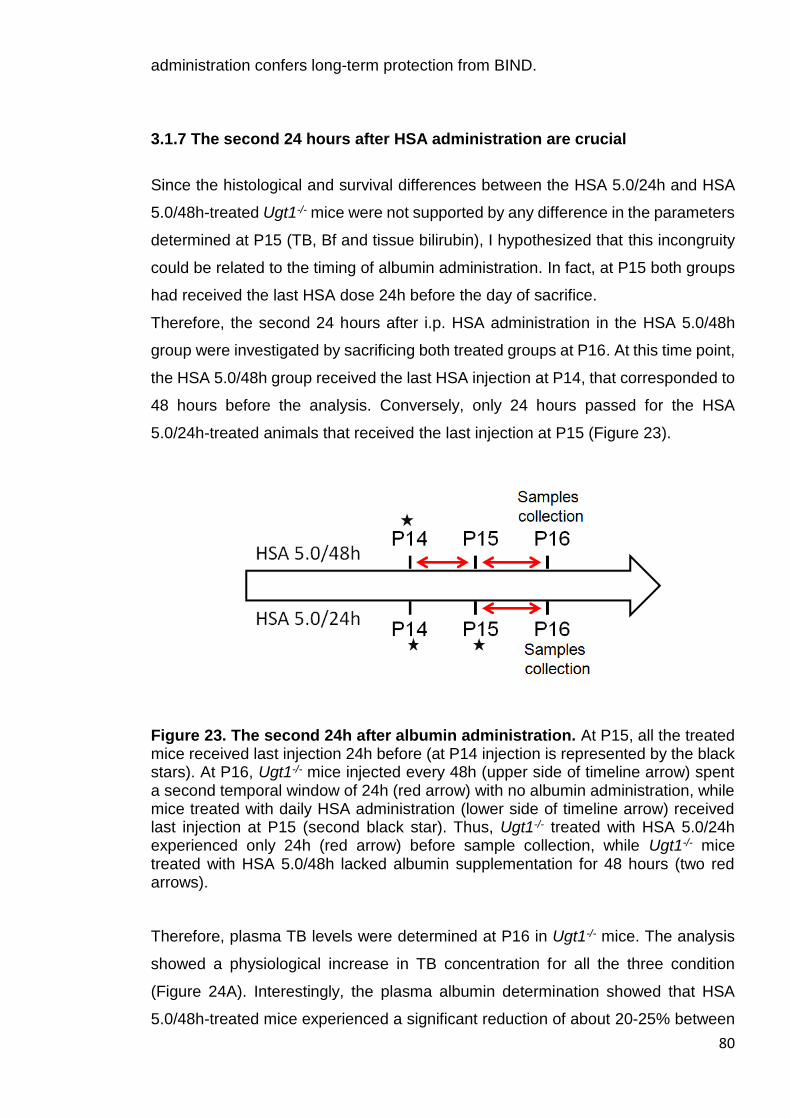
80
administration confers long-term protection from BIND.
3.1.7 The second 24 hours after HSA administration are crucial
Since the histological and survival differences between the HSA 5.0/24h and HSA
5.0/48h-treated Ugt1-/- mice were not supported by any difference in the parameters
determined at P15 (TB, Bf and tissue bilirubin), I hypothesized that this incongruity
could be related to the timing of albumin administration. In fact, at P15 both groups
had received the last HSA dose 24h before the day of sacrifice.
Therefore, the second 24 hours after i.p. HSA administration in the HSA 5.0/48h
group were investigated by sacrificing both treated groups at P16. At this time point,
the HSA 5.0/48h group received the last HSA injection at P14, that corresponded to
48 hours before the analysis. Conversely, only 24 hours passed for the HSA
5.0/24h-treated animals that received the last injection at P15 (Figure 23).
Figure 23. The second 24h after albumin administration. At P15, all the treated mice received last injection 24h before (at P14 injection is represented by the black stars). At P16, Ugt1-/- mice injected every 48h (upper side of timeline arrow) spent a second temporal window of 24h (red arrow) with no albumin administration, while mice treated with daily HSA administration (lower side of timeline arrow) received last injection at P15 (second black star). Thus, Ugt1-/- treated with HSA 5.0/24h experienced only 24h (red arrow) before sample collection, while Ugt1-/- mice treated with HSA 5.0/48h lacked albumin supplementation for 48 hours (two red arrows).
Therefore, plasma TB levels were determined at P16 in Ugt1-/- mice. The analysis
showed a physiological increase in TB concentration for all the three condition
(Figure 24A). Interestingly, the plasma albumin determination showed that HSA
5.0/48h-treated mice experienced a significant reduction of about 20-25% between
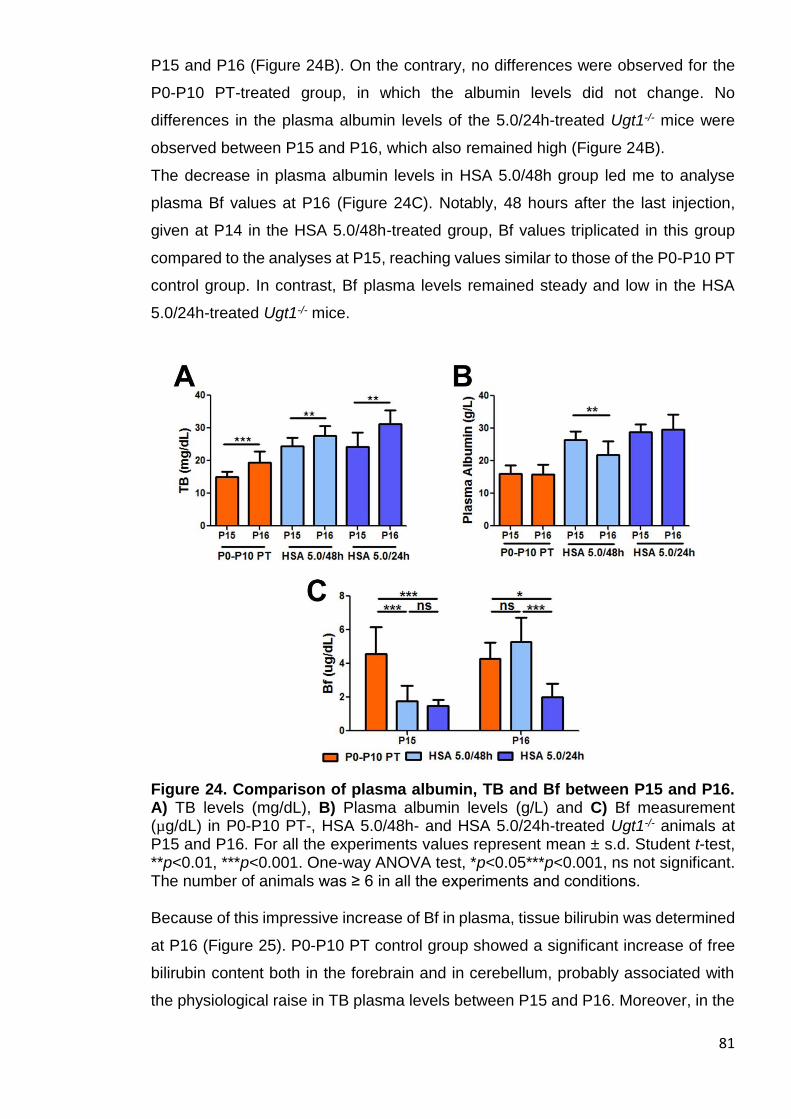
81
P15 and P16 (Figure 24B). On the contrary, no differences were observed for the
P0-P10 PT-treated group, in which the albumin levels did not change. No
differences in the plasma albumin levels of the 5.0/24h-treated Ugt1-/- mice were
observed between P15 and P16, which also remained high (Figure 24B).
The decrease in plasma albumin levels in HSA 5.0/48h group led me to analyse
plasma Bf values at P16 (Figure 24C). Notably, 48 hours after the last injection,
given at P14 in the HSA 5.0/48h-treated group, Bf values triplicated in this group
compared to the analyses at P15, reaching values similar to those of the P0-P10 PT
control group. In contrast, Bf plasma levels remained steady and low in the HSA
5.0/24h-treated Ugt1-/- mice.
Figure 24. Comparison of plasma albumin, TB and Bf between P15 and P16. A) TB levels (mg/dL), B) Plasma albumin levels (g/L) and C) Bf measurement (µg/dL) in P0-P10 PT-, HSA 5.0/48h- and HSA 5.0/24h-treated Ugt1-/- animals at P15 and P16. For all the experiments values represent mean ± s.d. Student t-test, **p<0.01, ***p<0.001. One-way ANOVA test, *p<0.05***p<0.001, ns not significant. The number of animals was ≥ 6 in all the experiments and conditions. Because of this impressive increase of Bf in plasma, tissue bilirubin was determined
at P16 (Figure 25). P0-P10 PT control group showed a significant increase of free
bilirubin content both in the forebrain and in cerebellum, probably associated with
the physiological raise in TB plasma levels between P15 and P16. Moreover, in the
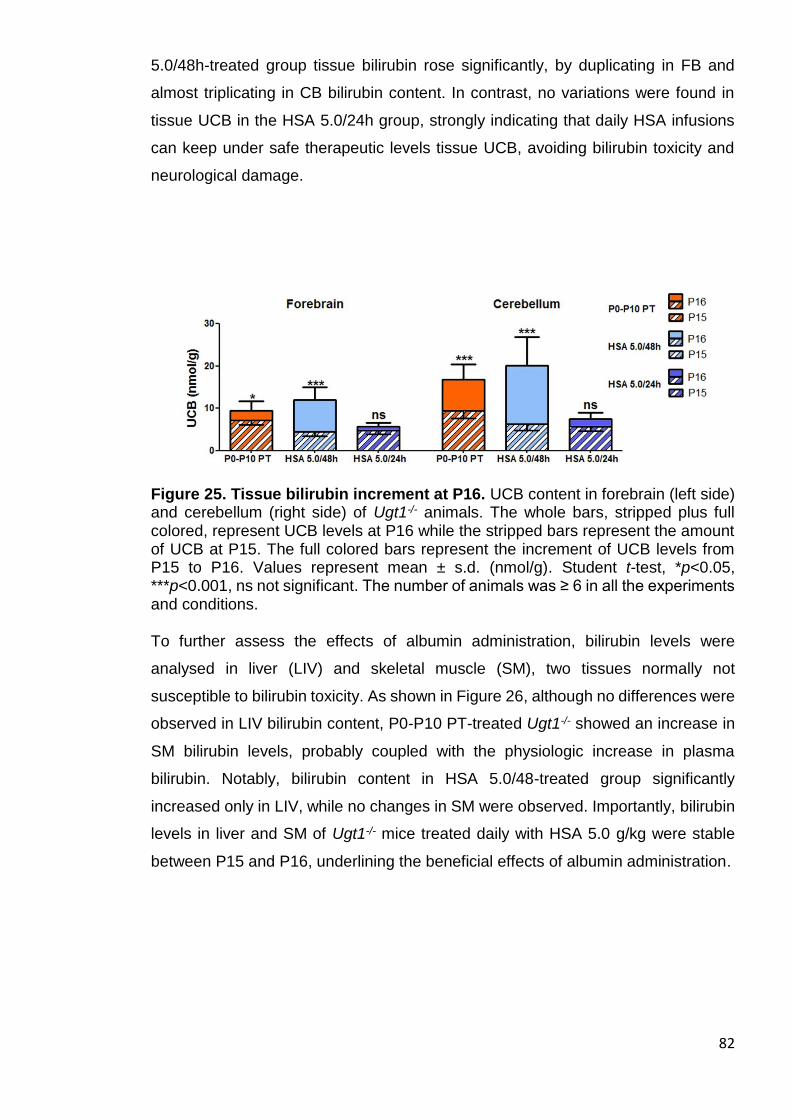
82
5.0/48h-treated group tissue bilirubin rose significantly, by duplicating in FB and
almost triplicating in CB bilirubin content. In contrast, no variations were found in
tissue UCB in the HSA 5.0/24h group, strongly indicating that daily HSA infusions
can keep under safe therapeutic levels tissue UCB, avoiding bilirubin toxicity and
neurological damage.
Figure 25. Tissue bilirubin increment at P16. UCB content in forebrain (left side) and cerebellum (right side) of Ugt1-/- animals. The whole bars, stripped plus full colored, represent UCB levels at P16 while the stripped bars represent the amount of UCB at P15. The full colored bars represent the increment of UCB levels from P15 to P16. Values represent mean ± s.d. (nmol/g). Student t-test, *p<0.05, ***p<0.001, ns not significant. The number of animals was ≥ 6 in all the experiments and conditions. To further assess the effects of albumin administration, bilirubin levels were
analysed in liver (LIV) and skeletal muscle (SM), two tissues normally not
susceptible to bilirubin toxicity. As shown in Figure 26, although no differences were
observed in LIV bilirubin content, P0-P10 PT-treated Ugt1-/- showed an increase in
SM bilirubin levels, probably coupled with the physiologic increase in plasma
bilirubin. Notably, bilirubin content in HSA 5.0/48-treated group significantly
increased only in LIV, while no changes in SM were observed. Importantly, bilirubin
levels in liver and SM of Ugt1-/- mice treated daily with HSA 5.0 g/kg were stable
between P15 and P16, underlining the beneficial effects of albumin administration.
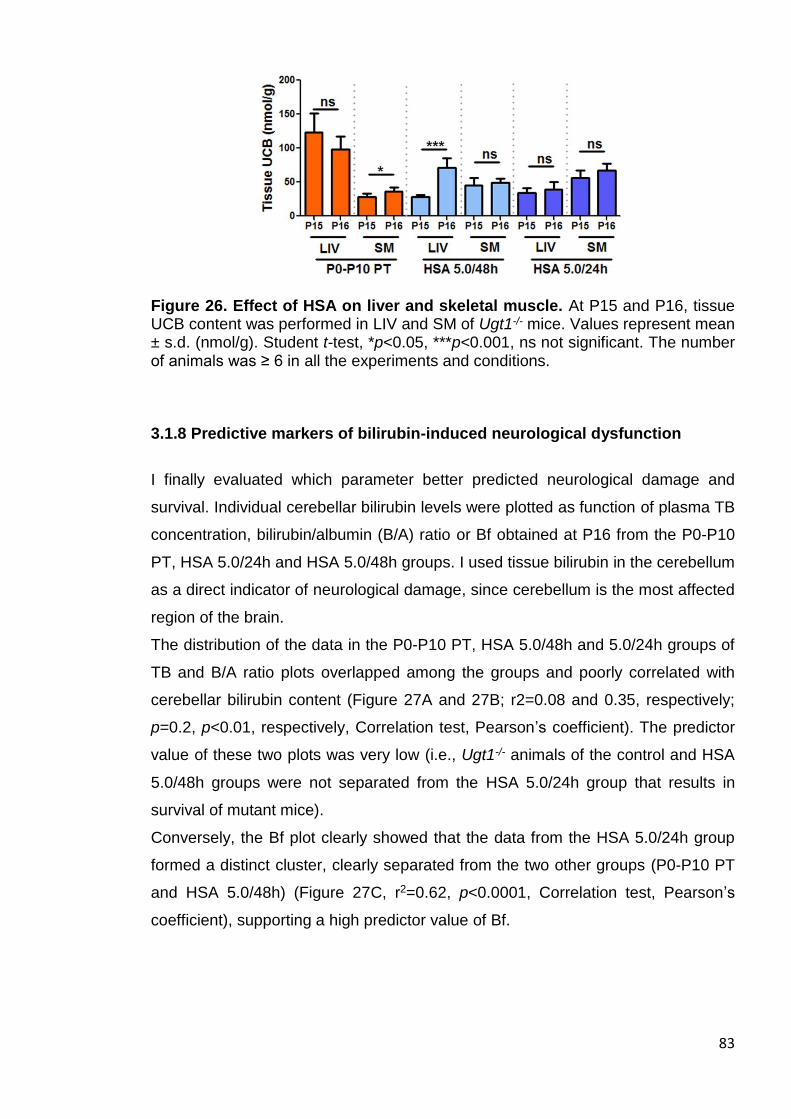
83
Figure 26. Effect of HSA on liver and skeletal muscle. At P15 and P16, tissue UCB content was performed in LIV and SM of Ugt1-/- mice. Values represent mean ± s.d. (nmol/g). Student t-test, *p<0.05, ***p<0.001, ns not significant. The number of animals was ≥ 6 in all the experiments and conditions.
3.1.8 Predictive markers of bilirubin-induced neurological dysfunction
I finally evaluated which parameter better predicted neurological damage and
survival. Individual cerebellar bilirubin levels were plotted as function of plasma TB
concentration, bilirubin/albumin (B/A) ratio or Bf obtained at P16 from the P0-P10
PT, HSA 5.0/24h and HSA 5.0/48h groups. I used tissue bilirubin in the cerebellum
as a direct indicator of neurological damage, since cerebellum is the most affected
region of the brain.
The distribution of the data in the P0-P10 PT, HSA 5.0/48h and 5.0/24h groups of
TB and B/A ratio plots overlapped among the groups and poorly correlated with
cerebellar bilirubin content (Figure 27A and 27B; r2=0.08 and 0.35, respectively;
p=0.2, p<0.01, respectively, Correlation test, Pearson’s coefficient). The predictor
value of these two plots was very low (i.e., Ugt1-/- animals of the control and HSA
5.0/48h groups were not separated from the HSA 5.0/24h group that results in
survival of mutant mice).
Conversely, the Bf plot clearly showed that the data from the HSA 5.0/24h group
formed a distinct cluster, clearly separated from the two other groups (P0-P10 PT
and HSA 5.0/48h) (Figure 27C, r2=0.62, p<0.0001, Correlation test, Pearson’s
coefficient), supporting a high predictor value of Bf.
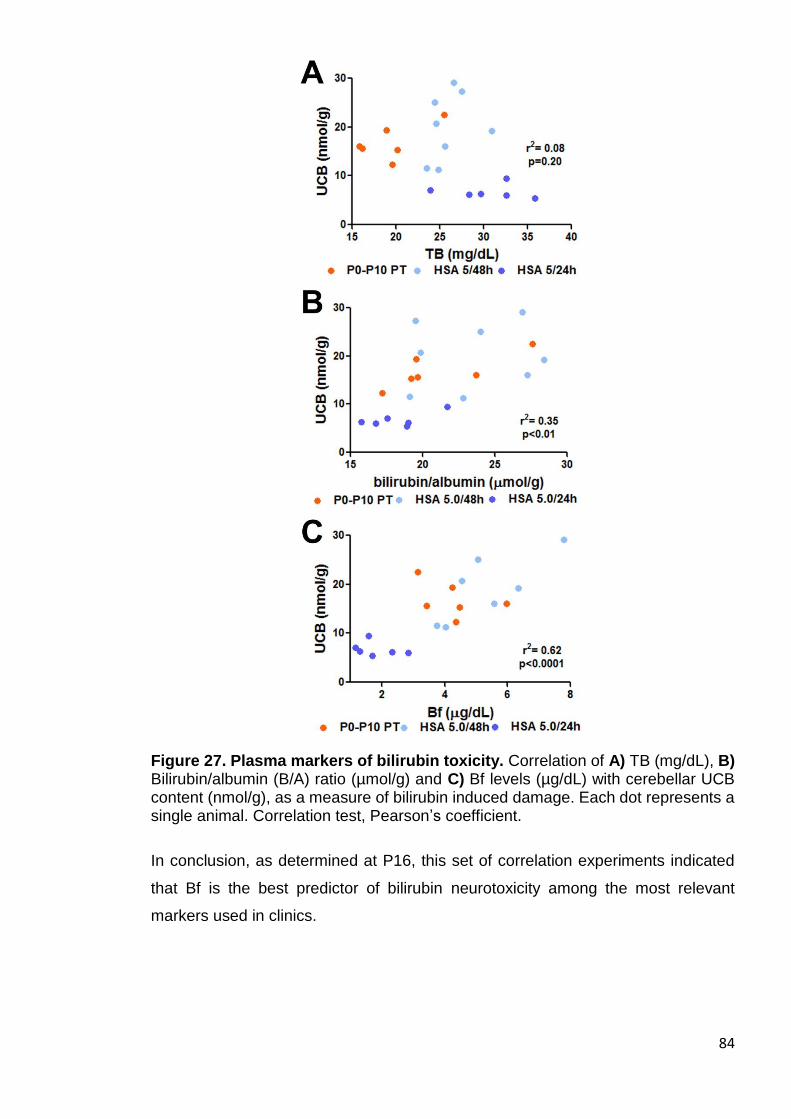
84
Figure 27. Plasma markers of bilirubin toxicity. Correlation of A) TB (mg/dL), B) Bilirubin/albumin (B/A) ratio (µmol/g) and C) Bf levels (µg/dL) with cerebellar UCB content (nmol/g), as a measure of bilirubin induced damage. Each dot represents a single animal. Correlation test, Pearson’s coefficient.
In conclusion, as determined at P16, this set of correlation experiments indicated
that Bf is the best predictor of bilirubin neurotoxicity among the most relevant
markers used in clinics.
85
3.2 Molecular basis of neurotoxicity in neonatal hyperbilirubinemia
Despite intensive studies, cellular and molecular events leading to irreversible BIND
remained not fully understood. The purpose of this investigation is the identification
of the neurological events preceding and leading to BIND.
3.2.1. Experimental plan
As a further effort to deeper investigate the mechanisms leading to bilirubin
neurotoxicity, it was performed a time-course analysis of Ugt1-/- animals at three
different time points: P5, at the onset of the pathology; P8 (Figure 28A), as a more
advanced pathological condition, shown to be a key time point reversible by PT
application in a low proportion of mice (Bortolussi et al., 2014); and finally P10, as
the latest and most severe analysed phase, the day before the observed 50 %
mortality of Ugt1-/- mice (P11, Figure 28B). At the indicated time points I studied
bilirubin susceptibility of different neuronal cell types, such as PCs and Granule cells
(GCs).
In addition, to illustrate a comprehensive landscape of bilirubin neurotoxicity effects
it was investigated the activation of different mechanisms induced by bilirubin, such
as neuroinflammation and its relative markers, endoplasmic reticulum (ER) and
oxidative stress.
3.2.2. Susceptibility to bilirubin depends on the neuronal type and its
developmental stage
One of the major features of BIND is neurodegeneration, a mechanism that involves
the collapse of neuronal cell structure and cell death (Haustein et al., 2010). A
previous work from Mouse Molecular Genetics lab has shown that apoptosis,
assessed by caspase 3 activation at P4, is induced by hyperbilirubinemia in the
cerebellum of C57BL/6 Ugt1-/- mice (Bortolussi et al., 2015), a mouse strain carrying
the same genetic mutation but showing a more severe phenotype (Bortolussi et al.,
2012). Hence, I investigated the activation of the apoptotic pathway in FVB/NJ Ugt1-
/- mice and their WT littermates by Western blot (WB) analysis. On the contrary to
what observed at P4 in the C57BL/6 strain (Bortolussi et al., 2015), no increase in
86
caspase 3 cleavage was shown at P5, while a two-fold increase was observed at
P8 (Figure 28C).
To assess bilirubin-induced neurological damage at cerebellar level, brain sections
of Ugt1-/- mice were stained with Nissl staining at P8 and P10 (Figures 28D and 28E,
respectively). Next, layers’ thickness was quantified in WT and Ugt1-/- pups, showing
a significant reduction in the EGL and ML at both P8 and P10. I observed a ~ 45%
reduction of EGL-thickness at both time points analysed, while ML-thickness was
reduced by 25% at P8 and by 34% at P10 in Ugt1-/- mice (Figure 28D and 28E,
respectively). Furthermore, the internal granular layer (IGL)-thickness was reduced
only at P10, in which Ugt1-/- presented 25% reduction compared to WT littermates
(Figure 28E).
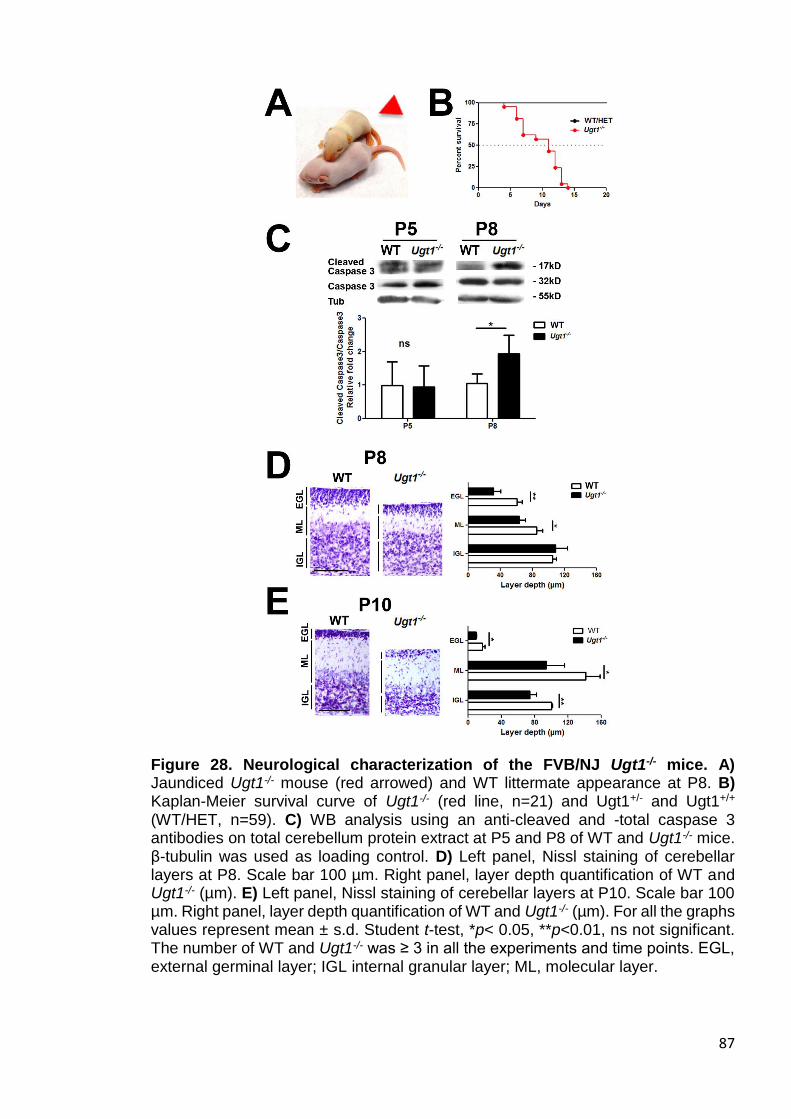
87
Figure 28. Neurological characterization of the FVB/NJ Ugt1-/- mice. A) Jaundiced Ugt1-/- mouse (red arrowed) and WT littermate appearance at P8. B) Kaplan-Meier survival curve of Ugt1-/- (red line, n=21) and Ugt1+/- and Ugt1+/+ (WT/HET, n=59). C) WB analysis using an anti-cleaved and -total caspase 3 antibodies on total cerebellum protein extract at P5 and P8 of WT and Ugt1-/- mice. β-tubulin was used as loading control. D) Left panel, Nissl staining of cerebellar layers at P8. Scale bar 100 µm. Right panel, layer depth quantification of WT and Ugt1-/- (µm). E) Left panel, Nissl staining of cerebellar layers at P10. Scale bar 100 µm. Right panel, layer depth quantification of WT and Ugt1-/- (µm). For all the graphs values represent mean ± s.d. Student t-test, *p< 0.05, **p<0.01, ns not significant. The number of WT and Ugt1-/- was ≥ 3 in all the experiments and time points. EGL, external germinal layer; IGL internal granular layer; ML, molecular layer.
88
To have a deeper insight about the effects of bilirubin neurotoxicity, different types
of cerebellar neurons were investigated. By real-time RT-PCR, WB and IF, it was
first estimated bilirubin detrimental effects on PCs by the analysis of calbindin1, a
PCs-specific marker (Whitney et al., 2008). A significant reduction of calbindin
mRNA levels was observed only at P10, although a non-statistically significant
decrease was also evident in the earlier time points analysed in Ugt1-/- mice (Figure
29A). Then, protein levels were analysed by WB analysis using an anti-calbindin
specific antibody. It was observed a minor reduction in calbindin levels at P5, while
a significant reduction in mutant cerebellar protein extracts was observed in Ugt1-/-
mice compared to WT at P8 and P10, showing 56% and 61% decrease, respectively
(Figure 29B).
IF experiments (Figure 29C and 29D) confirmed the results obtained by RT-PCR
and WB, showing a 30% and 50% reduction in PCs number at P8 and P10,
respectively (Figure 29D), and the almost complete absence of the PCs’ dendritic
arbor in Ugt1-/- mice.

89
Figure 29. Bilirubin affects PCs dendritic arborization and survival. A) Time-course of calbindin mRNA expression levels at P5, P8 and P10 in total RNA preparations of WT and Ugt1-/- cerebella. B) WB analysis of total cerebellum protein extracts using an anti-calbindin antibody at indicated time points of WT and Ugt1-/- mice. β-tubulin was used as loading control. C) Low-magnification images at P10 of representative IF of WT and Ugt1-/- cerebellum sections using anti-calbindin antibody (red) to highlight PCs. Hoechst (blue) was used to mark nuclei. Scale bar: 500 µm. D) High-magnification images of cerebellar sections from WT and Ugt1-/- mice at P8 and P10, using an anti-calbindin antibody (red) to highlight PCs. Hoechst (blue) was used to mark nuclei. Scale bar: 50 µm. The quantification of PCs number at P8 and P10 of WT and Ugt1-/- mice is represented in the bar graph (cell/mm). For all the experiments values represent mean ± s.d. Student t-test, *p< 0.05, **p<0.01, ***p<0.001, ns not significant. The number of WT and Ugt1-/- was ≥ 3 in all the experiments and time points.
Next, to determine whether bilirubin affected mature cerebellar GCs, it was analysed
the nuclear protein NeuN, since its expression in the cerebellum is restricted to
differentiated granule neurons (Sarnat et al., 1998). NeuN expression levels were
not affected in Ugt1-/- mice compared to WT animals at all time points analysed, as
determined by real-time RT-PCR (Figure 30A). WB experiments confirmed the
mRNA expression results, as it was observed no changes in protein levels of NeuN
of cerebellar extracts from Ugt1-/- and WT mice at P5, P8 and P10 (Figure 30B). IF
analysis performed at P8 and P10 (Figure 30C and 30D) showed no obvious
reduction in cell density of neurons located in the IGL, indicating that chronic
exposure to bilirubin in Ugt1-/- mice did not affect differentiated granule cells survival.
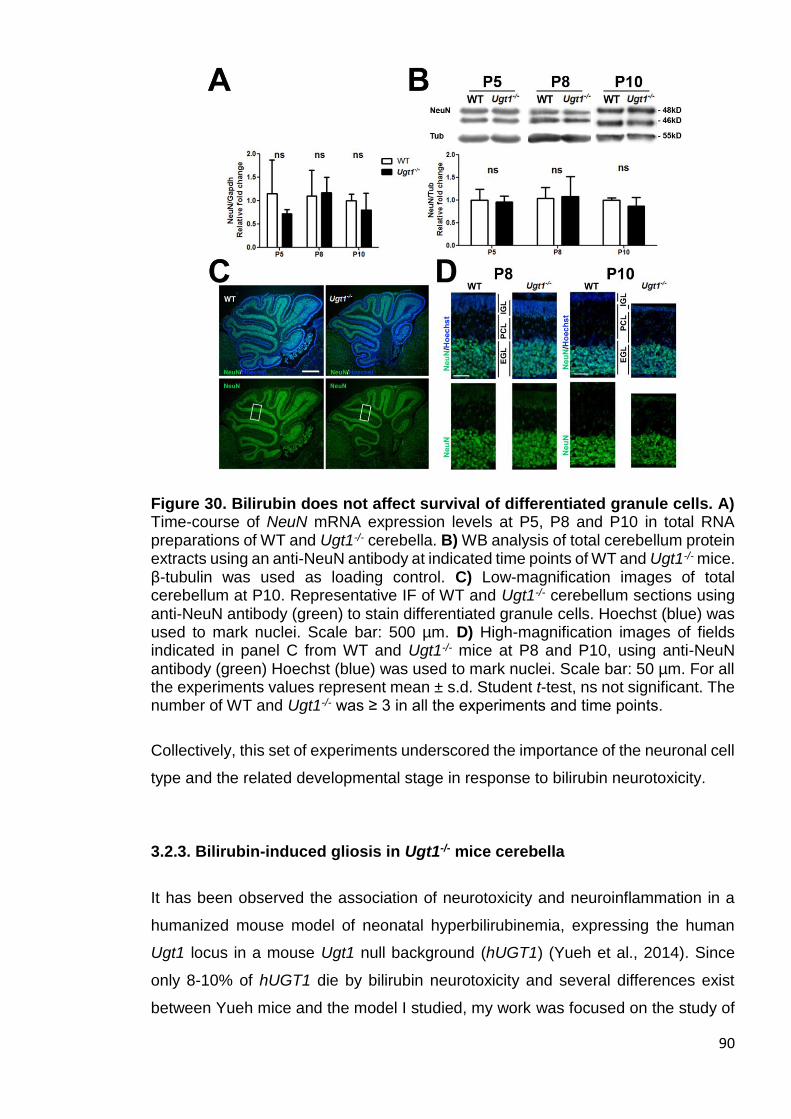
90
Figure 30. Bilirubin does not affect survival of differentiated granule cells. A) Time-course of NeuN mRNA expression levels at P5, P8 and P10 in total RNA preparations of WT and Ugt1-/- cerebella. B) WB analysis of total cerebellum protein extracts using an anti-NeuN antibody at indicated time points of WT and Ugt1-/- mice. β-tubulin was used as loading control. C) Low-magnification images of total cerebellum at P10. Representative IF of WT and Ugt1-/- cerebellum sections using anti-NeuN antibody (green) to stain differentiated granule cells. Hoechst (blue) was used to mark nuclei. Scale bar: 500 µm. D) High-magnification images of fields indicated in panel C from WT and Ugt1-/- mice at P8 and P10, using anti-NeuN antibody (green) Hoechst (blue) was used to mark nuclei. Scale bar: 50 µm. For all the experiments values represent mean ± s.d. Student t-test, ns not significant. The number of WT and Ugt1-/- was ≥ 3 in all the experiments and time points.
Collectively, this set of experiments underscored the importance of the neuronal cell
type and the related developmental stage in response to bilirubin neurotoxicity.
3.2.3. Bilirubin-induced gliosis in Ugt1-/- mice cerebella
It has been observed the association of neurotoxicity and neuroinflammation in a
humanized mouse model of neonatal hyperbilirubinemia, expressing the human
Ugt1 locus in a mouse Ugt1 null background (hUGT1) (Yueh et al., 2014). Since
only 8-10% of hUGT1 die by bilirubin neurotoxicity and several differences exist
between Yueh mice and the model I studied, my work was focused on the study of

91
neuroinflammation, investigating whether an increase in inflammatory markers
could be coupled to bilirubin-induced neurodegeneration and death in the Ugt1-/-
mouse model of severe neonatal hyperbilirubinemia.
First, to determine the astrocyte response to bilirubin the levels of glial fibrillary
acidic protein (GFAP), an astrocyte-specific marker (Sofroniew and Vinters, 2010)
were assessed. The time-course analysis of GFAP mRNA expression levels
revealed no alterations in the earliest time point (P5, Figure 31A). Conversely, a 3-
and 7-fold GFAP mRNA level increase was detected in Ugt1-/- mice at P8 and P10,
respectively (Figure 31A). WB analysis of cerebellar protein extracts confirmed the
increase in mRNA expression, showing no differences were observed at P5, but a
2- to 3-fold increase at P8 and P10 in Ugt1-/- pups (Figure 31B).
IF analysis at P8 and at P10 on cerebellar sections of WT and Ugt1-/- littermates
showed the localization of GFAP positive signal (glial scar) in proximity to cerebellar
fissures in which PCs loss was more evident, such as fissures IV to VIII (Figure
31C). The higher magnification analysis performed at P8 and P10 (Figure 31D)
confirmed the previous observation, as GFAP-positive cells correlated with the time-
dependent loss of PCs.

92
Figure 31. Bilirubin triggers the activation of astrocytes. A) Time-course of GFAP mRNA expression levels at P5, P8 and P10 in total RNA preparations of WT and Ugt1-/- cerebella. B) WB analysis of total cerebellum protein extracts using an anti-GFAP antibody at indicated time points of WT and Ugt1-/- mice. β-tubulin was used as loading control. C) Low-magnification images of representative IF from WT and Ugt1-/- cerebellum sections using anti-GFAP antibody (red) to detect astrocytes, co-stained with an anti-calbindin antibody (green) to highlight PCs. Hoechst (blue) was used to mark nuclei. Scale bar: 200 µm. Boxed areas indicate fields shown in Figure 2B. IV, VI, VIa, VIb, VII and IX indicate the cerebellar fissures. D) High-magnification images of boxed areas indicated in panel C. Scale bar: 50 µm. For all the experiments values represent mean ± s.d. Student t-test, *p< 0.05, **p<0.01, ***p<0.001, ns not significant. The number of WT and Ugt1-/- was ≥ 3 in all the experiments and time points.
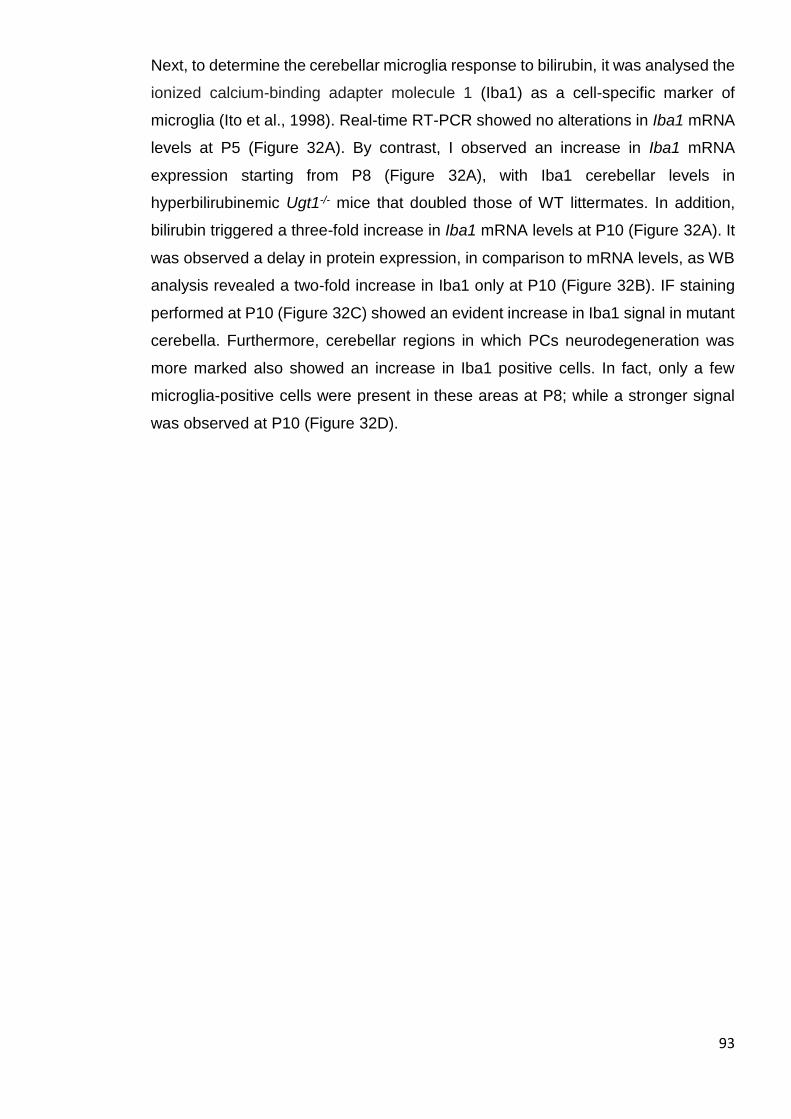
93
Next, to determine the cerebellar microglia response to bilirubin, it was analysed the
ionized calcium-binding adapter molecule 1 (Iba1) as a cell-specific marker of
microglia (Ito et al., 1998). Real-time RT-PCR showed no alterations in Iba1 mRNA
levels at P5 (Figure 32A). By contrast, I observed an increase in Iba1 mRNA
expression starting from P8 (Figure 32A), with Iba1 cerebellar levels in
hyperbilirubinemic Ugt1-/- mice that doubled those of WT littermates. In addition,
bilirubin triggered a three-fold increase in Iba1 mRNA levels at P10 (Figure 32A). It
was observed a delay in protein expression, in comparison to mRNA levels, as WB
analysis revealed a two-fold increase in Iba1 only at P10 (Figure 32B). IF staining
performed at P10 (Figure 32C) showed an evident increase in Iba1 signal in mutant
cerebella. Furthermore, cerebellar regions in which PCs neurodegeneration was
more marked also showed an increase in Iba1 positive cells. In fact, only a few
microglia-positive cells were present in these areas at P8; while a stronger signal
was observed at P10 (Figure 32D).
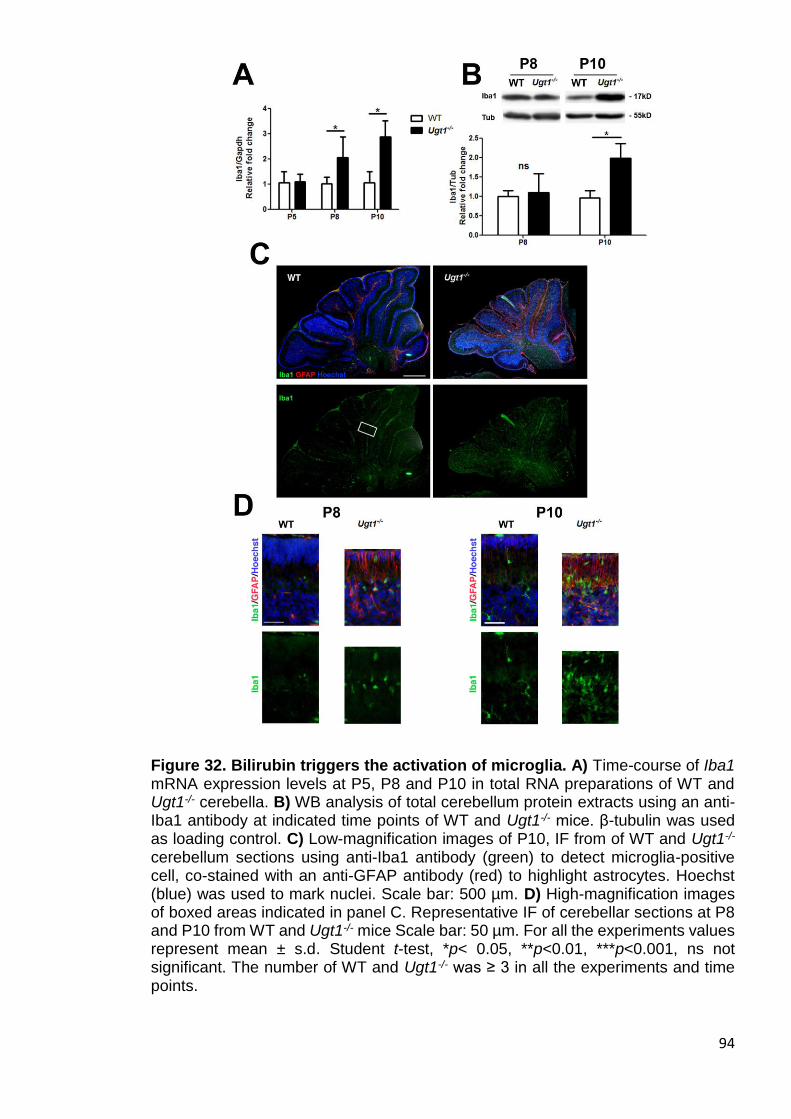
94
Figure 32. Bilirubin triggers the activation of microglia. A) Time-course of Iba1 mRNA expression levels at P5, P8 and P10 in total RNA preparations of WT and Ugt1-/- cerebella. B) WB analysis of total cerebellum protein extracts using an anti-Iba1 antibody at indicated time points of WT and Ugt1-/- mice. β-tubulin was used as loading control. C) Low-magnification images of P10, IF from of WT and Ugt1-/- cerebellum sections using anti-Iba1 antibody (green) to detect microglia-positive cell, co-stained with an anti-GFAP antibody (red) to highlight astrocytes. Hoechst (blue) was used to mark nuclei. Scale bar: 500 µm. D) High-magnification images of boxed areas indicated in panel C. Representative IF of cerebellar sections at P8 and P10 from WT and Ugt1-/- mice Scale bar: 50 µm. For all the experiments values represent mean ± s.d. Student t-test, *p< 0.05, **p<0.01, ***p<0.001, ns not significant. The number of WT and Ugt1-/- was ≥ 3 in all the experiments and time points.

95
3.2.4 Time-dependent decrease of M2 is inversely proportional to M1
activation
The inflammatory response typically involves the resident population of tissue
macrophages. Macrophages states can be divided in two main types: M1 and M2,
which correspond to inflammatory and neuroprotective ones, respectively. To better
characterize microglia activation during prolonged bilirubin exposure, it was
performed a real-time RT-PCR analysis of molecular markers that discriminate
microglia/macrophage states. These markers are key features of the pro-
inflammatory M1 type of microglia (cluster of differentiation (CD) 68 and 86) and the
anti-inflammatory M2 type of microglia [mannose receptor complex (MRC) 1 and 2
and arginase 1 (Arg1)].
A marker of neuro-inflammatory (M1 type) microglia, CD68, showed 2.1-, 2.5- and
3.5-fold increase at P5, P8 and P10, respectively, compared to WT levels (Figure
33). On the contrary, the expression analysis of CD86, another component of M1
type microglia, revealed that mRNA levels of Ugt1-/- mice were similar to those of
WT littermates.
By contrast, real-time RT-PCR analysis revealed an inverted trend for the M2 type,
which is the neuroprotective counterpart of microglia. MRC1 and Arg1 in mutant
mice showed decreased expression over time, while MRC2 was significantly
activated only at P8 (Figure 33).
Since the transition from M2 to M1 phenotype is generally associated with
inflammation-induced pathologies, taken together these data indicate that exposure
to bilirubin triggers activation of pro-inflammatory microglia and a parallel decrease
in the neuroprotective one.
96
Figure 33. Bilirubin induces activation of pro-inflammatory microglia. Time-course of mRNA expression levels of M1 and M2 microglia markers. WT and Ugt1-
/- mice mRNA cerebellar expression levels of CD68, CD86, MRC1, Arg1 and MRC2 were analysed at the indicated time points. Values represent the mean ± s.d. Student t-test, *p< 0.05, ***p<0.001. The number of WT and Ugt1-/- was ≥ 3 in all the experiments and time points.
3.2.5 Amplifiers genes of bilirubin-induces inflammatory response
To be effective, the immune response must be amplified by the recruitment of
additional cells to the site of ‘injury”. Important players of this response are cytokines
(e.g. INFγ, TNFα and ILs) and chemokines that also serve to recruit additional
immune cells. Moreover, during the inflammatory process other inflammatory
players may influence substrate metabolism, cell mobility, phagocytosis,
intracellular killing and antigen presentation.
Thus, some of these inflammatory markers were analysed by real-time RT-PCR
[interleukin (IL) 1β, IL6, IL10, interferon γ (INFγ), Toll-like receptor 2 (TLR2),
inducible nitric oxide synthase (iNOS), neuronal NOS (nNOS), IL18, nuclear factor
kappa-light-chain-enhancer of activated B cells (NFKβ), matrix metalloproteinases
2 (MMP2) and 9 (MMP9) and tumor necrosis factor α (TNFα)].
As shown in Figure 34, it was not possible to detect several cytokines and
inflammatory markers known to be involved in response to the bilirubin insult (Figure
34A). To rule out technical problems limiting the detection of inflammatory markers,
dendritic cells (DCs) treated with LPS for 24 hours were used as positive control.
Few candidate genes were below the detection limit in cerebellar RNA extracts
(Figure 34A), showing a technically clear product only in DCs RNA extracts (such
as IL1β, Figure 34B), while all the other candidate genes used in this study showed
a clear product both in DCs and cerebellar RNA extracts (such as TNFα, Figure
34C).
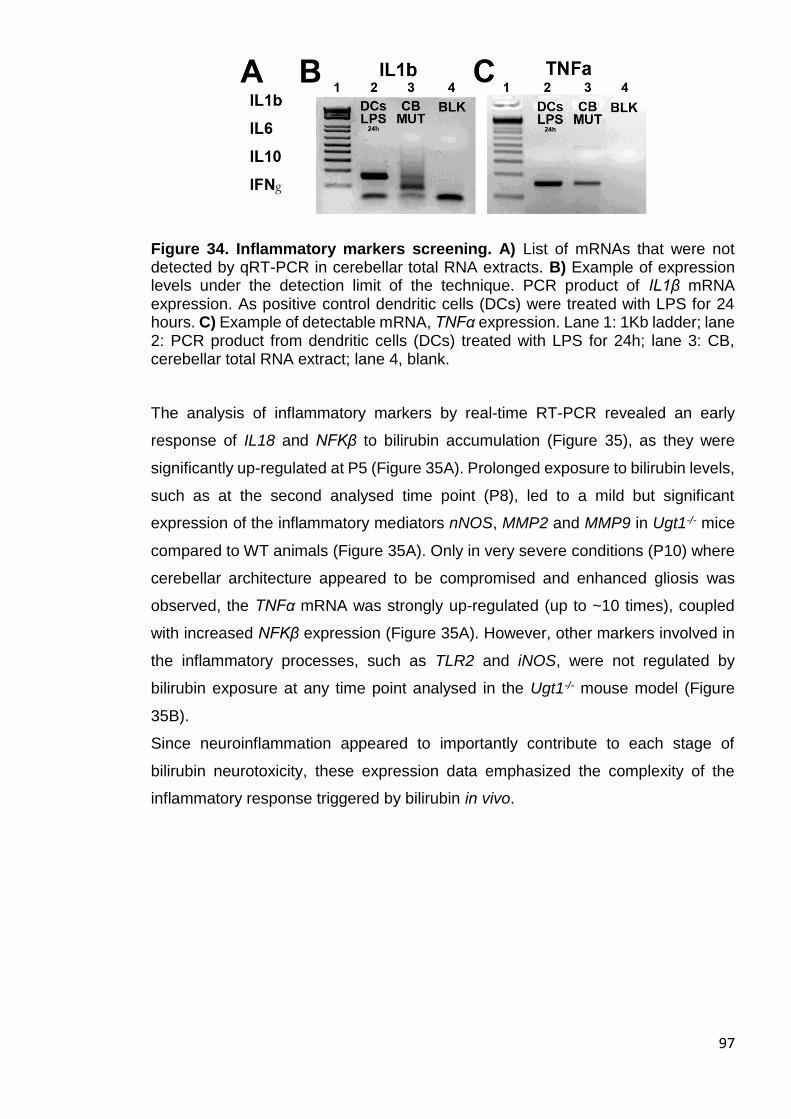
97
Figure 34. Inflammatory markers screening. A) List of mRNAs that were not detected by qRT-PCR in cerebellar total RNA extracts. B) Example of expression levels under the detection limit of the technique. PCR product of IL1β mRNA expression. As positive control dendritic cells (DCs) were treated with LPS for 24 hours. C) Example of detectable mRNA, TNFα expression. Lane 1: 1Kb ladder; lane 2: PCR product from dendritic cells (DCs) treated with LPS for 24h; lane 3: CB, cerebellar total RNA extract; lane 4, blank.
The analysis of inflammatory markers by real-time RT-PCR revealed an early
response of IL18 and NFKβ to bilirubin accumulation (Figure 35), as they were
significantly up-regulated at P5 (Figure 35A). Prolonged exposure to bilirubin levels,
such as at the second analysed time point (P8), led to a mild but significant
expression of the inflammatory mediators nNOS, MMP2 and MMP9 in Ugt1-/- mice
compared to WT animals (Figure 35A). Only in very severe conditions (P10) where
cerebellar architecture appeared to be compromised and enhanced gliosis was
observed, the TNFα mRNA was strongly up-regulated (up to ~10 times), coupled
with increased NFKβ expression (Figure 35A). However, other markers involved in
the inflammatory processes, such as TLR2 and iNOS, were not regulated by
bilirubin exposure at any time point analysed in the Ugt1-/- mouse model (Figure
35B).
Since neuroinflammation appeared to importantly contribute to each stage of
bilirubin neurotoxicity, these expression data emphasized the complexity of the
inflammatory response triggered by bilirubin in vivo.
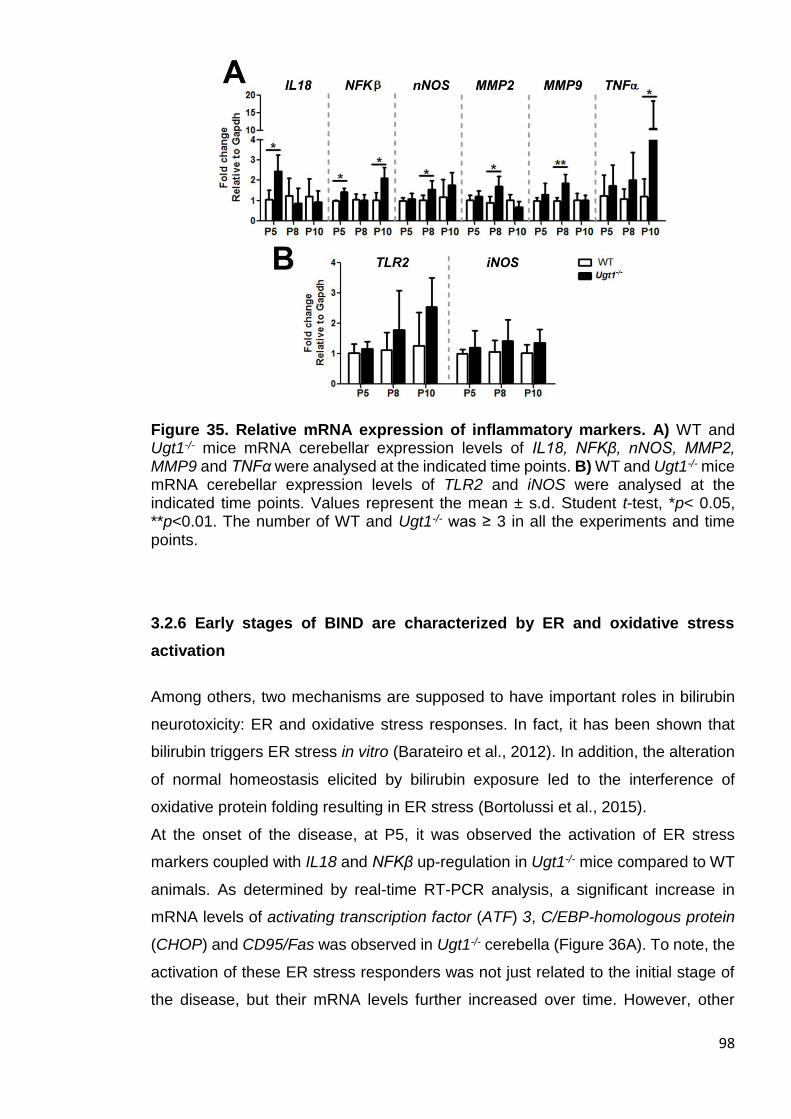
98
Figure 35. Relative mRNA expression of inflammatory markers. A) WT and Ugt1-/- mice mRNA cerebellar expression levels of IL18, NFKβ, nNOS, MMP2, MMP9 and TNFα were analysed at the indicated time points. B) WT and Ugt1-/- mice mRNA cerebellar expression levels of TLR2 and iNOS were analysed at the indicated time points. Values represent the mean ± s.d. Student t-test, *p< 0.05, **p<0.01. The number of WT and Ugt1-/- was ≥ 3 in all the experiments and time points.
3.2.6 Early stages of BIND are characterized by ER and oxidative stress
activation
Among others, two mechanisms are supposed to have important roles in bilirubin
neurotoxicity: ER and oxidative stress responses. In fact, it has been shown that
bilirubin triggers ER stress in vitro (Barateiro et al., 2012). In addition, the alteration
of normal homeostasis elicited by bilirubin exposure led to the interference of
oxidative protein folding resulting in ER stress (Bortolussi et al., 2015).
At the onset of the disease, at P5, it was observed the activation of ER stress
markers coupled with IL18 and NFKβ up-regulation in Ugt1-/- mice compared to WT
animals. As determined by real-time RT-PCR analysis, a significant increase in
mRNA levels of activating transcription factor (ATF) 3, C/EBP-homologous protein
(CHOP) and CD95/Fas was observed in Ugt1-/- cerebella (Figure 36A). To note, the
activation of these ER stress responders was not just related to the initial stage of
the disease, but their mRNA levels further increased over time. However, other

99
players of established/canonical ER stress pathways were not modified along the
analysis in the Ugt1-/- mouse model [e.g. glucose-regulated protein 78 (GRP78),
ATF4, Figure 36B], giving additional proof on the multifaceted mechanisms
associated to hyperbilirubinemia, in which not always the canonical pathways are
followed, at least in mRNA expression levels of Ugt1-/- mouse model.
Figure 36. Time-course of mRNA expression levels of ER stress-related markers. A) WT and Ugt1-/- mice mRNA cerebellar expression levels of ATF3, CHOP and CD95/Fas were analysed at the indicated time points. B) WT and Ugt1-
/- mice mRNA cerebellar expression levels of GRP78, GRP94, P58IPK, FKBP11, ATF4, DR5 and HMGB1 were analysed at the indicated time points. Values represent the mean ± s.d. Student t-test, *p< 0.05, **p<0.01, ***p<0.001. The number of WT and Ugt1-/- was ≥ 3 in all the experiments and time points.
Since a prominent ER stress response was observed, I next focused my attention
on oxidative stress, which is considered a major process affected by bilirubin. Real
time RT-PCR showed the early expression (P5) of an important transcription factor
involved in cellular response to oxidative stress, nuclear factor (erythroid-derived 2)-
like 2 (Nrf2) (Figure 37A). After peaking at P5, Nrf2 mRNA levels at P8 and P10 in
Ugt1-/- animals were similar to those of WT mice. Interestingly, the Ugt1-/- cerebellar
mRNA expression of heme oxygenase 1 (HO1), a key enzyme in heme catabolism,
increased in a time-dependent manner, starting from P8 up to ~10 times more than
WT levels at P10 (Figure 37A). However, differences in other markers of oxidative
stress were not detectable (Figure 37B).
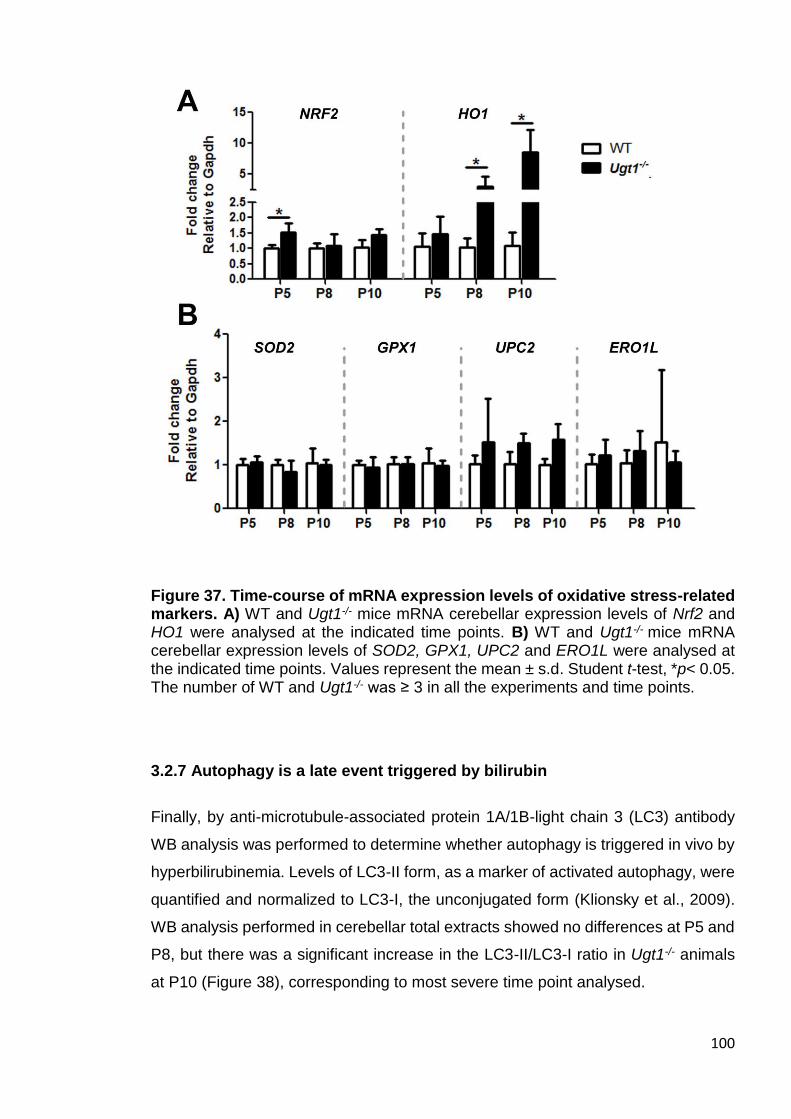
100
Figure 37. Time-course of mRNA expression levels of oxidative stress-related markers. A) WT and Ugt1-/- mice mRNA cerebellar expression levels of Nrf2 and HO1 were analysed at the indicated time points. B) WT and Ugt1-/- mice mRNA cerebellar expression levels of SOD2, GPX1, UPC2 and ERO1L were analysed at the indicated time points. Values represent the mean ± s.d. Student t-test, *p< 0.05. The number of WT and Ugt1-/- was ≥ 3 in all the experiments and time points.
3.2.7 Autophagy is a late event triggered by bilirubin
Finally, by anti-microtubule-associated protein 1A/1B-light chain 3 (LC3) antibody
WB analysis was performed to determine whether autophagy is triggered in vivo by
hyperbilirubinemia. Levels of LC3-II form, as a marker of activated autophagy, were
quantified and normalized to LC3-I, the unconjugated form (Klionsky et al., 2009).
WB analysis performed in cerebellar total extracts showed no differences at P5 and
P8, but there was a significant increase in the LC3-II/LC3-I ratio in Ugt1-/- animals
at P10 (Figure 38), corresponding to most severe time point analysed.
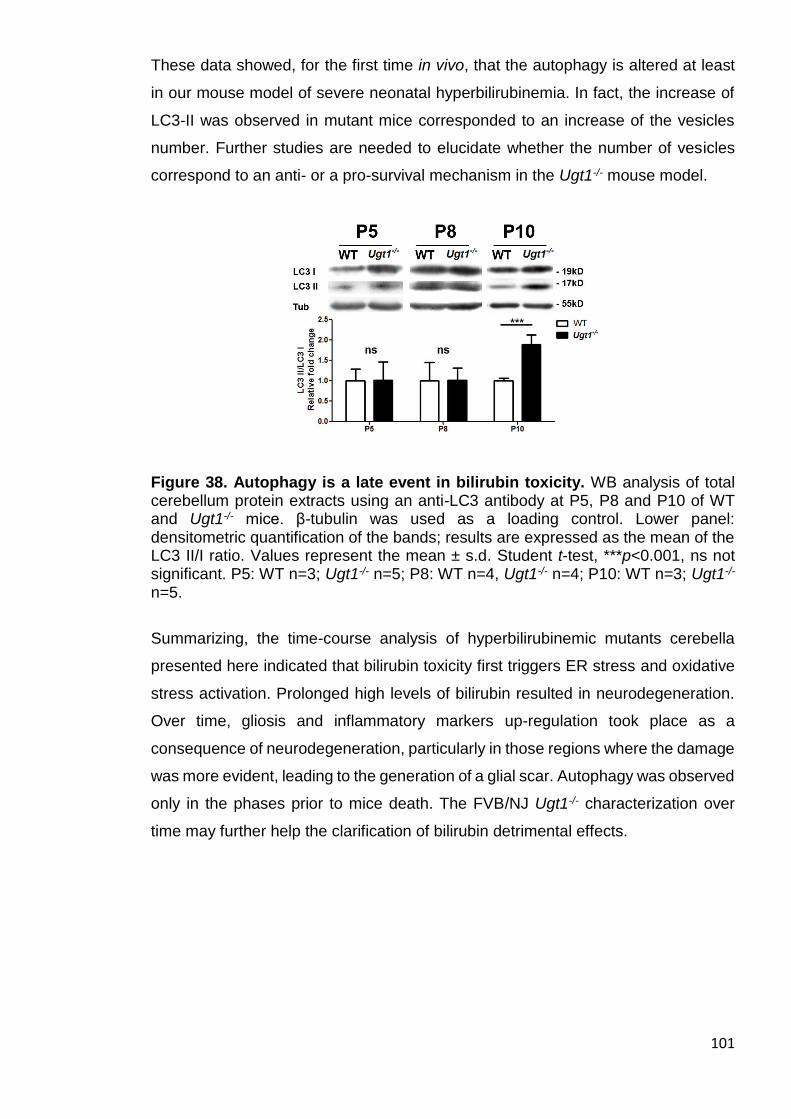
101
These data showed, for the first time in vivo, that the autophagy is altered at least
in our mouse model of severe neonatal hyperbilirubinemia. In fact, the increase of
LC3-II was observed in mutant mice corresponded to an increase of the vesicles
number. Further studies are needed to elucidate whether the number of vesicles
correspond to an anti- or a pro-survival mechanism in the Ugt1-/- mouse model.
Figure 38. Autophagy is a late event in bilirubin toxicity. WB analysis of total cerebellum protein extracts using an anti-LC3 antibody at P5, P8 and P10 of WT and Ugt1-/- mice. β-tubulin was used as a loading control. Lower panel: densitometric quantification of the bands; results are expressed as the mean of the LC3 II/I ratio. Values represent the mean ± s.d. Student t-test, ***p<0.001, ns not significant. P5: WT n=3; Ugt1-/- n=5; P8: WT n=4, Ugt1-/- n=4; P10: WT n=3; Ugt1-/- n=5.
Summarizing, the time-course analysis of hyperbilirubinemic mutants cerebella
presented here indicated that bilirubin toxicity first triggers ER stress and oxidative
stress activation. Prolonged high levels of bilirubin resulted in neurodegeneration.
Over time, gliosis and inflammatory markers up-regulation took place as a
consequence of neurodegeneration, particularly in those regions where the damage
was more evident, leading to the generation of a glial scar. Autophagy was observed
only in the phases prior to mice death. The FVB/NJ Ugt1-/- characterization over
time may further help the clarification of bilirubin detrimental effects.
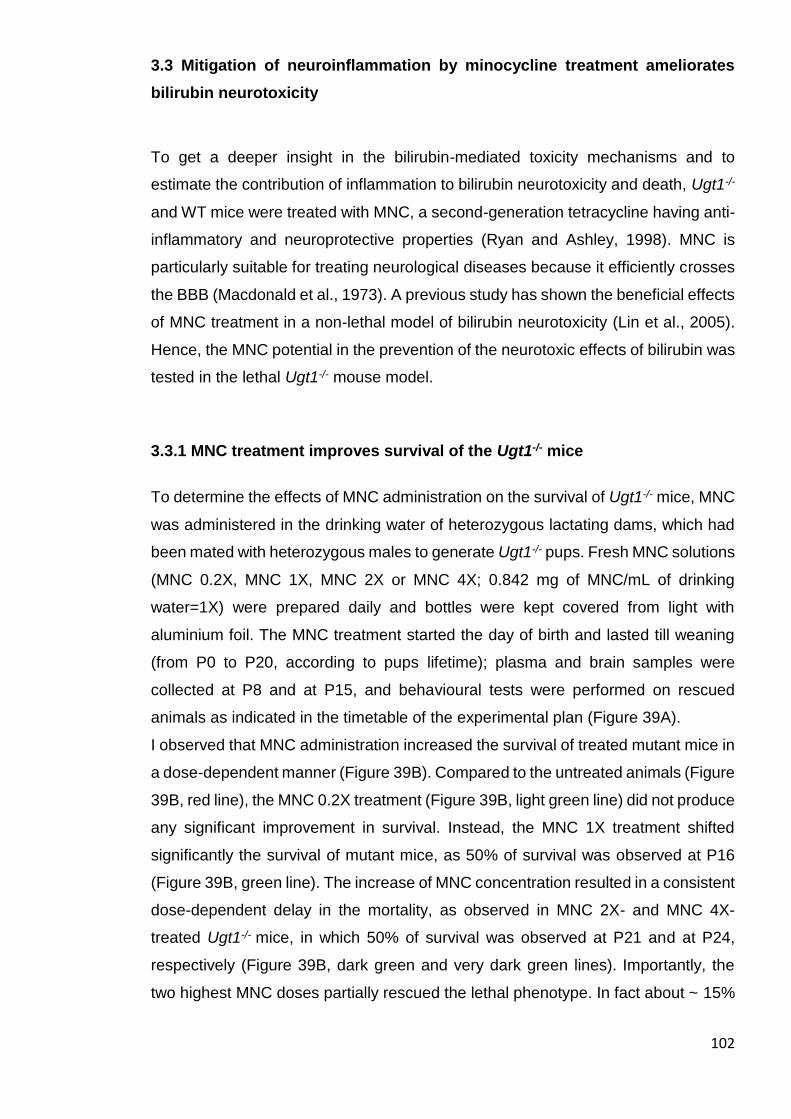
102
3.3 Mitigation of neuroinflammation by minocycline treatment ameliorates
bilirubin neurotoxicity
To get a deeper insight in the bilirubin-mediated toxicity mechanisms and to
estimate the contribution of inflammation to bilirubin neurotoxicity and death, Ugt1-/-
and WT mice were treated with MNC, a second-generation tetracycline having anti-
inflammatory and neuroprotective properties (Ryan and Ashley, 1998). MNC is
particularly suitable for treating neurological diseases because it efficiently crosses
the BBB (Macdonald et al., 1973). A previous study has shown the beneficial effects
of MNC treatment in a non-lethal model of bilirubin neurotoxicity (Lin et al., 2005).
Hence, the MNC potential in the prevention of the neurotoxic effects of bilirubin was
tested in the lethal Ugt1-/- mouse model.
3.3.1 MNC treatment improves survival of the Ugt1-/- mice
To determine the effects of MNC administration on the survival of Ugt1-/- mice, MNC
was administered in the drinking water of heterozygous lactating dams, which had
been mated with heterozygous males to generate Ugt1-/- pups. Fresh MNC solutions
(MNC 0.2X, MNC 1X, MNC 2X or MNC 4X; 0.842 mg of MNC/mL of drinking
water=1X) were prepared daily and bottles were kept covered from light with
aluminium foil. The MNC treatment started the day of birth and lasted till weaning
(from P0 to P20, according to pups lifetime); plasma and brain samples were
collected at P8 and at P15, and behavioural tests were performed on rescued
animals as indicated in the timetable of the experimental plan (Figure 39A).
I observed that MNC administration increased the survival of treated mutant mice in
a dose-dependent manner (Figure 39B). Compared to the untreated animals (Figure
39B, red line), the MNC 0.2X treatment (Figure 39B, light green line) did not produce
any significant improvement in survival. Instead, the MNC 1X treatment shifted
significantly the survival of mutant mice, as 50% of survival was observed at P16
(Figure 39B, green line). The increase of MNC concentration resulted in a consistent
dose-dependent delay in the mortality, as observed in MNC 2X- and MNC 4X-
treated Ugt1-/- mice, in which 50% of survival was observed at P21 and at P24,
respectively (Figure 39B, dark green and very dark green lines). Importantly, the
two highest MNC doses partially rescued the lethal phenotype. In fact about ~ 15%
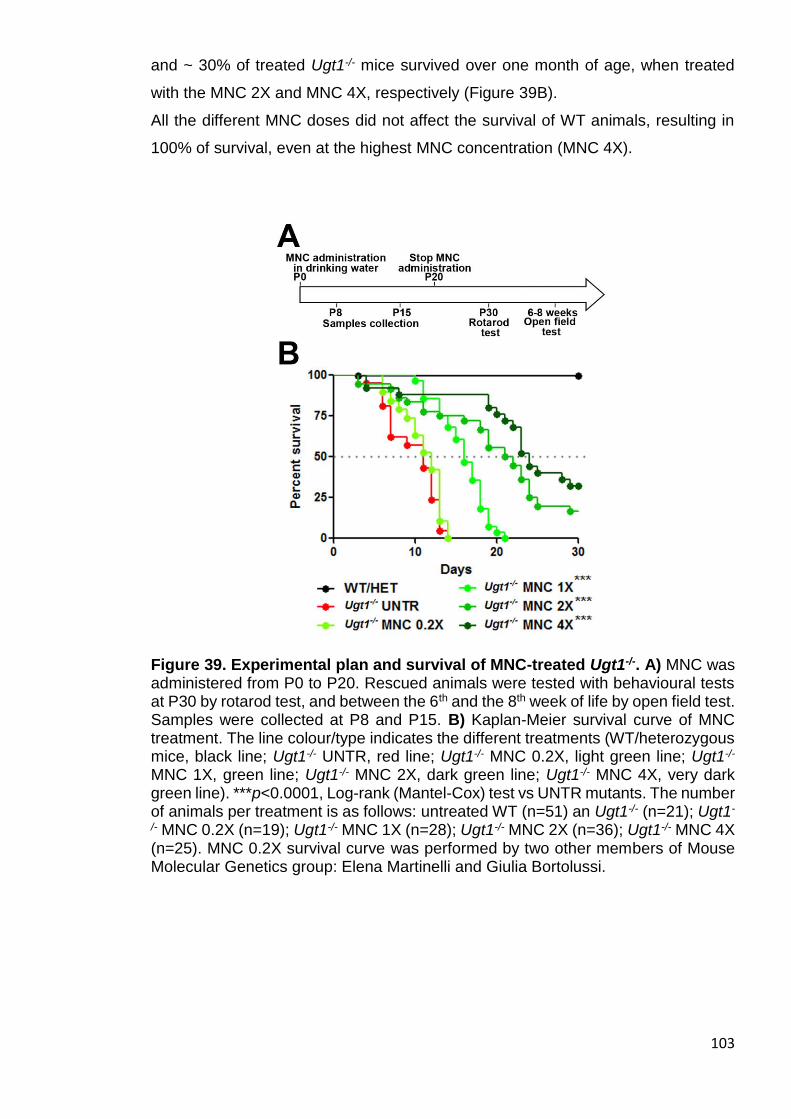
103
and ~ 30% of treated Ugt1-/- mice survived over one month of age, when treated
with the MNC 2X and MNC 4X, respectively (Figure 39B).
All the different MNC doses did not affect the survival of WT animals, resulting in
100% of survival, even at the highest MNC concentration (MNC 4X).
Figure 39. Experimental plan and survival of MNC-treated Ugt1-/-. A) MNC was administered from P0 to P20. Rescued animals were tested with behavioural tests at P30 by rotarod test, and between the 6th and the 8th week of life by open field test. Samples were collected at P8 and P15. B) Kaplan-Meier survival curve of MNC treatment. The line colour/type indicates the different treatments (WT/heterozygous mice, black line; Ugt1-/- UNTR, red line; Ugt1-/- MNC 0.2X, light green line; Ugt1-/- MNC 1X, green line; Ugt1-/- MNC 2X, dark green line; Ugt1-/- MNC 4X, very dark green line). ***p<0.0001, Log-rank (Mantel-Cox) test vs UNTR mutants. The number of animals per treatment is as follows: untreated WT (n=51) an Ugt1-/- (n=21); Ugt1-
/- MNC 0.2X (n=19); Ugt1-/- MNC 1X (n=28); Ugt1-/- MNC 2X (n=36); Ugt1-/- MNC 4X (n=25). MNC 0.2X survival curve was performed by two other members of Mouse Molecular Genetics group: Elena Martinelli and Giulia Bortolussi.
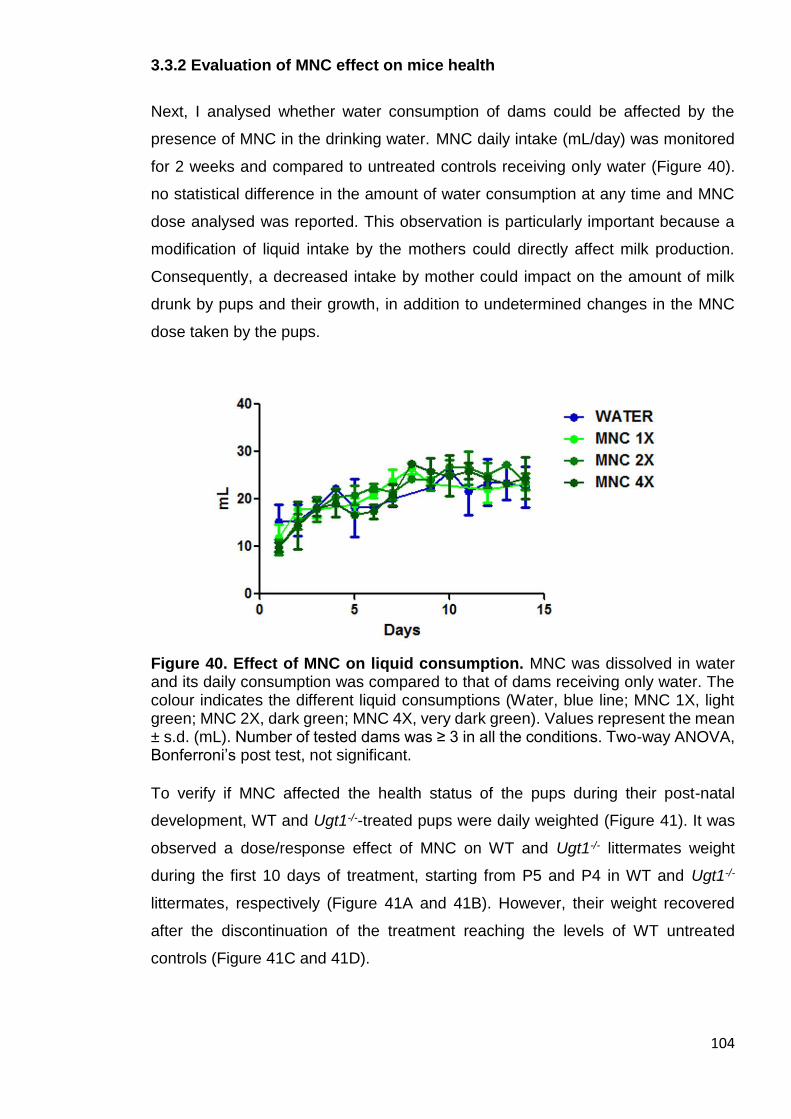
104
3.3.2 Evaluation of MNC effect on mice health
Next, I analysed whether water consumption of dams could be affected by the
presence of MNC in the drinking water. MNC daily intake (mL/day) was monitored
for 2 weeks and compared to untreated controls receiving only water (Figure 40).
no statistical difference in the amount of water consumption at any time and MNC
dose analysed was reported. This observation is particularly important because a
modification of liquid intake by the mothers could directly affect milk production.
Consequently, a decreased intake by mother could impact on the amount of milk
drunk by pups and their growth, in addition to undetermined changes in the MNC
dose taken by the pups.
Figure 40. Effect of MNC on liquid consumption. MNC was dissolved in water and its daily consumption was compared to that of dams receiving only water. The colour indicates the different liquid consumptions (Water, blue line; MNC 1X, light green; MNC 2X, dark green; MNC 4X, very dark green). Values represent the mean ± s.d. (mL). Number of tested dams was ≥ 3 in all the conditions. Two-way ANOVA, Bonferroni’s post test, not significant.
To verify if MNC affected the health status of the pups during their post-natal
development, WT and Ugt1-/--treated pups were daily weighted (Figure 41). It was
observed a dose/response effect of MNC on WT and Ugt1-/- littermates weight
during the first 10 days of treatment, starting from P5 and P4 in WT and Ugt1-/-
littermates, respectively (Figure 41A and 41B). However, their weight recovered
after the discontinuation of the treatment reaching the levels of WT untreated
controls (Figure 41C and 41D).

105
Figure 41. Effect of MNC on mice weight along the first month of life. A-B) Time-course of mice weight from P0 to P10, in WT and Ugt1-/-. Untreated WT, WT MNC 0.2X, WT MNC 1X, WT MNC 2X and WT MNC 4X. Two-way ANOVA, *p≤0.05 for the highest treatments compared to untreated WT. C-D) Time-course of mice weight from P20 to P30, (after MNC discontinuation at P20) in WT and Ugt1-/-. Untreated WT (n=51), Ugt1-/- (n=21); MNC 0.2X-treated WT (n=119), Ugt1-/- (n=19); MNC 1X-treated WT-H (n=83), Ugt1-/- (n=28); MNC 2X-treated WT-H (n=116), Ugt1-
/- (n=36); MNC 4X-treated WT-H (n=54), Ugt1-/- (n=25). Values represent the mean ± s.d. (g). Two-way ANOVA, Bonferroni’s post test, *p≤0.05 for the highest treatments compared to untreated WT A), C) and D), compared to untreated Ugt1-/- for B).
3.3.3 MNC administration does not affect bilirubin and albumin plasma values
As previously reported, untreated Ugt1-/- mice showed elevated levels of plasma TB
(Bortolussi et al., 2014). Since MNC-treated mutant mice survived longer than
untreated ones, it was verified whether the increased survival of MNC-treated Ugt1-
/- mice could be the result of a systemic decrease of bilirubin levels. Plasma TB
levels of MNC-treated Ugt1-/- mice at P8 were equivalent to those of the untreated
mutants, and no differences were observed between the distinct MNC treatments at
P15 (Figure 42A). Likewise, plasma albumin levels of treated animals were also
106
similar to untreated WT mice, confirming that MNC treatment did not affect plasma
albumin levels, both at P8 and P15 (Figure 42B). These findings demonstrated that
the efficacy of MNC did not stand in decreasing plasma bilirubin levels.
Figure 42. Plasma bilirubin and albumin levels in MNC-trated mice. A) Plasma TB of WT and Ugt1-/- mice were analysed at P8 and 15. B) Plasma albumin measurement (g/L) at P8 and P15 in MNC-treated animals. One-way ANOVA test, ***p<0.001, ns not significant; NA not available. For all the experiments values represent mean ± s.d. (mg/dL). The number of animals was ≥ 4 in all the experiments, conditions and time points.
3.3.4 Motor-coordination and activity parameters of MNC rescued Ugt1-/- mice
are comparable to WT mice, but anxiety features are only partially rescued
Since bilirubin neurotoxicity affects cerebellar development and architecture, it was
determined the degree of the functional rescue in Ugt1-/- mice treated with MNC. For
this purpose, I performed specific behavioural tests designed to assess locomotor
activity, motor coordination and balance, all functions in which the cerebellum has
a key role. Mice were treated as described in Figure 39A, and their performance
were tested in rotarod test (to assess motor coordination and balance, Figure 43)
and open field (OF) test (to assess spontaneous activity, such as general locomotor
activity levels and anxiety, Figure 44).
At one month of age, rescued Ugt1-/--MNC mice performed as well as untreated WT
on the rotating rod (Figure 43) indicating no obvious motor-coordination impairment.
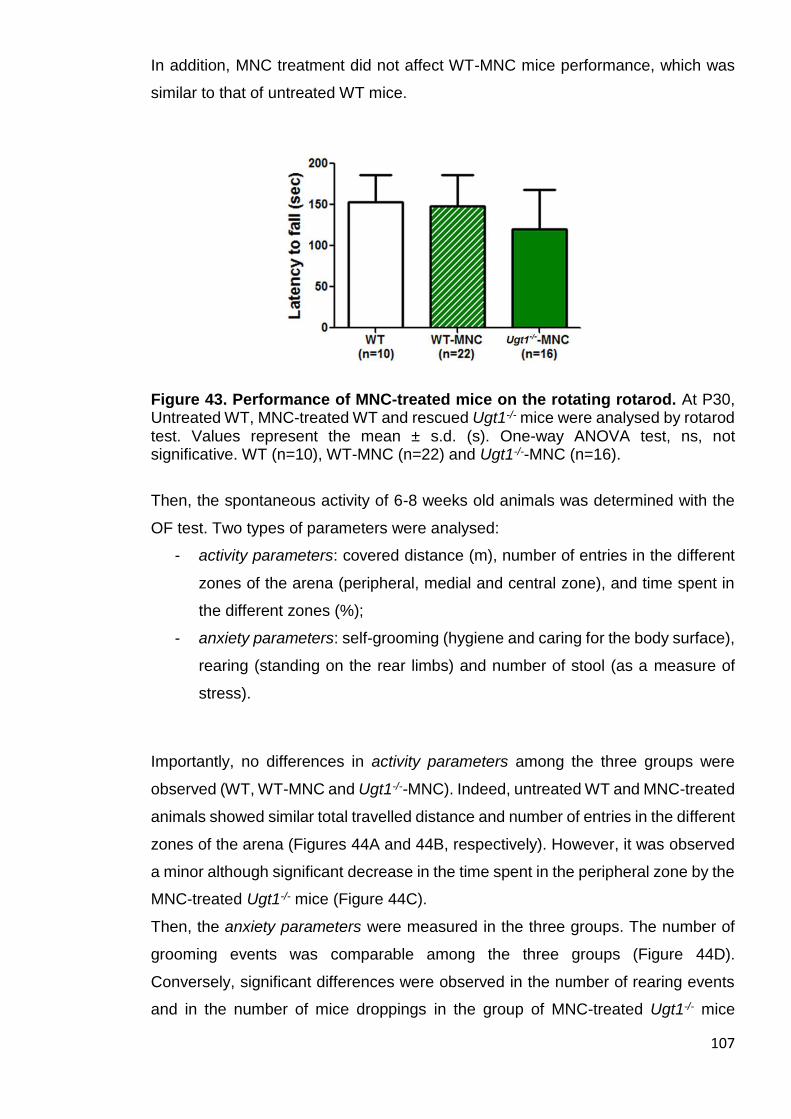
107
In addition, MNC treatment did not affect WT-MNC mice performance, which was
similar to that of untreated WT mice.
Figure 43. Performance of MNC-treated mice on the rotating rotarod. At P30, Untreated WT, MNC-treated WT and rescued Ugt1-/- mice were analysed by rotarod test. Values represent the mean ± s.d. (s). One-way ANOVA test, ns, not significative. WT (n=10), WT-MNC (n=22) and Ugt1-/--MNC (n=16).
Then, the spontaneous activity of 6-8 weeks old animals was determined with the
OF test. Two types of parameters were analysed:
- activity parameters: covered distance (m), number of entries in the different
zones of the arena (peripheral, medial and central zone), and time spent in
the different zones (%);
- anxiety parameters: self-grooming (hygiene and caring for the body surface),
rearing (standing on the rear limbs) and number of stool (as a measure of
stress).
Importantly, no differences in activity parameters among the three groups were
observed (WT, WT-MNC and Ugt1-/--MNC). Indeed, untreated WT and MNC-treated
animals showed similar total travelled distance and number of entries in the different
zones of the arena (Figures 44A and 44B, respectively). However, it was observed
a minor although significant decrease in the time spent in the peripheral zone by the
MNC-treated Ugt1-/- mice (Figure 44C).
Then, the anxiety parameters were measured in the three groups. The number of
grooming events was comparable among the three groups (Figure 44D).
Conversely, significant differences were observed in the number of rearing events
and in the number of mice droppings in the group of MNC-treated Ugt1-/- mice
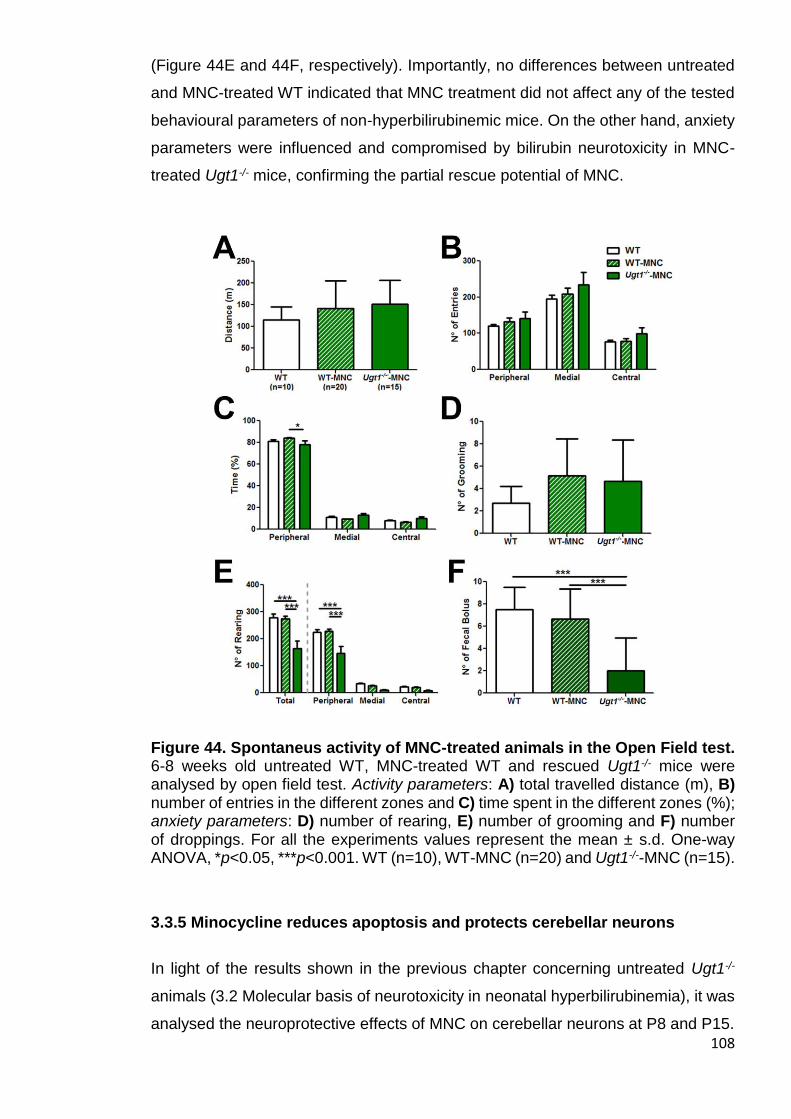
108
(Figure 44E and 44F, respectively). Importantly, no differences between untreated
and MNC-treated WT indicated that MNC treatment did not affect any of the tested
behavioural parameters of non-hyperbilirubinemic mice. On the other hand, anxiety
parameters were influenced and compromised by bilirubin neurotoxicity in MNC-
treated Ugt1-/- mice, confirming the partial rescue potential of MNC.
Figure 44. Spontaneus activity of MNC-treated animals in the Open Field test. 6-8 weeks old untreated WT, MNC-treated WT and rescued Ugt1-/- mice were analysed by open field test. Activity parameters: A) total travelled distance (m), B) number of entries in the different zones and C) time spent in the different zones (%); anxiety parameters: D) number of rearing, E) number of grooming and F) number of droppings. For all the experiments values represent the mean ± s.d. One-way ANOVA, *p<0.05, ***p<0.001. WT (n=10), WT-MNC (n=20) and Ugt1-/--MNC (n=15).
3.3.5 Minocycline reduces apoptosis and protects cerebellar neurons
In light of the results shown in the previous chapter concerning untreated Ugt1-/-
animals (3.2 Molecular basis of neurotoxicity in neonatal hyperbilirubinemia), it was
analysed the neuroprotective effects of MNC on cerebellar neurons at P8 and P15.

109
Untreated samples at P8 were compared with animals treated with MNC 4X, the
dose showing the maximum rescuing capacity. However, since untreated Ugt1-/-
animals did not survive over P14 (Figure 39B, red line), to evaluate the effects of
MNC administration over prolonged bilirubin exposure, such as at P15, I selected
as a control group an experimental condition that allowed the animals to survive
longer, such as MNC 1X, showing no variation in bilirubin levels over time and
treatment.
First, I focused my attention on neurodegeneration and apoptosis by determining
the cleaved /total caspase 3 ratio in the cerebellum of treated and untreated mice at
the indicated time points. It was observed a trend of apoptosis reduction in
cerebellar extracts of MNC 4X-treated Ugt1-/- mice compared to untreated Ugt1-/-
controls at P8 (Figures 45A), although this difference was not statistically significant.
At P15, the high levels of apoptosis present in the cerebella of Ugt1-/- mice treated
with the lowest dose (MNC 1X, 2-fold increase compared to WT) were reduced to
WT levels in the Ugt1-/- mice treated with the highest one (MNC 4X, Figure 45B).
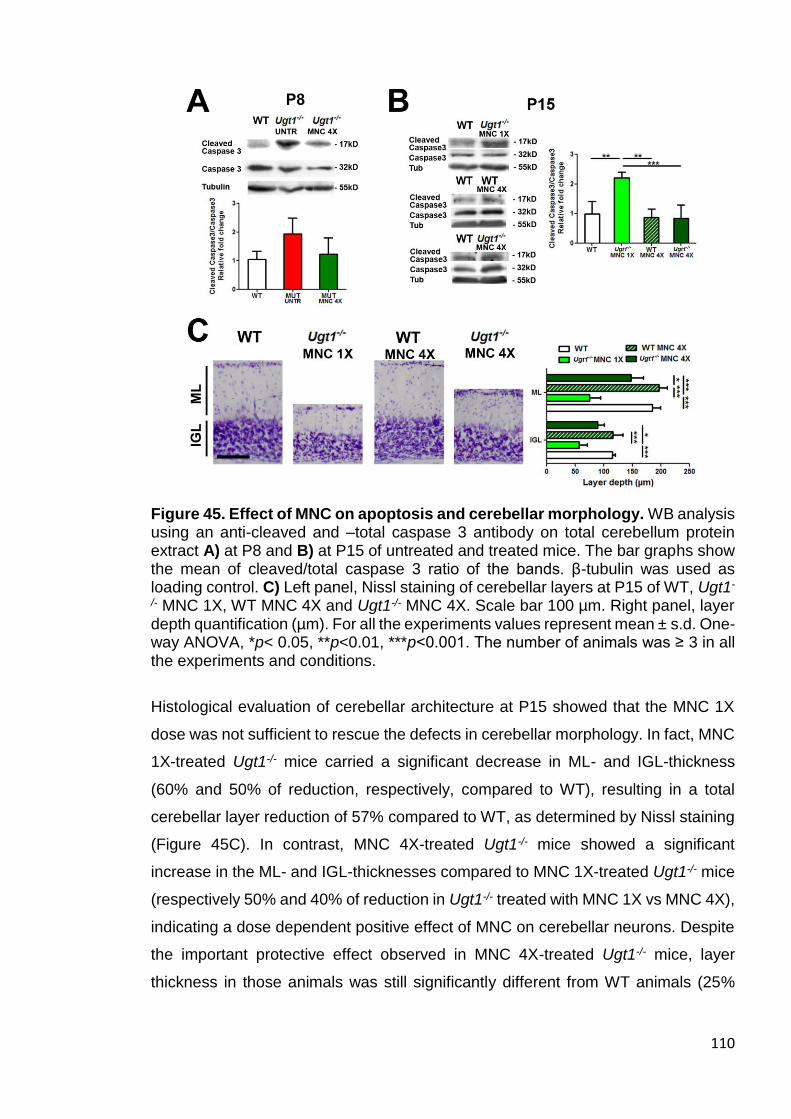
110
Figure 45. Effect of MNC on apoptosis and cerebellar morphology. WB analysis using an anti-cleaved and –total caspase 3 antibody on total cerebellum protein extract A) at P8 and B) at P15 of untreated and treated mice. The bar graphs show the mean of cleaved/total caspase 3 ratio of the bands. β-tubulin was used as loading control. C) Left panel, Nissl staining of cerebellar layers at P15 of WT, Ugt1-
/- MNC 1X, WT MNC 4X and Ugt1-/- MNC 4X. Scale bar 100 µm. Right panel, layer depth quantification (µm). For all the experiments values represent mean ± s.d. One-way ANOVA, *p< 0.05, **p<0.01, ***p<0.001. The number of animals was ≥ 3 in all the experiments and conditions.
Histological evaluation of cerebellar architecture at P15 showed that the MNC 1X
dose was not sufficient to rescue the defects in cerebellar morphology. In fact, MNC
1X-treated Ugt1-/- mice carried a significant decrease in ML- and IGL-thickness
(60% and 50% of reduction, respectively, compared to WT), resulting in a total
cerebellar layer reduction of 57% compared to WT, as determined by Nissl staining
(Figure 45C). In contrast, MNC 4X-treated Ugt1-/- mice showed a significant
increase in the ML- and IGL-thicknesses compared to MNC 1X-treated Ugt1-/- mice
(respectively 50% and 40% of reduction in Ugt1-/- treated with MNC 1X vs MNC 4X),
indicating a dose dependent positive effect of MNC on cerebellar neurons. Despite
the important protective effect observed in MNC 4X-treated Ugt1-/- mice, layer
thickness in those animals was still significantly different from WT animals (25%
111
whole cerebellar layer reduction). In addition, MNC 4X-treated WT mice did not differ
in the cerebellar architecture compared to untreated WT mice.
Importantly, PCs analyses revealed a dose-dependent effect of MNC on cell survival
and dendritic arborization, well correlating with apoptosis inhibition observed by WB
analysis. MNC administration resulted in similar calbindin content in MNC 4X-
treated compared to untreated Ugt1-/- animals at P8 (Figure 46A), suggesting the
absence of a positive effect of the drug on PCs. However, analysis performed at
P15 showed 75% decrease in calbindin content in the cerebellum of MNC 1X-
treated Ugt1-/- mice, but only 50% of calbindin reduction was observed in MNC 4X-
treated Ugt1-/- animals (Figure 46B). Moreover, the IF analysis of cerebellar sections
using anti-calbindin antibody showed that PCs number was decreased only in the
MNC 1X- but not in MNC 4X-treated Ugt1-/- mice, which showed the same PCs
density of WT animals (Figure 46C). The analysis of PCs morphology indicated that
the decrease in calbindin content observed in MNC 4X-treated Ugt1-/- mice was due
to reduction in dendritic arborisation, well correlating with the reduction in calbindin
levels determined by WB analysis in both P8 and P15 cerebellar extracts.
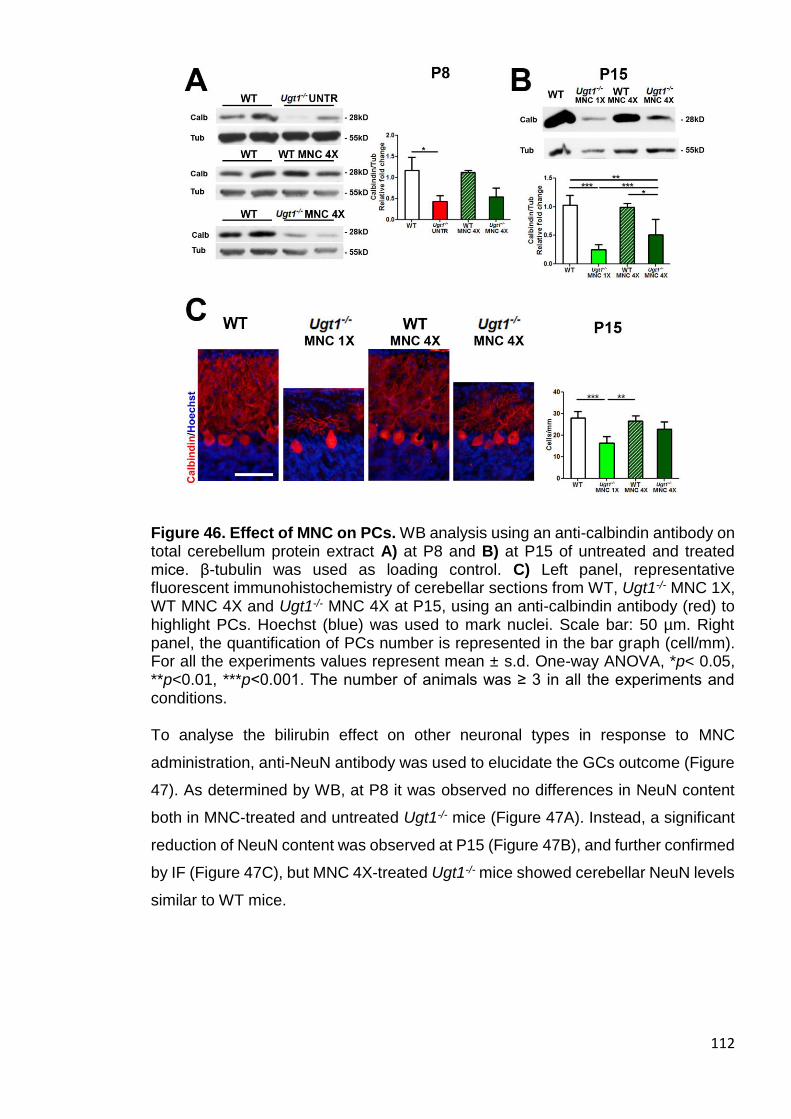
112
Figure 46. Effect of MNC on PCs. WB analysis using an anti-calbindin antibody on total cerebellum protein extract A) at P8 and B) at P15 of untreated and treated mice. β-tubulin was used as loading control. C) Left panel, representative fluorescent immunohistochemistry of cerebellar sections from WT, Ugt1-/- MNC 1X, WT MNC 4X and Ugt1-/- MNC 4X at P15, using an anti-calbindin antibody (red) to highlight PCs. Hoechst (blue) was used to mark nuclei. Scale bar: 50 µm. Right panel, the quantification of PCs number is represented in the bar graph (cell/mm). For all the experiments values represent mean ± s.d. One-way ANOVA, *p< 0.05, **p<0.01, ***p<0.001. The number of animals was ≥ 3 in all the experiments and conditions. To analyse the bilirubin effect on other neuronal types in response to MNC
administration, anti-NeuN antibody was used to elucidate the GCs outcome (Figure
47). As determined by WB, at P8 it was observed no differences in NeuN content
both in MNC-treated and untreated Ugt1-/- mice (Figure 47A). Instead, a significant
reduction of NeuN content was observed at P15 (Figure 47B), and further confirmed
by IF (Figure 47C), but MNC 4X-treated Ugt1-/- mice showed cerebellar NeuN levels
similar to WT mice.
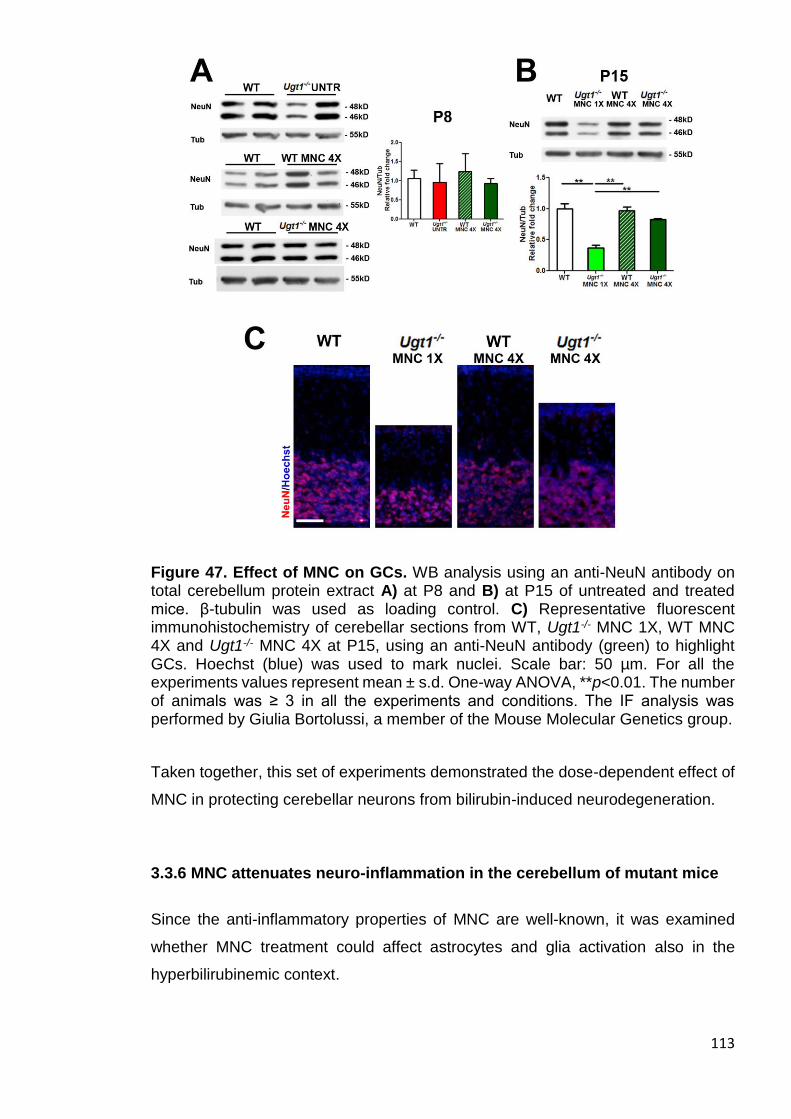
113
Figure 47. Effect of MNC on GCs. WB analysis using an anti-NeuN antibody on total cerebellum protein extract A) at P8 and B) at P15 of untreated and treated mice. β-tubulin was used as loading control. C) Representative fluorescent immunohistochemistry of cerebellar sections from WT, Ugt1-/- MNC 1X, WT MNC 4X and Ugt1-/- MNC 4X at P15, using an anti-NeuN antibody (green) to highlight GCs. Hoechst (blue) was used to mark nuclei. Scale bar: 50 µm. For all the experiments values represent mean ± s.d. One-way ANOVA, **p<0.01. The number of animals was ≥ 3 in all the experiments and conditions. The IF analysis was performed by Giulia Bortolussi, a member of the Mouse Molecular Genetics group.
Taken together, this set of experiments demonstrated the dose-dependent effect of
MNC in protecting cerebellar neurons from bilirubin-induced neurodegeneration.
3.3.6 MNC attenuates neuro-inflammation in the cerebellum of mutant mice
Since the anti-inflammatory properties of MNC are well-known, it was examined
whether MNC treatment could affect astrocytes and glia activation also in the
hyperbilirubinemic context.
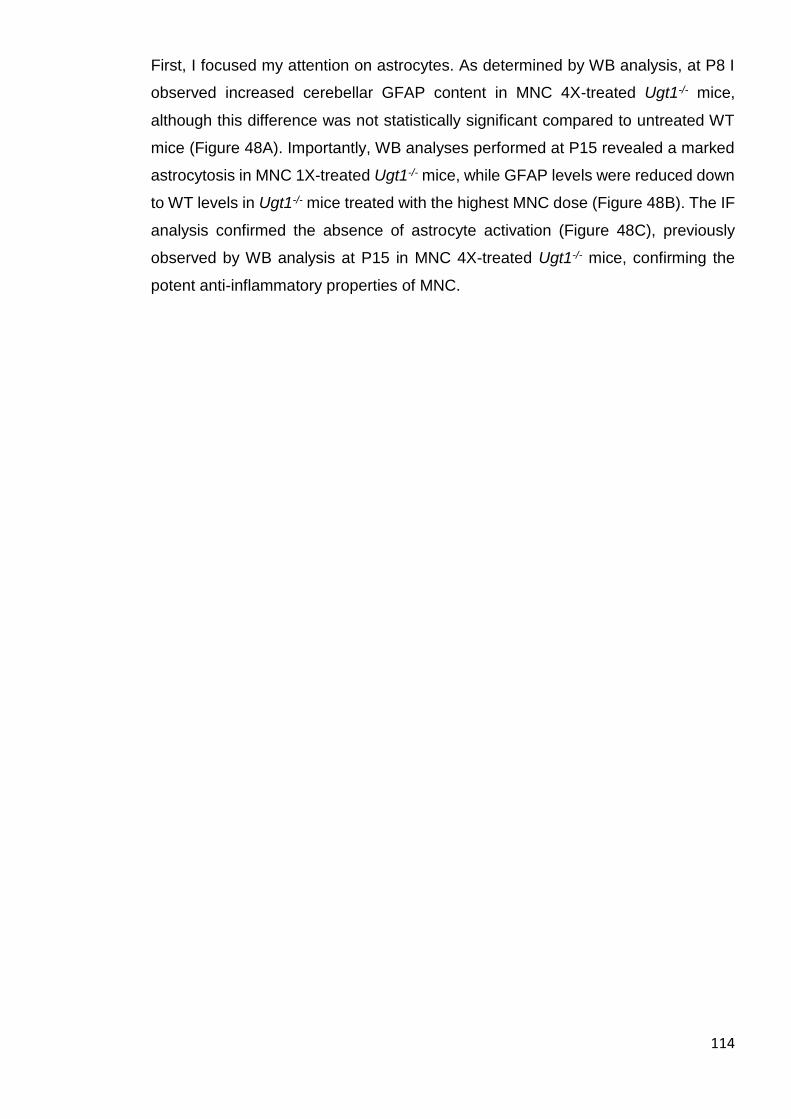
114
First, I focused my attention on astrocytes. As determined by WB analysis, at P8 I
observed increased cerebellar GFAP content in MNC 4X-treated Ugt1-/- mice,
although this difference was not statistically significant compared to untreated WT
mice (Figure 48A). Importantly, WB analyses performed at P15 revealed a marked
astrocytosis in MNC 1X-treated Ugt1-/- mice, while GFAP levels were reduced down
to WT levels in Ugt1-/- mice treated with the highest MNC dose (Figure 48B). The IF
analysis confirmed the absence of astrocyte activation (Figure 48C), previously
observed by WB analysis at P15 in MNC 4X-treated Ugt1-/- mice, confirming the
potent anti-inflammatory properties of MNC.
115
Figure 48. Effect of MNC on astrocytes. WB analysis using an anti-GFAP antibody on total cerebellum protein extract A) at P8 and B) at P15 of untreated and treated mice. β-tubulin was used as loading control. C) Representative fluorescent immunohistochemistry of cerebellar sections at P15 from WT, Ugt1-/- MNC 1X, WT MNC 4X and Ugt1-/- MNC 4X using anti-GFAP antibody (red) to detect astrocytes, co-stained with an anti-calbindin antibody (green) to highlight PCs. Hoechst (blue) was used to mark nuclei. Scale bar: 50 µm. For all the experiments values represent mean ± s.d. One-way ANOVA, *p< 0.05, ***p<0.001. The number of animals was ≥ 3 in all the experiments and conditions. The IF analysis was performed by Giulia Bortolussi, a member of the Mouse Molecular Genetics group.
The dose-dependent anti-inflammatory action of MNC was further corroborated by
the study of microglia. Real-time RT-PCR experiments performed at P8 revealed no
effects of MNC on Iba1 mRNA levels, which were highly expressed in both MNC-
treated and untreated Ugt1-/- mice (Figure 49A), indicating the absence of MNC
effects on treated Ugt1-/- animals at the earlier selected time point. However, at a
later time point (P15), the MNC treatment resulted in a dose-dependent reduction
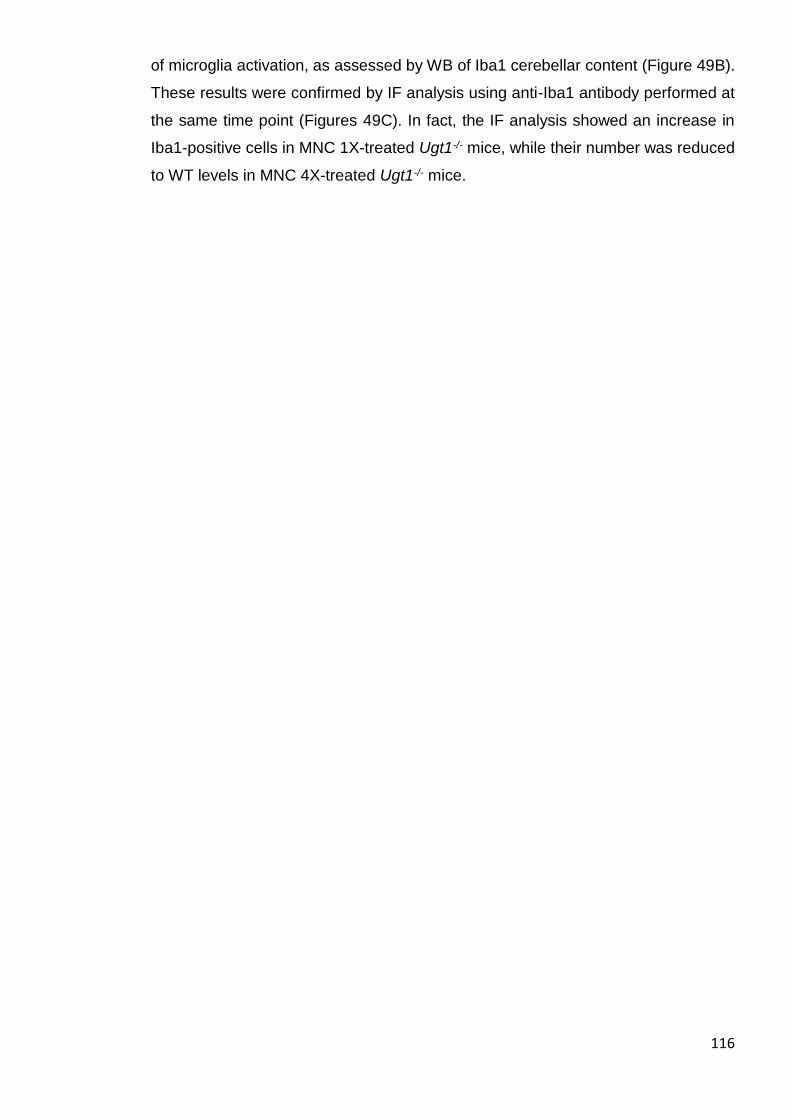
116
of microglia activation, as assessed by WB of Iba1 cerebellar content (Figure 49B).
These results were confirmed by IF analysis using anti-Iba1 antibody performed at
the same time point (Figures 49C). In fact, the IF analysis showed an increase in
Iba1-positive cells in MNC 1X-treated Ugt1-/- mice, while their number was reduced
to WT levels in MNC 4X-treated Ugt1-/- mice.
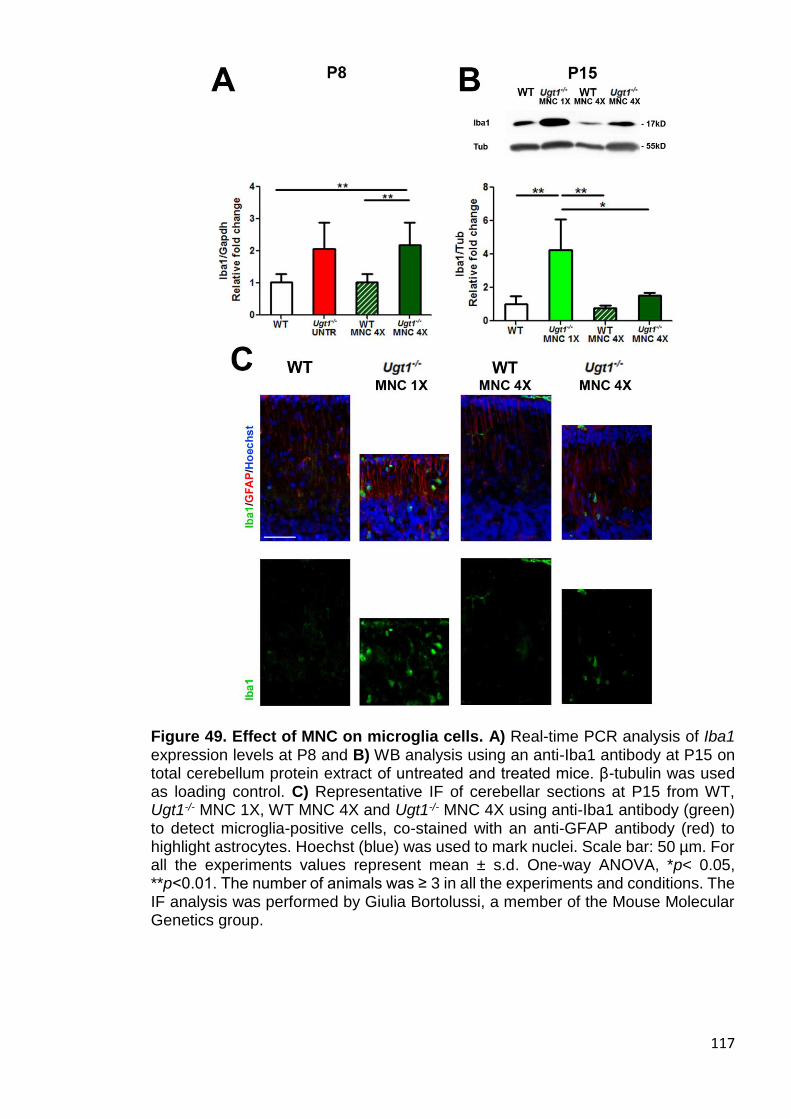
117
Figure 49. Effect of MNC on microglia cells. A) Real-time PCR analysis of Iba1 expression levels at P8 and B) WB analysis using an anti-Iba1 antibody at P15 on total cerebellum protein extract of untreated and treated mice. β-tubulin was used as loading control. C) Representative IF of cerebellar sections at P15 from WT, Ugt1-/- MNC 1X, WT MNC 4X and Ugt1-/- MNC 4X using anti-Iba1 antibody (green) to detect microglia-positive cells, co-stained with an anti-GFAP antibody (red) to highlight astrocytes. Hoechst (blue) was used to mark nuclei. Scale bar: 50 µm. For all the experiments values represent mean ± s.d. One-way ANOVA, *p< 0.05, **p<0.01. The number of animals was ≥ 3 in all the experiments and conditions. The IF analysis was performed by Giulia Bortolussi, a member of the Mouse Molecular Genetics group.
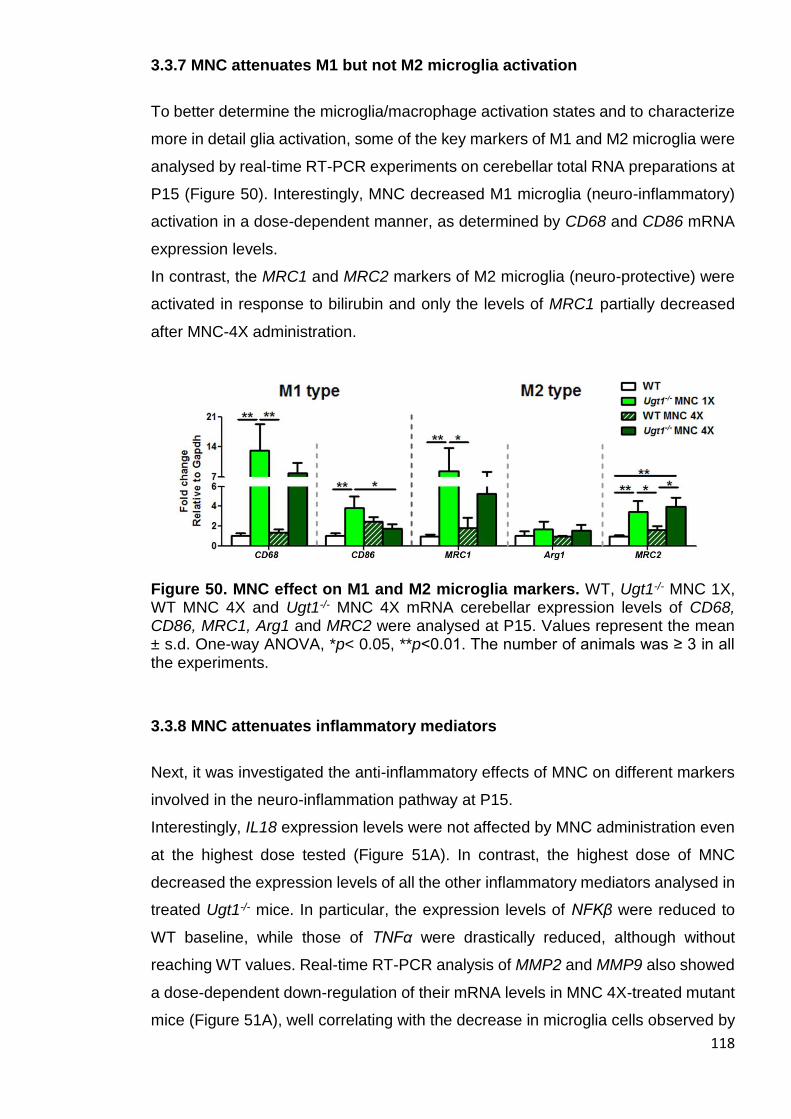
118
3.3.7 MNC attenuates M1 but not M2 microglia activation
To better determine the microglia/macrophage activation states and to characterize
more in detail glia activation, some of the key markers of M1 and M2 microglia were
analysed by real-time RT-PCR experiments on cerebellar total RNA preparations at
P15 (Figure 50). Interestingly, MNC decreased M1 microglia (neuro-inflammatory)
activation in a dose-dependent manner, as determined by CD68 and CD86 mRNA
expression levels.
In contrast, the MRC1 and MRC2 markers of M2 microglia (neuro-protective) were
activated in response to bilirubin and only the levels of MRC1 partially decreased
after MNC-4X administration.
Figure 50. MNC effect on M1 and M2 microglia markers. WT, Ugt1-/- MNC 1X, WT MNC 4X and Ugt1-/- MNC 4X mRNA cerebellar expression levels of CD68, CD86, MRC1, Arg1 and MRC2 were analysed at P15. Values represent the mean ± s.d. One-way ANOVA, *p< 0.05, **p<0.01. The number of animals was ≥ 3 in all the experiments.
3.3.8 MNC attenuates inflammatory mediators
Next, it was investigated the anti-inflammatory effects of MNC on different markers
involved in the neuro-inflammation pathway at P15.
Interestingly, IL18 expression levels were not affected by MNC administration even
at the highest dose tested (Figure 51A). In contrast, the highest dose of MNC
decreased the expression levels of all the other inflammatory mediators analysed in
treated Ugt1-/- mice. In particular, the expression levels of NFKβ were reduced to
WT baseline, while those of TNFα were drastically reduced, although without
reaching WT values. Real-time RT-PCR analysis of MMP2 and MMP9 also showed
a dose-dependent down-regulation of their mRNA levels in MNC 4X-treated mutant
mice (Figure 51A), well correlating with the decrease in microglia cells observed by

119
IF analysis (Figure 49). Importantly, TLR2 expression was increased about 20 times
the WT levels at P15 in MNC 1X-treated Ugt1-/- animals, but the MNC 4X treatment
resulted in a 65% decrease in MNC 4X-treated Ugt1-/- mice (Figure 51B). No
differences in the expression levels of iNOS, nNOS were observed at any dose
analysed (Figure 51B).
Figure 51. Effect of MNC on inflammatory markers. WT, Ugt1-/- MNC 1X, WT MNC 4X and Ugt1-/- MNC 4X mRNA cerebellar expression levels of A) IL18, NFKβ, TNFα, MMP2, and MMP9; B) TLR2, iNOS and nNOS were analysed at P15. Values represent the mean ± s.d. One-way ANOVA, *p< 0.05, **p<0.01, ***p<0.001. The number of animals was ≥ 3 in all the experiments.
These findings suggested that the activation of a prominent inflammatory response
occurred in presence of neuro-apoptosis and that inhibition of neuro-inflammation
ameliorated the neurodegenerative phenotype induced by bilirubin.
3.3.9 MNC effect on ER and oxidative stress
Since it was previously observed the involvement of ER stress in bilirubin
neurotoxicity (Chapter 3.2.6), the effect of MNC administration on ER stress
response related genes at P15 was investigated. Bilirubin activated the ER stress
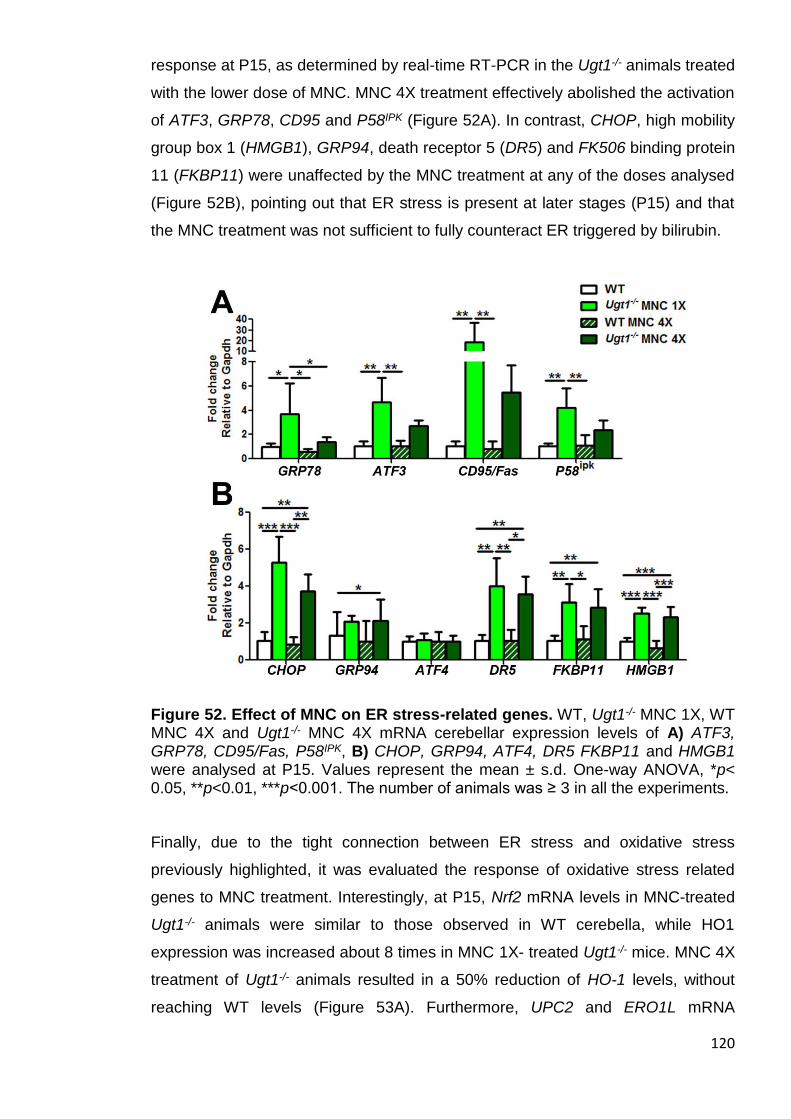
120
response at P15, as determined by real-time RT-PCR in the Ugt1-/- animals treated
with the lower dose of MNC. MNC 4X treatment effectively abolished the activation
of ATF3, GRP78, CD95 and P58IPK (Figure 52A). In contrast, CHOP, high mobility
group box 1 (HMGB1), GRP94, death receptor 5 (DR5) and FK506 binding protein
11 (FKBP11) were unaffected by the MNC treatment at any of the doses analysed
(Figure 52B), pointing out that ER stress is present at later stages (P15) and that
the MNC treatment was not sufficient to fully counteract ER triggered by bilirubin.
Figure 52. Effect of MNC on ER stress-related genes. WT, Ugt1-/- MNC 1X, WT MNC 4X and Ugt1-/- MNC 4X mRNA cerebellar expression levels of A) ATF3, GRP78, CD95/Fas, P58IPK, B) CHOP, GRP94, ATF4, DR5 FKBP11 and HMGB1 were analysed at P15. Values represent the mean ± s.d. One-way ANOVA, *p< 0.05, **p<0.01, ***p<0.001. The number of animals was ≥ 3 in all the experiments.
Finally, due to the tight connection between ER stress and oxidative stress
previously highlighted, it was evaluated the response of oxidative stress related
genes to MNC treatment. Interestingly, at P15, Nrf2 mRNA levels in MNC-treated
Ugt1-/- animals were similar to those observed in WT cerebella, while HO1
expression was increased about 8 times in MNC 1X- treated Ugt1-/- mice. MNC 4X
treatment of Ugt1-/- animals resulted in a 50% reduction of HO-1 levels, without
reaching WT levels (Figure 53A). Furthermore, UPC2 and ERO1L mRNA
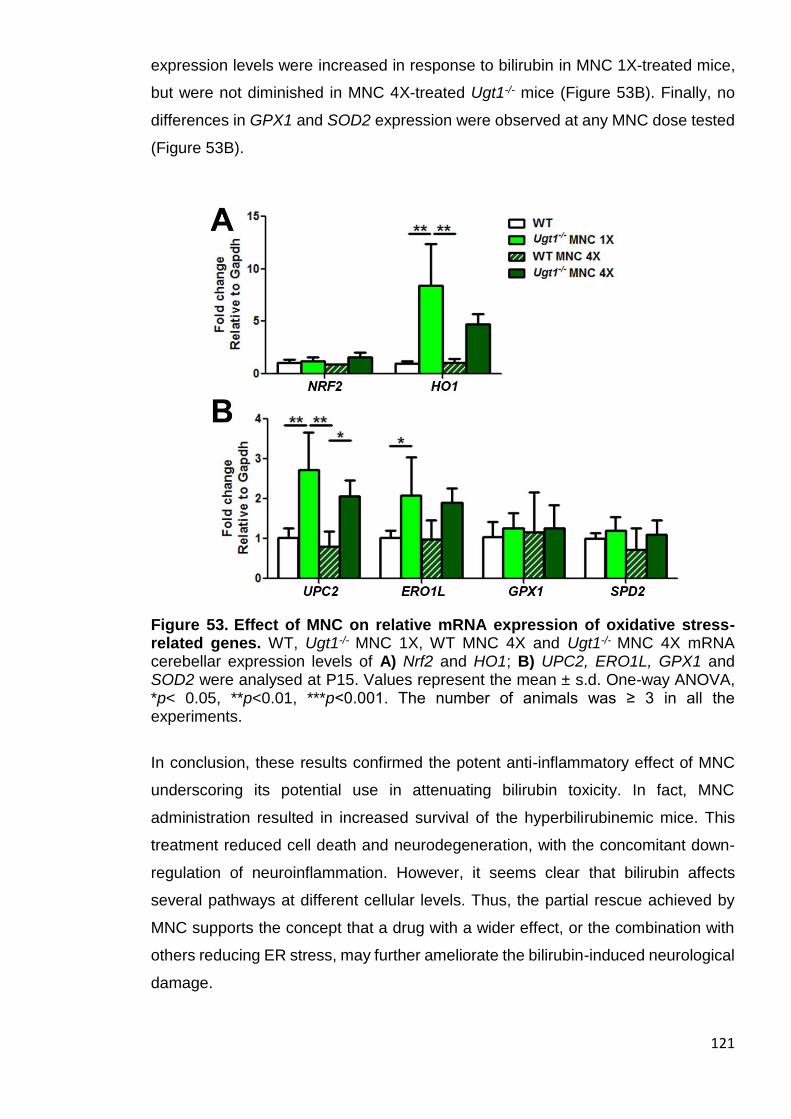
121
expression levels were increased in response to bilirubin in MNC 1X-treated mice,
but were not diminished in MNC 4X-treated Ugt1-/- mice (Figure 53B). Finally, no
differences in GPX1 and SOD2 expression were observed at any MNC dose tested
(Figure 53B).
Figure 53. Effect of MNC on relative mRNA expression of oxidative stress-related genes. WT, Ugt1-/- MNC 1X, WT MNC 4X and Ugt1-/- MNC 4X mRNA cerebellar expression levels of A) Nrf2 and HO1; B) UPC2, ERO1L, GPX1 and SOD2 were analysed at P15. Values represent the mean ± s.d. One-way ANOVA, *p< 0.05, **p<0.01, ***p<0.001. The number of animals was ≥ 3 in all the experiments.
In conclusion, these results confirmed the potent anti-inflammatory effect of MNC
underscoring its potential use in attenuating bilirubin toxicity. In fact, MNC
administration resulted in increased survival of the hyperbilirubinemic mice. This
treatment reduced cell death and neurodegeneration, with the concomitant down-
regulation of neuroinflammation. However, it seems clear that bilirubin affects
several pathways at different cellular levels. Thus, the partial rescue achieved by
MNC supports the concept that a drug with a wider effect, or the combination with
others reducing ER stress, may further ameliorate the bilirubin-induced neurological
damage.

122
In fact, since ER stress was only partially attenuated by MNC, I speculate about the
relevance of ER stress contribution to neurons imbalance that results in cerebellar
damage and death in a fraction of the MNC-treated Ugt1-/- animals.

123
DISCUSSION
124
4.1 Albumin supplementation studies demonstrate that Bf is the cause of
bilirubin neurotoxicity
In this chapter, it was elucidated the role of Bf as the cause of BIND. The data
presented in this study provide experimental support to the effectiveness of the HSA
supplementation to prevent neonatal neurological damage and death, by increasing
bilirubin-binding capacity in plasma.
4.1.1 Previous studies in Gunn rats
It has been previously demonstrated that HSA effectively decreases bilirubin toxicity
in the brain of the hyperbilirubinemic Gunn rat model. However, the Gunn rat
phenotype is not usually associated with kernicterus, mutant animals reach
adulthood without any sign of toxicity and they are able to reproduce. Neurotoxic
levels of bilirubin in the Gunn rat are usually induced by increasing haemolysis using
phenylhydrazine (PHZ) or by displacing bilirubin from circulating albumin using
sulphadimethoxine (Sulpha) (Rose and Wisniewski, 1959). Cuperus and colleagues
showed that a single albumin injection combined with PT lowers the brain bilirubin
and Bf levels of Gunn rats (Cuperus et al., 2013). In the acute hyperbilirubinemia
condition induced by PHZ, HSA is effective only in combination with PT. Further
evidences of HSA beneficial roles on hyperbilirubinemic Gunn rats were given by
Schreuder and colleagues, demonstrating that a single albumin injection prevents
BAEPs in the jj pups treated with PHZ or Sulpha (Schreuder et al., 2013b). In this
study, animals are selected according to their TB levels, reducing the variability, and
sacrificed 48h after a single HSA injection. Therefore, both the potential beneficial
effects of HSA administration during neonatal development and a comprehensive
long-term landscape of HSA potential were still missing.
4.1.2 Proof of principle in Ugt1-/- mouse model
Daily HSA treatment of Ugt1-/- mouse model resulted in a crucial step forward to
understand the role of Bf in BIND. It was demonstrated that repeated albumin
infusions during postnatal development were necessary and sufficient to rescue not
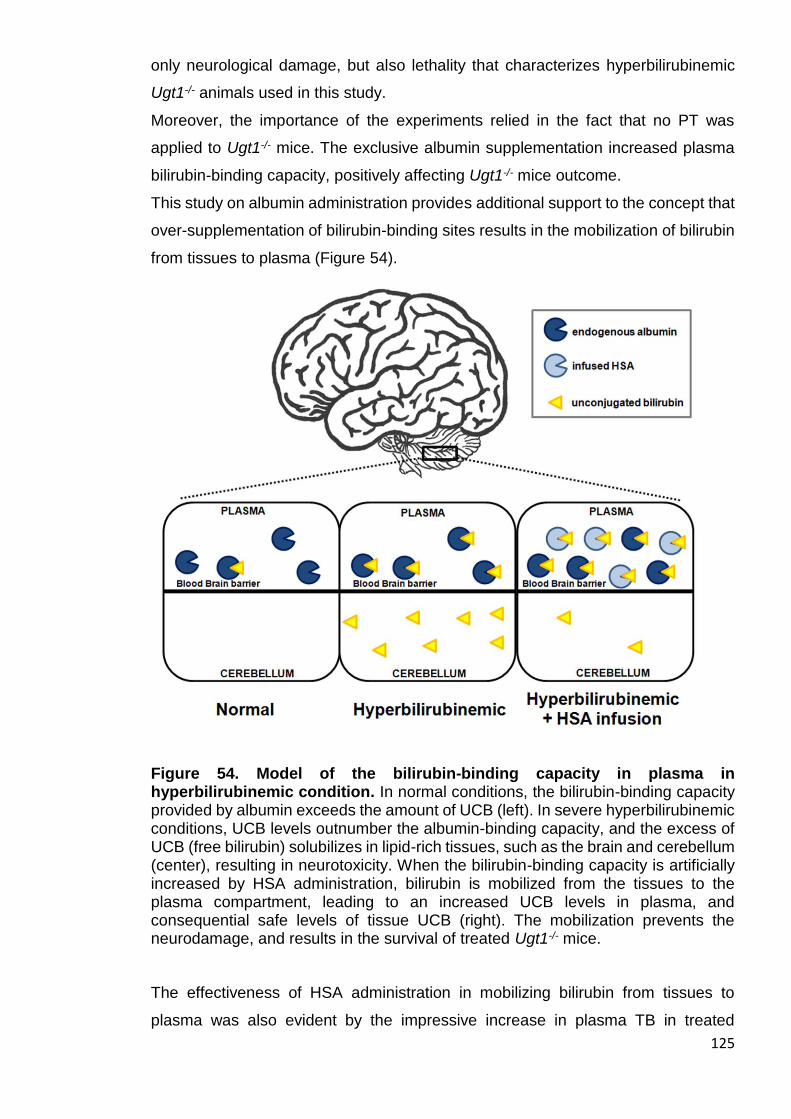
125
only neurological damage, but also lethality that characterizes hyperbilirubinemic
Ugt1-/- animals used in this study.
Moreover, the importance of the experiments relied in the fact that no PT was
applied to Ugt1-/- mice. The exclusive albumin supplementation increased plasma
bilirubin-binding capacity, positively affecting Ugt1-/- mice outcome.
This study on albumin administration provides additional support to the concept that
over-supplementation of bilirubin-binding sites results in the mobilization of bilirubin
from tissues to plasma (Figure 54).
Figure 54. Model of the bilirubin-binding capacity in plasma in hyperbilirubinemic condition. In normal conditions, the bilirubin-binding capacity provided by albumin exceeds the amount of UCB (left). In severe hyperbilirubinemic conditions, UCB levels outnumber the albumin-binding capacity, and the excess of UCB (free bilirubin) solubilizes in lipid-rich tissues, such as the brain and cerebellum (center), resulting in neurotoxicity. When the bilirubin-binding capacity is artificially increased by HSA administration, bilirubin is mobilized from the tissues to the plasma compartment, leading to an increased UCB levels in plasma, and consequential safe levels of tissue UCB (right). The mobilization prevents the neurodamage, and results in the survival of treated Ugt1-/- mice.
The effectiveness of HSA administration in mobilizing bilirubin from tissues to
plasma was also evident by the impressive increase in plasma TB in treated
126
animals. Despite this remarkable increase in TB, plasma Bf levels significantly
dropped. Indeed, the therapeutic efficacy of albumin administration was consequent
to the reduction in the Bf concentration by the increased bilirubin-binding capacity
in plasma.
4.1.3 HSA long-term effectiveness
Most strikingly, HSA-treated animals survived without any adverse effect despite
very high levels of plasma TB, consequent to the mobilization of UCB from tissues.
In addition, I observed neither alterations in the growth curve of treated WT and
Ugt1-/- littermates, even with the highest dose (HSA 7.5 g/kg/24h), nor significant
transaminases activation (Figure 16).
Ten days after HSA treatment discontinuation (at P30), rescued Ugt1-/- mice showed
no abnormalities in motor coordination skills, no cerebellum architecture impairment
and normal albumin levels, although the extreme hyperbilirubinemia in the plasma
compartment (Figure 22B). These findings underline the fact that brain susceptibility
to bilirubin neurotoxicity is correlated to developmental stages, as previously
suggested (Bortolussi et al., 2014).
4.1.4 Frequency of HSA administration is crucial
Importantly, it was shown that the frequency of administration was a very critical
parameter to determine Ugt1-/- mice fate. In fact, daily supplementation of HSA 5.0
g/kg increased bilirubin-binding sites in plasma and reasonably lowered Bf levels,
guaranteeing normal brain development and survival, according to the dose. In
contrast, the same dose of albumin administered every 48 h was not sufficient to
prevent the increase of Bf in the brain, resulting in severe neurological damage and
death. It is important to note that the plasma levels of albumin significantly
decreased during the second day after administration (in the HSA 5.0 g/kg/48h
groups), resulting in a critical increase in tissue UCB (Figure 25). Likewise, these
events probably represent the cause of the failure of this therapy.
127
4.1.5 Albumin half-life
Since monomeric albumin life-time in humans is reported in the range of 28-36 days
(Fanali et al., 2012), the decrease of plasma albumin concentration two days after
the previous administration remains unclear. Several works based on
analbuminemic patients and adult Gunn rats have reported that, despite plasma
albumin levels peaked immediately after infusion, albumin substantially decreases
24h after the treatment, (Cuperus et al., 2013; Greissman et al., 1996), while that of
mice infused with mouse albumin is 35h (Chaudhury et al., 2003). The reason of
such short half-life could be related to albumin redistribution in the extravascular
space of different body compartments, leading to a reduction in the plasma levels,
and/or to a faster degradation due to species-specific differences (Andersen et al.,
2010). However, the first hypothesis may be ruled out by the frequency of the
infusions in the experimental model that was performed.
4.1.6 Doses and routes of administration
Cerebellar abnormalities and mortality were rescued in Ugt1-/- mice with the dosage
scheme of daily infusion of 5.0 g/kg of HSA. Similar results were also obtained with
a higher dose (7.5 g/kg/24h). Usually, the clinical route of administration and dosage
employed in neonates are different to the ones applied in this study, such as about
1 g/kg, administered by intravenous (i.v.) injection (Hosono et al., 2001b). However
there are reported cases in which a higher doses, up to 2 g/kg, were applied without
evident adverse effects (Wood et al., 1970). Similarly, no obvious secondary side
effects were observed after albumin administration, even when WT and Ugt1-/-
littermates were treated with the highest dose (7.5 g/kg every 24 h).
Since the route of administration is different, a comparison of dose administration
between mice and neonates is not trivial. Neonates usually undergo i.v.
administration; due to the reduced size of mice (about 2 g at P2), i.p. injection was
adopted. The latter procedure results in a slower HSA availability in the intravascular
compartment, although a higher volume can be used for the purpose. Differently,
i.v. administration renders the compound immediately active. Therefore, it is
reasonable to hypothesize that that lower but more frequent doses of HSA using i.v.
as privileged way of administration may result in a similar rate of survival to those
obtained with 5.0 g/kg daily i.p. infusion.
128
Lower i.v. doses of HSA combined with intensive PT may limit the concerns raised
by the high HSA application used in this model. However, a deeper investigation
concerning the potential benefits of HSA treatment is needed in human jaundiced
babies, particularly regarding preterm infants with very low birth weight, as they are
the most affected by bilirubin neurotoxicity.
4.1.7 Predictive markers of BIND
4.1.7.1 Total bilirubin (TB)
The decision to treat hyperbilirubinemic newborns is conventionally based on TB
levels. However, there is not a generalized consensus on the threshold TB levels.
The guidelines of different countries suggest to apply therapeutic protocols to avoid
bilirubin neurotoxicity at different TB levels (Yu et al., 2014) and clinical studies in
jaundiced babies suggest that TB levels over value of ~20 mg/dL are poor
discriminators to determine the individual risk of developing BIND (see chapter
1.3.3) (Ahlfors and Parker, 2008). However, the administration of albumin to prevent
brain damage elicited the increase of plasma TB levels. Therefore, the use of TB as
an estimator of BIND may be misled after the HSA treatment, indicating the clinical
need for different and more specific parameters.
4.1.7.2 Bilirubin/albumin (B/A) ratio
In neonates, the ratio of bilirubin to albumin (B/A) has been proposed as a valid
parameter to assess bilirubin neurotoxicity risk (Ahlfors, 1994). Also the guidelines
of the American Academy of Pediatrics support the routine B/A ratio endorsement
to determine the threshold for ET (Ahlfors, 1994; American Academy of Pediatrics,
2004). The correlation test performed in this study indicated that the B/A ratio poorly
correlated with neurological damage and death in this mouse model (Figure 27B).
Although a slight better correlation was obtained counterpointing B/A and cerebellar
UCB levels (compared to TB), several samples were still overlapping among the
groups. In fact, similarly to the TB values, the B/A ratio did not accurately
discriminate the fate of the different groups of mice.
In line with these observation, a recent clinical study, the BARTrial, showed
comparable effects in the management of hyperbilirubinemia in preterm infants to
prevent neurodevelopmental damage by the use of TB and B/A ratio (Hulzebos et
al., 2014). However, it has to be considered that the artificial increase in plasma
129
albumin concentration in my experimental protocol affected TB levels and,
consequently, it may have also affected the B/A ratio.
4.1.7.3 Free bilirubin (Bf)
In this study, it was shown that plasma Bf, strongly correlated with UCB brain
concentration, providing a further proof that Bf is the most accurate indicator of the
neurological damage risk (Figure 27C).
The potential use of Bf as BIND predictor has been widely investigated in human
patients (Ahlfors and Parker, 2008). The authors showed that, in a newborn
population, Bf correlates better than TB with defects in auditory brainstem response
(ABR) generated by bilirubin neurotoxicity. In addition, another study performed in
infants with extremely low birth weight revealed the Bf association with death or
adverse neurodevelopmental outcomes (Oh et al., 2010), and that Bf, rather than
TB, better correlates with neurological complications. A recent study concerning
extremely low birth weight Japanese infants confirmed the association between high
levels of Bf and kernicterus (Morioka et al., 2015).
However, the use of Bf is not widely employed due to the technical difficulties to set
up a robust and simple assay (McDonagh and Maisels, 2006). In this study it was
employed the method described by Alhfors (Ahlfors et al., 2006), which consists in
a modified peroxidase test performed using Zone Fluidics. Compared to previous
peroxidase test methods, peroxidase test using Zone Fluidics reduces samples
volume and their dilutions. Moreover, the automated procedure decreases the
manual bias, and represents a more consistent and reliable range of measurement.
However, the intrinsic properties of this method are not devoid of imprecision, since
different factors, like haemoglobin, can interfere with the measurement.
4.1.8 HSA administration as a potential alternative to ET
HSA administration can clearly protect brain from bilirubin neurotoxicity and save
lives, at least in Ugt1-/- mouse model of severe neonatal hyperbilirubinemia. One of
the most striking findings of this project is that albumin beneficial effects were
obtained without any other concomitant therapy, such as PT which produces a
hypobilirubinemic effect. Thus, it is reasonable to assume that, if coupled with PT,
this procedure could be applied in those PT-unresponsive acute cases that may
result in kernicterus. In addition, HSA administration offers an alternative to ET.
130
The potential of albumin administration combined with PT in lowering Bf
concentration has been shown in a preclinical rat model (Cuperus et al., 2013;
Schreuder et al., 2013b). It is reasonable to speculate that the synergistic effect of
intensive PT and frequent albumin administration may result in a feasible and more
effective procedure for neonates with acute hyperbilirubinemia. However, due to
methodological and technical reasons, Bf is consider unreliable by some experts
(McDonagh and Maisels, 2006).
In line with our results, Hosono and colleagues (Hosono et al., 2001b) showed
promising results by a single albumin infusion at the beginning of the PT treatment.
In fact, the albumin-PT-treated babies show reduced Bf compared to the ones
treated only with PT. Moreover, the follow-up study showed decreased ABR
abnormalities in infants in which PT is also implemented with HSA (Hosono et al.,
2002). The results obtained in my Thesis, combined to those described above
(Hosono et al., 2001b, 2002), support the speculation that a similar or higher
therapeutic effect could be obtained if less concentrated but more frequent doses
are administered to the Ugt1-/- pups, concomitant with PT application.
HSA supplementation may also be helpful when ET is not easily or rapidly possible,
as in situations in which patient-related factors or lack of infrastructures/expertise
might not make ET implementable. ET is normally carried out only in specialized
centre, but it has different risks of complications, especially in developing countries,
where morbidity and mortality rates are remarkable (Ibekwe et al., 2012). In fact, not
only the procedure per se presents complications, but also the interval between the
decision to implement ET and the actual ET procedure is a significant constraint
(Mabogunje et al., 2016). HSA infusion could easily complement intensive PT, since
albumin is at the reach of most neonatal care units, and risks of complications in the
application of this procedure are very rare (Vincent et al., 2003), although clinical
trials on newborns with extreme low birth weight are needed.
In conclusion, HSA infusion exerts important beneficial effects in the severe acute
phase of neonatal hyperbilirubinemia and Crigler-Najjar patients. Albumin
administration could be a valid alternative in borderline situations where ET is
required, since it prevents and/or decreases bilirubin accumulation in brain tissue.
It was demonstrated that frequency of administration and dosage are crucial
parameters to achieve full efficacy. Finally, these data provide evidence that plasma
Bf level is the best marker to predict the risk of high bilirubin brain content and
131
consequential BIND, in the Ugt1-/- lethal mouse model. I strongly support further
survey of albumin therapy, such as randomized clinical trials, to validate these data.
132
4.2 Bilirubin neurotoxicity is the result of concerted pathways mis-regulation
The aim of this section was to temporally characterize the molecular events
activated in the developing cerebellum upon high bilirubin levels, which define the
lethal mouse model of neonatal hyperbilirubinemia.
This set of experiments showed the concomitant activation of a wide variety of
mechanisms activated by the long-term exposure to high bilirubin levels in the
cerebellum of Ugt1-/- pups, ranging from ER and oxidative stress to inflammation
and neurodegeneration. From the time perspective, in the early stages of the
disease are characterized by ER and oxidative stress responses activation,
consequentially affecting developing neurons’ survival. At later stages, when
apoptosis occurred in neurons, the rise of a prominent inflammatory response was
observed, as well as the generation of a glial scar. In the final stages of the disease,
the autophagy pathway was activated by bilirubin-induced neurotoxicity (Figure 55).
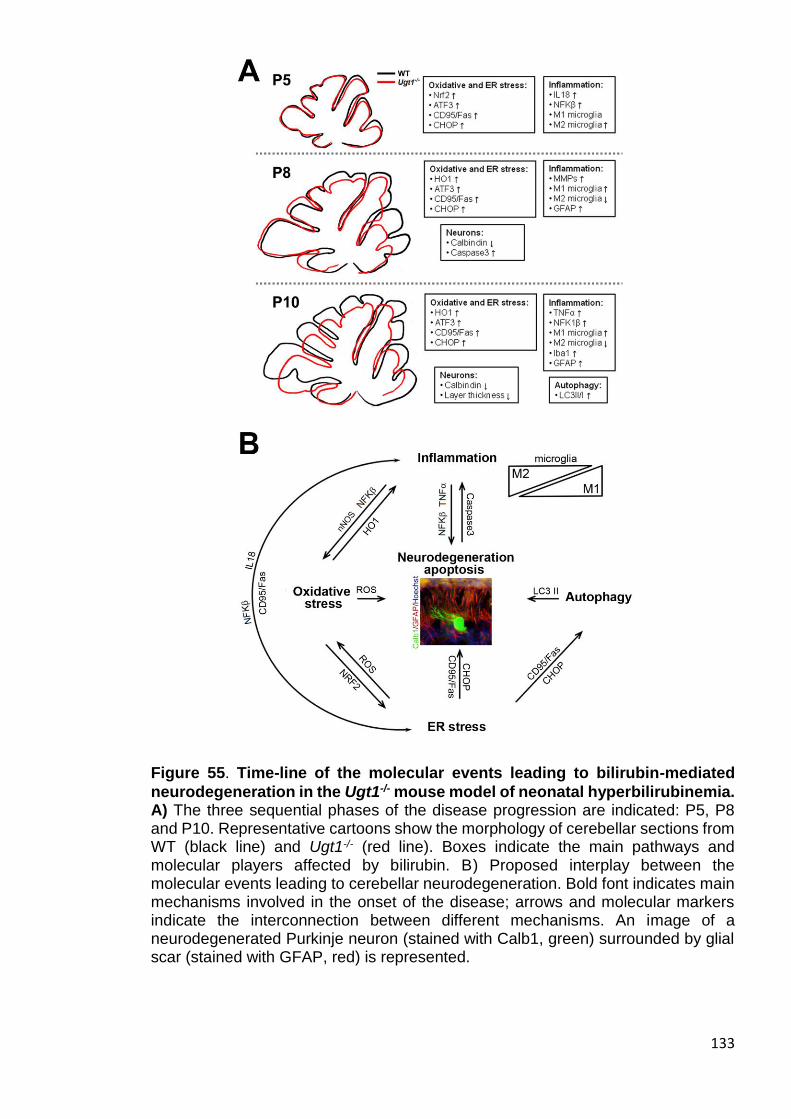
133
Figure 55. Time-line of the molecular events leading to bilirubin-mediated
neurodegeneration in the Ugt1-/- mouse model of neonatal hyperbilirubinemia. A) The three sequential phases of the disease progression are indicated: P5, P8 and P10. Representative cartoons show the morphology of cerebellar sections from WT (black line) and Ugt1-/- (red line). Boxes indicate the main pathways and molecular players affected by bilirubin. B) Proposed interplay between the molecular events leading to cerebellar neurodegeneration. Bold font indicates main mechanisms involved in the onset of the disease; arrows and molecular markers indicate the interconnection between different mechanisms. An image of a neurodegenerated Purkinje neuron (stained with Calb1, green) surrounded by glial scar (stained with GFAP, red) is represented.
134
4.2.1 Neurodegeneration and neuro-apoptosis
Neurons are particularly vulnerable to insults because of their high metabolic rate
and their restricted cell renewal. During cerebellar development of Ugt1-/- mice, high
levels of bilirubin led to a progressively enhanced neurodegeneration. In the
cerebellum, the neurodegenerative phenotype is characterized by reduced
arborization of PC and cell loss (Figure 29). In contrast, no neurodegenerative effect
at any time point analysed was observed in mature granule cells (Figure 30). These
evidences are in agreement with previous observations in both C57BL/6 and
FVB/NJ strains of the Ugt1-/- mouse model (Bortolussi et al., 2012, 2014, 2015).
My group showed that the absence of bilirubin conjugation in the C57BL/6 Ugt1-/-
strain of mice resulted in an increase in TB, and in the accumulation of bilirubin in
the brain. High levels of bilirubin lead to impaired cerebellar architecture and
neuronal cell death, resulting in neonatal lethality and showing 50% of survival at
P5 (Bortolussi et al., 2012). In addition, it was shown that only PCs own a
neurodegenerative phenotype (Figure 4) (Bortolussi et al., 2015). On the other
hand, further insights in bilirubin neurotoxicity mechanisms were obtained by the
study of the FVB/NJ Ugt1-/- mouse strain (Figure 5). This model shows a delayed
lethality, allowing the identification of a specific window of brain susceptibility to
bilirubin. In fact, high bilirubin levels result in cerebellar damage of untreated Ugt1-/-
animals at P8. The application of phototherapy (PT) over the first 8 days of life (P0-
P8 PT) or starting from P8 to P20 (P8-P20 PT) does not rescue the lethality of mice,
underling a critical window of susceptibility of brain during this developmental stage
(Bortolussi et al., 2014).
These results obtained by PT modulation supports the concept that bilirubin
susceptibility depends on the cell type and developmental stage, affecting survival
of neuronal precursors by impairing their neurogenesis, arborization and synaptic
connectivity (Falcão et al., 2007; Fernandes et al., 2009). In vitro experiments
performed by the group of Prof. Brites showed that immature neurons are
particularly sensitive to bilirubin and inflammatory agents (e.g. TNFα), resulting in
decreased neurites outgrowth and increased apoptosis rate (Falcão et al., 2007).
Bilirubin exposure reduces viability of proliferating neuronal precursors (Fernandes
et al., 2009), thus indicating that bilirubin exerts a detrimental effect on
undifferentiated neurons during brain development. In addition, bilirubin affects
other cell types in the CNS, such as oligodendrocyte precursor cells, by delayed

135
differentiation, reduced number of mature oligodendrocytes, decreased number of
internodes and their relative myelin length (Barateiro et al., 2013).
4.2.2 Oxidative stress response
Due to its antioxidant and cytoprotective properties, low bilirubin concentrations are
considered beneficial (Stocker et al., 1987). However, higher levels of bilirubin
impair cell homeostasis, placing jaundice babies at risk during neonatal severe
hyperbilirubinemia. It has been shown that toxic bilirubin concentrations lead to
oxidative stress response in vitro, and the abrogation of nitric oxide (NO) production
extends the survival of cell cultures of rat neurons (Brito et al., 2008b). Further
demonstration on oxidative stress involvment were given by Brito and colleagues
(Brito et al., 2008a), showing that oxidative stress response is impaired not only in
neuronal cell cultures, but also in rat cortical cerebrum astrocyte cultures, although
the latter cell type appears to be less sensitive to bilirubin incubation. In addition to
these in vitro evidences, it is important to underline that the CNS is particularly
sensible to oxidative stress, and neurodegeneration occurs when reactive oxygen
species (ROS) production overwhelms antioxidant defences (Fischer and Maier,
2015).
In the Ugt1-/- mouse model, mutant animals showed increased ROS production that
resulted in the up-regulation of Nrf2 gene expression. As a key transcription factor
activated in response to stress conditions, Nrf2 translocates in to the nucleus, where
it transactivates antioxidant regulated genes (ARE) (Giudice et al., 2010), such as
cyto-protective enzymes. Accordingly, after Nrf2 stimulation by bilirubin, it was
observed the up-regulation of HO-1 expression levels during the more advanced
stages of the disease analysed (such as P8 and P10) (Figure 37A).
These findings support previous in vitro and in vivo studies, showing that the redox-
sensitive pathway is not sufficient to protect neurons over the prolonged oxidative
stress induced by bilirubin (Calligaris et al., 2009; Giraudi et al., 2011; Rodrigues et
al., 2000; Stoeckius et al., 2012).
As a consequence of the cell damage, the mitochondrial apoptotic pathway is
activated (Brites, 2011), resulting in increased oxidative stress and cellular redox
status imbalance (Qaisiya et al., 2014; Tell and Gustincich, 2009). However, in the
cerebellum of Ugt1-/- mice it was not observed the regulation of the mitochondrial
superoxide dismutase 2 (SOD2), nor an impaired expression of mitochondrial
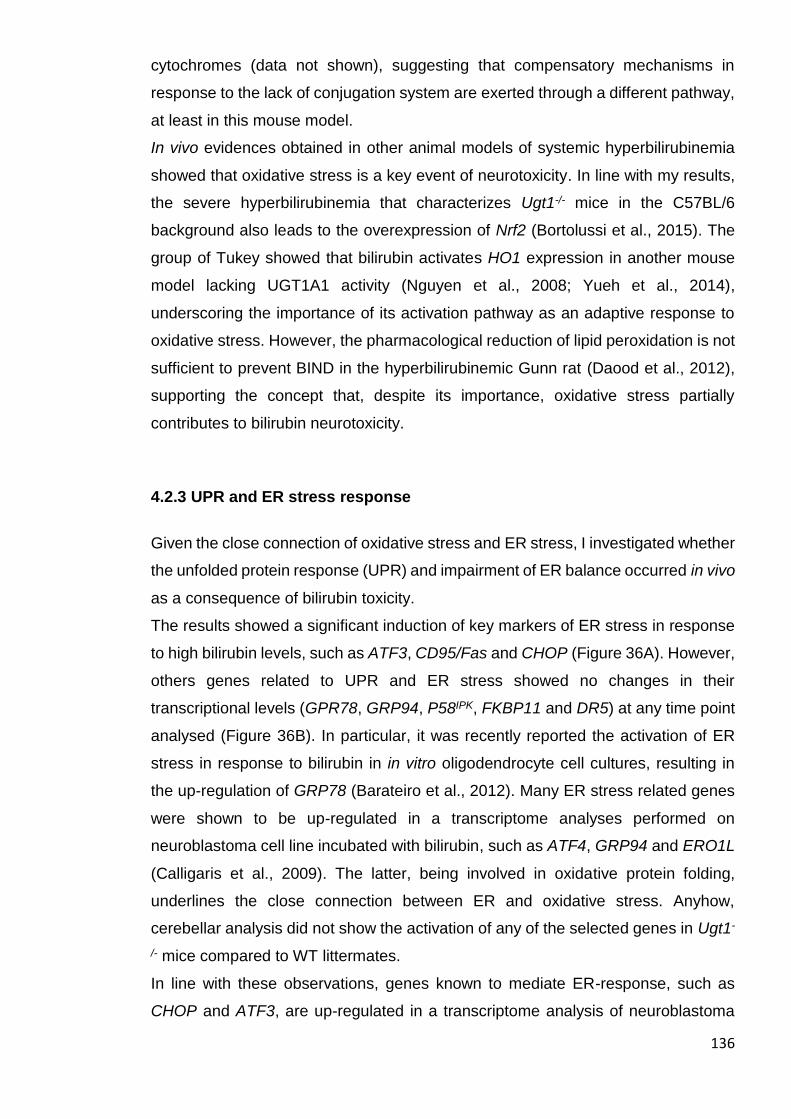
136
cytochromes (data not shown), suggesting that compensatory mechanisms in
response to the lack of conjugation system are exerted through a different pathway,
at least in this mouse model.
In vivo evidences obtained in other animal models of systemic hyperbilirubinemia
showed that oxidative stress is a key event of neurotoxicity. In line with my results,
the severe hyperbilirubinemia that characterizes Ugt1-/- mice in the C57BL/6
background also leads to the overexpression of Nrf2 (Bortolussi et al., 2015). The
group of Tukey showed that bilirubin activates HO1 expression in another mouse
model lacking UGT1A1 activity (Nguyen et al., 2008; Yueh et al., 2014),
underscoring the importance of its activation pathway as an adaptive response to
oxidative stress. However, the pharmacological reduction of lipid peroxidation is not
sufficient to prevent BIND in the hyperbilirubinemic Gunn rat (Daood et al., 2012),
supporting the concept that, despite its importance, oxidative stress partially
contributes to bilirubin neurotoxicity.
4.2.3 UPR and ER stress response
Given the close connection of oxidative stress and ER stress, I investigated whether
the unfolded protein response (UPR) and impairment of ER balance occurred in vivo
as a consequence of bilirubin toxicity.
The results showed a significant induction of key markers of ER stress in response
to high bilirubin levels, such as ATF3, CD95/Fas and CHOP (Figure 36A). However,
others genes related to UPR and ER stress showed no changes in their
transcriptional levels (GPR78, GRP94, P58IPK, FKBP11 and DR5) at any time point
analysed (Figure 36B). In particular, it was recently reported the activation of ER
stress in response to bilirubin in in vitro oligodendrocyte cell cultures, resulting in
the up-regulation of GRP78 (Barateiro et al., 2012). Many ER stress related genes
were shown to be up-regulated in a transcriptome analyses performed on
neuroblastoma cell line incubated with bilirubin, such as ATF4, GRP94 and ERO1L
(Calligaris et al., 2009). The latter, being involved in oxidative protein folding,
underlines the close connection between ER and oxidative stress. Anyhow,
cerebellar analysis did not show the activation of any of the selected genes in Ugt1-
/- mice compared to WT littermates.
In line with these observations, genes known to mediate ER-response, such as
CHOP and ATF3, are up-regulated in a transcriptome analysis of neuroblastoma

137
and hepatoma cell lines in response to high bilirubin levels (Calligaris et al., 2009;
Oakes and Bend, 2010). The continuous rise of bilirubin levels over time in the
FVB/NJ Ugt1-/- mouse model causes an impairment in cell homeostasis (Bortolussi
et al., 2014). Neurons are not able to revert ER stress, as suggested by the up-
regulated expression of effector genes like CD95/Fas and CHOP, resulting in death
by apoptosis of susceptible cells. The activation of ER stress may trigger the PERK-
mediated pathway (Chaudhari et al., 2014; Kim et al., 2009), leading to the apoptotic
pathway, as evidenced by increased CHOP and CD95/Fas expression and caspase
3 cleavage (Figure 36A and 28C, respectively).
The early and progressive up-regulation of CHOP and ATF3 observed in the Ugt1-
/- mouse model may reflect the precocity of the ER stress response, indicating that
neurons have already activated ER stress response after the initial phases of
bilirubin accumulation. Taken together, these in vivo observations suggest that ER
stress is a key initial event that causes neuro-apoptosis and has an important
contribution in the overall process that results in lethality by hyperbilirubinemia.
4.2.4 Inflammatory mediators
As shown in the previous chapter, ER stress was a critical process involved in
bilirubin lethality of the neonatal hyperbilirubinemia mouse model. Since the
activation of ER stress can critically regulate inflammation, particularly through ROS
production (Chaudhari et al., 2014), it was then analysed the contribution of
inflammatory players to the exacerbation of bilirubin-induced cerebellar damage. In
fact, in addition to ER and oxidative stress stimuli, also in the nervous system the
degeneration of neurons can stimulate inflammation. Neuroinflammation can be
activated by different mechanisms, such as the signals deriving from injured
neurons, the accumulation of misfolded or modified proteins, and/or the imbalance
between pro- and anti-inflammatory processes.
I showed that two well-known inflammatory mediators, NFKβ and IL18, were early
responders to high bilirubin levels at the onset of the disease (Figure 35).
NFKβ can have both neuroprotective and neurotoxic roles, since this transcription
factor plays a bivalent function depending on the kinetics and the expression in the
injured tissue. NFKβ is essential in the regulation of inflammation and oxidative
stress when activated as a defence response to stress stimuli, but it is also involved
in processes such as apoptosis, proliferation and differentiation to establish cellular
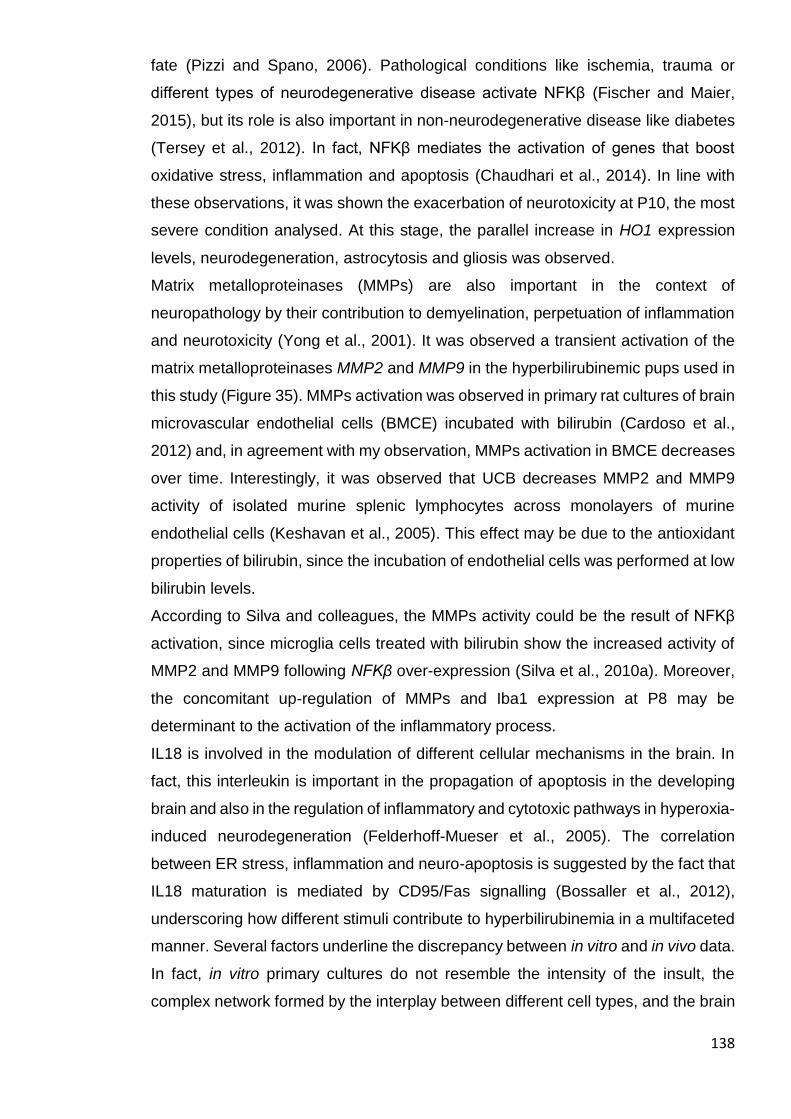
138
fate (Pizzi and Spano, 2006). Pathological conditions like ischemia, trauma or
different types of neurodegenerative disease activate NFKβ (Fischer and Maier,
2015), but its role is also important in non-neurodegenerative disease like diabetes
(Tersey et al., 2012). In fact, NFKβ mediates the activation of genes that boost
oxidative stress, inflammation and apoptosis (Chaudhari et al., 2014). In line with
these observations, it was shown the exacerbation of neurotoxicity at P10, the most
severe condition analysed. At this stage, the parallel increase in HO1 expression
levels, neurodegeneration, astrocytosis and gliosis was observed.
Matrix metalloproteinases (MMPs) are also important in the context of
neuropathology by their contribution to demyelination, perpetuation of inflammation
and neurotoxicity (Yong et al., 2001). It was observed a transient activation of the
matrix metalloproteinases MMP2 and MMP9 in the hyperbilirubinemic pups used in
this study (Figure 35). MMPs activation was observed in primary rat cultures of brain
microvascular endothelial cells (BMCE) incubated with bilirubin (Cardoso et al.,
2012) and, in agreement with my observation, MMPs activation in BMCE decreases
over time. Interestingly, it was observed that UCB decreases MMP2 and MMP9
activity of isolated murine splenic lymphocytes across monolayers of murine
endothelial cells (Keshavan et al., 2005). This effect may be due to the antioxidant
properties of bilirubin, since the incubation of endothelial cells was performed at low
bilirubin levels.
According to Silva and colleagues, the MMPs activity could be the result of NFKβ
activation, since microglia cells treated with bilirubin show the increased activity of
MMP2 and MMP9 following NFKβ over-expression (Silva et al., 2010a). Moreover,
the concomitant up-regulation of MMPs and Iba1 expression at P8 may be
determinant to the activation of the inflammatory process.
IL18 is involved in the modulation of different cellular mechanisms in the brain. In
fact, this interleukin is important in the propagation of apoptosis in the developing
brain and also in the regulation of inflammatory and cytotoxic pathways in hyperoxia-
induced neurodegeneration (Felderhoff-Mueser et al., 2005). The correlation
between ER stress, inflammation and neuro-apoptosis is suggested by the fact that
IL18 maturation is mediated by CD95/Fas signalling (Bossaller et al., 2012),
underscoring how different stimuli contribute to hyperbilirubinemia in a multifaceted
manner. Several factors underline the discrepancy between in vitro and in vivo data.
In fact, in vitro primary cultures do not resemble the intensity of the insult, the
complex network formed by the interplay between different cell types, and the brain

139
developmental status. IL18 is a key example of this concept, since it is highly
expressed in the early post-natal stages of brain development, but it is down-
regulated and almost absent in the adult brain (Felderhoff-Mueser et al., 2005). To
my knowledge, this is the first report showing the activation of IL18 and NFKβ
induced by bilirubin in an in vivo model of neonatal hyperbilirubinemia.
TNFα was activated in the latest and most severe phases that characterize the
disease states of the Ugt1-/- pups. TNFα is a key factor released in the CNS by
activated microglia and astrocytes, and mediates the amplification of neuro-
inflammatory events contributing to the initiation of the apoptotic cascade. As in the
cases of NFKβ and IL18, many neurodegenerative conditions such as ALS, PD and
HD, show the up-regulation of TNFα (Olmos and Llado, 2014). Studies performed
on astrocytes and microglia primary cultures showed the release of the pro-
inflammatory cytokines TNFα and IL1β after bilirubin incubation (Fernandes et al.,
2004; Gordo et al., 2006). In our studies, TNFα expression was increased at the
later analysed stage (Figure 35), in line with experiments performed in primary cell
cultures of astrocytes treated with bilirubin (Fernandes and Brites, 2009). In the
same study, the activation of other well-known pro-inflammatory mediators, such as
IL1β, IL6 and INFγ, was less pronounced (Fernandes and Brites, 2009).
Unexpectedly, it was not possible to detect IL1β, IL6, IL10 and INFγ in the
cerebellum of FVB/NJ Ugt1-/- and WT mice (Figure 34). Nonetheless, the network
of interrelated mechanisms resulting from different studies on hyperbilirubinemia will
require further in vivo experimentation to evaluate and assess the role of distinct
pathways in this multifaceted disease.
4.2.5 Implication of inflammatory cell mediators
The main effectors of innate immune response in the CNS are microglia and
astrocytes, whose activation is particularly evident in response to
neurodegeneration.
Hyperbilirubinemia triggered the activation of both astrocytes and microglia in the
cerebellum of Ugt1-/- mice. It was observed a prominent activation of GFAP
expression compared to WT mice in the most compromised conditions (P8 and P10,
Figure 31), while Iba1 expression was also increased but less prominently and in
the latest analysed time point (P10, Figure 32).

140
The effect of bilirubin activation on these two cell types has been reported both in
vitro and in vivo. In vitro experiments showed the activation of glia cells in response
to toxic bilirubin levels (Brites, 2012). However, the role of glia activation is still
controversial. In fact, the beneficial effect of astrocytes in protecting neurons when
challenged by bilirubin was reported (Falcao et al., 2013). On the other hand, longer
exposure to bilirubin showed that astrocytes critically worsen the viability of neurons
(Falcão et al., 2014). In vivo studies on Gunn rat cerebellum indicated that the
increase in GFAP content is a common trait of hyperbilirubinemia (Mikoshiba et al.,
1980). Moreover, astrocytes activation was also shown in a liver-specific Ugt1a1
conditional knockout mouse model (Barateiro et al., 2016; Yueh et al., 2014). In both
works, the authors showed that at P14, GFAP is increased in response to bilirubin
more than 15 times by expression analysis, and a 6-fold increase by IF analysis
when compared to their control, being astrocytes the main effectors of HO1
production. In addition, primary cultures of astrocytes are the main effectors for HO1
production (Yueh et al., 2014).
According to my results, Yueh and colleagues also reported the involvement of glia
by Iba1 activation, as shown by a 3-fold increase in Iba1 expression. The analysis
of microglia primary cell cultures revealed that Iba1-positive cells are mostly
responsible for the increase in pro-inflammatory cytokines (Yueh et al., 2014).
Importantly, the role of TLR2 in activation of inflammatory response was
demonstrated in the context of bilirubin damage to brain. Hyperbilirubinemic Ugt1a1-
/- TLR2-/- mice are characterized by the block of inflammatory activation that results
in increased mortality, underlining the importance of inflammatory response in the
context of bilirubin toxicity (Yueh et al., 2014). However, despite the activation of
inflammatory response in the Ugt1-/- mouse model, no differences in TLR2
regulation in response to bilirubin were observed (Figure 35B). The reason of this
discrepancy could rely on the fact that Yueh and colleagues´ analysis was
performed at a later time point, namely P14, or could be due to intrinsic differences
in the models. Although the mouse model characterized by Yueh and colleagues
showed lower levels of TB, it is reasonable to hypothesize that the level and duration
of the bilirubin insult in the two models may produce differences in TLR2 regulation.
Furthermore, it was studied the role of different types of microglia that are activated
during the disease progression. In fact, the interplay between M1 and M2 microglia
was never investigated in context of bilirubin toxicity. The activation of M2 microglia,
such as MRC1 expression, was observed at the early stages of the disease.
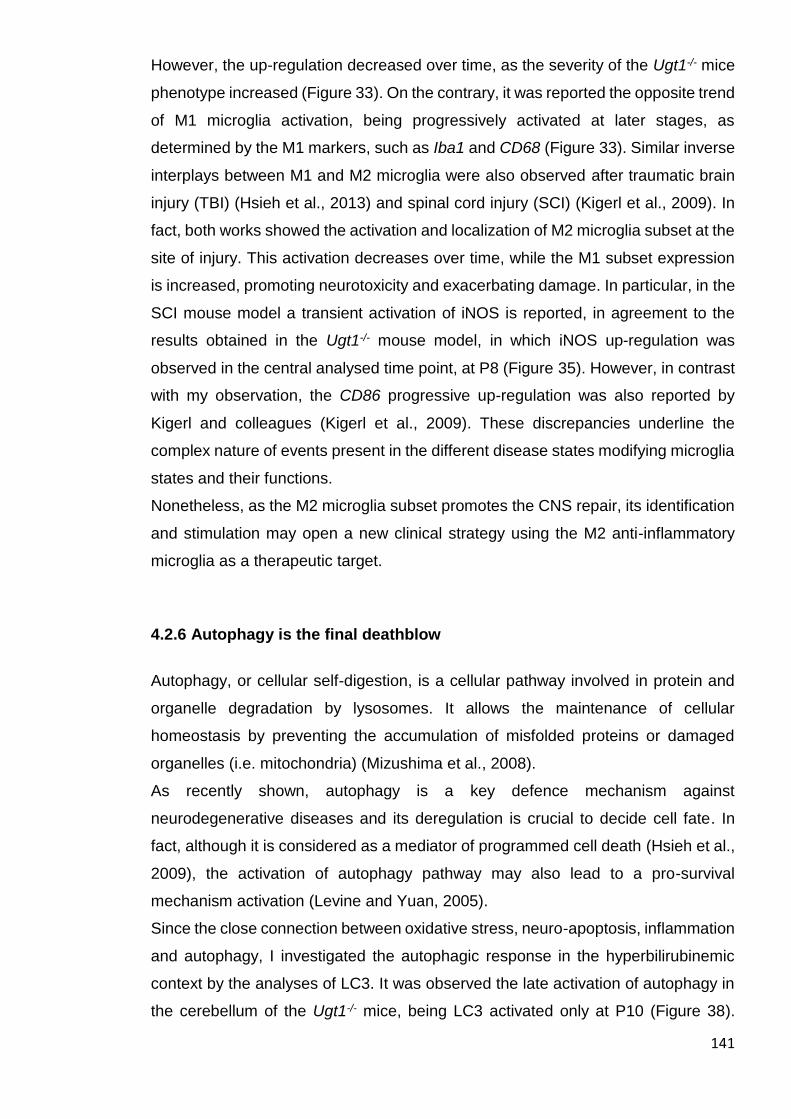
141
However, the up-regulation decreased over time, as the severity of the Ugt1-/- mice
phenotype increased (Figure 33). On the contrary, it was reported the opposite trend
of M1 microglia activation, being progressively activated at later stages, as
determined by the M1 markers, such as Iba1 and CD68 (Figure 33). Similar inverse
interplays between M1 and M2 microglia were also observed after traumatic brain
injury (TBI) (Hsieh et al., 2013) and spinal cord injury (SCI) (Kigerl et al., 2009). In
fact, both works showed the activation and localization of M2 microglia subset at the
site of injury. This activation decreases over time, while the M1 subset expression
is increased, promoting neurotoxicity and exacerbating damage. In particular, in the
SCI mouse model a transient activation of iNOS is reported, in agreement to the
results obtained in the Ugt1-/- mouse model, in which iNOS up-regulation was
observed in the central analysed time point, at P8 (Figure 35). However, in contrast
with my observation, the CD86 progressive up-regulation was also reported by
Kigerl and colleagues (Kigerl et al., 2009). These discrepancies underline the
complex nature of events present in the different disease states modifying microglia
states and their functions.
Nonetheless, as the M2 microglia subset promotes the CNS repair, its identification
and stimulation may open a new clinical strategy using the M2 anti-inflammatory
microglia as a therapeutic target.
4.2.6 Autophagy is the final deathblow
Autophagy, or cellular self-digestion, is a cellular pathway involved in protein and
organelle degradation by lysosomes. It allows the maintenance of cellular
homeostasis by preventing the accumulation of misfolded proteins or damaged
organelles (i.e. mitochondria) (Mizushima et al., 2008).
As recently shown, autophagy is a key defence mechanism against
neurodegenerative diseases and its deregulation is crucial to decide cell fate. In
fact, although it is considered as a mediator of programmed cell death (Hsieh et al.,
2009), the activation of autophagy pathway may also lead to a pro-survival
mechanism activation (Levine and Yuan, 2005).
Since the close connection between oxidative stress, neuro-apoptosis, inflammation
and autophagy, I investigated the autophagic response in the hyperbilirubinemic
context by the analyses of LC3. It was observed the late activation of autophagy in
the cerebellum of the Ugt1-/- mice, being LC3 activated only at P10 (Figure 38).
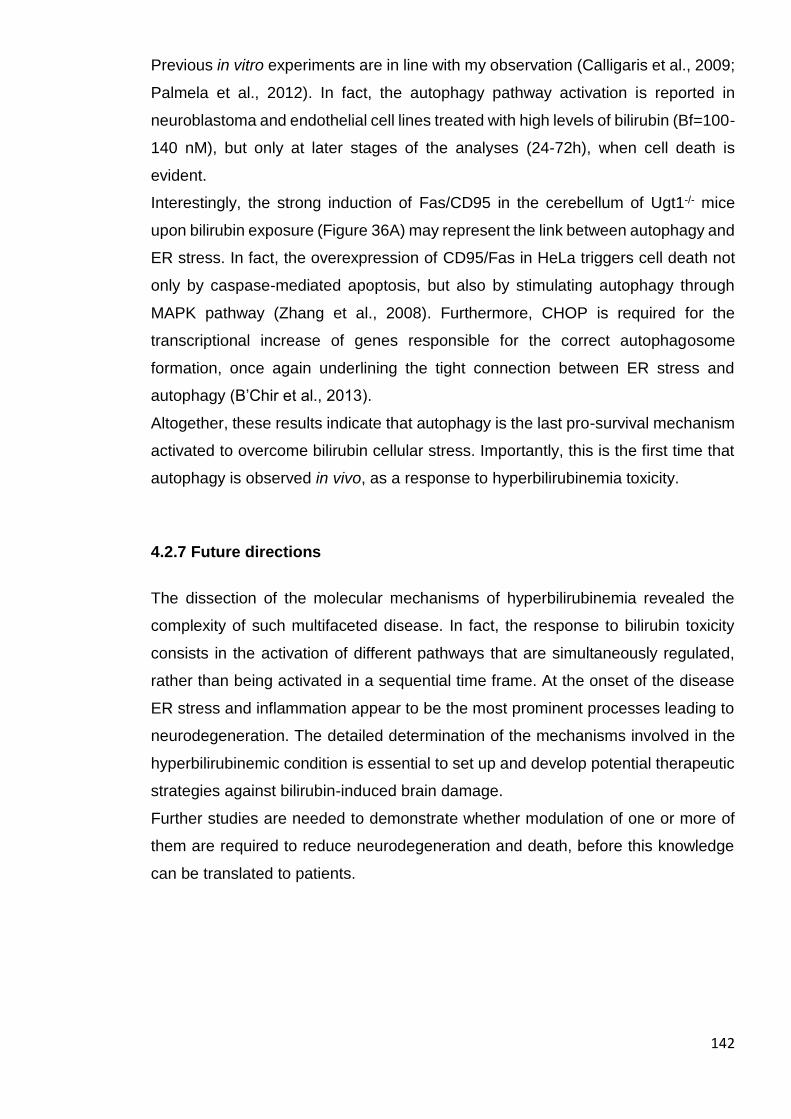
142
Previous in vitro experiments are in line with my observation (Calligaris et al., 2009;
Palmela et al., 2012). In fact, the autophagy pathway activation is reported in
neuroblastoma and endothelial cell lines treated with high levels of bilirubin (Bf=100-
140 nM), but only at later stages of the analyses (24-72h), when cell death is
evident.
Interestingly, the strong induction of Fas/CD95 in the cerebellum of Ugt1-/- mice
upon bilirubin exposure (Figure 36A) may represent the link between autophagy and
ER stress. In fact, the overexpression of CD95/Fas in HeLa triggers cell death not
only by caspase-mediated apoptosis, but also by stimulating autophagy through
MAPK pathway (Zhang et al., 2008). Furthermore, CHOP is required for the
transcriptional increase of genes responsible for the correct autophagosome
formation, once again underlining the tight connection between ER stress and
autophagy (B’Chir et al., 2013).
Altogether, these results indicate that autophagy is the last pro-survival mechanism
activated to overcome bilirubin cellular stress. Importantly, this is the first time that
autophagy is observed in vivo, as a response to hyperbilirubinemia toxicity.
4.2.7 Future directions
The dissection of the molecular mechanisms of hyperbilirubinemia revealed the
complexity of such multifaceted disease. In fact, the response to bilirubin toxicity
consists in the activation of different pathways that are simultaneously regulated,
rather than being activated in a sequential time frame. At the onset of the disease
ER stress and inflammation appear to be the most prominent processes leading to
neurodegeneration. The detailed determination of the mechanisms involved in the
hyperbilirubinemic condition is essential to set up and develop potential therapeutic
strategies against bilirubin-induced brain damage.
Further studies are needed to demonstrate whether modulation of one or more of
them are required to reduce neurodegeneration and death, before this knowledge
can be translated to patients.

143
4.3 MNC decreases neurodegeneration and neuroinflammation resulting in
increased lifespan and partial rescue of neonatal hyperbilirubinemia lethality
To obtain deeper insights in bilirubin neurotoxicity mechanisms mutant mice were
treated with MNC, a known compound with anti-inflammatory and neuroprotective
properties. In fact, MNC administration throughout lactating dams decreased
neurodegeneration and neuroinflammation, and increased the lifespan of Ugt1-/-
pups. As a result, it was obtained a partial rescue of the lethal outcome triggered by
severe neonatal hyperbilirubinemia.
4.3.1 MNC lifespan extension
Treatment of the lactating mothers with increasing MNC dosage resulted in the
lifespan extension of Ugt1-/- pups, shifting the 50% of survival from P11 in untreated
mutant animals to P26 in mice treated with the highest MNC dose (Figure 39).
Moreover, 20 days of MNC administration rescued lethality of 15% and 30% of
mutant animals treated with MNC 2X and MNC 4X, respectively, underscoring the
beneficial potentiality of this treatment. The in vivo wide beneficial effects of MNC
on survival have been shown in several mouse models of neurodegeneration,
ranging from multiple sclerosis (MS) to spinal cord injury, from ALS to HD, PD and
AD (Kim and Suh, 2009). For example, two different groups working on ALS showed
the efficacy of MNC in increasing the lifespan of SODG93A mice, which exhibit a
motor neuron-specific neurodegeneration (Kobayashi et al., 2013; Zhang et al.,
2003). However, the age of animals and route of administration were different from
those used in this Thesis, as these studies were performed in adult mice treated
with several i.p. injections per week.
On the other hand, the role of MNC is controversial, since different groups have
shown it has negative effects on survival. A recent work from Pinkernelle and
colleagues showed the deleterious effect of MNC administration on motor neurons
in ex vivo organotypic rat spinal cord cultures (Pinkernelle et al., 2013). In addition,
in vivo negative effects of high MNC doses were shown in the R6/2 mouse model
of HD (Menalled et al., 2010), as mice survival was reduced. Since HD affects
neuron viability in different regions of the brain compared to bilirubin, which affects
preferentially the cerebellum, further studies are needed to elucidate the impact of
MNC on survival in different disease contexts.

144
4.3.2 MNC route of administration
The route of MNC administration is particularly important for the treatment efficacy.
Fagan and colleagues suggested the use of i.v. MNC administration to obtain
reliable results in a brain injury model, as MNC half-life in plasma is ~3 hours post
injection (Fagan et al., 2004). To note, most of the work performed on rodent models
of neurodegeneration takes advantage of single or double i.p. injections,
preferentially evaluating the outcome shortly after ‘injury’ (Plane et al., 2010).
Since repeated i.p. or i.v. injection of P0 pups is impracticable (the weight of pups
is about 1.0-1.5 g at birth), I used the approach already employed by Lin et al with
Gunn rat pups (Lin et al., 2005), by daily administering fresh MNC dissolved in the
drinking water to the lactating mothers. However, in that study MNC is administrated
also after weaning on, till the day of sacrifice; the drug is dissolved in water with the
addition of sucrose to favour the intake (Lin et al., 2005). In contrast, in my study
sucrose supplementation was omitted, since it was observed no difference between
the sole intake of water and the water-MNC solution (Figure 40). In line with my
data, Hinwood and colleagues observed that 40 mg/kg/day of MNC administration
does not modify water consumption of treated adult rats (Hinwood et al., 2012).
Unaffected drinking rate is particularly important for the homogeneity of the
experiment, not only because the amount of milk drunk may affect the effective MNC
dosage in pups, but also because it may have a direct effect on the general
conditions (dehydration, strength to milk, etc.) of pups affecting their growth and
severity of the disease.
The lowest dose of MNC able to extend lifespan was 0.84 mg/mL (corresponding to
MNC 1X), while the highest consisted in 3.36 mg/mL (MNC 4X). No negative effects
were observed by this MNC dose except the decrease in weight growth (discussed
below), but it cannot be excluded that higher MNC doses may have a detrimental
effect on pups. For example, in another model and species, a single i.p. MNC
administration of high doses (500 mg/kg) results in the death of hyperbilirubinemic
rat pups (Geiger et al., 2007). However, it is difficult to assess the exact quantity of
drug intake by pups and final effective dose, due to the several passages of MNC
(from mother to pups) and lack of information of MNC concentration in the milk, that
add complexity to the calculation.
The usual dosage of MNC to treat acne in adult is 200 mg/day. Lin and colleagues
showed that about 22.5 mg/day of mothers intake results in 1.46 µg/g of brain MNC
concentration in treated pups (Lin et al., 2005). It is reasonable that, considering the
145
different size of mice and rats brains, and the higher drug doses given to the
mothers, MNC concentration in the brain of Ugt1-/- pups may result even higher.
However, such hypothesized high concentration, correlated with survival, underlines
the severity of Ugt1-/- mice phenotype compared to the one of hyperbilirubinemic
Gunn rat pups.
A comparison between animal model and human is hardly practicable, since MNC
is not recommended for the use in children below the age of 8 years old. In a recent
work on children with an average of 8 years old affected by Angelman syndrome (a
rare genetic disorder characterized by a deletion in the chromosome 15 causing
neurodevelopmental disorder) indicated that 8 weeks of oral MNC administration (3
mg/kg/day) are well tolerated, also showing beneficial effects of the drug on
cognitive impairment (Grieco et al., 2014). However, solid and reliable data on MNC
concentration in babies’ brain are still missing.
4.3.3 MNC side effects
MNC administration has different effects in the outcome of neurodegenerative
disorders, depending on the type of the disease and the age of subjects. As many
other antibiotics, the use of MNC is discouraged in infants or pregnant woman. In
fact, being ion chelators, tetracyclines act as calcium phosphate binder, allowing the
aggregates deposition in teeth and bones, thus impairing their growth (Buller et al.,
2008). In the Ugt1-/- mouse model, a decrease in the weight growth curve was
observed during the treatment in MNC-treated WT and mutant mice, when
compared with untreated WT mice (Figure 41). This effect was transient and the
weight recovered after MNC discontinuation. This is in contrast to what observed by
Hinwood and colleagues when MNC was administered in the drinking water to 70
days old rats exposed to chronic psychological stress (Hinwood et al., 2012). In fact,
they showed that the stress affects weight gain of rats but MNC does not. This effect
may be due to the different age of the animals, as in my experiment pups received
milk from mothers since birth, while Hinwood treated adult rats. Interestingly, MNC
does not affect the pups’ growth in a rat model of neonatal stroke. After focal
cerebral ischemia-reperfusion, P7 rat pups treated with PBS show no differences
with littermates treated with i.p. injection of MNC, regardless if single or triple
injection (Fox et al., 2005).
146
One important difference may stand in the frequency of MNC administration, which
was given just once or three times, in comparison with the continuous administration
in my experimental protocol. It cannot be excluded that the antimicrobial effect may
influence digestion of milk in pups, thus affecting their growth.
The majority of the MNC 2X- and 4X-treated Ugt1-/- animals begun to die after MNC
discontinuation, as shown in the survival curve (Figure 39). Moribund animals lost
weight, thus affecting the weight curve in the temporal window from P20 (at the time
of MNC discontinuation) to P30 (Figure 41C and 41D). It is reasonable to think that
a more prolonged MNC administration could further extend Ugt1-/- mice lifespan, but
a different way of administration (e.g. gavage, i.p. or i.v. administration) would be
required.
One of the most surprising beneficial properties of MNC was the ability to rescue
animals without modifying bilirubin plasma levels. In fact, treated and untreated
animals had high and unaffected TB levels (Figure 42), similarly to the bilirubin
determination performed on Gunn rats (Lin et al., 2005), indicating no effect of MNC
on systemic bilirubin levels.
I did not observe any obvious secondary effect in the MNC-treated mice, but I cannot
rule out an increase in transaminases levels in mice treated with MNC. However,
since the administration of MNC 10 mg/kg results in decreased transaminases
activation in a mouse model of hemorrhagic shock (Kholmukhamedov et al., 2014),
it can be speculated that this phenomenon may not occur in Ugt1-/- mice treated with
MNC.
4.3.4 Timing of administration is crucial to obtain MNC beneficial effects
Recent evidences pointed to the importance of the timing of MNC administration,
i.e., whether administration is performed during the pre- or the post-symptomatic
condition. In fact, it was observed that MNC beneficial properties are most significant
when the drug is administered close to the moment of ‘injury’. This effect was
particularly evident in the case of acute hyperbilirubinemia, as the efficacy of MNC
was tested in Gunn rat pups (at P16) with acute bilirubin levels generated by with
sulpha. The late administration of MNC (120 min after sulpha) does not rescue the
alterations in BAEPs caused by the bilirubin peak, while pups with early i.p. MNC
supplementation (30 min after sulpha) show no abnormalities (Rice et al., 2011).
Hence, the effect of MNC early administration to Gunn rats was remarkable.
147
However, important differences exist between the work of Rice and colleagues and
the work performed in this Thesis. In fact, the damage in the Gunn pups was
produced by the pharmacological increase of bilirubin levels, resembling an acute
phase, while hyperbilirubinemia was genetically induced and the Ugt1-/- mice used
in my study showed chronic high TB. Nonetheless, MNC administration from the
day of birth resulted in amelioration of the lethal phenotype of Ugt1-/- mice,
suggesting that, although hyperbilirubinemia was chronic, the preventive use of
MNC is effective in rescuing animals.
4.3.5 MNC effectively reduces neurodegeneration
As shown in the section 3.2, neurodegeneration is a key event caused by bilirubin.
At P15, Ugt1-/- mice used in this study showed a severely impaired cerebellum,
resulting in the reduction of 57% of cerebellar layer thickness in mice treated with
the lowest analysed dose (MNC 1X). In contrast, MNC 4X-treated Ugt1-/- animals
had a 50% increase in the total cerebellar thickness compared to mutant receiving
the MNC 1X dose (Figure 43C). The prevention of cerebellar abnormalities by MNC
was also shown in a neonatal rat model of hyperoxia, in which i.p. MNC injection
reduced cerebellar impairment in rat pups exposed to 80% of O2 (Scheuer et al.,
2015). In addition, my results are in agreement with the work of Lin and colleagues,
who showed that administration of MNC to dams (at lower doses compared to this
study) retrieves cerebellar abnormities of Gunn rat pups (Lin et al., 2005). However,
as mentioned before, Gunn rats showed a milder neurological phenotype, survive
and reach adulthood without any treatment; thus, the estimation of the MNC benefit
on rats’ survival is not possible to determine. The less severe phenotype combined
with the administration of MNC after weaning may account for the complete rescue
of both the cerebellar hypoplasia and PCs number. In the same work it was shown
that the in vivo administration of MNC decreases the activation of p38 in cerebellar
extracts of hyperbilirubinemic Gunn rat pups, adding further insights in the anti-
inflammatory properties of MNC (Lin et al., 2005).
The trend showing a reduction in apoptosis after MNC 4X treatment observed at P8
(Figure 45A) was very significant at P15, as cleaved-caspase 3 levels decreased to
WT levels in MNC 4X-treated Ugt1-/- animals (Figure 45B). It was previously shown
that, among its beneficial properties, MNC inhibits the cytochrome c release from
mitochondria in an in vivo model of ALS, in primary cortical neurons and in isolated

148
mitochondria, thus directly affecting caspase 3 activation (Zhu et al., 2002). In
addition, my result is in line with those of Wang and colleagues, who demonstrated
caspase 3 reduction in both in vitro and in vivo models of ALS and HD (Wang et al.,
2003). A more recent report showed that MNC inhibits apoptosis by reducing
caspase 3 cleavage, protecting a human dopaminergic cell line challenged with a
neurotoxic inducer (Ossola et al., 2012).
It is straightforward to predict that the reduction of cerebellar apoptosis will result in
an increase of the final number of neurons. In fact, it was observed that the
neuroprotective properties of MNC on GCs of MNC 4X-treated Ugt1-/-mice resulted
in an increase in Granule neurons number, since they were increased more than 2
times compared to mutant mice treated with the lower dose of MNC (Figure 47).
This is in contrast to what observed by Cheng and colleagues, showing that MNC
treatment is not sufficient to rescue NeuN content and cell death upon induction of
Dicer knocking-out (a mouse model of neurodegeneration) in the hippocampus
(Cheng et al., 2015). Interestingly, in untreated Ugt1-/- mice GCs were not affected,
even after ten days of severe hyperbilirubinemia (P10) (Figure 30). Therefore, it is
reasonable to hypothesise that this cell type may be affected by a more prolonged
bilirubin exposure, as clear differences were present at P15 in MNC 1X-treated
Ugt1-/-mice (Figure 47). It should be considered that the MNC effects may depend
on the cell-type and the nature of the insult, accounting for different neuroprotective
outcomes, as Chen and colleagues focused their attention on hippocampal neurons
(Cheng et al., 2015), while in my study the analysis was performed on cerebellar
neurons.
MNC also partially rescued MNC 4X-treated Ugt1-/- animals from PCs loss by
bilirubin toxicity. In fact, it was observed decreased cerebellar calbindin content
down to 50% and reduced arborization (Figure 46), but PCs density of mutant mice
treated with the highest dose was comparable to WT. The potential neuroprotective
properties of MNC on these important neurons were also shown in Gunn rats, where
pups have same PCs number compared to WT when treated with the drug (Lin et
al., 2005). The cerebellum is the organ implicated in movement and motor
coordination and, remarkably, the rescued Ugt1-/- animals were able to perform the
rotarod test as well as WT animals (Figure 43), suggesting that the number of viable
PCs, despite their reduced arborisation, is an important factor affecting the
cerebellar function.
149
4.3.6 MNC attenuation of inflammation ameliorates neurodegenerative
disease
The wide anti-inflammatory effects of MNC were shown in many neurodegenerative
diseases (Kim and Suh, 2009). In the Ugt1-/- mouse model, the bilirubin-induced
activation of cells involved in the glial scar process in untreated Ugt1-/- mice was
significantly reduced after MNC 4X treatment. In fact, at P15 both the levels of the
GFAP and Iba1 cerebellar markers of inflammation were decreased in MNC 4X-
treated mutant animals, compared to mice treated with the lowest dose of MNC,
almost reaching WT levels (Figure 48 and 49). These observations are in line with
the decreased number of astrocyte and microglia cells observed in a Dicer KO
mouse model of neurodegeneration after MNC treatment (Cheng et al., 2015).
Interestingly, MNC shows a beneficial impact in modulating retrovirus-induced
neurodegeneration. MNC protects neuronal cells from the detrimental effects of co-
cultured astrocytes infected (and consequentially activated) with ts1 virus, a virus
that selectively infects astrocytes (Kuang et al., 2009). However, MNC modulation
of the neuroinflammatory players depends on the disease. In fact, no reduction in
astrocytosis is observed when LPS is injected in the brain of rat pups treated with
MNC but, instead, the treatment results in a reduction in microgliosis (Fan et al.,
2005).
It is plausible that, since gliosis influences neuronal development, the reduction in
gliosis impacts on neurons, spines generation and arborisation, as shown in MNC
4X-treated Ugt1-/- mice. These results underline both the anti-inflammatory effects
of MNC, and that the reduction of the inflammatory response is important to ensure
brain development.
4.3.7 M1 and M2 microglia
Microglia modulation is very important in the outcome of brain injury, as differences
in microglia polarization can determine the fate of neurons (Michell-Robinson et al.,
2015). It was shown that bilirubin triggered the progressive activation of pro-
inflammatory M1 type microglia (inversely proportional to M2 type microglia, the
neuro-protective one) from P5 to P10 in untreated mutant mice (Figure 33), leading
to damage exacerbation, as increased gliosis formed the glial scar.
At P15, Ugt1-/- mice treated with MNC 4X showed a reduction in the M1 microglia
(Figure 50). This result is in line with what observed by Kobayashi and colleagues,
150
showing a decreased expression of M1 microglia markers by MNC treatment, both
in in vivo and in vitro models. In fact, MNC treatment reduces Iba1, CD68 and CD86
levels contributing to lifespan extension in a mouse model of ALS, while primary
cultured microglia cells treated with LPS show decreased expression of CD86 after
MNC treatment (Kobayashi et al., 2013). It is reasonable that attenuation of M1
microglia may contribute to a better outcome also in Ugt1-/- hyperbilirubinemic mice.
Since MNC abolished microglia activation, it was studied its effect on M2 type
microglia by investigating the expression of MRC1 and MRC2, two membrane
receptors involved in the resolution of the inflammatory state by M2 microglia. The
dose-dependent reduction in MRC1 well correlated with the general anti-
inflammatory effect of MNC. On the other hand, MRC2 was up-regulated both in
MNC 1X- and MNC 4X-treated Ugt1-/- animals. I can be speculated that MNC had
no effect in reducing MRC2 activation, as observed in a rat model of depression in
which MNC does not affect this gene up-regulation (Burke et al., 2014). Interestingly,
MNC had no effect on M2 expression in the ALS mouse model mentioned above,
since M2 markers up-regulation is found in both MNC-treated and untreated mice
(Kobayashi et al., 2013). However, neonatal hyperbilirubinemia and ALS greatly
differ by their onset during life. This feature might reflect the different effects of MNC
on M2 microglia regulation and, consequentially, the outcome of treated mice.
MNC effect on microglia is still controversial. Liu and colleagues showed that,
although MNC protects neuronal precursor cell cultures from LPS-activated
microglia toxic effects, it also suppresses the differentiation toward neurons, being
toxic to neuronal undifferentiated cell types at high concentration (Liu et al., 2013).
Once again, the time of administration appears crucial for the disease outcome. For
example, in an ALS mouse model, the markers of glia activation are not increased
after pre-symptomatic administration of MNC. Conversely, post-symptomatic drug
treatment triggers a further up-regulation of the already activated astrocytes and
microglia, exacerbating the course of the disease (Keller et al., 2011). Hence, further
studies are needed to elucidate the mechanism of MNC on microglia polarization.
4.3.8 Markers of inflammation
Among the molecular effectors of inflammation triggered by bilirubin, it was
observed a dose-dependent reduction of many transcripts belonging to the
151
inflammatory pathway (e.g., NFKβ, TNFα, MMPs, NOSs and TLR2, Figure 49) after
MNC administration.
To note, one of the most common examined marker of bilirubin-induced
neuroinflammation is IL1β (Fernandes and Brites, 2009; Yueh et al., 2014).
Unexpectedly, I was not able to clearly detect the mRNA of IL1β in the cerebellum
of mice in the FVB/NJ strain (Figure 34). Thus, the role of IL18, another key cytokine
belonging to the IL1 superfamily, was investigated. In contrast with other
inflammatory markers, only IL18 was up-regulated in the all MNC-treated Ugt1-/-
mice. This observation is in line with results obtained in MNC-treated P7 rat pups
after cerebral ischemia-reperfusion. In fact, 24h after the transient middle cerebral
artery occlusion, MNC does not affect IL18 levels in brain compared to PBS treated
rat pups (Fox et al., 2005). In my study, the prolonged activation of IL18 is of great
importance, because its up-regulation could highlight other mechanisms involved in
brain damage triggered by bilirubin.
NFKβ is one of the key markers involved in bilirubin-induced neuroinflammation. In
fact, it was activated in MNC 1X-treated Ugt1-/- animals and effectively reduced to
WT levels in MNC 4X-treated Ugt1-/- mice. A similar trend was also observed when
MNC was administered to in vitro cultures of microglia cells stimulated with LPS
(Kobayashi et al., 2013) and in an in vivo model of AD triggered by a diabetic
metabolic disorder (Cai et al., 2011). In the context of bilirubin, different in vitro
studies on inflammatory cells incubated with bilirubin revealed the contribution of
NFKβ to the damage, both in astrocytes (Falcao et al., 2007; Fernandes et al., 2006,
2007b) and microglia (Silva et al., 2010b). Although modest, the reduction of NFKβ
in MNC 4X-treated Ugt1-/- mice was significant and may contribute to their extended
survival.
Neuron viability is particularly susceptible to TNFα (Oldreive and Doherty, 2010). As
shown before in this study, the late expression of TNFα in untreated
hyperbilirubinemic Ugt1-/- mice correlated with the disease severity (Figure 35).
Importantly, a drastic reduction in TNFα expression was observed at P15 in MNC
4X-treated Ugt1-/- mice compared to MNC 1X-treated mutant mice. Likewise, MNC
treatment attenuated TNFα overexpression in a wide variety of neurodegenerative
conditions, like osmotic demyelination syndrome (Suzuki et al., 2010), hyperoxia
(Scheuer et al., 2015), schizophrenia (Mattei et al., 2014), β-amyloid-related
disorders (Cai et al., 2011) and epilepsy (Abraham et al., 2012). In addition, rat
astrocytes cell cultures incubated with bilirubin show increased TNFα levels
152
(Fernandes et al., 2004, 2011). In light of the TNFα relevance in the context of
bilirubin, I speculate that the enduring activation of TNFα may account, at least in
part, for the percentage of MNC 4X-treated mutant mice not surviving the treatment.
Also nitric oxide synthase (NOS) activation is considered as a major causative
reason for the pathogenesis of neurodegenerative diseases (Yuste et al., 2015).
Other experiments showed the activation of neuronal NOS (nNOS) in neuronal cell
cultures incubated with bilirubin, which promotes cells dysfunction and death (Brito
et al., 2010). The inducible NOS (iNOS) activation was shown to be up-regulated by
bilirubin exposure in endothelial cell cultures (Mazzone et al., 2010), suggesting that
regulation of NO production is important for cell viability. Although MNC is known to
reduce NOS activation in microglia cells (Wu et al., 2002), even after prolonged
exposure to high bilirubin levels it could not be observed the activation of NOS,
regardless of being the inducible or neuronal NOS. It is reasonable to conclude that
NO production is not a leading mechanism in bilirubin toxicity, at least in this animal
model of neonatal hyperbilirubinemia.
The importance of TLR2 response was shown in the Ugt1 conditional knockout
mouse model, as deficiency of TLR2 leads to the absence of neuroinflammatory
response, resulting in premature death of hyperbilirubinemic animals (Yueh et al.,
2014). In line with Yueh and colleagues, it was observed a 10- to 20-fold up-
regulation of TLR2 expression in mutant mice compared to WT animals at roughly
similar developmental stages (P14 and P15, respectively). Conversely, untreated
Ugt1-/- animals did not show TLR2 up-regulation at any of the analysed time points
(Figure 35B). Taken together, these data indicate that TLR2 activation occurs over
prolonged bilirubin levels. Pre-treatment with MNC of Balb/C mice receiving i.p.
injections of LPS results in decreased TLR2 expression (Henry et al., 2008).
Accordingly, in my study the anti-inflammatory effect of MNC resulted in a 60%
reduction of TLR2 expression in Ugt1-/- mice treated with the highest MNC dose.
Interestingly, Hu and colleagues revealed the close connection between TLR2 and
the matrix metalloproteinases (MMPs) pathway, as in vivo TLR2 deficiency
attenuates the expression of microglia MMPs. The up-regulation of MMPs by TLR2
activation in in vitro glioma cells was reduced by MNC administration (Hu et al.,
2014). As mentioned in the chapter 4.2.4, MMPs activation is an important
mechanism involved in various neurodegenerative diseases, since they contribute
to neuroinflammation (Yong et al., 2001). It was observed the dose-dependent
reduction of MMP2 and MMP9 expression in MNC 4X-treated mutant animals, in
153
line with in vivo ischemic stroke rat model evidences, in which the gelatinolytic
activity of MMPs is reduced by MNC (Machado et al., 2006). My observation,
together with the aforementioned evidences, pointed to the relevance of the TLR2
pathway as a potential target to reduce neurodegenerative consequences.
Collectively, glia cells analysis and inflammatory markers investigation underscored
that the reduction of the inflammatory response by MNC contributes to the
amelioration of the lethal phenotype in Ugt1-/- mice. Since neurodegeneration and
neuroinflammation are tightly connected and it is difficult to distinguish a specific
pattern in a time-dependent manner, further efforts are needed to clarify whether
the inhibition of gliosis exerted by MNC directly affects cell death or it is a
consequence of the prevention of neurodegeneration.
4.3.9 Bilirubin alters anxiety but not activity parameters in MNC rescued
animals
Since bilirubin affects cerebellar development, and the cerebellum is the organ
responsible for movement and motor coordination, behaviours of rescued Ugt1-/-
animals were tested. However, untreated mutant mice did not survive over P14, thus
the “untreated” control to compare Ugt1-/- mice improvement by MNC treatment was
missing.
Overall, the behaviour of MNC-treated mutant animals was similar to untreated WT
animals. In particular, despite high levels of bilirubin and their consequences on
brain morphology impairment (Figure 45C), the rotarod test showed that MNC-
rescued Ugt1-/- animals performed as well as WT littermates (Figure 43). My results
are in line with those observed in a mouse model of chronic cannabis exposure,
which results in cerebellar dysfunction due to activation of neuroinflammatory
players, thus affecting fine motor coordination (Cutando et al., 2013). Cutando and
colleagues showed that MNC administration rescues motor coordination
performance of mice affected by THC-induced cerebellar deficit (Cutando et al.,
2013). These observations underline the relevance of MNC administration in the
amelioration of cerebellar dysfunction.
Most of the parameters analysed in the OF test were similar to WT, confirming the
results of MNC-treated Ugt1-/- mice on motor-coordination performance. In fact,
activity parameters of treated Ugt1-/- mice (total travelled distance and number of
154
entries in the different zones of the arena, Figure 44A and 44B, respectively) were
similar to those of treated and untreated WT mice. The rescuing potential of activity
parameters was also evident in a mouse model of intracerebral haemorrhage. In
fact, after surgery, total travelled distance of MNC-treated mice is similar to non-
operated mice, and differs from mice treated with saline solution (Xue et al., 2010).
The most evident differences in rescued Ugt1-/- mice were shown in anxiety
parameters compared to both treated and untreated WT. Different number of rearing
events and stools production indicated an alteration in exploratory behaviour and
fear (Figure 44E and 44F). These results are in line with works performed on
hyperbilirubinemic Gunn rats by Liaury, suggesting that bilirubin-induced glia
activation may promote cognitive impairment and anxiety features (Liaury et al.,
2012, 2014). A further indication to explain different anxiety behaviours could come
from what observed in the earlier analysed time point. In fact, at P8 GFAP protein
(Figure 48A) and Iba1 mRNA levels (Figure 49A) in the cerebellum were similar to
hyperbilirubinemic untreated Ugt1-/- animals, suggesting that MNC needs time to
establish its anti-inflammatory properties. Thus, differences in the anxiety
behaviours of rescued Ugt1-/- animals may be related to this incomplete protection
from neuroinflammation during the first days after birth. Beside these analysed
parameters, further experiments will be required to better determine the causes of
the behavioural impairment of MNC-treated Ugt1-/- survivors.
4.3.10 Effects of MNC on oxidative and ER stress
Gene expression analysis of oxidative stress markers in treated mutant mice
revealed that most of them were increased upon the treatment with the lowest dose
of MNC and never reached the values of WT controls, even at the higher dose of
MNC (such as HO1, UPC2 and ERO1L, Figure 53), once again underscoring the
importance of oxidative stress in the progression of the pathology.
Differently to what observed in the untreated Ugt1-/- animals at P5 (Figure 37A), Nrf2
was not regulated by bilirubin or by MNC at P15 (Figure 53). The role of Nrf2 is
usually associated to the increase in antioxidant defences to compensate oxidative
stress, and MNC stimulates Nrf2 to promote protection, as demonstrated by Kuang
and colleagues (Kuang et al., 2009). In fact, using an in vitro model of virus-induced
neurodegeneration, they showed that MNC administration restores Nrf2 protein
levels of infected primary astrocytes to the levels of uninfected ones. I speculate
155
that the contribution of Nrf2 in the Ugt1-/- mouse model of neonatal
hyperbilirubinemia could be minor or restricted only to the initial stages of the
disease, while in later stages other players, such as HO1, are involved in the anti-
oxidant response to bilirubin stress. In fact, expression analysis of HO1 revealed an
8-fold increase in cerebella of MNC 1X-treated mutant mice, while these levels were
reduced to 5-fold increase upon MNC 4X treatment compared to WT animals levels,
showing an important trend of decreased activation. These data are in agreement
with in vivo experiments performed in a rat model of PD induced by zinc
administration (Kumar et al., 2015) and in a rat model of hepatic encephalopathy
(Gamal et al., 2014), in which MNC reduces HO1 expression levels. Taken together,
these data indicates that MNC pleiotropic effect may involve also the attenuation of
oxidative stress by decreasing the bilirubin-induced HO1 activation.
As described in the section 3.2.6, ER stress is one of the initial events leading to
cell impairment by the increase of its activation in parallel with disease progression
(Figure 34), thus, contributing to the onset of BIND. The majority of ER stress
markers were up-regulated in the mice treated with the lowest dose of MNC,
indicating that ER stress is an important molecular mechanism accounting for
bilirubin-induced toxicity. Although MNC treatment decreased the expression of
some of the investigated ER stress related genes (Figure 50A), many others were
not affected by MNC administration even at the highest dose (MNC 4X) (Figure
50B), underling the poor effect of the drug on the modulation of the ER stress
pathway.
The MNC effect on ER stress is controversial. Depending on the context, MNC
treatment resulted in different responses of the main ER stress effectors. In an in
vitro model of PD, rat neuron cell cultures treated with paraquat showed a
decreased expression of CHOP and GRP78 when MNC is administered (Huang et
al., 2012). On the contrary, Liu and colleagues showed both in vitro and in vivo that
the MNC treatment of glioma cells results in the increased expression of the above-
mentioned ER-stress related markers (Liu et al., 2013). Thus, as also suggested by
Kyuhou and colleagues (Kyuhou et al., 2006), it can be speculated that ER stress
is one of the key event leading to neurodegeneration, by its continuous neuron
homeostasis impairment, and MNC has only a partial effect in the attenuation of this
pathway.
156
4.3.11 MNC administration could open future therapeutic approaches for
neonatal hyperbilirubinemia
MNC was shown to be effective as it partially rescued the lethal phenotype of FVB
Ugt1-/- mice used in this study. In order to increase the efficiency of the therapy to
treat the acute phase of hyperbilirubinemia, the combination of MNC administration
(even at lower doses) with other therapies may represent a possible approach.
Unfortunately, one of the side effect of MNC is the photo-sensibility (Kestel, 1981),
thus a possible combination with PT to reduce bilirubin neurotoxicity is excluded.
A number of efforts have been made to design a modified version of MNC, trying to
eliminate the antimicrobial activity, without losing the neuroprotective and anti-
inflammatory properties. Regrettably, results are not striking. For example, the
modified MNC 12S-hydroxy-1,12-pyrazolinomynocycline (PMIN) was shown to
reduce lipid peroxidation, but no effect on BIND rescue was obtained, as observed
in hyperbilirubinemic Gunn rats (Daood et al., 2012). In fact, despite PMIN has no
antimicrobial activity, it was shown to be a non-chelating drug, lacking MMPs
inhibitory activity (Lertvorachon et al., 2005). Furthermore, CMT-3 6-dimethyl-6-
deoxy-4-de(dimethylamino) tetracycline, known as COL3, showed properties
resembling the non-antimicrobial activity of MNC (Edan et al., 2013). Even though
the beneficial features were replicated, also the undesired side effect of COL3 was
photosensitivity, similarly to MNC. Thus, further efforts are needed to generate novel
drugs owing higher specificity to target brain disease and fewer side effects.
Nonetheless, this set of experiments revealed that ER stress seems a predominant
feature of hyperbilirubinemia. Thus, a drug owing wider potential effects may be
more effective in acute condition to prevent BIND.

157
CONCLUSIONS
BIND and kernicterus are still a “silent” cause of significant neonatal morbidity and
mortality in low- and middle-income countries, and a concern in western countries.
The understanding of the mechanisms resulting in bilirubin neurotoxicity is essential
to prevent brain damage and death of hyperbilirubinemic babies. In this Thesis, it
was shown that bilirubin neurotoxicity is the result of concerted deregulation of
different mechanisms. In fact, the in vivo time-course analysis revealed that
neuroinflammation, ER and oxidative stress are activated at the onset of the
pathology. Marked neuroinflammation coupled to neurodegeneration exacerbate
the disease course, leading to mis-regulation of the autophagy pathway prior to
death.
The use of MNC, a neuroprotector compound having anti-inflammatory properties,
resulted in the partial rescue of the lethal phenotype by reducing neuronal cell death
and decreasing neuroinflammation, revealing the prevalence of ER stress in
bilirubin-induced neurological damage. However, the partial rescue of Ugt1-/- mice
underscores the complexity of such multifaceted disease, supporting the concept
that the combined administration of a neuroprotector compound with a drug able to
attenuate ER stress may result in the complete prevention of BIND.
In addition, I contributed to clarify the potential of HSA administration in reducing
bilirubin neurotoxicity and mortality during the neonatal period. In this work, I showed
that plasma Bf is the most accurate clinical parameter to indicate bilirubin
neurotoxicity, as it strongly correlates with UCB accumulation in the brain of
hyperbilirubinemic mice. Furthermore, it was demonstrated that repeated albumin
administration, as the sole therapy, prevented bilirubin accumulation in the brain
tissue, resulting in the absence of brain abnormalities and the complete rescue of
the lethal phenotype. HSA could be a valid therapeutic alternative to the
unresponsive and acute cases of hyperbilirubinemia, to avoid or delay ET.

158
BIBLIOGRAPHY
Abraham, J., Fox, P.D., Condello, C., Bartolini, A., and Koh, S. (2012). Minocycline attenuates microglia activation and blocks the long-term epileptogenic effects of early-life seizures. Neurobiol. Dis. 46, 425–430.
Ahlfors, C.E. (1994). Criteria for exchange transfusion in jaundiced newborns. Pediatrics 93, 488–494.
Ahlfors, C.E. (2000). Unbound bilirubin associated with kernicterus: a historical approach. J. Pediatr. 137, 540–544.
Ahlfors, C.E., and Parker, A.E. (2008). Unbound bilirubin concentration is associated with abnormal automated auditory brainstem response for jaundiced newborns. Pediatrics 121, 976–978.
Ahlfors, C.E., Marshall, G.D., Wolcott, D.K., Olson, D.C., and Van Overmeire, B. (2006). Measurement of unbound bilirubin by the peroxidase test using Zone Fluidics. Clin. Chim. Acta. 365, 78–85.
American Academy of Pediatrics (2004). Managment of Hyperbilirubinemia in the newborns infant 35 or more weeks of gestation. Pediatrics 114, 297–316.
Amin, S.B., Ahlfors, C., Orlando, M.S., Dalzell, L.E., Merle, K.S., and Guillet, R. (2001). Bilirubin and serial auditory brainstem responses in premature infants. Pediatrics 107, 664–670.
Andersen, J.T., Daba, M.B., Berntzen, G., Michaelsen, T.E., and Sandlie, I. (2010). Cross-species binding analyses of mouse and human neonatal Fc receptor show dramatic differences in immunoglobulin G and albumin binding. J. Biol. Chem. 285, 4826–4836.
Ardakani, S.B., Dana, V.G., Ziaee, V., Ashtiani, M.-T.H., Djavid, G.E., and Alijani, M. (2011). Bilirubin/Albumin Ratio for Predicting Acute Bilirubin-induced Neurologic Dysfunction. Iran. J. Pediatr. 21, 28–32.
Argikar, U.A., Senekeo-Effenberger, K., Larson, E.E., Tukey, R.H., and Remmel, R.P. (2009). Studies on induction of lamotrigine metabolism in transgenic UGT1 mice. Xenobiotica. 39, 826–835.
Arias, I.M. (1962). Chronic unconjugated hyperbilirubinemia without overt signs of hemolysis in adolescents and adults. J. Clin. Invest. 41, 2233–2245.
Arias, I.M., Gartner, L.M., Seifter, S., and Furman, M. (1964). Prolonged Neonatal Unconjugated Hyperbilirubinemia Associated with Breast Feeding and a Steroid, Pregnane-3 (Alpha), 20 (Beta)-Diol, in Maternal Milk That Inhibits Glucuronide Formation In Vitro*. J. Clin. Invest. 43, 2037–2047.
B’Chir, W., Maurin, A.C., Carraro, V., Averous, J., Jousse, C., Muranishi, Y., Parry, L., Stepien, G., Fafournoux, P., and Bruhat, A. (2013). The eIF2α/ATF4 pathway is essential for stress-induced autophagy gene expression. Nucleic Acids Res. 41, 7683–7699.
Barateiro, A., Vaz, A.R., Silva, S.L., Fernandes, A., and Brites, D. (2012). ER
159
stress, mitochondrial dysfunction and calpain/jnk activation are involved in oligodendrocyte precursor cell death by unconjugated bilirubin. NeuroMolecular Med. 14, 285–302.
Barateiro, A., Miron, V.E., Santos, S.D., Relvas, J.B., Fernandes, A., Ffrench-Constant, C., and Brites, D. (2013). Unconjugated bilirubin restricts oligodendrocyte differentiation and axonal myelination. Mol. Neurobiol. 47, 632–644.
Barateiro, A., Chen, S., Yueh, M.-F., Fernandes, A., Domingues, H.S., Relvas, J., Barbier, O., Nguyen, N., Tukey, R.H., and Brites, D. (2016). Reduced Myelination and Increased Glia Reactivity Resulting from Severe Neonatal Hyperbilirubinemia. Mol. Pharmacol. 89, 84–93.
Bhutani, V.K., and Wong, R.J. (2013). Bilirubin neurotoxicity in preterm infants: risk and prevention. J. Clin. Neonatol. 2, 61–69.
Bhutani, V.K., Zipursky, A., Blencowe, H., Khanna, R., Sgro, M., Ebbesen, F., Bell, J., Mori, R., Slusher, T.M., Fahmy, N., et al. (2013). Neonatal hyperbilirubinemia and Rhesus disease of the newborn: incidence and impairment estimates for 2010 at regional and global levels. Pediatr. Res. 74 Suppl 1, 86–100.
Biran, V., Verney, C., and Ferriero, D.M. (2012). Perinatal cerebellar injury in human and animal models. Neurol. Res. Int. 2012, 858929.
Birben, E., Sahiner, U.M., Sackesen, C., Erzurum, S., and Kalayci, O. (2012). Oxidative stress and antioxidant defense. World Allergy Organ. J. 5, 9–19.
Bortolussi, G., Zentilin, L., Baj, G., Giraudi, P., Bellarosa, C., Giacca, M., Tiribelli, C., and Muro, A.F. (2012). Rescue of bilirubin-induced neonatal lethality in a mouse model of Crigler-Najjar syndrome type I by AAV9-mediated gene transfer. FASEB J. 26, 1052–1063.
Bortolussi, G., Baj, G., Vodret, S., Viviani, G., Bittolo, T., and Muro, A.F. (2014). Age-dependent pattern of cerebellar susceptibility to bilirubin neurotoxicity in vivo. Dis. Model. Mech. 1057–1068.
Bortolussi, G., Codarin, E., Antoniali, G., Vascotto, C., Vodret, S., Arena, S., Cesaratto, L., Scaloni, A., Tell, G., and Muro, a F. (2015). Impairment of enzymatic antioxidant defenses is associated with bilirubin-induced neuronal cell death in the cerebellum of Ugt1 KO mice. Cell Death Dis. 6, e1739.
Bosma, P.J. (2003). Inherited disorders of bilirubin metabolism. J. Hepatol. 38, 107–117.
Bosma, P.J., Seppen, J., Goldhoorn, B., Bakker, C., Oude Elferink, R.P., Chowdhury, J.R., Chowdhury, N.R., and Jansen, P.L. (1994). Bilirubin UDP-glucuronosyltransferase 1 is the only relevant bilirubin glucuronidating isoform in man. J. Biol. Chem. 269, 17960–17964.
Bossaller, L., Chiang, P.-I., Schmidt-Lauber, C., Ganesan, S., Kaiser, W.J., Rathinam, V. a K., Mocarski, E.S., Subramanian, D., Green, D.R., Silverman, N., et al. (2012). Cutting edge: FAS (CD95) mediates noncanonical IL-1β and IL-18 maturation via caspase-8 in an RIP3-independent manner. J. Immunol. 189,
160
5508–5512.
Bradford, M.M. (1976). A rapid and sensitive method for the quantitation of microgram quantities of protein utilizing the principle of protein-dye binding. Anal. Biochem. 72, 248–254.
Brettschneider, J., Tredici, K. Del, Lee, V.M.-Y.Y., and Trojanowski, J.Q. (2015). Spreading of pathology in neurodegenerative diseases: a focus on human studies. Nat. Rev. Neurosci. 16, 109–120.
Brites, D. (2011). Bilirubin Injury to Neurons and Glial Cells : New Players , Novel Targets , and Newer Insights. YSPER 35, 114–120.
Brites, D. (2012). The evolving landscape of neurotoxicity by unconjugated bilirubin : role of glial cells and inflammation. Front. Pharmacol. 3, 1–27.
Brito, M.A., Brites, D., and Butterfield, D.A. (2004). A link between hyperbilirubinemia, oxidative stress and injury to neocortical synaptosomes. Brain Res. 1026, 33–43.
Brito, M.A., Rosa, A.I., Falc??o, A.S., Fernandes, A., Silva, R.F.M., Butterfield, D.A., and Brites, D. (2008a). Unconjugated bilirubin differentially affects the redox status of neuronal and astroglial cells. Neurobiol. Dis. 29, 30–40.
Brito, M. a, Lima, S., Fernandes, A., Falcão, A.S., Silva, R.F.M., Butterfield, D.A., and Brites, D. (2008b). Bilirubin injury to neurons: contribution of oxidative stress and rescue by glycoursodeoxycholic acid. Neurotoxicology 29, 259–269.
Brito, M. a, Vaz, A.R., Silva, S.L., Falcão, A.S., Fernandes, A., Silva, R.F.M., and Brites, D. (2010). N-methyl-aspartate receptor and neuronal nitric oxide synthase activation mediate bilirubin-induced neurotoxicity. Mol. Med. 16, 372–380.
Buckley, D.B., and Klaassen, C.D. (2007). Tissue- and Gender-Specific mRNA Expression of UDP-Glucornosyltransferases (UGTs) in Mice. Drug Metab. Dispos. 35, 121–127.
Buller, K.M., Carty, M.L., Reinebrant, H.E., and Wixey, J.A. (2008). Minocycline : A Neuroprotective Agent for Hypoxic-Ischemic Brain Injury in the Neonate ? J. Neurosci. Res. 608, 599–608.
Burke, N.N., Kerr, D.M., Moriarty, O., Finn, D.P., and Roche, M. (2014). Minocycline modulates neuropathic pain behaviour and cortical M1-M2 microglial gene expression in a rat model of depression. Brain. Behav. Immun. 42, 147–156.
Cai, Z., Zhao, Y., Yao, S., and Zhao, B. (2011). Increases in B-amyloid protein in the hippocampus caused by diabetic metabolic disorder are blocked by minocycline through inhibition of NF-kB pathway activation. Pharmacol. Reports 63, 381–391.
Calligaris, R., Bellarosa, C., Foti, R., Roncaglia, P., Giraudi, P., Krmac, H., Tiribelli, C., and Gustincich, S. (2009). A transcriptome analysis identifies molecular effectors of unconjugated bilirubin in human neuroblastoma SH-SY5Y cells. BMC Genomics 10, 543.
Cardoso, F.L., Kittel, A., Veszelka, S., Palmela, I., Toth, A., Brites, D., Deli, M.A.,
161
and Brito, M.A. (2012). Exposure to lipopolysaccharide and/or unconjugated bilirubin impair the integrity and function of brain microvascular endothelial cells. PLoS One 7, 1–14.
Chan, G., and Schiff, D. (1976). Variance in albumin loading in exchange transfusions. J. Pediatr. 88, 609–613.
Chaudhari, N., Talwar, P., Parimisetty, A., Lefebvre d’Hellencourt, C., and Ravanan, P. (2014). A molecular web: endoplasmic reticulum stress, inflammation, and oxidative stress. Front. Cell. Neurosci. 8, 213.
Chaudhury, C., Mehnaz, S., Robinson, J.M., Hayton, W.L., Pearl, D.K., Roopenian, D.C., and Anderson, C.L. (2003). The major histocompatibility complex-related Fc receptor for IgG (FcRn) binds albumin and prolongs its lifespan. J. Exp. Med. 197, 315–322.
Chauhan, A.K., Moretti, F.A., Iaconcig, A., Baralle, F.E., and Muro, A.F. (2005). Impaired motor coordination in mice lacking the EDA exon of the fibronectin gene. Behav. Brain Res. 161, 31–38.
Chen, M., Ona, V.O., Li, M., Ferrante, R.J., Fink, K.B., Zhu, S., Bian, J., Guo, L., Farrell, L.A., Hersch, S.M., et al. (2000). Minocycline inhibits caspase-1 and caspase-3 expression and delays mortality in a transgenic mouse model of Huntington disease. Nat. Med. 6, 797–801.
Chen, S., Yueh, M.-F., Bigo, C., Barbier, O., Wang, K., Karin, M., Nguyen, N., and Tukey, R.H. (2013). Intestinal glucuronidation protects against chemotherapy-induced toxicity by irinotecan (CPT-11). Proc. Natl. Acad. Sci. U. S. A. 110, 19143–19148.
Cheng, S., Hou, J., Zhang, C., Xu, C., Wang, L., Zou, X., Yu, H., Shi, Y., Yin, Z., and Chen, G. (2015). Minocycline reduces neuroinflammation but does not ameliorate neuron loss in a mouse model of neurodegeneration. Sci. Rep. 5, 10535.
Cho, H.-Y., Jedlicka, A.E., Reddy, S.P.M., Kensler, T.W., Yamamoto, M., Zhang, L.-Y., and Kleeberger, S.R. (2002). Role of NRF2 in protection against hyperoxic lung injury in mice. Am. J. Respir. Cell Mol. Biol. 26, 175–182.
Chowdhury, J.R., Kondapalli, R., and Chowdhury, N.R. (1993). Gunn rat: a model for inherited deficiency of bilirubin glucuronidation. Adv. Vet. Sci. Comp. Med. 37, 149–173.
Conlee, J.W., and Shapiro, S.M. (1997). Development of cerebellar hypoplasia in jaundiced Gunn rats: a quantitative light microscopic analysis. Acta Neuropathol. 93, 450–460.
Connolly, A.M., and Volpe, J.J. (1990). Clinical features of bilirubin encephalopathy. Clin. Perinatol. 17, 371–379.
Coughtrie, M.W., Burchell, B., Leakey, J.E., and Hume, R. (1988). The inadequacy of perinatal glucuronidation: immunoblot analysis of the developmental expression of individual UDP-glucuronosyltransferase isoenzymes in rat and human liver microsomes. Mol. Pharmacol. 34, 729–735.

162
Crigler, J.F., and Najjar, V.A. (1952). Congenital familial nonhemolytic jaundice with kernicterus. Pediatrics 10, 169–180.
Cuperus, F.J.C., Hafkamp, A.M., Havinga, R., Vitek, L., Zelenka, J., Tiribelli, C., Ostrow, J.D., and Verkade, H.J. (2009). Effective treatment of unconjugated hyperbilirubinemia with oral bile salts in Gunn rats. Gastroenterology 136, 673–82.e1.
Cuperus, F.J.C., Schreuder, A.B., Imhoff, D.E. Van, Vitek, L., Vanikova, J., Konickova, R., Ahlfors, C.E., Hulzebos, C. V, and Verkade, H.J. (2013). Beyond plasma bilirubin : The effects of phototherapy and albumin on brain bilirubin levels in Gunn rats. J. Hepatol. 58, 134–140.
Cutando, L., Busquets-Garcia, A., Puighermanal, E., Gomis-Gonz??lez, M., Delgado-Garc??a, J.M., Gruart, A., Maldonado, R., and Ozaita, A. (2013). Microglial activation underlies cerebellar deficits produced by repeated cannabis exposure. J. Clin. Invest. 123, 2816–2831.
Daood, M.J., Hoyson, M., and Watchko, J.F. (2012). Lipid peroxidation is not the primary mechanism of bilirubin-induced neurologic dysfunction in jaundiced Gunn rat pups. Pediatr. Res. 72, 455–459.
Davutoǧlu, M., Garipardiç, M., Güler, E., Karabiber, H., and Erhan, D. (2010). The etiology of severe neonatal hyperbilirubinemia and complications of exchange transfusion. Turk. J. Pediatr. 52, 163–166.
Dennery, P.A., Seidman, D.S., and Stevenson, D.K. (2001). Neonatal hyperbilirubinemia. N. Engl. J. Med. 344, 581–590.
Domitrovi, R., Jakovac, H., Tomac, J., and Ivana, Š. (2009). Liver fi brosis in mice induced by carbon tetrachloride and its reversion by luteolin. 241, 311–321.
Doyle, K.M., Kennedy, D., Gorman, A.M., Gupta, S., Healy, S.J.M., and Samali, A. (2011). Unfolded proteins and endoplasmic reticulum stress in neurodegenerative disorders. J. Cell. Mol. Med. 15, 2025–2039.
Edan, R.A., Luqmani, Y. a, and Masocha, W. (2013). COL-3, a Chemically Modified Tetracycline, Inhibits Lipopolysaccharide-Induced Microglia Activation and Cytokine Expression in the Brain. PLoS One 8, e57827.
Ekshyyan, O., and Aw, T.Y. (2004). Apoptosis: a key in neurodegenerative disorders. Curr. Neurovasc. Res. 1, 355–371.
Erlinger, S., Arias, I.M., and Dhumeaux, D. (2014). Inherited disorders of bilirubin transport and conjugation: new insights into molecular mechanisms and consequences. Gastroenterology 146, 1625–1638.
Escobar, G.J., Greene, J.D., Hulac, P., Kincannon, E., Bischoff, K., Gardner, M.N., Armstrong, M. a, and France, E.K. (2005). Rehospitalisation after birth hospitalisation: patterns among infants of all gestations. Arch. Dis. Child. 90, 125–131.
Fagan, S.C., Edwards, D.J., Borlongan, C. V., Xu, L., Arora, A., Feuerstein, G., and Hess, D.C. (2004). Optimal delivery of minocycline to the brain: Implication for
163
human studies of acute neuroprotection. Exp. Neurol. 186, 248–251.
Fagiuoli, S., Daina, E., D’Antiga, L., Colledan, M., and Remuzzi, G. (2013). Monogenic diseases that can be cured by liver transplantation. J. Hepatol. 59, 595–612.
Falcao, A.S., Silva, R.F.M., Fernandes, A., Brito, M.A., and Brites, D. (2007). Influence of hypoxia and ischemia preconditioning on bilirubin damage to astrocytes. Brain Res. 1149, 191–199.
Falcao, A.S., Silva, R.F.M., Vaz, A.R., Silva, S.L., Fernandes, A., and Brites, D. (2013). Cross-talk between neurons and astrocytes in response to bilirubin: Early beneficial effects. Neurochem. Res. 38, 644–659.
Falcao, A.S., Silva, R.F.M., Vaz, A.R., Gomes, C., Fernandes, A., Barateiro, A., Tiribelli, C., and Brites, D. (2014). Cross-talk between neurons and astrocytes in response to bilirubin: Adverse secondary impacts. Neurotox. Res. 26, 1–15.
Falcão, A.S., Silva, R.F.M., Pancadas, S., Fernandes, A., Brito, M. a, and Brites, D. (2007). Apoptosis and impairment of neurite network by short exposure of immature rat cortical neurons to unconjugated bilirubin increase with cell differentiation and are additionally enhanced by an inflammatory stimulus. J. Neurosci. Res. 85, 1229–1239.
Falcão, A.S., Silva, R.F.M., Vaz, A.R., Gomes, C., Fernandes, A., Barateiro, A., Tiribelli, C., and Brites, D. (2014). Cross-talk between neurons and astrocytes in response to bilirubin: adverse secondary impacts. Neurotox. Res. 26, 1–15.
Fan, L.-W., Pang, Y., Lin, S., Rhodes, P.G., and Cai, Z. (2005). Minocycline attenuates lipopolysaccharide-induced white matter injury in the neonatal rat brain. Neuroscience 133, 159–168.
Fanali, G., Trezza, V., Marino, M., Fasano, M., and Ascenzi, P. (2012). Human serum albumin : From bench to bedside. Mol. Aspects Med. 33, 209–290.
Federico, A., Cardaioli, E., Da Pozzo, P., Formichi, P., Gallus, G.N., and Radi, E. (2012). Mitochondria, oxidative stress and neurodegeneration. J. Neurol. Sci. 322, 254–262.
Felderhoff-Mueser, U., Schmidt, O.I., Oberholzer, A., Bührer, C., and Stahel, P.F. (2005). IL-18: A key player in neuroinflammation and neurodegeneration? Trends Neurosci. 28, 487–493.
Fernandes, A., and Brites, D. (2009). Contribution of inflammatory processes to nerve cell toxicity by bilirubin and efficacy of potential therapeutic agents. Curr. Pharm. Des. 15, 2915–2926.
Fernandes, A., Silva, R.F.M., Falcao, A.S., Brito, M.A., and Brites, D. (2004). Cytokine production, glutamate release and cell death in rat cultured astrocytes treated with unconjugated bilirubin and LPS. J. Neuroimmunol. 153, 64–75.
Fernandes, A., Falcao, A.S., Silva, R.F.M., Gordo, A.C., Gama, M.J., Brito, M.A., and Brites, D. (2006). Inflammatory signalling pathways involved in astroglial activation by unconjugated bilirubin. J. Neurochem. 96, 1667–1679.
164
Fernandes, A., Falcao, A.S., Silva, R.F.M., Brito, M.A., and Brites, D. (2007a). MAPKs are key players in mediating cytokine release and cell death induced by unconjugated bilirubin in cultured rat cortical astrocytes. Eur. J. Neurosci. 25, 1058–1068.
Fernandes, A., Falcão, A.S., Silva, R.F.M., Brito, M. a., and Brites, D. (2007b). MAPKs are key players in mediating cytokine release and cell death induced by unconjugated bilirubin in cultured rat cortical astrocytes. Eur. J. Neurosci. 25, 1058–1068.
Fernandes, A., Falc??o, A.S., Abranches, E., Bekman, E., Henrique, D., Lanier, L.M., and Brites, D. (2009). Bilirubin as a determinant for altered neurogenesis, neuritogenesis, and synaptogenesis. Dev. Neurobiol. 69, 568–582.
Fernandes, A., Barateiro, A., Sofia, A.N.A., Ao, F., Silva, S.L., Vaz, A.N.A.R., Brito, M.A., Fernando, R.U.I., Silva, M., and Brites, D. (2011). Astrocyte Reactivity to Unconjugated Bilirubin Requires TNF- a and IL-1 b Receptor Signaling Pathways. 25, 14–25.
Fine, E.J., Ionita, C.C., and Lohr, L. (2002). The history of the development of the cerebellar examination. Semin. Neurol. 22, 375–384.
Fischer, R., and Maier, O. (2015). Interrelation of Oxidative Stress and Inflammation in Neurodegenerative Disease : Role of TNF. Oxid. Med. Cell. Longev. 1–18.
Fisher, M.B., Paine, M.F., Strelevitz, T.J., and Wrighton, S.A. (2001). The role of hepatic and extrahepatic UDP-glucuronosyltransferases in human drug metabolism. Drug Metab. Rev. 33, 273–297.
Fonnum, F., and Lock, E. a (2000). Cerebellum as a target for toxic substances. Toxicol. Lett. 112–113, 9–16.
Fox, C., Dingman, A., Derugin, N., Wendland, M.F., Manabat, C., Ji, S., Ferriero, D.M., and Vexler, Z.S. (2005). Minocycline confers early but transient protection in the immature brain following focal cerebral ischemia-reperfusion. J. Cereb. Blood Flow Metab. 25, 1138–1149.
Frank-Cannon, T.C., Alto, L.T., McAlpine, F.E., and Tansey, M.G. (2009). Does neuroinflammation fan the flame in neurodegenerative diseases? Mol. Neurodegener. 4, 47.
Fujiwara, R., Nguyen, N., Chen, S., and Tukey, R.H. (2010). Developmental hyperbilirubinemia and CNS toxicity in mice humanized with the UDP glucuronosyltransferase 1 (UGT1) locus. Proc. Natl. Acad. Sci. U. S. A. 107, 5024–5029.
Fujiwara, R., Chen, S., Karin, M., and Tukey, R.H. (2012). Reduced Expression of UGT1A1 in Intestines of Humanized UGT1 Mice via Inactivation of NF-κB Leads to Hyperbilirubinemia. Gastroenterology 1, 109–118.
Gamal, M., Abdel Wahab, Z., Eshra, M., Rashed, L., and Sharawy, N. (2014). Comparative neuroprotective effects of dexamethasone and minocycline during hepatic encephalopathy. Neurol. Res. Int. 2014.
165
Gamaleldin, R., Iskander, I., Seoud, I., Aboraya, H., Aravkin, A., Sampson, P.D., and Wennberg, R.P. (2011). Risk factors for neurotoxicity in newborns with severe neonatal hyperbilirubinemia. Pediatrics 128, e925-31.
Gao, X., Yang, X., and Zhang, B. (2011). Neuroprotection of taurine against bilirubin-induced elevation of apoptosis and intracellular free calcium ion in vivo. Toxicol. Mech. Methods 21, 383–387.
Geiger, A.S., Rice, A.C., and Shapiro, S.M. (2007). Minocycline blocks acute bilirubin-induced neurological dysfunction in jaundiced Gunn rats. Neonatology 92, 219–226.
Giraudi, P.J., Bellarosa, C., Coda-Zabetta, C.D., Peruzzo, P., and Tiribelli, C. (2011). Functional induction of the cystine-glutamate exchanger system X c- activity in SH-SY5Y cells by unconjugated bilirubin. PLoS One 6.
Giudice, A., Arra, C., and Turco, M.C. (2010). Review of molecular mechanisms involved in the activation of the Nrf2-ARE signaling pathway by chemopreventive agents. Methods Mol. Biol. 647, 37–74.
Gong, Q.H., Cho, J.W., Huang, T., Potter, C., Gholami, N., Basu, N.K., Kubota, S., Carvalho, S., Pennington, M.W., Owens, I.S., et al. (2001). Thirteen UDPglucuronosyltransferase genes are encoded at the human UGT1 gene complex locus. Pharmacogenetics 11, 357–368.
Gordo, A.C., Falca, A.S., Fernandes, A., Brito, M.A., Silva, R.F.M., and Brites, D. (2006). Unconjugated Bilirubin Activates and Damages Microglia. 201, 194–201.
Greco, C., Arnolda, G., Boo, N.-Y., Iskander, I.F., Okolo, A.A., Rohsiswatmo, R., Shapiro, S.M., Watchko, J., Wennberg, R.P., Tiribelli, C., et al. (2016). Neonatal Jaundice in Low- and Middle-Income Countries: Lessons and Future Directions from the 2015 Don Ostrow Trieste Yellow Retreat. Neonatology 172–180.
Greissman, A., Silver, P., Nimkoff, L., and Sagy, M. (1996). Albumin bolus administration versus continuous infusion in critically ill hypoalbuminemic pediatric patients. Intensive Care Med. 22, 495–499.
Grieco, J.C., Ciarlone, S.L., Gieron-Korthals, M., Schoenberg, M.R., Smith, A.G., Philpot, R.M., Heussler, H.S., Banko, J.L., and Weeber, E.J. (2014). An open-label pilot trial of minocycline in children as a treatment for Angelman syndrome. BMC Neurol. 14, 232.
Grojean, S., Lievre, V., Koziel, V., Vert, P., and Daval, J.L. (2001). Bilirubin exerts additional toxic effects in hypoxic cultured neurons from the developing rat brain by the recruitment of glutamate neurotoxicity. Pediatr. Res. 49, 507–513.
Gunn, C.H. (1938). Hereditary acholuric jaundice in a New Mutant Strain of Rats. J. Hered. 137–139.
Hafkamp, A.M., Havinga, R., Sinaasappel, M., and Verkade, H.J. (2005). Effective oral treatment of unconjugated hyperbilirubinemia in Gunn rats. Hepatology 41, 526–534.
Hafkamp, A.M., Nelisse-Haak, R., Sinaasappel, M., Oude Elferink, R.P.J., and
166
Verkade, H.J. (2007). Orlistat treatment of unconjugated hyperbilirubinemia in Crigler-Najjar disease: a randomized controlled trial. Pediatr. Res. 62, 725–730.
Harvey, B.K., Richie, C.T., Hoffer, B.J., and Airavaara, M. (2012). Transgenic animal models of neurodegeneration based on human genetic studies. J. Neural Transm. 118, 27–45.
Haustein, M.D., Read, D.J., Steinert, J.R., Pilati, N., Dinsdale, D., and Forsythe, I.D. (2010). Acute hyperbilirubinaemia induces presynaptic neurodegeneration at a central glutamatergic synapse. J. Physiol. 588, 4683–4693.
Henry, C.J., Huang, Y., Wynne, A., Hanke, M., Himler, J., Bailey, M.T., Sheridan, J.F., and Godbout, J.P. (2008). Minocycline attenuates lipopolysaccharide (LPS)-induced neuroinflammation, sickness behavior, and anhedonia. J. Neuroinflammation 5, 15.
Hinwood, M., Morandini, J., Day, T.A., and Walker, F.R. (2012). Evidence that microglia mediate the neurobiological effects of chronic psychological stress on the medial prefrontal cortex. Cereb. Cortex 22, 1442–1454.
Hosono, S., Ohno, T., Kimoto, H., Nagoshi, R.E.N., Neonatology, D., and Children, S. (2001a). Effects of albumin infusion therapy on total and unbound bilirubin values in term infants with intensive phototherapy. 8–11.
Hosono, S., Ohno, T., Kimoto, H., Nagoshi, R., Shimizu, M., and Nozawa, M. (2001b). Effects of albumin infusion therapy on total and unbound bilirubin values in term infants with intensive phototherapy. Pediatr. Int. 43, 8–11.
Hosono, S., Ohno, T., Kimoto, H., Nagoshi, R., Shimizu, M., Nozawa, M., and Harada, K. (2002). Follow-up study of auditory brainstem responses in infants with high unbound bilirubin levels treated with albumin infusion therapy. Pediatr. Int. 44, 488–492.
Hsieh, C.L., Kim, C.C., Ryba, B.E., Niemi, E.C., Bando, J.K., Locksley, R.M., Liu, J., Nakamura, M.C., and Seaman, W.E. (2013). Traumatic brain injury induces macrophage subsets in the brain. Eur. J. Immunol. 43, 2010–2022.
Hsieh, Y.-C., Athar, M., and Chaudry, I.H. (2009). When apoptosis meets autophagy: deciding cell fate after trauma and sepsis. Trends Mol. Med. 15, 129–138.
Hu, F., Ku, M.C., Markovic, D., Dzaye, O.D., Lehnardt, S., Synowitz, M., Wolf, S.A., and Kettenmann, H. (2014). Glioma-associated microglial MMP9 expression is upregulated by TLR2 signaling and sensitive to minocycline. Int. J. Cancer 135, 2569–2578.
Huang, C.L., Lee, Y.C., Yang, Y.C., Kuo, T.Y., and Huang, N.K. (2012). Minocycline prevents paraquat-induced cell death through attenuating endoplasmic reticulum stress and mitochondrial dysfunction. Toxicol. Lett. 209, 203–210.
Huang, T.-Y., Chu, H.-C., Lin, Y.-L., Lin, C.-K., Hsieh, T.-Y., Chang, W.-K., Chao, Y.-C., and Liao, C.-L. (2009). Minocycline attenuates experimental colitis in mice by blocking expression of inducible nitric oxide synthase and matrix
167
metalloproteinases. Toxicol. Appl. Pharmacol. 237, 69–82.
Huizing, K.M.N., Røislien, J., and Hansen, T.W.R. (2008). Intravenous immune globulin reduces the need for exchange transfusions in Rhesus and AB0 incompatibility. Acta Paediatr. Int. J. Paediatr. 97, 1362–1365.
Hulzebos, C. V, Dijk, P.H., Imhoff, D.E. Van, Bos, A.F., Lopriore, E., Offringa, M., Ruiter, S.A.J., Braeckel, K.N.J.A. Van, Krabbe, P.F.M., Quik, E.H., et al. (2014). The Bilirubin Albumin Ratio in the Management of Hyperbilirubinemia in Preterm Infants to Improve Neurodevelopmental Outcome : A Randomized Controlled Trial – BARTrial. 9, 1–7.
Ibekwe, R.C., Ibekwe, M.U., and Muoneke, V.U. (2012). Outcome of exchange blood transfusions done for neonatal jaundice in abakaliki, South eastern Nigeria. J. Clin. Neonatol. 1, 34–37.
Ito, D., Imai, Y., Ohsawa, K., Nakajima, K., Fukuuchi, Y., and Kohsaka, S. (1998). Microglia-specific localisation of a novel calcium binding protein, Iba1. Mol. Brain Res. 57, 1–9.
Iyanagi, T., Watanabe, T., and Uchiyama, Y. (1989). The 3-methylcholanthrene-inducible UDP-glucuronosyltransferase deficiency in the hyperbilirubinemic rat (Gunn rat) is caused by a -1 frameshift mutation. J. Biol. Chem. 264, 21302–21307.
Jangi, S., Otterbein, L., and Robson, S. (2013). The molecular basis for the immunomodulatory activities of unconjugated bilirubin. Int. J. Biochem. Cell Biol. 45, 2843–2851.
Jansen, P.L. (1999). Diagnosis and management of Crigler-Najjar syndrome. Eur. J. Pediatr. 158 Suppl, S89-94.
Johnson, L., Sarmiento, F., Blanc, W.A., and Day, R. (1959). Kernicterus in rats with an inherited deficiency of glucuronyl transferase. AMA. J. Dis. Child. 97, 591–608.
Kaplan, M., and Hammerman, C. (2005). Understanding severe hyperbilirubinemia and preventing kernicterus: adjuncts in the interpretation of neonatal serum bilirubin. Clin. Chim. Acta. 356, 9–21.
Keino, H., and Kashiwamata, S. (1989). Critical period of bilirubin-induced cerebellar hypoplasia in a new Sprague-Dawley strain of jaundiced Gunn rats. Neurosci. Res. 6, 209–215.
Keller, A.F., Gravel, M., and Kriz, J. (2011). Treatment with minocycline after disease onset alters astrocyte reactivity and increases microgliosis in SOD1 mutant mice. Exp. Neurol. 228, 69–79.
Keshavan, P., Schwemberger, S.J., Smith, D.L.H., Babcock, G.F., and Zucker, S.D. (2004). Unconjugated bilirubin induces apoptosis in colon cancer cells by triggering mitochondrial depolarization. Int. J. Cancer 112, 433–445.
Keshavan, P., Deem, T.L., Schwemberger, S.J., Babcock, G.F., Cook-Mills, J.M., and Zucker, S.D. (2005). Unconjugated Bilirubin Inhibits VCAM-1-Mediated
168
Transendothelial Leukocyte Migration. J. Immunol. 174, 3709–3718.
Kestel, J.L. (1981). Photo-onycholysis from minocycline. Side effects of minocycline therapy. Cutis 28, 53–54.
Kholmukhamedov, A., Czerny, C., Hu, J., Schwartz, J., Zhong, Z., and Lemasters, J.J. (2014). Minocycline and doxycycline, but not tetracycline, mitigate liver and kidney injury after hemorrhagic shock/resuscitation. Shock 42, 256–263.
Kigerl, K.A., Gensel, J.C., Ankeny, D.P., Alexander, J.K., Donnelly, D.J., and Popovich, P.G. (2009). Identification of two distinct macrophage subsets with divergent effects causing either neurotoxicity or regeneration in the injured mouse spinal cord. J. Neurosci. 29, 13435–13444.
Kim, H.-S., and Suh, Y.-H. (2009). Minocycline and neurodegenerative diseases. Behav. Brain Res. 196, 168–179.
Kim, K.H., Jeong, J.Y., Surh, Y.J., and Kim, K.W. (2009). Expression of stress-response ATF3 is mediated by Nrf2 in astrocytes. Nucleic Acids Res. 38, 48–59.
Klionsky, D.J., Abeliovich, H., Agostinis, P., Agrawal, D.K., Aliev, G., Askew, D.S., Baba, M., Baehrecke, E.H., Bahr, B.A., Ballabio, A., et al. (2009). Guidelines for the use and interpretation of assays for monitoring autophagy in higher eukaryotes. 4, 151–175.
Kobayashi, K., Imagama, S., Ohgomori, T., Hirano, K., Uchimura, K., Sakamoto, K., Hirakawa, A., Takeuchi, H., Suzumura, A., Ishiguro, N., et al. (2013). Minocycline selectively inhibits M1 polarization of microglia. Cell Death Dis. 4, e525.
Kuang, X., Scofield, V.L., Yan, M., Stoica, G., Liu, N., and Wong, P.K.Y. (2009). Attenuation of oxidative stress, inflammation and apoptosis by minocycline prevents retrovirus-induced neurodegeneration in mice. Brain Res. 1286, 174–184.
Kuma, A., Hatano, M., Matsui, M., Yamamoto, A., Nakaya, H., Yoshimori, T., Ohsumi, Y., Tokuhisa, T., and Mizushima, N. (2004). The role of autophagy during the early neonatal starvation period. Nature 432, 1032–1036.
Kumar, V., Singh, B.K., Chauhan, A.K., Singh, D., Patel, D.K., and Singh, C. (2015). Minocycline Rescues from Zinc-Induced Nigrostriatal Dopaminergic Neurodegeneration: Biochemical and Molecular Interventions. Mol. Neurobiol. 53, 2761–2777.
Kyuhou, S., Kato, N., and Gemba, H. (2006). Emergence of endoplasmic reticulum stress and activated microglia in Purkinje cell degeneration mice. Neurosci. Lett. 396, 91–96.
Lauer, B.J., and Spector, N.D. (2011). Hyperbilirubinemia in the newborn. Pediatr. Rev. 32, 341–349.
Lertvorachon, J., Kim, J.P., Soldatov, D. V., Boyd, J., Roman, G., Sung, J.C., Popek, T., Jung, Y.S., Lau, P.C.K., and Konishi, Y. (2005). 1,12-Substituted tetracyclines as antioxidant agents. Bioorganic Med. Chem. 13, 4627–4637.

169
Levine, B., and Yuan, J. (2005). Autophagy in cell death: an innocent convict? J. Clin. Invest. 115, 2679–2688.
Li, Y., Guo, Y., Tang, J., Jiang, J., and Chen, Z. (2014). New insights into the roles of CHOP-induced apoptosis in ER stress Structure and Properties of C / EBP Homologous Protein Roles of CHOP in ER Stress-Mediated Apoptosis. 46, 629–640.
Liaury, K., Miyaoka, T., Tsumori, T., Furuya, M., Wake, R., Ieda, M., Tsuchie, K., Taki, M., Ishihara, K., Tanra, A.J., et al. (2012). Morphological features of microglial cells in the hippocampal dentate gyrus of Gunn rat: a possible schizophrenia animal model. J. Neuroinflammation 9, 56.
Liaury, K., Miyaoka, T., Tsumori, T., Furuya, M., Hashioka, S., Wake, R., Tsuchie, K., Fukushima, M., Limoa, E., Tanra, A.J., et al. (2014). Minocycline improves recognition memory and attenuates microglial activation in Gunn rat: A possible hyperbilirubinemia-induced animal model of schizophrenia. Prog. Neuro-Psychopharmacology Biol. Psychiatry 50, 184–190.
Lin, S., Zhang, Y., Dodel, R., Farlow, M.R., Paul, S.M., and Du, Y. (2001). Minocycline blocks nitric oxide-induced neurotoxicity by inhibition p38 MAP kinase in rat cerebellar granule neurons. Neurosci. Lett. 315, 61–64.
Lin, S., Yan, C., Wei, X., Paul, S.M., and Du, Y. (2003). p38 MAP kinase mediates bilirubin-induced neuronal death of cultured rat cerebellar granule neurons. Neurosci. Lett. 353, 209–212.
Lin, S., Wei, X., Bales, K.R., Paul, A.B.C., Ma, Z., Yan, G., Paul, S.M., and Du, Y. (2005). Minocycline blocks bilirubin neurotoxicity and prevents hyperbilirubinemia-induced cerebellar hypoplasia in the Gunn rat. Eur. J. Neurosci. 22, 21–27.
Liu, G., Su, L., Hao, X., Zhong, N., Zhong, D., Singhal, S., and Liu, X. (2012). Salermide up-regulates death receptor 5 expression through the ATF4-ATF3-CHOP axis and leads to apoptosis in human cancer cells. J. Cell. Mol. Med. 16, 1618–1628.
Liu, X., Su, H., Chu, T.H., Guo, A., and Wu, W. (2013). Minocycline inhibited pro-apoptotic effect of microglia on neuronal progenitor cells and protected their neuronal differentiation in vitro - Liu.pdf. Neurosci. Lett. 30–36.
London, I.M.., West, R.., Shemin, D.., and Rittenberg, D. (1950). On the origin of bile pigment in normal man. J. Biol. Chem. 184, 351–358.
Mabogunje, C.A., Olaifa, S.M., and Olusanya, B.O. (2016). Facility-based constraints to exchange transfusions for neonatal hyperbilirubinemia in resource-limited settings. World J. Clin. Pediatr. 5, 182.
Macdonald, H., Kelly, R.G., Allen, E.S., Noble, J.F., and Kanegis, L.A. (1973). Pharmacokinetic studies on minocycline in man. Clin. Pharmacol. Ther. 14, 852–861.
Machado, L.S., Kozak, A., Ergul, A., Hess, D.C., Borlongan, C. V, and Fagan, S.C. (2006). Delayed minocycline inhibits ischemia-activated matrix metalloproteinases 2 and 9 after experimental stroke. BMC Neurosci. 7, 56.
170
Mackenzie, P.I., Gregory, P.A., Lewinsky, R.H., Yasmin, S.N., Height, T., McKinnon, R.A., and Gardner-Stephen, D.A. (2005). Polymorphic variations in the expression of the chemical detoxifying UDP glucuronosyltransferases. Toxicol. Appl. Pharmacol. 207, 77–83.
Maisels, M.J., and McDonagh, A.F. (2008). Phototherapy for neonatal jaundice. N. Engl. J. Med. 358, 920–928.
Maisels, M.J., Watchko, J.F., Bhutani, V.K., and Stevenson, D.K. (2012). An approach to the management of hyperbilirubinemia in the preterm infant less than 35 weeks of gestation. J. Perinatol. 32, 660–664.
Maity, S., Nag, N., Chatterjee, S., Adhikari, S., and Mazumder, S. (2013). Bilirubin clearance and antioxidant activities of ethanol extract of Phyllanthus amarus root in phenylhydrazine-induced neonatal jaundice in mice. J. Physiol. Biochem. 69, 467–476.
Martinez, F.O., Gordon, S., Locati, M., and Mantovani, A. (2006). Transcriptional Profiling of the Human Monocyte-to-Macrophage Differentiation and Polarization: New Molecules and Patterns of Gene Expression. J. Immunol. 177, 7303–7311.
Mattei, D., Djodari-Irani, A., Hadar, R., Pelz, A., de Coss??o, L.F., Goetz, T., Matyash, M., Kettenmann, H., Winter, C., and Wolf, S.A. (2014). Minocycline rescues decrease in neurogenesis, increase in microglia cytokines and deficits in sensorimotor gating in an animal model of schizophrenia. Brain. Behav. Immun. 38, 175–184.
Mazzone, G.L., Rigato, I., and Tiribelli, C. (2010). Unconjugated bilirubin modulates nitric oxide production via iNOS regulation. Biosci. Trends 4, 244–248.
McDonagh, A.F., and Maisels, M.J. (2006). Bilirubin unbound: déjà vu all over again? Pediatrics 117, 523–525.
Menalled, L.B., Patry, M., Ragland, N., Lowden, P.A.S., Goodman, J., Minnich, J., Zahasky, B., Park, L., Leeds, J., Howland, D., et al. (2010). Comprehensive behavioral testing in the R6/2 mouse model of Huntington’s disease shows no benefit from CoQ10 or minocycline. PLoS One 5.
Michell-Robinson, M.A., Touil, H., Healy, L.M., Owen, D.R., Durafourt, B.A., Bar-Or, A., Antel, J.P., and Moore, C.S. (2015). Roles of microglia in brain development, tissue maintenance and repair. Brain 138, 1138–1159.
Mikoshiba, K., Kohsaka, S., Takamatsu, K., and Tsukada, Y. (1980). Cerebellar hypoplasia in the Gunn rat with hereditary hyperbilirubinemia: immunohistochemical and neurochemical studies. J. Neurochem. 35, 1309–1318.
Mitra, S., Samanta, M., Sarkar, M., De, A.K., and Chatterjee, S. (2011). Pre-exchange 5% albumin infusion in low birth weight neonates with intensive phototherapy failure--a randomized controlled trial. J. Trop. Pediatr. 57, 217–221.
Mizushima, N., Levine, B., Cuervo, A.M., and Klionsky, D.J. (2008). Autophagy fights disease through cellular self-digestion. Nature 451, 1069–1075.
Moerschel, S.K., Cianciaruso, L.B., and Tracy, L.R. (2008). A practical approach to
171
neonatal jaundice. Am. Fam. Physician 77, 1255–1262.
Morioka, I., Nakamura, H., Koda, T., Yokota, T., Okada, H., Katayama, Y., Kunikata, T., Kondo, M., Nakamura, M., Hosono, S., et al. (2015). Current incidence of clinical kernicterus in preterm infants in Japan. Pediatr. Int. 57, 494–497.
Muchowski, K.E. (2014). Evaluation and treatment of neonatal hyperbilirubinemia. Am. Fam. Physician 89, 873–878.
Newman, T.B., Liljestrand, P., and Escobar, G.J. (2003). Infants with bilirubin levels of 30 mg/dL or more in a large managed care organization. Pediatrics 111, 1303–1311.
Nguyen, N., Bonzo, J. a, Chen, S., Chouinard, S., Kelner, M.J., Hardiman, G., Bélanger, A., and Tukey, R.H. (2008). Disruption of the ugt1 locus in mice resembles human Crigler-Najjar type I disease. J. Biol. Chem. 283, 7901–7911.
Nguyen, T., Sherratt, P.J., and Pickett, C.B. (2003). Regulatory Mechanisms Controlling Gene Expression Mediated By the Antioxidant Response Element. Annu. Rev. Pharmacol. Toxicol. 43, 233–260.
Nguyen, T., Nioi, P., and Pickett, C.B. (2009). The Nrf2-Antioxidant Response Element Signaling Pathway and Its Activation by Oxidative Stress. J. Biol. Chem. 284, 13291–13295.
Oakes, G.H., and Bend, J.R. (2005). Early steps in bilirubin-mediated apoptosis in murine hepatoma (Hepa 1c1c7) cells are characterized by aryl hydrocarbon receptor-independent oxidative stress and activation of the mitochondrial pathway. J. Biochem. Mol. Toxicol. 19, 244–255.
Oakes, G.H., and Bend, J.R. (2010). Global changes in gene regulation demonstrate that unconjugated bilirubin is able to upregulate and activate select components of the endoplasmic reticulum stress response pathway. J. Biochem. Mol. Toxicol. 24, 73–88.
Oakes, S.A., and Papa, F.R. (2015). The role of endoplasmic reticulum stress in human pathology. Annu. Rev. Pathol. 10, 173–194.
Odell, G.B. (1973). Influence of binding on the toxicity of bilirubin. Ann. N. Y. Acad. Sci. 226, 225–237.
Oh, W., Stevenson, D.K., Tyson, J.E., Morris, B.H., Ahlfors, C.E., Bender, G.J., Wong, R.J., Perritt, R., Vohr, B.R., Van Meurs, K.P., et al. (2010). Influence of clinical status on the association between plasma total and unbound bilirubin and death or adverse neurodevelopmental outcomes in extremely low birth weight infants. Acta Paediatr 99, 673–678.
Okumura, A., Kidokoro, H., Shoji, H., Nakazawa, T., Mimaki, M., Fujii, K., Oba, H., and Shimizu, T. (2009). Kernicterus in preterm infants. Pediatrics 123, e1052-8.
Oldreive, C.E., and Doherty, G.H. (2010). Effects of tumour necrosis factor-alpha on developing cerebellar granule and Purkinje neurons in vitro. J. Mol. Neurosci. 42, 44–52.
172
Olmos, G., and Llado, J. (2014). Tumor necrosis factor alpha: A link between neuroinflammation and excitotoxicity. Mediators Inflamm.
Olusanya, B.O., Ogunlesi, T.A., and Slusher, T.M. (2014). Why is kernicterus still a major cause of death and disability in low-income and middle-income countries? Arch. Dis. Child.
Ossola, B., Lantto, T.A., Puttonen, K.A., Tuominen, R.K., Raasmaja, A., and Männistö, P.T. (2012). Minocycline protects SH-SY5Y cells from 6-hydroxydopamine by inhibiting both caspase-dependent and -independent programmed cell death. J. Neurosci. Res. 90, 682–690.
Ostrow, J.D., Mukerjee, P., and Tiribelli, C. (1994). Structure and binding of unconjugated bilirubin: relevance for physiological and pathophysiological function. J. Lipid Res. 35, 1715–1737.
Ostrow, J.D., Pascolo, L., Brites, D., and Tiribelli, C. (2004). Molecular basis of bilirubin-induced neurotoxicity. Trends Mol. Med. 10, 65–70.
Owa, J.A., Ogunlesi, T.A., and Ogunlesi, T.A. (2009). Why we are still doing so many exchange blood transfusion for neonatal jaundice in Nigeria. World J. Pediatr. 5, 51–55.
Palmela, I., Sasaki, H., Cardoso, F.L., Moutinho, M., Kim, K.S., Brites, D., and Brito, M. a (2012). Time-dependent dual effects of high levels of unconjugated bilirubin on the human blood-brain barrier lining. Front. Cell. Neurosci. 6, 22.
Peter, M.E., Hadji, A., Murmann, A.E., Brockway, S., Putzbach, W., Pattanayak, A., Ceppi, P., and Mhc-i, T.C.R.A. (2015). The role of CD95 and CD95 ligand in cancer. 22, 549–559.
Petzold, A., Tisdall, M.M., Girbes, A.R., Martinian, L., Thom, M., Kitchen, N., and Smith, M. (2011). In vivo monitoring of neuronal loss in traumatic brain injury : a microdialysis study. 464–483.
Pinkernelle, J., Fansa, H., Ebmeyer, U., and Keilhoff, G. (2013). Prolonged Minocycline Treatment Impairs Motor Neuronal Survival and Glial Function in Organotypic Rat Spinal Cord Cultures. PLoS One 8, 1–22.
Pizzi, M., and Spano, P. (2006). Distinct roles of diverse nuclear factor-κB complexes in neuropathological mechanisms. Eur. J. Pharmacol. 545, 22–28.
Plane, J.M., Shen, Y., Pleasure, D.E., and Deng, W. (2010). Prospects for minocycline neuroprotection. Arch. Neurol. 67, 1442–1448.
Poland, R.L. (2002). Preventing kernicterus: almost there. J. Pediatr. 140, 385–386.
Qaisiya, M., Coda Zabetta, C.D., Bellarosa, C., and Tiribelli, C. (2014). Bilirubin mediated oxidative stress involves antioxidant response activation via Nrf2 pathway. Cell. Signal. 26, 512–520.
Reichman, N.E., Teitler, J.O., Moullin, S., Ostfeld, B.M., and Hegyi, T. (2015). Late-preterm birth and neonatal morbidities: Population-level and within-family estimates. Ann. Epidemiol. 25, 126–132.
173
Rice, A.C., and Shapiro, S.M. (2008). A new animal model of hemolytic hyperbilirubinemia-induced bilirubin encephalopathy (kernicterus). Pediatr. Res. 64, 265–269.
Rice, A.C., Chiou, V.L., Zuckoff, S.B., and Shapiro, S.M. (2011). Profile of minocycline neuroprotection in bilirubin-induced auditory system dysfunction. Brain Res. 1368, 290–298.
Ritter, J.K., Chen, F., Sheen, Y.Y., Tran, H.M., Kimura, S., Yeatman, M.T., and Owens, I.S. (1992). A novel complex locus UGT1 encodes human bilirubin, phenol, and other UDP-glucuronosyltransferase isozymes with identical carboxyl termini. J. Biol. Chem. 267, 3257–3261.
Rodkey, F.L. (1965). Direct spectrophotometric determination of albumin in human serum. Clin. Chem. 11, 478–487.
Rodrigues, C.M., Solá, S., Silva, R., and Brites, D. (2000). Bilirubin and amyloid-beta peptide induce cytochrome c release through mitochondrial membrane permeabilization. Mol. Med. 6, 936–946.
Rodrigues, C.M.P., Solá, S., and Brites, D. (2002). Bilirubin induces apoptosis via the mitochondrial pathway in developing rat brain neurons. Hepatology 35, 1186–1195.
Rose, A.L., and Wisniewski, H. (1959). Acute bilirubin encephalopathy induced with sulfadimethoxinein gunn rats. J. Neuropathol. Exp. Neurol. 165–189.
Rubinsztein, D.C., Ravikumar, B., Acevedo-Arozena, A., Imarisio, S., O’Kane, C.J., and Brown, S.D.M. (2005). Dyneins, autophagy, aggregation and neurodegeneration. Autophagy 1, 177–178.
Ryan, M.E., and Ashley, R.A. (1998). How do tetracyclines work? Adv. Dent. Res. 12, 149–151.
Sarnat, H.B., Nochlin, D., and Born, D.E. (1998). Neuronal nuclear antigen (NeuN): A marker of neuronal maturation in the early human fetal nervous system. Brain Dev. 20, 88–94.
Scheuer, T., Brockmöller, V., Blanco Knowlton, M., Weitkamp, J.-H., Ruhwedel, T., Mueller, S., Endesfelder, S., Bührer, C., and Schmitz, T. (2015). Oligodendroglial maldevelopment in the cerebellum after postnatal hyperoxia and its prevention by minocycline. Glia 63, 1825–1839.
Schreuder, A.B., Vanikova, J., Vitek, L., Havinga, R., Ahlfors, C.E., Hulzebos, C. V, and Verkade, H.J. (2013a). Optimizing Exchange Transfusion for Severe Unconjugated Hyperbilirubinemia : Studies in the Gunn Rat. PLoS One 8, 1–6.
Schreuder, A.B., Rice, A.C., Vanikova, J., Vitek, L., Shapiro, S.M., and Verkade, H.J. (2013b). Albumin administration protects against bilirubin-induced auditory brainstem dysfunction in Gunn rat pups. 1557–1565.
Schulz, S., Wong, R.J., Vreman, H.J., and Stevenson, D.K. (2012). Metalloporphyrins - An update. Front. Pharmacol. 3 APR, 1–16.
Scott, R.C., Juh??sz, G., and Neufeld, T.P. (2007). Direct Induction of Autophagy
174
by Atg1 Inhibits Cell Growth and Induces Apoptotic Cell Death. Curr. Biol. 17, 1–11.
Shah, Z., Chawla, A., Patkar, D., and Pungaonkar, S. (2003). MRI in kernicterus. Australas. Radiol. 47, 55–57.
Shahian, M., and Moslehi, M.A. (2010). Effect of albumin administration prior to exchange transfusion in term neonates with hyperbilirubinemia--a randomized controlled trial. Indian Pediatr. 47, 241–244.
Shapiro, S.M. (2003). Bilirubin toxicity in the developing nervous system. Pediatr. Neurol. 29, 410–421.
Shapiro, S.M. (2010). Chronic bilirubin encephalopathy: diagnosis and outcome. Semin. Fetal Neonatal Med. 15, 157–163.
Shapiro, S.M., and Nakamura, H. (2001). Bilirubin and the Auditory System. J. Perinatol. 852–855.
Silva, R.F., Rodrigues, C.M., and Brites, D. (2001). Bilirubin-induced apoptosis in cultured rat neural cells is aggravated by chenodeoxycholic acid but prevented by ursodeoxycholic acid. J. Hepatol. 34, 402–408.
Silva, S.L., Vaz, A.R., Barateiro, A., Falcão, A.S., Fernandes, A., Brito, M. a., Silva, R.F.M., and Brites, D. (2010a). Features of bilirubin-induced reactive microglia: From phagocytosis to inflammation. Neurobiol. Dis. 40, 663–675.
Silva, S.L., Vaz, A.R., Barateiro, A., Falcão, A.S., Fernandes, A., Brito, M.A., Silva, R.F.M., and Brites, D. (2010b). Neurobiology of Disease Features of bilirubin-induced reactive microglia : From phagocytosis to in fl ammation. Neurobiol. Dis. 40, 663–675.
Smith, K., and Leyden, J.J. (2005). Safety of doxycycline and minocycline: A systematic review. Clin. Ther. 27, 1329–1342.
Smitherman, H., Stark, A.R., and Bhutani, V.K. (2006). Early recognition of neonatal hyperbilirubinemia and its emergent management. Semin. Fetal Neonatal Med. 11, 214–224.
Sofroniew, M. V., and Vinters, H. V. (2010). Astrocytes: Biology and pathology. Acta Neuropathol. 119, 7–35.
Song, S., Hu, Y., Gu, X., Si, F., and Hua, Z. (2014). A novel newborn rat kernicterus model created by injecting a bilirubin solution into the cisterna magna. PLoS One 9, e96171.
Van De Steeg, E., Stránecký, V., Hartmannová, H., Nosková, L., Wagenaar, E., Esch, A. Van, Waart, D.R. De, Martin, H., Elferink, R.P.J.O., Kenworthy, K.E., et al. (2012). Complete OATP1B1 and OATP1B3 deficiency causes human Rotor syndrome by interrupting conjugated bilirubin reuptake into the liver. J. Clin. Invest. 122, 519–528.
Stevenson, D.K., Wong, R.J., Vreman, H.J., McDonagh, A.F., Maisels, M.J., and Lightner, D.A. (2004). NICHD Conference on Kernicterus: Research on Prevention of Bilirubin-Induced Brain Injury and Kernicterus: Bench-to-Bedside--Diagnostic
175
Methods and Prevention and Treatment Strategies. J. Perinatol. 24, 521–525.
Stirling, D.P., Koochesfahani, K.M., Steeves, J.D., and Tetzlaff, W. (2005). Minocycline as a neuroprotective agent. Neuroscientist 11, 308–322.
Stocker, R., Yamamoto, Y., Mcdonagh, A.F., Glazer, A.N., and Ames, B.N. (1987). Bilirubin is an Antioxidant of Possible Physiological Importance Published by : American Association for the Advancement of Science Stable URL : http://www.jstor.org/stable/1698769 Accessed : 07-06-2016 09 : 41 UTC. 235, 1043–1046.
Stoeckius, M., Erat, A., Fujikawa, T., Hiromura, M., Koulova, A., Otterbein, L., Bianchi, C., Tobiasch, E., Dagon, Y., Sellke, F.W., et al. (2012). Essential roles of Raf/extracellular signal-regulated kinase/mitogen-activated protein kinase pathway, YY1, and Ca2+ influx in growth arrest of human vascular smooth muscle cells by bilirubin. J. Biol. Chem. 287, 15418–15426.
Sumida, K., Kawana, M., Kouno, E., Itoh, T., Takano, S., Narawa, T., Tukey, R.H., and Fujiwara, R. (2013). Importance of UDP-glucuronosyltransferase 1A1 expression in skin and its induction by UVB in neonatal hyperbilirubinemia. Mol. Pharmacol. 84, 679–686.
Suzuki, H., Sugimura, Y., Iwama, S., Suzuki, H., Nobuaki, O., Nagasaki, H., Arima, H., Sawada, M., and Oiso, Y. (2010). Minocycline prevents osmotic demyelination syndrome by inhibiting the activation of microglia. J. Am. Soc. Nephrol. 21, 2090–2098.
Tanida, I., Ueno, T., and Kominami, E. (2008). LC3 and Autophagy. Methods Mol. Biol. 445, 77–88.
Tell, G., and Gustincich, S. (2009). Redox state, oxidative stress, and molecular mechanisms of protective and toxic effects of bilirubin on cells. Curr. Pharm. Des. 15, 2908–2914.
Tersey, S.A., Nishiki, Y., Templin, A.T., Cabrera, S.M., Stull, N.D., Colvin, S.C., Evans-Molina, C., Rickus, J.L., Maier, B., and Mirmira, R.G. (2012). Islet β-cell endoplasmic reticulum stress precedes the onset of type 1 diabetes in the nonobese diabetic mouse model. Diabetes 61, 818–827.
Uttara, B., Singh, A. V, Zamboni, P., and Mahajan, R.T. (2009). Oxidative stress and neurodegenerative diseases: a review of upstream and downstream antioxidant therapeutic options. Curr. Neuropharmacol. 7, 65–74.
Vaz, A.R., Delgado-Esteban, M., Brito, M.A., Bolaños, J.P., Brites, D., and Almeida, A. (2010). Bilirubin selectively inhibits cytochrome c oxidase activity and induces apoptosis in immature cortical neurons: assessment of the protective effects of glycoursodeoxycholic acid. J. Neurochem. 112, 56–65.
Vincent, J.L., Wilkes, M.M., and Navickis, R.J. (2003). Safety of human albumin - Serious adverse events reported worldwide in 1998-2000. Br. J. Anaesth. 91, 625–630.
Vítek, L., and Carey, M.C. (2003). Enterohepatic cycling of bilirubin as a cause of “black” pigment gallstones in adult life. Eur. J. Clin. Invest. 33, 799–810.
176
Wang, X., Zhu, S., Drozda, M., Zhang, W., Stavrovskaya, I.G., Cattaneo, E., Ferrante, R.J., Kristal, B.S., and Friedlander, R.M. (2003). Minocycline inhibits caspase-independent and -dependent mitochondrial cell death pathways in models of Huntington’s disease. Proc. Natl. Acad. Sci. U. S. A. 100, 10483–10487.
Watchko, J.F. (2006). Kernicterus and the Molecular Mechanisms of Bilirubin-Induced CNS Injury in Newborns. 8.
Watchko, J.F., and Tiribelli, C. (2013). Bilirubin-induced neurologic damage--mechanisms and management approaches. N. Engl. J. Med. 369, 2021–2030.
Wen, Y., Zhai, R.G., and Kim, M.D. (2013). The Role of Autophagy in Nmnat-Mediated Protection Against Hypoxia-Induced Dendrite Degeneration. 140–151.
Wennberg, R.P., and Hance, A.J. (1986). Experimental bilirubin encephalopathy: importance of total bilirubin, protein binding, and blood-brain barrier. Pediatr. Res. 20, 789–792.
Wennberg, R.P., Ahlfors, C.E., and Rasmussen, L.F. (1979). The pathochemistry of kernicterus. Early Hum. Dev. 3, 353–372.
Wennberg, R.P., Ahlfors, C.E., Bhutani, V.K., Johnson, L.H., and Shapiro, S.M. (2006). Toward understanding kernicterus: a challenge to improve the management of jaundiced newborns. Pediatrics 117, 474–485.
Whitney, E.R., Kemper, T.L., Rosene, D.L., Bauman, M.L., and Blatt, G.J. (2008). Calbindin-D28k is a more reliable marker of human Purkinje cells than standard Nissl stains: A stereological experiment. J. Neurosci. Methods 168, 42–47.
Wood, B., Comley, A., and Sherwell, J. (1970). Effect of additional albumin administration during exchange transfusion on plasma albumin-binding capacity. Arch. Dis. Child. 45, 59–62.
Wu, D.C., Jackson-Lewis, V., Vila, M., Tieu, K., Teismann, P., Vadseth, C., Choi, D.-K., Ischiropoulos, H., and Przedborski, S. (2002). Blockade of microglial activation is neuroprotective in the 1-methyl-4-phenyl-1,2,3,6-tetrahydropyridine mouse model of Parkinson disease. J. Neurosci. 22, 1763–1771.
Xue, M., Mikliaeva, E.I., Casha, S., Zygun, D., Demchuk, A., and Yong, V.W. (2010). Improving outcomes of neuroprotection by minocycline: guides from cell culture and intracerebral hemorrhage in mice. Am. J. Pathol. 176, 1193–1202.
Yokota, T., Morioka, I., Kodera, T., Morisawa, T., Sato, I., Kawano, S., Koda, T., Matsuo, K., Fujioka, K., Morikawa, S., et al. (2013). Novel treatment strategy for Japanese newborns with high serum unbound bilirubin. Pediatr. Int. 55, 54–59.
Yong, V.W., Power, C., Forsyth, P., and Edwards, D.R. (2001). Metalloproteinases in biology and pathology of the nervous system. Nat. Rev. Neurosci. 2, 502–511.
Yong, V.W., Wells, J., Giuliani, F., Casha, S., Power, C., and Metz, L.M. (2004). Minocycline and neurological diseases The promise of minocycline in neurology. 3, 744–751.
Yrjänheikki, J., Tikka, T., Keinänen, R., Goldsteins, G., Chan, P.H., and Koistinaho, J. (1999). A tetracycline derivative, minocycline, reduces inflammation
177
and protects against focal cerebral ischemia with a wide therapeutic window. Proc. Natl. Acad. Sci. U. S. A. 96, 13496–13500.
Yu, C., Wang, F., Jin, C., Wu, X., Chan, W., and Mckeehan, W.L. (2003). Increased Carbon Tetrachloride-Induced Liver Injury and Fibrosis in FGFR4-Deficient Mice. 161, 2003–2010.
Yu, Z. Bin, Han, S.P., and Chen, C. (2014). Bilirubin nomograms for identification of neonatal hyperbilirubinemia in healthy term and late-preterm infants: a systematic review and meta-analysis. World J. Pediatr. 10, 211–218.
Yueh, M.F., Chen, S., Nguyen, N., and Tukey, R.H. (2014). Developmental Onset of bilirubin-induced neurotoxicity involves toll-like receptor 2-dependent signaling in humanized UDP-glucuronosyltransferase1 mice. J. Biol. Chem. 289, 4699–4709.
Yuste, J.E., Tarragon, E., Campuzano, C.M., and Ros-Bernal, F. (2015). Implications of glial nitric oxide in neurodegenerative diseases. Front. Cell. Neurosci. 9, 322.
Zelenka, J., Lenícek, M., Muchová, L., Jirsa, M., Kudla, M., Balaz, P., Zadinová, M., Ostrow, J.D., Wong, R.J., and Vítek, L. (2008). Highly sensitive method for quantitative determination of bilirubin in biological fluids and tissues. J. Chromatogr. B. Analyt. Technol. Biomed. Life Sci. 867, 37–42.
Zhang, T., Haws, P., and Wu, Q. (2004). Multiple Variable First Exons : A Mechanism for Cell- and Tissue-Specific Gene Regulation. Genome Res. 79–89.
Zhang, W., Narayanan, M., and Friedlander, R.M. (2003). Additive neuroprotective effects of minocycline with creatine in a mouse model of ALS. Ann. Neurol. 53, 267–270.
Zhang, Y., Wu, Y., Cheng, Y., Zhao, Z., Tashiro, S. ichi, Onodera, S., and Ikejima, T. (2008). Fas-mediated autophagy requires JNK activation in HeLa cells. Biochem. Biophys. Res. Commun. 377, 1205–1210.
Zhu, S., Stavrovskaya, I.G., Drozda, M., Kim, B.Y.S., Ona, V., Li, M., Sarang, S., Liu, A.S., Hartley, D.M., Wu, D.C., et al. (2002). Minocycline inhibits cytochrome c release and delays progression of amyotrophic lateral sclerosis in mice. Nature 417, 74–78.
178
Appendix 1
Part of the Thesis was published as follows:
S. Vodret, G. Bortolussi, A. B. Schreuder, J. Jasprovà, L. Vitek, H. J. Verkade and
A. F. Muro (2015). Albumin administration prevented neurological damage and
death in a mouse model of severe neonatal hyperbilirubinemia. Scientific Reports,
5: 16203