NeoGenomics Company Overview Presentation | 07-27-2015
20
Company Overview Presentation July 2015 “Improving Patient Care through exceptional cancer genetic testing services!” Time Matters. Results Count!
-
Upload
neogenomics-laboratory-cancer-diagnostics -
Category
Economy & Finance
-
view
3.389 -
download
4
Transcript of NeoGenomics Company Overview Presentation | 07-27-2015

Company Overview Presentation July 2015
“Improving Patient Care through exceptional cancer genetic testing services!”
Time Matters. Results Count!

Forward-looking Statements
This presentation contains statements which constitute forward-looking statements within the meaning of Section 27A of the Securities Act, as amended; Section 21E of the Securities Exchange Act of 1934; and the Private Securities Litigation Reform Act of 1995. The words “may”, “would”, “could”, “will”, “expect”, “estimate”, “anticipate”, “believe”, “intend”, “plan”, “goal”, and similar expressions and variations thereof are intended to specifically identify forward-looking statements. All statements that are not statements of historical fact are forward-looking statements.
Investors and prospective investors are cautioned that any such forward-looking statements are not guarantees of future performance and involve risks and uncertainties, and that actual results may differ materially from those projected in the forward-looking statements as a result of various factors. The risks that might cause such differences are identified in our filings with the Securities and Exchange Commission. We undertake no obligation to publicly update or revise the forward looking statements made in this presentation to reflect events or circumstances after the date of this presentation or to reflect the occurrence of unanticipated events.
2

Investment Highlights
Fast growing cancer genetics lab servicing Oncologists, Pathologists and Hospitals
Strategic client partnerships created
by “Tech-Only” model
Dynamic, rapidly- growing and consolidating industry
Industry-leading revenue & test volume
growth
Most Comprehensive Cancer Testing Menu in Industry
Strong Management Team with large cap
lab experience
3

Experienced Management Team
• Douglas VanOort, Chairman & CEO Chief Operating Officer, Quest Diagnostics Executive Vice President, Corning Life Sciences, Inc.
• Maher Albitar, M.D., Chief Medical Officer & Director of R&D Med. Dir. for Hematopathology & Oncology and Chief of R&D, Quest Nichols Institute; Director of Leukemia and Molecular Laboratory, MD Anderson Cancer Center
• Robert Shovlin, Chief Operating Officer Chief Development Officer, Bostwick Laboratories President & Chief Executive Officer, Aureon Biosciences
• Steven Jones, Director, EVP – Finance, & Chief Compliance Officer Chairman, Aspen Capital Group; Managing Member, Medical Venture Partners Vice President, Merrill Lynch Investment Banking
• George Cardoza, Chief Financial Officer CFO, Protocol Global Solutions; Controller, Central Region, Quest Diagnostics
• Robert Horel, Vice President & General Manager, PathLogic Regional Mgr., US Labs; Product Specialist, Ventana Medical Systems; Pilot, U.S. Navy
• Steven Ross, Chief Information Officer Vice President Technology, Chico’s FAS, Inc.
4

Company Overview
• Specialized oncology reference laboratory providing the latest testing technologies, global/tech-only options, and interactive education to the pathology community
• Offer the complete spectrum of diagnostic services through nationwide network of laboratories
• Dedicated to providing superior service, faster turn-around times, and complete attention to the needs of our clients and their patients
• Founded and went public in 2001
• First to launch tech-only FISH services in 2006
• March 2009, Doug VanOort joined as CEO
• December 2012, up-listed to NASDAQ
• Recently completed acquisition of Path Logic based in West Sacramento, California
• 65% CAGR in Revenue and Test Volume over last ten Years.
Description Broad Menu of Genetic & Molecular Tests
History
5
• 57 Custom FISH Panels
• 215 IHC Stains and Custom Panels
• 72 Molecular Markers
• 23 Targeted NeoTYPE Molecular/FISH/IHC Panels
• Full Suite of Next Generation Sequencing Panels 315 Gene Solid Tumor Discovery Panel
4,813 Gene Cancer Exome Profile
• Cytogenetics
• Flow Cytometry

1,152 4,082 12,838
20,998
32,539
45,675
57,332
76,288
114,606
137,317
177,279
2004
2005
2006
2007
2008
2009
2010
2011
2012
2013
2014
$558 $1,885
$6,476
$11,505
$20,015
$29,469
$34,371
$43,484
$59,866
$66,467
$82,194
2004
2005
2006
2007
2008
2009
2010
2011
2012
2013
2014
Proven Track Record of Consistent Growth
Base NEO* Annual Revenue Base NEO* Tests Performed ($, 000s)
6
* Base NEO represents organic revenue and test volume growth from legacy business and excludes the impacts from the PathLogic acquisition.

U.S. Cancer Testing Market Size $10-12 Billion
Hematopoietic Cancers Solid Tumor Cancers
Total Testing Market: $3 - 4 Billion $7 - 8 Billion
Est. Genetic Mkt. (TAM) ~$2 - 3 Billion
~$2 - 3 Billion
Patients in Treatment: 850,000 7.0 million
New Diagnoses/Yr.: 150,000 1.45 million
Specimen Types: Bone Marrow (350K/Yr)
Per. Blood (150K/Yr) Lymph Nodes
Tiss. Biopsies (8-10MM) Fine Needle Aspirates
Other Bodily Fluids
Neo Revenue Split: ~80% ~20%
7

NeoGenomics’ Cancer Testing Services
Key Testing Methodologies
• Cytogenetics: chromosome analysis − “Neighborhood view of 46 houses from 1000 feet”
• Flow Cytometry & IHC: cell surface marker analysis − “Single house view from 500 feet”
• Fluorescence in-situ Hybridization (FISH): gene analysis − “Door and window view of one house”
• Molecular Testing: DNA/RNA analysis − “View of serial number on door lock”
8

Customer Targets
Pathologists & Hospital Pathology Groups (about 75% of 2014 Revenue ) • Enable community Pathologists to practice using sophisticated tools and tests • Innovative technical component (TC or “tech-only”) services – Flow, FISH, IHC • Outstanding Web-based Lab System & extensive training programs
Oncologists & Clinician Groups (about 22% of 2014 Revenue ) • Includes Hematologists, Oncologists, Dermatologists, Urologists • Disease Panels and comprehensive molecular menus • Increasing Opportunity to service larger practices with Tech-only model
Clinical Trials & Other (about 3% of 2014 Revenue ) • Contract research/clinical trial support work for Pharma clients
9

A Growing Commercial & Facility Footprint
NV
OR
WA
MT
MN
NE
ND
ID
WY
OK
KS CO UT
TX
NM
SC
FL
GA AL MS
LA
AR
MO
IA
VA
NC
IN
KY
IL
MI WI
PA
WV
VT
RI
NH
AZ
OH DE MD
NY
CA
NJ
MI
MA SD
States sending specimens in 2014
ME
CT
Irvine, CA 25k sf
Nashville, TN 7k sf
Ft. Myers, FL 45k sf
Tampa, FL 5k sf
W. Sacramento, CA
17k sf
Fresno, CA 3k sf
10
SD

Large & Growing Clinical Trials Opportunity
• World class Molecular Oncology menu opening up numerous opportunities to directly service pharmaceutical companies.
− Leverages NEO Pathologist expertise, Lab systems, Tech-only model, comprehensive menus to further diversify into a new segment.
− Ability to expand into world-wide markets
− Potential for developing companion diagnostics
− Access to market with higher AUP
• Exclusive 5 year Agreement with Covance, with a two year renewal option.
− NEO exclusively provides professional interpretations for all AP and Histology testing ordered with new trials worldwide
− NEO exclusively provides all technical component FISH for samples tested in the U.S.
− NEO eligible to provide technical component services for all U.S. based testing that is not otherwise performed by Covance’s Lab-within-a-Lab (LWL) facility at NEO
11
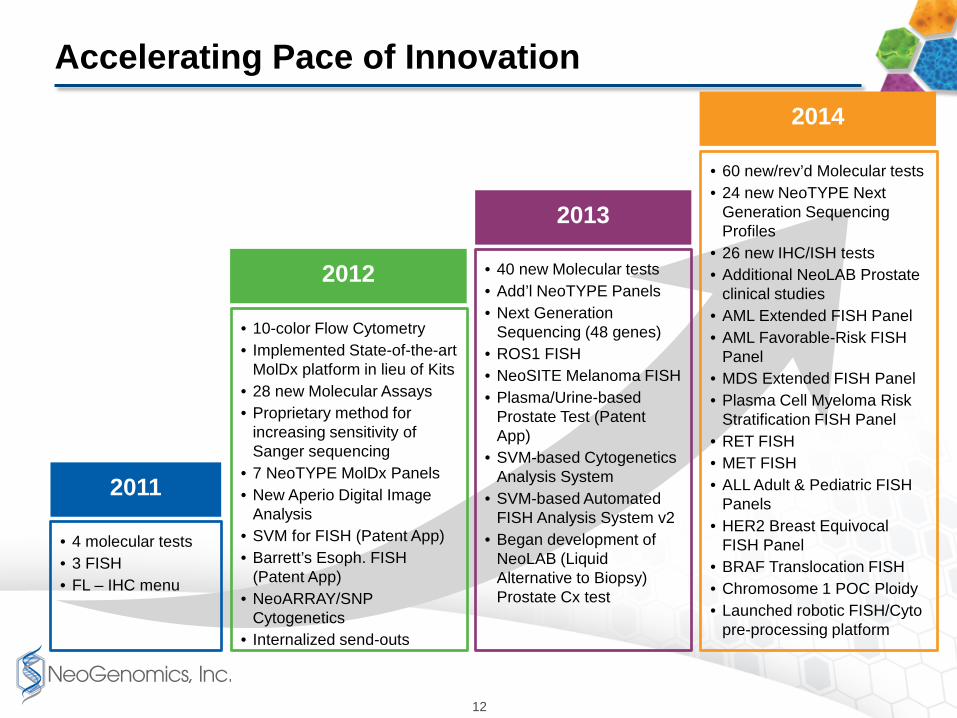
Accelerating Pace of Innovation
• 4 molecular tests • 3 FISH • FL – IHC menu
• 10-color Flow Cytometry • Implemented State-of-the-art
MolDx platform in lieu of Kits • 28 new Molecular Assays • Proprietary method for
increasing sensitivity of Sanger sequencing
• 7 NeoTYPE MolDx Panels • New Aperio Digital Image
Analysis • SVM for FISH (Patent App) • Barrett’s Esoph. FISH
(Patent App) • NeoARRAY/SNP
Cytogenetics • Internalized send-outs
• 40 new Molecular tests • Add’l NeoTYPE Panels • Next Generation
Sequencing (48 genes) • ROS1 FISH • NeoSITE Melanoma FISH • Plasma/Urine-based
Prostate Test (Patent App)
• SVM-based Cytogenetics Analysis System
• SVM-based Automated FISH Analysis System v2
• Began development of NeoLAB (Liquid Alternative to Biopsy) Prostate Cx test
2011
2012
2013
12
• 60 new/rev’d Molecular tests • 24 new NeoTYPE Next
Generation Sequencing Profiles
• 26 new IHC/ISH tests • Additional NeoLAB Prostate
clinical studies • AML Extended FISH Panel • AML Favorable-Risk FISH
Panel • MDS Extended FISH Panel • Plasma Cell Myeloma Risk
Stratification FISH Panel • RET FISH • MET FISH • ALL Adult & Pediatric FISH
Panels • HER2 Breast Equivocal
FISH Panel • BRAF Translocation FISH • Chromosome 1 POC Ploidy • Launched robotic FISH/Cyto
pre-processing platform
2014

Next Generation Sequencing and Liquid Biopsies Next Generation Sequencing
• 26 tumor-specific hematologic and solid tumor profiles
• 5 broad pan-tumor profiles (54 gene Myeloid Disorders Profile, 48 gene Precision Profile for Solid Tumors, 73 gene Cancer Susceptibility Profile for inherited mutations, 315+ gene Discovery Profile for Solid Tumors, 4813 gene Caner Exome Profile
• Germline testing for BRCA1/BRCA2 for familial breast cancer and Lynch Syndrome for colorectal cancer
• Comprehensive and clear reporting of key diagnostic, prognostic, therapeutic and clinical trials information relevant for informed decision making
NeoLAB (Liquid Alternative to Biopsy) Prostate Text • Blood Plasma & Urine-based (no need for Prostate tissue)
• Designed to inform which patients with elevated PSA should be biopsied
• Pivotal validation study underway (800 - 1,000 patients)
• Commercial launch expected in 1H 2016
• Expected pricing $400 - $600/Test
13

2015 Strategic Priorities
• Next Gen Sequencing
• Develop Prostate Cancer Test
• Launch New Products
• Grow Clinical Trials
• Optimize Covance partnership
• Higher Productivity
• Lower Costs
• Become a “Digital Lab”
• Expand Sales Team
• Add new clients
• Improve Informatics
Growth Get LEAN
Innovate Diversify
14

Avg Rev/Test & Adjusted EBITDA – Base NEO*
15
* For comparison purposes Base NEO exclude the impacts from the Path Logic Acquisition, which was completed on 7/8/14.
9.1% 8.7%
12.2%
4.9%
-7.0%
-5.0%
-8.4% -7.3%
-4.1%
$659
-$1,243
$562
-$103 -$566
$2,134
$5,998
$8,515
$9,804
-15%
-10%
-5%
0%
5%
10%
15%
-$10,000
-$7,000
-$4,000
-$1,000
$2,000
$5,000
$8,000
2006 2007 2008 2009 2010 2011 2012 2013 2014
Change in Avg Rev/Test (%) Adjusted EBITDA ($, 000's)

32% Reduction in Operating Costs per Test Over the Last 5 years!
Cost Management & Operating Leverage – Base NEO*
16
* For comparison purposes Base NEO exclude the impacts from the Path Logic Acquisition, which was completed on 7/8/14.
$651
$575
$512 $461 $446
-2%
5%
10%
13% 12%
-4%
-2%
0%
2%
4%
6%
8%
10%
12%
14%
$0
$100
$200
$300
$400
$500
$600
$700
2010 2011 2012 2013 2014Cogs Cost/Test G&A Net of R&D Cost/TestS&M Cost/Test R&D Cost/TestTotal Cost/Test Adj EBITDA Margin %

Increasing Margins Despite Lower Avg Unit Prices – Base NEO*
* For comparison purposes Base NEO exclude the impacts from the Path Logic Acquisition, which was completed on 7/8/14. (1) Productivity calculated as the average number of lab tests completed per month per laboratory FTE.
17
45.9%
44.7% 44.8%
47.7% 48.0%
-28.1%
40.6%
-50%
-40%
-30%
-20%
-10%
0%
10%
20%
30%
40%
50%
35%
40%
45%
50%
55%
2010 2011 2012 2013 2014
Gross Margin % Cum Change in Avg Rev/Test Since 2009 Cum Change in Productivity Since 2009 (1)
Cum
Cha
nge
in A
vg R
ev/T
est &
Pro
duct
ivity
Gro
ss M
argi
n

Accelerating Cash Flow & Earnings
($, 000's)
2012
2013
Base NEO* 2014
Consolidated 2014
Total Consolidated Revenue $ 59,867 $ 66,467 $82,193 $ 87,069 % Growth 37.7% 11.0% 23.7% 31.0%
Total Gross Profit 26,836 31,737 39,455 40,714 Gross Margin % 44.8% 47.7% 48.0% 46.8%
SG&A Expenses 25,624 28,563 36,411 38,496 Total SG&A as a % of Rev 42.8% 43.0% 44.3% 44.2%
Net Income/(Loss) $ 65 $ 2,033 $1,906 $ 1,132 Diluted EPS $0.00 $0.04 NA $0.02
Adjusted EBITDA $ 5,997 $ 8,515 $9,803 $ 9,176 % Growth 181.0% 42.0% 15.1% 7.8%
Base NEO* Summary Operating Metrics % Growth in Tests Performed 50.2% 19.8% 29.1%
Avg. Revenue/Test $ 522 $ 484 $ 463 % Change -8.4% -7.3% -4.2%
Avg. Cost of Goods Sold/Test $ 288 $ 253 $ 241 % Change -8.6% -12.2% -4.7%
18
* For comparison purposes Base NEO exclude the impacts from the Path Logic Acquisition, which was completed on 7/8/14.

Recent Share Price (7/24/15): $ 6.08
Common Shares Outstanding: 60.4 M
Fully Diluted Shares: 66.7 M
Avg. Daily Trading Volume (3 Mos.): 455,411
Current Market Cap: $367.2 M
Less Net Debt: (21.7)M
Enterprise Valuation: $345.5 M
Key Financial Information
19

NeoGenomics Summary
• Emerging leader in fastest-growing segment of lab testing industry
• Robust competitive advantages and product portfolio
• Strong Management Team with outstanding industry experience
• Accelerating profitability driven by growth and operating leverage
• Fragmented industry undergoing consolidation likely to present additional strategic opportunities
• Recent Guidance(1): FY 2015
Revenue ($, MMs) $100 - 103
(1) Guidance incorporates an estimated $8-9 million reduction in revenue from the pricing of the new FISH CPT Codes by all Payers.
20