
NEO Tracking and Characterization Facility...• Tracking capability for the next generation launch...
29
NEO Tracking and Characterization Facility by Barry Geldzahler; NASA Chief Scientist for Space Communications and Navigation Jason Crusan; Chief Technologist- NASA HQ/Space Operations Mission Directorate Pat Martin ; Senior Scientist, R&D Technology, Harris Corporation Kathy Minear; Senior Mathematician, R&D Technology, Harris Corporation Jason Soloff; NASA/Johnson Space Center, Avionics & Communications Office Lead Presented to the Small Body Assessment Group: Aug 3-4, 2010 1
Transcript of NEO Tracking and Characterization Facility...• Tracking capability for the next generation launch...

NEO Tracking and Characterization Facility
by
Barry Geldzahler; NASA Chief Scientist for Space Communications and NavigationJason Crusan; Chief Technologist- NASA HQ/Space Operations Mission Directorate
Pat Martin ; Senior Scientist, R&D Technology, Harris CorporationKathy Minear; Senior Mathematician, R&D Technology, Harris Corporation
Jason Soloff; NASA/Johnson Space Center, Avionics & Communications Office Lead
Presented to the Small Body Assessment Group: Aug 3-4, 2010
1

Genesis
•For several years we have been undertaking experiments/demonstrations of uplink arraying.
All have been successful. The demo from Harris Corporation offers real-time compensation
for atmospheric fluctuations- enabling high frequency u/l arraying- and uses phase transfer-
2-4 orders of magnitude less complex than time transfer
•Applications include spacecraft emergency commanding, radar tracking/imaging of NEO’s,
and obtaining statistics of small body orbital debris and possibly tracking of debris
•SOMD Chief Technologist asked for a White Paper on the topic to include a facility that
might use this technique for a variety of NASA purposes
•This talk is a distillation of the White Paper
2

Goal
• We propose to build at the Kennedy Space Center a low-cost, low maintenance facility focused on the tracking and characterization of Near Earth Objects (NEO’s) that can supplement and augment the existing radar facilities of Goldstone and Arecibo and undertake joint studies with these facilities as well as the Green Bank Telescope and the Very Large Array of the National Radio Astronomy Observatory.
• The proposed array will provide improved capabilities over those of today:
– Track 25-30X more NEO’s per year with 4-16X better resolution than available today– Capture 10-20X more data for the Earth Science Decadal Survey missions– Expandable as required to provide emergency uplink to the farthest reaches of the solar
system– Greater than 1000X signal/noise figure improvement to enhance radio science experiments– Possible improved detection/tracking of small (≤1-10cm) orbital debris particles
3

BackgroundNASA is interested in NEO’s for three major reasons:
(1) protection of the home planet by cataloging 90% of NEOs > 140m in size, keeping the Goldstone Solar System Radar (GSSR) capacity (per the NASA Authorization Act 2008),
(1) characterization of the size, shape, spin, and composition of asteroids for possible human exploration missions, and
(2) intrinsic scientific studies such as insight into the formation and evolution of the solar system.
“The Congress reaffirms the policy direction established in the National Aeronautics and Space Administration Authorization Act of 2005 (Public Law 109-155) for NASA to detect, track, catalogue, and characterize the physical characteristics of near-Earth objects equal to or greater than 140 meters in diameter. NASA's Near-Earth Object program activities will also provide benefits to NASA's scientific and exploration activities.”…”The Administrator shall maintain planetary radar that is, at minimum, comparable to the capability provided through the NASA Deep Space Network Goldstone facility.”
4

Ground Based Facilities Required
The new “mandate” to find by 2020, 90% of the approximately 100,000 NEOs with diameters greater than 140 m (i.e. those bodies that could cause significant statewide or ocean margin damage if they collide with Earth) will lead to a massive increase in the discovery rate of NEOs
• Studying even a small fraction of the NEOs with space craft alone would take a prohibitively long time.
• Ground based remote sensing assets and space-based observatories such as HST, and eventually JWST, are required.
• True orbit determination is accomplished by ground based planetary radars
5

Existing Facilities Capabilities
• Goldstone : the 70m 400 kW X-band facility• Arecibo : the 305m 900kW S-band facility
• Advantages of Ground-based Radar vs. optical systems:– 5 times more accurate prediction of the orbits of objects approaching
the Earth, – reduce orbit uncertainties by some 5 orders of magnitude over optical
only solutions – meter-level characterization of NEO shapes, dimensions and features.
• Disadvantages:– the antenna fields of view of the radar antennas are small (~ 2 arcmin)– finding NEOs is usually performed optically or in the infrared and then
followed up for characterization by radar observations.
6
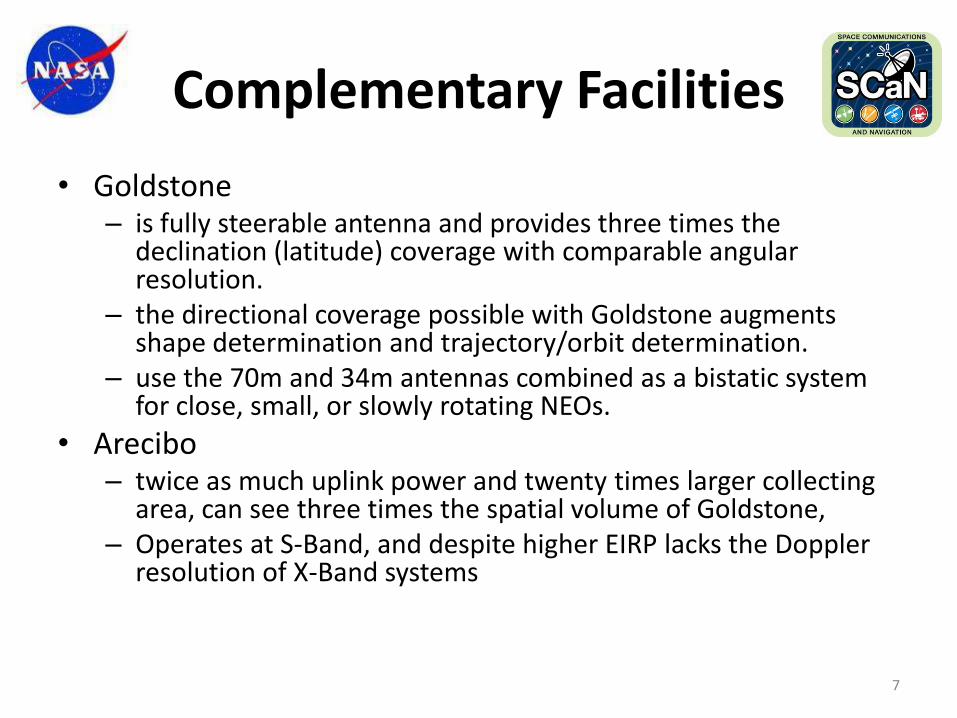
Complementary Facilities
• Goldstone – is fully steerable antenna and provides three times the
declination (latitude) coverage with comparable angular resolution.
– the directional coverage possible with Goldstone augments shape determination and trajectory/orbit determination.
– use the 70m and 34m antennas combined as a bistatic system for close, small, or slowly rotating NEOs.
• Arecibo – twice as much uplink power and twenty times larger collecting
area, can see three times the spatial volume of Goldstone, – Operates at S-Band, and despite higher EIRP lacks the Doppler
resolution of X-Band systems
7

Limitations of the Current Planetary Radar Systems
• Arecibo – restricted in hour angle and declination coverage the number of
NEOs accessible to the radar system is limited.
• Goldstone– (1) Goldstone radar competes for telescope time with numerous NASA
spacecraft missions that have higher priority and often limit the time available for radar observations ==? Limited access time
– (2) the long length of time (~ 1 month) to coordinate the high EIRP (Effective or Equivalent Isotropic Radiative Power) uplink with the 31 agencies that form the Mojave Spectrum Coordination group- recent urgent requests have been at least two weeks in advance (FAA regulations require coordination for EIRP ≥ 10 mW/cm2), and
– (3) the 70m antennas are slated to be decommissioned after 2015 and replaced with a minimal set of 34m antennas thereby further exacerbating restriction (1) .
8

Proposed Method of Increasing Observations of NEOs
• With the long-term future of Goldstone in doubt, there is at present no clear plan to maintain within the DSN a radar capability comparable to the present Goldstone capabilities. With the additional constraint of antenna availability, implementation of a dedicated facility to track and characterize NEOs is timely.
• The proposed facility consists of twenty five 12m antennas, each with a 5 kW X-band transmitter. Whereas for downlink arraying, array sensitivity increases linearly with the number of antennas, N, for transmit or uplink arraying the EIRP increases as N2 (see Appendix A). Hence, when the antenna beams are combined in the far field, the proposed array can transmit 3TW EIRP.
9

Advantages of an NEO Tracking and Characterization Facility
• Virtually 24/7 availability. Whereas radar observations on the 70m antenna comprise < 3% of the available antenna time, on a NEO-focused purpose array, some 25-30 times more antenna time is available and thus 25-30 times the number of sources can be observed in a given year. This will dramatically help NASA reach the goal of tracking and characterizing 90% of NEOs ≥140m by 2020.
• The array is a more reliable resource than a single dish. If the 70m is down for any reason, so too is the radar facility. The same is true for the high power klystron tubes. However, with an array, if any given antenna is taken out for maintenance or is in an anomalous condition, little performance is lost. For example, losing a single antenna out of 25 would be a loss of only 2% of the array downlink capability. Hence, availability of the array is more assured and robust to operational “down time” or element failures.
• Spectrum management is not an issue with the array. Since the high power beam forms ~200 km above the earth, the FAA EIRP limit will not be violated obviating the need for a time-consuming coordination among a large number of Agencies.
• The angular resolution of the proposed array is 4 times better than that of the 70m antenna at Goldstone. With antenna spacings of 60m, an effective diameter of ~300m can be achieved- imagine a 5x5 antenna array. Increased angular resolution can help characterize NEOs in unprecedented detail.
• Scalability. If still higher resolution or greater sensitivity is desired, additional antenna elements can be added. At roughly $1M per antenna element, increased capability can be added at a low cost.
• Extensibility to Ka band. This would be unique to NASA and provide 16 times the angular resolution of the 70m radar system as well as significantly improved range and range-rate measurement.
10

Additional Capabilities
• Tracking capability for the next generation launch facility at/near KSC.
• 10-20X increase in data rate capture over today’s Ground Network for Earth Science Decadal Survey missions will be provided at minimal cost.
• High power emergency uplink capability can be provided more quickly (~250 times) since spectrum coordination will not be required. Hence, the uplink will not take ~ 1 month to coordinate with the multiple Agencies as at Goldstone; it can be provided virtually on-demand.
• Radio science experiments (Planetary atmospheres, general relativity, mass determinations, occultations, surface scattering, etc) are usually conducted by transmitting signals from the spacecraft past/through the target of interest to the ground. However, spacecraft transmitters, ~20W, limit the signal to noise ratio and hence the science results. Using a high power uplink from the ground to the target to the spacecraft and then downlinking the data via telemetry (ala New Horizons) can increase the S/N by ≥ 1000. Science using traditional “downlink” measurement techniques will also be improved due to the higher sensitivity of the array.
• Improved detection/tracking of small (≤1-10cm) orbital debris particles (this is a goal). We have begun discussions with the NASA orbital debris office at JSC to see how/if the proposed array can make a contribution. The JSC orbital debris team visited the NASA uplink arraying test bed in Florida as a first step.
11

Feasibility- Current State of Uplink Arraying
Harris’ Uplink Method Offers Operational Feasibility Including: Immediate Availability, Potential Extension to Ka-Band
Methods # Dishes -
Size
Circuitry/Fiber
(Ops to Feed)
Beam-Steer
(ARP to Target)
Troposphere
(Feed to Target)
Extensibility
to Ka
Additional
Considerations
Collimation
Towers
(D’Addario)
5 x 1.2m Time Transfer Model-based Not handled No, tropospheric
effects not
handled
-Can’t build tower tall enough if
dishes are over 6m
-Increased cost for equivalent G/T for
dishes < 6m (Cost to cool)
Moon Bounce
(Vilnrotter)
3 x 34m Time Transfer Model-based for
initial estimate
Not handled No, tropospheric
effects not
handled
-Moon only accessible ½ the day
-Remaining phase correction derived
empirically using radar pulses
Calibration
Using Geo-
Satellite
Satellite
Not
Available
Time or Phase Model-based Latency is an issue
for Ka
Possibly, if
satellite is near
target
-Have to point away (even for X/S-
band)
-At least three required worldwide
Continuous
Self-Calibration
w/Instant Return
(Harris)
3 x 12m Local Closed-Loop
Phase Control
Local Closed-Loop
Phase Control and
Model-based
Instant Return Yes
(Requires known
external source
within element
pattern)
-Immediate Availability
-Time transfer for bits, Phase control
for carrier - Easier to achieve phase
transfer than time
-Phase stability of circuit not sensitive
to temperature, length change
Collimation Towers Moon Bounce Harris’ Continuous Self-Calibration
“Large Reflector Uplink Arraying” G. Patrick Martin & Kathy Minear of Harris Corporation, Barry J. Geldzahler NASA HQ, Jason Soloff NASA JSC
(Presented at SpaceOps 2010, Huntsville, Alabama) 12

Summary
• Uplink arraying offers significant advantages for tracking and characterization of NEO’s– Antenna availability, high resolution, amelioration of
spectrum mgt issues, reliability, scalability, and extensibility
• The method developed by the Harris Corp. offers– “Instant” availability. No need to point to collimation
towers or a beacon/moon– Real time atmospheric fluctuation compensation-
critical for Ka band– Phase transfer rather than time transfer- 2-4 orders of
magnitude less complex
13

Appendix A: Proof of N2 EIRP EffectG. Patrick Martin Senior Scientist Harris Corporation
Consider an array of N nominally identical reflector antennas, each nominally pointed toward the same far field target, such as the three 12m reflectors comprising the Harris Uplink Experiment Array shown in Figure 1 communicating with a DSCS satellite.
Figure 1. Array of 12m Reflectors Transmitting to DSCS B13
If each of these antennas has a power amplifier transmitting power P Watts and each has a directive gain G, then the far field power density in Watts per meter squared at a range R meters for a single one of these antennas is well known to be
2
2/
4meterWatts
R
PGPdensity
1
14

Appendix A: Proof of N2 EIRP Effect-2
The electric field associated with this power is proportional to the square root of power density times the impedance of free space. One has
Where
meterVoltsR
PGE /
4 2
Ohms377
2
3
If several of these signals are arrayed, then their electric fields (not the powers) add linearly. The total electric field for antennas in the direction of interest (assuming all in-phase) is therefore
meterVoltsR
PGNEE
N
i
iArray /4 2
1
4
15

Appendix A: Proof of N2 EIRP Effect- 3
Wave power for the array is proportional to the array’s electric field squared divided by the
impedance of free space, given by
2
2
2
2
22
/4
4meterWatts
R
PGNR
PGN
EP
Array
Array
5
Consequently, it is seen that the far field power density is proportional to the number of
array elements squared.
Qualitatively, we know that the gain of an array is directly proportional to N, so we can
restate Equation 5 as the product of Array Gain, NG, times the total power transmitted, NP,
seeing that the array result is entirely consistent with single antenna EIRP experience.
16

Appendix A: Proof of N2 EIRP Effect- 4
2
22
2
/44
meterWattsR
NPNG
R
PGNPArray
6
Or,
2
2/
4meterWatts
R
mittedPowerTransnAntennaGaiPArray
7
This effect was demonstrated experimentally during an uplink experiment using the three 12m reflector antennas transmitting to DSCS B13 (Martin et al 2010).
17

Consider the ith signal arriving at a spacecraft to be a simple sine wave for which the voltage can be represented as.
Where are the amplitude and phase respectively of the ith signal. All of the signals are assumed to have the
same frequency . For N signals arriving at the spacecraft the total voltage would be
In order for these signals to add maximally, θi must be equal for all
Let θ= θk
If the amplitude of the signals is also equal, then the total voltage at the spacecraft receiver can be written
Since the received power is proportional to N2:
And the received power must be proportional to received EIRP:
Then
or the EIRP of N antennas each with identical EIRP is N2 times the EIRP of a single antenna.
Appendix B: Derivation of N2 EIRP Effect for CW
18
)sin()( itAtv ii
N
i
iiTotal tAtv1
)sin()(
)...,...3,2,1( Nki
iiA and
)sin()( kTotal tNtv
)sin()...()sin()( 211
kNii
N
iTotal tAAANtAtv
2NPTotal
222 )]sin([)]([ kTotal tNtv
EIRPPTotal
2NEIRP

20
• 25 -12m Dishes
• Tx Power/Dish 5kW
• Total Diameter = 484.6m
• X and Ka Bands
Elevation = 85o
Power Density (mW/cm2)vs
Range from Array (km)
FAA regulations require coordination for Power Density ≥ 10 mW/cm2

21
Power Density Patterns (mW/cm2 )25 Dishes Elevation 85o 8.4 GHz
Far-field of
Single DishPeak = 0.749
mW/cm2
Left Right Distance to
Target: 8070m
to 13158km
At Far-field of
ArrayPeak = 0.000
mW/cm2
FAA regulations require coordination for Power Density ≥ 10 mW/cm2

22
Power Density vs Range (mW/cm2 vs km)25 Dishes Elevation 85o 8.4 GHz
1.9e-4 mW/cm2
Far-field of
Single DishPeak = 0.749
mW/cm2
At Far-field of
ArrayPeak = 0.000
mW/cm2

23
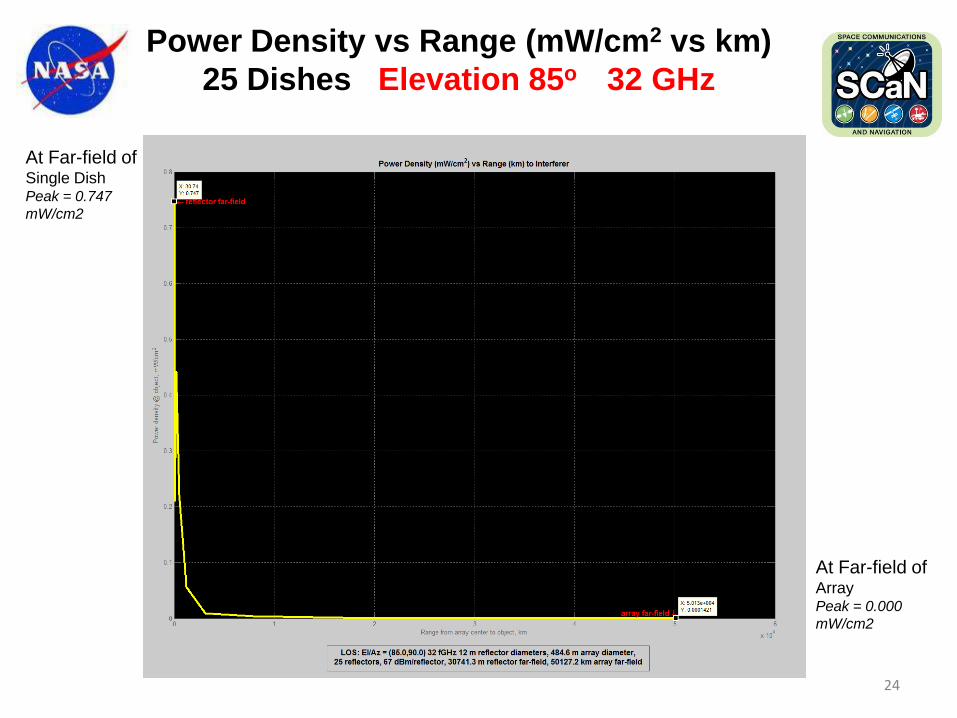
Power Density Patterns (mW/cm2 )
25 Dishes Elevation 85o 32 GHz
At Far-field of Single DishPeak = 0.747
mW/cm2
At Far-field of ArrayPeak = 0.000
mW/cm2
Left Right Distance to
Target: 31 km to
50127km
FAA regulations require coordination for Power Density ≥ 10 mW/cm2
24
Power Density vs Range (mW/cm2 vs km)
25 Dishes Elevation 85o 32 GHz
1.9e-4 mW/cm2
At Far-field of Single DishPeak = 0.747
mW/cm2
At Far-field of ArrayPeak = 0.000
mW/cm2

25
• 25 -12m Dishes
• Tx Power/Dish 5kW
• Total Diameter = 484.6m
• X and Ka Bands
Elevation = 5o
Power Density (mW/cm2)vs
Range from Array (km)
FAA regulations require coordination for Power Density ≥ 10 mW/cm2
26
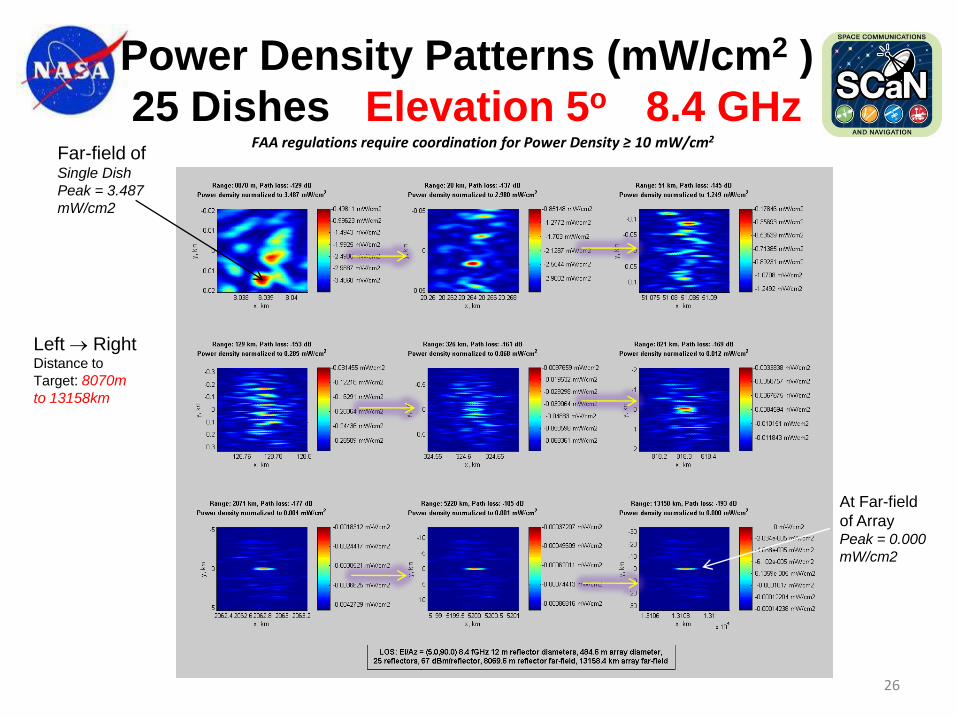
Power Density Patterns (mW/cm2 )
25 Dishes Elevation 5o 8.4 GHzFar-field of Single Dish
Peak = 3.487
mW/cm2
At Far-field
of ArrayPeak = 0.000
mW/cm2
Left Right Distance to
Target: 8070m
to 13158km
FAA regulations require coordination for Power Density ≥ 10 mW/cm2
27
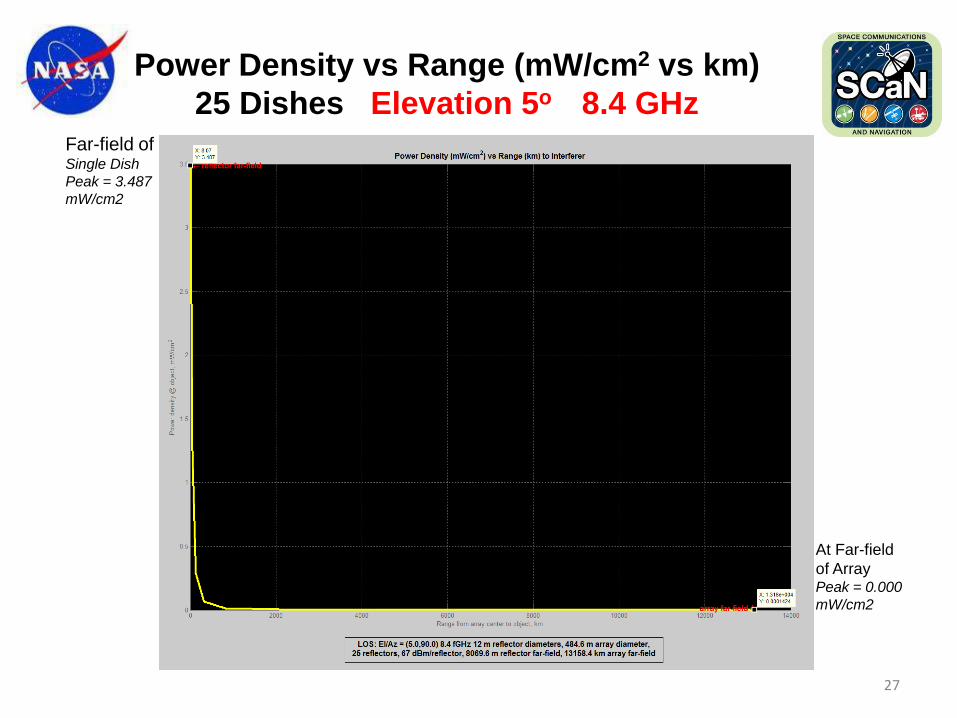
Power Density vs Range (mW/cm2 vs km)
25 Dishes Elevation 5o 8.4 GHzFar-field of Single Dish
Peak = 3.487
mW/cm2
At Far-field
of ArrayPeak = 0.000
mW/cm2

28
Power Density Patterns (mW/cm2 )
25 Dishes Elevation 5o 32 GHz
At Far-field of
Single DishPeak = 3.488
mW/cm2
At Far-field
of ArrayPeak = 0.000
mW/cm2
Left Right Distance to
Target: 31 km to
50127km
FAA regulations require coordination for Power Density ≥ 10 mW/cm2

29
Power Density vs Range (mW/cm2 vs km)
25 Dishes Elevation 5o 32 GHz
At Far-field
of ArrayPeak = 0.000
mW/cm2
At Far-field of
Single DishPeak = 3.488
mW/cm2