nEmesis: Which Restaurants Should You Avoid Today? · nEmesis: Which Restaurants Should You Avoid...
9
nEmesis: Which Restaurants Should You Avoid Today? Adam Sadilek * Google Mountain View, CA [email protected] Sean Brennan University of Rochester Rochester, NY [email protected] Henry Kautz University of Rochester Rochester, NY [email protected] Vincent Silenzio University of Rochester Rochester, NY [email protected] Abstract Computational approaches to health monitoring and epi- demiology continue to evolve rapidly. We present an end-to-end system, nEmesis, that automatically identi- fies restaurants posing public health risks. Leveraging a language model of Twitter users’ online communica- tion, nEmesis finds individuals who are likely suffering from a foodborne illness. People’s visits to restaurants are modeled by matching GPS data embedded in the messages with restaurant addresses. As a result, we can assign each venue a “health score” based on the pro- portion of customers that fell ill shortly after visiting it. Statistical analysis reveals that our inferred health score correlates (r =0.30) with the official inspection data from the Department of Health and Mental Hygiene (DOHMH). We investigate the joint associations of mul- tiple factors mined from online data with the DOHMH violation scores and find that over 23% of variance can be explained by our factors. We demonstrate that read- ily accessible online data can be used to detect cases of foodborne illness in a timely manner. This approach offers an inexpensive way to enhance current methods to monitor food safety (e.g., adaptive inspections) and identify potentially problematic venues in near-real time. Introduction Every day, many people fall ill due to foodborne disease. Annually, three thousand of these patients die from the infec- tion in the United States alone (CDC 2013). We argue in this paper that many of these occurrences are preventable. We present and validate nEmesis—a scalable approach to data- driven epidemiology that captures a large population with fine granularity and in near-real time. We are able to do this by leveraging vast sensor networks composed of users of online social media, who report—explicitly as well as implicitly— on their activities from their smart phones. We accept the inherent noise and ambiguity in people’s online communica- tion and develop statistical techniques that overcome some of the challenges in this space. As a result, nEmesis extracts important signals that enable individuals to make informed decisions (e.g., “What is the probability that I will get sick * Adam performed this work at the University of Rochester. Copyright c 2013, Association for the Advancement of Artificial Intelligence (www.aaai.org). All rights reserved. Figure 1: nEmesis analyses people’s online messages and reveals individuals who may be suffering from a foodborne disease. Pre- cise geo coordinates embedded in the messages enable us to detect specific restaurants a user had visited prior to falling ill. This fig- ure shows a sample of users in New York City. Their most recent location is shown on the map and their likelihood of suffering from a foodborne illness is color-coded from low (green) to high (red). nEmesis enables tracking of possible health risks in a timely and scalable fashion. if I eat lunch here?”) and opens new opportunities for public health management (e.g., “Given a limited budget, which restaurants should we inspect today?”). Recent work in computational epidemiology and ma- chine learning has demonstrated that online social me- dia enable novel surveillance and modeling tools (Lam- pos, De Bie, and Cristianini 2010; Paul and Dredze 2011a; Sadilek and Kautz 2013). Most research to date has fo- cused on estimating aggregate “flu trends” in a large geo- graphical area, typically at the national level. Researchers have shown that Internet data can be used to compute es- timates of flu prevalence that correlate with the official Centers for Disease Control (CDC) statistics, but can be obtained in a more timely manner (Ginsberg et al. 2008; Signorini, Segre, and Polgreen 2011; Achrekar et al. 2012; Sadilek, Kautz, and Silenzio 2012b). Flu outbreaks can in some cases be even predicted by modeling the flow of infected airline passengers through their tweets (Brennan,
Transcript of nEmesis: Which Restaurants Should You Avoid Today? · nEmesis: Which Restaurants Should You Avoid...

nEmesis: Which Restaurants Should You Avoid Today?
Adam Sadilek∗
GoogleMountain View, CA
Sean BrennanUniversity of Rochester
Rochester, [email protected]
Henry KautzUniversity of Rochester
Rochester, [email protected]
Vincent SilenzioUniversity of Rochester
Rochester, [email protected]
Abstract
Computational approaches to health monitoring and epi-demiology continue to evolve rapidly. We present anend-to-end system, nEmesis, that automatically identi-fies restaurants posing public health risks. Leveraginga language model of Twitter users’ online communica-tion, nEmesis finds individuals who are likely sufferingfrom a foodborne illness. People’s visits to restaurantsare modeled by matching GPS data embedded in themessages with restaurant addresses. As a result, we canassign each venue a “health score” based on the pro-portion of customers that fell ill shortly after visitingit. Statistical analysis reveals that our inferred healthscore correlates (r = 0.30) with the official inspectiondata from the Department of Health and Mental Hygiene(DOHMH). We investigate the joint associations of mul-tiple factors mined from online data with the DOHMHviolation scores and find that over 23% of variance canbe explained by our factors. We demonstrate that read-ily accessible online data can be used to detect casesof foodborne illness in a timely manner. This approachoffers an inexpensive way to enhance current methodsto monitor food safety (e.g., adaptive inspections) andidentify potentially problematic venues in near-real time.
IntroductionEvery day, many people fall ill due to foodborne disease.Annually, three thousand of these patients die from the infec-tion in the United States alone (CDC 2013). We argue in thispaper that many of these occurrences are preventable. Wepresent and validate nEmesis—a scalable approach to data-driven epidemiology that captures a large population with finegranularity and in near-real time. We are able to do this byleveraging vast sensor networks composed of users of onlinesocial media, who report—explicitly as well as implicitly—on their activities from their smart phones. We accept theinherent noise and ambiguity in people’s online communica-tion and develop statistical techniques that overcome someof the challenges in this space. As a result, nEmesis extractsimportant signals that enable individuals to make informeddecisions (e.g., “What is the probability that I will get sick
∗Adam performed this work at the University of Rochester.Copyright c© 2013, Association for the Advancement of ArtificialIntelligence (www.aaai.org). All rights reserved.
Figure 1: nEmesis analyses people’s online messages and revealsindividuals who may be suffering from a foodborne disease. Pre-cise geo coordinates embedded in the messages enable us to detectspecific restaurants a user had visited prior to falling ill. This fig-ure shows a sample of users in New York City. Their most recentlocation is shown on the map and their likelihood of suffering froma foodborne illness is color-coded from low (green) to high (red).nEmesis enables tracking of possible health risks in a timely andscalable fashion.
if I eat lunch here?”) and opens new opportunities for publichealth management (e.g., “Given a limited budget, whichrestaurants should we inspect today?”).
Recent work in computational epidemiology and ma-chine learning has demonstrated that online social me-dia enable novel surveillance and modeling tools (Lam-pos, De Bie, and Cristianini 2010; Paul and Dredze 2011a;Sadilek and Kautz 2013). Most research to date has fo-cused on estimating aggregate “flu trends” in a large geo-graphical area, typically at the national level. Researchershave shown that Internet data can be used to compute es-timates of flu prevalence that correlate with the officialCenters for Disease Control (CDC) statistics, but can beobtained in a more timely manner (Ginsberg et al. 2008;Signorini, Segre, and Polgreen 2011; Achrekar et al. 2012;Sadilek, Kautz, and Silenzio 2012b). Flu outbreaks canin some cases be even predicted by modeling the flow ofinfected airline passengers through their tweets (Brennan,
Sadilek, and Kautz 2013). This paper extends prior workbeyond influenza-like disease, focusing on foodborne illnessthat afflicts specific individuals at specific venues.
The field of human computation (also referred to as crowd-sourcing) has made significant progress in recent years (Ka-mar, Hacker, and Horvitz 2012). Along the way, it has beenshown in a number of domains that the crowd can often actmore effectively and accurately than even the best individual(i.e., the “expert”). Successes with leveraging the crowd haveinfluenced thinking within a wide range of disciplines, frompsychology to machine learning, and include work on crowd-sourcing diverse tasks such as text editing (Bernstein et al.2010), image labeling (Von Ahn and Dabbish 2004), speechtranscription (Lasecki et al. 2012), language translation (Sha-haf and Horvitz 2010), software development (Little andMiller 2006), protein folding (Khatib et al. 2011), and pro-viding new forms of accessibility for the disabled (Bigham etal. 2010).
This paper explores the intersection of three fields: humancomputation, machine learning, and computational epidemi-ology. We focus on real-time modeling of foodborne illness—a significant health challenge in the developing and devel-oped world. Harnessing human and machine intelligence ina unified way, we develop an automated language modelthat detects individuals who likely suffer from a foodbornedisease, on the basis of their online Twitter communication.By leveraging the global positioning system (GPS) data ofeach Twitter user and known locations of every restaurantin New York City (NYC), we detect users’ restaurant visitspreceding the onset of a foodborne illness. As a result, wecan assign each restaurant a “health score” based on the pro-portion of Twitter customers that fell ill shortly after visitingthe restaurant.
As we will see, our inferred health score correlates (r =0.30, p-value of 6 × 10⁻⁴) with the official inspectiondata from the Department of Health and Mental Hygiene(DOHMH). Additionally, we investigate the joint effect ofmultiple factors mined from online data on the DOHMHviolation scores and find that over 23% of variance in theofficial statistics can be explained by factors inferred fromonline social media.
Achieving these encouraging results would be difficultwithout joint human and machine effort. Humans could notkeep up with the average rate of 9,100 tweets per secondthat are produced globally,1 resulting in very sparsely labeleddata. Since foodborne illness is (fortunately) rare, even 99%coverage would not be enough to get a reliable signal. At thesame time, the complexity of natural language would preventmachines from making sense of the data. While machines caneasily provide full coverage, the signal to noise ratio wouldbe too low to maintain adequate sensitivity and specificity.We show in this paper that including human workers andmachines in a common loop cancels each others’ weaknessesand results in a reliable model of foodborne disease.
1http://www.statisticbrain.com/twitter-statistics/
Significance of ResultsWe harness human computation on two different levels. Oneis the aforementioned explicit crowdsourcing of data labelingby online workers. The second—more subtle—level lever-ages the implicit human computation performed by hundredsof millions of users of online social media every day. Theseusers make up an “organic” sensor network—a dynamic meshof sensors interconnected with people facilitated by Internet-enabled phones. A single status update often contains notonly the text of the message itself, but also location, a photojust taken, relationships to other people, and other informa-tion. The text contains a nugget of human computation aswell—describing what the person thought or saw.
This paper concentrates on extracting useful and depend-able signals from snippets of human computation that usersperform every time they post a message. We do this via am-bient tracking and inference over online data. The inferenceitself is in part enabled by explicit crowdsourcing.
It is essential to capture the organic sensor network com-putationally. A single user complaining about acute foodpoisoning has a small impact on the behavior of others. Evenmessages from very popular individuals (barring celebrities)reach relatively few followers. However, an automated sys-tem like nEmesis that tracks a large online population canfind important patterns, even when they require stitching to-gether subtle signals from low-profile users. By placing thesignal in context (e.g., by matching the message with a rel-evant restaurant), a seemingly random collection of onlinerants suddenly becomes an actionable alert.
We believe the pervasiveness of Internet-enabled mobiledevices has reached a critical point that enables novel ap-plications that help people make more informed decisions.nEmesis is one specific example of such an application.
In the remainder of the paper, we will discuss the broadercontext of this research, describe in detail our methodologyand models, report key findings, and discuss the results.
Background and Related WorkTwitter is a widely used online social network and a particu-larly popular source of data for its real-time nature and openaccess (Smith 2011). Twitter users post message updates(tweets) up to 140 characters long. Twitter launched in 2006and has been experiencing an explosive growth since then.As of April 2012, over 500 million accounts were registeredon Twitter.
Researchers have shown that Twitter data can be used notonly for flu tracking, but also for modeling mental health(Golder and Macy 2011; De Choudhury et al. 2013), andgeneral public health (Paul and Dredze 2011b). Much workhas been done outside the medical domain as well. Twitterdata has been leveraged to predict movie box office revenues(Asur and Huberman 2010), election outcomes (Tumasjanet al. 2010), and other phenomena. Globally, the prevalenceof social media usage is significant, and is increasing: 13%of online adults use Twitter, most of them daily and oftenvia a phone (Smith 2011). These mobile users often attachtheir current GPS location to each tweet, thereby creatingrich datasets of human mobility and interactions.
Foodborne illness, also known colloquially as food poi-soning, is any illness resulting from the consumption ofpathogenic bacteria, viruses, or parasites that contaminatefood, as well as the consumption of chemical or natural tox-ins, such as poisonous mushrooms. The most common symp-toms include vomiting, diarrhea, abdominal pain, fever, andchills. These symptoms can be mild to serious, and maylast from hours to several days. Typically, symptoms appearwithin hours, but may also occur days or even weeks afterexposure to the pathogen (J Glenn Morris and Potter 2013).Some pathogens can also cause symptoms of the nervous sys-tem, including headache, numbness or tingling, blurry vision,weakness, dizziness, and even paralysis. According to theU.S. Food and Drug Administration (FDA), the vast majorityof these symptoms will occur within three days (FDA 2012).
The CDC estimates that 47.8 million Americans (roughly 1in 6 people) are sickened by foodborne disease every year. Ofthat total, nearly 128,000 people are hospitalized, while justover 3,000 die of foodborne diseases (CDC 2013). The CDCclassifies cases of foodborne illness according to whether theyare caused by one of 31 known foodborne illness pathogens orby unspecified agents. The known pathogens account for 9.4million (20% of the total) cases of food poisoning each year,while the remaining 38.4 million cases (80% of the total) arecaused by unspecified agents. Of the 31 known pathogens,the top five (Norovirus, Salmonella, Clostridium perfringens,Campylobacter species, and Staphylococcus aureus) accountfor 91% of the cases (CDC 2013). The economic burden ofhealth losses resulting from foodborne illness are staggering—$78 billion annually in the U.S. alone (Scharff 2012).
Public health authorities use an array of surveillance sys-tems to monitor foodborne illness. The CDC relies heavilyon data from state and local health agencies, as well as morerecent systems such as sentinel surveillance systems and na-tional laboratory networks, which help improve the qualityand timeliness of data (CDC 2013). The NYC Department ofHealth carries out unannounced sanitary inspections. Eachrestaurant in NYC is inspected at least once a year and re-ceives a violation score (higher score means more problemsrecorded by the inspector) (Farley 2011).
An example of the many systems in use by CDC would in-clude the Foodborne Diseases Active Surveillance Network,referred to as FoodNet. FoodNet is a sentinel surveillancesystem using information provided from sites in 10 states,covering about 15% of the US population, to monitor ill-nesses caused by seven bacteria or two parasites commonlytransmitted through food. Other systems include the NationalAntimicrobial Resistance Monitoring Systementeric bacte-ria (NARMS), the National Electronic Norovirus OutbreakNetwork (CaliciNet), and the National Molecular Subtyp-ing Network for Foodborne Disease Surveillance (PulseNet),among many others.
A major challenge in monitoring foodborne illness is incapturing actionable data in real time. Like all disease surveil-lance programs, each of the systems currently in use by CDCto monitor foodborne illness entails significant costs andtime lags between when cases are identified and the data isanalyzed and reported.
Support vector machine (SVM) is an established model
of data in machine learning (Cortes and Vapnik 1995). Welearn an SVM for linear binary classification to accurately dis-tinguish between tweets indicating the author is afflicted byfoodborne disease and all other tweets. Linear binary SVMsare trained by finding a hyperplane defined by a normal vec-tor with the maximal margin separating it from the positiveand negative datapoints.
Finding such a hyperplane is inherently a quadratic opti-mization problem given by the following objective functionthat can be solved efficiently and in a parallel fashion usingstochastic gradient descent methods (Shalev-Shwartz, Singer,and Srebro 2007).
minw
λ
2||w||2 + L(w,D) (1)
where λ is a regularization parameter controlling model com-plexity, and L(w,D) is the hinge-loss over all training dataD given by
L(w,D) =∑i
max(0, 1− yiwTxi
)(2)
Class imbalance, where the number of examples in one classis dramatically larger than in the other class, complicatesvirtually all machine learning. For SVMs, prior work hasshown that transforming the optimization problem from thespace of individual datapoints 〈xi, yi〉 in matrix D to oneover pairs of examples
⟨x+i − x
−j , 1
⟩yields significantly
more robust results (Joachims 2005).Active learning is a machine learning approach, where
the training data is provided adaptively. The model we areinducing typically ranks unlabeled data according to the ex-pected information gain and requests labels for top-k exam-ples, given budget constraints (Settles 2010). The labels aretypically provided by a single human expert. In a numberof domains, active learning has been repeatedly shown toachieve the same level of model quality while requiring onlya fraction of (often exponentially less) labeled data, as com-pared to nonadaptive (“label all”) learning approaches (Cohn,Atlas, and Ladner 1994).
MethodsThis section describes in detail our method of leveraging hu-man and machine computation to learn an accurate languagemodel of foodborne disease, which is subsequently used todetect restaurants that could pose health risks. We begin bydescribing our data collection system, then turn to our activedata labeling framework that leverages human as well as ma-chine intelligence, and finally concentrate on the inductionand application of the language model itself.
Data CollectionWe have obtained a database of all restaurant inspectionsconducted by the Department of Health and Mental Hygienein New York City. A total of 24,904 restaurants have beenrecently inspected at least once and appear in the database.
As each inspection record contains the name and addressof the restaurant, we used Google Maps2 to obtain exact GPS
2https://developers.google.com/maps/documentation/geocoding/
coordinates for each venue. We then use the location to tietogether users and restaurants in order to estimate visits. Wesay that a user visited a restaurant if he or she appeared within25 meters of the venue at a time the restaurant was likelyopen, considering typical operating hours for different typesof food establishments.
Since foodborne disease is not necessarily contracted ata venue already recorded in the DOHMH database, futurework could explore the interesting problem of finding undoc-umented venues that pose health hazards. This could be doneby analyzing visits that appear to be—at first sight—falsenegatives. As the food industry is becoming increasinglymobile (e.g., food trucks and hot dog stands), its health im-plications are more difficult to capture. We believe onlinesystems based on methods presented in this paper will be animportant component of future public health management.
Using the Twitter Search API3, we collected a sampleof public tweets that originated from the New York Citymetropolitan area. The collection period ran from December26, 2012 to April 25, 2013. We periodically queried Twitterfor all recent tweets within 100 kilometers of the NYC citycenter in a distributed fashion.
Twitter users may alternate between devices, not necessar-ily publishing their location every time. Whenever nEmesisdetects a person visiting a restaurant it spawns a separate datacollection process that listens for new tweets from that person.This captures scenarios where someone tweets from a restau-rant using a mobile device, goes home, and several hourslater tweets from a desktop (without GPS) about feeling ill.
The GPS noise could lead to false positive as well as falsenegative visits. We validate our visit detector by analyzingdata for restaurants that have been closed by DOHMH be-cause of severe health violations. A significant drop in visitsoccurs in each venue after its closure. Furthermore, someusers explicitly “check-in” to a restaurant using services suchas FourSquare that are often tied to a user’s Twitter account.As each check-in tweet contains venue name and a GPS tag,we use them to validate our visit detector. 97.2% of the ex-plicit 4,108 restaurant check-ins are assigned to the correctrestaurant based on GPS alone.
Altogether, we have logged over 3.8 million tweets au-thored by more than 94 thousand unique users who producedat least one GPS-tagged message. Out of these users, over23 thousand visited at least one restaurant during the datacollection period. We did not consider users who did notshare any location information as we cannot assign them torestaurants. To put these statistics in context, the entire NYCmetropolitan area has an estimated population of 19 millionpeople.4 Table 1 summarizes our dataset.
Labeling Data at ScaleTo scale the laborious process of labeling training data forour language model, we turn to Amazon’s Mechanical Turk.5Mechanical Turk allows requesters to harness the power ofthe crowd in order to complete a set of human intelligence
3http://search.twitter.com/api/4http://www.census.gov/popest/metro/5https://www.mturk.com/
Restaurants in DOHMH inspection database 24,904Restaurants with at least one Twitter visit 17,012Restaurants with at least one sick Twitter visit 120Number of tweets 3,843,486Number of detected sick tweets 1,509Sick tweets associated with a restaurant 479Number of unique users 94,937Users who visited at least one restaurant 23,459
Table 1: Summary statistics of the data collected from NYC. Notethat nearly a third of the messages indicating foodborne disease canbe traced to a restaurant.
tasks (HITs). These HITs are then completed online by hiredworkers (Mason and Suri 2012).
We formulated the task as a series of short surveys, each25 tweets in length. For each tweet, we ask “Do you thinkthe author of this tweet has an upset stomach today?”. Thereare three possible responses (“Yes”, “No”, “Can’t tell”), outof which a worker has to choose exactly one.
We paid the workers 1 cent for every tweet evaluated,making each survey 25 cents in total. Each worker was al-lowed to label a given tweet only once. The order of tweetswas randomized. Each survey was completed by exactly fiveworkers independently. This redundancy was added to reducethe effect of workers who might give erroneous or outrightmalicious responses. Inter-annotator agreement measuredby Cohen’s κ is 0.6, considered a moderate to substantialagreement in the literature (Landis and Koch 1977).
For each tweet, we calculate the final label by adding upthe five constituent labels provided by the workers (Yes= 1,No= −1, Can’t tell= 0). In the event of a tie (0 score), weconsider the tweet healthy in order to obtain a high-precisiondataset.
Human Guided Machine Learning. Given that tweets in-dicating foodborne illness are relatively rare, learning a robustlanguage model poses considerable challenges (Japkowiczand others 2000; Chawla, Japkowicz, and Kotcz 2004). Thisproblem is called class imbalance and complicates virtuallyall machine learning. In the world of classification, modelsinduced in a skewed setting tend to simply label all data asmembers of the majority class. The problem is compoundedby the fact that the minority class (sick tweets) are often ofgreater interest than the majority class.
We overcome class imbalance faced by nEmesis through acombination of two techniques: human guided active learn-ing, and learning a language model that is robust under classimbalance. We cover the first technique in this section anddiscuss the language model induction in the following sec-tion.
Previous research has shown that under extreme class im-balance, simply finding examples of the minority class andproviding them to the model at learning time significantlyimproves the resulting model quality and reduces humanlabeling cost (Attenberg and Provost 2010). In this work,we present a novel, scalable, and fully automated learningmethod—called human guided machine learning—that con-siderably reduces the amount of human effort required toreach any given level of model quality, even when the num-
ber of negatives is many orders of magnitude larger thanthe number of positives. In our domain, the ratio of sick tohealthy tweets is roughly 1:2,500.
In each human guided learning iteration, nEmesis samplesrepresentative and informative examples to be sent for humanreview. As the focus is on the minority class examples, wesample 90% of tweets for a given labeling batch from thetop 10% of the most likely sick tweets (as predicted by ourlanguage model). The remaining 10% is sampled uniformlyat random to increase diversity. We use the HITs describedabove to obtain the labeled data.
In parallel with this automated process, we hire workers toactively find examples of tweets in which the author indicateshe or she has an upset stomach. We asked them to paste adirect link to each tweet they find into a text box. Workers re-ceived a base pay of 10 cents for accepting the task, and weremotivated by a bonus of 10 cents for each unique relevanttweet they provided. Each wrong tweet resulted in a 10 centdeduction from the current bonus balance of a worker. Tweetsjudged to be too ambiguous were neither penalized nor re-warded. Overall, we have posted 50 HITs that resulted in1,971 submitted tweets (mean of 39.4 per worker). Removingduplicates yielded 1,176 unique tweets.
As a result, we employ human workers that “guide” theclassifier induction by correcting the system when it makeserroneous predictions, and proactively seeking and labelingexamples of the minority classes. Thus, people and machineswork together to create better models faster.
In the following section, we will see how a combination ofhuman guided learning and active learning in a loop with amachine model leads to significantly improved model quality.
Learning Language Model of Foodborne IllnessAs a first step in modeling potentially risky restaurants, weneed to identify Twitter messages that indicate the authoris afflicted with a foodborne disease at the time of postingthe message. Recall that these messages are rare within themassive stream of tweets.
We formulate a semi-supervised cascade-based approachto learning a robust support vector machine (SVM) classifierwith a large area under the ROC curve (i.e., consistentlyhigh precision and high recall). We learn an SVM for linearbinary classification to accurately distinguish between tweetsindicating the author is afflicted by foodborne illness (we callsuch tweets “sick”), and all other tweets (called “other” or“normal”).
In order to learn such a classifier, we ultimately need toeffortlessly obtain a high-quality set of labeled training data.We achieve this via the following “bootstrapping” process,shown in Fig. 2.
We begin by creating a simple keyword-matching modelin order to obtain a large corpus of tweets that are potentiallyrelevant to foodborne illness. The motivation is to producean initial dataset with relatively high recall, but low precisionthat can be subsequently refined by a combination of hu-man and machine computation. The keyword model contains27 regular expressions matching patterns such as “stomachache”, “throw up”, “Mylanta”, or “Pepto Bismol”. Each reg-ular expression matches many variations on a given phrase,
accounting for typos and common misspellings, capitaliza-tion, punctuation, and word boundaries. We created the listof patterns in consultation with a medical expert, and refer-ring to online medical ontologies, such as WebMD.com, thatcurate information on diagnosis, symptoms, treatments, andother aspects of foodborne illness.
Each tweet in our corpus C containing 3.8 million collectedtweets is ranked based on how many regular expressionsmatch it (step 1 in Fig. 2). We then take the top 5,800 tweetsalong with a uniform sample of 200 tweets and submit aHIT to label them, as described in the previous section. Thisyields a high-quality corpus of 6,000 labeled tweets (step 2).
We proceed by training two different binary SVM classi-fiers, Ms and Mo, using the SVMlight package (step 3).6 Ms
is highly penalized for inducing false positives (mistakenlylabeling a normal tweet as one about sickness), whereas Mo
is heavily penalized for creating false negatives (labelingsymptomatic tweets as normal). We train Ms and Mo usingthe dataset of 6,000 tweets, each labeled as either “sick” or“other”. We then select the bottom 10% of the scores predictedby Mo (i.e., tweets that are normal with high probability),and the top 10% of scores predicted by Ms (i.e., likely “sick”tweets).
The intuition behind this cascading process is to extracttweets that are with high confidence about sickness withMs, and tweets that are almost certainly about other topicswith Mo from the corpus C. We further supplement the finalcorpus with messages from a sample of 200 million tweets(disjoint from C) that Mo classified as “other” with highprobability. We apply thresholding on the classification scoresto reduce the noise in the cascade.
At this point, we begin to iterate the human guided activelearning loop shown in the gray box in Fig. 2. The cycleconsists of learning an updated model M from availabletraining data (step 4), labeling new examples, and finallyusing our active learning strategy described above to obtainlabeled tweets from human workers (steps 5 and 6). Thisprocess is repeated until sufficient model quality is obtained,as measured on an independent evaluation set.
As features, the SVM models use all uni-gram, bi-gram,and tri-gram word tokens that appear in the training data. Forexample, a tweet “My tummy hurts.” is represented by thefollowing feature vector:(
my, tummy, hurts,my tummy, tummy hurts,my tummy hurts
).
Prior to tokenization, we convert all text to lower case andstrip punctuation. Additionally, we replace mentions of usernames (the “@” tag) with a special @MENTION token, and allweb links with a @LINK token. We do keep hashtags (suchas #upsetstomach), as those are often relevant to the author’shealth state, and are particularly useful for disambiguation ofshort or ill-formed messages. When learning the final SVMM , we only consider tokens that appear at least three timesin the training set. Table 2 lists the most significant positiveand negative features M found.
While our feature space has a very high dimensionality (Moperates in more than one million dimensions), with many
6http://svmlight.joachims.org/
Corpus of 6,000 labeled
tweets
Mo
Ms
Training
Training Labeling
Corpus of "other" tweets
Corpus of "sick" tweets
+
UpdateCLabeling
MTraining
Rank tweets by regular expression relevance
Human workers label top-5800 tweets + random
sample of 200 tweets
C
C
Active learning
Workers label sampled tweets
& search for sick tweets
Labe
ling
C
Corpus C of 3.8M tweets
1 2
34
65
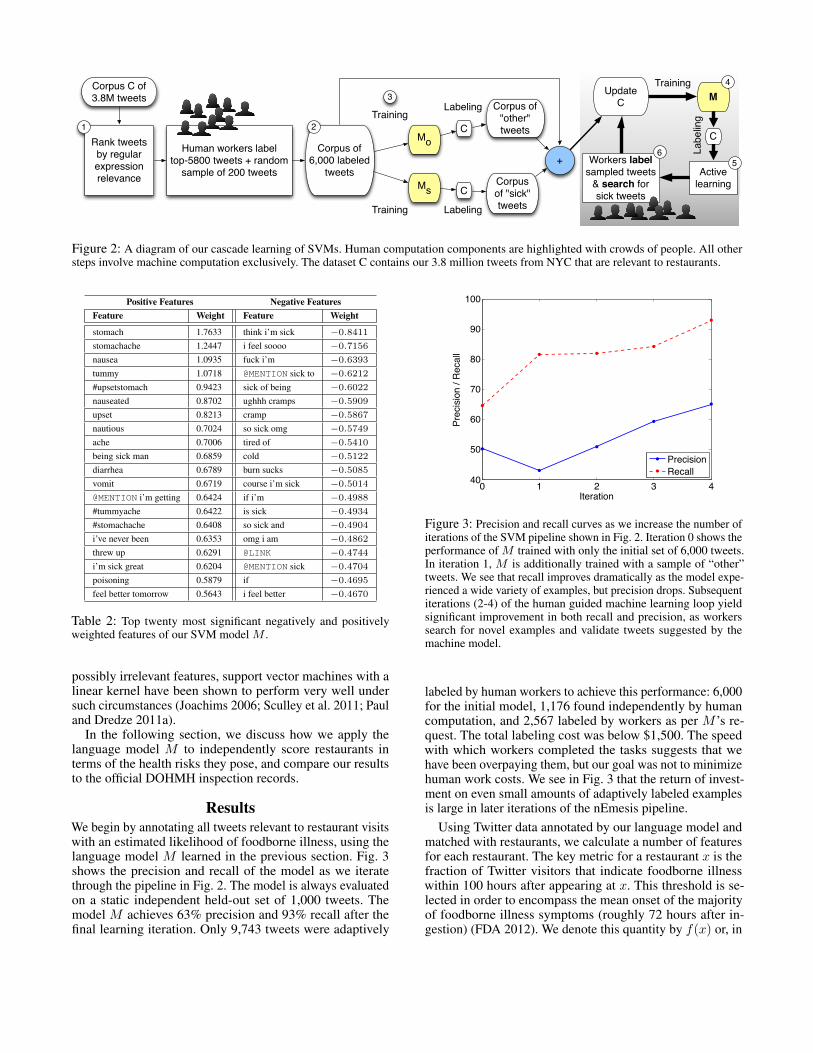
Figure 2: A diagram of our cascade learning of SVMs. Human computation components are highlighted with crowds of people. All othersteps involve machine computation exclusively. The dataset C contains our 3.8 million tweets from NYC that are relevant to restaurants.
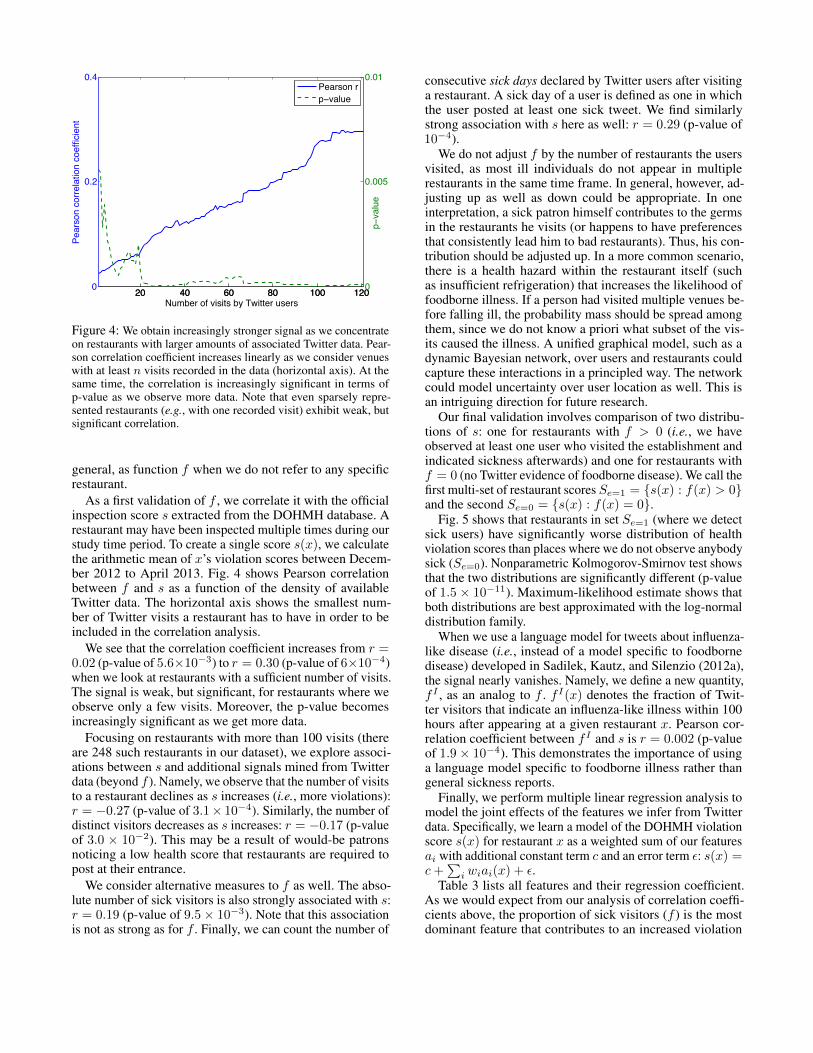
Positive Features Negative FeaturesFeature Weight Feature Weight
stomach 1.7633 think i’m sick −0.8411
stomachache 1.2447 i feel soooo −0.7156
nausea 1.0935 fuck i’m −0.6393
tummy 1.0718 @MENTION sick to −0.6212
#upsetstomach 0.9423 sick of being −0.6022
nauseated 0.8702 ughhh cramps −0.5909
upset 0.8213 cramp −0.5867
nautious 0.7024 so sick omg −0.5749
ache 0.7006 tired of −0.5410
being sick man 0.6859 cold −0.5122
diarrhea 0.6789 burn sucks −0.5085
vomit 0.6719 course i’m sick −0.5014
@MENTION i’m getting 0.6424 if i’m −0.4988
#tummyache 0.6422 is sick −0.4934
#stomachache 0.6408 so sick and −0.4904
i’ve never been 0.6353 omg i am −0.4862
threw up 0.6291 @LINK −0.4744
i’m sick great 0.6204 @MENTION sick −0.4704
poisoning 0.5879 if −0.4695
feel better tomorrow 0.5643 i feel better −0.4670
Table 2: Top twenty most significant negatively and positivelyweighted features of our SVM model M .
possibly irrelevant features, support vector machines with alinear kernel have been shown to perform very well undersuch circumstances (Joachims 2006; Sculley et al. 2011; Pauland Dredze 2011a).
In the following section, we discuss how we apply thelanguage model M to independently score restaurants interms of the health risks they pose, and compare our resultsto the official DOHMH inspection records.
ResultsWe begin by annotating all tweets relevant to restaurant visitswith an estimated likelihood of foodborne illness, using thelanguage model M learned in the previous section. Fig. 3shows the precision and recall of the model as we iteratethrough the pipeline in Fig. 2. The model is always evaluatedon a static independent held-out set of 1,000 tweets. Themodel M achieves 63% precision and 93% recall after thefinal learning iteration. Only 9,743 tweets were adaptively
0 1 2 3 440
50
60
70
80
90
100
Iteration
Prec
isio
n / R
ecal
l
PrecisionRecall
Figure 3: Precision and recall curves as we increase the number ofiterations of the SVM pipeline shown in Fig. 2. Iteration 0 shows theperformance of M trained with only the initial set of 6,000 tweets.In iteration 1, M is additionally trained with a sample of “other”tweets. We see that recall improves dramatically as the model expe-rienced a wide variety of examples, but precision drops. Subsequentiterations (2-4) of the human guided machine learning loop yieldsignificant improvement in both recall and precision, as workerssearch for novel examples and validate tweets suggested by themachine model.
labeled by human workers to achieve this performance: 6,000for the initial model, 1,176 found independently by humancomputation, and 2,567 labeled by workers as per M ’s re-quest. The total labeling cost was below $1,500. The speedwith which workers completed the tasks suggests that wehave been overpaying them, but our goal was not to minimizehuman work costs. We see in Fig. 3 that the return of invest-ment on even small amounts of adaptively labeled examplesis large in later iterations of the nEmesis pipeline.
Using Twitter data annotated by our language model andmatched with restaurants, we calculate a number of featuresfor each restaurant. The key metric for a restaurant x is thefraction of Twitter visitors that indicate foodborne illnesswithin 100 hours after appearing at x. This threshold is se-lected in order to encompass the mean onset of the majorityof foodborne illness symptoms (roughly 72 hours after in-gestion) (FDA 2012). We denote this quantity by f(x) or, in
20 40 60 80 100 1200
0.2
0.4
Number of visits by Twitter users
Pear
son
corre
latio
n co
effic
ient
20 40 60 80 100 1200
0.005
0.01
p−va
lue
Pearson rp−value
Figure 4: We obtain increasingly stronger signal as we concentrateon restaurants with larger amounts of associated Twitter data. Pear-son correlation coefficient increases linearly as we consider venueswith at least n visits recorded in the data (horizontal axis). At thesame time, the correlation is increasingly significant in terms ofp-value as we observe more data. Note that even sparsely repre-sented restaurants (e.g., with one recorded visit) exhibit weak, butsignificant correlation.
general, as function f when we do not refer to any specificrestaurant.
As a first validation of f , we correlate it with the officialinspection score s extracted from the DOHMH database. Arestaurant may have been inspected multiple times during ourstudy time period. To create a single score s(x), we calculatethe arithmetic mean of x’s violation scores between Decem-ber 2012 to April 2013. Fig. 4 shows Pearson correlationbetween f and s as a function of the density of availableTwitter data. The horizontal axis shows the smallest num-ber of Twitter visits a restaurant has to have in order to beincluded in the correlation analysis.
We see that the correlation coefficient increases from r =0.02 (p-value of 5.6×10⁻³) to r = 0.30 (p-value of 6×10⁻⁴)when we look at restaurants with a sufficient number of visits.The signal is weak, but significant, for restaurants where weobserve only a few visits. Moreover, the p-value becomesincreasingly significant as we get more data.
Focusing on restaurants with more than 100 visits (thereare 248 such restaurants in our dataset), we explore associ-ations between s and additional signals mined from Twitterdata (beyond f ). Namely, we observe that the number of visitsto a restaurant declines as s increases (i.e., more violations):r = −0.27 (p-value of 3.1× 10⁻⁴). Similarly, the number ofdistinct visitors decreases as s increases: r = −0.17 (p-valueof 3.0 × 10⁻²). This may be a result of would-be patronsnoticing a low health score that restaurants are required topost at their entrance.
We consider alternative measures to f as well. The abso-lute number of sick visitors is also strongly associated with s:r = 0.19 (p-value of 9.5× 10⁻³). Note that this associationis not as strong as for f . Finally, we can count the number of
consecutive sick days declared by Twitter users after visitinga restaurant. A sick day of a user is defined as one in whichthe user posted at least one sick tweet. We find similarlystrong association with s here as well: r = 0.29 (p-value of10−4).
We do not adjust f by the number of restaurants the usersvisited, as most ill individuals do not appear in multiplerestaurants in the same time frame. In general, however, ad-justing up as well as down could be appropriate. In oneinterpretation, a sick patron himself contributes to the germsin the restaurants he visits (or happens to have preferencesthat consistently lead him to bad restaurants). Thus, his con-tribution should be adjusted up. In a more common scenario,there is a health hazard within the restaurant itself (suchas insufficient refrigeration) that increases the likelihood offoodborne illness. If a person had visited multiple venues be-fore falling ill, the probability mass should be spread amongthem, since we do not know a priori what subset of the vis-its caused the illness. A unified graphical model, such as adynamic Bayesian network, over users and restaurants couldcapture these interactions in a principled way. The networkcould model uncertainty over user location as well. This isan intriguing direction for future research.
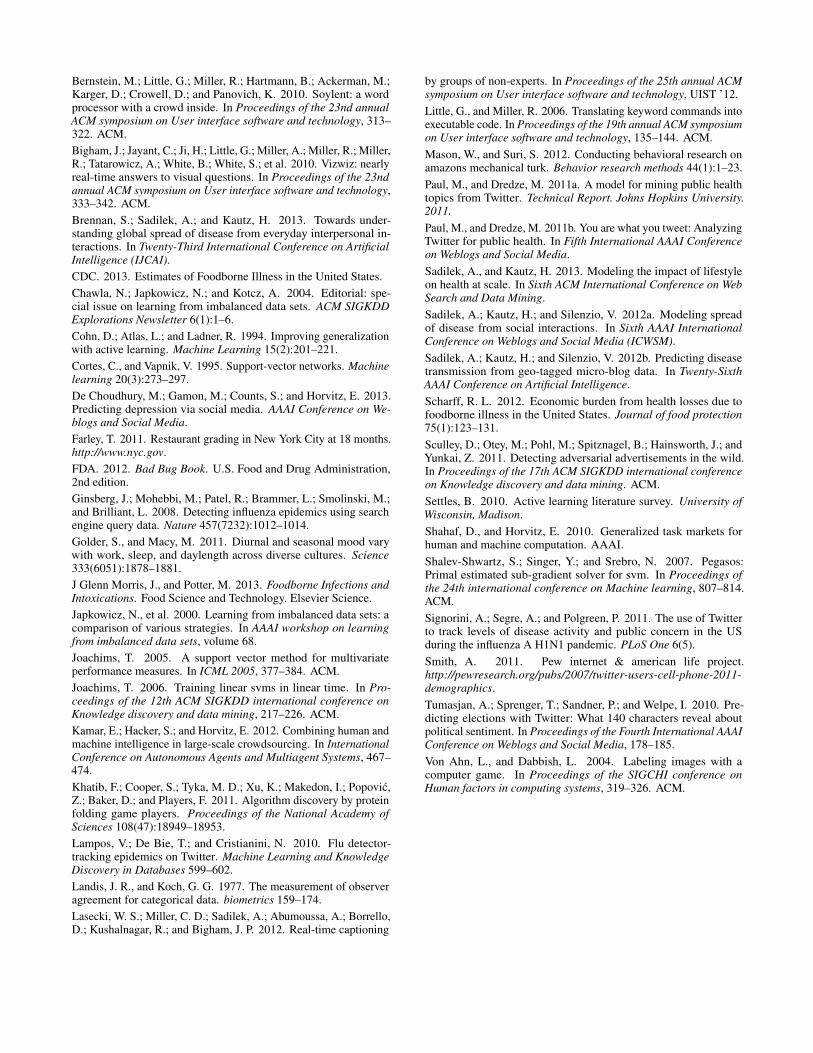
Our final validation involves comparison of two distribu-tions of s: one for restaurants with f > 0 (i.e., we haveobserved at least one user who visited the establishment andindicated sickness afterwards) and one for restaurants withf = 0 (no Twitter evidence of foodborne disease). We call thefirst multi-set of restaurant scores Se=1 = {s(x) : f(x) > 0}and the second Se=0 = {s(x) : f(x) = 0}.
Fig. 5 shows that restaurants in set Se=1 (where we detectsick users) have significantly worse distribution of healthviolation scores than places where we do not observe anybodysick (Se=0). Nonparametric Kolmogorov-Smirnov test showsthat the two distributions are significantly different (p-valueof 1.5 × 10⁻¹¹). Maximum-likelihood estimate shows thatboth distributions are best approximated with the log-normaldistribution family.
When we use a language model for tweets about influenza-like disease (i.e., instead of a model specific to foodbornedisease) developed in Sadilek, Kautz, and Silenzio (2012a),the signal nearly vanishes. Namely, we define a new quantity,f I , as an analog to f . f I(x) denotes the fraction of Twit-ter visitors that indicate an influenza-like illness within 100hours after appearing at a given restaurant x. Pearson cor-relation coefficient between f I and s is r = 0.002 (p-valueof 1.9× 10⁻⁴). This demonstrates the importance of usinga language model specific to foodborne illness rather thangeneral sickness reports.
Finally, we perform multiple linear regression analysis tomodel the joint effects of the features we infer from Twitterdata. Specifically, we learn a model of the DOHMH violationscore s(x) for restaurant x as a weighted sum of our featuresai with additional constant term c and an error term ε: s(x) =c+
∑i wiai(x) + ε.
Table 3 lists all features and their regression coefficient.As we would expect from our analysis of correlation coeffi-cients above, the proportion of sick visitors (f ) is the mostdominant feature that contributes to an increased violation
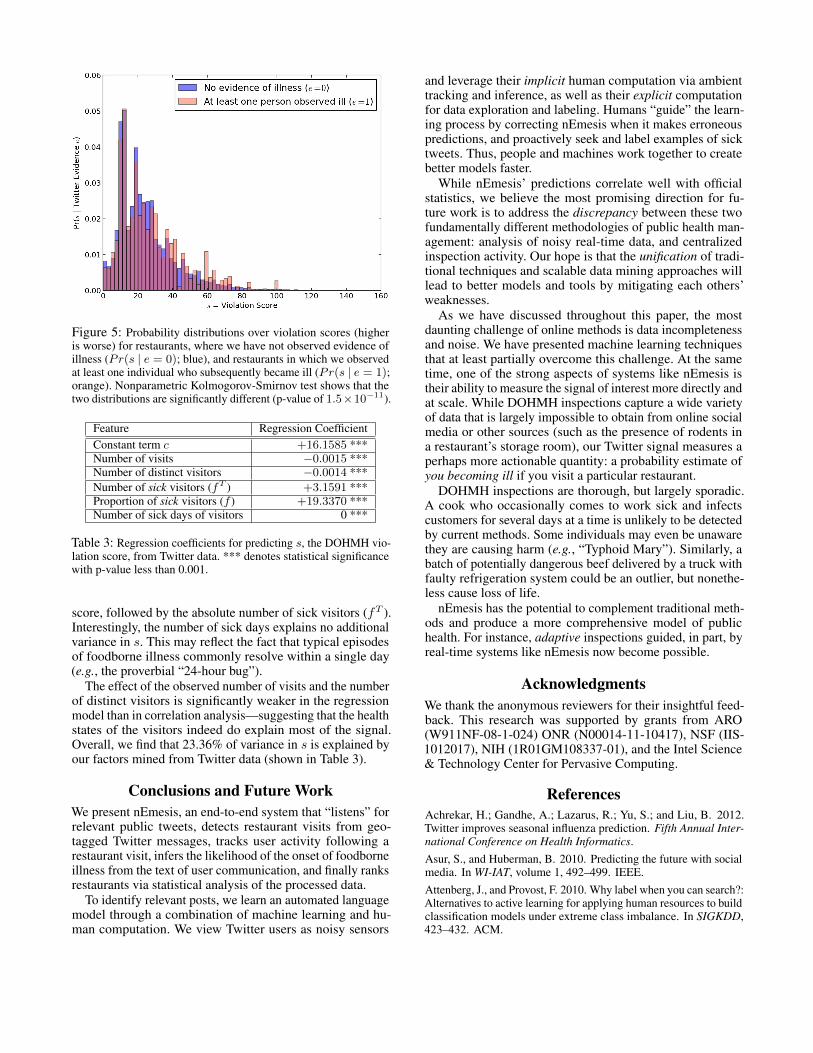
Figure 5: Probability distributions over violation scores (higheris worse) for restaurants, where we have not observed evidence ofillness (Pr(s | e = 0); blue), and restaurants in which we observedat least one individual who subsequently became ill (Pr(s | e = 1);orange). Nonparametric Kolmogorov-Smirnov test shows that thetwo distributions are significantly different (p-value of 1.5×10⁻¹¹).
Feature Regression CoefficientConstant term c +16.1585 ***Number of visits −0.0015 ***Number of distinct visitors −0.0014 ***Number of sick visitors (fT ) +3.1591 ***Proportion of sick visitors (f ) +19.3370 ***Number of sick days of visitors 0 ***
Table 3: Regression coefficients for predicting s, the DOHMH vio-lation score, from Twitter data. *** denotes statistical significancewith p-value less than 0.001.
score, followed by the absolute number of sick visitors (fT ).Interestingly, the number of sick days explains no additionalvariance in s. This may reflect the fact that typical episodesof foodborne illness commonly resolve within a single day(e.g., the proverbial “24-hour bug”).
The effect of the observed number of visits and the numberof distinct visitors is significantly weaker in the regressionmodel than in correlation analysis—suggesting that the healthstates of the visitors indeed do explain most of the signal.Overall, we find that 23.36% of variance in s is explained byour factors mined from Twitter data (shown in Table 3).
Conclusions and Future WorkWe present nEmesis, an end-to-end system that “listens” forrelevant public tweets, detects restaurant visits from geo-tagged Twitter messages, tracks user activity following arestaurant visit, infers the likelihood of the onset of foodborneillness from the text of user communication, and finally ranksrestaurants via statistical analysis of the processed data.
To identify relevant posts, we learn an automated languagemodel through a combination of machine learning and hu-man computation. We view Twitter users as noisy sensors
and leverage their implicit human computation via ambienttracking and inference, as well as their explicit computationfor data exploration and labeling. Humans “guide” the learn-ing process by correcting nEmesis when it makes erroneouspredictions, and proactively seek and label examples of sicktweets. Thus, people and machines work together to createbetter models faster.
While nEmesis’ predictions correlate well with officialstatistics, we believe the most promising direction for fu-ture work is to address the discrepancy between these twofundamentally different methodologies of public health man-agement: analysis of noisy real-time data, and centralizedinspection activity. Our hope is that the unification of tradi-tional techniques and scalable data mining approaches willlead to better models and tools by mitigating each others’weaknesses.
As we have discussed throughout this paper, the mostdaunting challenge of online methods is data incompletenessand noise. We have presented machine learning techniquesthat at least partially overcome this challenge. At the sametime, one of the strong aspects of systems like nEmesis istheir ability to measure the signal of interest more directly andat scale. While DOHMH inspections capture a wide varietyof data that is largely impossible to obtain from online socialmedia or other sources (such as the presence of rodents ina restaurant’s storage room), our Twitter signal measures aperhaps more actionable quantity: a probability estimate ofyou becoming ill if you visit a particular restaurant.
DOHMH inspections are thorough, but largely sporadic.A cook who occasionally comes to work sick and infectscustomers for several days at a time is unlikely to be detectedby current methods. Some individuals may even be unawarethey are causing harm (e.g., “Typhoid Mary”). Similarly, abatch of potentially dangerous beef delivered by a truck withfaulty refrigeration system could be an outlier, but nonethe-less cause loss of life.
nEmesis has the potential to complement traditional meth-ods and produce a more comprehensive model of publichealth. For instance, adaptive inspections guided, in part, byreal-time systems like nEmesis now become possible.
AcknowledgmentsWe thank the anonymous reviewers for their insightful feed-back. This research was supported by grants from ARO(W911NF-08-1-024) ONR (N00014-11-10417), NSF (IIS-1012017), NIH (1R01GM108337-01), and the Intel Science& Technology Center for Pervasive Computing.
ReferencesAchrekar, H.; Gandhe, A.; Lazarus, R.; Yu, S.; and Liu, B. 2012.Twitter improves seasonal influenza prediction. Fifth Annual Inter-national Conference on Health Informatics.Asur, S., and Huberman, B. 2010. Predicting the future with socialmedia. In WI-IAT, volume 1, 492–499. IEEE.Attenberg, J., and Provost, F. 2010. Why label when you can search?:Alternatives to active learning for applying human resources to buildclassification models under extreme class imbalance. In SIGKDD,423–432. ACM.
Bernstein, M.; Little, G.; Miller, R.; Hartmann, B.; Ackerman, M.;Karger, D.; Crowell, D.; and Panovich, K. 2010. Soylent: a wordprocessor with a crowd inside. In Proceedings of the 23nd annualACM symposium on User interface software and technology, 313–322. ACM.Bigham, J.; Jayant, C.; Ji, H.; Little, G.; Miller, A.; Miller, R.; Miller,R.; Tatarowicz, A.; White, B.; White, S.; et al. 2010. Vizwiz: nearlyreal-time answers to visual questions. In Proceedings of the 23ndannual ACM symposium on User interface software and technology,333–342. ACM.Brennan, S.; Sadilek, A.; and Kautz, H. 2013. Towards under-standing global spread of disease from everyday interpersonal in-teractions. In Twenty-Third International Conference on ArtificialIntelligence (IJCAI).CDC. 2013. Estimates of Foodborne Illness in the United States.Chawla, N.; Japkowicz, N.; and Kotcz, A. 2004. Editorial: spe-cial issue on learning from imbalanced data sets. ACM SIGKDDExplorations Newsletter 6(1):1–6.Cohn, D.; Atlas, L.; and Ladner, R. 1994. Improving generalizationwith active learning. Machine Learning 15(2):201–221.Cortes, C., and Vapnik, V. 1995. Support-vector networks. Machinelearning 20(3):273–297.De Choudhury, M.; Gamon, M.; Counts, S.; and Horvitz, E. 2013.Predicting depression via social media. AAAI Conference on We-blogs and Social Media.Farley, T. 2011. Restaurant grading in New York City at 18 months.http://www.nyc.gov.FDA. 2012. Bad Bug Book. U.S. Food and Drug Administration,2nd edition.Ginsberg, J.; Mohebbi, M.; Patel, R.; Brammer, L.; Smolinski, M.;and Brilliant, L. 2008. Detecting influenza epidemics using searchengine query data. Nature 457(7232):1012–1014.Golder, S., and Macy, M. 2011. Diurnal and seasonal mood varywith work, sleep, and daylength across diverse cultures. Science333(6051):1878–1881.J Glenn Morris, J., and Potter, M. 2013. Foodborne Infections andIntoxications. Food Science and Technology. Elsevier Science.Japkowicz, N., et al. 2000. Learning from imbalanced data sets: acomparison of various strategies. In AAAI workshop on learningfrom imbalanced data sets, volume 68.Joachims, T. 2005. A support vector method for multivariateperformance measures. In ICML 2005, 377–384. ACM.Joachims, T. 2006. Training linear svms in linear time. In Pro-ceedings of the 12th ACM SIGKDD international conference onKnowledge discovery and data mining, 217–226. ACM.Kamar, E.; Hacker, S.; and Horvitz, E. 2012. Combining human andmachine intelligence in large-scale crowdsourcing. In InternationalConference on Autonomous Agents and Multiagent Systems, 467–474.Khatib, F.; Cooper, S.; Tyka, M. D.; Xu, K.; Makedon, I.; Popovic,Z.; Baker, D.; and Players, F. 2011. Algorithm discovery by proteinfolding game players. Proceedings of the National Academy ofSciences 108(47):18949–18953.Lampos, V.; De Bie, T.; and Cristianini, N. 2010. Flu detector-tracking epidemics on Twitter. Machine Learning and KnowledgeDiscovery in Databases 599–602.Landis, J. R., and Koch, G. G. 1977. The measurement of observeragreement for categorical data. biometrics 159–174.Lasecki, W. S.; Miller, C. D.; Sadilek, A.; Abumoussa, A.; Borrello,D.; Kushalnagar, R.; and Bigham, J. P. 2012. Real-time captioning
by groups of non-experts. In Proceedings of the 25th annual ACMsymposium on User interface software and technology, UIST ’12.Little, G., and Miller, R. 2006. Translating keyword commands intoexecutable code. In Proceedings of the 19th annual ACM symposiumon User interface software and technology, 135–144. ACM.Mason, W., and Suri, S. 2012. Conducting behavioral research onamazons mechanical turk. Behavior research methods 44(1):1–23.Paul, M., and Dredze, M. 2011a. A model for mining public healthtopics from Twitter. Technical Report. Johns Hopkins University.2011.Paul, M., and Dredze, M. 2011b. You are what you tweet: AnalyzingTwitter for public health. In Fifth International AAAI Conferenceon Weblogs and Social Media.Sadilek, A., and Kautz, H. 2013. Modeling the impact of lifestyleon health at scale. In Sixth ACM International Conference on WebSearch and Data Mining.Sadilek, A.; Kautz, H.; and Silenzio, V. 2012a. Modeling spreadof disease from social interactions. In Sixth AAAI InternationalConference on Weblogs and Social Media (ICWSM).Sadilek, A.; Kautz, H.; and Silenzio, V. 2012b. Predicting diseasetransmission from geo-tagged micro-blog data. In Twenty-SixthAAAI Conference on Artificial Intelligence.Scharff, R. L. 2012. Economic burden from health losses due tofoodborne illness in the United States. Journal of food protection75(1):123–131.Sculley, D.; Otey, M.; Pohl, M.; Spitznagel, B.; Hainsworth, J.; andYunkai, Z. 2011. Detecting adversarial advertisements in the wild.In Proceedings of the 17th ACM SIGKDD international conferenceon Knowledge discovery and data mining. ACM.Settles, B. 2010. Active learning literature survey. University ofWisconsin, Madison.Shahaf, D., and Horvitz, E. 2010. Generalized task markets forhuman and machine computation. AAAI.Shalev-Shwartz, S.; Singer, Y.; and Srebro, N. 2007. Pegasos:Primal estimated sub-gradient solver for svm. In Proceedings ofthe 24th international conference on Machine learning, 807–814.ACM.Signorini, A.; Segre, A.; and Polgreen, P. 2011. The use of Twitterto track levels of disease activity and public concern in the USduring the influenza A H1N1 pandemic. PLoS One 6(5).Smith, A. 2011. Pew internet & american life project.http://pewresearch.org/pubs/2007/twitter-users-cell-phone-2011-demographics.Tumasjan, A.; Sprenger, T.; Sandner, P.; and Welpe, I. 2010. Pre-dicting elections with Twitter: What 140 characters reveal aboutpolitical sentiment. In Proceedings of the Fourth International AAAIConference on Weblogs and Social Media, 178–185.Von Ahn, L., and Dabbish, L. 2004. Labeling images with acomputer game. In Proceedings of the SIGCHI conference onHuman factors in computing systems, 319–326. ACM.