

Nelson guillermo r_20150708_1730_upmc_jussieu_-_amphi_durand
23
THE ROLE OF TELECONNECTION PATTERNS IN WAVE CLIMATE AND STORMS DISTRIBUTION: THE SW SPANISH AND WALES COASTS EXAMPLES. Nelson Rangel-Buitrago ,Giorgio Anfuso, Mike Phillips, Tony Thomas
-
Upload
ingrid-le-ru -
Category
Science
-
view
311 -
download
0
Transcript of Nelson guillermo r_20150708_1730_upmc_jussieu_-_amphi_durand
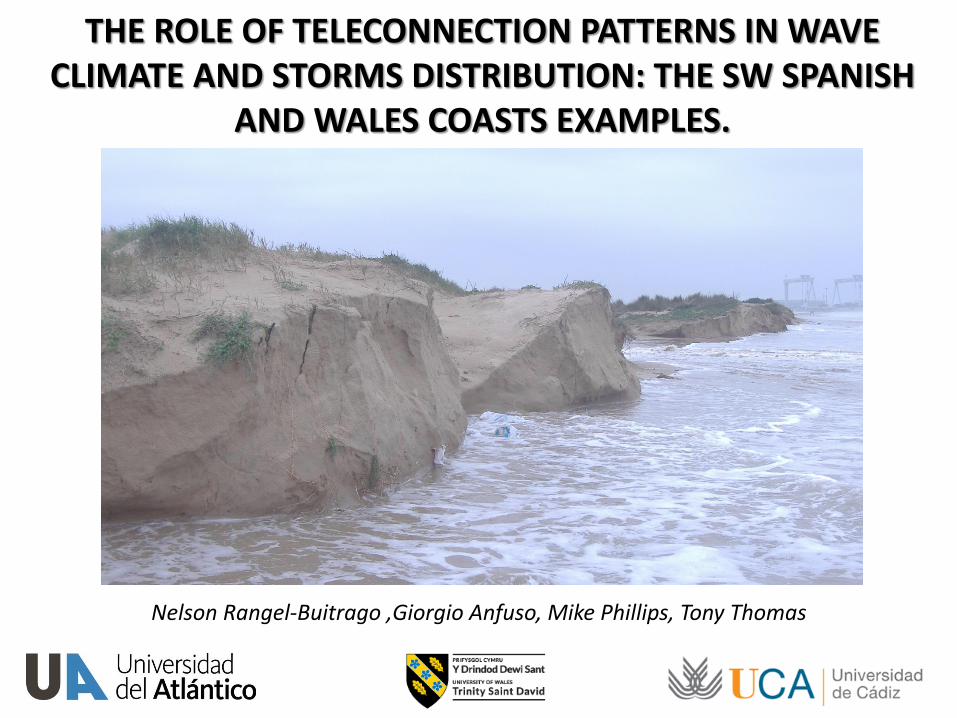
THE ROLE OF TELECONNECTION PATTERNS IN WAVE CLIMATE AND STORMS DISTRIBUTION: THE SW SPANISH
AND WALES COASTS EXAMPLES.
Nelson Rangel-Buitrago ,Giorgio Anfuso, Mike Phillips, Tony Thomas
This work is a contribution to the RESISTE Research Project (CGL2008-00458/BTE, supported by the Spanish Ministry of Science and Technology and by European
Funds for Regional Development – F.E.D.E.R.), the Research Project GERICO (CGL 2011–25438) and to the Andalusia P.A.I. Research Group no. RNM-328.

HAZARDS - VULNERABILITY - RISK
Over the past decades several great storms and hurricanes have caused important economic losses and scores of deaths along the coastline of the world.

Source:EEA
STORMS IN EU
Recorded events Number of fatalilies Number of people afected Overal lossses Insured losses
Nº 155 729 3803 44.338 (billion) 20.532 (billion)
Rank 2 4 2 2 1
Overal losses associated with disasters caused by natural hazards in europe (1998 – 2009)
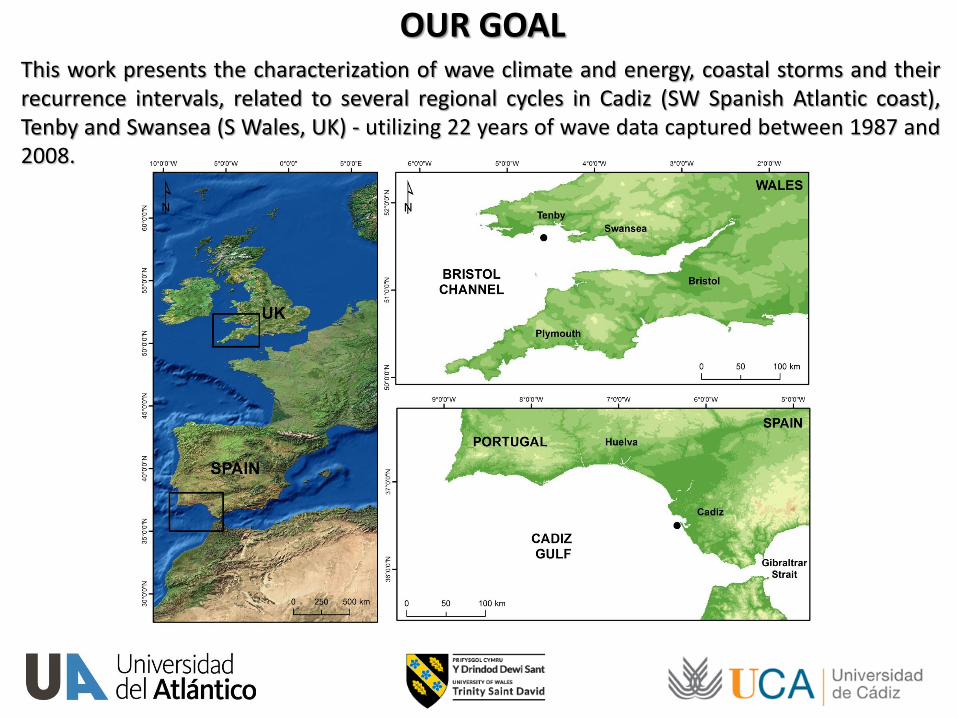
OUR GOAL This work presents the characterization of wave climate and energy, coastal storms and their recurrence intervals, related to several regional cycles in Cadiz (SW Spanish Atlantic coast), Tenby and Swansea (S Wales, UK) - utilizing 22 years of wave data captured between 1987 and 2008.
METHODS
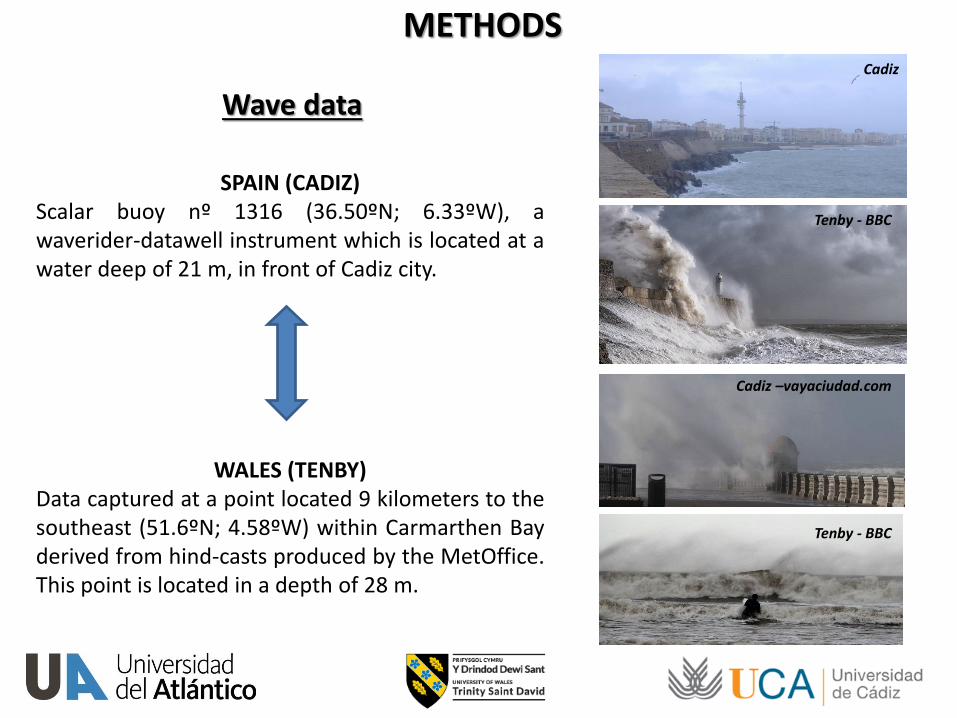
Wave data
SPAIN (CADIZ) Scalar buoy nº 1316 (36.50ºN; 6.33ºW), a waverider-datawell instrument which is located at a water deep of 21 m, in front of Cadiz city.
WALES (TENBY) Data captured at a point located 9 kilometers to the southeast (51.6ºN; 4.58ºW) within Carmarthen Bay derived from hind-casts produced by the MetOffice. This point is located in a depth of 28 m.
Tenby - BBC
Cadiz
Tenby - BBC
Cadiz –vayaciudad.com

METHODS
The Dolan & Davis (1992)
Storm Power Index
Hs2 td
Hs = significant wave height
td = storm duration in hours
STORM CHARACTERIZATION
Threshold= 2.5 m CADIZ 3.5 m TENBY
Minimum storm duration = 12 hr Inter-storm period = 24 hr
Rangel & Anfuso (2011)
CLASS RANGEWEAK < 515
MODERATE 515 - 1225
SIGNIFICANT 1225 - 2537
SEVERE 2538 - 5167
EXTREME > 5167
TELECONNECTION PATTERNS
The term Regional Cycle and Teleconnection Pattern are terms referred to a recurring and persistent, large scale pattern of pressure and circulation anomalies that span vast geographical areas (Hatzaki et al., 2006).
• North Atlantic Oscillation – NAO .
• East Atlantic Pattern – EA .
• East Atlantic/Western Russia – EA/WR .
• Scandinavia – SCAND.
• Polar/Eurasia – POL.
• East – North Pacific Pattern – EP–NP.
• Pacific/North American Pattern – PNA .
• Arctic Oscillation – AO.
Wave Climate
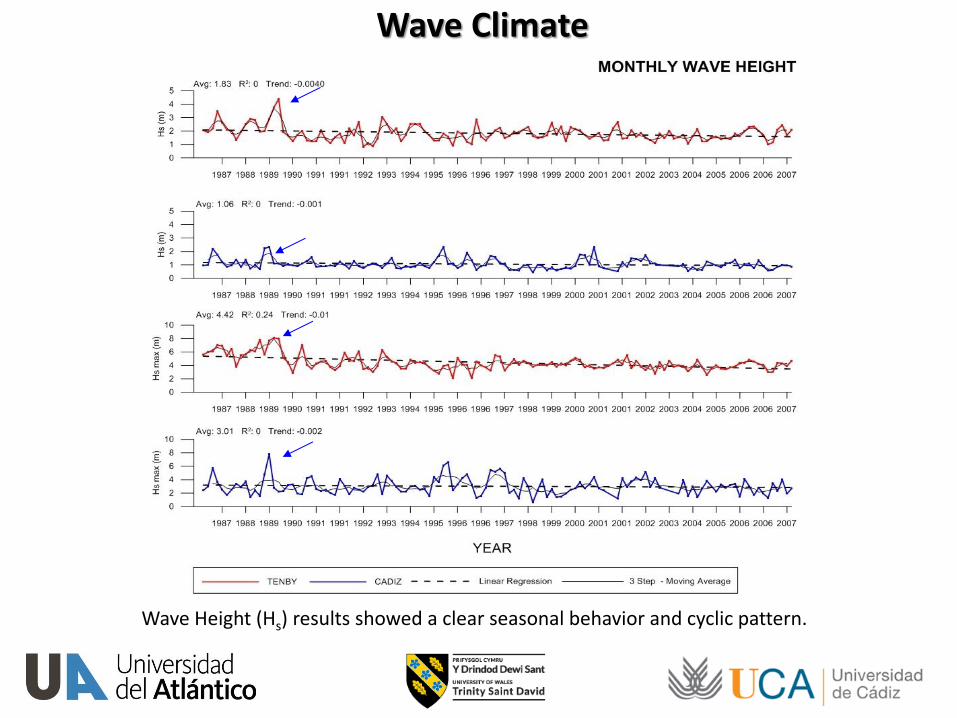
Wave Height (Hs) results showed a clear seasonal behavior and cyclic pattern.
Wave Climate

Wave Climate During the winter season, waves rapidly increased in height, reaching peak
values (Hs = 1.2 m, Cadiz, Hs = 2.1 m, Tenby) between December and January.
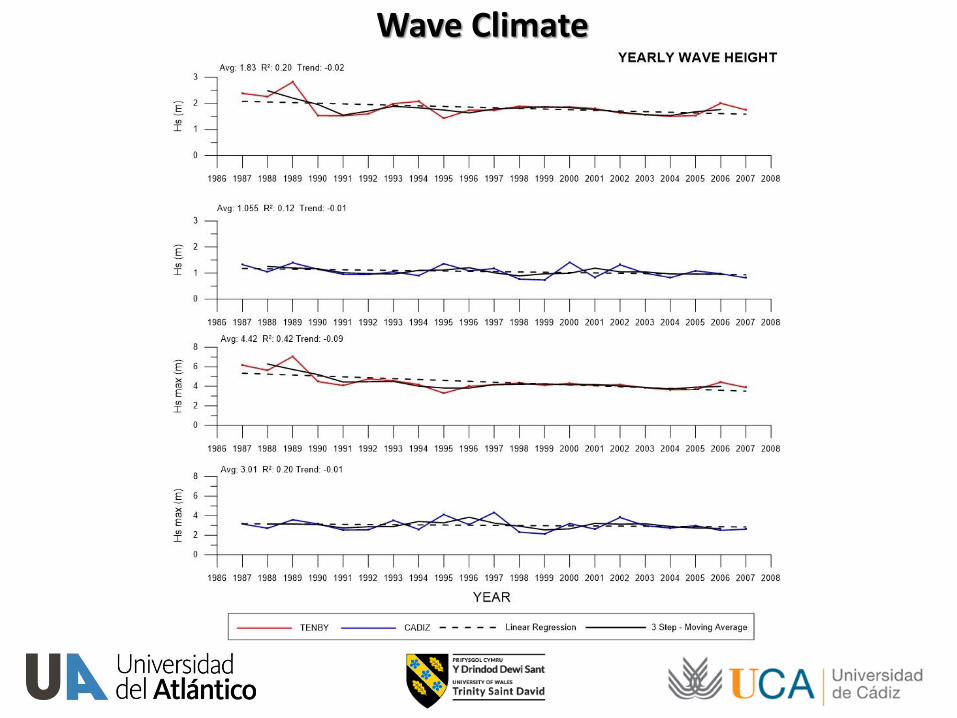
When consideration was given to the entire investigated period, there was a significant variation in average monthly wave height.
When extreme wave conditions were considered, the highest monthly value was December 1989, with an average value of extreme wave height of 4.6 m in Tenby and 2.5 m in Cadiz.
Quasi-periodic 2 to 4 year cyclical behavior in significantly high wave. Similarly, spectral analysis of time series of extreme waves, based on the Fourier transformation (Boashash,
2003), indicated a cyclic trend of 3 years.
FACTS
Wave Climate

Wave Energy
Results show that the monthly average wave energy flux was 14.7 kW/m in Tenby and 4.7 kW/m in Cadiz, and respectively reached values of 155.5 kW/m and 36.6 kW/m during the winter season.
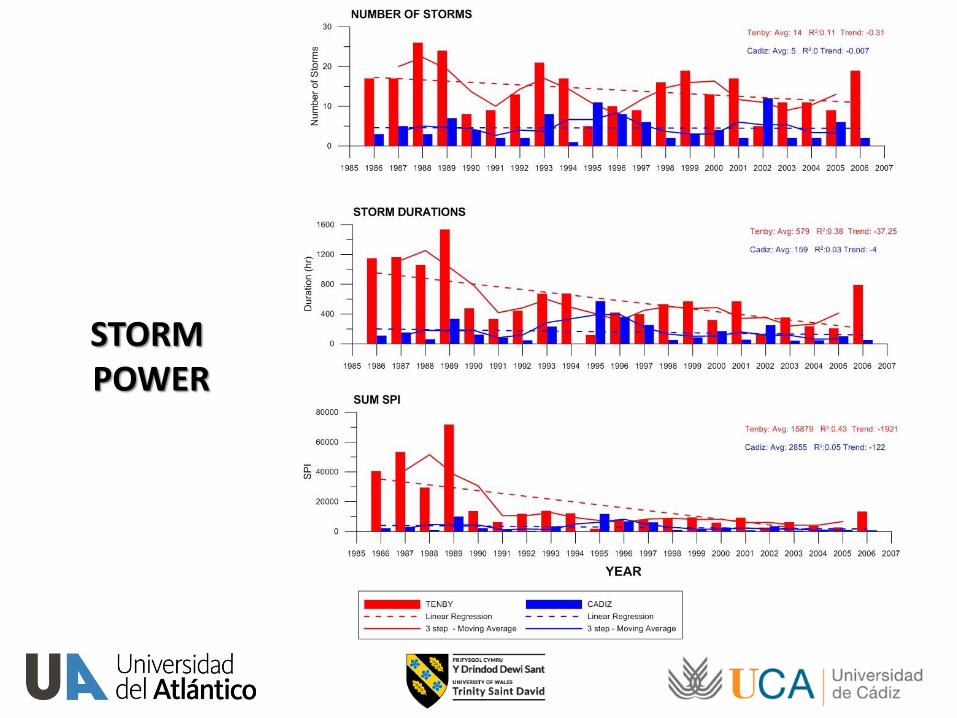
STORM POWER
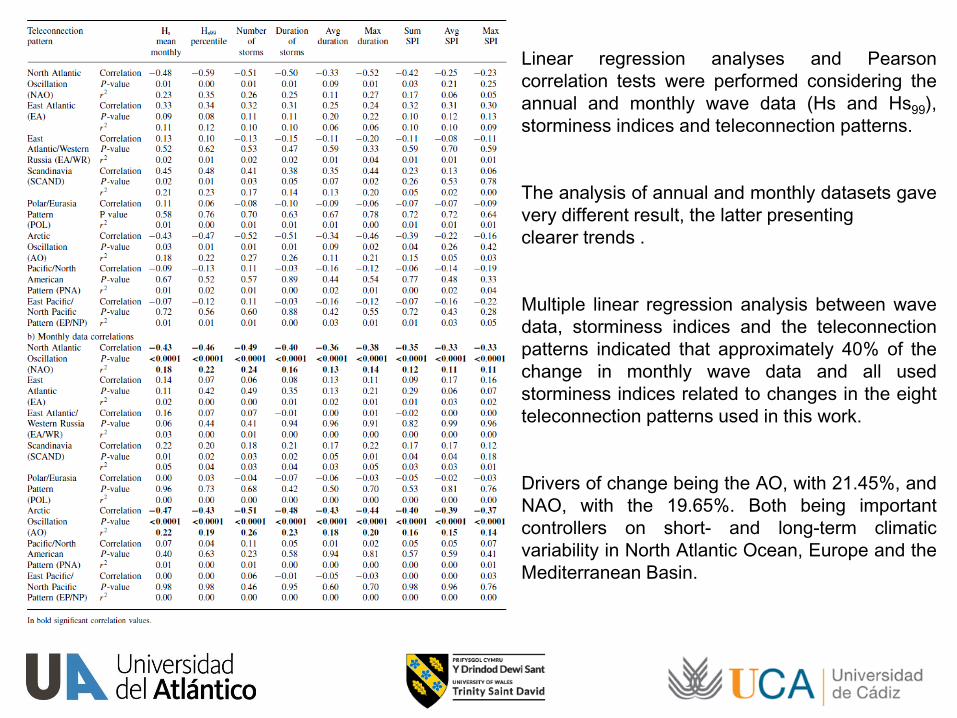
Linear regression analyses and Pearson
correlation tests were performed considering the
annual and monthly wave data (Hs and Hs99),
storminess indices and teleconnection patterns.
The analysis of annual and monthly datasets gave
very different result, the latter presenting
clearer trends .
Multiple linear regression analysis between wave
data, storminess indices and the teleconnection
patterns indicated that approximately 40% of the
change in monthly wave data and all used
storminess indices related to changes in the eight
teleconnection patterns used in this work.
Drivers of change being the AO, with 21.45%, and
NAO, with the 19.65%. Both being important
controllers on short- and long-term climatic
variability in North Atlantic Ocean, Europe and the
Mediterranean Basin.

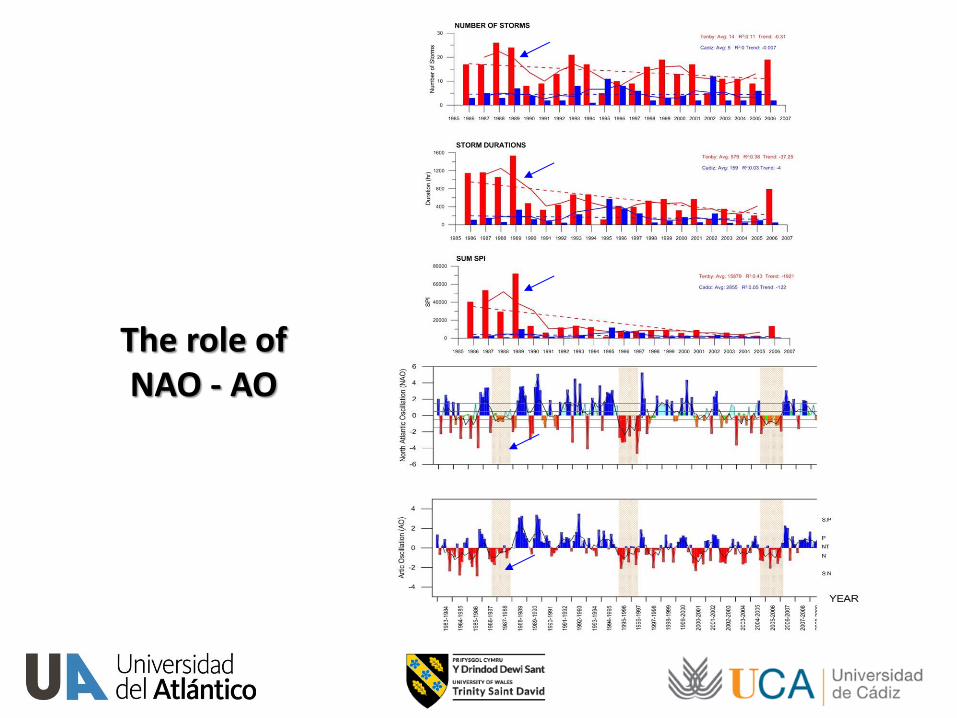
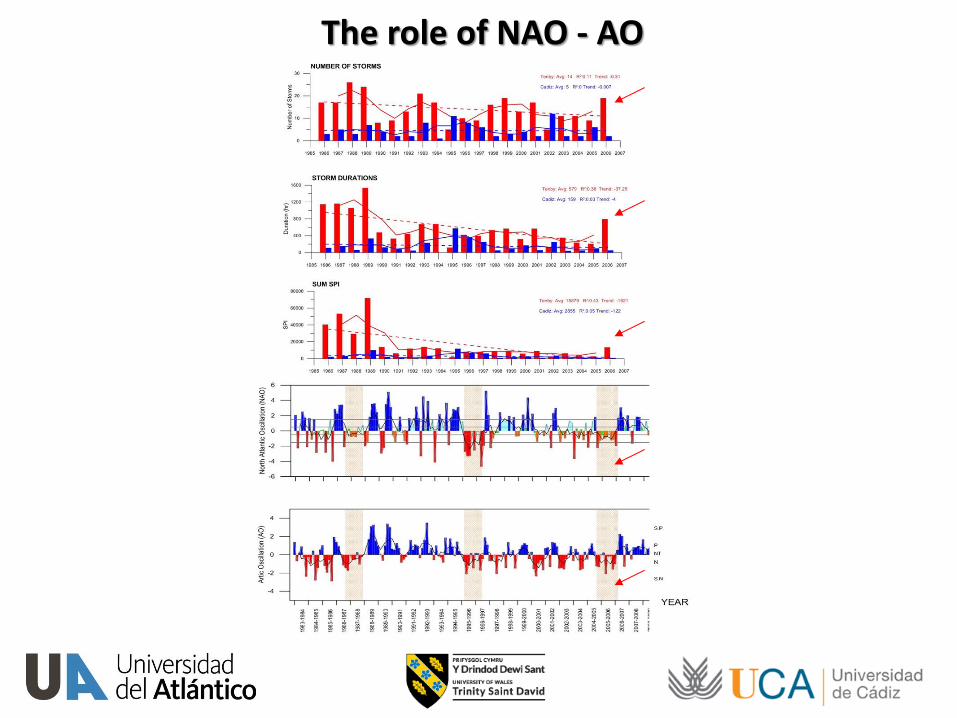
The role of NAO - AO
It is interesting to remark that high energy values were observed when neutral to strong negative NAO and AO phases occurred and also when there were abrupt changes, e.g. from positive to negative phases without passing through a neutral phase.

The role of NAO - AO 1980s General predominance of positive NAO phases, AO trend changed in 1988. Considering storminess, the 1980s can be classified as a period of ‘calm’ due to the low recorded condition in wave heights and storminess. Tenby showed many storms in 1988.
1980s 1990s 2000s
The role of NAO - AO
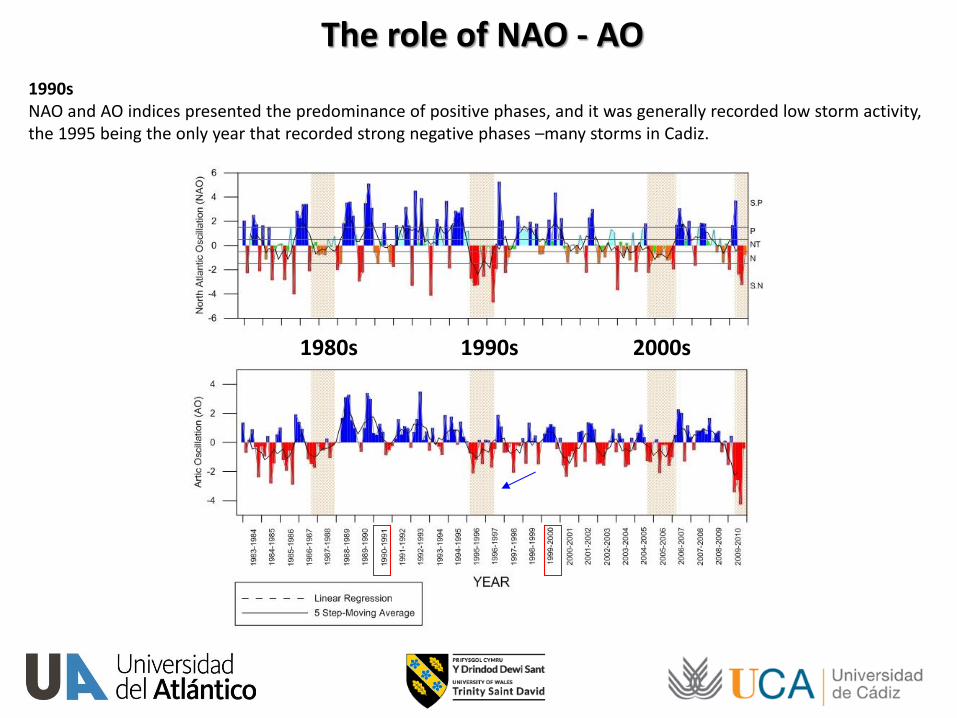
The role of NAO - AO
1990s NAO and AO indices presented the predominance of positive phases, and it was generally recorded low storm activity, the 1995 being the only year that recorded strong negative phases –many storms in Cadiz.
1980s 1990s 2000s

The role of NAO - AO
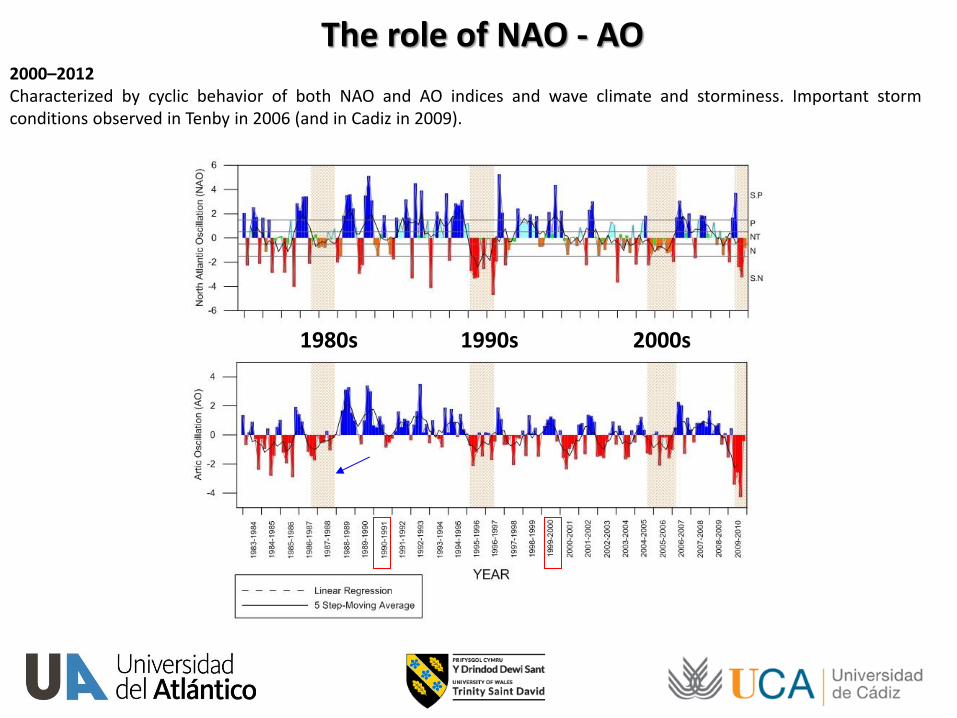
The role of NAO - AO 2000–2012 Characterized by cyclic behavior of both NAO and AO indices and wave climate and storminess. Important storm conditions observed in Tenby in 2006 (and in Cadiz in 2009).
1980s 1990s 2000s
The role of NAO - AO
The role of NAO - AO
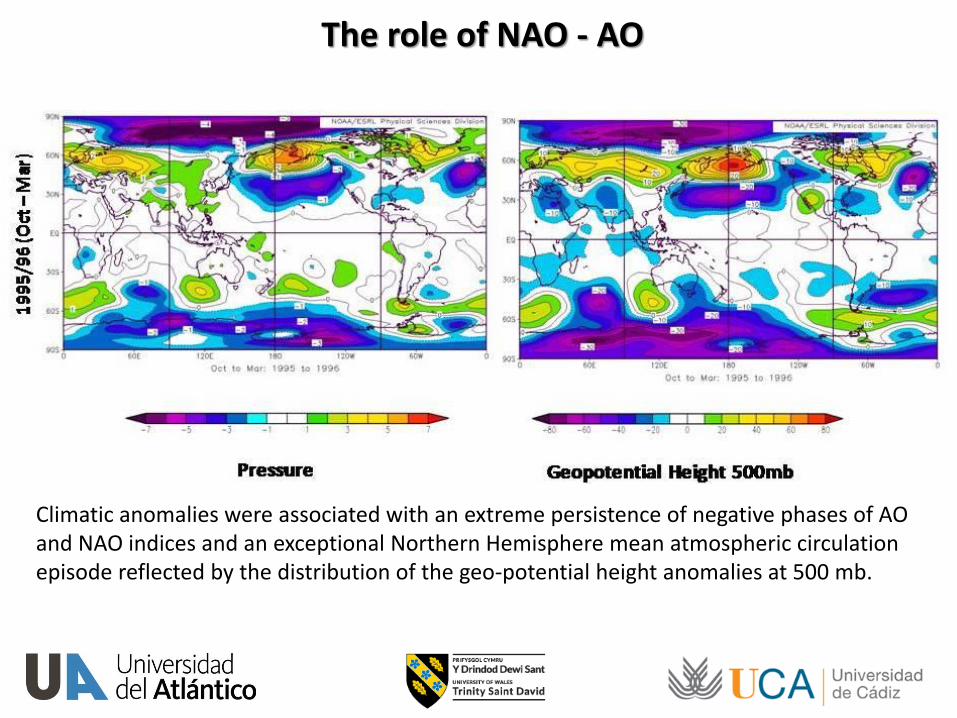
Climatic anomalies were associated with an extreme persistence of negative phases of AO and NAO indices and an exceptional Northern Hemisphere mean atmospheric circulation episode reflected by the distribution of the geo-potential height anomalies at 500 mb.


![ii [multi]/1st Edition... · 2019. 9. 26. · ii Credits Authors: Jason Nelson, Alex Riggs, and Jen Page Artists: Guillermo Cartay, Bob Greyvenstein, Frank Hessefort, Tim Kings-Lynne,](https://static.fdocuments.net/doc/165x107/60af44821f6b6e16c85c3ad3/ii-multi1st-edition-2019-9-26-ii-credits-authors-jason-nelson-alex.jpg)


