Factors Influencing the Distribution and Characteristics of ...
Crime and Justice Research Paper Series
Neighbourhood characteristics andthe distribution of crime in Winnipegby Robin Fitzgerald, Michael Wisener and Josée Savoie
Canadian Centre for Justice Statistics,Statistics Canada, Ottawa, Ontario, K1A 0T6.
Telephone: 1 800 387-2231 Fax: 1 613 951-6615
This paper represents the views of the authors and does not necessarily reflect the opinions of Statistics Canadaor the Department of Justice Canada.
Catalogue no. 85-561-MIE — No. 004
ISSN: 1707-5203
ISBN: 0-662-37912-8
Research Paper
Statistics StatistiqueCanada Canada
How to obtain more information
Specific inquiries about this product and related statistics or services should be directed to:Canadian Centre for Justice Statistics, Toll free 1 800 387-2231 or (613) 951-9023, StatisticsCanada, Ottawa, Ontario, K1A 0T6.
For information on the wide range of data available from Statistics Canada, you can contactus by calling one of our toll-free numbers. You can also contact us by e-mail or by visiting ourWeb site.
National inquiries line 1 800 263-1136National telecommunications device for the hearing impaired 1 800 363-7629Depository Services Program inquiries 1 800 700-1033Fax line for Depository Services Program 1 800 889-9734E-mail inquiries [email protected] site www.statcan.ca
Ordering and subscription information
This product, Catalogue no. 85-561-MIE, is published occasionally in electronic format on theStatistics Canada Internet site free of charge. To obtain single issues, visit our Web site atwww.statcan.ca, and select Products and Services.
Standards of service to the public
Statistics Canada is committed to serving its clients in a prompt, reliable and courteousmanner and in the official language of their choice. To this end, the Agency has developedstandards of service which its employees observe in serving its clients. To obtain a copy ofthese service standards, please contact Statistics Canada toll free at 1 800 263-1136.
More information can be obtained from
http://www.prevention.gc.ca/en/library/publications/research/winnipeg

Crime and Justice research paper series
Neighbourhood characteristics andthe distribution of crime in Winnipeg
Robin Fitzgerald, Michael Wisenerand Josée Savoie, Statistics Canada
Published by authority of the Minister responsible for Statistics Canada
© Minister of Industry, 2004
All rights reserved. No part of this publication may be reproduced, stored in a retrieval system or transmitted in anyform or by any means, electronic, mechanical, photocopying, recording or otherwise without prior written permissionfrom Licence Services, Marketing Division, Statistics Canada, Ottawa, Ontario, Canada K1A 0T6.
September 2004
Catalogue no. 85-561-MIE2004004
Frequency: Irregular
ISSN 1707-5203
ISBN 0-662-37912-8
Ottawa
La version française de cette publication est disponible sur demande (no 85-561-MIF2004004 au catalogue)
Statistics Canada
Public Safety and Emergency Preparedness Canada
The views expressed in this report are solely those of the author and do not necessarily represent the views ofStatistics Canada or Public Safety and Emergency Preparedness Canada.
4
Neighbourhood characteristics and the distribution of crime in Winnipeg
Catalogue no. 85-561-MIE2004004
Acknowledgements
This research paper was prepared by the Canadian Centre for Justice Statistics (CCJS)with the financial support of the National Crime Prevention Centre (NCPC) at PublicSafety and Emergency Preparedness Canada. The CCJS gratefully acknowledgesthe assistance of the Winnipeg Police Service, the City of Winnipeg Property andPlanning Department, and the Community Data Network (CDN) in Winnipeg inmaking this report possible.
The paper has benefited from the comments of many reviewers. In particularthe authors gratefully acknowledge the various contributions of Yves Lafortune inSocial Survey Methods Division at Statistics Canada, Dr. Paul Brantingham fromthe School of Criminology at Simon Fraser University, Dr. Les Kennedy from theSchool of Criminal Justice at Rutgers University, Dr. Dietrich Oberwittler from theInstitute of Criminology at the University of Cambridge, our federal-provincial-territorial partners on the CCJS Liaison Officers Committee and the staff of CCJS.Finally, the authors would like to extend a special thank you to Danielle Baum forher indispensable work in preparing the Manuscript.
Note of appreciation
Canada owes the success of its statistical system to a long-standing partnershipbetween Statistics Canada, the citizens of Canada, its businesses, governments and other institutions. Accurate and timely statistical information could not beproduced without their continued cooperation and goodwill.

5
Neighbourhood characteristics and the distribution of crime in Winnipeg
Catalogue no. 85-561-MIE2004004
Table of contentsAcknowledgements 4
Abstract 8
Background 9
Methodology 11
Data sources 11
Description of variables 12
Methods 16
Mapping techniques 16
Findings 20
Winnipeg in context 20
How is crime distributed across Winnipeg neighbourhoods? 22
How does the spatial pattern of incidents change by time of day? 30
Neighbourhood characteristics and crime within neighbourhoods 32
Discussion 42
Bibliography 45
Appendices 47
Appendix A: Maps of distribution of selected Census variables 48
Appendix B: High-need neighbourhoods 55
Endnotes 59
Crime and Justice research paper series 62
Maps, figures and tables
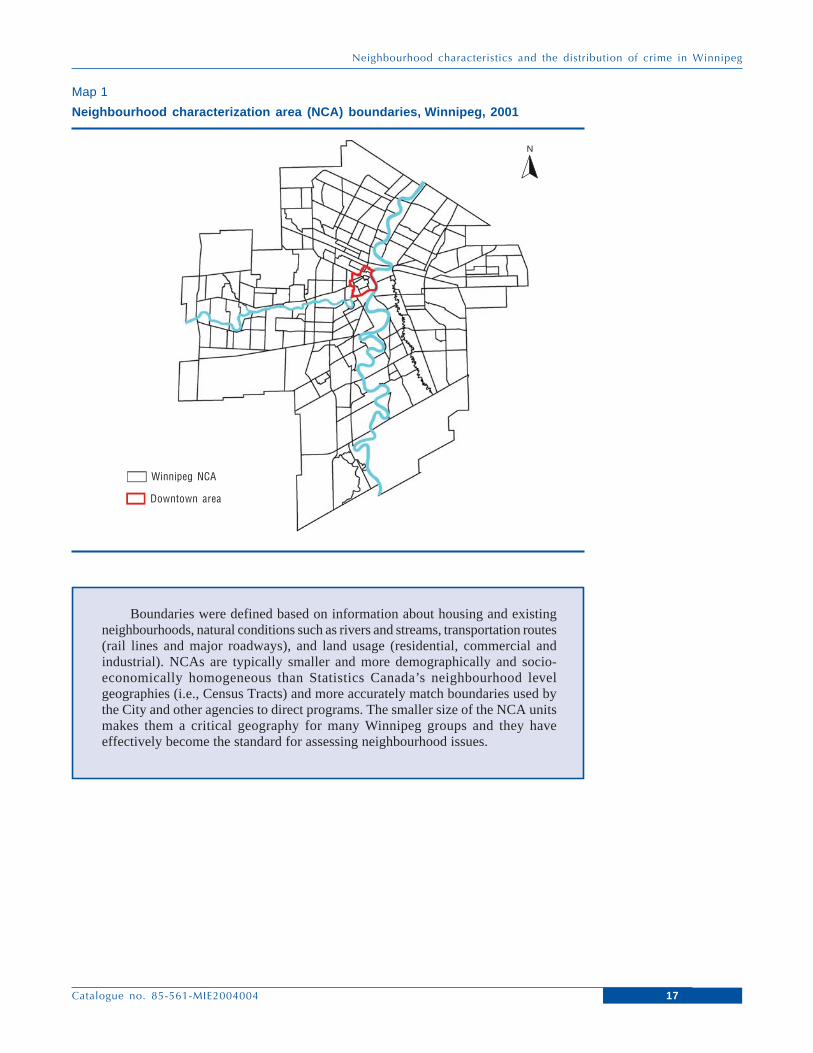
Map 1 Neighbourhood characterization area (NCA) boundaries,Winnipeg, 2001 17
Map 2 A comparison of NCA and Census Tract boundaries, WestBroadway and Armstrong Point, Winnipeg, 2001 18
6
Neighbourhood characteristics and the distribution of crime in Winnipeg
Catalogue no. 85-561-MIE2004004
Map 3 Distribution of violent crime incidents by NCA,Winnipeg, 2001 23
Map 4 Distribution of property crime incidents by NCA,Winnipeg, 2001 23
Map 5 Concentration of incidents, density per square kilometre,Winnipeg, 2001 24
Map 6 Kernel density distribution of violent crime incidents,Winnipeg, 2001 25
Map 7 Kernel density distribution of property crime incidents,Winnipeg, 2001 25
Map 8 Kernel density distribution of property incidents andresidential population, Winnipeg, 2001 28
Map 9 Kernel density distribution of property incidents andpopulation at risk (combined residential and employedpopulation), Winnipeg, 2001 28
Map 10 Kernel density distribution of violent incidents andresidential population, Winnipeg, 2001 29
Map 11 Kernel density distribution of violent incidents andpopulation at risk (combined residential and employedpopulation), Winnipeg, 2001 29
Map 12 Kernel density distribution of morning robberyincidents, 7:00-9:00 AM, Winnipeg, 2001 31
Map 13 Kernel density distribution of evening robberyincidents, 8:00-10:00 PM, Winnipeg, 2001 31
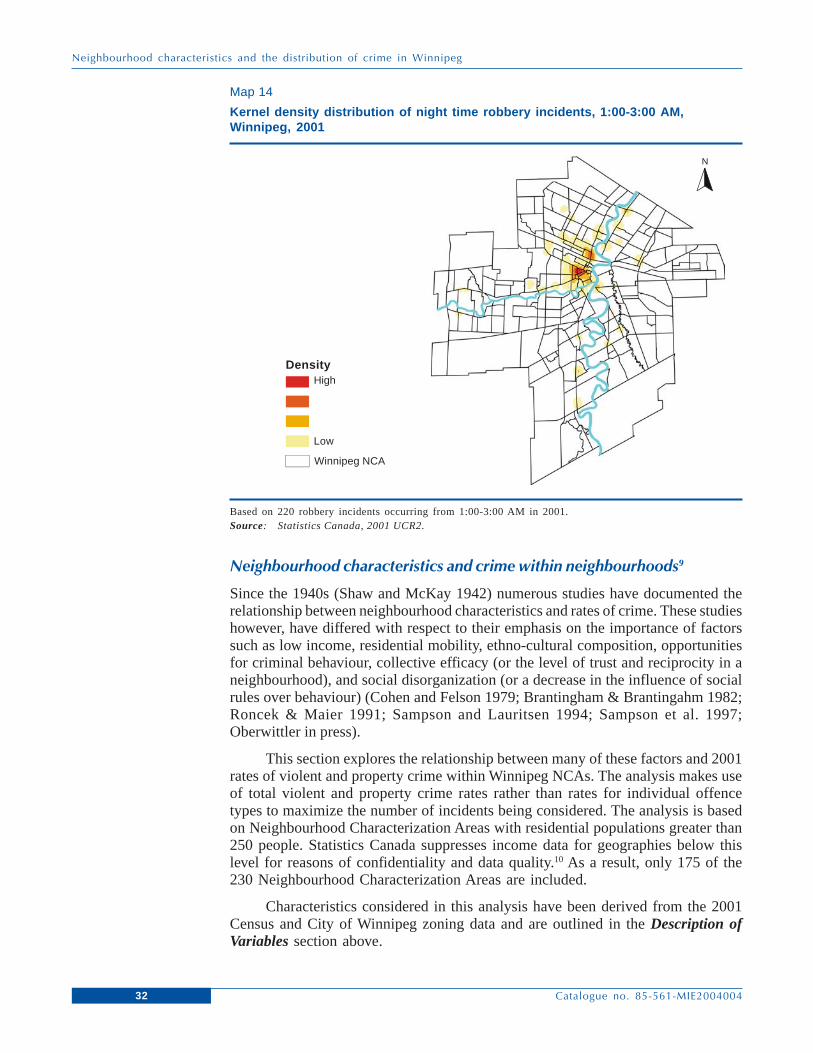
Map 14 Kernel density distribution of night time robberyincidents, 1:00-3:00 AM, Winnipeg, 2001 32
Map 15 Kernel density distribution of drug incidents, Winnipeg, 2001 48
Map 16 Kernel density distribution of arson incidents, Winnipeg, 2001 48
Map 17 Kernel density distribution of common assault incidents,Winnipeg, 2001 49
Map 18 Kernel density distribution of break and enter incidents,Winnipeg, 2001 49
Map 19 Kernel density distribution of car theft incidents,Winnipeg, 2001 50
Map 20 Kernel density distribution of homicide and seriousassault incidents, Winnipeg, 2001 50
Map 21 Kernel density distribution of mischief incidents,Winnipeg, 2001 51
Map 22 Kernel density distribution of prostitution incidents,Winnipeg, 2001 51
Map 23 Kernel density distribution of robbery incidents,Winnipeg, 2001 52
Table of contents
7
Neighbourhood characteristics and the distribution of crime in Winnipeg
Catalogue no. 85-561-MIE2004004
Map 24 Kernel density distribution of sexual offence incidents,Winnipeg, 2001 52
Map 25 Kernel density distribution of shoplifting incidents,Winnipeg, 2001 53
Map 26 Kernel density distribution of theft $5,000 andunder incidents, Winnipeg, 2001 53
Map 27 Kernel density distribution of theft over $5,000,Winnipeg, 2001 54
Figure 1 Crime rate Winnipeg and Canada, 1991 to 2002 21
Figure 2 Age distribution of accused, Winnipeg, 2001 22Figure 3 Robbery incidents by time of day, Winnipeg, 2001 30
Figure 4 Population characteristics in neighbourhoods with highand lower rates of violent crime, Winnipeg, 2001 33
Figure 5 Population characteristics in neighbourhoods with highand lower rates of property crime, Winnipeg, 2001 34
Figure 6 Land-use and housing characteristics in neighbourhoodswith high and lower rates of violent crime, Winnipeg, 2001 35
Figure 7 Land-use and housing characteristics in neighbourhoodswith high and lower rates of property crime, Winnipeg, 2001 36
Figure 8 Socio-economic characteristics in neighbourhoods withhigh and lower rates of violent crime, Winnipeg, 2001 37
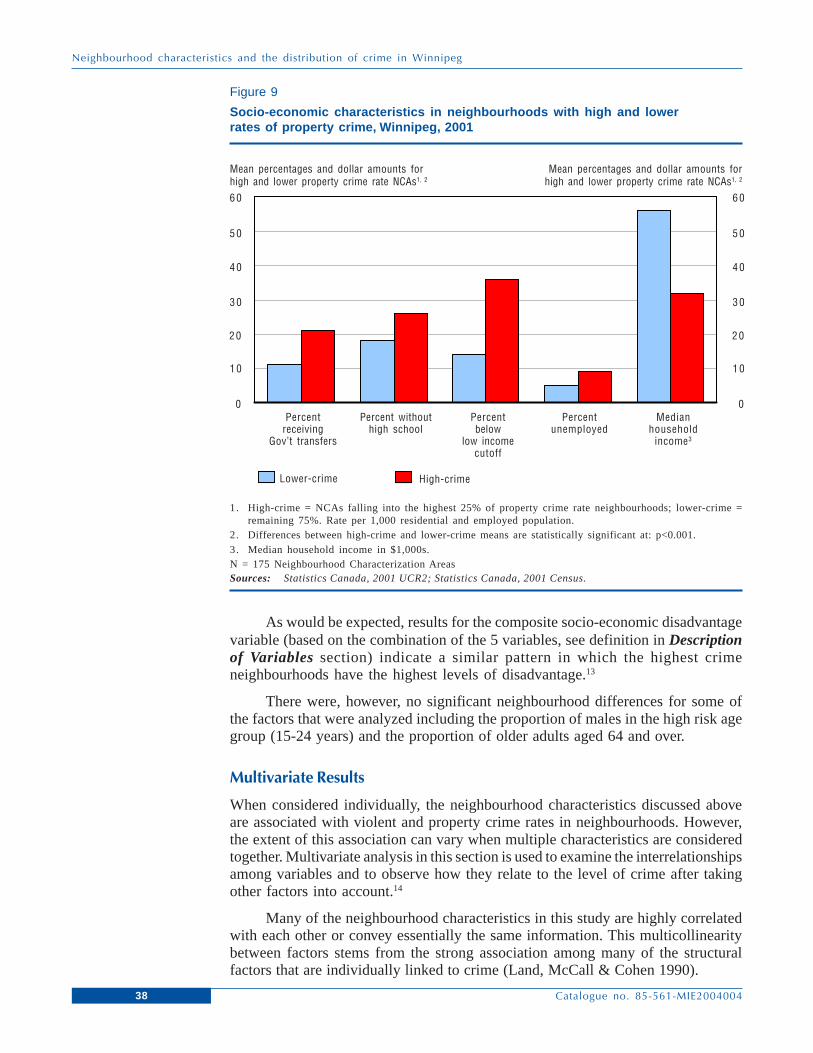
Figure 9 Socio-economic characteristics in neighbourhoods withhigh and lower rates of property crime, Winnipeg, 2001 38
Table 1 Count and rate of police-reported crime incidents inWinnipeg neighbourhoods, 2001 27
Table 2 Bivariate correlations of independent variables,Winnipeg neighbourhoods, 2001 39
Table 3 OLS-multiple regression models for violent and propertycrime rates, Winnipeg neighbourhoods, 2001 41
Table 4 Selected offence types for highest-need NeighbourhoodCharacterization Areas, Winnipeg, 2001 56
Table 5 Selected Census characteristics for highest-needNeighbourhood Characterization Areas, Winnipeg, 2001 58
Table of contents

8
Neighbourhood characteristics and the distribution of crime in Winnipeg
Catalogue no. 85-561-MIE2004004
AbstractThis research paper explores the spatial distribution of crime and various social,economic and physical neighbourhood characteristics in the City of Winnipeg.Analysis is based on police-reported crime data from the 2001 Incident-basedUniform Crime Reporting Survey (UCR2), the 2001 Census of Population, and Cityof Winnipeg land-use data.
In general, results support previous research suggesting that crime is notrandomly distributed within cities, but is associated with the distribution of otherfactors related to the population and land-uses of the city. In particular, crime inWinnipeg in 2001 was concentrated in the city centre, representing a relatively smallproportion of the total geographic area of the city.
Results point to significant differences in the characteristics of high- and low-crime neighbourhoods. For instance, high-crime neighbourhoods were characterizedby reduced access to socio-economic resources, decreased residential stability,increased population density and land-use patterns that may increase opportunityfor crime.
After taking into account all other factors, the level of socio-economicdisadvantage of the residential population in a neighbourhood was most stronglyassociated with the highest neighbourhood rates of both violent and property crime.
9
Neighbourhood characteristics and the distribution of crime in Winnipeg
Catalogue no. 85-561-MIE2004004
BackgroundThis demonstration study represents Statistics Canada’s first examination of crimedata using Geographic Information System (GIS) technology. The study, funded bythe National Crime Prevention Centre at Public Safety and Emergency PreparednessCanada, examines crime patterns in the City of Winnipeg in 2001. Results lendsupport to the notion that crime is not randomly distributed within cities but isassociated with the distribution of other factors related to the population and land-uses of the city.
A recognition that crime is not evenly dispersed across cities, but is oftenconcentrated within particular areas has been the focus of ecological studies ofcrime since the 1940s. Using data from the 2001 Census of Population, the 2001Incident-based Uniform Crime Reporting Survey (UCR2) and City of Winnipegzoning data, this study describes and explains spatial patterns of crime using social,economic and physical neighbourhood characteristics. Questions addressed include:How are police-reported crimes distributed across city neighbourhoods? Is the rateof crime in a neighbourhood associated with factors that are specific to thatneighbourhood such as particular population, housing, land-use or socio-economiccharacteristics?
The study addresses these questions through a combination of statisticalanalyses and maps. Crime maps are important tools for the development andimplementation of crime reduction strategies, and are used in this report to providea visual representation of areas of concentrated crime and characteristics related tothat concentration.
It should be kept in mind that this study makes use of police-reported data,which provides one particular view of the nature and extent of crime. Specifically,police-reported data measure only those crimes that are known to the police. Manyfactors can influence the police-reported crime rate, including the willingness of thepublic to report crimes to the police; reporting by police to the UCR Survey; andchanges in legislation, policies or enforcement practices.
According to the 1999 General Social Survey (GSS) on Victimization, 59% ofincidents at the national level in Canada were not reported to the police (Bessererand Trainor 2000). While population-based surveys such as the GSS collectinformation directly from individuals about their experiences of criminal victimizationregardless of whether the crime was reported to the police, these data are currentlynot available at the urban and sub-urban levels in Canada.
The Census of Population is conducted by Statistics Canada every 5 years,and most recently in 2001. In order to achieve the highest degree of compatibilitybetween neighbourhood characteristics derived from the Census and crimeinformation, this study is based on police and Census data from the year 2001.

10
Neighbourhood characteristics and the distribution of crime in Winnipeg
Catalogue no. 85-561-MIE2004004
The focus of this study is to examine factors related to the geographic locationof reported criminal incidents, and does not address issues related to the residentiallocation of either offenders or victims. Consequently, conclusions cannot be drawnabout the connection between the location of criminal incidents and the residencesof either accused individuals or victims.
How is this report organized?
There are four parts in this report. The first part provides a description of the datasources, variables and methods used for analyzing spatial data. The results of theanalysis are presented in the second part, and part three presents a discussion of themajor findings and some of the limitations of this demonstration study. Finally, thefourth part of the report includes appendices providing greater detail of the distributionof specific crimes, and selected crime and census data for the highest-needneighbourhoods in Winnipeg.

11
Neighbourhood characteristics and the distribution of crime in Winnipeg
Catalogue no. 85-561-MIE2004004
Methodology
Data sources
The Incident-based Uniform Crime Reporting Survey (UCR2)
The incident-based UCR2 survey captures detailed information on individual criminalincidents reported to police, including characteristics of victims, accused personsand incidents. The Winnipeg Police Service has been reporting to the UCR2 since2000.
The UCR2 Survey allows for a maximum of four offences committed duringthe same criminal incident to be recorded in the data base. The selected offences areclassified according to their level of seriousness, which is related to the maximumsentence that can be imposed under the Criminal Code.
Analyses of broad offence categories (e.g., total offences against the person,total property offences, total drug-related offences and total other Criminal Codeoffences) undertaken in this study are based on the most serious offence in eachincident. This coincides with the crime rates published annually by the CCJS, whichare based on the most serious offence in each police-reported incident. In classifyingoffences this way, a higher priority is given to violent offences than to non-violentoffences. As a result, less serious offences may be under-represented when only themost serious offence is considered.
The majority of analyses undertaken in this study are based on broad categoriesof crime such as violent and property crime, which are based on a count of the mostserious offence. However, in some analyses individual offence types are examined.In these cases, all incidents in which the offence was reported are included. Forexample, Table 1 provides information on selected individual offence types includingtheft under $5,000, theft over $5,000, car theft, shoplifting, break and enter, drugoffences, mischief, arson, prostitution, robbery, common assault, sexual assault,homicide and serious assault. For these specific offence types, all incidents in whichthe offence was reported are included, regardless of the seriousness of the rankinggiven to the offence in the incident. This method provides a more completerepresentation of the distribution of individual offence types.
This study includes most Criminal Code offences, but excludes offences underother Federal, Provincial and Municipal statutes with the exception of the ControlledDrug and Substances Act. Also excluded are Criminal Code offences for whichthere is either no expected pattern of spatial distribution or a lack of informationabout the actual location of the offence. For example, administrative offencesincluding bail violation, failure to appear and breach of probation are typicallyreported at court locations; threatening or harassing phone calls are often reportedat the receiving end of the call; and impaired driving offences may be more likely to
12
Neighbourhood characteristics and the distribution of crime in Winnipeg
Catalogue no. 85-561-MIE2004004
be related to the location of apprehension (for example, apprehensions resultingfrom road-side stop programs). In total, roughly 7,000 offences were excluded.
The Census of Population
On May 15, 2001, Statistics Canada conducted the Census of Population to developa statistical portrait of Canada and its people. The Census of Population providesthe population and dwelling counts not only for Canada but also for each provinceand territory, and for smaller geographic units such as cities or districts within cities.The Census also provides information about Canada’s demographic, social andeconomic characteristics.
The detailed socio-economic data used in this study is derived from the longform of the Census, which is based on a 20% sample of households. These dataexclude the institutional population, which includes individuals living in hospitals,nursing homes, prisons and other institutions.
City of Winnipeg Zoning Data
Zoning data from the City of Winnipeg’s Planning, Property and DevelopmentDepartment were used to calculate the proportion of the area within neighbourhoodsdesignated as either commercial, multiple-family residential or single-familyresidential land-use zones. Individual zoning parcels defined by City by-laws1 wereaggregated to the neighbourhood level in order to calculate proportions.
Zoning data were also included for parcels in the downtown core. In theseareas in particular, zoning types were frequently overlapping such that the sameparcel of land could be zoned as commercial and residential (e.g., multiple-family)in cases where buildings served mixed purposes. Since historical data are notavailable, the zoning data used in this study are based on current (2003-04)information from the City of Winnipeg.
Description of variables
Crime variables
While selected individual offence types are displayed in tables and maps, analysesexploring the relationship between crime and neighbourhood characteristics arelimited to the broad offence categories of violent and property crime to maximizethe number of incidents being considered.
For this report, rates of both violent and property crime are calculated basedon the “population at risk” rather than the residential population alone (see TextBox 2 for an explanation of this calculation). Violent crime includes homicide,attempted murder, sexual assault, assault, violations resulting in the deprivation offreedom, robbery, extortion, criminal harassment, explosives causing death or bodilyharm, uttering threats and other violent violation. Property crime includes arson,break and enter, theft under $5,000, theft $5,000 and over, possessing stolen goods,fraud and mischief.

13
Neighbourhood characteristics and the distribution of crime in Winnipeg
Catalogue no. 85-561-MIE2004004
2001 Census of Population variables
Socio-economic disadvantage variables
Socio-economic disadvantage was derived from the set of five variables listed below.Boyle and Lipman (2002) found this composite variable to be linked to delinquentor problem behaviour in a Canadian sample of children and youth. Moreover,inequality of socio-economic resources across US cities has been demonstrated tobe strongly associated with the spatial distribution of crime (Morenoff, Sampsonand Raudenbush 2001).
Based on the approach taken by Boyle and Lipman (2002), the five socio-economic disadvantage variables were standardized to have a mean of 0 and astandard deviation of 1 (z-score). The Disadvantage Score was calculated by takingan unweighted average of the five standardized variables. The variables are highlycorrelated and yield an Alpha coefficient of 0.81 which reflects a high degree ofinternal consistency between the variables, and suggests that the variables successfullymeasure the same concept.
• Percent of population receiving government transfer payments includingEmployment Insurance; Old Age Security including Guaranteed IncomeSupplement and Spousal Allowance; Net Federal Supplements; Canadaand Quebec Pension Plan benefits; Child Tax Benefit; New Brunswick,Quebec, Alberta and British Columbia Family Allowance; Goods andServices Tax Credit; Workers’ Compensation; Social Assistance; andprovincial/territorial Refundable Tax Credits.
• Percent of neighbourhood population aged 20 years and older withouta secondary school certificate.
• Percent of neighbourhood population in private households with lowincome in 2000. Low income refers to private households who spend20% more of their disposable income than the average private householdon food, shelter and clothing. Statistics Canada’s low-income cut-offs(LICOs) are income thresholds that vary according to family andcommunity size. Although LICOs are often referred to as poverty lines,they have no official status as such.
• Neighbourhood unemployment rate for population aged 15 and olderparticipating in the labour force.
• Median household income in $1,000s or the dollar amount above andbelow which half the cases fall, the 50th percentile.
Population characteristic variables
• Males aged 15-24 years as a percentage of the total neighbourhoodpopulation. This age group represents the highest risk age group foroffending (see Figure 2). In Winnipeg in 2001 about 35% of all identifiedaccused were males aged 15-24 years who were responsible for 26% ofreported violent offences and 43% of property crimes.
• Percent of neighbourhood population aged 65 years and over. Resultsfrom the General Social Survey on Victimization suggest that Canadianrates of criminal victimization among the elderly are relatively lowcompared to the population as a whole, though they report feeling lesssafe (Besserer and Trainor 2000).
14
Neighbourhood characteristics and the distribution of crime in Winnipeg
Catalogue no. 85-561-MIE2004004
• Percentage of the neighbourhood population immigrating to Canadabetween 1991 and 2001. Initially, immigration may hinder integrationinto society; however this condition decreases with the length ofresidence in the country (Breton 2003). Recent immigrants may be morelikely to face reduced social participation and consequently reducedsocial capital or the benefits gained from relationships within thecommunity. Numerous studies have demonstrated links between reducedlevels of social participation and increased levels of crime (Morenoff etal. 2001; Sampson, Raudenbush & Earls 1997; Sampson 1997).
• Percentage of Aboriginal identity population living in the neighbourhood.Included are those persons who reported identifying with at least oneAboriginal group, that is, “North American Indian”, “Métis” or “Inuit(Eskimo)”, and/or who reported being a Treaty Indian or a RegisteredIndian, as defined by the Indian Act of Canada, and/or who reportedthey were members of an Indian Band or First Nation. The Aboriginalpopulation in Canada is over represented with respect to victimizationand offending. For instance, about 35% of Aboriginal people reportedbeing the victim of at least one crime in 12 months preceding the 1999General Social Survey on Victimization, in comparison to about 26%for non-Aboriginal people (Statistics Canada 2001a). In 1998-99Aboriginal peoples aged 18 and over represented about 2% of the 18and over population, but about 17% of admission to provincial/territorialcustody and the same proportion to federal custody (Thomas 2000).
• Percentage of female lone-parent families among economic familiesliving in private households.2 Although the after-tax income of femalelone-parent families is increasing in Canada, these families continue tobe among the lowest earners (Statistics Canada 2001c), and consequentlymay be concentrated in more disadvantaged areas of the city.Additionally, an increase in labour force participation among femalelone-parents from 65% in 1995 to 82% in 2001 may be tied to the notionof decreased guardianship or supervision in neighbourhoods, whichhas been associated with higher crime rates (Cohen and Felson 1979).
• Percentage of population in a neighbourhood living at another residenceone year prior to the Census. Residential mobility has been associatedwith higher crime rates through reduced guardianship or socialinvolvement that frequent movers exhibit. For instance, studies ofAmerican cities indicate that streets where neighbours knew each otheror felt responsible for their community had significantly lower rates ofviolent crime than those where social interaction was lower (Block 1979;Sampson 1993).
Dwelling characteristic variables
• Percentage of dwellings built before 1961. In combination with othervariables related to signs of physical decay within urban neighbourhoodsthe age of buildings may be associated with higher crime rates througha perception of increased physical disorder (Kelling & Coles 1998).
• Percentage of dwellings in need of major repairs. Refers to whether, inthe judgement of the respondent, the dwelling requires any repairs(excluding desirable remodelling or additions). Major repairs refer tothe repair of defective plumbing or electrical wiring, structural repairsto walls, floors or ceilings, etc. This variable may similarly be associated
15
Neighbourhood characteristics and the distribution of crime in Winnipeg
Catalogue no. 85-561-MIE2004004
with higher crime rates through the perception of increased physicaldisorder in the neighbourhood (Kelling & Coles 1998).
• Percentage of households spending more than 30% of total householdincome on shelter, including both owner-occupied and tenant occupiedhouseholds. This is a measure of housing affordability. The 30% figureis based on research indicating that when the shelter costs of low incomehouseholds exceed 30% of their incomes, their consumption of otherlife necessities is reduced. Shelter expenses include payments forelectricity, oil, gas, coal, wood or other fuels, water and other municipalservices, mortgage payments, property taxes, condominium fees andrent. Decreased housing affordability within a neighbourhood is anotherindicator of socio-economic disadvantage.
• Percentage of owner-occupied dwellings in the neighbourhood.Collective dwellings are excluded from both the numerator anddenominator. Greater proportions of owner-occupied housing in aneighbourhood may increase residential stability, social involvementamong neighbours and a collective commitment to the neighbourhood.
City land-use variables
• Commercial zoning – the proportion of square area within aneighbourhood zoned for commercial land-use. Types of land-use fallingunder commercial zoning include stores, supermarkets, discount stores,furniture stores, banks, hotels, beverage hotels (licensed off-sales beervendors), motels, restaurants, service garages, service stations, autodealers, car washes, residential/commercial split properties andcommercial offices.
• Multiple-family residential zoning – the proportion of square area withina neighbourhood zoned for multiple-family, two-family (duplex) ortransitional dwellings which include short- and longer-term subsidizedhousing for those in need.
• Single-family residential zoning – the proportion of square area withina neighbourhood zoned for single-family dwellings.

16
Neighbourhood characteristics and the distribution of crime in Winnipeg
Catalogue no. 85-561-MIE2004004
Methods
What is Geocoding?
Geocoding is the process of matching a particular address with a geographic locationon the Earth’s surface. In this study the address corresponds to the location of theincident reported to the police and aggregated to the block-face level, or to one sideof a city block between two consecutive intersections. This is done through matchingrecords in two databases, one containing a list of addresses, the other containinginformation about a street network and the address range within a given block. Thegeocoding tool will match the address with its unique position along the streetnetwork. Since the street network is geo-referenced, or located in geographic spacewith reference to a coordinate system, longitude and latitude values—or X and Yvalues—can be generated for each crime incident. X and Y values in the crimeincident database provide the spatial component that allows for points to be mapped,relative to the street or neighbourhood in which they occurred.
While the UCR2 does not currently collect information on the geographic locationof crime incidents, for the purposes of this study these data were provided by theWinnipeg Police Service (WPS) for each of the approximately 73,000 incidentsreported in 2001.3 The WPS collects the street address of each reported incident.This information was resolved by the WPS to a set of geographical coordinates (Xand Y) for each address. These coordinates were rolled up to the mid-point of ablock-face, and intersection data were compiled.
Mapping techniques
Two methods of displaying crime and other information are used in this study. First,data are displayed as a total for each NCA (see Text Box 1 for NCA description),and second, the pattern of points (individual criminal incidents) is displayed acrossthe City of Winnipeg to indicate the location of high density crime locations or“hot spots”.
Text Box 1: Neighbourhood Characterization Areas
The 230 ‘neighbourhoods’ in this study reflect Neighbourhood CharacterizationAreas (NCAs) (Map 1). The NCA boundaries were formally adopted in the 1980sby the Community Data Network (CDN), a consortium of government and non-government agencies in Winnipeg. The boundaries are based on the collectiveknowledge of many local agencies that helped to establish these and othergeographies including the inner city.
17
Neighbourhood characteristics and the distribution of crime in Winnipeg
Catalogue no. 85-561-MIE2004004
Map 1
Neighbourhood characterization area (NCA) boundaries, Winnipeg, 2001
Boundaries were defined based on information about housing and existingneighbourhoods, natural conditions such as rivers and streams, transportation routes(rail lines and major roadways), and land usage (residential, commercial andindustrial). NCAs are typically smaller and more demographically and socio-economically homogeneous than Statistics Canada’s neighbourhood levelgeographies (i.e., Census Tracts) and more accurately match boundaries used bythe City and other agencies to direct programs. The smaller size of the NCA unitsmakes them a critical geography for many Winnipeg groups and they haveeffectively become the standard for assessing neighbourhood issues.
Winnipeg NCA
Downtown area
N
18
Neighbourhood characteristics and the distribution of crime in Winnipeg
Catalogue no. 85-561-MIE2004004
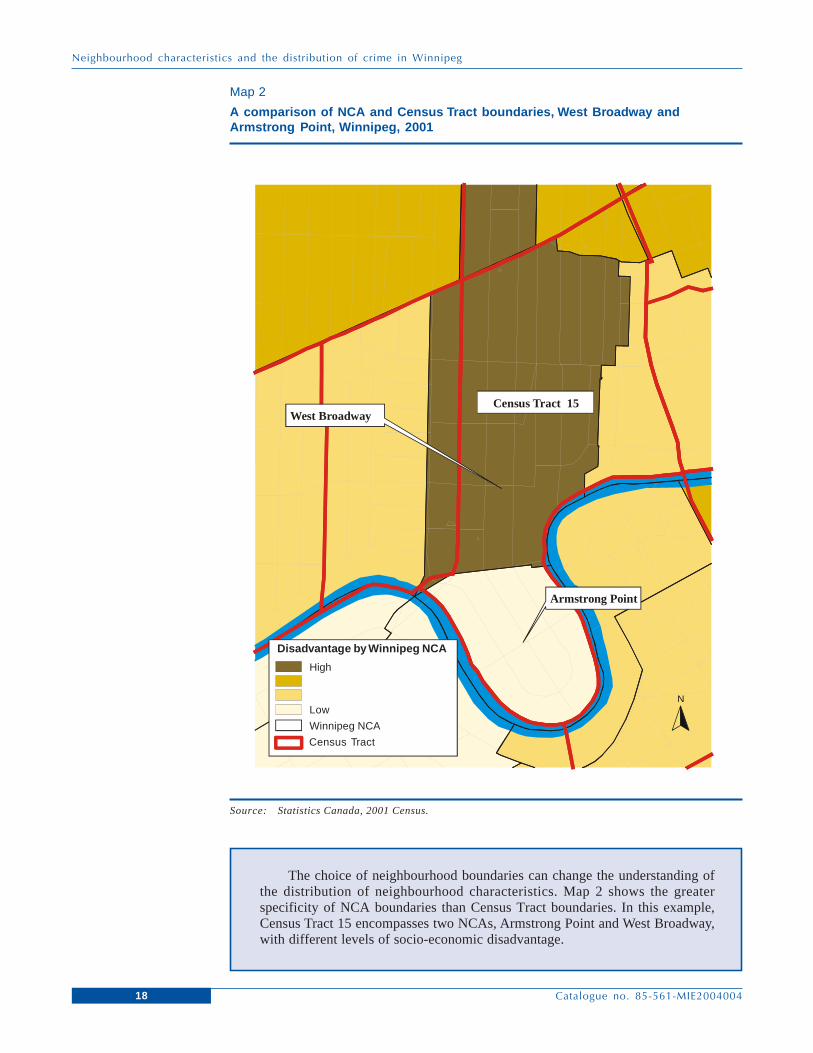
Map 2
A comparison of NCA and Census Tract boundaries, West Broadway andArmstrong Point, Winnipeg, 2001
Source: Statistics Canada, 2001 Census.
The choice of neighbourhood boundaries can change the understanding ofthe distribution of neighbourhood characteristics. Map 2 shows the greaterspecificity of NCA boundaries than Census Tract boundaries. In this example,Census Tract 15 encompasses two NCAs, Armstrong Point and West Broadway,with different levels of socio-economic disadvantage.
Armstrong Point
West BroadwayCensus Tract 15
N
Disadvantage by Winnipeg NCA
Census Tract
High
Low
Winnipeg NCA
19
Neighbourhood characteristics and the distribution of crime in Winnipeg
Catalogue no. 85-561-MIE2004004
Mapping NCAs
By combining the crime incident codes with an X and Y value, point distributionswere generated for specific crime types, time of incidents, and other data from theUCR database. Using the Geographic Information System (GIS), point data wereoverlaid on top of NCAs. Crime incidents were then calculated as a total for eachNCA.
Mapping “hot spots”: Kernel analysis
Kernel analysis is an alternative method of making sense of the spatial distributionof crime data. The method makes it possible to examine crime incident point dataacross neighbourhood boundaries and to see natural distributions and the locationof concentrations of incidents. The goal of kernel analysis is to estimate how thedensity of events varies across a study area based on a point pattern. Kernel estimationwas originally developed to estimate probability density from a sample of observations(Bailey and Gatrell 1995). When applied to spatial data, kernel analysis creates asmooth map of density values in which the density at each location reflects theconcentration of points in a given area.
In kernel estimation, a grid is overlaid on the study area. Distances are measuredfrom the centre of a grid cell to each observation that falls within a predefinedregion of influence known as a bandwidth. The grid cell size for single kernelestimation in this study was about 110 meters squared. Each observation contributesto the density value of that grid cell based on its distance from the centre. Nearbyobservations are given more weight in the density calculation than those fartheraway.
The product of the kernel estimation method is a simple matrix of dots (rasterimage) displaying contours of varying density. Contour loops define the boundariesof hot spot areas. Hot spots may be irregular in shape, and they are not limited byneighbourhood or other boundaries. This method of analysis was applied usingEnvironmental Systems Research Institute (ESRI) Spatial Analyst software.
The dual kernel method is also used in this study in order to examine thedistribution of two variables simultaneously (for example crime and population atrisk).4 The dual kernel method was applied using CrimeStat 2.0 spatial statisticsmodelling software.
20
Neighbourhood characteristics and the distribution of crime in Winnipeg
Catalogue no. 85-561-MIE2004004
Findings
Winnipeg in context
In 2001, the Winnipeg Census Metropolitan Area (CMA), with a population of671,274, ranked eighth in terms of size among the 25 CMAs in Canada.5 The 2001population was up 0.6% from 1996 (667,093), a rate of change that was similar tothe average percentage change (0.7%) over the same period for the 25 CMAs. In2001, the Winnipeg CMA represented approximately 60% of the population of theprovince of Manitoba.
The City of Winnipeg, which is the focus of this demonstration study, fallswithin the larger CMA boundary and covers approximately 475 square kilometres,with a perimeter of 130 kilometres encompassing 230 neighbourhoods orNeighbourhood Characterization Areas (see definition in Text Box 1). The populationof the study area in 2001 was 610,455. The area is served entirely by the WinnipegPolice Service, which employed a force of 1,127 officers operating out of 6 policestations and 8 community-based policing service centres.
Zoning in Winnipeg is composed of roughly 19% single-family, 5.3% multiple-family and other types of residential; 3% commercial; 13% industrial; 7% parks andrecreation areas; 35% agricultural and rural residential district; 0.5% downtownresidential (primarily multiple-family); and 0.5% downtown non-residential (primarilycommercial). This zoning accounts for roughly 83% of the 475 square kilometreswithin the study area boundary. The remaining 17% is associated with spaces suchas street right of ways, rivers and other natural features.
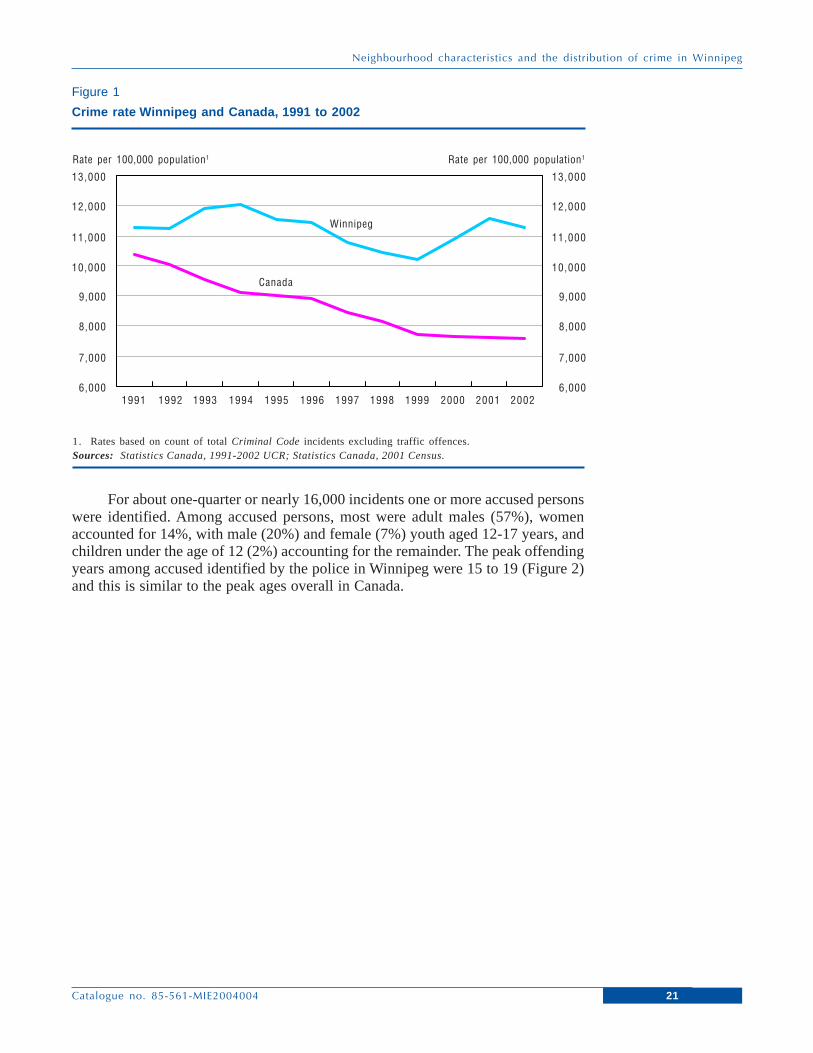
Since the mid 1990’s, the CMA of Winnipeg has reported crime rates amongthe highest in the country. In 2001, the CMA ranked 4th behind Regina, Saskatoonand Vancouver. Figure 1 compares Winnipeg’s crime rate to the overall rate in Canadafrom 1991 to 2002. While both rates were generally declining in the 1990s, thedrop was been less dramatic in Winnipeg, and beginning in 1999, Winnipegexperienced three years of increase prior to 2002.
Categories of offences considered in this study include: violent, property, drug,prostitution, offensive weapons, and gaming and betting offences. In 2001, theWinnipeg Police Service reported over 66,000 of these incidents, the vast majorityof which were property crimes (83%), followed by violent (15%), and other offences(2%) including prostitution, drugs, offensive weapons and gaming and betting. Theseresults are similar to the distribution of offences in Canada overall in 2001 (79%,17% and 4%), as well as the results reported by other police services in the Westincluding Calgary, Edmonton and Regina.
21
Neighbourhood characteristics and the distribution of crime in Winnipeg
Catalogue no. 85-561-MIE2004004
Figure 1
Crime rate Winnipeg and Canada, 1991 to 2002
Rate per 100,000 population1
13,000
Rate per 100,000 population1
13,000
12,000 12,000
11,000 11,000
10,000 10,000
9,000 9,000
8,000 8,000
7,000 7,000
6,000 6,000
Winnipeg
Canada
1. Rates based on count of total Criminal Code incidents excluding traffic offences.Sources: Statistics Canada, 1991-2002 UCR; Statistics Canada, 2001 Census.
1991 1992 1993 1994 1995 1996 1997 1998 1999 2000 2001 2002
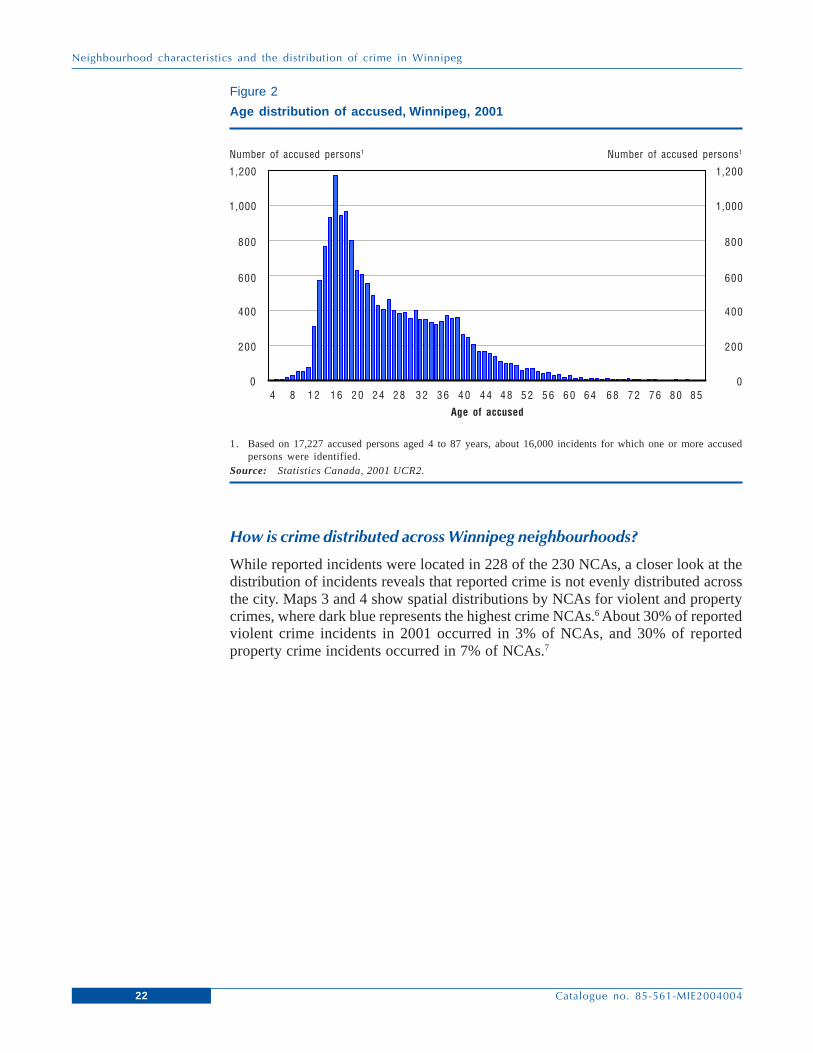
For about one-quarter or nearly 16,000 incidents one or more accused personswere identified. Among accused persons, most were adult males (57%), womenaccounted for 14%, with male (20%) and female (7%) youth aged 12-17 years, andchildren under the age of 12 (2%) accounting for the remainder. The peak offendingyears among accused identified by the police in Winnipeg were 15 to 19 (Figure 2)and this is similar to the peak ages overall in Canada.
22
Neighbourhood characteristics and the distribution of crime in Winnipeg
Catalogue no. 85-561-MIE2004004
How is crime distributed across Winnipeg neighbourhoods?
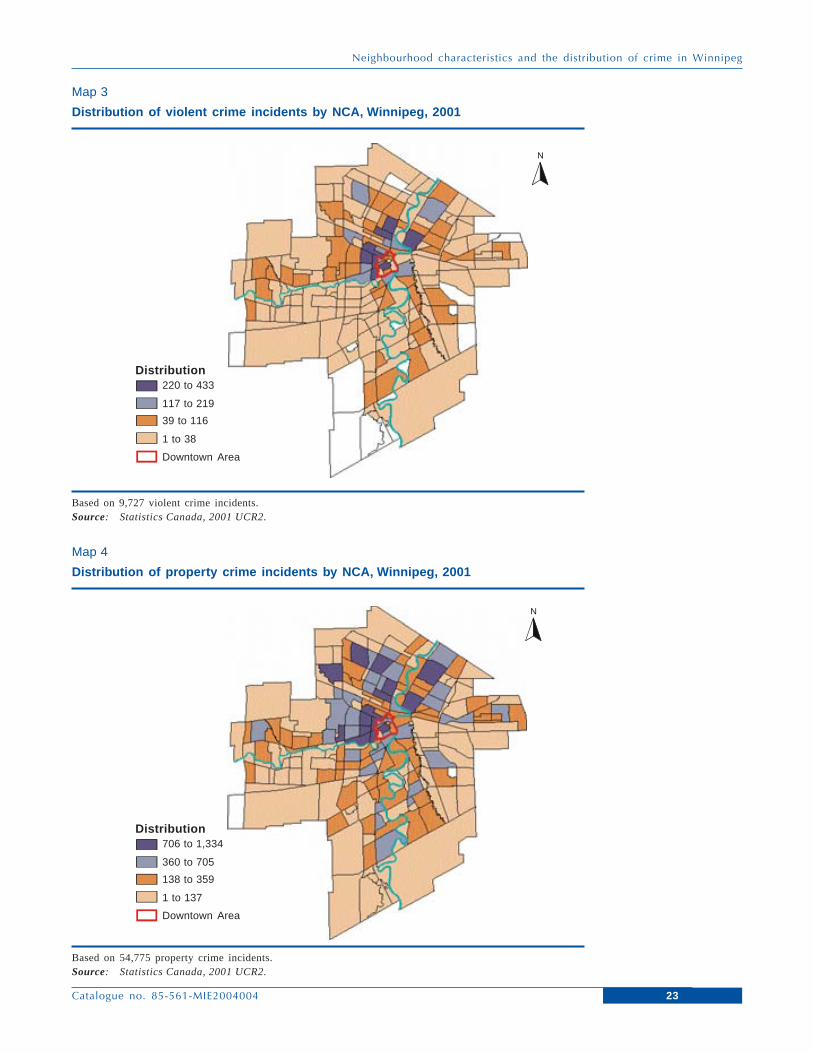
While reported incidents were located in 228 of the 230 NCAs, a closer look at thedistribution of incidents reveals that reported crime is not evenly distributed acrossthe city. Maps 3 and 4 show spatial distributions by NCAs for violent and propertycrimes, where dark blue represents the highest crime NCAs.6 About 30% of reportedviolent crime incidents in 2001 occurred in 3% of NCAs, and 30% of reportedproperty crime incidents occurred in 7% of NCAs.7
Figure 2
Age distribution of accused, Winnipeg, 2001
Number of accused persons1
1,200
Number of accused persons1
1,200
1,000 1,000
800 800
600 600
400 400
200 200
0 0
1. Based on 17,227 accused persons aged 4 to 87 years, about 16,000 incidents for which one or more accusedpersons were identified.
Source: Statistics Canada, 2001 UCR2.
4 8 12 16 20 24 28 32 36 40 44 48
Age of accused
52 56 60 64 68 72 76 80 85
23
Neighbourhood characteristics and the distribution of crime in Winnipeg
Catalogue no. 85-561-MIE2004004
Map 3
Distribution of violent crime incidents by NCA, Winnipeg, 2001
Based on 9,727 violent crime incidents.Source: Statistics Canada, 2001 UCR2.
Map 4
Distribution of property crime incidents by NCA, Winnipeg, 2001
Based on 54,775 property crime incidents.Source: Statistics Canada, 2001 UCR2.
N
Distribution
Downtown Area
706 to 1,334
360 to 705
138 to 359
1 to 137
Distribution
Downtown Area
220 to 433
117 to 219
39 to 116
1 to 38
N
24
Neighbourhood characteristics and the distribution of crime in Winnipeg
Catalogue no. 85-561-MIE2004004
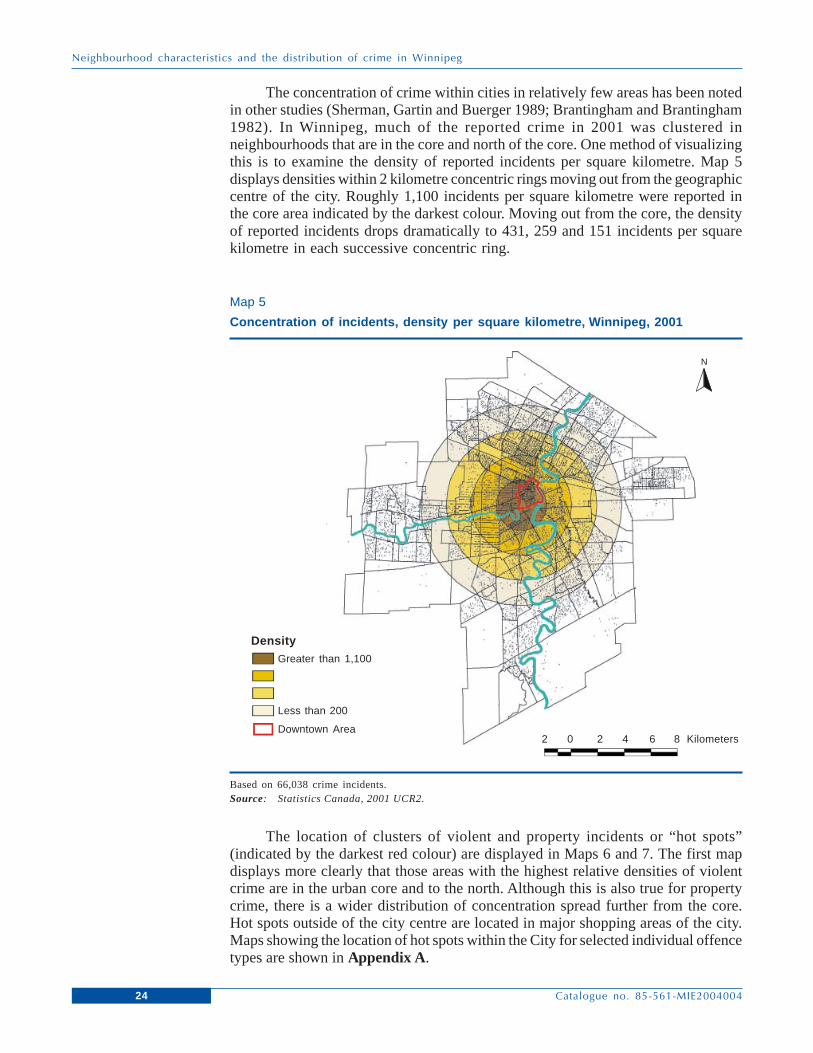
The concentration of crime within cities in relatively few areas has been notedin other studies (Sherman, Gartin and Buerger 1989; Brantingham and Brantingham1982). In Winnipeg, much of the reported crime in 2001 was clustered inneighbourhoods that are in the core and north of the core. One method of visualizingthis is to examine the density of reported incidents per square kilometre. Map 5displays densities within 2 kilometre concentric rings moving out from the geographiccentre of the city. Roughly 1,100 incidents per square kilometre were reported inthe core area indicated by the darkest colour. Moving out from the core, the densityof reported incidents drops dramatically to 431, 259 and 151 incidents per squarekilometre in each successive concentric ring.
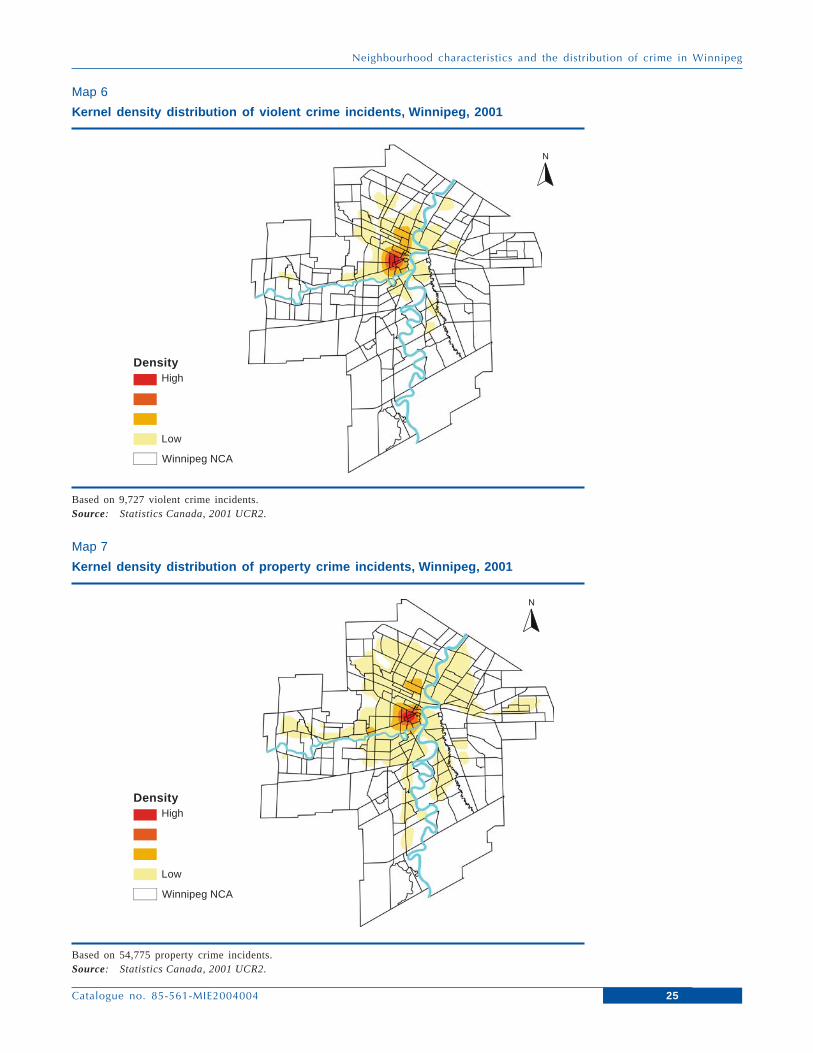
The location of clusters of violent and property incidents or “hot spots”(indicated by the darkest red colour) are displayed in Maps 6 and 7. The first mapdisplays more clearly that those areas with the highest relative densities of violentcrime are in the urban core and to the north. Although this is also true for propertycrime, there is a wider distribution of concentration spread further from the core.Hot spots outside of the city centre are located in major shopping areas of the city.Maps showing the location of hot spots within the City for selected individual offencetypes are shown in Appendix A.
Map 5
Concentration of incidents, density per square kilometre, Winnipeg, 2001
Based on 66,038 crime incidents.Source: Statistics Canada, 2001 UCR2.
N
DensityGreater than 1,100
Less than 200
Downtown AreaKilometers2 0 2 4 6 8
25
Neighbourhood characteristics and the distribution of crime in Winnipeg
Catalogue no. 85-561-MIE2004004
Map 6
Kernel density distribution of violent crime incidents, Winnipeg, 2001
Based on 9,727 violent crime incidents.Source: Statistics Canada, 2001 UCR2.
Map 7
Kernel density distribution of property crime incidents, Winnipeg, 2001
Based on 54,775 property crime incidents.Source: Statistics Canada, 2001 UCR2.
N
N
DensityHigh
Low
Winnipeg NCA
DensityHigh
Low
Winnipeg NCA
26
Neighbourhood characteristics and the distribution of crime in Winnipeg
Catalogue no. 85-561-MIE2004004
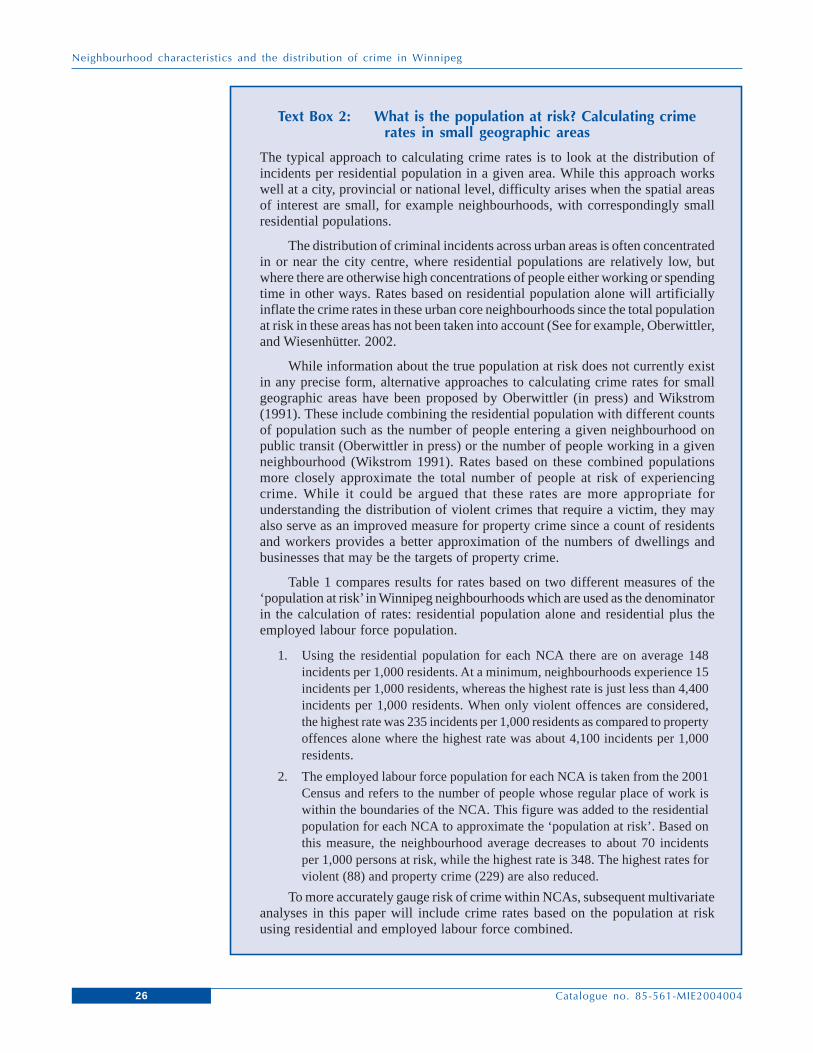
Text Box 2: What is the population at risk? Calculating crimerates in small geographic areas
The typical approach to calculating crime rates is to look at the distribution ofincidents per residential population in a given area. While this approach workswell at a city, provincial or national level, difficulty arises when the spatial areasof interest are small, for example neighbourhoods, with correspondingly smallresidential populations.
The distribution of criminal incidents across urban areas is often concentratedin or near the city centre, where residential populations are relatively low, butwhere there are otherwise high concentrations of people either working or spendingtime in other ways. Rates based on residential population alone will artificiallyinflate the crime rates in these urban core neighbourhoods since the total populationat risk in these areas has not been taken into account (See for example, Oberwittler,and Wiesenhütter. 2002.
While information about the true population at risk does not currently existin any precise form, alternative approaches to calculating crime rates for smallgeographic areas have been proposed by Oberwittler (in press) and Wikstrom(1991). These include combining the residential population with different countsof population such as the number of people entering a given neighbourhood onpublic transit (Oberwittler in press) or the number of people working in a givenneighbourhood (Wikstrom 1991). Rates based on these combined populationsmore closely approximate the total number of people at risk of experiencingcrime. While it could be argued that these rates are more appropriate forunderstanding the distribution of violent crimes that require a victim, they mayalso serve as an improved measure for property crime since a count of residentsand workers provides a better approximation of the numbers of dwellings andbusinesses that may be the targets of property crime.
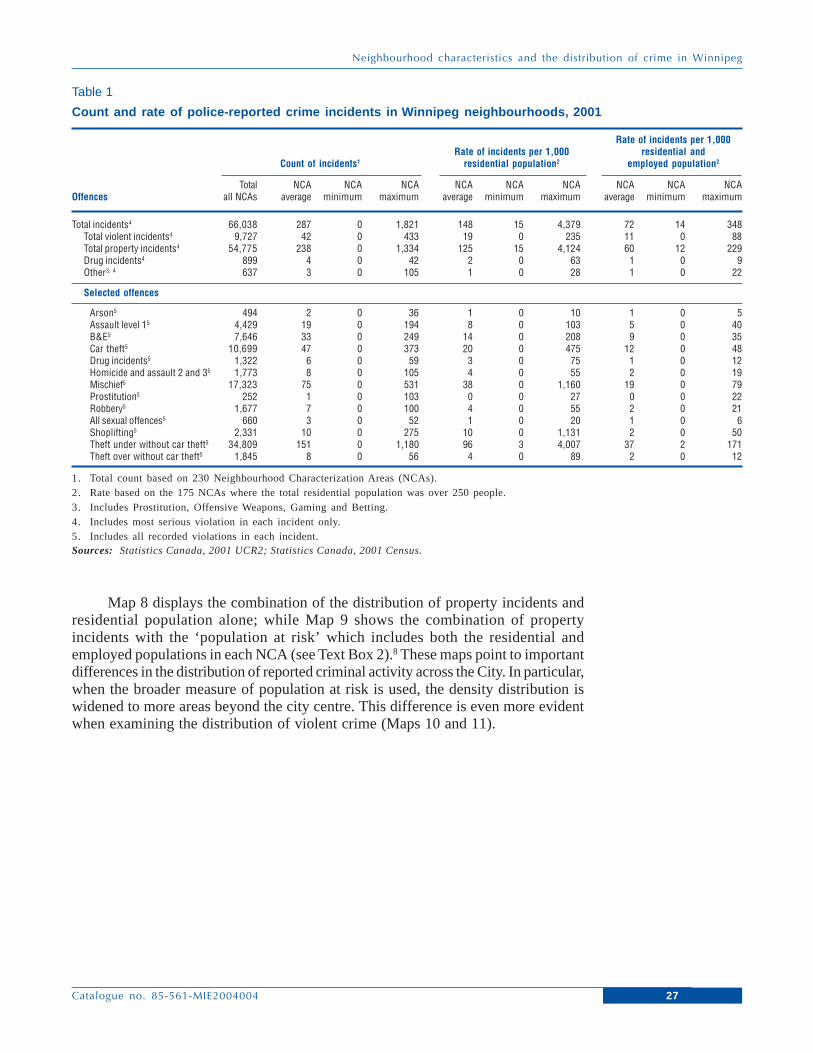
Table 1 compares results for rates based on two different measures of the‘population at risk’ in Winnipeg neighbourhoods which are used as the denominatorin the calculation of rates: residential population alone and residential plus theemployed labour force population.
1. Using the residential population for each NCA there are on average 148incidents per 1,000 residents. At a minimum, neighbourhoods experience 15incidents per 1,000 residents, whereas the highest rate is just less than 4,400incidents per 1,000 residents. When only violent offences are considered,the highest rate was 235 incidents per 1,000 residents as compared to propertyoffences alone where the highest rate was about 4,100 incidents per 1,000residents.
2. The employed labour force population for each NCA is taken from the 2001Census and refers to the number of people whose regular place of work iswithin the boundaries of the NCA. This figure was added to the residentialpopulation for each NCA to approximate the ‘population at risk’. Based onthis measure, the neighbourhood average decreases to about 70 incidentsper 1,000 persons at risk, while the highest rate is 348. The highest rates forviolent (88) and property crime (229) are also reduced.
To more accurately gauge risk of crime within NCAs, subsequent multivariateanalyses in this paper will include crime rates based on the population at riskusing residential and employed labour force combined.
27
Neighbourhood characteristics and the distribution of crime in Winnipeg
Catalogue no. 85-561-MIE2004004
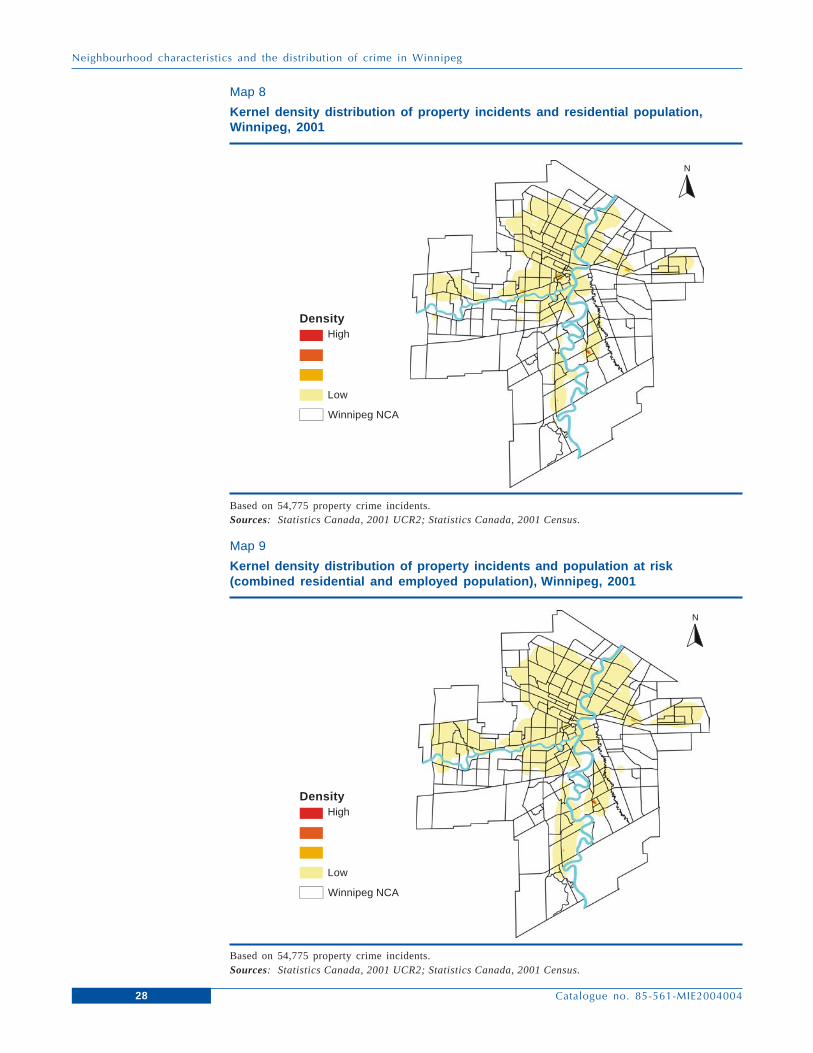
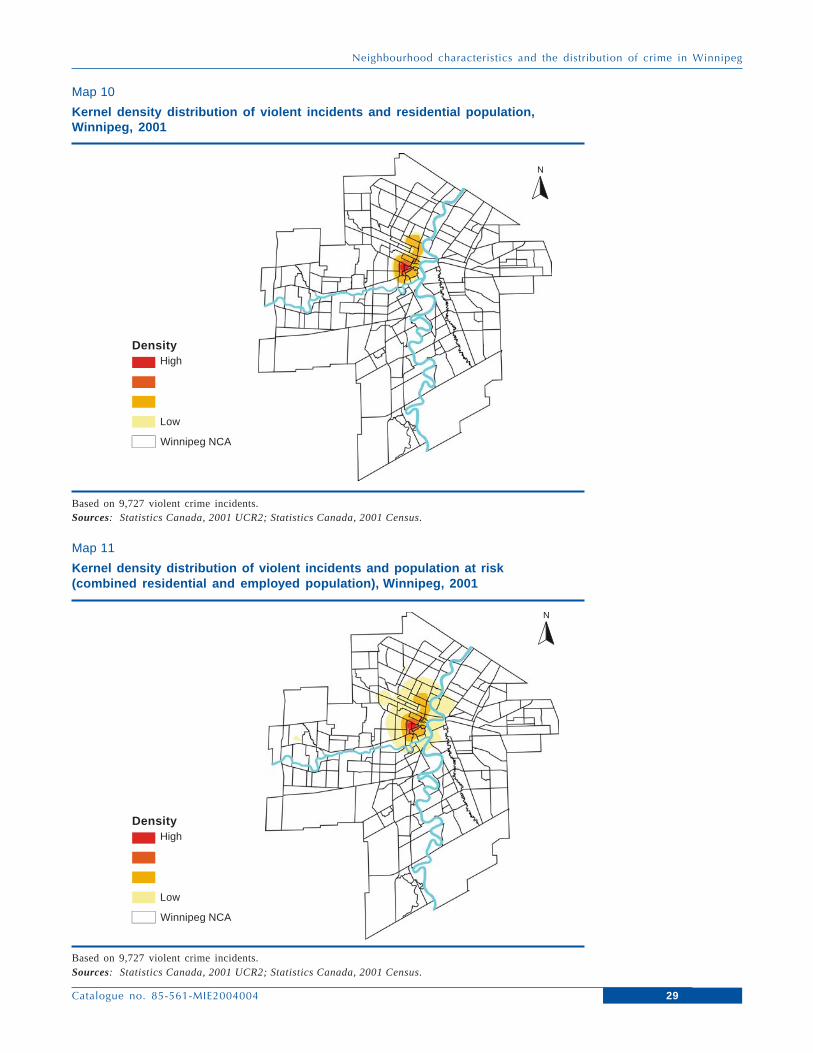
Map 8 displays the combination of the distribution of property incidents andresidential population alone; while Map 9 shows the combination of propertyincidents with the ‘population at risk’ which includes both the residential andemployed populations in each NCA (see Text Box 2).8 These maps point to importantdifferences in the distribution of reported criminal activity across the City. In particular,when the broader measure of population at risk is used, the density distribution iswidened to more areas beyond the city centre. This difference is even more evidentwhen examining the distribution of violent crime (Maps 10 and 11).
Table 1
Count and rate of police-reported crime incidents in Winnipeg neighbourhoods, 2001
Rate of incidents per 1,000Rate of incidents per 1,000 residential and
Count of incidents1 residential population2 employed population2
Total NCA NCA NCA NCA NCA NCA NCA NCA NCAOffences all NCAs average minimum maximum average minimum maximum average minimum maximum
Total incidents4 66,038 287 0 1,821 148 15 4,379 72 14 348Total violent incidents4 9,727 42 0 433 19 0 235 11 0 88Total property incidents4 54,775 238 0 1,334 125 15 4,124 60 12 229Drug incidents4 899 4 0 42 2 0 63 1 0 9Other3, 4 637 3 0 105 1 0 28 1 0 22
Selected offences
Arson5 494 2 0 36 1 0 10 1 0 5Assault level 15 4,429 19 0 194 8 0 103 5 0 40B&E5 7,646 33 0 249 14 0 208 9 0 35Car theft5 10,699 47 0 373 20 0 475 12 0 48Drug incidents5 1,322 6 0 59 3 0 75 1 0 12Homicide and assault 2 and 35 1,773 8 0 105 4 0 55 2 0 19Mischief5 17,323 75 0 531 38 0 1,160 19 0 79Prostitution5 252 1 0 103 0 0 27 0 0 22Robbery5 1,677 7 0 100 4 0 55 2 0 21All sexual offences5 660 3 0 52 1 0 20 1 0 6Shoplifting5 2,331 10 0 275 10 0 1,131 2 0 50Theft under without car theft5 34,809 151 0 1,180 96 3 4,007 37 2 171Theft over without car theft5 1,845 8 0 56 4 0 89 2 0 12
1. Total count based on 230 Neighbourhood Characterization Areas (NCAs).2. Rate based on the 175 NCAs where the total residential population was over 250 people.3. Includes Prostitution, Offensive Weapons, Gaming and Betting.4. Includes most serious violation in each incident only.5. Includes all recorded violations in each incident.Sources: Statistics Canada, 2001 UCR2; Statistics Canada, 2001 Census.
28
Neighbourhood characteristics and the distribution of crime in Winnipeg
Catalogue no. 85-561-MIE2004004
Map 8
Kernel density distribution of property incidents and residential population,Winnipeg, 2001
Based on 54,775 property crime incidents.Sources: Statistics Canada, 2001 UCR2; Statistics Canada, 2001 Census.
Map 9
Kernel density distribution of property incidents and population at risk(combined residential and employed population), Winnipeg, 2001
Based on 54,775 property crime incidents.Sources: Statistics Canada, 2001 UCR2; Statistics Canada, 2001 Census.
DensityHigh
Low
Winnipeg NCA
DensityHigh
Low
Winnipeg NCA
N
N
29
Neighbourhood characteristics and the distribution of crime in Winnipeg
Catalogue no. 85-561-MIE2004004
Map 10
Kernel density distribution of violent incidents and residential population,Winnipeg, 2001
Based on 9,727 violent crime incidents.Sources: Statistics Canada, 2001 UCR2; Statistics Canada, 2001 Census.
Map 11
Kernel density distribution of violent incidents and population at risk(combined residential and employed population), Winnipeg, 2001
Based on 9,727 violent crime incidents.Sources: Statistics Canada, 2001 UCR2; Statistics Canada, 2001 Census.
DensityHigh
Low
Winnipeg NCA
DensityHigh
Low
Winnipeg NCA
N
N

30
Neighbourhood characteristics and the distribution of crime in Winnipeg
Catalogue no. 85-561-MIE2004004
How does the spatial pattern of incidents change by time of day?
In combination with the location of crime, the time of occurrence is particularlyimportant from the perspective of a crime reduction strategy. Although criminalincidents can occur at any time, research indicates that different types of crimes areconcentrated at certain times of the day (Assuncao, Beato and Silva. 2002.
As an example, distributions of reported incidents of robbery by time of dayfor all reported incidents in 2001 are shown in Figure 3. Since criminal offencesmay occur over an extended period of time, the UCR2 survey collects both thereported starting time of the offence and the reported completion time. Columns inthe figure below represent the reported completion time of the incidents. A patternemerges for robbery offences with the fewest incidents occurring in the morninghours and the peak occurring in the evening before midnight.
Figure 3
Robbery incidents by time of day, Winnipeg, 20011
Total number of reported incidentsby hour in 2001140
Total number of reported incidentsby hour in 2001
140
120 120
100 100
80 80
60 60
40 40
0 0
1. Includes 1,652 reported robbery incidents where the time of the incident was known.Source: Statistics Canada, 2001 UCR2.
20:0
0-20
:59
19:0
0-19
:59
18:0
0-18
:59
17:0
0-17
:59
16:0
0-16
:59
15:0
0-15
:59
14:0
0-14
:59
13:0
0-13
:59
12:0
0-12
:59
11:0
0-11
:59
10:0
0-10
:59
9:00
-9:5
9
Hour
8:00
-8:5
9
7:00
-7:5
9
6:00
-6:5
9
5:00
-5:5
9
4:00
-4:5
9
3:00
-3:5
9
2:00
-2:5
9
1:00
-1:5
9
24:0
0-0:
59
2 0 20
23:0
0-23
:59
22:0
0-22
:59
21:0
0-21
:59
Maps 12 through 14 show the distribution of robbery incident hot spots atthree points during the day: morning (7:00 to 9:00); evening (20:00 to 22:00) andnight (1:00 to 3:00). In 2001, 4% of reported robberies occurred between 7:00 and9:00 AM, 14% between 8:00 and 10:00 PM and 12% between 1:00 and 3:00 AM.The spatial distributions differ depending on the time of day, with variation in boththe amount of crime and also in the location of the highest crime density areas or‘hot spots’ identified by the darkest red colour.

31
Neighbourhood characteristics and the distribution of crime in Winnipeg
Catalogue no. 85-561-MIE2004004
Map 12
Kernel density distribution of morning robbery incidents, 7:00-9:00 AM,Winnipeg, 2001
Based on 52 robbery incidents occurring from 7:00-9:00 AM in 2001.Source: Statistics Canada, 2001 UCR2.
Map 13
Kernel density distribution of evening robbery incidents, 8:00-10:00 PM,Winnipeg, 2001
Based on 254 robbery incidents occurring from 8:00-10:00 PM in 2001.Source: Statistics Canada, 2001 UCR2.
DensityHigh
Low
Winnipeg NCA
DensityHigh
Low
Winnipeg NCA
N
N
32
Neighbourhood characteristics and the distribution of crime in Winnipeg
Catalogue no. 85-561-MIE2004004
Map 14
Kernel density distribution of night time robbery incidents, 1:00-3:00 AM,Winnipeg, 2001
Based on 220 robbery incidents occurring from 1:00-3:00 AM in 2001.Source: Statistics Canada, 2001 UCR2.
Neighbourhood characteristics and crime within neighbourhoods9
Since the 1940s (Shaw and McKay 1942) numerous studies have documented therelationship between neighbourhood characteristics and rates of crime. These studieshowever, have differed with respect to their emphasis on the importance of factorssuch as low income, residential mobility, ethno-cultural composition, opportunitiesfor criminal behaviour, collective efficacy (or the level of trust and reciprocity in aneighbourhood), and social disorganization (or a decrease in the influence of socialrules over behaviour) (Cohen and Felson 1979; Brantingham & Brantingahm 1982;Roncek & Maier 1991; Sampson and Lauritsen 1994; Sampson et al. 1997;Oberwittler in press).
This section explores the relationship between many of these factors and 2001rates of violent and property crime within Winnipeg NCAs. The analysis makes useof total violent and property crime rates rather than rates for individual offencetypes to maximize the number of incidents being considered. The analysis is basedon Neighbourhood Characterization Areas with residential populations greater than250 people. Statistics Canada suppresses income data for geographies below thislevel for reasons of confidentiality and data quality.10 As a result, only 175 of the230 Neighbourhood Characterization Areas are included.
Characteristics considered in this analysis have been derived from the 2001Census and City of Winnipeg zoning data and are outlined in the Description ofVariables section above.
N
DensityHigh
Low
Winnipeg NCA
33
Neighbourhood characteristics and the distribution of crime in Winnipeg
Catalogue no. 85-561-MIE2004004
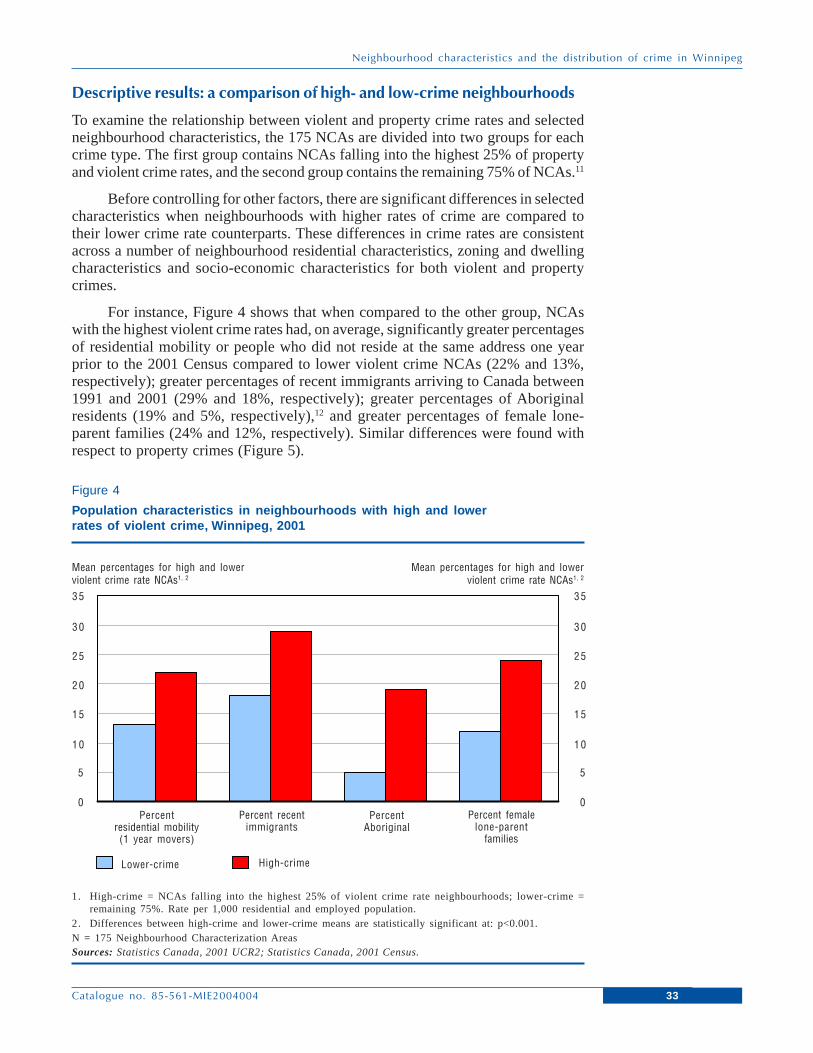
Descriptive results: a comparison of high- and low-crime neighbourhoods
To examine the relationship between violent and property crime rates and selectedneighbourhood characteristics, the 175 NCAs are divided into two groups for eachcrime type. The first group contains NCAs falling into the highest 25% of propertyand violent crime rates, and the second group contains the remaining 75% of NCAs.11
Before controlling for other factors, there are significant differences in selectedcharacteristics when neighbourhoods with higher rates of crime are compared totheir lower crime rate counterparts. These differences in crime rates are consistentacross a number of neighbourhood residential characteristics, zoning and dwellingcharacteristics and socio-economic characteristics for both violent and propertycrimes.
For instance, Figure 4 shows that when compared to the other group, NCAswith the highest violent crime rates had, on average, significantly greater percentagesof residential mobility or people who did not reside at the same address one yearprior to the 2001 Census compared to lower violent crime NCAs (22% and 13%,respectively); greater percentages of recent immigrants arriving to Canada between1991 and 2001 (29% and 18%, respectively); greater percentages of Aboriginalresidents (19% and 5%, respectively),12 and greater percentages of female lone-parent families (24% and 12%, respectively). Similar differences were found withrespect to property crimes (Figure 5).
Figure 4
Population characteristics in neighbourhoods with high and lowerrates of violent crime, Winnipeg, 2001
Mean percentages for high and lowerviolent crime rate NCAs1, 2
35
Mean percentages for high and lowerviolent crime rate NCAs1, 2
35
30 30
25 25
20 20
15 15
10 10
0 0
1. High-crime = NCAs falling into the highest 25% of violent crime rate neighbourhoods; lower-crime =remaining 75%. Rate per 1,000 residential and employed population.
2. Differences between high-crime and lower-crime means are statistically significant at: p<0.001.N = 175 Neighbourhood Characterization AreasSources: Statistics Canada, 2001 UCR2; Statistics Canada, 2001 Census.
5 5
Percentresidential mobility(1 year movers)
Percent recentimmigrants
PercentAboriginal
Percent femalelone-parent
families
Lower-crime High-crime

34
Neighbourhood characteristics and the distribution of crime in Winnipeg
Catalogue no. 85-561-MIE2004004
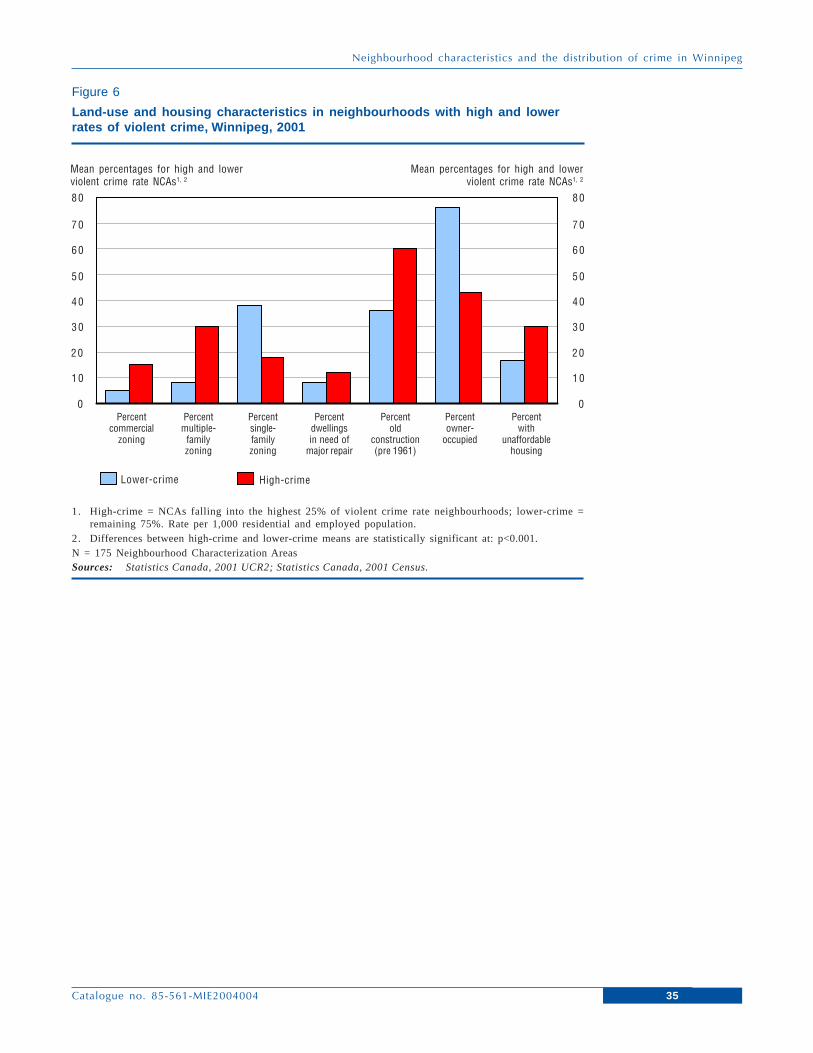
With respect to land-use characteristics, neighbourhoods with the highest rateof violent crime had significantly greater proportions of commercial zoning thanlower crime neighbourhoods (15% and 5%, respectively); greater proportions ofmultiple-family residential zoning (30% and 8%, respectively); and lower levels ofsingle-family zoning (18% and 38%, respectively) (Figure 6). On average, a greaterproportion of housing in high violent crime rate areas was in need of major repairs(12% and 8%, respectively) and was older, built before 1961 (60% and 36%,respectively). There were also lower proportions of owner-occupied dwellings inhigh violent crime NCAs (43% and 76%, respectively), and greater proportions ofunaffordable housing represented by households spending more than 30% of theirincome on shelter (30% and 17%, respectively). These differences in land-use andhousing characteristics were similar for property crime (Figure 7).
Figure 5
Population characteristics in neighbourhoods with high and lowerrates of property crime, Winnipeg, 2001
Mean percentages for high and lowerproperty crime rate NCAs1, 2
30
Mean percentages for high and lowerproperty crime rate NCAs1, 2
30
25 25
20 20
15 15
10 10
0 0
1. High-crime = NCAs falling into the highest 25% of property crime rate neighbourhoods; lower-crime =remaining 75%. Rate per 1,000 residential and employed population.
2. Differences between high-crime and lower-crime means are statistically significant at: p<0.001.N = 175 Neighbourhood Characterization AreasSources: Statistics Canada, 2001 UCR2; Statistics Canada, 2001 Census.
5 5
Percentresidential mobility(1 year movers)
Percent recentimmigrants
PercentAboriginal
Percent femalelone-parent
families
Lower-crime High-crime
35
Neighbourhood characteristics and the distribution of crime in Winnipeg
Catalogue no. 85-561-MIE2004004
Figure 6
Land-use and housing characteristics in neighbourhoods with high and lowerrates of violent crime, Winnipeg, 2001
Mean percentages for high and lowerviolent crime rate NCAs1, 2
80
Mean percentages for high and lowerviolent crime rate NCAs1, 2
80
70 70
60 60
50 50
40 40
30 30
0 0
1. High-crime = NCAs falling into the highest 25% of violent crime rate neighbourhoods; lower-crime =remaining 75%. Rate per 1,000 residential and employed population.
2. Differences between high-crime and lower-crime means are statistically significant at: p<0.001.N = 175 Neighbourhood Characterization AreasSources: Statistics Canada, 2001 UCR2; Statistics Canada, 2001 Census.
10 10
Percentcommercial
zoning
Percentmultiple-
familyzoning
Percentsingle-familyzoning
Percentdwellingsin need of
major repair
Lower-crime High-crime
20 20
Percentold
construction(pre 1961)
Percentowner-
occupied
Percentwith
unaffordablehousing

36
Neighbourhood characteristics and the distribution of crime in Winnipeg
Catalogue no. 85-561-MIE2004004
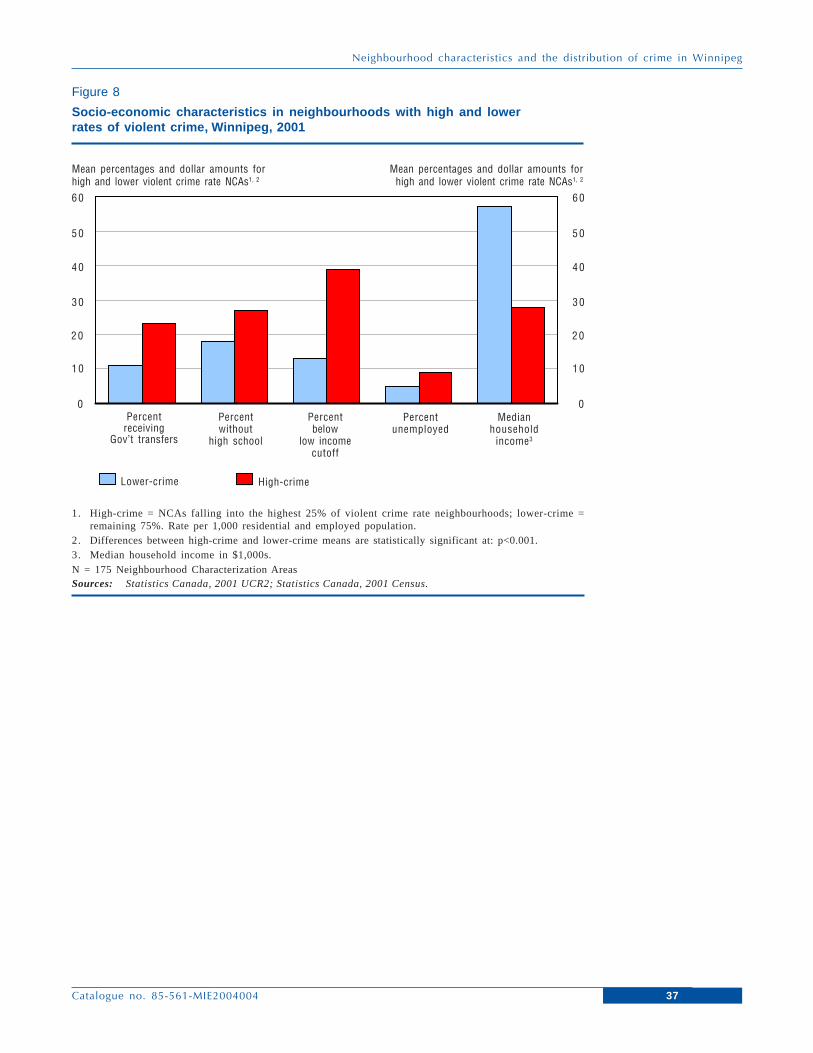
Finally, Figure 8 points to the presence of concentrated socio-economicdisadvantage in higher violent crime rate neighbourhoods, evidenced by significantlygreater percentages of population receiving government transfers (23% and 11%,respectively), without completion of high school (27% and 18%, respectively), withincomes below the low income cut-off (39% and 13%, respectively) and unemployed(9% and 5%, respectively). In addition, these neighbourhoods have significantlylower median household incomes when compared to neighbourhoods with lowerviolent crime rates ($28,000 and $57,000, respectively). Figure 9 indicates similarresults for property crime rates.
Figure 7
Land-use and housing characteristics in neighbourhoods with high and lowerrates of property crime, Winnipeg, 2001
Mean percentages for high and lowerproperty crime rate NCAs1, 2
80
Mean percentages for high and lowerproperty crime rate NCAs1, 2
80
70 70
60 60
50 50
40 40
30 30
0 0
1. High-crime = NCAs falling into the highest 25% of property crime rate neighbourhoods; lower-crime =remaining 75%. Rate per 1,000 residential and employed population.
2. Differences between high-crime and lower-crime means are statistically significant at: p<0.001.N = 175 Neighbourhood Characterization AreasSources: Statistics Canada, 2001 UCR2; Statistics Canada, 2001 Census.
10 10
Lower-crime High-crime
20 20
Percentcommercial
zoning
Percentmultiple-
familyzoning
Percentsingle-familyzoning
Percentdwellingsin need of
major repair
Percentold
construction(pre 1961)
Percentowner-
occupied
Percentwith
unaffordablehousing
37
Neighbourhood characteristics and the distribution of crime in Winnipeg
Catalogue no. 85-561-MIE2004004
Figure 8
Socio-economic characteristics in neighbourhoods with high and lowerrates of violent crime, Winnipeg, 2001
Mean percentages and dollar amounts forhigh and lower violent crime rate NCAs1, 2
60
Mean percentages and dollar amounts forhigh and lower violent crime rate NCAs1, 2
60
50 50
40 40
30 30
0 0
1. High-crime = NCAs falling into the highest 25% of violent crime rate neighbourhoods; lower-crime =remaining 75%. Rate per 1,000 residential and employed population.
2. Differences between high-crime and lower-crime means are statistically significant at: p<0.001.3. Median household income in $1,000s.N = 175 Neighbourhood Characterization AreasSources: Statistics Canada, 2001 UCR2; Statistics Canada, 2001 Census.
10 10
Percentreceiving
Gov’t transfers
Percentwithout
high school
Percentbelow
low incomecutoff
Percentunemployed
Lower-crime High-crime
20 20
Medianhousehold
income3
38
Neighbourhood characteristics and the distribution of crime in Winnipeg
Catalogue no. 85-561-MIE2004004
As would be expected, results for the composite socio-economic disadvantagevariable (based on the combination of the 5 variables, see definition in Descriptionof Variables section) indicate a similar pattern in which the highest crimeneighbourhoods have the highest levels of disadvantage.13
There were, however, no significant neighbourhood differences for some ofthe factors that were analyzed including the proportion of males in the high risk agegroup (15-24 years) and the proportion of older adults aged 64 and over.
Multivariate Results
When considered individually, the neighbourhood characteristics discussed aboveare associated with violent and property crime rates in neighbourhoods. However,the extent of this association can vary when multiple characteristics are consideredtogether. Multivariate analysis in this section is used to examine the interrelationshipsamong variables and to observe how they relate to the level of crime after takingother factors into account.14
Many of the neighbourhood characteristics in this study are highly correlatedwith each other or convey essentially the same information. This multicollinearitybetween factors stems from the strong association among many of the structuralfactors that are individually linked to crime (Land, McCall & Cohen 1990).
Figure 9
Socio-economic characteristics in neighbourhoods with high and lowerrates of property crime, Winnipeg, 2001
Mean percentages and dollar amounts forhigh and lower property crime rate NCAs1, 2
60
Mean percentages and dollar amounts forhigh and lower property crime rate NCAs1, 2
60
50 50
40 40
30 30
0 0
1. High-crime = NCAs falling into the highest 25% of property crime rate neighbourhoods; lower-crime =remaining 75%. Rate per 1,000 residential and employed population.
2. Differences between high-crime and lower-crime means are statistically significant at: p<0.001.3. Median household income in $1,000s.N = 175 Neighbourhood Characterization AreasSources: Statistics Canada, 2001 UCR2; Statistics Canada, 2001 Census.
10 10
Percentreceiving
Gov’t transfers
Percent withouthigh school
Percentbelow
low incomecutoff
Percentunemployed
Lower-crime High-crime
20 20
Medianhousehold
income3
39
Neighbourhood characteristics and the distribution of crime in Winnipeg
Catalogue no. 85-561-MIE2004004
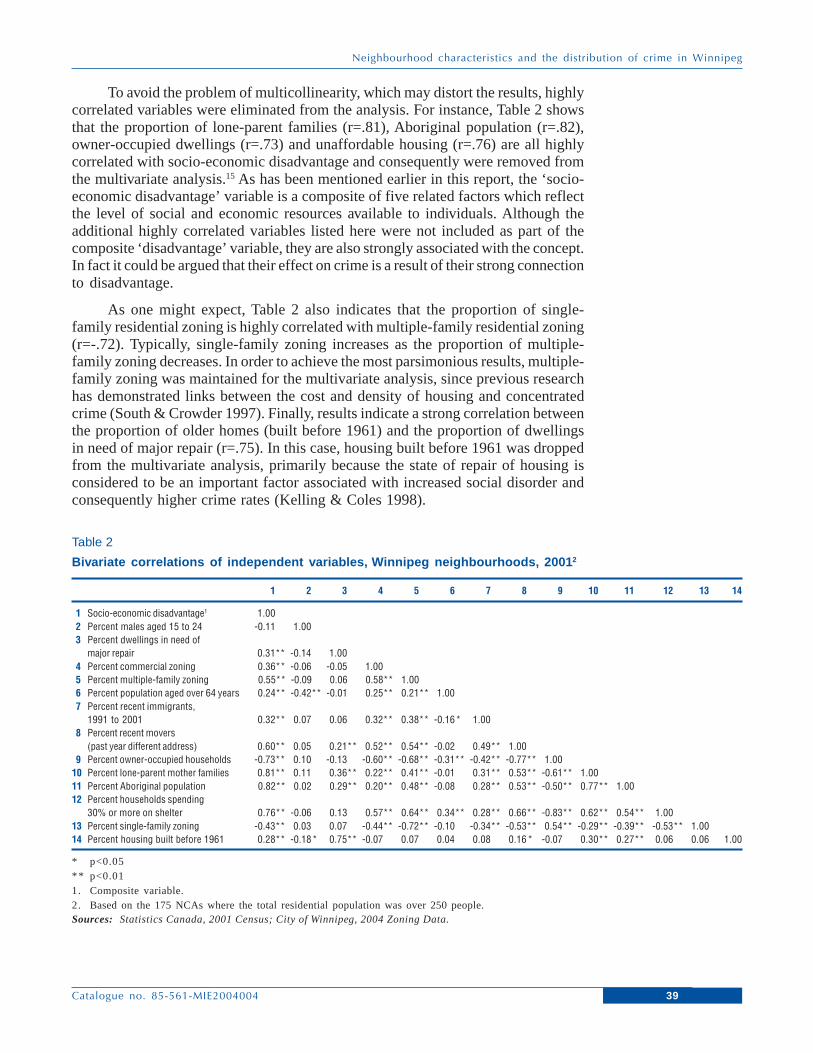
To avoid the problem of multicollinearity, which may distort the results, highlycorrelated variables were eliminated from the analysis. For instance, Table 2 showsthat the proportion of lone-parent families (r=.81), Aboriginal population (r=.82),owner-occupied dwellings (r=.73) and unaffordable housing (r=.76) are all highlycorrelated with socio-economic disadvantage and consequently were removed fromthe multivariate analysis.15 As has been mentioned earlier in this report, the ‘socio-economic disadvantage’ variable is a composite of five related factors which reflectthe level of social and economic resources available to individuals. Although theadditional highly correlated variables listed here were not included as part of thecomposite ‘disadvantage’ variable, they are also strongly associated with the concept.In fact it could be argued that their effect on crime is a result of their strong connectionto disadvantage.
As one might expect, Table 2 also indicates that the proportion of single-family residential zoning is highly correlated with multiple-family residential zoning(r=-.72). Typically, single-family zoning increases as the proportion of multiple-family zoning decreases. In order to achieve the most parsimonious results, multiple-family zoning was maintained for the multivariate analysis, since previous researchhas demonstrated links between the cost and density of housing and concentratedcrime (South & Crowder 1997). Finally, results indicate a strong correlation betweenthe proportion of older homes (built before 1961) and the proportion of dwellingsin need of major repair (r=.75). In this case, housing built before 1961 was droppedfrom the multivariate analysis, primarily because the state of repair of housing isconsidered to be an important factor associated with increased social disorder andconsequently higher crime rates (Kelling & Coles 1998).
Table 2
Bivariate correlations of independent variables, Winnipeg neighbourhoods, 20012
1 2 3 4 5 6 7 8 9 10 11 12 13 14
1 Socio-economic disadvantage1 1.002 Percent males aged 15 to 24 -0.11 1.003 Percent dwellings in need of
major repair 0.31** -0.14 1.004 Percent commercial zoning 0.36** -0.06 -0.05 1.005 Percent multiple-family zoning 0.55** -0.09 0.06 0.58** 1.006 Percent population aged over 64 years 0.24** -0.42** -0.01 0.25** 0.21** 1.007 Percent recent immigrants,
1991 to 2001 0.32** 0.07 0.06 0.32** 0.38** -0.16* 1.008 Percent recent movers
(past year different address) 0.60** 0.05 0.21** 0.52** 0.54** -0.02 0.49** 1.009 Percent owner-occupied households -0.73** 0.10 -0.13 -0.60** -0.68** -0.31** -0.42** -0.77** 1.00
10 Percent lone-parent mother families 0.81** 0.11 0.36** 0.22** 0.41** -0.01 0.31** 0.53** -0.61** 1.0011 Percent Aboriginal population 0.82** 0.02 0.29** 0.20** 0.48** -0.08 0.28** 0.53** -0.50** 0.77** 1.0012 Percent households spending
30% or more on shelter 0.76** -0.06 0.13 0.57** 0.64** 0.34** 0.28** 0.66** -0.83** 0.62** 0.54** 1.0013 Percent single-family zoning -0.43** 0.03 0.07 -0.44** -0.72** -0.10 -0.34** -0.53** 0.54** -0.29** -0.39** -0.53** 1.0014 Percent housing built before 1961 0.28** -0.18* 0.75** -0.07 0.07 0.04 0.08 0.16* -0.07 0.30** 0.27** 0.06 0.06 1.00
* p<0.05* * p<0.011. Composite variable.2. Based on the 175 NCAs where the total residential population was over 250 people.Sources: Statistics Canada, 2001 Census; City of Winnipeg, 2004 Zoning Data.

40
Neighbourhood characteristics and the distribution of crime in Winnipeg
Catalogue no. 85-561-MIE2004004
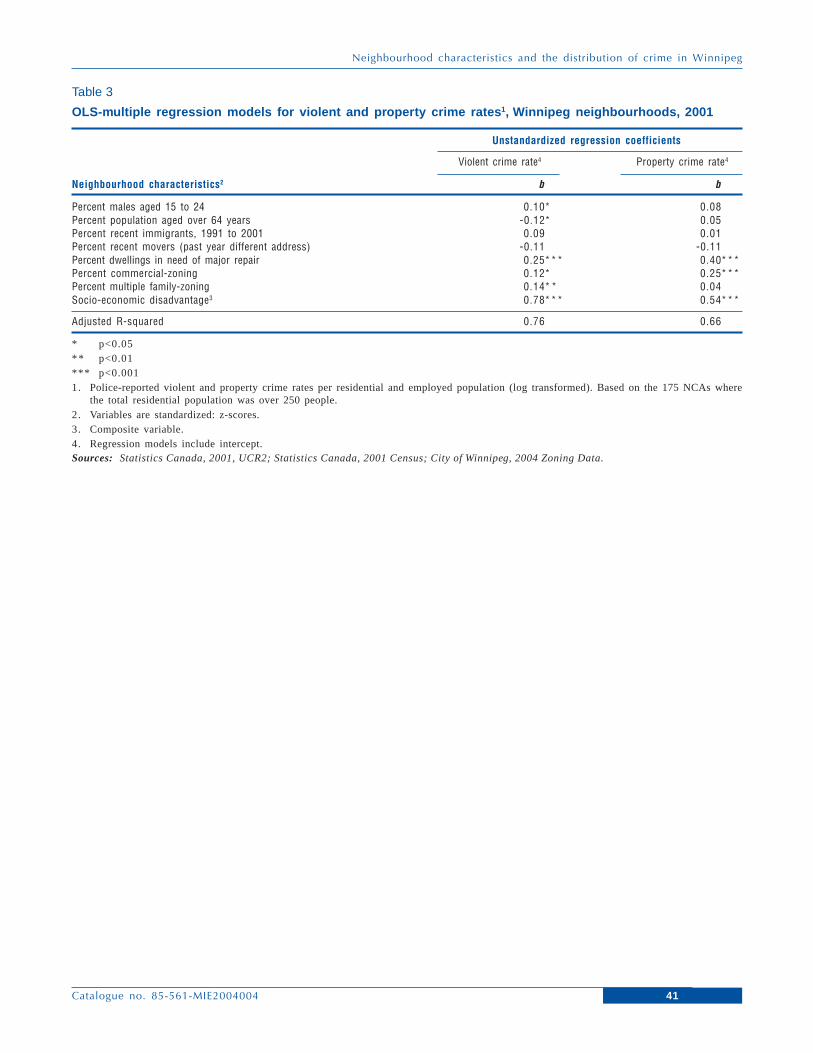
To assess the relative contribution of neighbourhood characteristics to theexplanation of crime, the set of variables was regressed separately on violent andproperty crime rates (Table 3). The adjusted r-square values indicate that the 8remaining explanatory variables account for a very high percentage of the variationin violent crime (76%) and property crime (66%). The estimated regressioncoefficients provide an indication of the relative contribution of each variable aftercontrolling for the other variables in the model.16
Socio-economic disadvantage makes the largest relative contribution to theexplanation of both violent (b=0.78) and property (b=0.54) crime rates, after adjustingfor, or holding constant, the other explanatory variables. In both models, as thelevel of socio-economic disadvantage increases, so do the violent and propertycrime rates. Disadvantage is followed in importance by the relative contribution ofthe condition of housing in the neighbourhood, indicated by the proportion ofdwellings in need of major repairs (b=0.25 and b=0.40). As the proportion ofdwellings in need of major repair increases, so do the violent and property crimerates net of the other variables in the model.
Other variables that made smaller, though statistically significant, contributionsto an increase in violent crime rates after adjusting for other variables include anincrease in the percentage of multiple-family zoning (b=0.14), an increase in thepercentage of commercial zoning (b=0.12), a decrease in the proportion of olderadults aged over 64 years (b=-0.12) and an increase in the high risk victim/offenderpopulation of males aged 15-24 (b=0.10). Neither the proportion of immigrants inthe neighbourhood, nor the proportion of residents living at a different address inthe previous year made significant contributions to the explanation of the violentcrime rate after controlling for the other variables in the model.
With respect to property crime, the percentage of commercial zoning (b=0.25)followed socio-economic disadvantage and dwellings in need of repair in terms ofrelative importance, and was the only other variable to make a significant contributionto the explanation of the property crime rate. Net of the other variables, an increasein the proportion of commercial zoning in a neighbourhood was related to increasesin the property crime rate.
41
Neighbourhood characteristics and the distribution of crime in Winnipeg
Catalogue no. 85-561-MIE2004004
Table 3
OLS-multiple regression models for violent and property crime rates1, Winnipeg neighbourhoods, 2001
Unstandardized regression coefficients
Violent crime rate4 Property crime rate4
Neighbourhood characteristics2 b b
Percent males aged 15 to 24 0.10* 0.08Percent population aged over 64 years -0.12* 0.05Percent recent immigrants, 1991 to 2001 0.09 0.01Percent recent movers (past year different address) -0.11 -0.11Percent dwellings in need of major repair 0.25*** 0.40***Percent commercial-zoning 0.12* 0.25***Percent multiple family-zoning 0.14** 0.04Socio-economic disadvantage3 0.78*** 0.54***
Adjusted R-squared 0.76 0.66
* p<0.05* * p<0.01*** p<0.0011. Police-reported violent and property crime rates per residential and employed population (log transformed). Based on the 175 NCAs where
the total residential population was over 250 people.2. Variables are standardized: z-scores.3. Composite variable.4. Regression models include intercept.Sources: Statistics Canada, 2001, UCR2; Statistics Canada, 2001 Census; City of Winnipeg, 2004 Zoning Data.

42
Neighbourhood characteristics and the distribution of crime in Winnipeg
Catalogue no. 85-561-MIE2004004
DiscussionThis report has presented information from a Statistics Canada pilot study of thespatial distribution of crime in a Canadian city using a combination of statisticalanalyses and crime mapping based on Geographic Information System (GIS)technology. Results from the examination of 2001 Winnipeg data are in agreementwith those from other studies indicating that crime is not randomly distributed acrosscities, but rather is concentrated in certain areas that are associated with other factorsrelated to the population and land-uses of the city.
Maps of the distribution of police-reported criminal incidents in this reportshow a concentration in the core of the city representing a relatively small geographicarea. For example, about 1,100 incidents per square kilometre were reported withina 2 kilometre radius of the geographic centre of the city. However, between 6 and 8kilometres from the centre, the density of reported incidents drops dramatically to151 incidents per square kilometre.
There are some differences in the degree of concentration of violent andproperty crime. About 30% of reported violent crime incidents in 2001 occurred in3% of neighbourhoods, and although there is a wider distribution of property crimeincidents, about 30% of reported property crime occurred in just 7% ofneighbourhoods.
Before controlling for other factors, results point to significant differences inselected characteristics when neighbourhoods with the highest rates of crime arecompared to their lower crime rate counterparts. Differences in crime rates areconsistent across a number of neighbourhood residential characteristics, land-useand dwelling characteristics and socio-economic characteristics for both violent andproperty crimes.
These bivariate results suggest that higher levels of crime occur in areas withreduced access to social and economic resources. For example, theseneighbourhoods are characterized by populations that are more economicallydisadvantaged, less educated, more likely to have higher numbers of female single-parent families, Aboriginal residents and/or recent immigrants. The neighbourhoodsalso tend to exhibit lower levels of residential stability, to be more crowded and tohave greater proportions of multiple-family dwellings which are often in need ofrepair.
It was demonstrated in this study that many of these individual factors areclosely related. Thus, when the variables were held constant through the use of amultivariate technique, a few key factors were shown to be most highly related toboth property and violent crime rates.
After controlling for other variables, socio-economic disadvantage had thegreatest significant association with violent and property crime. The strong associationbetween concentrated disadvantage and crime has been demonstrated frequently in
43
Neighbourhood characteristics and the distribution of crime in Winnipeg
Catalogue no. 85-561-MIE2004004
other research. For example, Sampson and Raudenbush (1999) have argued thatthe relationship between disadvantage and crime is in fact so strong that other“symptoms” of high-crime neighbourhoods actually stem from the socio-economicdisadvantage.
Disadvantage was followed in importance by the relative contribution of thecondition of housing in the neighbourhood, indicated by the proportion of dwellingsin need of major repair. This factor is an indication of lower community affiliation,a lower sense of community responsibility leading to a disconnection fromidentification with and interest in neighbours and neighbourhood (Sampson andRaudenbush 1999).
Land-use types also contributed to the explanation of crime. With respect toviolent crime, this was particularly the case for multiple-family zoning, and to alesser extent was also valid for commercial zoning which included, among otherbusinesses, restaurants, beverage hotels and retail establishments. The results forproperty crime were somewhat different. In this case, commercial zoning was theonly land-use type that proved to be significant.
Opportunities for crime increase when neighbourhood land-use patterns areconducive to crime (Hayslett-McCall 2002). Land-uses that have been associatedwith crime include mixed patterns of residential, commercial, industrial, and vacantlands within neighbourhoods, as well as the presence of particular establishments,such as shopping malls. Land-use patterns can influence crime by inhibiting thesocial control or guardianship capacity of residents in a neighbourhood or by beinga focal point for particular types of activities (e.g., consuming alcohol at a bar,selling/using drugs in abandoned structures) (Hayslett-McCall 2002).
This study has demonstrated that high-crime neighbourhoods exhibit distinctcharacteristics that are quite different from low-crime neighbourhoods. They arecharacterized by residential populations with smaller shares of social and economicresources, and by land-use patterns that may increase opportunities for crime to becommitted.
These results suggest that effective community level interventions wouldinclude programs and policies that improve the socio-economic conditions ofresidents including housing and take into account the implications of land-use zoning.Moreover, the high level of geographic concentration found in this study suggeststhat there may be some benefit to targeting strategies to the particular needs ofneighbourhoods or smaller areas within a city.
Limitations and opportunities
Work undertaken in the Winnipeg demonstration study was limited to a single yearof data. Consequently it was not possible to examine change in neighbourhoodcrime rates and associated characteristics. Temporal data provides the opportunityto examine the causal ordering of different factors. For instance, studies of Americancities suggest that high crime leads to depopulation which in turn leads to an increasein socio-economic disadvantage in urban core areas. Understanding factors relatedto change over time is also important for the development of prevention andreduction strategies and for the evaluation of existing programs. Future work shouldconsider multiple years of data and consequently change over time.
44
Neighbourhood characteristics and the distribution of crime in Winnipeg
Catalogue no. 85-561-MIE2004004
While this study provided information about the location of the criminalincidents, no data were available on the location of either accused or victim residences.Information about travel-to-crime patterns, or the distances offenders travel to commitcrimes, can be used to shape appropriate crime reduction strategies. While it is oftenassumed that offenders travel distances to commit crime, and that a considerableamount of crime is committed by the same high-volume offenders travelling todifferent parts of the city, evidence from the UK suggests that most offendermovements are relatively short and travel associated with crime is driven byopportunities presenting themselves during normal routines rather than plans tooffend. To test these results in the Canadian context, accused address informationcould be examined.
Some initial work was undertaken in the Winnipeg demonstration study toexamine factors that distinguish neighbourhoods with lower levels of crime despitehaving characteristics typically associated with high-crime neighbourhoods. Thecharacteristics and locations of these neighbourhoods are of particular interest froman intervention perspective since they may possess certain protective attributes.However, the very strong relationship between crime and disadvantage in Winnipegmeant that the small numbers of these low-crime/higher-disadvantageneighbourhoods yielded unreliable results. Consequently, it was not possible todescribe the attributes of these neighbourhoods. More work in this area could beundertaken in other Canadian cities.
Finally, analyses of the spatial distribution of crime are particularly affectedby the availability of data. This study relied on the Census of Population and City ofWinnipeg zoning data to describe the relationship between location and crime. Whilethis information contributes to an understanding of crime patterns in cities, there areother factors that could be related to the people who flow in and out of aneighbourhood over the course of a day, the locations of specific land-use types(e.g., bars and nightclubs), the location and delivery of various justice and non-justice services and most importantly about individuals’ attitudes and perceptionsregarding their own neighbourhood, their trust in others and their willingness toparticipate. Improved understanding of factors associated with crime distributionrequires access to data sets from a variety of sources.

45
Neighbourhood characteristics and the distribution of crime in Winnipeg
Catalogue no. 85-561-MIE2004004
BibliographyAnselin, L., J. Cohen, D. Cook, W. Gorr and G. Tita. 2000. “Spatial analyses of
crime.” In Criminal Justice: Vol. 4. Measurement and analysis of crime and justice.D. Duffee (ed.). Washington, D.C. National Institute of Justice. 213-262.
Assuncao, R., C. Beato and B. Silva. 2002. “Describing crime spatial patterns bytime of day.” In: Levine, N., CrimeStat II: A Spatial Statistics Program for theAnalysis of Crime Incident Locations. Program Manual. Washington, D.C.:National Institute of Justice, 222.
Bailey, T.C. and A.C. Gatrell. 1995. Interactive spatial data analysis. ReadingMassachusetts: Addison-Wesley.
Besserer, S. and C. Trainor. 2000. “Criminal victimization in Canada, 1999.” Juristat.Catalogue no. 85-002-XIE Vol. 20 no. 10. Ottawa: Canadian Centre for JusticeStatistics.
Block R.L. 1979. “Community, Environment, and Violent Crime.” Criminology.17:46-57.
Block, R.L. and C.R. Block. 1995. “Space, place and crime: areas and hot spots ofcrime.” In Eck, J.E. and Weisburd, D. (eds), Crime and place. 145-184.Monsey, NY: Criminal Justice Press.
Boyle M.H., E.L. Lipman. 2002. “Do places matter? Socio-economic disadvantageand child problem behaviour in Canada.” Journal of Consulting and ClinicalPsychology. 70: 378-389.
Brantingham, P.L. and P.J. Brantingham. 1982. “Mobility, notoriety and crime: Astudy of crime patterns in urban nodal points.” Journal of EnvironmentalSystems. 11: 89-99.
Breton, R. 2003. “Social Capital and the Civic Participation of Immigrants andMembers of Ethno-Cultural Groups.” Paper presented at the Policy ResearchInitiative Conference on The Opportunities and Challenges of Diversity: ARole for Social Capital? Montreal, November, 2003.
Cohen, L. and M. Felson. 1979. “Social Change and Crime Rates.” AmericanSociological Review. 44: 588-608.
Hayslett-McCall, K.L. 2002. Neighborhoods, land-use, and robbery rates: a test ofroutine activity theory. Dissertation. Dallas: University of Texas at Dallas.
Kelling, G. and C. Coles. 1998. Fixing Broken Windows: Restoring Order andReducing Crime in Our Communities. New York, NY: Touchstone.
Land, K. C., P.L. McCall and L.E. Cohen. 1990. “Structural covariates of homiciderates: Are there any invariances across time and social space?” AmericanJournal of Sociology, 95, 922-963.
Morenoff, J.D. and R.J. Sampson. 1997. “Violent crime and the spatial dynamicsof neighbourhood transition: Chicago 1970-1990.” Social forces. 76(1):31-64.
Morenoff, J.D., R.J. Sampson and S.W. Raudenbush. 2001. “Neighbourhoodinequality, collective efficacy and the spatial dynamics of urban violence.”Research Report. Report No. 00-451. University of Michigan: PopulationStudies Centre at the Institute for Social Research.
46
Neighbourhood characteristics and the distribution of crime in Winnipeg
Catalogue no. 85-561-MIE2004004
Oberwittler, D. In press. “Re-Balancing routine activity and social disorganizationtheories in the explanation of urban violence: A new approach to the analysisof spatial crime patterns based on population at risk.” Journal of QuantitativeCriminology.
Oberwittler, D. and M. Wiesenhütter. 2002. “The Risk of Violent Incidents Relativeto Population Density in Cologne Using the Dual Kernel Density Routine.”In: Levine, N., CrimeStat II: A Spatial Statistics Program for the Analysis ofCrime Incident Locations. Program Manual. Washington, D.C.: NationalInstitute of Justice, 332.
Roncek, D.W. and P.A. Maier. 1991. “Bars, blocks, and crimes revisited: linkingthe theory of routine activities to the empiricism of hot spots.” Criminology.29: 725-755.
Sampson, R. J. 1993. “The community context of violent crime.” In W. J. Wilson(Eds.), Sociology and the public agenda (pp. 274-279). Newbury Park, CA:Sage Publications.
Sampson, R.J. 1997. “The Embeddedness of Child and Adolescent Development:A Community-Level Perspective on Urban Violence.” In J. McCord ed.,Violence and Childhood in the Inner City. Cambridge, UK: CambridgeUniversity Press.
Sampson, R.J., and J.L. Lauritsen. 1994. “Violent victimization and offending:Individual-, situational-, and community-level risk factors.” In A.J. Reiss andJ.A. Roth eds., Understanding and Preventing Violence. Washington, DC:National Academy Press.
Sampson, R.J. and J.D. Morenoff. 2004. “Spatial (Dis)Advantage and Homicide inChicago Neighborhoods”. In M.F. Goodchild and D.G. Janelle (editors),Spatially Integrated Social Science. Oxford University Press.
Sampson, R.J. and S. Raudenbush. 1999. “Systematic Social Observation of PublicSpaces: A New Look at Disorder in Urban Neighborhoods.” American Journalof Sociology. 105: 603-651.
Sampson, R.J., S.W. Raudenbush and F.Earls. 1997. “Neighbourhoods and violentcrime: a multilevel study of collective efficacy.” Science. 277: 918-924.
Shaw, C.R. and H.D. McKay. 1942. Juvenile Delinquency in Urban Areas. Chicago:University of Chicago Press.
Sherman, L.W., P.R. Gartin, and M.E. Buerger. 1989. “Hot Spots of Predatory Crime:Routine Activities and the Criminology of Place.” Criminology. 27(1), 27-55.
South, S.J. and K.D. Crowder. 1997. “Residential mobility between cities andsuburbs: Race suburbanization, and back-to-the-city moves.” Demography.34: 525-538.
Statistics Canada. 2001a. “Aboriginal people in Canada.” Canadian Centre for JusticeStatistics Justice Profile Series. Cat. No. 85F0033MIE. Ottawa: Canadian Centrefor Justice Statistics.
Statistics Canada. 2001c. Income in Canada. Catalogue no. 75-202-XIE. Ottawa:Statistics Canada.
Thomas, J. 2000. “Adult Correctional Services in Canada, 1998-99.” Juristat.Catalogue no. 85-002, Vol. 20, No. 3. Ottawa: Canadian Centre for JusticeStatistics.
Wikstrom, P.-O.H. 1991. Urban crime, criminals and victims. Springer: New York,NY.
47
Neighbourhood characteristics and the distribution of crime in Winnipeg
Catalogue no. 85-561-MIE2004004
Appendices
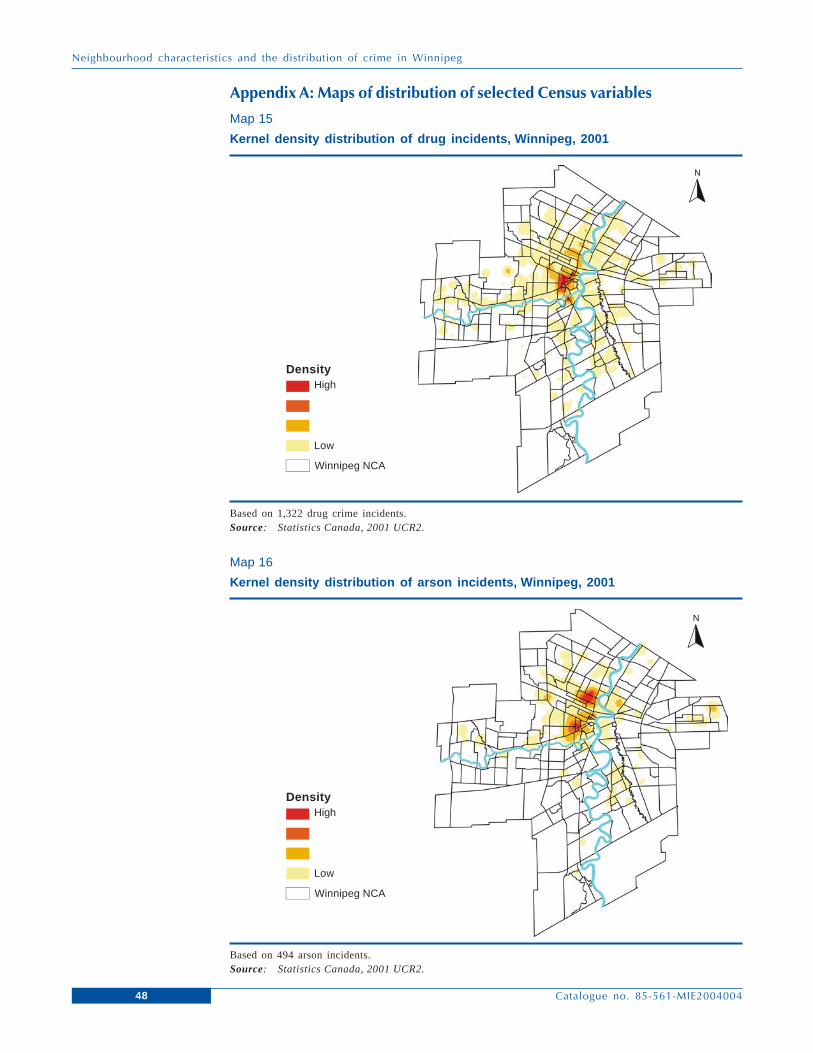
48
Neighbourhood characteristics and the distribution of crime in Winnipeg
Catalogue no. 85-561-MIE2004004
Map 15
Kernel density distribution of drug incidents, Winnipeg, 2001
Based on 1,322 drug crime incidents.Source: Statistics Canada, 2001 UCR2.
Map 16
Kernel density distribution of arson incidents, Winnipeg, 2001
Based on 494 arson incidents.Source: Statistics Canada, 2001 UCR2.
Appendix A: Maps of distribution of selected Census variables
N
N
DensityHigh
Low
Winnipeg NCA
DensityHigh
Low
Winnipeg NCA
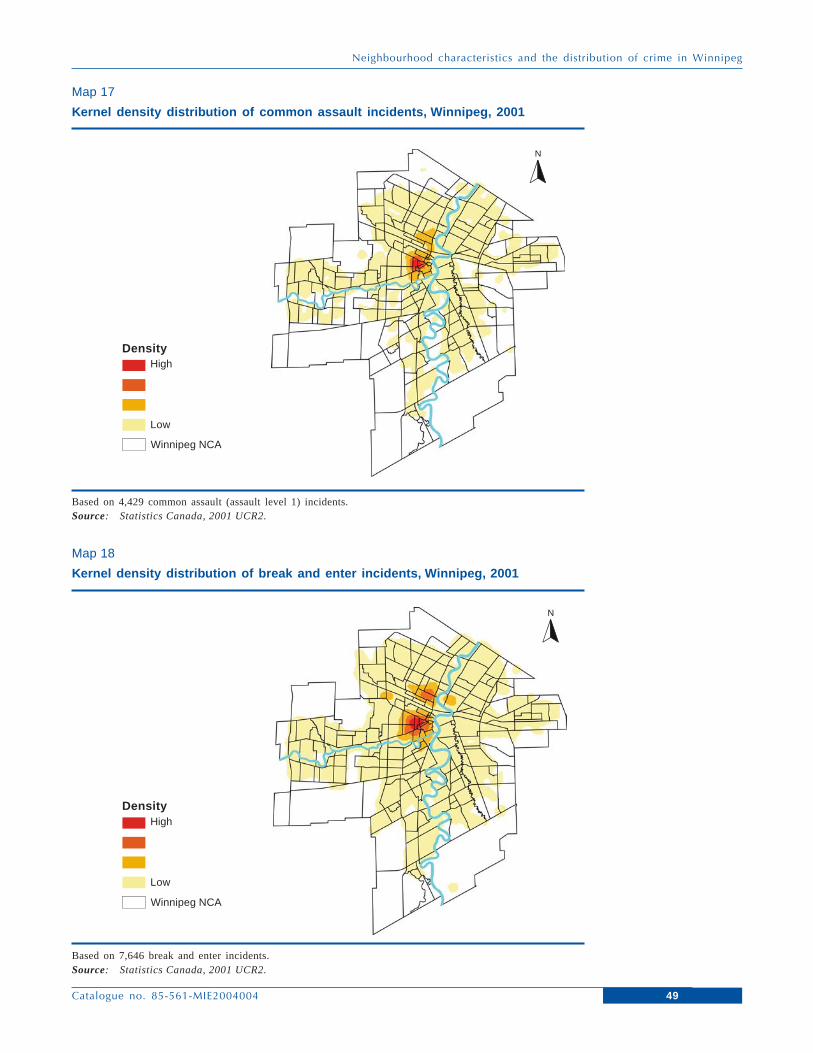
49
Neighbourhood characteristics and the distribution of crime in Winnipeg
Catalogue no. 85-561-MIE2004004
Map 17
Kernel density distribution of common assault incidents, Winnipeg, 2001
Based on 4,429 common assault (assault level 1) incidents.Source: Statistics Canada, 2001 UCR2.
Map 18
Kernel density distribution of break and enter incidents, Winnipeg, 2001
Based on 7,646 break and enter incidents.Source: Statistics Canada, 2001 UCR2.
N
N
DensityHigh
Low
Winnipeg NCA
DensityHigh
Low
Winnipeg NCA
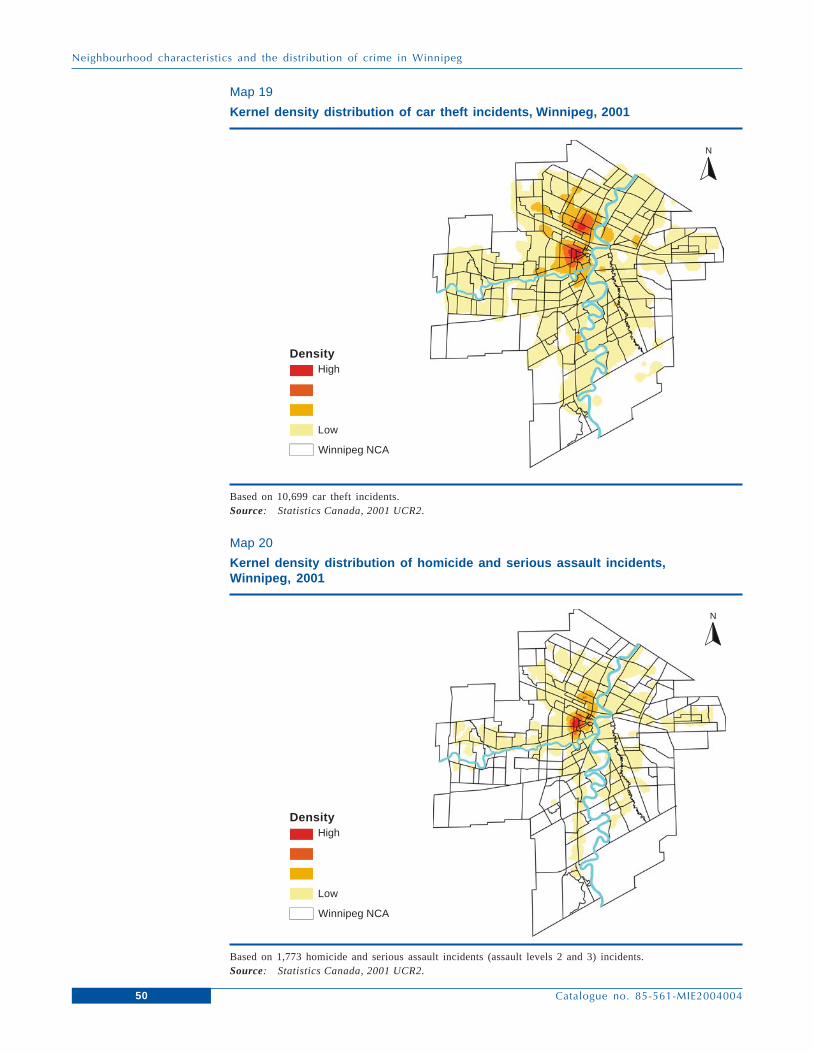
50
Neighbourhood characteristics and the distribution of crime in Winnipeg
Catalogue no. 85-561-MIE2004004
Map 20
Kernel density distribution of homicide and serious assault incidents,Winnipeg, 2001
Based on 1,773 homicide and serious assault incidents (assault levels 2 and 3) incidents.Source: Statistics Canada, 2001 UCR2.
Map 19
Kernel density distribution of car theft incidents, Winnipeg, 2001
Based on 10,699 car theft incidents.Source: Statistics Canada, 2001 UCR2.
N
N
DensityHigh
Low
Winnipeg NCA
DensityHigh
Low
Winnipeg NCA

51
Neighbourhood characteristics and the distribution of crime in Winnipeg
Catalogue no. 85-561-MIE2004004
Map 22
Kernel density distribution of prostitution incidents, Winnipeg, 2001
Based on 252 prostitution incidents.Source: Statistics Canada, 2001 UCR2.
Map 21
Kernel density distribution of mischief incidents, Winnipeg, 2001
Based on 17,323 mischief incidents.Source: Statistics Canada, 2001 UCR2.
N
N
DensityHigh
Low
Winnipeg NCA
DensityHigh
Low
Winnipeg NCA

52
Neighbourhood characteristics and the distribution of crime in Winnipeg
Catalogue no. 85-561-MIE2004004
Map 23
Kernel density distribution of robbery incidents, Winnipeg, 2001
Map 24
Kernel density distribution of sexual offence incidents, Winnipeg, 2001
Based on 1,677 robbery incidents.Source: Statistics Canada, 2001 UCR2.
Based on 660 sexual offences incidents.Source: Statistics Canada, 2001 UCR2.
N
N
DensityHigh
Low
Winnipeg NCA
DensityHigh
Low
Winnipeg NCA
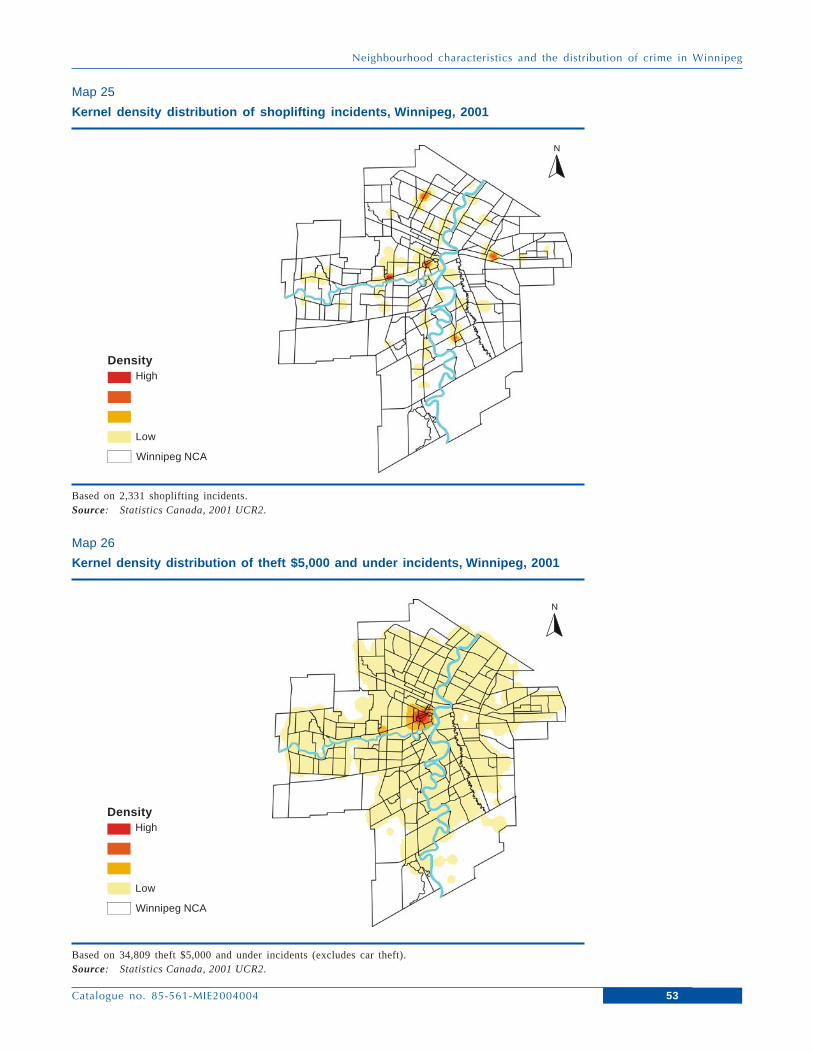
53
Neighbourhood characteristics and the distribution of crime in Winnipeg
Catalogue no. 85-561-MIE2004004
Map 25
Kernel density distribution of shoplifting incidents, Winnipeg, 2001
Map 26
Kernel density distribution of theft $5,000 and under incidents, Winnipeg, 2001
Based on 2,331 shoplifting incidents.Source: Statistics Canada, 2001 UCR2.
Based on 34,809 theft $5,000 and under incidents (excludes car theft).Source: Statistics Canada, 2001 UCR2.
N
N
DensityHigh
Low
Winnipeg NCA
DensityHigh
Low
Winnipeg NCA

54
Neighbourhood characteristics and the distribution of crime in Winnipeg
Catalogue no. 85-561-MIE2004004
Map 27
Kernel density distribution of theft over $5,000, Winnipeg, 2001
Based on 1,845 theft over $5,000 incidents (excludes car theft).Source: Statistics Canada, 2001 UCR2.
N
DensityHigh
Low
Winnipeg NCA
55
Neighbourhood characteristics and the distribution of crime in Winnipeg
Catalogue no. 85-561-MIE2004004
Appendix B:
High-need neighbourhoodsIn this appendix, selected crime (Table 4) and population characteristics (Table 5)are reported for the 30 highest-need NCAs, and as an average across the 175 WinnipegNCAs examined in this study. High-need NCAs were selected based on their socio-economic disadvantage ranking.
Socio-economic disadvantage is a composite variable derived from fiveneighbourhood characteristics including percent receiving government transferpayments, percent aged 20 years and older without a secondary school certificate,percent in private households with low income in 2000, unemployment rate forpopulation aged 15 and older, and median household income in $1,000s. Separateresults for each of the 5 socio-economic disadvantage variables are reported inTable 5. Details regarding the creation of the socio-economic disadvantage variableare provided in the Description of variables section earlier in this report.

56
Neighbourhood characteristics and the distribution of crime in Winnipeg
Catalogue no. 85-561-MIE2004004
Table 4
Selected offence types for highest-need Neighbourhood Characterization Areas, Winnipeg, 2001
Total TotalTotal violent property Common Break
incidents3 crime3 crime3 assault 14 and enter4 Car theft4
NeighbourhoodCharacterization Area Count Rate1 Count Rate1 Count Rate1 Count Rate1 Count Rate1 Count Rate1
Average for Winnipeg(175 NCAs)2 346 72 52 11 286 60 26 5 40 9 58 12
Highest-need NCAs5
Lord Selkirk Park 523 203 176 6 8 308 119 6 8 2 6 4 8 1 9 6 2 2 4Logan-C.P.R. 263 76 49 14 203 59 12 3 33 10 43 12Dufferin 431 204 109 52 305 145 53 25 60 28 93 44Centennial 505 153 190 5 8 296 9 0 101 3 1 6 3 1 9 5 8 1 8William Whyte 1,816 270 433 6 4 1,320 196 194 2 9 234 3 5 322 4 8North Point Douglas 577 140 155 38 392 95 63 15 63 15 79 19Spence 1,638 348 413 8 8 1,078 229 188 4 0 159 3 4 176 3 7West Broadway 1,333 177 327 4 3 963 128 150 2 0 163 2 2 138 1 8Central Park 813 179 219 48 565 124 109 24 82 18 113 25Polo Park 1,235 179 5 8 8 1,163 168 2 9 4 4 1 6 134 1 9China Town 148 133 46 41 97 87 14 13 11 10 17 15Alpine Place 267 71 52 14 213 56 26 7 25 7 65 17Daniel McIntyre 1,821 165 402 3 6 1,309 118 182 1 6 249 2 3 279 2 5St. Matthews 1,105 144 207 2 7 871 114 7 9 1 0 193 2 5 157 2 0Weston 819 125 181 2 8 620 9 5 9 7 1 5 117 1 8 164 2 5Luxton 300 102 51 17 246 84 30 10 29 10 63 22South Portage 1,656 7 2 282 1 2 1,334 5 8 121 5 123 5 9 1 4St. John’s 1,628 187 318 3 6 1,269 145 156 1 8 223 2 6 373 4 3Burrows-Keewatin 381 118 77 24 300 93 40 12 21 7 100 31Talbot-Grey 238 9 8 3 4 1 4 199 8 2 1 9 8 3 9 1 6 3 8 1 6West Alexander 1,345 8 0 312 1 9 995 5 9 152 9 118 7 223 1 3Burrows Central 785 155 110 22 659 130 47 9 108 21 193 38Chalmers 1,355 111 284 2 3 1,049 8 6 146 1 2 185 1 5 248 2 0Valhalla 106 3 3 1 4 4 9 0 2 8 4 1 1 1 3 1 9 6Lavalee 120 73 25 15 94 57 12 7 22 13 30 18Central St. Boniface 813 63 169 13 628 49 70 5 92 7 102 8Colony 364 151 52 22 298 123 22 9 18 7 18 7Brooklands 474 165 88 31 375 130 47 16 90 31 96 33Dufresne 47 103 9 20 35 77 3 7 7 15 10 22Mynarski 116 81 17 12 96 67 7 5 17 12 20 14
x suppressed to meet the confidentiality requirements of the Statistics Act.1. Rates per 1,000 residential and employed population.2. Winnipeg figures based on the 175 neighbourhoods where the total residential population was over 250 people.3. Includes most serious violation in each incident only.4. Includes all recorded violations in each incident.5. Highest-need neighbourhoods based on ranking for the socio-economic disadvantage score.Sources: Statistics Canada, 2001 UCR2; Statistics Canada, 2001 Census.
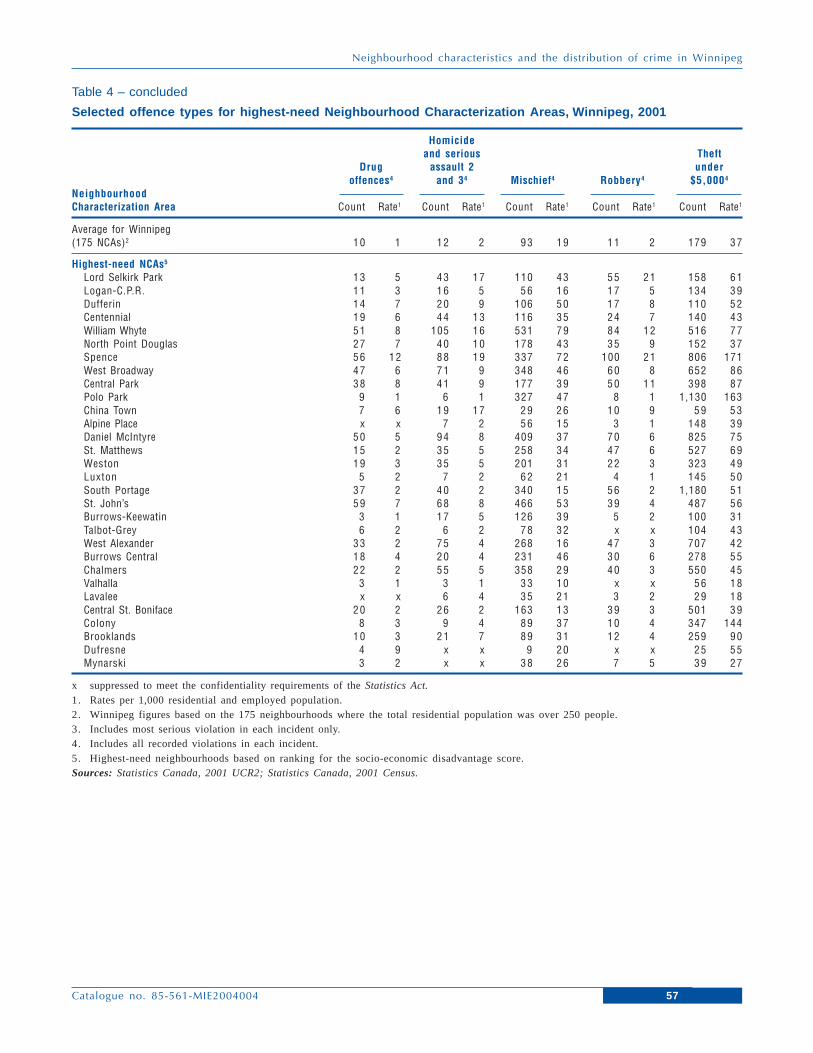
57
Neighbourhood characteristics and the distribution of crime in Winnipeg
Catalogue no. 85-561-MIE2004004
Table 4 – concluded
Selected offence types for highest-need Neighbourhood Characterization Areas, Winnipeg, 2001
Homicideand serious Theft
Drug assault 2 underoffences4 and 34 Mischief4 Robbery4 $5,0004
NeighbourhoodCharacterization Area Count Rate1 Count Rate1 Count Rate1 Count Rate1 Count Rate1
Average for Winnipeg(175 NCAs)2 10 1 12 2 93 19 11 2 179 37
Highest-need NCAs5
Lord Selkirk Park 1 3 5 4 3 1 7 110 4 3 5 5 2 1 158 6 1Logan-C.P.R. 11 3 16 5 56 16 17 5 134 39Dufferin 14 7 20 9 106 50 17 8 110 52Centennial 1 9 6 4 4 1 3 116 3 5 2 4 7 140 4 3William Whyte 5 1 8 105 1 6 531 7 9 8 4 1 2 516 7 7North Point Douglas 27 7 40 10 178 43 35 9 152 37Spence 5 6 1 2 8 8 1 9 337 7 2 100 2 1 806 171West Broadway 4 7 6 7 1 9 348 4 6 6 0 8 652 8 6Central Park 38 8 41 9 177 39 50 11 398 87Polo Park 9 1 6 1 327 4 7 8 1 1,130 163China Town 7 6 19 17 29 26 10 9 59 53Alpine Place x x 7 2 56 15 3 1 148 39Daniel McIntyre 50 5 94 8 409 37 70 6 825 75St. Matthews 1 5 2 3 5 5 258 3 4 4 7 6 527 6 9Weston 1 9 3 3 5 5 201 3 1 2 2 3 323 4 9Luxton 5 2 7 2 62 21 4 1 145 50South Portage 37 2 40 2 340 15 56 2 1,180 5 1St. John’s 5 9 7 6 8 8 466 5 3 3 9 4 487 5 6Burrows-Keewatin 3 1 17 5 126 39 5 2 100 31Talbot-Grey 6 2 6 2 7 8 3 2 x x 104 4 3West Alexander 33 2 75 4 268 16 47 3 707 42Burrows Central 18 4 20 4 231 46 30 6 278 55Chalmers 22 2 55 5 358 29 40 3 550 45Valhalla 3 1 3 1 3 3 1 0 x x 5 6 1 8Lavalee x x 6 4 35 21 3 2 29 18Central St. Boniface 20 2 26 2 163 13 39 3 501 39Colony 8 3 9 4 89 37 10 4 347 144Brooklands 10 3 21 7 89 31 12 4 259 90Dufresne 4 9 x x 9 20 x x 25 55Mynarski 3 2 x x 38 26 7 5 39 27
x suppressed to meet the confidentiality requirements of the Statistics Act.
1. Rates per 1,000 residential and employed population.2. Winnipeg figures based on the 175 neighbourhoods where the total residential population was over 250 people.3. Includes most serious violation in each incident only.4. Includes all recorded violations in each incident.5. Highest-need neighbourhoods based on ranking for the socio-economic disadvantage score.Sources: Statistics Canada, 2001 UCR2; Statistics Canada, 2001 Census.
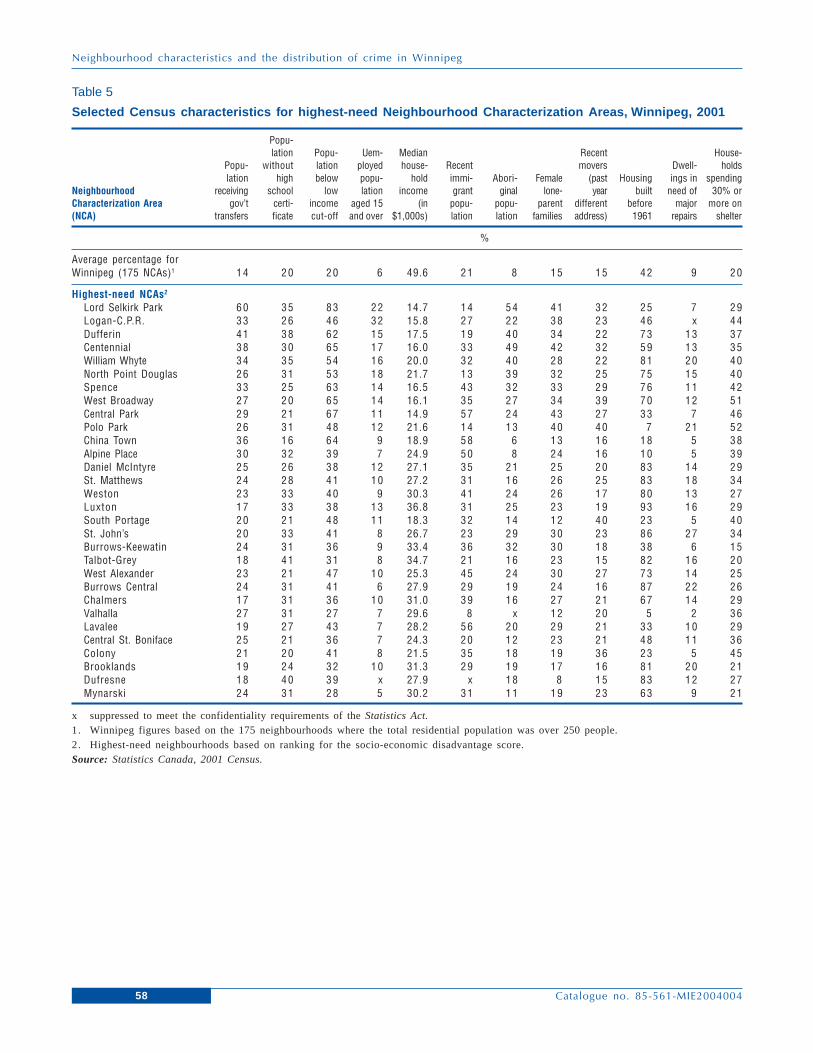
58
Neighbourhood characteristics and the distribution of crime in Winnipeg
Catalogue no. 85-561-MIE2004004
Table 5
Selected Census characteristics for highest-need Neighbourhood Characterization Areas, Winnipeg, 2001
Popu-lation Popu- Uem- Median Recent House-
Popu- without lation ployed house- Recent movers Dwell- holdslation high below popu- hold immi- Abori- Female (past Housing ings in spending
Neighbourhood receiving school low lation income grant ginal lone- year built need of 30% orCharacterization Area gov’t certi- income aged 15 (in popu- popu- parent different before major more on(NCA) transfers ficate cut-off and over $1,000s) lation lation families address) 1961 repairs shelter
%
Average percentage forWinnipeg (175 NCAs)1 14 20 20 6 49.6 21 8 15 15 42 9 20
Highest-need NCAs2
Lord Selkirk Park 6 0 3 5 8 3 2 2 14.7 14 54 41 32 25 7 29Logan-C.P.R. 33 26 46 32 15.8 27 22 38 23 46 x 44Dufferin 41 38 62 15 17.5 19 40 34 22 73 13 37Centennial 3 8 3 0 6 5 1 7 16.0 33 49 42 32 59 13 35William Whyte 3 4 3 5 5 4 1 6 20.0 32 40 28 22 81 20 40North Point Douglas 26 31 53 18 21.7 13 39 32 25 75 15 40Spence 3 3 2 5 6 3 1 4 16.5 43 32 33 29 76 11 42West Broadway 2 7 2 0 6 5 1 4 16.1 35 27 34 39 70 12 51Central Park 29 21 67 11 14.9 57 24 43 27 33 7 46Polo Park 2 6 3 1 4 8 1 2 21.6 14 13 40 40 7 21 52China Town 36 16 64 9 18.9 58 6 13 16 18 5 38Alpine Place 30 32 39 7 24.9 50 8 24 16 10 5 39Daniel McIntyre 25 26 38 12 27.1 35 21 25 20 83 14 29St. Matthews 2 4 2 8 4 1 1 0 27.2 31 16 26 25 83 18 34Weston 2 3 3 3 4 0 9 30.3 41 24 26 17 80 13 27Luxton 17 33 38 13 36.8 31 25 23 19 93 16 29South Portage 20 21 48 11 18.3 32 14 12 40 23 5 40St. John’s 2 0 3 3 4 1 8 26.7 23 29 30 23 86 27 34Burrows-Keewatin 24 31 36 9 33.4 36 32 30 18 38 6 15Talbot-Grey 1 8 4 1 3 1 8 34.7 21 16 23 15 82 16 20West Alexander 23 21 47 10 25.3 45 24 30 27 73 14 25Burrows Central 24 31 41 6 27.9 29 19 24 16 87 22 26Chalmers 17 31 36 10 31.0 39 16 27 21 67 14 29Valhalla 2 7 3 1 2 7 7 29.6 8 x 12 20 5 2 36Lavalee 19 27 43 7 28.2 56 20 29 21 33 10 29Central St. Boniface 25 21 36 7 24.3 20 12 23 21 48 11 36Colony 21 20 41 8 21.5 35 18 19 36 23 5 45Brooklands 19 24 32 10 31.3 29 19 17 16 81 20 21Dufresne 18 40 39 x 27.9 x 18 8 15 83 12 27Mynarski 24 31 28 5 30.2 31 11 19 23 63 9 21
x suppressed to meet the confidentiality requirements of the Statistics Act.1. Winnipeg figures based on the 175 neighbourhoods where the total residential population was over 250 people.2. Highest-need neighbourhoods based on ranking for the socio-economic disadvantage score.Source: Statistics Canada, 2001 Census.
59
Neighbourhood characteristics and the distribution of crime in Winnipeg
Catalogue no. 85-561-MIE2004004
Endnotes1. Zoning parcels are defined in the City of Winnipeg by-laws 4800/88 and 6400/94 and
subsequent amendments.
2. Economic family is defined as a group of two or more persons who live in the samedwelling and are related to each other by blood, marriage, common-law or adoption.
3. In 2001, the 73,111 incidents were reported to the Winnipeg Police Service, and it waspossible to geocode the vast majority (99.6% or 72,860) of these incidents.
4. For the purposes of this analysis the centroid, or spatial midpoint of the NCA, is used whenexamining the distribution of Census variables. The centroid provides the location (X andY) information for each area while the value of the Census variable (e.g., socio-economicdisadvantage) provides the intensity estimate (Z).
5. These population figures are based on the Statistics Canada Census Metropolitan Area(CMA) population for Winnipeg, and are used for national comparative purposes. TheCMA boundary includes adjacent municipalities situated around the urban core and isconsequently larger than the study area which covers 230 NCAs within the municipalityof Winnipeg; consequently population figures for the study area are lower, totalling 610,455residents in 2001.
6. Information in maps in this report is typically displayed in 4 categories or classes. Classesare based on natural groupings of data values. Arcmap identifies break points by lookingfor groupings and patterns inherent in the data. The features are divided into classeswhose boundaries are set where there are relatively large jumps in the data values.
7. The highest reported violent crime neighbourhoods in 2001 were Spence, William Whyte,Daniel Mcintyre, West Broadway, St. John’s, West Alexander, Chalmers and South Portage,and the highest reported property crime neighbourhoods were South Portage, WilliamWhyte, Daniel Mcintyre, St. John’s, Polo Park, Spence, Chalmers, West Alexander,Rossmere-A, West Broadway, Wolseley, St. Matthews, Tyndall Park, Garden City, TheMaples and Regent.
8. The dual kernel method is used in these maps in order to examine the distribution of twovariables simultaneously.
9. Findings in this study are not intended to suggest that certain neighbourhood characteristicsare the cause of crime, but rather they suggest that these factors are associated with or co-occur with higher crime rates in neighbourhoods.
10. For reasons of confidentiality and reliability, Statistics Canada requires that when usingindividual, family or household income data, the population size for any Canadiangeographic area being considered must be least 250 people who are residing in at least 40private households.
11. Dichotomous variables are used only for the descriptive or bivariate analysis. Themultivariate analysis that follows this section is based on continuous dependent variables:violent and property crime rates.
12. The 2001Aboriginal identity population accounted for 8.4% of the Winnipeg CensusMetropolitan Area population, 13.6% of Manitoba’s population and 3.3% of Canada’spopulation.
13. Average disadvantage scores for high- and low-crime NCAs were -0.3 and 1.0, respectively,and for property crime, -0.3 an 0.8, respectively.

60
Neighbourhood characteristics and the distribution of crime in Winnipeg
Catalogue no. 85-561-MIE2004004
14. Ordinary least squares (OLS) regression is used in this study to examine the distribution ofviolent and property crime rates as a function of the set of explanatory factors. Thismethod requires a continuous or quantitative outcome variable which is normallydistributed, in this case crime rate. Since the distribution of crime rates is often skewedwith a small proportion of neighbourhoods accounting for a larger proportion of reportedincidents, it was necessary to log transform the crime variables.
15. The correlation between two variables reflects the degree to which the variables are related.The most common measure of correlation is the Pearson’s correlation (r) which reflects thedegree of linear relationship between two variables. It ranges from +1 to -1. A correlationof +1 means that there is a perfect positive linear relationship between variables, while acorrelation of -1 means that there is a perfect negative relationship.
16. Since the independent variables are initially transformed into z-scores, the unstandardizedregression coefficients provide a means of assessing the relative importance of the differentpredictor variables in the multiple regression models. The coefficients indicate the expectedchange, in standard deviation units, of the dependent variable per one standard deviationunit increase in the independent variable, after controlling for the other variables. Themaximum possible values are +1 and -1, with coefficient values closer to 0 indicating aweaker contribution to the explanation of the dependent variable.

62
Neighbourhood characteristics and the distribution of crime in Winnipeg
Catalogue no. 85-561-MIE2004004
Canadian Centre forJustice StatisticsCrime and Justice research paper series
Cumulative Index
The Canadian Centre for Justice Statistics (CCJS) was created in 1981 as a divisionof Statistics Canada. The CCJS is the focal point of a federal-provincial-territorialpartnership for the collection of information on the nature and extent of crime andthe administration of civil and criminal justice in Canada. This partnership, knownas the “National Justice Statistics Initiative”, has become the international model ofsuccess on how to develop, implement and manage an effective national justicestatistics program. Its analytical output appears in the flagship publication Juristat(http://www.statcan.ca/english/IPS/Data/85-002-XIE.htm), in various annual andbiennieal publications, and in the Crime and Justice research paper series (http://www.statcan.ca/english/IPS/Data/85-561-MIE.htm).
63
Neighbourhood characteristics and the distribution of crime in Winnipeg
Catalogue no. 85-561-MIE2004004
Following is a cumulative index of Canadian Centre for Justice Statisticsresearch papers published to date:
Crime and Justice Research Paper Series – Research papers
85-561-MIE2003001 An examination of sex differences in delinquency
85-561-MIE2003002 Childhood aggression and exposureto violence in the home
85-561-MIE2003003 Prior Police Contacts and Police Discretion withApprehended Youth
85-561-MIE2003004 Neighbourhood characteristics and the distribution ofcrime in Winnipeg