
Neighboring pallidal neurons do not exhibit more...
12
SYSTEMS NEUROSCIENCE Neighboring pallidal neurons do not exhibit more synchronous oscillations than remote ones in the MPTP primate model of Parkinson’s disease Rea Mitelman 1,2 * † , Boris Rosin 1† , Hila Zadka 1,3 , Maya Slovik 1 , Gali Heimer 4 , Ya’akov Ritov 2,5 , Hagai Bergman 1,2,6 and Shlomo Elias 1,7 1 Department of Medical Neurobiology, Institute of Medical Research Israel-Canada, The Hebrew University – Hadassah Medical School, Jerusalem, Israel 2 The Interdisciplinary Center for Neural Computation, The Hebrew University, Jerusalem, Israel 3 Department of Psychology, The Hebrew University, Jerusalem, Israel 4 Pediatric Neurology Unit, The Edmond and Lily Safra Children’s Hospital, Sheba Medical Center, Tel Hashomer, Israel 5 Department of Statistics, The Hebrew University, Jerusalem, Israel 6 Edmond and Lily Safra Center for Brain Sciences, The Hebrew University, Jerusalem, Israel 7 Department of Medicine, Hadassah University Hospital, Jerusalem, Israel In the healthy primate, neurons of the external and internal segments of the globus pallidus (GP) present a primarily irregular firing pattern, and a negligible level of synchrony is observed between pairs of neurons. This holds even for neighboring cells, despite their higher probability to receive common inputs and to innervate each other via lateral connectivity. In the Parkinsonian primate, this changes drastically, and many pairs of GP cells show synchronous oscillations. To address the relation between distance and synchrony in the Parkinsonian state, we compared the synchrony of discharge of close pairs of neurons, recorded by the same electrode, with remote pairs, recorded by different ones. However, spike trains of neighboring cells recorded by the same extracellular electrode exhibit the shadowing effect; i.e., lack of detection of spikes that occur within a few milliseconds of each other. Here, we demonstrate that the shadowing artifact can both induce apparent correlations between non-correlated neurons, as well as conceal existing correlations between neighboring ones. We therefore introduced artificial shadowing in the remote pairs, similar to the effect we observed in the close ones. After the artificial shadowing, neighboring cells did not show a higher tendency to oscillate synchronously than remote ones. On the contrary, the average percentage (over all sessions) of artificially shadowed remote pairs exhibiting synchronous oscillations was 35.4% compared to 17.2% in the close ones. Similar trend was found when the unshadowed remote pairs were separated according to the estimated distance between electrode tips: 29.9% of pairs at approximate distance of less than 750 μm were significantly synchronized, in comparison with 28.5% of the pairs whose distance was more than 750 μm. We conclude that the synchronous oscillations in the GP of MPTP treated primates are homogenously distributed. Keywords: primate, basal ganglia, spike trains, synchronization, MPTP, oscillations, globus pallidus and the SNr form the network’s output nuclei. Both the GPe and the GPi are relatively small nuclei, and have approximately two orders of magnitude fewer neurons than their major input – the striatum (Percheron et al., 1987; Bar-Gad et al., 2003b). In the healthy primate, the firing pattern of most GP neurons is irregular (DeLong, 1971). Despite the high level of convergence of input innervations (Percheron et al., 1984) and inhibitory col- laterals (Kita and Kita, 1994; Sato et al., 2000), GP neurons exhibit negligible synchrony (Nini et al., 1995; Raz et al., 2000). This is the case even between neighboring cells (Bar-Gad et al., 2003a), despite their high probability of sharing at least some of the input and/or having anatomical lateral connections. In both human PD patients and monkeys treated with the neu- rotoxin 1-methyl-4-phenyl-1,2,3,6-tetrahydropyridine (MPTP), these properties change drastically. Synchrony appears between pairs of GP neurons, and the firing of many of them is dominated INTRODUCTION The basal ganglia are a set of subcortical nuclei which play an important role in the control of behavior. This can be seen in both normal physiology, as well as in several movement disorders, the most prominent being Parkinson’s disease (PD). The basal ganglia receive inputs from cortical and thalamic areas, and in a mostly feed-forward manner innervate the brainstem motor nuclei and the motor thalamic nuclei which close the loop back to the motor cortices (Haber and Gdowski, 2004). Anatomically, there is a high level of convergence of inputs from the cortex to the input nuclei of the basal ganglia, the striatum and the subthalamic nucleus. Further convergence exists in the next stages of the basal ganglia, which consist of both segments of the globus pallidus (GP) as well as the substantia nigra pars reticulata (SNr). The external segment of the globus pallidus (GPe) is an internal nucleus within the basal ganglia network, whereas the internal segment of the globus pallidus (GPi) Edited by: Charles J. Wilson, University of Texas at San Antonio, USA Reviewed by: Robert S. Turner, University of Pittsburgh, USA Hitoshi Kita, The University Tennessee Health Science Center, USA *Correspondence: Rea Mitelman, Department of Medical Neurobiology (Physiology), Institute of Medical Research Israel-Canada, The Hebrew University – Hadassah Medical School, POB 12272, Jerusalem 91120, Israel. e-mail: [email protected] † Rea Mitelman and Boris Rosin have contributed equally to this work. Frontiers in Systems Neuroscience www.frontiersin.org June 2011 | Volume 5 | Article 54 | 1 ORIGINAL RESEARCH ARTICLE published: 30 June 2011 doi: 10.3389/fnsys.2011.00054
-
Upload
hoangthien -
Category
Documents
-
view
214 -
download
0
Transcript of Neighboring pallidal neurons do not exhibit more...

SYSTEMS NEUROSCIENCE
Neighboring pallidal neurons do not exhibit more synchronous oscillations than remote ones in the MPTP primate model of Parkinson’s disease
Rea Mitelman1,2*†, Boris Rosin1†, Hila Zadka1,3, Maya Slovik1, Gali Heimer 4, Ya’akov Ritov 2,5, Hagai Bergman1,2,6 and Shlomo Elias1,7
1 Department of Medical Neurobiology, Institute of Medical Research Israel-Canada, The Hebrew University – Hadassah Medical School, Jerusalem, Israel2 The Interdisciplinary Center for Neural Computation, The Hebrew University, Jerusalem, Israel3 Department of Psychology, The Hebrew University, Jerusalem, Israel4 Pediatric Neurology Unit, The Edmond and Lily Safra Children’s Hospital, Sheba Medical Center, Tel Hashomer, Israel5 Department of Statistics, The Hebrew University, Jerusalem, Israel6 Edmond and Lily Safra Center for Brain Sciences, The Hebrew University, Jerusalem, Israel7 Department of Medicine, Hadassah University Hospital, Jerusalem, Israel
In the healthy primate, neurons of the external and internal segments of the globus pallidus (GP) present a primarily irregular firing pattern, and a negligible level of synchrony is observed between pairs of neurons. This holds even for neighboring cells, despite their higher probability to receive common inputs and to innervate each other via lateral connectivity. In the Parkinsonian primate, this changes drastically, and many pairs of GP cells show synchronous oscillations. To address the relation between distance and synchrony in the Parkinsonian state, we compared the synchrony of discharge of close pairs of neurons, recorded by the same electrode, with remote pairs, recorded by different ones. However, spike trains of neighboring cells recorded by the same extracellular electrode exhibit the shadowing effect; i.e., lack of detection of spikes that occur within a few milliseconds of each other. Here, we demonstrate that the shadowing artifact can both induce apparent correlations between non-correlated neurons, as well as conceal existing correlations between neighboring ones. We therefore introduced artificial shadowing in the remote pairs, similar to the effect we observed in the close ones. After the artificial shadowing, neighboring cells did not show a higher tendency to oscillate synchronously than remote ones. On the contrary, the average percentage (over all sessions) of artificially shadowed remote pairs exhibiting synchronous oscillations was 35.4% compared to 17.2% in the close ones. Similar trend was found when the unshadowed remote pairs were separated according to the estimated distance between electrode tips: 29.9% of pairs at approximate distance of less than 750 μm were significantly synchronized, in comparison with 28.5% of the pairs whose distance was more than 750 μm. We conclude that the synchronous oscillations in the GP of MPTP treated primates are homogenously distributed.
Keywords: primate, basal ganglia, spike trains, synchronization, MPTP, oscillations, globus pallidus
and the SNr form the network’s output nuclei. Both the GPe and the GPi are relatively small nuclei, and have approximately two orders of magnitude fewer neurons than their major input – the striatum (Percheron et al., 1987; Bar-Gad et al., 2003b).
In the healthy primate, the firing pattern of most GP neurons is irregular (DeLong, 1971). Despite the high level of convergence of input innervations (Percheron et al., 1984) and inhibitory col-laterals (Kita and Kita, 1994; Sato et al., 2000), GP neurons exhibit negligible synchrony (Nini et al., 1995; Raz et al., 2000). This is the case even between neighboring cells (Bar-Gad et al., 2003a), despite their high probability of sharing at least some of the input and/or having anatomical lateral connections.
In both human PD patients and monkeys treated with the neu-rotoxin 1-methyl-4-phenyl-1,2,3,6-tetrahydropyridine (MPTP), these properties change drastically. Synchrony appears between pairs of GP neurons, and the firing of many of them is dominated
IntroductIonThe basal ganglia are a set of subcortical nuclei which play an important role in the control of behavior. This can be seen in both normal physiology, as well as in several movement disorders, the most prominent being Parkinson’s disease (PD). The basal ganglia receive inputs from cortical and thalamic areas, and in a mostly feed-forward manner innervate the brainstem motor nuclei and the motor thalamic nuclei which close the loop back to the motor cortices (Haber and Gdowski, 2004). Anatomically, there is a high level of convergence of inputs from the cortex to the input nuclei of the basal ganglia, the striatum and the subthalamic nucleus. Further convergence exists in the next stages of the basal ganglia, which consist of both segments of the globus pallidus (GP) as well as the substantia nigra pars reticulata (SNr). The external segment of the globus pallidus (GPe) is an internal nucleus within the basal ganglia network, whereas the internal segment of the globus pallidus (GPi)
Edited by: Charles J. Wilson, University of Texas at San Antonio, USA
Reviewed by: Robert S. Turner, University of Pittsburgh, USAHitoshi Kita, The University Tennessee Health Science Center, USA
*Correspondence:Rea Mitelman, Department of Medical Neurobiology (Physiology), Institute of Medical Research Israel-Canada, The Hebrew University – Hadassah Medical School, POB 12272, Jerusalem 91120, Israel.e-mail: [email protected]†Rea Mitelman and Boris Rosin have contributed equally to this work.
Frontiers in Systems Neuroscience www.frontiersin.org June 2011 | Volume 5 | Article 54 | 1
Original research articlepublished: 30 June 2011
doi: 10.3389/fnsys.2011.00054

by episodes of periodic bursts. Typically, these periodic oscilla-tions occur within two narrow frequency bands, approximately the tremor frequency (around 5–7 Hz) and double-tremor frequen-cies (Nini et al., 1995; Raz et al., 2000; Levy et al., 2002). In the rodents unilaterally injected with 6-hydroxy-dopamine (6-OHDA), the level of synchrony was found to moderately decrease with the distance (Mallet et al., 2008). However, no similar study has appar-ently been conducted in Parkinsonian primates.
Traditional studies of single neuron activity in awake behaving animals involve extracellular electrophysiological recordings which are subjected to detection and sorting of action potential (spike) waveforms (Abeles and Goldstein, 1977; Lewicki, 1998). However, the detection of spikes of neighboring neurons recorded by the same electrode, is affected by the shadowing effect (Bar-Gad et al., 2001); namely, when two neurons fire approximately together, the sorting process fails to identify both action potentials (Figure 1A). Although stereo-recording (e.g., by tetrode) might reduce the shad-owing effect, they don’t completely eradicate it (Harris et al., 2000). The shadowing effect distorts the spike to spike cross-correlation function of the two neurons, and may lead to false appearance of synchronization (Bar-Gad et al., 2001).
Bar-Gad et al. (2003a) developed a method to estimate the cross-correlogram of an unsynchronized pair of neighboring neurons (with shadowing effect), assuming the autocorrelation functions are known (Bar-Gad et al., 2001). They concluded that cross-correlograms which are significantly different from the expected function are therefore synchronous. However, in the Parkinsonian state, the autocorrelation functions might be severely affected by the shadowing effects, and therefore the real (i.e., unshadowed) autocorrelation functions are unknown. We cannot assume that the autocorrelation functions are flat (as done in the normal state) because of the known pathological oscillatory firing. Therefore a different approach is required.
Here we confirm that the shadowing effect can create false synchronization, as reported by Bar-Gad et al. (2001). However, we also show that in other cases, this undesired alteration in data can also conceal existing synchrony. Therefore, one cannot assume that the extent of correlation found under the shadowing effect represents an upper bound for the real correlations. We thus present a new method which enables a balanced comparison of close and remote pairs by artificially shadowing the remote pairs. This method creates two populations of pairs, which differ only in the distance between the cells, but not in the shadowing effect. Thereby, we can compare them and estimate the spatial distribution of the synchrony in the GP of the MPTP treated pri-mate. Understanding the spatiotemporal pattern of the pallidal synchrony in the Parkinsonian primate can shed new light on the basal ganglia functional connectivity. Furthermore, these pat-terns may help clarify what role these pathological oscillations play downstream to the basal ganglia.
MaterIals and MethodsrecordIng procedures and Mptp InjectIonsThe experiments were carried out on two vervet monkeys (Cu and S, Cercopithecus aethiops aethiops, females, weighing 3.8 and 3.6 kg, respectively). Primates’ care and surgical procedures were in accord-ance with the NIH Guide for the Care and Use of Laboratory Animals
(1996) and the Hebrew University Guidelines for the Use and Care of Laboratory Animals in Research, supervised by the Institutional Committee for Animal Care and Use.
Both monkeys were trained to sit in a monkey chair; monkey Cu was also trained to perform a self-initiated button-pressing task to obtain a liquid reward. After training, a recording chamber was attached to the monkey’s skull under surgical procedure. Details of the surgery and data recording of monkey Cu methods were given previously (Heimer et al., 2002, 2006; Bar-Gad et al., 2003a; Elias et al., 2007). Surgery and data recording details of monkey S were identical to those performed on monkey Cu, unless stated otherwise. Briefly, a Cilux recording chamber (Cu – 18 mm round base; S – 27 mm square base) was tilted 50° laterally in the coronal plane and was positioned by a stereotactic device to cover most of the pallidal area (Contreras et al., 1981; Szabo and Cowan, 1984; Martin and Bowden, 2000).
The exact position of the chamber was verified using an MRI scan and electrophysiological mapping.
On each recording day, glass-coated tungsten electrodes (127 μm diameter tungsten rods coated with a layer of approximately 100 μm glass, yielding a total diameter of ∼350 μm for a length of 8–10 cm), confined to a concentric guide tube, were inserted into the brain. The electrodes’ relative and absolute location was a consequence of the chamber’s tilted angle. Therefore, distances on the plane tangent to the camber (and therefore the cranium) are defined “horizontal”, and distances perpendicular to the cranium are defined “vertical”.
The horizontal distance between the different electrodes was defined by the spatial arrangement of the electrodes within the guide: for monkey S the four electrodes were confined in a 570-μm inner diameter guide (i.e., 2 × 2 square with a 410-μm side). For monkey Cu the eight electrodes were confined in a 1420-μm inner diameter guide (i.e., one central electrode with a distance of 505 μm from each of the seven surrounding ones). Layout design can be found at: http://www.alphaomega-eng.com/pr_site/mt_lay-out/mt_designs.htm.
A mechanical micro-drive (EPS – Electrode Positioning System 1.28, Alpha-Omega Engineering, Nazareth, Israel) was used to lower each electrode individually through the dura into the brain while tracking its depth. Inside the recording target, we manipulated the electrode depth until an optimal and stable signal to noise ratio of spiking activity had been achieved. Vertical distances between the electrodes were therefore variable and typically ranged between 0 and 2000 μm. Distance between electrodes tips was estimated based on depth and horizontal distances. However, it should be stressed that this depth is subject to inaccuracies resulting mainly from the electrodes flexibility. This might be more pronounced in our settings, in which long (8–10 cm), and thin (350 μm diameter) electrodes were used, in order to minimize the spatial spread of the recording tips of the microelectrodes.
After recordings in the normal state, the monkeys were ren-dered Parkinsonian by five intramuscular injections of 0.4 mg/kg of MPTP–HCl dissolved in ∼0.5 ml of normal saline (Cu: Aldrich, Milwaukee, WI, USA; S: Sigma, Israel) over a period of 4 days. The monkeys were clinically assessed on a regular basis using a modi-fied primate clinical staging scale (Benazzouz et al., 1995; Imbert et al., 2000). The monkeys developed severe Parkinsonism 5 days after initiation of MPTP treatment, and received an average score
Mitelman et al. Parkinsonian pallidum is homogeneously synchronized
Frontiers in Systems Neuroscience www.frontiersin.org June 2011 | Volume 5 | Article 54 | 2

for the effect of the refractory period. This method is especially use-ful for bursting oscillations, which are typical at the Parkinsonian pallidum. Similar to previous work (Heimer et al., 2006), we used a frequency resolution of 0.25 Hz; shuffling was repeated 20 times; the confidence interval was set based on the flat high frequency range (270–300 Hz); and the range of interest for significant oscil-lations was 4.5–30 Hz. Since we used shadowed spike trains, which rendered noisy spectrograms especially in the low frequencies, we defined a higher threshold than described previously (Rivlin-Etzion et al., 2006). To define a significant oscillation in this study, a seg-ment of three consecutive samples were required to cross a con-fidence level of p = 10−5. Furthermore, we required that the local maximum of an interval which crossed the confidence level would be within the range of interest (4.5–30 Hz).
Single neurons were defined “oscillatory” if they had at least one segment in their auto-spectrum function which fulfilled the criteria detailed above. Similarly, close pairs of neurons were defined “synchronized” if they had at least one segment in their cross-spectrum which fulfilled these criteria. Remote pairs of neurons were graded between 0 and 1 (synchronization index), according to their probability of being detected as “synchronized” had they been affected by the shadowing effect (see below). For further analysis, a non-synchronization index was also defined, such that it completed the synchronization index to 1 (i.e., their probability of not being detected as synchronized had they been affected by shadowing). For a synchronized pair, the oscillation frequency was defined as the frequency of the maximal peak in the cross-spectrum (within the range of interest).
estIMatIng the shadowIng effectIn order to mimic the shadowing effect on remote cells, we first estimated the shadowing effect of the close pairs (see details in the Appendix). Briefly, we used previously derived mathemati-cal equations (Eqs 1 and 2 in the Appendix) which estimate the recorded cross-correlation function and recorded firing rate, given the probability to miss a spike in each time sample (termed “shadowing vector”) and the original – “true” firing rates of the two cells (Bar-Gad et al., 2001). Based on the same formula we estimated the shadowing vector (as well as the original firing rates), given the recorded firing rate and cross correlation. This can be done under several assumptions, which are necessary for mathematically extracting the shadowing vector (see details in the Appendix). First, we assume that the shadowing effect is shorter than the refractory period. Second, the shadowing vectors of a pair of neurons are symmetric; i.e., the shadowing vector of the first cell at time t equals the shadowing vector of the second cell at time minus t. Finally, we assume that during complete shadowing (i.e., at time samples in which the shadowing vector, or the lost spike probability, equals 1), no spike was detected at either of the cells. This process yielded one shadowing vector per close pair.
To test the shadowing effect estimation method, we used data recorded from the two monkeys, where spikes are detected and sorted with different methods. Offline sorting (monkey Cu) yielded a longer shadowing period than online sorting (monkey S), appar-ently reflecting the longer “dead time” required by the offline sort-ing algorithm. The averaged shadowing vectors of monkeys Cu and
of 30.0/36 (Cu) and 20.0/25 (S). Recordings were resumed 4 days after the last MPTP injection. In monkey Cu, recordings were also conducted after treatment with dopamine replacement therapy (these data are not included in this report).
Pallidal neurons were identified according to their stereotactic coordinates (based on the MRI and the primate atlas data) and their real-time physiological properties (typical spike shape, firing rate, and pattern), which are considerably different from striatal neurons located above (DeLong, 1971). Differentiation into GPe and GPi neurons was determined by the depth of the electrode and other anatomical/physiological structures identified along the
electrode trajectory (e.g., border cells). Pallidal cells which could not be classified as GPe or GPi neurons were considered GP neurons.
recordIng and spIke sortIngThe electrode output was sorted and classified in real time by a template-matching algorithm (Cu: MSD, S: ASD; Alpha-Omega Engineering, Nazareth, Israel). In addition, the electrode output was also bandpass filtered (Cu: 300–6000 Hz, S: 250–5000, MCP-plus; Alpha-Omega Engineering) and continuously sampled (Cu: 24 kHz, S: 40 kHz, AlphaMap; Alpha-Omega Engineering). The continuous sampling of the electrode output of monkey Cu was also subjected to an offline spike-sorting procedure (AlphaSort; Alpha-Omega Engineering) based on principal-component analy-sis of the spike patterns (Abeles and Goldstein, 1977). We applied two sets of principal components (PCs), a default based on cortical recordings (Abeles and Goldstein, 1977) and a set of PCs that were created by a library of 131 waveforms of well isolated pallidal spikes recorded by the same setup (Bar-Gad et al., 2003a). Offline sorting was performed using both cortical and pallidal PCs, and the best result was taken for each pair.
Both offline (monkey Cu) and online (monkey S) sorting was verified by the existence of a refractory period in the inter-spike interval histogram (cells in which more than 2% of the total inter-spike intervals were less than 2 ms were excluded) and by the stabil-ity of the firing rate of the cells (inspected by human observer). In the stability analysis, the instantaneous firing rate of the neurons as a function of time was displayed for the entire period of recording, and the largest segment of stable data was selected for additional analysis. Spike times were saved at the sampling rate of the analog data (Cu: 24 kHz; S: 40 kHz).
data analysIsAll data analysis was done on custom software using Matlab (The MathWorks). Only pairs of neurons which were recorded simul-taneously and fulfilled the isolation criteria (refectory period and stability of discharge rate) for at least 150 s were included. For analysis of the shadowing effect, which is a phenomenon at the sub-millisecond order, we used the original sampling rate. For the inspection of synchronous oscillations, we down sampled the data to a sampling rate of 1 kHz.
We used auto and cross-correlation functions for time domain analyses. The cross correlation of all pairs of cells recorded by the same electrode showed a clear shadowing effect (Figure 1A). We used a global shuffling method for the frequency domain analysis (Rivlin-Etzion et al., 2006), which reflects this domain more reliably than standard spectrum or coherence functions by compensating
Mitelman et al. Parkinsonian pallidum is homogeneously synchronized
Frontiers in Systems Neuroscience www.frontiersin.org June 2011 | Volume 5 | Article 54 | 3

The representative vectors were chosen in the following way: all the shadowing vectors were pooled together, and for each time sample, five values were chosen such that they divided the ampli-tude of the shadowing vector at each time sample into six evenly spaced shares. This approach (known as six-quantiles), is a natural extension of the median concept (achieved by dividing the data into two equal shares), and still provides a good representation of the population diversity. As stated above, this was done separately for each monkey.
Since shadowing is stochastic in nature (there are points in which the probability of missing a spike lies between 0 and 1), we repeated the artificial shadowing with a given shadowing vec-tor five times and averaged the resulting time and frequency cor-relation functions. This yielded a single correlation function per shadowing vector. All in all, we had five cross-spectrum functions for any given pair of remote neurons, one from each representa-tive shadowing vector. The relative part out of these five functions which was considered synchronous (according to the parameters
S are shown in Figure 1B. During the analysis of the remote pairs of each monkey, we used the shadowing vectors derived from the close pairs of the same monkey.
MIMIckIng the shadowIng effectArtificial shadowing of a pair of spike trains recorded by different electrodes, by a given shadowing vector, was done by dropping spikes from these spike trains with the probability derived from the shadowing vector. A simplified approach would have been to take the average shadowing vector and use it to shadow the remote pairs. However, this would not have fully represented the diversity of the different shadowing vectors. Ideally, we should have artifi-cially shadowed each remote pair with all possible shadowing vec-tors (as calculated for all the close pairs of a particular monkey). However, repeating the artificial shadowing and all further analyses with all shadowing vectors for all remote pairs was computationally heavy. Therefore, we chose five representative shadowing vectors (per monkey in this study), and applied them to the remote pairs.
−2 −1.5 −1 −0.5 0 0.5 1 1.5 20
0.2
0.4
0.6
0.8
1
Offset (ms)
Lost
spi
ke p
roba
bilit
y
−10 −5 0 5 100
10
20
30
40
50
60
70
80
90
Offset (ms)
Firi
ng r
ate
(Spi
kes/
S)
−500 0 5000
40
80
A
C D
−10 −5 0 5 100
20
40
60
80
100
120
140
Offset (ms)
Firi
ng r
ate
(Spi
kes/
S)
B
−10 −5 0 5 100
20
40
60
80
100
120
140
Offset (ms)
Firi
ng r
ate
(Spi
kes/
S)
Figure 1 | The shadowing effect – demonstration, quantification, and artificial shadowing. (A) Cross correlation function of a pair of neighboring pallidal neurons (i.e., extracellularly recorded by the same electrode, Monkey Cu). The shadowing effect is approximately within 1 ms offset. This pair also exhibits synchronous oscillations, as can be seen in the larger time scale (±500 ms) cross correlation histogram in the inset. (B) Mean shadowing effect, as estimated from
the close pairs sorted offline (monkey Cu, n = 24 pairs, in blue) and online (monkey S, n = 15 pairs, in orange). Gray shading marks the SEM. The shadowing effect for the online sorting is shorter than that of the offline sorting. (C) Example of cross correlation of a pallidal remote pair (i.e., recorded by different electrodes) from monkey S. (D) Cross correlation of the pair shown in (C), after artificial shadowing by one of the five representative shadowing vectors.
Mitelman et al. Parkinsonian pallidum is homogeneously synchronized
Frontiers in Systems Neuroscience www.frontiersin.org June 2011 | Volume 5 | Article 54 | 4

visible in the time domain, but are clearer in the frequency domain. Figure 2A presents the temporal (first row) and frequency (sec-ond row) correlation of a remote pallidal pair. The insets present the autocorrelation and auto-spectrum of the two cells. In both domains, the pair shows no significant synchronous oscillations (although one of the cells does show oscillations). The effect of artificial shadowing on the correlation and the cross-spectrum functions of this pair is shown in Figure 2B. Both functions (in the time and frequency domains) present clear and statistically significant (here calculated only for the frequency domain) syn-chronous oscillations at approximately 10 Hz.
Here we show that the shadowing effect can also have the oppo-site effect and mask existing synchrony. This opposite phenomenon is presented in Figure 3. Here, a remote pair displays significant synchronous oscillations (Figure 3A). However, after artificial shad-owing by one of the five possible shadowing vectors (Figure 3B), the peak in the cross-spectrum function is smoothed and the cross-spectrum does not meet the significance criteria. Thus, the artifi-cial shadowing by this shadowing vector results in no-detection of synchronous oscillations of this pair of neurons. Application of the other four representative shadowing vectors here also masked the synchrony and yielded a synchronization index of 0.
Thus, the net effect of the shadowing on the detection of neu-ronal synchronous oscillations is not unidirectional and two error types are possible. First, there are false positive errors; i.e., detec-tion of significant synchronous oscillations in the shadowed pair which were not there in the original spike trains. Second, there are false negative errors; i.e., synchronous oscillations that were missed because of the shadowing effect. The fraction of the two errors was found to differ between the two monkeys, probably because of the difference in sorting method of the close pairs and the resulting shadowing vectors (Figure 1B). For monkey S (n = 91 pairs, sorted online, and ∼2 ms duration shadowing effect), P (false positive) = 0.074, and P (false negative) = 0.171, whereas for monkey Cu (n = 349 pairs, sorted offline, and ∼3.5 ms shadowing effect), P (false positive) = 0.27, and P (false nega-tive) = 0.309. Apparently, the longer duration of the shadow-ing vector originating from the offline sorting process led to the higher error values in this case.
Next, we wanted to further understand the connection between these types of errors and the firing properties of each of the neurons in a given pair. To do so, we calculated the probabilities of having zero, one, or two of the cells significantly oscillatory in each of the pairs. This was done given the probability of having one of the pos-sible types of errors, as well as the two correct possibilities (correct detection and rejection of synchronous oscillations). These results are summed at Table 1. The most striking result is that all cases in which the shadowing effect created apparent synchrony occurred when only one of the cells in the pair was significantly oscillatory. On the other hand, about half of the cases in which synchrony was concealed by the shadowing effect occurred when none of the cells in the pair was considered oscillatory.
Thus overall, the shadowing effect on neighboring neurons is not one-sided, and it induces both false detection of synchronous oscillations, as well as misses of existing synchronous oscillations. Therefore, a proper comparison of the close pairs to the remote ones should balance this effect.
mentioned above), was defined as synchronization index of that pair. This index represents the probability (p = 0, 0.2, 0.4, …, 1) of a remote pair to be detected as synchronized, had it been affected by the shadowing effect. A complementary non-synchronization index was also defined, such that it completes the synchronization index to 1. Close pairs were classified as either synchronized or non-synchronized (which is equivalent to a synchronization index of 1 or 0 respectively). Figures 1C,D illustrates the artificial shadowing of a remote pair by one of the five shadowing vectors (for simplified visualization). Applying the shadowing vectors yielded the short term artifacts observed in the close pairs, as planned.
statIstIcal coMparIson of close and reMote paIrsComparison of two populations (close vs. remote pairs) divided into two categories (synchronized vs. non-synchronized) is typically done by 2 × 2 contingency table. This method was easily expanded in our continuous case by replacing the discrete number of synchro-nized pairs by the sum of the synchronization index, which could be a fraction. Similarly, the number of non-synchronized pairs was replaced by the sum of the non-synchronization index. This yielded a continuous 2 × 2 contingency table per recording session.
For each pallidal population, we obtained an N × 2 × 2 hyper-matrix, where N represents the number of recording sessions (N = 16 and 33 recording sessions for monkey Cu and S respec-tively). First, we summed the results over the N sessions. This yielded, for each population (GPe, GPi, GP-pooled), a 2 × 2 con-tinuous version of the contingency table previously described. To test the hypothesis that both close and remote pairs originate from the same distribution, we used a two-tailed statistical Fisher’s exact test, with the null hypothesis that close pairs are as synchronized as remote ones (the χ2 test was not suitable because of the relative small N for the GPi population).
However, since the pallidal oscillations in the Parkinsonian mon-key are episodic in nature, this analysis method might distort the results. For example, if during oscillatory episodes more remote pairs were recorded, this might create the impression that they have a higher probability for synchronous oscillations. Furthermore, in an analysis of three or more simultaneously recorded neurons, not all comparisons are independent (e.g., if there is synchrony between the neuron pair A–B and B–C, one would probably find a synchrony between the A–C pair). Therefore, counting correlated pairs might again bias the results.
To overcome this, we used additionally a different statistical method. We averaged the synchronization index of the close and remote populations, over all N sessions. This method yielded the average synchrony percentage per recording session (for close and remote pairs separately), rather than the total percentage of syn-chronized pairs. Here, we used a statistical two-tailed Student’s t-test, comparing the session’s synchronicity. As before, our null hypothesis was that in an average session, the fraction of synchro-nized pairs of close neurons was identical to that of the remote pairs.
resultsshadowIng effect In the tIMe and frequency doMaInPrevious studies (Bar-Gad et al., 2001) have revealed that the shadowing effect can induce apparent synchrony between neurons recorded simultaneously from the same electrode. These effects are
Mitelman et al. Parkinsonian pallidum is homogeneously synchronized
Frontiers in Systems Neuroscience www.frontiersin.org June 2011 | Volume 5 | Article 54 | 5

the remote ones (32.2%). Thus, to our surprise, we failed to reject the null hypothesis that the fraction of synchrony in the close pairs is equal to that found at the remote ones (after artificial shadowing).
Similar trend was achieved in the second analysis method of averaging the synchrony over the recording sessions. This method has the advantage of compensating the episodic nature of the oscil-lations (see Materials and Methods). These results are summarized in Table 3. In the pooled data, the average synchrony of the close pairs (17.2%) was smaller than that of the remote ones, both before and after artificial shadowing (29.2 and 35.4%, respectively).
Both analysis methods yielded similar results. After artificial shadowing, the remote pairs tend to be more synchronized than the close ones. This was the case for both monkeys, in both the GPe and the GP-pooled population. In the GPi we observed opposite trends in the two monkeys, but the number of close pairs in our
synchrony In the dIfferent pallIdal populatIonsWe divided the pallidal cell population into three groups – GPe, GPi, and GP (i.e., unclassified cells within the GP). We analyzed separately the GPe pairs, and the GPi pairs, and then pooled all three pallidal populations together (“GP-pooled”).
We used two different statistical approaches in the comparison of close and remote pairs (see details in the Materials and Methods). The results of the contingency table analysis, which pools all pairs and ignores the sessions in which they were recorded, are sum-marized in Table 2. In the pooled data (as in most sub-groups), the fraction of synchrony in the close pairs (20.5%) was slightly higher than in the remote one without shadowing (17.7%). After application of the shadowing effects to the remote pairs (to bal-ance this effect on the close pairs) we found that the fraction of synchrony in the close pairs (20.5%) was actually lower than that in
A B
−500 −250 0 250 50060
80
100
120
Offset (ms)
Firi
ng r
ate
(Spi
kes/
S)
−500 0 5000
50
100
−500 0 5000
50
100
10 20 300
5
10
15
20
25
Frequency (Hz)
Com
pens
ated
CP
SD
10 20 300
2
4
6
8
10 20 300
1
2
3
4
−500 −250 0 250 50060
80
100
120
Offset (ms)
Firi
ng r
ate
(Spi
kes/
S)
−500 0 5000
50
100
−500 0 5000
50
100
10 20 300
5
10
15
Frequency (Hz)
Com
pens
ated
CP
SD
10 20 300
2
4
6
10 20 300
1
2
3
4
Figure 2 | Shadowing effect induces artificial synchronous oscillations. (A) A remote pair (same pair as in Figures 1C,D) which does not exhibit significant synchronous oscillations. First row – cross-correlation function (inset: auto correlation functions); second row – cross power spectral density (CPSD, inset: auto-spectral densities). Note that one of the cells is oscillatory whereas the other one is not. (B) The same pair as in a, after artificial shadowing by one of the
representative shadowing vectors. At the time domain (first row) we can see the large deflection around t = 0 which is caused by the shadowing effect. Both time domain and frequency domain (second row) demonstrate synchronous oscillations (insets show auto correlations and auto-spectrum after shadowing). Confidence levels in the frequency domain are marked with a broken line. Significant samples (at least three continuous) are marked with a circle.
Mitelman et al. Parkinsonian pallidum is homogeneously synchronized
Frontiers in Systems Neuroscience www.frontiersin.org June 2011 | Volume 5 | Article 54 | 6

−500 −250 0 250 50060
80
100
120
Offset (ms)
Firi
ng r
ate
(Spi
kes/
S)
−500 0 5000
50
100
−500 0 5000
50
100
10 20 300
5
10
15
20
25
Frequency (Hz)
Com
pens
ated
CP
SD
10 20 300
1
2
3
4
5
10 200
2.5
5.0
7.5
10.0
−500 −250 0 250 50060
80
100
120
Offset (ms)
Firi
ng r
ate
(Spi
kes/
S)
−500 0 5000
50
100
−500 0 5000
50
100
10 20 300
10
20
30
40
Frequency (Hz)
Com
pens
ated
CP
SD
10 20 300.5
1.0
1.5
2.0
2.5
3.0
10 20 300
2.5
5.0
7.5
AB
Figure 3 | Shadowing effect conceals existing synchronous oscillations. (A) A remote pair (monkey Cu) with significant synchronous oscillations in both the time (first row) and frequency (second row) domains. Insets are auto correlation and auto spectrum functions. Both cells exhibit oscillatory firing patterns. (B) The same pair as in (A), after artificial shadowing by one of the
representative shadowing vectors (same one as in Figure 2). Similarly to Figure 2B, we can see the deflection at t = 0 (in the time domain, first row) caused by the shadowing effect. In both the time domain and the frequency domain (second row), the shadowing effect decreased the ∼10 Hz synchronous oscillations to an insignificant level. Conventions are the same as in Figure 2.
Table 1 | The shadowing effect and oscillatory activity of the single cells.
Number of
significantly
oscillating cells in
the pair
Synchronous
oscillations before
and after artificial
shadowing (“hit”) (%)
Artificial shadowing
concealed existing
synchronous oscillations
(“miss”) (%)
Shadowing created
apparent synchronous
oscillations (“false
alarm”) (%)
No synchronous oscillations
before and after artificial
shadowing (“correct
rejection”) (%)
None 1.7 52.1 0.0 89.1
Only one 36.0 38.1 100.0 10.0
Both 62.3 9.8 0.0 0.9
Relationships between firing properties of each of the single neurons in a given pair, and the outcome of the shadowing effect. The left column gives the number of cells within a pair that were defined as oscillatory. Each of the next columns addresses one of the four possibilities of detection of synchronous oscillations given the shadowing effect (signal detection theory). That is, synchronous oscillations were detected before and after shadowing (“hit”); synchronous oscillations were concealed by the shadowing (“miss”); shadowing created apparent synchronous oscillations (“false alarm”); or there were no synchronous oscillations both before and after synchronous oscillations (“correct rejection”). We present here the probability of having none, one, or both oscillatory cells within the pair, given each one of the four possibilities (so that each column is summed to 100%). We can see that all “false alarms” occurred when only one of the cells in the pair was oscillatory. On the other hand, about half of the “misses” occurred when none of the cells in the pair were significantly oscillatory.
Mitelman et al. Parkinsonian pallidum is homogeneously synchronized
Frontiers in Systems Neuroscience www.frontiersin.org June 2011 | Volume 5 | Article 54 | 7

Similarly to the previously described comparisons of close and remote pairs, we first compared the ratio of synchronous pairs (Table 4). For the GPe, GPi, and GP-pooled populations the closer (i.e., less than 750 μm apart) pairs were slightly but insig-nificantly less synchronized than the further distant ones (15.8% and 20.0% of the GP-pooled pairs, respectively). Finally, we com-pared the average percentage of synchrony per recording session (Table 5). Again, no significant difference was found between closer and further distant pairs in GPe, GPi, and GP-pooled populations (for GP-pooled population, average synchrony of 29.9% in the closer pairs, in comparison with 28.5% in those further distant).
database was very small (three and two close pairs in monkeys Cu and S, respectively). We conclude that in the MPTP treated primate, close pairs of GP neurons have a similar tendency for synchronous oscillations as remote pairs.
To further validate our results, we divided the remote pairs’ population into two subpopulations. This was done according to the estimated distance between the electrode tips, with a cutoff between categories at 750 μm. We preferred to use two categories, rather than continuous spectrum, since this distance estimation suffers a certain noise, resulting from the electrodes flexibility. Since both subpopulations were recorded by different electrodes, we compared the synchrony of the original, unshadowed signal.
Table 2 | ratio of synchronous oscillating pairs out of total population of pairs: comparison between neighboring and remote cells.
Monkey ratio of synchronous oscillating pairs out of total population of pairs Fisher’s exact test
p-value (unshadowed in
parentheses)Close remote shadowed (unshadowed in parentheses)
ratio % ratio %
GPe Cu 3/19 15.8 29.4 (7)/118 24.9 (5.9) 0.562 (0.144)
S 2/13 15.4 2.8 (4)/53 5.3 (7.5) 0.253 (0.337)
Both 5/32 15.6 32.2 (11)/171 18.8 (6.4) 0.806 (0.142)
GPi Cu 3/3 100 15.0 (22)/23 65.2 (95.7) 0.529 (1)
S 0/2 0 10.8 (10)/14 77.1 (71.4) 0.083 (0.125)
Both 3/5 60 25.8 (32)/37 69.7 (86.5) 0.637 (0.188)
GP-pooled Cu 6/24 25 119.2 (57)/349 34.2 (16.3) 0.503 (0.265)
S 2/15 13.3 22.6 (21)/91 24.8 (23.1) 0.513 (0.515)
Both 8/39 20.5 141.8 (78)/440 32.2 (17.7) 0.151 (0.664)
Ratio of synchronous oscillating pairs out of total population of pairs in the different nuclei. Each artificially shadowed pair was scored between 0 and 1 based on the synchronization index. The sum of this score for the whole population represents the number of pairs which were significantly oscillatory. For the remote pairs we also present, in parentheses, the results of the original, unshadowed pairs. A two-tailed Fisher’s exact test was performed under the null hypothesis of an identical fraction of synchrony in the close and the remote pairs.
Table 3 | Average percentage of synchronous oscillating pairs per session: comparison between neighboring and remote cells.
Monkey Number of sessions Average percentage of synchronous oscillating pairs
per session
t-Test p-value
(unshadowed in
parentheses)Close remote Close remote shadowed (unshadowed in
parentheses)
GPe Cu 10 10 10.0 23.5 (6.5) 0.179 (0.674)
S 13 20 15.4 6.9 (12.0) 0.477 (0.790)
Both 23 30 13.0 12.5 (10.2) 0.941 (0.725)
GPi Cu 2 3 100.0 67.6 (97.4) 0.108 (0.423)
S 2 10 0.0 79.3 (70.0) 0.0002 (0.001)
Both 4 13 50.0 76.6 (76.3) 0.437 (0.446)
GP-pooled Cu 14 16 21.4 39.0 (20.3) 0.141 (0.932)
S 15 33 13.3 33.6 (33.5) 0.098 (0.105)
Both 29 49 17.2 35.4 (29.2) 0.040 (0.188)
Percentage of synchronous oscillating pairs in an average session in the different nuclei (regardless of the number of pairs recorded in it). The percentage of signifi-cantly synchronous oscillating pairs per session is presented in the second and third columns from the right. For the remote pairs, the percentage of pairs after artificial shadowing is presented, with the percentage of original, unshadowed pairs in parentheses. Similar to Table 1, the two-tailed t-test hypothesis is that close pairs have the same percentage of synchrony as remote ones.
Mitelman et al. Parkinsonian pallidum is homogeneously synchronized
Frontiers in Systems Neuroscience www.frontiersin.org June 2011 | Volume 5 | Article 54 | 8
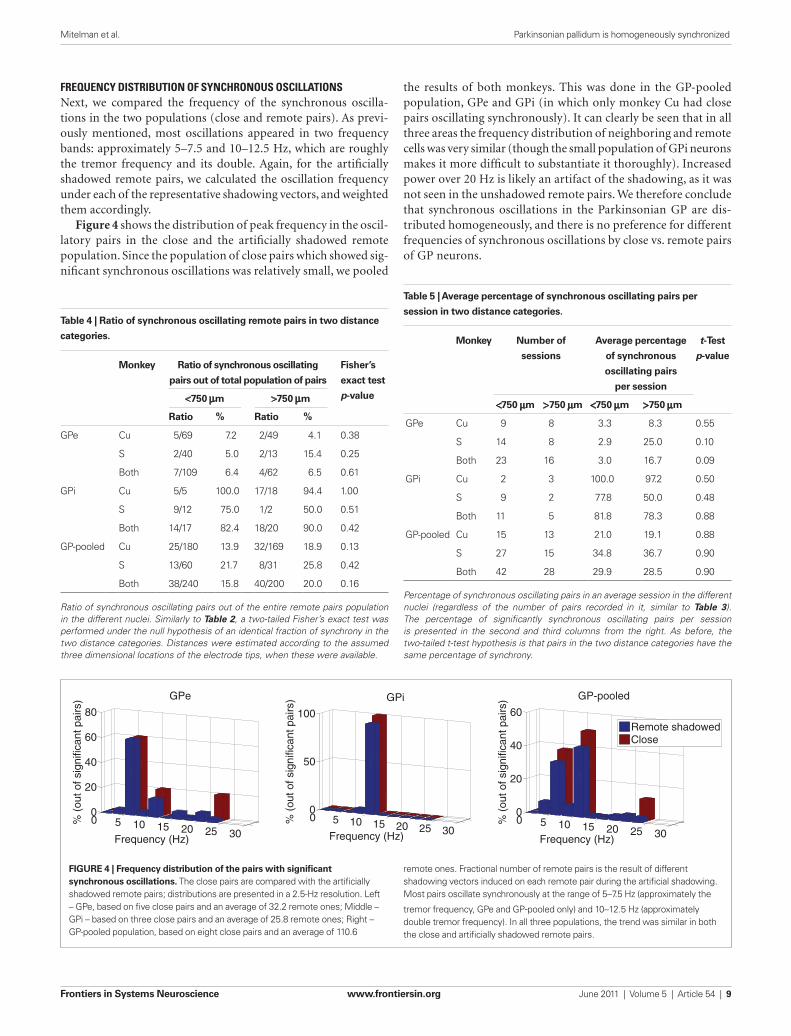
the results of both monkeys. This was done in the GP-pooled population, GPe and GPi (in which only monkey Cu had close pairs oscillating synchronously). It can clearly be seen that in all three areas the frequency distribution of neighboring and remote cells was very similar (though the small population of GPi neurons makes it more difficult to substantiate it thoroughly). Increased power over 20 Hz is likely an artifact of the shadowing, as it was not seen in the unshadowed remote pairs. We therefore conclude that synchronous oscillations in the Parkinsonian GP are dis-tributed homogeneously, and there is no preference for different frequencies of synchronous oscillations by close vs. remote pairs of GP neurons.
frequency dIstrIbutIon of synchronous oscIllatIonsNext, we compared the frequency of the synchronous oscilla-tions in the two populations (close and remote pairs). As previ-ously mentioned, most oscillations appeared in two frequency bands: approximately 5–7.5 and 10–12.5 Hz, which are roughly the tremor frequency and its double. Again, for the artificially shadowed remote pairs, we calculated the oscillation frequency under each of the representative shadowing vectors, and weighted them accordingly.
Figure 4 shows the distribution of peak frequency in the oscil-latory pairs in the close and the artificially shadowed remote population. Since the population of close pairs which showed sig-nificant synchronous oscillations was relatively small, we pooled
0 5 10 15 20 25 30
0
20
40
60
80
Frequency (Hz)
GPe
% (
out o
f sig
nific
ant p
airs
)
0 5 10 15 20 25 30
0
50
100
Frequency (Hz)
GPi
% (
out o
f sig
nific
ant p
airs
)
0 5 10 15 20 25 30
0
20
40
60
Frequency (Hz)
GP-pooled
% (
out o
f sig
nific
ant p
airs
)
Remote shadowedClose
Figure 4 | Frequency distribution of the pairs with significant synchronous oscillations. The close pairs are compared with the artificially shadowed remote pairs; distributions are presented in a 2.5-Hz resolution. Left – GPe, based on five close pairs and an average of 32.2 remote ones; Middle – GPi – based on three close pairs and an average of 25.8 remote ones; Right – GP-pooled population, based on eight close pairs and an average of 110.6
remote ones. Fractional number of remote pairs is the result of different shadowing vectors induced on each remote pair during the artificial shadowing. Most pairs oscillate synchronously at the range of 5–7.5 Hz (approximately the
tremor frequency, GPe and GP-pooled only) and 10–12.5 Hz (approximately double tremor frequency). In all three populations, the trend was similar in both the close and artificially shadowed remote pairs.
Table 4 | ratio of synchronous oscillating remote pairs in two distance
categories.
Monkey ratio of synchronous oscillating
pairs out of total population of pairs
Fisher’s
exact test
p-value<750 mm >750 mm
ratio % ratio %
GPe Cu 5/69 7.2 2/49 4.1 0.38
S 2/40 5.0 2/13 15.4 0.25
Both 7/109 6.4 4/62 6.5 0.61
GPi Cu 5/5 100.0 17/18 94.4 1.00
S 9/12 75.0 1/2 50.0 0.51
Both 14/17 82.4 18/20 90.0 0.42
GP-pooled Cu 25/180 13.9 32/169 18.9 0.13
S 13/60 21.7 8/31 25.8 0.42
Both 38/240 15.8 40/200 20.0 0.16
Ratio of synchronous oscillating pairs out of the entire remote pairs population in the different nuclei. Similarly to Table 2, a two-tailed Fisher’s exact test was performed under the null hypothesis of an identical fraction of synchrony in the two distance categories. Distances were estimated according to the assumed three dimensional locations of the electrode tips, when these were available.
Table 5 | Average percentage of synchronous oscillating pairs per
session in two distance categories.
Monkey Number of
sessions
Average percentage
of synchronous
oscillating pairs
per session
t-Test
p-value
<750 mm >750 mm <750 mm >750 mm
GPe Cu 9 8 3.3 8.3 0.55
S 14 8 2.9 25.0 0.10
Both 23 16 3.0 16.7 0.09
GPi Cu 2 3 100.0 97.2 0.50
S 9 2 77.8 50.0 0.48
Both 11 5 81.8 78.3 0.88
GP-pooled Cu 15 13 21.0 19.1 0.88
S 27 15 34.8 36.7 0.90
Both 42 28 29.9 28.5 0.90
Percentage of synchronous oscillating pairs in an average session in the different nuclei (regardless of the number of pairs recorded in it, similar to Table 3). The percentage of significantly synchronous oscillating pairs per session is presented in the second and third columns from the right. As before, the two-tailed t-test hypothesis is that pairs in the two distance categories have the same percentage of synchrony.
Mitelman et al. Parkinsonian pallidum is homogeneously synchronized
Frontiers in Systems Neuroscience www.frontiersin.org June 2011 | Volume 5 | Article 54 | 9

would be higher synchrony between close pairs than between remote ones. However, it was theoretically shown (DeLiang, 1995) that local interactions can cause global, homogeneous synchrony. Therefore, we believe that the attempt to derive the origin of the synchronous oscillations from our results requires a separate theoretical analysis. Such theoretical approach should take into consideration the specific properties of the GP, including its high firing rate and its predominantly inhibi-tory innervation.
We therefore suggest that future research should focus on two directions. First, in order to minimize the shadowing effect and maximize the separation quality of the different units, tetrodes, rather than single electrodes, should be used (Harris et al., 2000; Ecker et al., 2010). This is especially important since we cannot rule out the possibility that artificial shadowing have a different effect than the “natural” shadowing. It should be mentioned, though, that the shadowing effect still exists on tetrodes recordings. Hence, for a complete suppression of the shadowing effect one should use more than four contacts and/or a more advanced sorting algo-rithm (Takahashi and Sakurai, 2009; Franke et al., 2010). Second, to complete the comparison between rodent’s and primate’s spa-tial distribution of pallidal pathological synchronous oscillations, recordings within verified distances inside the primate and human (during DBS surgeries) pallidum should be performed (e.g., by multi-contact silicone probes).
Our work focused on the second order level of synchronous neural activity, i.e., pair wise correlations. At this level, no dif-ference was found between close and remote pairs in the primate GP. However, this does not rule out the possibility that higher orders of synchrony differ between close and remote popula-tions of neurons. Indeed, such a result was recently found in the primate visual cortex (Ohiorhenuan et al., 2010). Such an analysis with our data is not possible since recording of more than two neurons by a single electrode is extremely rare in the primate GP.
To conclude, our findings strongly imply that the pathological synchronous oscillations in the Parkinsonian MPTP treated pri-mate have a homogeneous spatial pattern. This pattern probably contributes to the robust effect of the pallidal oscillations on their target downstream to the basal ganglia. This robust effect can underlie the severe motor abnormalities in PD.
acknowledgMentsWe thank G. Goelman for MRI, V. Sharkansky, S. Freeman, and A. Shaposhnikov for technical assistance, Y. Ben Shaul, M. Joshua, and Y. Prut for suggestions on early stages of this work and E. Singer for language editing. This study was partly supported by the Hebrew University Netherlands Association (HUNA) “Fighting against Parkinson” and the Vorst family foundation grant (HB), the Dekker foundation fellowship (BR); the Foulkes Foundation fellowship, and a fellowship from MYERS-JDC-BROOKDALE Institute of Gerontology and Human Development and ESHEL, the Association for the Planning and Development of Services for the Aged in Israel (SE); the Israel Science Foundation grant (YR) and by the “Hoffman Leadership and Responsibility” fellowship program at the Hebrew University (RM).
dIscussIonWe analyzed correlations of close pairs of GP neurons recorded by the same electrode and compared their synchrony to that of pairs recorded by different electrodes (200–2000 μm apart) in the Parkinsonian MPTP treated primates. In addition we compared intermediate distant pairs (less than 750 μm) to further distant ones (over 750 μm). Our results indicate that pathological synchronization of pallidal activity in the MPTP treated monkeys does not fall off across a few millimeters of tis-sue. Furthermore, the frequency distribution of the significant synchronous oscillations of close and remote pairs was found to be similar. These findings are in line with our previous report of emergence of synchronous oscillations between striatal cho-linergic interneurons (TANs) and pallidal neurons after MPTP treatment. In the normal state TANs have no correlation with pallidal activity. The high level of oscillatory correlated activ-ity between random pairs of TAN and GP neuron suggests that coherent, homogeneous oscillations of the whole basal ganglia circuitry underlie the clinical features of the MPTP primate model of PD (Raz et al., 2001).
Along the line of previous work in the rodent 6-OHDA model of PD (Mallet et al., 2008), our results suggest that the pallidal synchrony spans most of these nuclei. However, Mallet et al. found that synchronization decreases with distance. One pos-sible explanation for this discrepancy is the delicate method of multi-contact silicone probes which was used in that study. These probes cover a range of distances from a hundred of microns to a few millimeters, whereas our methods divide the population of neuron pairs in a binary fashion. Furthermore, the close pairs which were recorded in our study by the same electrode were probably within less than a 100-μm apart (Abeles, 1974; Gray et al., 1995). On the other hand, the primate pallidum is larger than the rodent pallidum, and therefore our “remote” units, even those in the subcategory of over 750 μm, might still be in the closer pallidal territories than the remote rodent ones. This differ-ence in scales may underlie the discrepancy between the studies.
Alternatively, the discrepancy could be the result of differ-ences in the model of PD. First, our recordings were made on awake animals, whereas Mallet et al. used urethane anesthetized animals. Next, our dopamine depletion model was systemic and therefore bilateral, whereas the 6-OHDA model was uni-lateral. Finally, MPTP treated vervet monkeys demonstrate all major Parkinsonian motor symptoms, including rigidity and Parkinsonian tremor. Unilaterally injected 6-OHDA rodents, on the other hand, mainly display motor asymmetry, which is mani-fested in an increased tendency for turning (Ungerstedt, 1968). The homogeneous level of synchronous oscillations found in the MPTP primate model could cause a broad effect of synchronous oscillations downstream to the basal ganglia; e.g., in the motor thalamus and motor cortex. This, in turn, could lead to a more pronounced clinical effect in the Parkinsonian vervets in com-parison to rodents (Beal, 2001).
The homogeneous spatial pattern of pathological GP syn-chrony may assist in finding the origin of the phenomenon. We might conjecture that if the synchronous oscillations emerge within the GP (rather than upstream in the basal ganglia), there
Mitelman et al. Parkinsonian pallidum is homogeneously synchronized
Frontiers in Systems Neuroscience www.frontiersin.org June 2011 | Volume 5 | Article 54 | 10

pyridine vervet model of Parkinsonism. J. Neurosci. 20, 8559–8571.
Rivlin-Etzion, M., Ritov, Y., Heimer, G., Bergman, H., and Bar-Gad, I. (2006). Local shuffling of spike trains boosts the accuracy of spike train spectral analysis. J. Neurophysiol. 95, 3245–3256.
Sato, F., Lavallee, P., Levesque, M., and Parent, A. (2000). Single-axon tracing study of neurons of the external seg-ment of the globus pallidus in primate. J. Comp. Neurol. 417, 17–31.
Szabo, J., and Cowan, W. M. (1984). A stereotaxic atlas of the brain of the cynomolgus monkey (Macaca fascicu-laris). J. Comp. Neurol. 222, 265–300.
Takahashi, S., and Sakurai, Y. (2009). Sub-millisecond firing synchrony of closely neighboring pyramidal neu-rons in hippocampal CA1 of rats dur-ing delayed non-matching to sample task. Front Neural Circuits 3:9. doi: 10.3389/neuro.04.009.2009.
Ungerstedt, U. (1968). 6-Hydroxy-dopamine induced degeneration of central monoamine neurons. Eur. J. Pharmacol. 5, 107–110.
Conflict of Interest Statement: The authors declare that the research was conducted in the absence of any com-mercial or financial relationships that could be construed as a potential conflict of interest.
Received: 31 December 201 ; paper pending published: 14 February 2011; accepted: 13 June 2011; published online: 30 June 2011.Citation: Mitelman R, Rosin B, Zadka H, Slovik M, Heimer G, Ritov Y, Bergman H and Elias S (2011) Neighboring pallidal neurons do not exhibit more synchronous oscillations than remote ones in the MPTP primate model of Parkinson’s disease. Front. Syst. Neurosci. 5:54. doi: 10.3389/fnsys.2011.00054Copyright © 2011 Mitelman, Rosin, Zadka, Slovik, Heimer, Ritov, Bergman and Elias. This is an open-access article subject to a non-exclusive license between the authors and Frontiers Media SA, which permits use, distribution and reproduction in other forums, provided the original authors and source are credited and other Frontiers con-ditions are complied with.
Synchronized neuronal discharge in the basal ganglia of Parkinsonian patients is limited to oscillatory activ-ity. J. Neurosci. 22, 2855–2861.
Lewicki, M. S. (1998). A review of meth-ods for spike sorting: the detection and classification of neural action poten-tials. Network 9, R53–R78.
Mallet, N., Pogosyan, A., Marton, L. F., Bolam, J. P., Brown, P., and Magill, P. J. (2008). Parkinsonian beta oscilla-tions in the external globus pallidus and their relationship with subtha-lamic nucleus activity. J. Neurosci. 28, 14245–14258.
Martin, R. F., and Bowden, D. M. (2000). Primate Brain Maps: Structure of the Macaque Brain. Amesterdam: Elsevier Science.
Nini, A., Feingold, A., Slovin, H., and Bergman, H. (1995). Neurons in the globus pallidus do not show corre-lated activity in the normal monkey, but phase-locked oscillations appear in the MPTP model of Parkinsonism. J. Neurophysiol. 74, 1800–1805.
Ohiorhenuan, I. E., Mechler, F., Purpura, K. P., Schmid, A. M., Hu, Q., and Victor, J. D. (2010). Sparse coding and high-order correlations in fine-scale cortical networks. Nature 466, 617–621.
Percheron, G., Francois, C., and Yelnik, J. (1987). “Spatial organization and information processing in the core of the basal ganglia,” in The Basal Ganglia, eds M. B. Carpenter and A. Jayaraman (New York: Plenum Press), 205–226.
Percheron, G., Yelnik, J., and Francois, C. (1984). A Golgi analysis of the primate globus pallidus. III. Spatial organiza-tion of the striato-pallidal complex. J. Comp. Neurol. 227, 214–227.
Raz, A., Frechter-Mazar, V., Feingold, A., Abeles, M., Vaadia, E., and Bergman, H. (2001). Activity of pallidal and striatal tonically active nurons is cor-related in MPTP-treated monkeys but not in normal monkeys. J. Neurosci. 21, RC128.
Raz, A., Vaadia, E., and Bergman, H. (2000). Firing patterns and correlations of spontaneous discharge of pallidal neu-rons in the normal and the tremulous 1-methyl-4- phenyl-1,2,3,6-tetrahydro
external segment of the globus pal-lidus. J. Neurosci. 27, 2525–2538.
Franke, F., Natora, M., Boucsein, C., Munk, M., and Obermayer, K. (2010). An online spike detection and spike classi-fication algorithm capable of instanta-neous resolution of overlapping spikes. J. Comput. Neurosci. 29, 127–148.
Gray, C. M., Maldonado, P. E., Wilson, M., and McNaughton, B. (1995). Tetrodes markedly improve the reliability and yield of multiple single-unit isolation from multi-unit recordings in cat striate cortex. J. Neurosci. Methods 63, 43–54.
Haber, S. N., and Gdowski, M. J. (2004), “The basal ganglia,” in The Human Nervous System, eds G. Paxinos and J. K. Mai (New York, NY: Elsevier Academic Press), 676–738.
Harris, K. D., Henze, D. A., Csicsvari, J., Hirase, H., and Buzsaki, G. (2000). Accuracy of tetrode spike separation as determined by simultaneous intracel-lular and extracellular measurements. J. Neurophysiol. 84, 401–414.
Heimer, G., Bar-Gad, I., Goldberg, J. A., and Bergman, H. (2002). Dopamine replacement therapy reverses abnor-mal synchronization of pallidal neurons in the 1-methyl-4-phenyl-1,2,3,6-tetrahydropyridine primate model of Parkinsonism. J. Neurosci. 22, 7850–7855.
Heimer, G., Rivlin-Etzion, M., Bar-Gad, I., Goldberg, J. A., Haber, S. N., and Bergman, H. (2006). Dopamine replacement therapy does not restore the full spectrum of normal pallidal activity in the 1-methyl-4-phenyl-1,2,3,6-tetra-hydropyridine primate model of Parkinsonism. J. Neurosci. 26, 8101–8114.
Imbert, C., Bezard, E., Guitraud, S., Boraud, T., and Gross, C. E. (2000). Comparison of eight clinical rat-ing scales used for the assessment of MPTP-induced Parkinsonism in the Macaque monkey. J. Neurosci. Methods 96, 71–76.
Kita, H., and Kita, S. T. (1994). The morphology of globus pallidus pro-jection neurons in the rat: an intra-cellular staining study. Brain Res. 636, 308–319.
Levy, R., Hutchison, W. D., Lozano, A. M., and Dostrovsky, J. O. (2002).
referencesAbeles, M. (1974). “A journey into the
brain,” in Signal Analysis and Pattern Recognition in Biomedical Engineering, ed. G. F. Inbar (New York: Wiley), 41–59.
Abeles, M., and Goldstein, M. H. (1977). Multispike train analysis. Proc. IEEE 65, 762–773.
Bar-Gad, I., Heimer, G., Ritov, Y., and Bergman, H. (2003a). Functional correlations between neighboring neurons in the primate globus pallidus are weak or nonexistent. J. Neurosci. 23, 4012–4016.
Bar-Gad, I., Morris, G., and Bergman, H. (2003b). Information process-ing, dimensionality reduction and reinforcement learning in the basal ganglia. Prog. Neurobiol. 71, 439–473.
Bar-Gad, I., Ritov, Y., Vaadia, E., and Bergman, H. (2001). Failure in iden-tification of overlapping spikes from multiple neuron activity causes artifi-cial correlations. J. Neurosci. Methods 107, 1–13.
Beal, M. F. (2001). Experimental models of Parkinson’s disease. Nat. Rev. Neurosci. 2, 325–334.
Benazzouz, A., Boraud, T., Dubqdat, P., Boireau, A., Stutzmann, J. M., and Gross, C. (1995). Riluzole prevents MPTP-induced Parkinsonism in the rhesus monkey: a pilot study. Eur. J. Pharmacol. 284, 299–307.
Contreras, C. M., Mexicano, G., and Guzman-Flores, C. A. (1981). Stereotaxic brain atlas of the green monkey (Cercopithecus aethiops aethi-ops). Bol. Estud. Med. Biol. 31, 383–428.
DeLiang, W. (1995). Emergent synchrony in locally coupled neural oscillators. IEEE Trans. Neural Netw. 6, 941–948.
DeLong, M. R. (1971). Activity of pal-lidal neurons during movement. J. Neurophysiol. 34, 414–427.
Ecker, A. S., Berens, P., Keliris, G. A., Bethge, M., Logothetis, N. K., and Tolias, A. S. (2010). Decorrelated neu-ronal firing in cortical microcircuits. Science 327, 584–587.
Elias, S., Joshua, M., Goldberg, J. A., Heimer, G., Arkadir, D., Morris, G., and Bergman, H. (2007). Statistical properties of pauses of the high-frequency discharge neurons in the
Mitelman et al. Parkinsonian pallidum is homogeneously synchronized
Frontiers in Systems Neuroscience www.frontiersin.org June 2011 | Volume 5 | Article 54 | 11
0

appendIxthe MatheMatIcs of artIfIcIal shadowIngExtracellular recording of spiking activity is based on detection of instantaneous events (spikes) in the high pass filtered analog signal and sorting them according to their pattern. This process is known as “spike sorting.” The underlying assumption is that different cells, recorded by the same electrode (neighboring cells), can be detected according to their different shape. However, spikes occurring within a few milliseconds cannot be detected, because of their shape overlap. This phenomenon was termed the “shadowing effect” by Bar-Gad et al. (2001).
The probability to miss a spike within a given spike train, as a function of the spike’s lag from a spike in the neighboring spike train, was termed the “shadowing vector.” Given the actual firing rate (p), the shadowing vector (S
n,m) and the shadowing duration
(α) the observed firing rate (p*), can be calculated as follows (Bar-Gad et al., 2001):
p p p Sm m n n m*
, ( )= −
=−
∑1 ττ α
α
(1)
Furthermore, given the neurons’ actual firing rate (Pn, P
m),
their autocorrelation (a), and the shadowing vector (S) – the cross- correlation function ( ),cn m
∗ of two uncorrelated spike trains recorded by the same electrode can be calculated as follows (Bar-Gad et al., 2001, Eq. 5):
The shadowing vector S(t) can be calculated from Eq. 4. Since S(t) is a probability vector, its values are limited to the interval [0,1], hence we get a single solution:
S tp c t
p pm n m
n m
( )( ),= −1
∗ ∗
(5)
This allows an approximated solution, if p pm m∗ ≈ and p pn n
∗ ≈ as follows:
S tc t
pn m
n
( )( ),
*≈ −1
∗
(6)
Furthermore, we have a satisfied set of second degree equa-tions. We have the following empirical data: p pn m
* *, , and c tn m,* ( ) for
−α ≤ t ≤ α, whereas we are interested in S(t) for −α ≤ t ≤ α, as well as p
n and p
m. This yields 2α + 1 equations (Eq. 5) for −α ≤ t ≤ α,
and two more equations (Eq. 1) for pn and p
m – altogether 2α + 3
equations for 2α + 3 variables.
A set of equations of the second degree does not necessarily have an algebraic solution. Therefore, we used two numerical approaches. First, we used an iterative solution, which initiated in the approximated solution (Eq. 6), and iteratively used Eq. 5 to improve the solution. Second, we used the Matlab fsolve function for the solution of the equation. Both methods yielded similar solutions.
This solution assumes independence between the two spike trains. However, this term might be violated in our data. Therefore, we verified this method by estimating a shadowing vector from an artificially shadowed cross-correlogram. Different shadowing vec-tors were applied on all 349 pairs recorded by different electrodes (i.e., not originally distorted by the shadowing effect) from monkey Cu. Then we used the above method to estimate the shadowing vector, and calculated the error between known and estimated shadowing vectors. The absolute error per index in the vector was 0.017 ± 0.036 (average ± SD, values representing the probability of missing a spike, hence they vary between 0 and 1). Thus, the estima-tion of the shadowing effects is satisfactory for our purposes despite the possible violation of the assumption of independent spike train.
c tp
p S
S a tn mn
n n m
n m n,*
,
,( )
( )
( ) ( )=−
− +
−
= −
= −∑∑
1
1 1
ττ τ
τ α
ατ α
α
SS a tm n m, ( ) ( )τ ττ α
α
−
= −
∑ (2)
We assume that the refractory period of the neurons is longer than the shadowing period, similar to Bar-Gad et al. (2003a). This means that the autocorrelation equals 1 at t = 0, and 0 for the rest of the shadowing period. This assumption further simplifies the cross-correlation estimation to:
c tp
S t S tn mn
p
p
n m m nm
m
, , ,( ) ( ) ( )*
∗ = − −( ) −( )1 1 (3)
We further assume that the shadowing period is symmetric, i.e., that S
m,n(t) = S
n,m(−t) ≡ S(t), and then get Eq. (4):
c tp p
pS tn m
n m
m
, *( ) ( )∗ = −( )1
2
(4)
Mitelman et al. Parkinsonian pallidum is homogeneously synchronized
Frontiers in Systems Neuroscience www.frontiersin.org June 2011 | Volume 5 | Article 54 | 12


