NEGATIVE DIFFERENTIAL CONDUCTIVITY IN E-BEAM SUSTAINED ...
50
NEGATIVE DIFFERENTIAL CONDUCTIVITY IN E-BEAM SUSTAINED DIFFUSE DISCHARGES FOR SWITCHING APPLICATIONS by BRYAN EDWARD STRICKLAND, B.S. in E.E. A THESIS IN ELECTRICAL ENGINEERING Submitted to the Graduate Faculty of Texas Tech University in Partial Fulfillment of the Requirements for the Degree of MASTER OF SCIENCE IN ELECTRICAL ENGINEERING Approyed May, 1986
Transcript of NEGATIVE DIFFERENTIAL CONDUCTIVITY IN E-BEAM SUSTAINED ...

NEGATIVE DIFFERENTIAL CONDUCTIVITY IN E-BEAM SUSTAINED
DIFFUSE DISCHARGES FOR SWITCHING APPLICATIONS
by
BRYAN EDWARD STRICKLAND, B.S. in E.E.
A THESIS
IN
ELECTRICAL ENGINEERING
Submitted to the Graduate Faculty of Texas Tech University in Partial Fulfillment of the Requirements for
the Degree of
MASTER OF SCIENCE
IN
ELECTRICAL ENGINEERING
Approyed
May, 1986

ACKNOWLEDGMENTS
I would like to express my sincere appreciation to Dr.
Karl Schoenbach for serving as advisor of my graduate work
and co-chairman of my committee. His advice, guidance, and
technical assistance throughout the course of these exper
iments and during the preparation of this manuscript has
been invaluable. I would also like to thank Dr. Gerhard
Schaefer for serving as co-chairman of my committee and
providing invaluable support and guidance for the prepara
tion of this manuscript. I am also deeply indebted to the
other members of my committee: Dr. Osamu Ishihara who was
instrumental in the development of a computer code and Dr.
Clyde Martin.
I would also like to express my gratitude to those I
have worked with in the laboratory on the project. I en
joyed working with and have been greatly assisted by Chuck
Harjes, Doug Skaggs, Kim Zinsmeyer, Ken Rathbun, Rick
Korzekwa and other students in the Plasma and Switching
Laboratory at Texas Tech.
I must also extend a special thanks to Paul Vanderford
who has been very helpful in the preparation of this manu
script. Finally, I owe my deepest appreciation to my par
ents, who have stood by me with unwaving support and en
couragement.
11

TABLE OF CONTENTS
ACKNOWLEDGMENTS ii
ABSTRACT v
LIST OF FIGURES vi
I. INTRODUCTION 1
II. BACKGROUND AND THEORY 5
2.1 Attachment Instability 6
2.2 One-Dimensional Model of the Discharge 9
2.3 Formation of Domains in E-beam Controlled Diffuse Discharges . . 11
III. ELECTRICAL MEASUREMENTS 15
3.1 Experimental Set-up 15
3.1.1 E-beam System 15
3.1.2 Switch System 17
3.1.3 Diagnostics 18
3.2 Experimental Results 18
3.2.1 C2F6:Ar Results 19
3.2.2 N2:Ar Results 22
IV. OPTICAL MEASUREMENTS 24
4.1 Optical Set-up 24
4.2 C2F6:Ar Results 25
4.2.1 Region of Positive Differential Conductivity . 25
4.2.2 Region of Negative Differential Conductivity . 28
111

4.2.3 Region of Approximately Zero Differential Conductivity . 28
4.2.4 Effect of Applied Voltage
on Position of Striation . . 32
4.3 N2:Ar Results 35
V. CONCLUSIONS 37
LIST OF REFERENCES 39
IV

ABSTRACT
In e-beam sustained diffuse discharges in gas mixtures
which contain small additives of electronegative gases, the
discharge characteristic (current density versus reduced
field strength) may exhibit negative differential conduc
tivity (NDC) depending on the source function and the con
centration of attacher gas. In discharges exhibiting nega
tive differential conductivity, electron depleted domains
of high electric field intensity are formed in the dis
charge.
The results of electrical and optical measurements
performed on an e-beam sustained diffuse discharge in a gas
mixture of 2% C2F6 in 1 atm Ar are presented and compared
with theoretical predictions. The steady state current
density (J) versus reduced field strength (E/N) exhibits a
strong negative differential conductivity in an E/N range
of 2.5 Td < E/N < 5 Td. Time resolved photographs taken in
this E/N range show distinct luminous layers perpendicular
to the discharge axis.

LIST OF FIGURES
1. Electron mobility and attachment rate as a function of E/N for gases in diffuse discharge opening switches 3
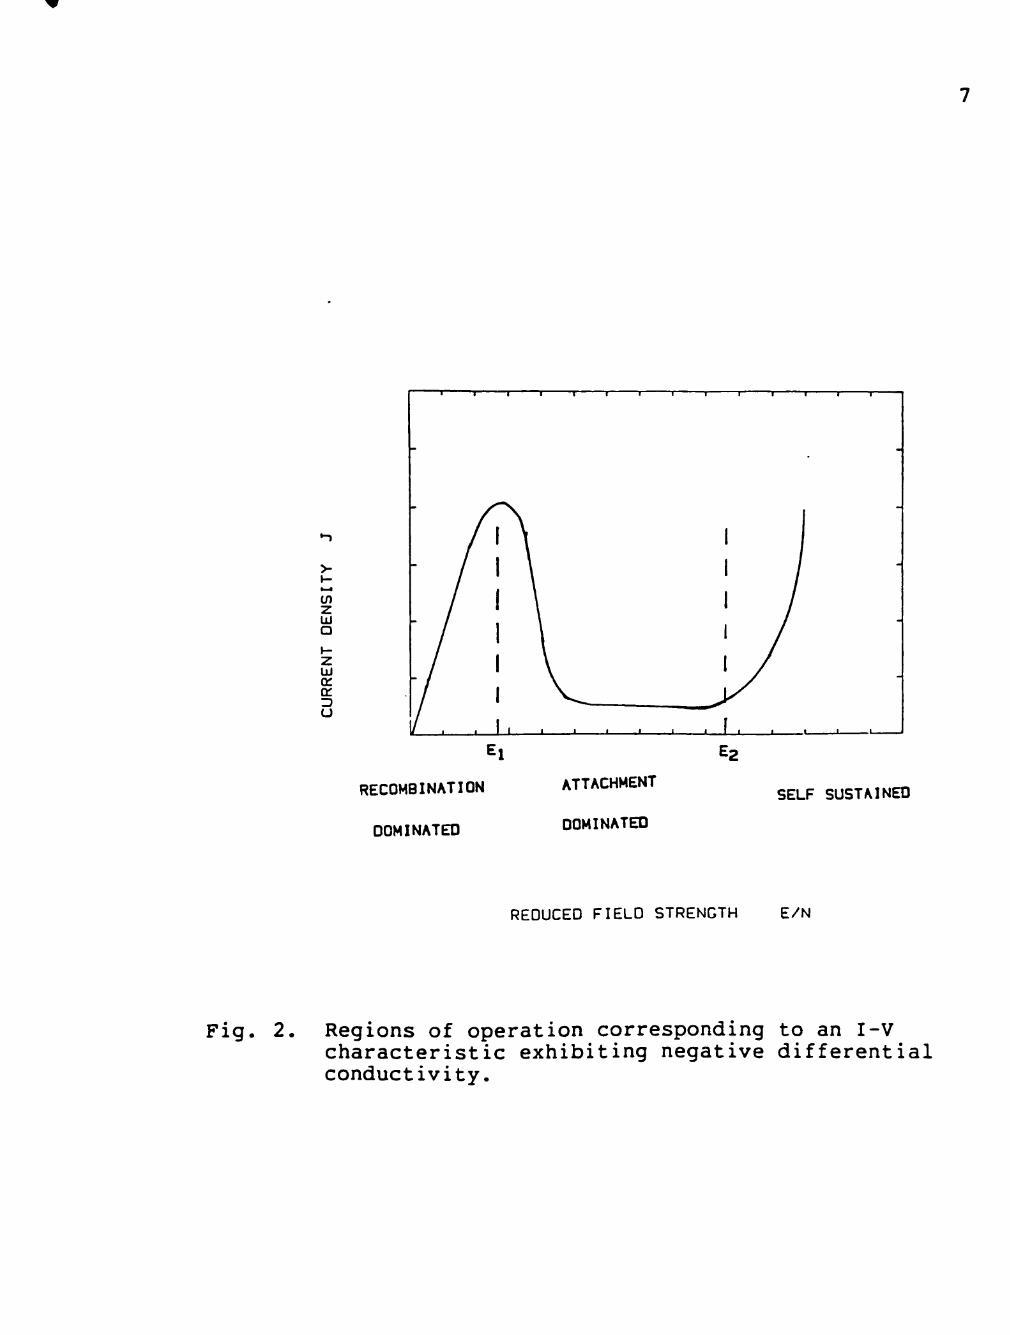
2. Regions of operation corresponding to an I-V characteristic exhibiting negative differential conductivity 7
3. Distribution of E/N (curves a - e) and n+ (a) in • cm^ discharge gap with E/N = 4.8 • lO"-'- V
(Problem 1, VQ = 6 • 10^ cm/sec); current density at times: a) 0; b) 2 ysec; c) 4[1) (E/N) • 10" ^ = 3.3 V • cm2; 2) 3.9; 3) 4.8]; d) 5; e) 6 [12] . 13
4. Cross sectional view of e-beam and switch systems 16
5. Steady state current density, J, versus E/N for a discharge in 2% C2F5:Ar at 1 atm 20
6. Discharge resistivity, p, versus E/N for a discharge in 2% C2F6:Ar at 1 atm 21
7. Steady state current density, J, versus E/N for a discharge in 5% N2:Ar at 1 atm 23
8. Experimental set-up for optical measurements of the discharge 26
9. Photograph of discharge at 2 Td in the positive differential conductivity region . . . 27
10. Photographs taken at 100 ns intervals in a discharge at 5 Td in the negative differential conductivity region 29
11. Photodensitometer curves of the discharge along the discharge axis at 5 Td 30
12. Photographs taken at 100 ns intervals in a discharge at 9 Td in the zero differential conductivity region 31
13. Photodensitometer curves of the discharge along the discharge axis at 9 Td 33
VI

14. Position of striation as a function of reduced field strength, E/N 34
15. The effect of reversing the polarity on the position of the striation 36
vii

CHAPTER I
INTRODUCTION
In recent years interest has grown in the use of in
ductive energy storage devices in pulsed power systems be
cause with inductive devices it is possible to achieve sig
nificantly higher energy densities than with capacitors.
In order to use an inductive energy storage device in a
pulsed power system, an opening switch is required to
switch the energy from the inductor to the load. In a re
petitive pulsed power system the opening switch should op
erate in a controlled mode, have a high current carrying
ability (kA), have a high voltage stand off capability
(kV), have low losses in the conduction phase, and endure a
long lifetime. Electron-beam (e-beam) controlled diffuse
discharges show promise for use as repetitively operated
switches in inductive energy storage systems.
In order for a diffuse discharge switch to have the
previously mentioned properties, it is necessary to prop
erly engineer the gas mixture used in the switch. To ob
tain low losses in the conduction phase, it is necessary
for the gas to have a high electron mobility and a low
electron loss rate (recombination and attachment) at low
reduced field strength (E/N) which corresponds to the con
duction phase. Furthermore, to improve the opening and

stand off capabilities of the switch, it is desirable to
have a gas that has a low electron mobility and a high
electron loss rate at higher values of E/N that correspond
to the opening and hold off phases. For the switch to
achieve fast opening times, electronegative gases or at-
tachers must be in the switch gas mixture. To satisfy the
conditions listed above, it has been suggested to use an
attacher that has a low attachment rate at low E/N and a
high attachment rate at high E/N [1,2,3]. The desired
electron mobility and attachment rate relationship as a
function of E/N is illustrated in Fig. 1.
Hunter [4], Kovalchuk, et al. [5], Fernsler, et
al. [6], Hallada, et al. [7], Harjes, et al. [8], and
Schoenbach, et al. [9] have investigated e-beam controlled
diffuse discharge switches in various modes of operation.
An e-beam controlled diffuse discharge switch facility has
been constructed at Texas Tech University to investigate
promising switch gas combinations in a repetitive mode of
operation [8,9].
Christophourou, et al. [10] has investigated the prop
erties of some promising gases for use in diffuse discharge
opening switches. Fluorocarbons in combinations of Ar or
CH4 buffer gas exhibit an electron mobility and attachment
rate similar to the idealized relationship shown in Fig. 1
[10].
ATTACHMENT RATE
(E/N) (E/N)
Fig. 1. Electron mobility and attachment rate as a function of E/N for gases in diffuse discharge opening switches.
The use of attachers in e-beam controlled diffuse dis
charge switches and their subsequent effect on the current-
voltage (I-V) characteristics of the switch has been
theoretically investigated by Schaefer, et al. [3]. The
results show that a switch that utilizes attachers with a
strongly increasing attachment rate as a function of E/N
will have an I-V characteristic which exhibits negative
differential conductivity (NDC) depending on the magnitude
and energy of the ionization source and the concentration
of the attacher.

CHAPTER II
BACKGROUND AND THEORY
In an externally sustained diffuse discharge for
switching applications, the primary processes in the dis
charge which must be considered in order to describe the
electrical behavior of the discharge are ionization by the
external source, given by the source function, S; the ioni
zation due to the applied electric field (E), described by
the ionization rate coefficient, ki(E); the electron at
tachment depicted by the attachment rate coefficient,
ka(E); and the recombination of electrons and ions,
described by the electron-ion recombination rate coeffic
ient, 3ei« ^or the switch gas combination of C2F5:Ar, the
recombination rate and the source function are independent
of the applied electric field while the attachment rate,
the ionization rate, and the electron drift velocity, v^,
are strongly dependent on the applied field or reduced
field strength.
As predicted by Schaefer et al. [3], the discharge is
recombination dominated at low E/N where the attachment
rate coefficient, k^iE), is very small. With increasing
E/N, ka(E) increases and the discharge becomes attachment
dominated. As E/N increases further, ionization through
discharge electrons becomes significant and finally the

discharge becomes self sustained. It is within the attach
ment dominated stage of operation that the attachment rate,
ka(E), is a strongly increasing function of E/N and, conse
quently, the discharge may exhibit NDC [3]. The previously
mentioned stages of operation are illustrated in a typical
I-V characteristic exhibiting NDC, as shown in Fig. 2.
2.1 Attachment Instability
Electron-neutral dissociative attachment generally has
a threshold electron energy corresponding to the dissocia
tive energy of the unstable intermediate negative ion [11].
Therefore, over a certain E/N range in which the mean elec
tron energy approaches the negative ion dissociation en
ergy, the dissociative attachment rate is a strongly in
creasing function of E/N. Under steady state conditions, a
small increase in the local electric field results in an
increase in the attachment rate which causes a reduction of
the electron density and a further increase in the electric
field. Therefore, an instability occurs [11].
Ultimately, electron depleted domains of high electric
field are formed in the discharge. These domains can be
static or moving across the discharge, which results in
oscillations in the discharge current and voltage
[12,13,14,15]. A further consequence of attachment insta
bility in a diffuse discharge is that the high local
z UJ a
z u oc tr =3 U
RECOMBINATION
DOMINATED
ATTACHMENT
DOMINATED
SELF SUSTAINED
REDUCED FIELD STRENGTH E/N
Fig. 2. Regions of operation corresponding to an I-V characteristic exhibiting negative differential conductivity.
8
fields produced by the electron attachment loss will
greatly increase the local heating and, therefore, the ion
ization rate, until streamers are initiated which grow to
ward both electrodes resulting in a glow-to-arc transition.
As previously mentioned, a diffuse discharge which
contains attachers may exhibit a NDC characteristic. Nega
tive differential conductivity is also a characteristic of
semiconductors exhibiting the Gunn Effect. In each case,
the reason for the NDC characteristic is a decrease in
electron drift velocity due to an increase in the effective
mass of an electron with increasing energy. In semiconduc
tors the increase in effective mass is caused by the scat
tering of the electrons into the satellite or higher val
leys [16,17], while in gas discharges the increase in
effective mass is due to the attachment of the electrons by
the heavier electronegative gas molecules. In bulk semi
conductors that exhibit a NDC characteristic, the homogene
ous bulk material can become electrically heterogeneous
with a high field dipole domain forming and propagating
through the semiconductor under d.c. bias conditions
[16,17]. Therefore, it is of interest to determine if the
domains present in a diffuse discharge [12,13,14,15] which
exhibits NDC have similar properties as the domains in
semiconductors.
2.2 One-Dimensional Model of the Discharge
The spatial dependence of the fields and particle den
sities in a diffuse discharge can be described by the space
dependent, one dimensional continuity equations for elec
trons (1), positive ions (2), and negative ions (3):
3n e + -— Me' e = S + kiN^ne
3t 3x
- kaNane - 6eiJ en+ (^
8n+ a it i^ \i+^+^ = S + kiNane
- Biin+n_ - Beirier + ^2)
9n_ 3 + —- u_n_E = kaNanp
3t 3x a a e
- Biin+n_ (3)
and Poisson's equation
3E —e — = — (n+ - n_ - ne) , E > 0 , (4) 3x e
0
where UQ, n_, and n+ are the densities of electrons, nega
tive ions, and positive ions; Ue^ ^-' ^^^ ^+ ^^^ ^^® corre
sponding mobilities; the source function, S, is the rate at
which electrons are produced by the external source; Bei
and 3ii are the electron-ion and ion-ion recombination rate
coefficients, respectively; Ng is the number density of

10
attacher molecules; and e is the charge of an electron. We
must adjoint to the system of equations (l)-(4) the bound
ary conditions at the electrode surfaces and the equations
governing the external circuit. With the cathode at x = 0
and the anode at x = L, the boundary conditions are
Uene(0,t) = YM+n+(0,t) , (5)
n _ ( 0 , t ) = 0 , (6)
and
n+(L,t) = 0 , (7)
where y is the secondary-emission coefficient at the cath
ode which relates the emission of electrons from the cath
ode due to bombardment of the cathode by positive ions.
The secondary-emission coefficient, y is defined by the
ratio of electron current at the cathode to positive ion
current at the cathode [18],
le Y = — . (8)
••• +
The boundary condition in equation (5) can be obtained from
the definition of the secondary-emission coefficient and
consideration of the electron and positive ion currents in
a high pressure (dense) plasma. Equation (6) says that
there are no negative ions at the cathode for any time, t.
This condition can be physically visualized since there are

11
no mechanisms for creating negative ions at the cathode.
Furthermore, any negative ions which are created in the
discharge region will move toward the anode due to the
electric field. Similar reasoning for positive ions re
sults in equation (7). The equations governing the ex
ternal circuit are
L Q
j(t) = - J iUe^e •*• M+n+ + p_n-)Edx ^ 0 (9)
and
L J* Edx = UQ = constant , (10) 0
where UQ is the supply voltage and L is the interelectrode
gap length.
2.3 Formation of Domains in E-beam Controlled Diffuse Discharges
In order to investigate the formation of domains in a
diffuse discharge of interest for pumping CO2 lasers,
Barkalov and Gladush [12] used the mathematical model pre
viously discussed to describe a discharge containing a mix
ture of N2 + O2 which exhibited NDC. When a voltage UQ,
corresponding to the electric field E in the region
Ei< E <E2 of Fig. 2, is applied to the discharge, a domain
is formed at the cathode and moves with constant velocity.

12
amplitude, and shape along the interelectrode gap, as shown
in Fig. 3. The sloping line of Fig. 3(a-c) indicates that
the domain moves at a constant velocity, VQ = 6 x 10^
cm/sec. Upon reaching the anode, the domain merges with
the anode. The voltage released by the merging process is
redistributed between a new domain growing at the cathode
and the discharge column as shown in Fig. 3d. This merging
process causes the current in the external circuit to in
crease until the new domain is completely formed. The new
domain picks off voltage from the discharge column which
causes the current to fall to its minimum value. The cur
rent remains constant while the domain is moving along the
interelectrode gap.
These calculations [12] revealed that as the applied
voltage is further increased there is a proportional in
crease in the width of the domain, as shown in Fig. 3b.
Furthermore, the domain velocity is independent of applied
voltage. Since the domain width increases with increasing
voltage, the period of the current oscillation becomes
smaller with increasing voltage [12].
A computer code was developed that reproduced the re
sults of Barkalov and Gladush [12] by implementing the im
plicit finite difference methods to solve numerically the
system of equations (l)-(4). This computer code is cur
rently being modified in order to solve the system of
equations (l)-(4) for a discharge in a gas mixture of 2%

13
(E/N) 10? V-cnr
/Z
n^'JO , cm
Fig. 3. Distribution of E/N (curves a - e) and n+ (a) in discharge gap with E/N = 4.8 • 10 -^ V • cm^ (Problem 1, VQ = 6 • 10^ cm/sec); current density at times: a) 0; b) 2 usee; c) 4[1) (E/N) • 10^^ = 3 3 V • cm^; 2) 3.9; 3) 4.8]; d) 5; e) 6 [12].

14
C2F6 in Ar at a total pressure of 1 atm. The basic gas
data for this gas mixture were obtained from Christophourou
et al. [10]. The results obtained from this calculation at
this time do not agree with the experimental observations.
This discrepancy may be due to the uncertainty of parame
ters such as the positive and negative ion mobility or the
electron-ion and ion-ion recombination rate for gas mix
tures of C2F5:Ar.

CHAPTER III
ELECTRICAL MEASUREMENTS
In order to study the electron-beam controlled conduc
tivity in a high pressure diffuse discharge containing
small amounts of electronegative gases, a repetitive
electron-beam controlled diffuse discharge switch exper
iment has been constructed and used to investigate promis
ing gases for opening switches [8].
3.1 Experimental Set-up
The e-beam system consists of an e-beam gun inside of
a Pyrex chamber that is located between the two parallel
plates of the e-beam pulser's transmission line. The
stainless steel switch chamber is located above the e-beam
system. Figure 4 is a cross-sectional view of the e-beam
and switch systems [8].
3.1.1 E-beam System
The e-beam gun is a tetrode that consists of a dispen
ser cathode, a control grid, a screen grid, and the anode.
The electron source or cathode is a Ba02 dispenser cathode
capable of emitting 4 A/cm^ uniformly over the 100 cm^
area of the cathode at a temperature of SSO^K. The e-beam
15

16
CURRENT SENSOR
DISCHARGE VOLUME
PFN CONNECTION
E-BEAM PULSER
/f,//,/n
CURRENT SENSOR
VACUUM PUMP
Fig. 4- Cross sectional view of e-beam and switch systems.

17
gun is operated in a vacuum of 10"^ torr. The temporal
structure of the e-beam is controlled by a control grid
that is driven by a transmission line pulser capable of
generating a pulse train with a variable pulse duration and
separation. In addition, a d.c. biased screen grid shields
the control grid from the effects of induced voltage by the
anode or e-beam pulser.
The e-beam pulser consists of a two-stage Marx genera
tor that is capable of delivering a maximum output voltage
of 250 kV with a risetime of 5 ns and a decay time of
2.5 ijs into a 300-ohm load.
3.1.2 Switch System
The diffuse discharge is generated in a stainless
steel chamber that has been tested up to 4 atmospheres. A
25 um titanium foil serves as the interface between the
high pressure switch chamber and the high vacuum, e-beam
chamber. A 12 urn aluminum foil functions as the lower
electrode while the upper electrode is made of stainless
steel. After traveling through each of the foils, the
e-beam ionizes the gas between the switch electrodes and
creates a plasma. The plasma continues to conduct until
the ionizing e-beam is turned off, which allows recombina
tion and attachment processes to remove the remaining free
electrons, thus creating an insulating medium or opening
the switch. A 2-ohm pulse forming network with a maximum

18
output voltage of 60 kV supplies the current through the
discharge plasma.
3.1.3 Diagnostics
Transmission line current transformers [19,20] and
fast resistive current probes were used to measure the
e-beam current and switch current, respectively. Fast re
sistive voltage dividers were utilized as voltage probes.
All current and voltage waveforms were recorded with Tek
tronix 7834 storage oscilloscopes. Since the anode of the
e-beam gun is at the same potential as both the lower elec
trode and the switch chamber, ail diagnostic probes for the
switch system were referenced to the high voltage of the
e-beam pulser. Consequently, the storage oscilloscopes
that recorded the data for the switch system were placed in
a floating screen box.
3.2 Experimental Results
While operating the e-beam gun as a cold cathode di
ode, which relies only on field emission for electron pro
duction, electrical investigations were performed on a high
pressure diffuse discharge in a gas mixture of 2% C2F6 in 1
atm Ar. The impedance of the switch system was held con
stant at 4 ohms. In the cold cathode diode mode the source
term, which is the number of electrons produced per
19
cm- • second, was in the range of 2-3 x lO' cm' s"-'-. The
electrode gap spacing was maintained at a constant 3.9 cm
while the applied voltage was varied from 0 to 15 kV.
3.2.1 C2F6:Ar Results
The steady state current density (J) versus the re
duced field strength characteristic for a gas mixture of 2%
C2F6 in 1 atm Ar is shown in Fig. 5. This characteristic
contains a region with a pronounced negative differential
conductivity in the reduced field strength range of 2.5 Td
< E/N < 5 Td. This range of reduced J corresponds to the
range of E/N where the attachment rate for the gas mixture
of 2% C2F6:Ar is strongly increasing.
In previous experiments performed under the same con
ditions, using various mixtures of CO2, SO2, or N2O in 1
atm N2, the steady state J versus reduced E/N character
istic did not yield a region of NDC [21]. In order to ob
tain a high pressure diffuse discharge whose steady state J
versus E/N characteristic exhibits a strong NDC character
istic, it is necessary to use a gas mixture with an attach
ment rate that increases strongly with E/N, such as C2F6:Ar
and C3F6:Ar mixtures [22].
The experimentally obtained resistivity (p) versus E/N
characteristic for this gas mixture is shown in Fig. 6.
This result shows an increase in resistivity by a factor of

20
1 Atm. Argon •*• 2% C2^Q
E U \ <
(A
2 UJ Q
u
3. 0
2.5
2.0 -
1.5
1. 0 -
0. 5
0. G
• I I I I 1 1 r T 1 1 r
' • ' ' ' • L.
10 15
REDUCED FIELD STRENGTH E/N / C Td 3
Fig- 5. Steady state current density, J, versus E/N for a discharge in 2% C2F6:Ar at 1 atm.

21
10'
E O I E
r. 10^
a Q:
1—4
—
»—t
ULI
T 1 r
•ooo-
10'
1 Atm. A r g o n + 2% ^ 2 ^ 5
T 1 1 1 1 1 1 1 1 r
J I L.
10 15
REDUCED FIELD STRENGTH E/N/ C Td ]
Fig. 6. Discharge resistivity, p, versus E/N for a discharge in 2% C2F6:Ar at 1 atm.

22
50 in a reduced field strength range of 2 Td < E/N < 12 Td.
The change in resistivity for this gas mixture is an order
of magnitude greater than that found for a gas mixture of
0.7% N2O in 1 atm N2 [23]. The opening times for the gas
mixture of 2% C2F6:Ar at 1 atm were below 100 ns.
The mixture seems to be relatively stable since repro
ducible results were obtained for 200 shots without chang
ing the gas; therefore, this mixture may be a reasonable
switch gas candidate for use in a repetitively operated,
closed system.
3.2.2 N2:Ar Results
Other work done by Long, et al. [24], Haddad [25], and
Petrovic' [26], suggest that it may be possible to obtain a
NDC characteristic by using a mixture of a molecular gas,
such as N2 in a buffer gas such as Ar, which exhibits a
Ramsauer minimum in the momentum transfer cross-section.
Therefore, investigations were performed in mixtures of 2%
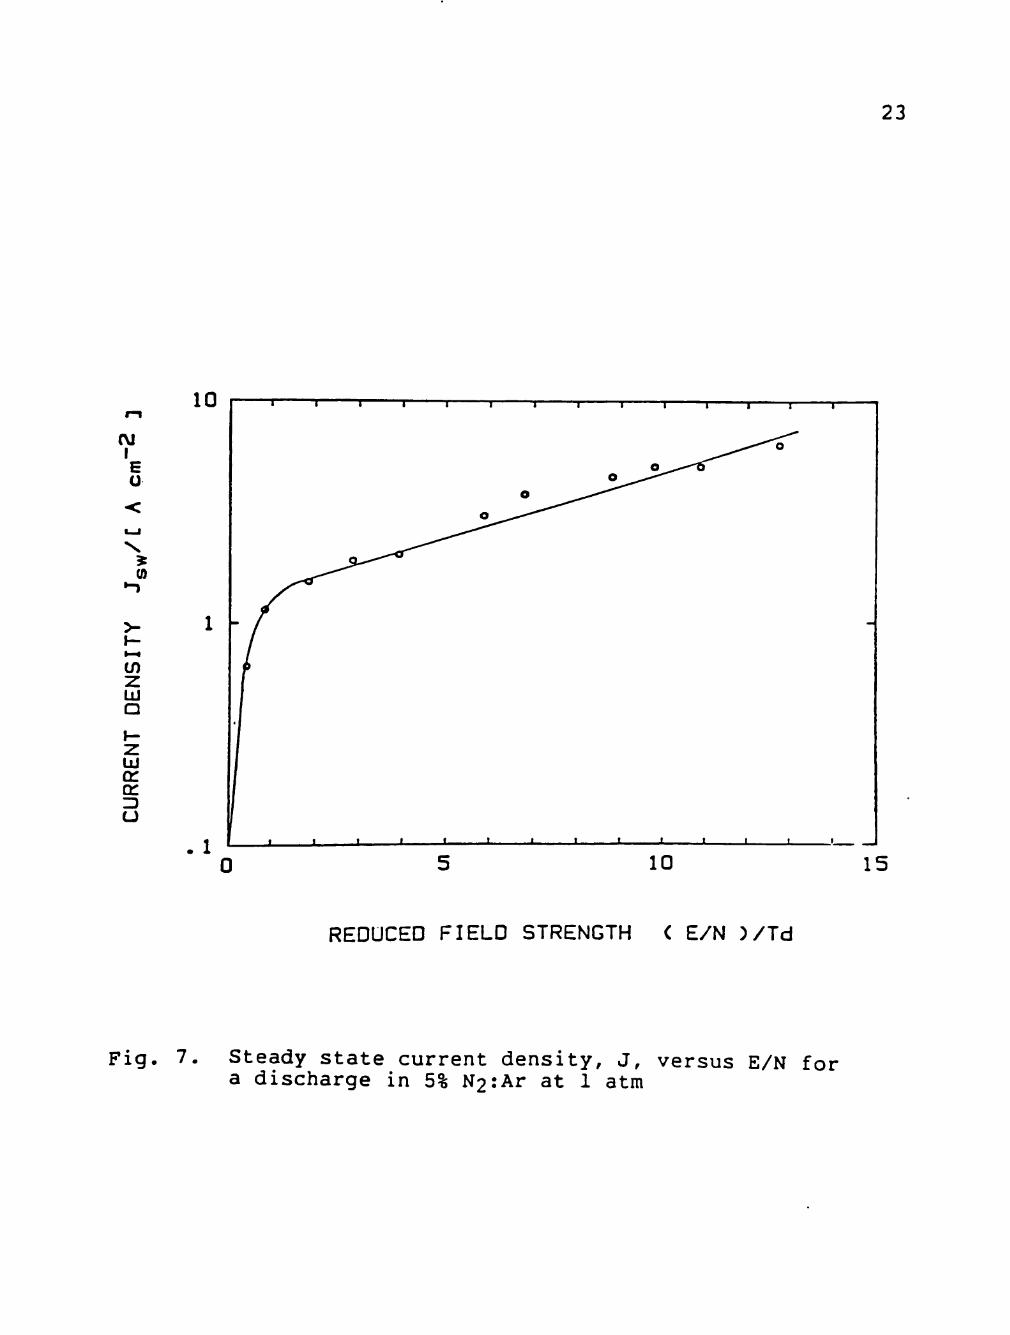
N2 in 1 atm Ar and 5% N2 in 1 atm Ar. The current density
(J) versus E/N characteristic for a gas mixture of 5% N2:Ar
is shown in Fig. 7. It shows that under our operating con
ditions this discharge did not exhibit a NDC characteris
tic. A similar result was obtained for the gas mixture of
2% N2 in 1 atm Ar.
23
I E U
(0
tn LU
a z: UJ on cr ID U
IQ T 1 1 I 1 1 1 1 1 1 T I I
J I i I I I i I I I t i _ _
5 10 15
REDUCED FIELD STRENGTH < E/N )/Id
Fig. 7. Steady state current density, J, versus E/N for a discharge in 5% N2:Ar at 1 atm

CHAPTER IV
OPTICAL MEASUREMENTS
The formation of high field domains can be expected in
e-beam sustained diffuse discharges that exhibit a NDC
characteristic [27,28,12]. In regions of high field inten
sity, the number of excited atoms or molecules is in
creased, causing an increased level of emission processes.
In order to investigate the possible formation of such do
mains in our discharge, time resolved photographs were
taken at various times during the discharge while using
various bias conditions.
4.1 Optical Set-up
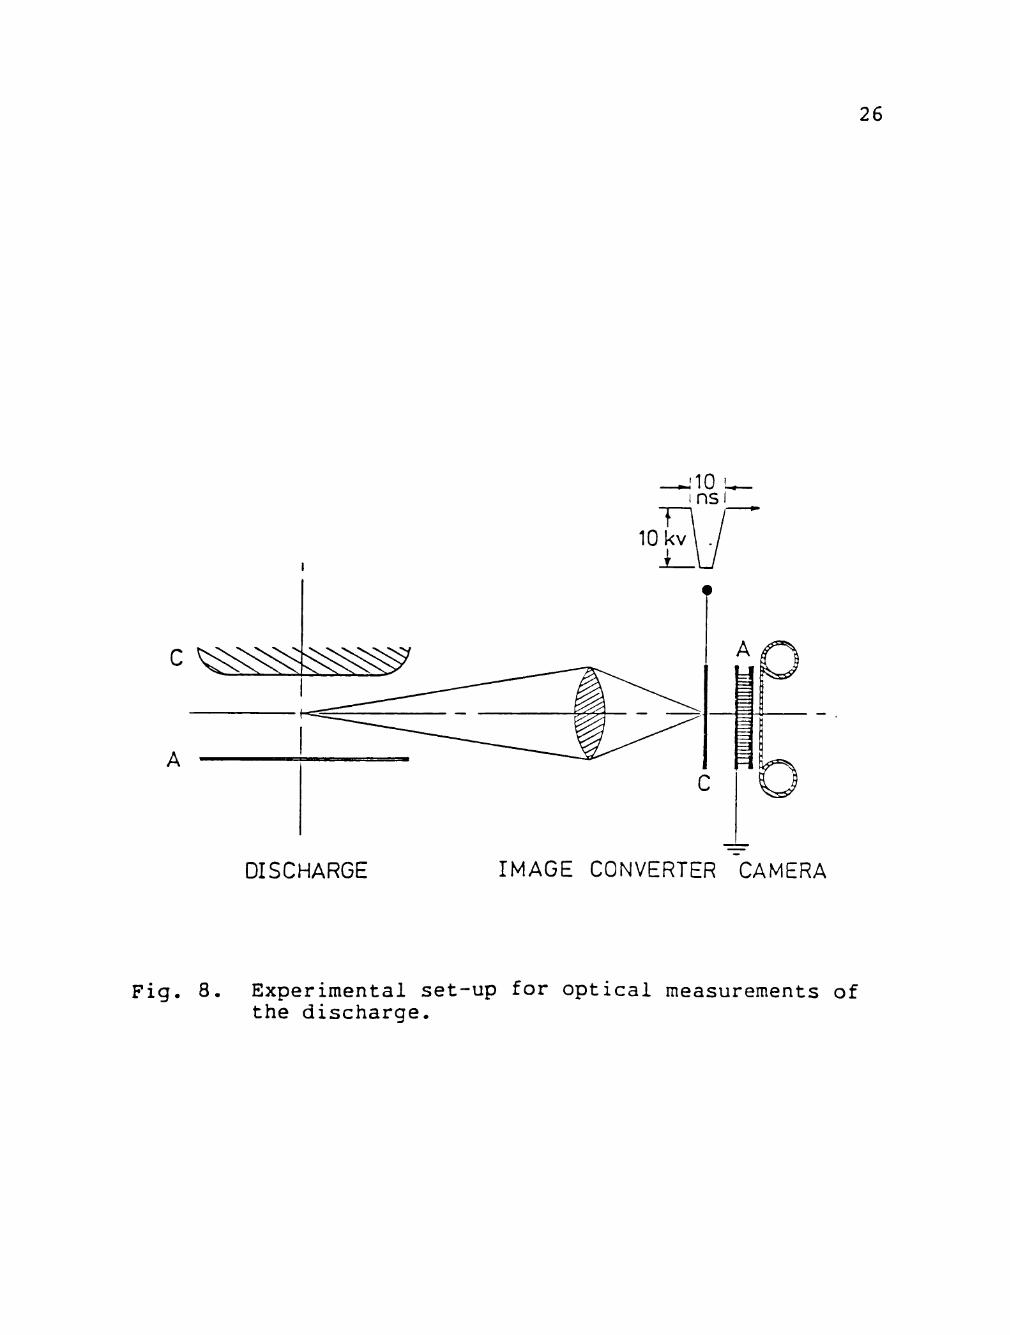
Time resolved photographs of the discharge were taken
using a high speed, high resolution, image converter camera
that consisted of a proximity focusing diode manufactured
by ITT with a Tektronix roll film back mounted on the rear
of the diode [29]. A krytron-switched Blumlein pulser was
used to deliver a 10 kV, 10 ns rectangular pulse to the di
ode; consequently, the camera has a shutter speed of 10 ns.
The diode has a high resolution of 45 Ip/mm.
The experimental arrangement for the optical investi
gations performed on the discharge is schematically
24

25
illustrated in Fig. 8. Optical investigations were per
formed on discharges containing gas mixtures of 2% C2F5:Ar
and 5% N2:Ar.
4.2 C?Ffi;Ar Results
The diffuse discharge containing 2% C2F5:Ar was inves
tigated in three operation regions: the region of positive
differential conductivity (PDC), corresponding to the E/N
range 0 < E/N < 2 Td as shown in Fig. 5; the region of neg
ative differential conductivity (NDC), corresponding to the
E/N range 2.5 < E/N < 5 Td; and the region of approximately
zero differential conductivity (ZDC), corresponding to the
E/N range 5 < E/N < 9 Td.
4.2.1 Region of Positive Differential
Conductivity
A time resolved photograph of the discharge biased at
2 Td so that it would operate in the PDC region is shown in
Fig. 9. This photograph illustrates that the discharge is
homogeneous or has no field domains other than the cathode
fall for bias points to the left of the current density
maximum. The discharge is homogeneous throughout the dura
tion of the 500 ns discharge current pulse.
26
ins I
10 kv i_
A
DISCHARGE IMAGE CONVERTER CAMERA
Fig. 8. Experimental set-up for optical measurements of the discharge.

27
Fig. 9. Photograph of discharge at 2 Td in the positive differential conductivity region.

28 4.2.2 Region of Negative Differential
Conductivity
The discharge was biased at 5 Td so that it would op
erate in the region of NDC. Time resolved photographs
taken at 100 ns intervals throughout the duration of the
discharge current are shown in Fig. 10. At any point of
operation in this region, the discharge is not homogeneous.
These photographs show a distinct luminous layer perpendic
ular to the discharge axis.
In order to obtain qualitative information about the
position of these luminous layers or striations as a func
tion of time, photodensitometer plots were made from the
negative of each photograph. The normalized photodensito
meter plots along the discharge axis corresponding to the
photographs in Fig. 10 are shown in Fig. 11.
These curves show that the domain forms at the cathode
and propagates toward the anode with constant velocity and
shape, as predicted by Barkalov and Gladush [12], As shown
by Douglas-Hamilton [11] and Barkalov and Gladush [12], the
domain velocity, VQ - 1.95 x 10^ cm/sec, is approximately
equal to the electron drift velocity.
4.2.3 Region of Approximately Zero Differential Conductivity
Time resolved pictures of the discharge biased at 9 Td
(ZDC region) are shown in Fig. 12. Discharges in this

29
^^^^^^S^^ - i i
~<';-y c -
i i i t i i
E-BEAv
1 a t m At- 2 Z C 2 ^ 5
3 0 0
4 0 0 n s
5 0 0 n s
E / N ° 5 T d 5 c m
T£:-'PORAL DEVELOPMENT OF STRIATIONS I
DIFFERENTIAL CO iDUCTIVITY
THE E/N RANGE WITH NEGATIVE
Fig. 10. Photographs taken at 100 ns intervals in a discharge at 5 Td in the negative differential conductivity region.

30
1.0
CO z: LLI
0.5
0.0 L 0
300 ns
400 ns
— • 5 0 0 ns
ANODE DISTANCE [cm]
CATHODE
Fig. 11. Photodensitometer curves of the discharge along the discharge axis at 5 Td.

31
i •
2 0 0
i k k i k k k
h-BEAM
1 a t m A r - 2 Z ^.^^Q
E/N = 9 Td
lEMPORAL DEVELOPf'iENT OF SIRIATIONS
IN THE E/N RAf GE WITH APFROXIf;AIELY
ZERO DIFFEREKTIAL CONDUCTIVITY
3 0 0
4 0 0 n s
5 0 0 n s
F i g . 12 . Photographs taken at 100 ns intervals in a discharge at 9 Td in the zero differential conductivity region.

32
operating region showed the occurrence of striations simi
lar to those observed in the NDC region. The normalized
photodensitometer plots shown in Fig. 13 correspond to the
photographs in Fig. 12.
These results are similar to the curves obtained for 5
Td and they illustrate that the domain velocity,
v-Q ^ 1.95 X 10° cm/sec, is independent of applied voltage.
These curves also show that with increasing voltage the
domain width increases proportionally as predicted by
Barkalov and Gladush [12]. Similar results were obtained
for any bias point in the attachment dominated stage of
operation.
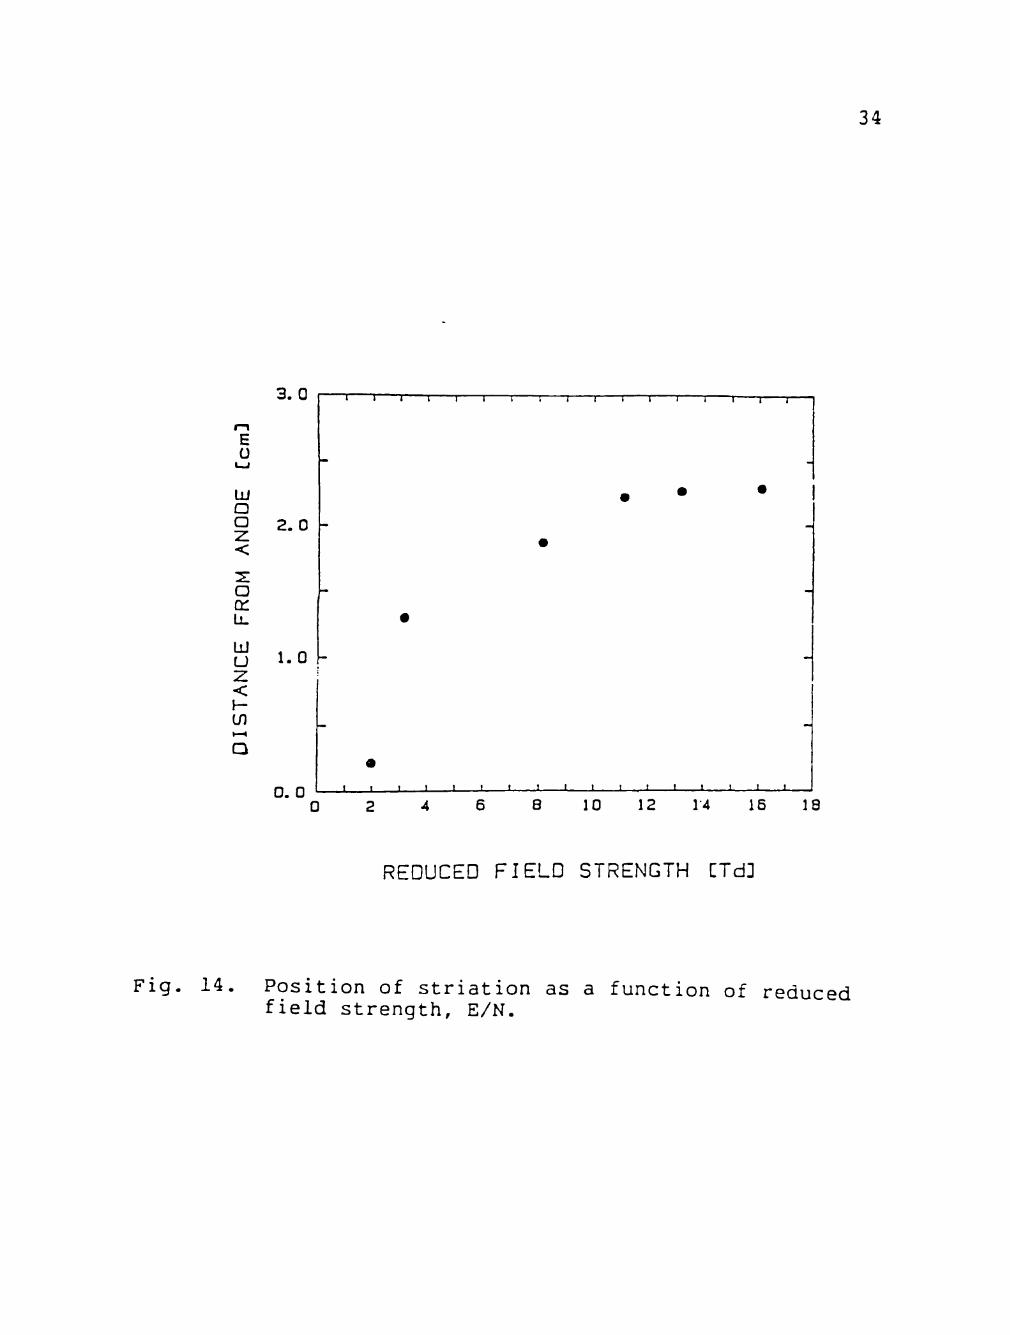
4.2.4 Effect of Applied Voltage on Position of Striation
From the photographs shown previously, it is evident
that the shape and position of the striations vary with ap
plied voltage; therefore, the discharge was photographed at
a constant time of 400 ns in the discharge current in the
reduced field strength range of 2 Td < E/N < 15 Td. The
position of the striation with respect to the anode, as a
function of applied voltage, is shown in Fig. 14.
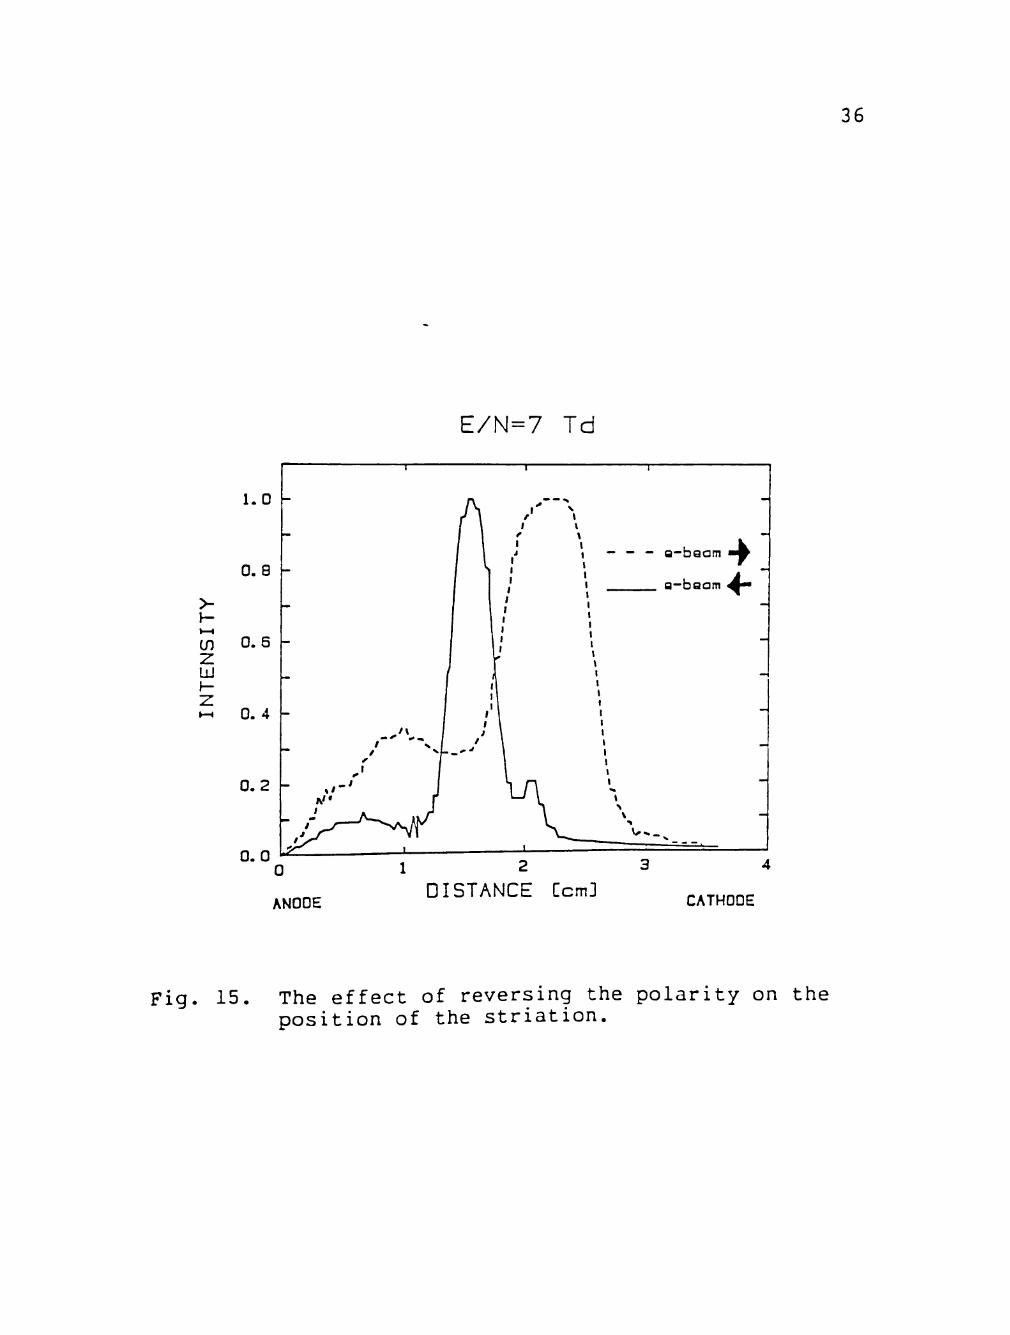
The effect of reversing the polarity of the applied
voltage, with respect to the direction of the e-beam, on
the position of the striation was also investigated op
tically. The normalized photodensitometer plots of two

33
E/N= 3 Td
1.0
0.8
>-
CO
LU I -•-H 0 . 4
0. 5
0. 2
0. 0
t - 200 na
t-300 ns
. . t-400 ns
ANODE
1 2
DISTANCE Ccm] CATHODE
Fig. 13. Photodensitometer curves of the discharge along the discharge axis at 9 Td.
E U
3 . 0 T I I 1 1 1 1 1 1 1 1 1 1 1 1 r
LU a a 2 . 0
a en LL
LU U z <
Lf)
1.0
0. 0 I I ' ' ' ' ' 1 I I I . I I I I I I -
8 10 12 14 16 18
REDUCED FIELD STRENGTH CTd]
34
Fig. 14. Position of striation as a function of reduced field strength, E/N.

35
photographs of the discharge biased in the NDC region with
opposite polarities are shown in Fig. 15. For a fixed
anode and cathode, the effect of reversing the polarity is
obtained by reversing the direction of the e-beam. In Fig.
15, -• corresponds to negative polarity and -^ corresponds to
positive polarity. In the negatively and the positively
biased cases, moving domains form in the discharge when the
magnitude of the applied voltage is such that the discharge
operates in the E/N range where the discharge is attachment
dominated.
4.3 N^iAr Results
Time resolved photographs were taken of a discharge
containing a mixture of 5% N2 in 1 atm Ar. These pictures
revealed a homogeneous discharge like that shown in Fig. 9
for the gas mixture of 2% C2F6 in 1 atm Ar in a region of
PDC. Since the I-V characteristic of this discharge, shown
in Fig. 7, did not exhibit NDC and the photographs of the
discharge revealed a homogeneous discharge, one can con
clude that it is necessary for a discharge to exhibit NDC
in order to observe striations in the discharge.
E/N=7 Td
36
1.0
0 . 8
cn 0.5
z LLI I -Z H-t 0 . 4
0 . 2 -
0 . 0 0
ANODE
- Q-bQam " ^
o-baam ^-"
v-"--
1 2 DISTANCE Ccm]
CATHODE
Fig. 15. The effect of reversing the polarity on the position of the striation.

CHAPTER V
CONCLUSIONS
Electron-beam controlled diffuse discharges used as
fast opening switches were operated in gas mixtures con
taining small additives of attachers. Attachers which have
a strongly increasing attachment rate will cause the dis
charge to exhibit a NDC characteristic depending on the
magnitude of the source function and the concentration of
attacher gas. Gas mixtures which cause a NDC character
istic in an intermediate E/N range are most suitable for
diffuse discharge opening switches which are operated in a
single shot mode where the inductor is recharged after each
shot. For a repetitive mode of operation, the closing pro
cess is obstructed and the maximum possible current can not
be utilized [30].
If an e-beam sustained diffuse discharge which exhib
its NDC is operated in an E/N range where the discharge is
attachment dominated, moving domains of high field inten
sity will be formed in the discharge. The velocity of
these domains is independent of applied voltage while the
amplitude and width are dependent on the applied field.
Oscillations in the current and voltage can be expected in
applications where the discharge conducts longer than the
transit time of a domain moving across the discharge. This
37

38
might open up the possibility of using diffuse discharges
which exhibit NDC as high power oscillators.

LIST OF REFERENCES
1. Schoenbach, K.H., Schaefer, G., Kristiansen, M., Hatfield, L.L., andGuenther, A.H., "Concepts for Optical Control of Diffuse Discharge Opening Switches," IEEE Trans. Plasma Sci., Vol. PS-10, pp. 246-251, (1982).
2. Christophourou, L., Hunter, S., Carter, J., and Mathis, R.,"Gases for Possible Use in Diffuse Discharge Switches," Appl. Phys. Lett., Vol. 41, pp. 147-149, (1982).
3. Schaefer, G., Schoenbach, K., Krompholz, H., Kristiansen, M., and Guenther, A.H.,"The use of attachers in electron-beam sustained discharge switches - theoretical considerations," Laser and Particle Beams, Vol. 2, pp. 273-291, (1984).
4. Hunter, R.,"Electron Beam Controlled Switch," IEEE Int. Pulsed Power Conf., Lubbock, Tx., pp. IC8:l-6, (1976).
5. Kovalchuk, B., and Meysats, G.,"Current Breaker with Space Discharge Controlled by Electron Beam," Sov. Tech-Phys. Lett., Vol. 2(7), pp. IC7:l-5, (1976).
6. Fernsler, R., Conte, D., and Vitkovitsky, I.,"Repetetive Electron-beam Controlled Switching," IEEE Trans. Plasma Sci., Vol. PS-10, pp. 176-180, (1982).
7. Hallada, M., Bletzinger, P., and Bailey, W.,"Application of Electron-beam Ionized Discharges to Switches - A Comparison of Experiment with Theory," IEEE Trans. Plasma Sci., Vol. PS-10, pp. 218-224, (1982).
8. Harjes, C.H., Schoenbach, K.H., Schaefer, G., Kristiansen, M., Krompholz, H., and Skaggs, D., "Electron-Beam Tetrode For Multiple, Submicrosecond Pulse Operation," Rev. Sci. Instrum., Vol. 55, pp. 1684-1686, (1984).
9. Schoenbach, K.H., Schaefer, G., Kristiansen, M., Krompholz, H., Skaggs, D., and Strickland, E.,"An Electron Beam Controlled Diffuse Discharge Switch," Proc. 5th IEEE Int. Pulsed Power Conf., Washington, D.C, To be published, (1985).
10. Christophourou, L., Hunter, S., Carter, J., Spyrou, S., and Lakdawla, V.,"Basic Studies of Gases for Diffuse Discharge Switching Applications," U.S.-F.R.G. Joint Seminar on Externally Controlled Diffuse Discharges, pp. 103-132, (1983).
39
40
11. Douglas-Hamilton, D.H., andMani, S.A., "Attachment instability in an externally ionized discharge," J. Appl. Phys., Vol. 45, pp. 4406-4415, (1974).
12. Barkalov, A.D., and Gladush, G.G.,"Domain Instability of a Non-self-sustaining Discharge in Electronegative Gases," Translated from Teplofizika Vysokikh Temperatur, Vol. 20, pp. 19-24, (1982).
13. Barkalov, A.D., and Gladush, G.G.,"Domain Instability of a Non-self-sustaining Discharge in Electronegative Gases," Translated from Teplofizika Vysokikh Temperatur, Vol. 20, pp. 201-206, (1982).
14. Barkalov, A.D., and Gladush, G.G.,"Spontaneous Oscillations in a Discharge in an Electronegative Gas," Sov. Phys. Tech. Phys., Vol. 24, pp. 1203-1206, (1979).
15. Bekefi, G., Editor, Principles of Laser Plasmas, New York: John Wiley and Sons, p. 283, (1976).
16. Bar-Lev, A., Semiconductors and Electronic Devices, Englewood Cliffs: Prentice-Hall Inc., pp. 329-334, (1979).
17. Gunn, J.B.,"Microwave Oscillations of Current in III-V Semiconductors," Solid State Communications, Vol. 37, pp. 88, (1963).
18. Kaminsky, M., Atomic and Ionic Impact Phenomena on Metal Surfaces, New York: Springer-Verlag, p. 239, (1965).
19. Krompholz, H., Doggett, J., Schoenbach, K.H., Gahl, J., Harjes, C., Schaefer, G., and Kristiansen, M., "Nanosecond Current Probe for High-Voltage Experiments," Rev. Sci. Instrum., Vol. 55, pp. 127-128, (1984).
20. Krompholz, H., Schoenbach, K., and Schaefer, G., "Transmission Line Current Sensor," Proc. IMTC-IEEE Instrum. and Meas. Tech. Conf., pp. 224-227, (1985).
21. Schoenbach, K.H., Schaefer, G., Kristiansen, M., Krompholz, H., Harjes, H.C., and Skaggs, D.,"An electron-beam controlled diffuse discharge switch," J. Appl. Phys., Vol. 57, pp. 1618-1622, (1985).

41 22. Hunter, S.R., Carter, J.G., Christophourou, L.G.,
and Lakdawala, V.K.,"Transport Properties and Dielectric Strengths of Gas Mixtures for use in Diffuse Discharge Opening Switches," Proc. 4th Gaseous Dielectrics Conf., pp. 224-237, (1984).
23. Schoenbach, K., Schaefer, G., Kristiansen, M., Krompholz, H., Harjes, H., and Skaggs, D., "Investigations of E-beam Controlled Diffuse Discharges," Proc. 4th Gaseous Dielectrics Conf., pp. 246-253, (1984).
24. Long, W.H., Jr., Bailey, W.F., and Garscadden, A., "Electron drift velocities in molecular-gas - rare-gas mixtures," Phys. Rev., Vol. A-13, pp. 471-475, (1976).
25. Haddad, G.N.,"Drift Velocities of Electrons in Nitrogen-Argon Mixtures," Aust. J. Phys., Vol. 36, pp. 297-303, (1983).
26. Petrovic', Z.Lj., Crompton, R.W., and Haddad, G.N., "Model Calculations of Negative Differential Conductivity in Gases," Aust. J. Phys., Vol. 37, pp. 23-24, (1984).
27. Lopantseva, G.B., Pal*, A.F., Persiantsev, I.G., Polushkin, V.M., Starostin, A.N., Timofeev, M.A., and Treneva, E.G.,"Instability of an externally sustained discharge in mixtures of argon with molecular gases," Sov. J. Plasma Phys., Vol. 5, pp. 767-773, (1979).
28. Petrushevich, Yu.V., and Starostin, A.N.,"Domain instability in mixtures of inert and molecular gases," Sov. J. Plasma Phys., Vol. 7, pp. 463-468, (1981).
29. The image converter camera was designed and constructed by M. Michel, Technische Hochschule Darmstadt, FRG.
30. Schaefer, G., Schoenbach, K.H., Kristiansen, M., Strickland, B.E., Korzekwa, R.A., and Hutcheson, G.Z.,"The Influence of the Circuit Impedance on an Electron-Beam Controlled Diffuse Discharge with a Negative Differential Conductivity," Submitted to Appl. Phys. Lett.

PERMISSION TO COPY
In presenting this thesis in partial fulfillment of the
requirements for a master's degree at Texas Tech University, I agree
that the Library and my major department shall make it freely avail
able for research purposes. Permission to copy this thesis for
scholarly purposes may be granted by the Director of the Library or
my major professor. It is understood that any copying or publication
of this thesis for financial gain shall not be allowed without my
further written permission and that any user may be liable for copy-»
right infringement.
Disagree (Permission not granted) Agree (Permission granted)
Student's signature S.^.MMJ Student's signature
Date
^i7i^y Date


![Electronic baseline-suppression for liquid conductivity detection in …biodevices.et.tudelft.nl/Bio-projects/BIOMAS/pdf2.pdf · 2010-03-17 · with the differential amplifier [9]](https://static.fdocuments.net/doc/165x107/5e7a3af13092ba33b35009a4/electronic-baseline-suppression-for-liquid-conductivity-detection-in-2010-03-17.jpg)