Nedgroup Investments MultiFunds PLC Condensed Interim ... · Nedgroup Investments MultiFunds PLC...
52
Nedgroup Investments MultiFunds PLC (Registered number 502599) An umbrella fund with segregated liability between sub-funds for the period ended 31 December 2015
Transcript of Nedgroup Investments MultiFunds PLC Condensed Interim ... · Nedgroup Investments MultiFunds PLC...
Nedgroup Investments MultiFunds PLC (Registered number 502599) An umbrella fund with segregated liability between sub-funds
for the period ended31 December 2015
Nedgroup InvestmentsMultiFunds PLC
Condensed InterimReport and UnauditedFinancial Statements
2Nedgroup Investments MultiFunds PLC Condensed Interim Report and Unaudited Financial Statements 2015
Contents
03 Directory
04 Investment Manager’s Report
07 Schedule of Investments
13 Statement of Comprehensive Income
15 Statement of Financial Position
17 Statement of Changes in Net Assets Attributable to Redeemable Participating Shareholders
19 Statement of Cash Flows
20 Notes to the Financial Statements
44 Significant Purchases and Sales
47 Additional Information
3Nedgroup Investments MultiFunds PLC Condensed Interim Report and Unaudited Financial Statements 2015
Board of Directors Investment Manager, Distributor and PromoterJohn Skelly (Chairman) (Irish)* Nedgroup Investments (IOM) Limited,Yvonne Connolly (Irish)* First Floor,Andrew Lodge (British resident)** Samuel Harris House,Tracey Wiltcher (British resident)** 5 – 11 St. George’s Street,Lorcan Murphy (Irish)*** Douglas, Isle of Man IM1 1AJ, British Isles. Depositary1 Legal Advisers Citi Depositary Services Ireland Limited, A&L Goodbody,1 North Wall Quay, International Financial Services Centre,Dublin 1, North Wall Quay,Ireland. Dublin 1, Ireland. Administrator and Registrar Registered OfficeCitibank Europe plc, 2nd Floor Block E,1 North Wall Quay, Iveagh Court,Dublin 1, Harcourt Road,Ireland. Dublin 2, Ireland. Company Secretary Auditors Carne Global Financial Services Limited, KPMG,2nd Floor Block E, Chartered Accountants, Statutory Audit Firm,Iveagh Court, 1 Harbourmaster Place,Harcourt Road, IFSC,Dublin 2, Dublin 1,Ireland. Ireland.
Directory
* Non – Executive Director, Independent of Investment Manager.** Non – Executive Director.*** Independent, Non – Executive Director.1With effect from 9 November 2015, the Depositary Agreement between the Company and Citibank International Limited, IrelandBranch has been novated to Citi Depositary Services Ireland Limited.
4Nedgroup Investments MultiFunds PLC Condensed Interim Report and Unaudited Financial Statements 2015
General Market Commentary
The final six months of 2015 saw a substantial rise in volatility and a marked degree of differentiation across the various asset classes, regions and sectors. Although mixed, economic data releases generally supported the view that the sluggish recovery of advanced economies remains on track, whilst emerging market economies struggled from a combination of weak commodity prices (a side effect of the slowdown in China), US dollar appreciation and instances of poor governance (with two prime examples being the resignation and replacement of respected finance ministers in Brazil and South Africa).
Events in China captured a lot of headlines over the period. Whilst the Chinese economy has been slowing for a while, poor data releases, combined with a modest devaluation of the Chinese yuan renminbi and a bursting of the Chinese stock bubble, cast further doubt over the health of the world’s second largest economy. By extension, it also focused minds on the deteriorating outlook for commodity prices and economies dependent on exporting to China, especially those that were already struggling. With the European and Japanese economies spluttering, and only the US and the UK showing any sustained growth, the world can ill-afford a significant slowdown in emerging economies. For that reason, many started to question the global economic outlook for 2016, with some economists reducing their forecasts significantly.
Divergence in monetary policy continued to be a central theme as the Federal Reserve finally raised its target interest rate. In contrast, many other central banks (most notably The People’s Bank of China and the European Central Bank) moved in the opposite direction, easing policy further by cutting rates.
Against this background, equity markets struggled, with the MSCI AC World Index returning -4.9%, measured in US dollars. The dramatic strength of the US dollar relative to most other currencies meant that the best performing major market was the US (-0.7%), even though it lost ground. The weakest region was the Emerging Markets (-17.4%), followed by Asia ex-Japan (-13.9%), the UK (-9.4%) and Europe ex-UK (-5.1%). The impact of the sharp decline in the oil price was evident at the sector level, with Energy (-19.1%) and Materials (-16.7%) being significant underperformers. Elsewhere, better performers included Consumer Staples (+3.6%), Information Technology (+1.5%) and Utilities (-0.5%). In terms of style, Growth stocks (-3.0%) outpaced Value stocks (-6.4%), whilst higher risk smaller companies (-6.6%) fell more than larger companies (-4.9%).
Crude oil’s sharp decline had a polarising effect on fixed income markets. The best returns were seen amongst the more secure government bonds issued by the most creditworthy nations, with the decline in the oil price exacerbating disinflationary pressures and leading to market expectations of a ‘lower for longer’ interest rate path. Elsewhere, the importance of energy in the high yield and emerging market universes led to underperformance across both of these bond sectors. Overall, the JP Morgan World Government Bond Index advanced by +2.0%, whilst the Merrill Lynch Global Corporate Bond Index returned +0.3%, the Merrill Lynch Global High Yield Index fell -5.1% and the JP Morgan Hard and Local Currency Sovereign Bond Indices declined by -0.5% and -11.9% respectively (all in hedged to US dollar terms, except for the latter where performance was negatively impacted by currency weakness).
As already mentioned, commodity prices fell significantly over the period, with the Dow Jones
Investment Manager’s Report
5Nedgroup Investments MultiFunds PLC Condensed Interim Report and Unaudited Financial Statements 2015
UBS Commodity Index down 23.5%. The decline was led by a dramatic 44.4% collapse in the price of crude oil caused by a combination of increased supply, weaker demand and a stronger US dollar. However, whilst oil made the headlines, commodity price weakness was broadly based, with industrial metals (-18.4%), agriculture (-14.5%) and gold (-9.7%) all posting negative returns.
In terms of currencies, the marked divergence in economic momentum and monetary policy between the US and much of the rest of the World meant that the US dollar strengthened relative to the majority of the currencies that we closely monitor. Against the majors, the US dollar was strong versus the British pound (+6.7%) and the Euro (+2.6%). However, the rise of the US dollar was particularly marked against the emerging market currencies that are dependent on exporting commodities, such as the Brazilian real (+27.5%) and the South African rand (+27.4%).
The Nedgroup Investments Growth MultiFund (“Growth MultiFund”) returned -4.7% in US dollars from 1 July 2015 to 31 December 2015, which, for reference, compares to the Morningstar USD Aggressive Allocation peer group average return of -4.3%.
The Growth MultiFund’s stated benchmark, USD 3-month LIBID +3% to +5%, returned +1.6% to +2.6% over the period. As a higher risk profile fund, the absolute performance of the Growth MultiFund was driven mainly by its exposure to global equities, which fell sharply over the period. Looking forward, we continue to be underweight equities, underweight bonds and overweight listed property, renewable energy infrastructure and cash. Within equities we remain overweight better valued non-US equities. We are also favouring the US dollar over the euro, Japanese yen and
British pound, whilst protecting against the risk of increased interest rates by maintaining a bias towards shorter dated bonds.
The Nedgroup Investments Balanced MultiFund (“Balanced MultiFund”) returned -3.3% in US dollars from 1 July 2015 to 31 December 2015, which, for reference, compares to the average return of -3.1% for the equally weighted Morningstar USD Moderate and Morningstar USD Cautious Allocation peer groups. The Balanced MultiFund’s benchmark, USD 3-month LIBID +1% to +3%, returned +0.6% to +1.6% over the period. As a medium risk profile fund, the absolute performance was constrained by its exposure to both bonds (due to tilts towards high yield debt and emerging market bonds) and global equities. Looking forward, we continue to be underweight equities, underweight bonds and overweight listed property, renewable energy infrastructure and cash. We are also favouring the US dollar over the euro, Japanese yen and British pound (GBP), whilst protecting against the risk of increased interest rates by maintaining a bias towards shorter dated bonds.
The Nedgroup Investments Income MultiFund (“Income MultiFund”) returned -1.9% in GBP terms from 1 July 2015 to 31 December 2015, which, for reference, compares to the Morningstar Global Bonds GBP Hedged peer group average return of +0.27%.
The Income MultiFund’s stated benchmark, GBP 3-month LIBID, returned +0.2% for the same period. As a low risk profile fund, the absolute performance of the Income MultiFund was constrained by its exposure to corporate bonds (especially high yield) and emerging market debt, which lagged other fixed income sectors
6Nedgroup Investments MultiFunds PLC Condensed Interim Report and Unaudited Financial Statements 2015
over the period. Looking forward, we continue to favour high yielding credit, whilst protecting against the risk of increased interest rates through a bias towards shorter dated bonds. We also maintain modest holdings in commercial property, renewable energy infrastructure and higher yielding equities which offer the benefit of diversification and enhanced yield.
Nedgroup Investments (IOM) LimitedJanuary 2016
7Nedgroup Investments MultiFunds PLC Condensed Interim Report and Unaudited Financial Statements 2015
Holding QuantityFair Value
USD% of
Net Assets
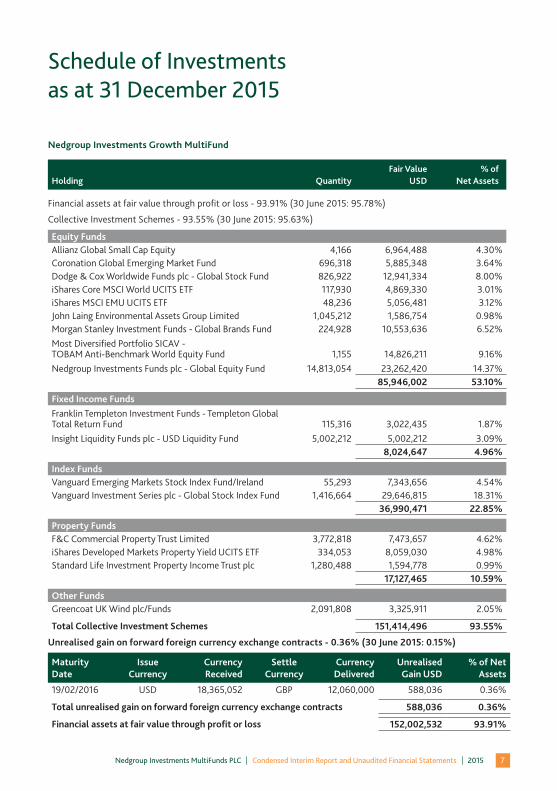
Financial assets at fair value through profit or loss - 93.91% (30 June 2015: 95.78%)
Collective Investment Schemes - 93.55% (30 June 2015: 95.63%)
Equity FundsAllianz Global Small Cap Equity 4,166 6,964,488 4.30%Coronation Global Emerging Market Fund 696,318 5,885,348 3.64%Dodge & Cox Worldwide Funds plc - Global Stock Fund 826,922 12,941,334 8.00%iShares Core MSCI World UCITS ETF 117,930 4,869,330 3.01%iShares MSCI EMU UCITS ETF 48,236 5,056,481 3.12%John Laing Environmental Assets Group Limited 1,045,212 1,586,754 0.98%Morgan Stanley Investment Funds - Global Brands Fund 224,928 10,553,636 6.52%Most Diversified Portfolio SICAV - TOBAM Anti-Benchmark World Equity Fund 1,155 14,826,211 9.16%Nedgroup Investments Funds plc - Global Equity Fund 14,813,054 23,262,420 14.37%
85,946,002 53.10%
Fixed Income FundsFranklin Templeton Investment Funds - Templeton Global Total Return Fund 115,316 3,022,435 1.87%Insight Liquidity Funds plc - USD Liquidity Fund 5,002,212 5,002,212 3.09%
8,024,647 4.96%
Index FundsVanguard Emerging Markets Stock Index Fund/Ireland 55,293 7,343,656 4.54%Vanguard Investment Series plc - Global Stock Index Fund 1,416,664 29,646,815 18.31%
36,990,471 22.85%
Property FundsF&C Commercial Property Trust Limited 3,772,818 7,473,657 4.62%iShares Developed Markets Property Yield UCITS ETF 334,053 8,059,030 4.98%Standard Life Investment Property Income Trust plc 1,280,488 1,594,778 0.99%
17,127,465 10.59%
Other FundsGreencoat UK Wind plc/Funds 2,091,808 3,325,911 2.05%
Total Collective Investment Schemes 151,414,496 93.55%
Unrealised gain on forward foreign currency exchange contracts - 0.36% (30 June 2015: 0.15%)
MaturityDate
IssueCurrency
CurrencyReceived
SettleCurrency
CurrencyDelivered
UnrealisedGain USD
% of NetAssets
19/02/2016 USD 18,365,052 GBP 12,060,000 588,036 0.36%
Total unrealised gain on forward foreign currency exchange contracts 588,036 0.36%
Financial assets at fair value through profit or loss 152,002,532 93.91%
Nedgroup Investments Growth MultiFund
Schedule of Investmentsas at 31 December 2015
8Nedgroup Investments MultiFunds PLC Condensed Interim Report and Unaudited Financial Statements 2015
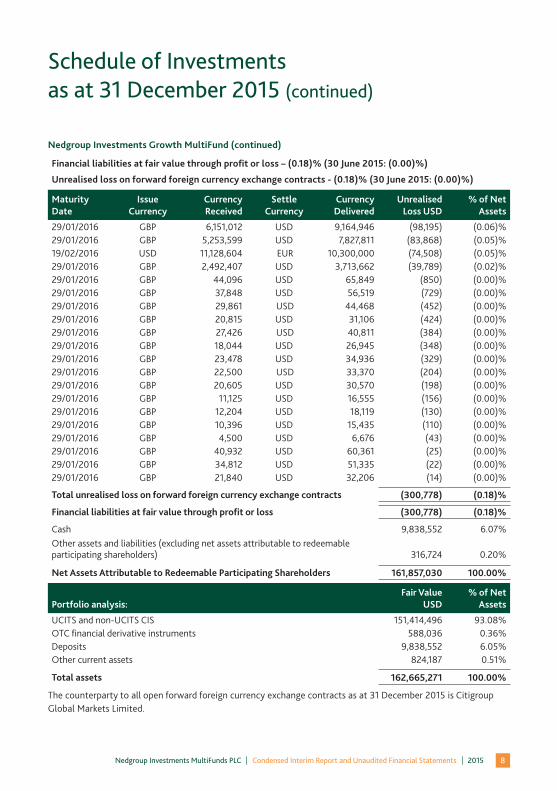
Nedgroup Investments Growth MultiFund (continued)
Financial liabilities at fair value through profit or loss – (0.18)% (30 June 2015: (0.00)%)
Unrealised loss on forward foreign currency exchange contracts - (0.18)% (30 June 2015: (0.00)%)
MaturityDate
IssueCurrency
CurrencyReceived
SettleCurrency
CurrencyDelivered
UnrealisedLoss USD
% of NetAssets
29/01/2016 GBP 6,151,012 USD 9,164,946 (98,195) (0.06)%29/01/2016 GBP 5,253,599 USD 7,827,811 (83,868) (0.05)%19/02/2016 USD 11,128,604 EUR 10,300,000 (74,508) (0.05)%29/01/2016 GBP 2,492,407 USD 3,713,662 (39,789) (0.02)%29/01/2016 GBP 44,096 USD 65,849 (850) (0.00)%29/01/2016 GBP 37,848 USD 56,519 (729) (0.00)%29/01/2016 GBP 29,861 USD 44,468 (452) (0.00)%29/01/2016 GBP 20,815 USD 31,106 (424) (0.00)%29/01/2016 GBP 27,426 USD 40,811 (384) (0.00)%29/01/2016 GBP 18,044 USD 26,945 (348) (0.00)%29/01/2016 GBP 23,478 USD 34,936 (329) (0.00)%29/01/2016 GBP 22,500 USD 33,370 (204) (0.00)%29/01/2016 GBP 20,605 USD 30,570 (198) (0.00)%29/01/2016 GBP 11,125 USD 16,555 (156) (0.00)%29/01/2016 GBP 12,204 USD 18,119 (130) (0.00)%29/01/2016 GBP 10,396 USD 15,435 (110) (0.00)%29/01/2016 GBP 4,500 USD 6,676 (43) (0.00)%29/01/2016 GBP 40,932 USD 60,361 (25) (0.00)%29/01/2016 GBP 34,812 USD 51,335 (22) (0.00)%29/01/2016 GBP 21,840 USD 32,206 (14) (0.00)%
Total unrealised loss on forward foreign currency exchange contracts (300,778) (0.18)%
Financial liabilities at fair value through profit or loss (300,778) (0.18)%
Cash 9,838,552 6.07%Other assets and liabilities (excluding net assets attributable to redeemable participating shareholders) 316,724 0.20%
Net Assets Attributable to Redeemable Participating Shareholders 161,857,030 100.00%
Portfolio analysis: Fair Value
USD% of Net
Assets
UCITS and non-UCITS CIS 151,414,496 93.08%OTC financial derivative instruments 588,036 0.36%Deposits 9,838,552 6.05%Other current assets 824,187 0.51%
Total assets 162,665,271 100.00%
The counterparty to all open forward foreign currency exchange contracts as at 31 December 2015 is CitigroupGlobal Markets Limited.
Schedule of Investmentsas at 31 December 2015 (continued)
9Nedgroup Investments MultiFunds PLC Condensed Interim Report and Unaudited Financial Statements 2015
Holding QuantityFair Value
USD% of
Net Assets
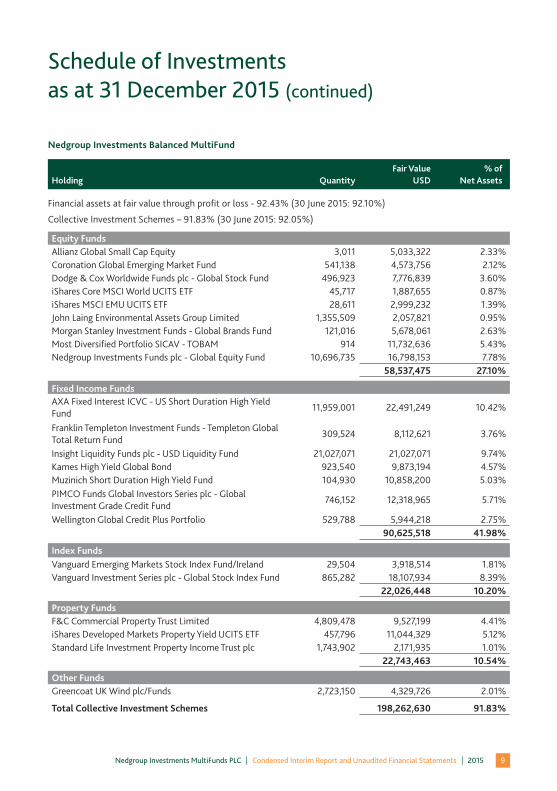
Financial assets at fair value through profit or loss - 92.43% (30 June 2015: 92.10%)
Collective Investment Schemes – 91.83% (30 June 2015: 92.05%)
Equity FundsAllianz Global Small Cap Equity 3,011 5,033,322 2.33%Coronation Global Emerging Market Fund 541,138 4,573,756 2.12%Dodge & Cox Worldwide Funds plc - Global Stock Fund 496,923 7,776,839 3.60%iShares Core MSCI World UCITS ETF 45,717 1,887,655 0.87%iShares MSCI EMU UCITS ETF 28,611 2,999,232 1.39%John Laing Environmental Assets Group Limited 1,355,509 2,057,821 0.95%Morgan Stanley Investment Funds - Global Brands Fund 121,016 5,678,061 2.63%Most Diversified Portfolio SICAV - TOBAM 914 11,732,636 5.43%Nedgroup Investments Funds plc - Global Equity Fund 10,696,735 16,798,153 7.78%
58,537,475 27.10%
Fixed Income FundsAXA Fixed Interest ICVC - US Short Duration High Yield Fund
11,959,001 22,491,249 10.42%
Franklin Templeton Investment Funds - Templeton Global Total Return Fund
309,524 8,112,621 3.76%
Insight Liquidity Funds plc - USD Liquidity Fund 21,027,071 21,027,071 9.74%Kames High Yield Global Bond 923,540 9,873,194 4.57%Muzinich Short Duration High Yield Fund 104,930 10,858,200 5.03%PIMCO Funds Global Investors Series plc - Global Investment Grade Credit Fund
746,152 12,318,965 5.71%
Wellington Global Credit Plus Portfolio 529,788 5,944,218 2.75%90,625,518 41.98%
Index FundsVanguard Emerging Markets Stock Index Fund/Ireland 29,504 3,918,514 1.81%Vanguard Investment Series plc - Global Stock Index Fund 865,282 18,107,934 8.39%
22,026,448 10.20%
Property FundsF&C Commercial Property Trust Limited 4,809,478 9,527,199 4.41%iShares Developed Markets Property Yield UCITS ETF 457,796 11,044,329 5.12%Standard Life Investment Property Income Trust plc 1,743,902 2,171,935 1.01%
22,743,463 10.54%
Other FundsGreencoat UK Wind plc/Funds 2,723,150 4,329,726 2.01%
Total Collective Investment Schemes 198,262,630 91.83%
Nedgroup Investments Balanced MultiFund
Schedule of Investmentsas at 31 December 2015 (continued)
10Nedgroup Investments MultiFunds PLC Condensed Interim Report and Unaudited Financial Statements 2015
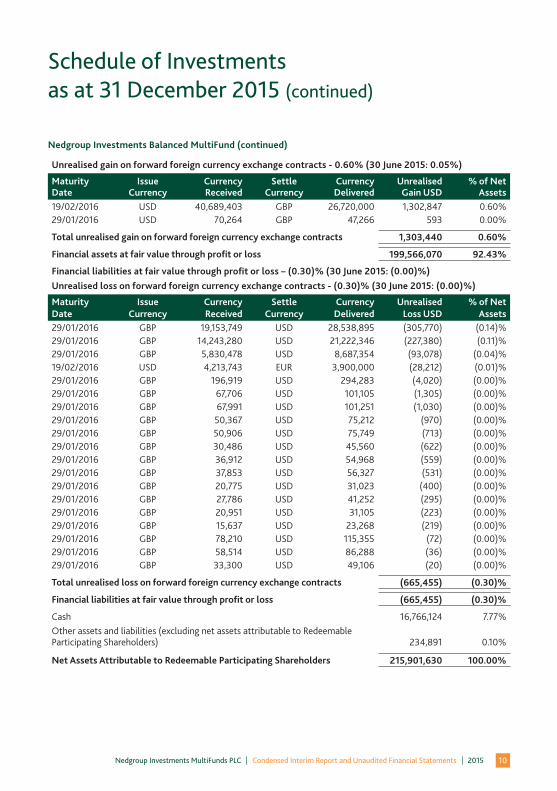
Nedgroup Investments Balanced MultiFund (continued)
Unrealised gain on forward foreign currency exchange contracts - 0.60% (30 June 2015: 0.05%)
MaturityDate
IssueCurrency
CurrencyReceived
SettleCurrency
CurrencyDelivered
UnrealisedGain USD
% of NetAssets
19/02/2016 USD 40,689,403 GBP 26,720,000 1,302,847 0.60%29/01/2016 USD 70,264 GBP 47,266 593 0.00%
Total unrealised gain on forward foreign currency exchange contracts 1,303,440 0.60%
Financial assets at fair value through profit or loss 199,566,070 92.43%
Financial liabilities at fair value through profit or loss – (0.30)% (30 June 2015: (0.00)%)Unrealised loss on forward foreign currency exchange contracts - (0.30)% (30 June 2015: (0.00)%)
MaturityDate
IssueCurrency
CurrencyReceived
SettleCurrency
CurrencyDelivered
UnrealisedLoss USD
% of NetAssets
29/01/2016 GBP 19,153,749 USD 28,538,895 (305,770) (0.14)%29/01/2016 GBP 14,243,280 USD 21,222,346 (227,380) (0.11)%29/01/2016 GBP 5,830,478 USD 8,687,354 (93,078) (0.04)%19/02/2016 USD 4,213,743 EUR 3,900,000 (28,212) (0.01)%29/01/2016 GBP 196,919 USD 294,283 (4,020) (0.00)%29/01/2016 GBP 67,706 USD 101,105 (1,305) (0.00)%29/01/2016 GBP 67,991 USD 101,251 (1,030) (0.00)%29/01/2016 GBP 50,367 USD 75,212 (970) (0.00)%29/01/2016 GBP 50,906 USD 75,749 (713) (0.00)%29/01/2016 GBP 30,486 USD 45,560 (622) (0.00)%29/01/2016 GBP 36,912 USD 54,968 (559) (0.00)%29/01/2016 GBP 37,853 USD 56,327 (531) (0.00)%29/01/2016 GBP 20,775 USD 31,023 (400) (0.00)%29/01/2016 GBP 27,786 USD 41,252 (295) (0.00)%29/01/2016 GBP 20,951 USD 31,105 (223) (0.00)%29/01/2016 GBP 15,637 USD 23,268 (219) (0.00)%29/01/2016 GBP 78,210 USD 115,355 (72) (0.00)%29/01/2016 GBP 58,514 USD 86,288 (36) (0.00)%29/01/2016 GBP 33,300 USD 49,106 (20) (0.00)%
Total unrealised loss on forward foreign currency exchange contracts (665,455) (0.30)%
Financial liabilities at fair value through profit or loss (665,455) (0.30)%
Cash 16,766,124 7.77%Other assets and liabilities (excluding net assets attributable to Redeemable Participating Shareholders) 234,891 0.10%
Net Assets Attributable to Redeemable Participating Shareholders 215,901,630 100.00%
Schedule of Investmentsas at 31 December 2015 (continued)
11Nedgroup Investments MultiFunds PLC Condensed Interim Report and Unaudited Financial Statements 2015
Holding QuantityFair Value
GBP% of
Net Assets
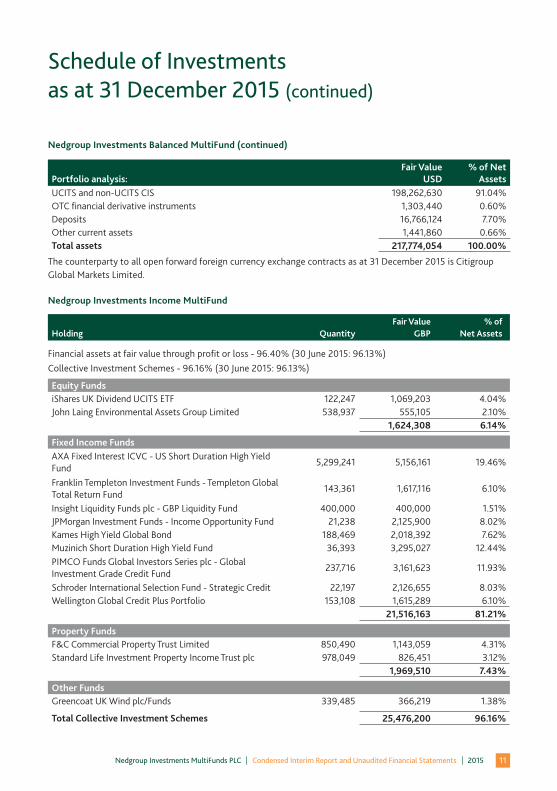
Financial assets at fair value through profit or loss - 96.40% (30 June 2015: 96.13%) Collective Investment Schemes - 96.16% (30 June 2015: 96.13%)
Equity FundsiShares UK Dividend UCITS ETF 122,247 1,069,203 4.04%John Laing Environmental Assets Group Limited 538,937 555,105 2.10%
1,624,308 6.14%
Fixed Income FundsAXA Fixed Interest ICVC - US Short Duration High Yield Fund
5,299,241 5,156,161 19.46%
Franklin Templeton Investment Funds - Templeton Global Total Return Fund
143,361 1,617,116 6.10%
Insight Liquidity Funds plc - GBP Liquidity Fund 400,000 400,000 1.51%JPMorgan Investment Funds - Income Opportunity Fund 21,238 2,125,900 8.02%Kames High Yield Global Bond 188,469 2,018,392 7.62%Muzinich Short Duration High Yield Fund 36,393 3,295,027 12.44%PIMCO Funds Global Investors Series plc - Global Investment Grade Credit Fund
237,716 3,161,623 11.93%
Schroder International Selection Fund - Strategic Credit 22,197 2,126,655 8.03%Wellington Global Credit Plus Portfolio 153,108 1,615,289 6.10%
21,516,163 81.21%
Property FundsF&C Commercial Property Trust Limited 850,490 1,143,059 4.31%Standard Life Investment Property Income Trust plc 978,049 826,451 3.12%
1,969,510 7.43%
Other FundsGreencoat UK Wind plc/Funds 339,485 366,219 1.38%
Total Collective Investment Schemes 25,476,200 96.16%
Nedgroup Investments Income MultiFund
Nedgroup Investments Balanced MultiFund (continued)
Schedule of Investmentsas at 31 December 2015 (continued)
Portfolio analysis: Fair Value
USD% of Net
AssetsUCITS and non-UCITS CIS 198,262,630 91.04%OTC financial derivative instruments 1,303,440 0.60%Deposits 16,766,124 7.70%Other current assets 1,441,860 0.66%Total assets 217,774,054 100.00%
The counterparty to all open forward foreign currency exchange contracts as at 31 December 2015 is Citigroup Global Markets Limited.
12Nedgroup Investments MultiFunds PLC Condensed Interim Report and Unaudited Financial Statements 2015
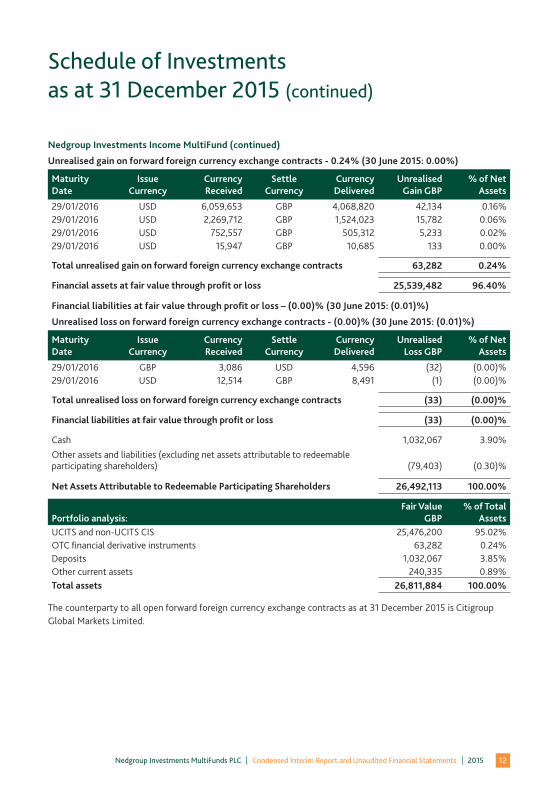
Nedgroup Investments Income MultiFund (continued)
Unrealised gain on forward foreign currency exchange contracts - 0.24% (30 June 2015: 0.00%)
MaturityDate
IssueCurrency
CurrencyReceived
SettleCurrency
CurrencyDelivered
UnrealisedGain GBP
% of NetAssets
29/01/2016 USD 6,059,653 GBP 4,068,820 42,134 0.16%29/01/2016 USD 2,269,712 GBP 1,524,023 15,782 0.06%29/01/2016 USD 752,557 GBP 505,312 5,233 0.02%29/01/2016 USD 15,947 GBP 10,685 133 0.00%
Total unrealised gain on forward foreign currency exchange contracts 63,282 0.24%
Financial assets at fair value through profit or loss 25,539,482 96.40%
Financial liabilities at fair value through profit or loss – (0.00)% (30 June 2015: (0.01)%)
Unrealised loss on forward foreign currency exchange contracts - (0.00)% (30 June 2015: (0.01)%)
MaturityDate
IssueCurrency
CurrencyReceived
SettleCurrency
CurrencyDelivered
UnrealisedLoss GBP
% of NetAssets
29/01/2016 GBP 3,086 USD 4,596 (32) (0.00)%29/01/2016 USD 12,514 GBP 8,491 (1) (0.00)%
Total unrealised loss on forward foreign currency exchange contracts (33) (0.00)%
Financial liabilities at fair value through profit or loss (33) (0.00)%
Cash 1,032,067 3.90%Other assets and liabilities (excluding net assets attributable to redeemable participating shareholders) (79,403)
(0.30)%
Net Assets Attributable to Redeemable Participating Shareholders 26,492,113 100.00%
Portfolio analysis: Fair Value
GBP% of Total
AssetsUCITS and non-UCITS CIS 25,476,200 95.02%OTC financial derivative instruments 63,282 0.24%Deposits 1,032,067 3.85%Other current assets 240,335 0.89%Total assets 26,811,884 100.00%
The counterparty to all open forward foreign currency exchange contracts as at 31 December 2015 is Citigroup Global Markets Limited.
Schedule of Investmentsas at 31 December 2015 (continued)
13Nedgroup Investments MultiFunds PLC Condensed Interim Report and Unaudited Financial Statements 2015
Notes
Nedgroup Investments
GrowthMultiFund
USD
Nedgroup Investments
Balanced MultiFund
USD
Nedgroup Investments
IncomeMultiFund
GBP
Total31 December
2015GBP
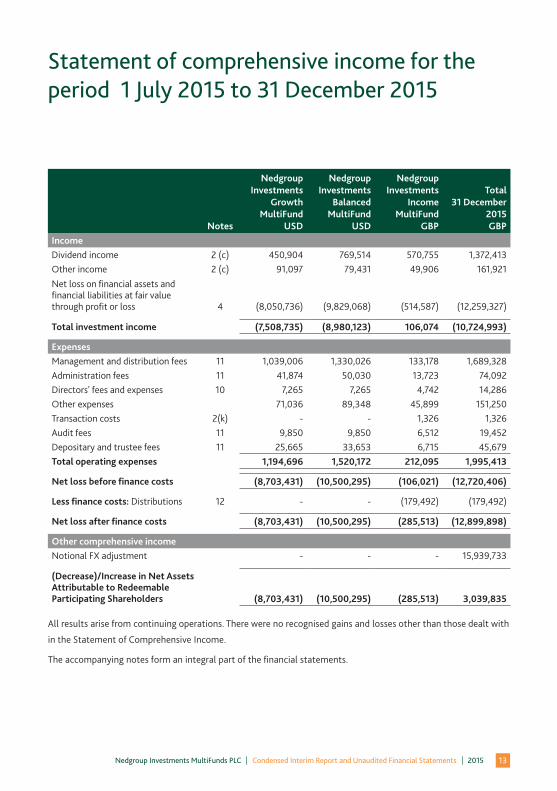
IncomeDividend income 2 (c) 450,904 769,514 570,755 1,372,413Other income 2 (c) 91,097 79,431 49,906 161,921Net loss on financial assets and financial liabilities at fair value through profit or loss 4 (8,050,736) (9,829,068) (514,587) (12,259,327)
Total investment income (7,508,735) (8,980,123) 106,074 (10,724,993)
ExpensesManagement and distribution fees 11 1,039,006 1,330,026 133,178 1,689,328Administration fees 11 41,874 50,030 13,723 74,092Directors' fees and expenses 10 7,265 7,265 4,742 14,286Other expenses 71,036 89,348 45,899 151,250Transaction costs 2(k) - - 1,326 1,326Audit fees 11 9,850 9,850 6,512 19,452Depositary and trustee fees 11 25,665 33,653 6,715 45,679Total operating expenses 1,194,696 1,520,172 212,095 1,995,413
Net loss before finance costs (8,703,431) (10,500,295) (106,021) (12,720,406)
Less finance costs: Distributions 12 - - (179,492) (179,492)
Net loss after finance costs (8,703,431) (10,500,295) (285,513) (12,899,898)
Other comprehensive incomeNotional FX adjustment - - - 15,939,733
(Decrease)/Increase in Net Assets Attributable to Redeemable Participating Shareholders (8,703,431) (10,500,295) (285,513) 3,039,835
All results arise from continuing operations. There were no recognised gains and losses other than those dealt with
in the Statement of Comprehensive Income.
The accompanying notes form an integral part of the financial statements.
Statement of comprehensive income for the period 1 July 2015 to 31 December 2015
14Nedgroup Investments MultiFunds PLC Condensed Interim Report and Unaudited Financial Statements 2015
Notes
Nedgroup Investments
GrowthMultiFund
USD
Nedgroup Investments
Balanced MultiFund
USD
Nedgroup Investments
IncomeMultiFund
GBP
Total31 December
2014GBP
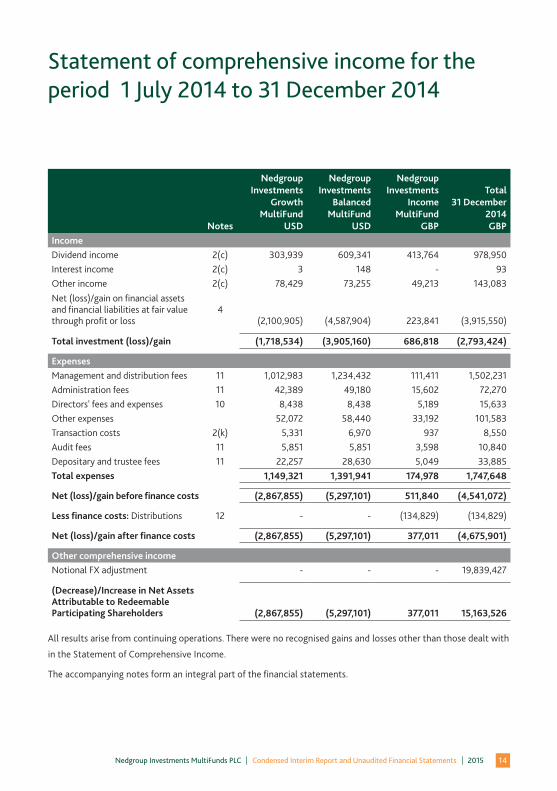
IncomeDividend income 2(c) 303,939 609,341 413,764 978,950Interest income 2(c) 3 148 - 93Other income 2(c) 78,429 73,255 49,213 143,083Net (loss)/gain on financial assets and financial liabilities at fair value through profit or loss
4(2,100,905) (4,587,904) 223,841 (3,915,550)
Total investment (loss)/gain (1,718,534) (3,905,160) 686,818 (2,793,424)
ExpensesManagement and distribution fees 11 1,012,983 1,234,432 111,411 1,502,231Administration fees 11 42,389 49,180 15,602 72,270Directors' fees and expenses 10 8,438 8,438 5,189 15,633Other expenses 52,072 58,440 33,192 101,583Transaction costs 2(k) 5,331 6,970 937 8,550Audit fees 11 5,851 5,851 3,598 10,840Depositary and trustee fees 11 22,257 28,630 5,049 33,885Total expenses 1,149,321 1,391,941 174,978 1,747,648
Net (loss)/gain before finance costs (2,867,855) (5,297,101) 511,840 (4,541,072)
Less finance costs: Distributions 12 - - (134,829) (134,829)
Net (loss)/gain after finance costs (2,867,855) (5,297,101) 377,011 (4,675,901)
Other comprehensive incomeNotional FX adjustment - - - 19,839,427
(Decrease)/Increase in Net Assets Attributable to Redeemable Participating Shareholders (2,867,855) (5,297,101) 377,011 15,163,526
All results arise from continuing operations. There were no recognised gains and losses other than those dealt with
in the Statement of Comprehensive Income.
The accompanying notes form an integral part of the financial statements.
Statement of comprehensive income for the period 1 July 2014 to 31 December 2014
15Nedgroup Investments MultiFunds PLC Condensed Interim Report and Unaudited Financial Statements 2015
Notes
Nedgroup Investments
GrowthMultiFund
USD
Nedgroup Investments
Balanced MultiFund
USD
Nedgroup Investments
IncomeMultiFund
GBP
Total31 December
2015GBP
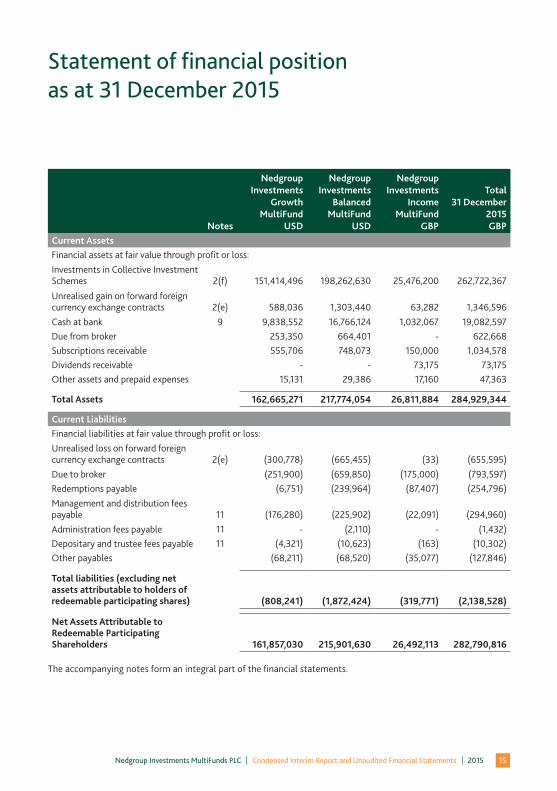
Current AssetsFinancial assets at fair value through profit or loss:Investments in Collective Investment Schemes 2(f) 151,414,496 198,262,630 25,476,200 262,722,367
Unrealised gain on forward foreign currency exchange contracts 2(e) 588,036 1,303,440 63,282 1,346,596Cash at bank 9 9,838,552 16,766,124 1,032,067 19,082,597Due from broker 253,350 664,401 - 622,668Subscriptions receivable 555,706 748,073 150,000 1,034,578Dividends receivable - - 73,175 73,175Other assets and prepaid expenses 15,131 29,386 17,160 47,363
Total Assets 162,665,271 217,774,054 26,811,884 284,929,344
Current LiabilitiesFinancial liabilities at fair value through profit or loss:Unrealised loss on forward foreign currency exchange contracts 2(e) (300,778) (665,455) (33) (655,595)Due to broker (251,900) (659,850) (175,000) (793,597)Redemptions payable (6,751) (239,964) (87,407) (254,796)Management and distribution fees payable 11 (176,280) (225,902) (22,091) (294,960)Administration fees payable 11 - (2,110) - (1,432)Depositary and trustee fees payable 11 (4,321) (10,623) (163) (10,302)Other payables (68,211) (68,520) (35,077) (127,846)
Total liabilities (excluding net assets attributable to holders of redeemable participating shares) (808,241) (1,872,424) (319,771) (2,138,528)
Net Assets Attributable to Redeemable Participating Shareholders 161,857,030 215,901,630 26,492,113 282,790,816
The accompanying notes form an integral part of the financial statements.
Statement of financial positionas at 31 December 2015
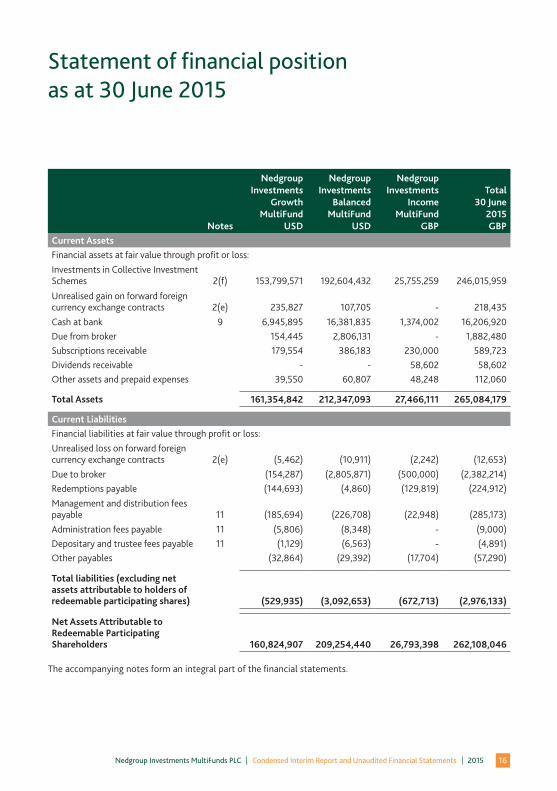
16Nedgroup Investments MultiFunds PLC Condensed Interim Report and Unaudited Financial Statements 2015
Notes
Nedgroup Investments
GrowthMultiFund
USD
Nedgroup Investments
Balanced MultiFund
USD
Nedgroup Investments
IncomeMultiFund
GBP
Total30 June
2015GBP
Current AssetsFinancial assets at fair value through profit or loss:Investments in Collective Investment Schemes 2(f) 153,799,571 192,604,432 25,755,259 246,015,959
Unrealised gain on forward foreign currency exchange contracts 2(e) 235,827 107,705 - 218,435Cash at bank 9 6,945,895 16,381,835 1,374,002 16,206,920Due from broker 154,445 2,806,131 - 1,882,480Subscriptions receivable 179,554 386,183 230,000 589,723Dividends receivable - - 58,602 58,602Other assets and prepaid expenses 39,550 60,807 48,248 112,060
Total Assets 161,354,842 212,347,093 27,466,111 265,084,179
Current LiabilitiesFinancial liabilities at fair value through profit or loss:Unrealised loss on forward foreign currency exchange contracts 2(e) (5,462) (10,911) (2,242) (12,653)Due to broker (154,287) (2,805,871) (500,000) (2,382,214)Redemptions payable (144,693) (4,860) (129,819) (224,912)Management and distribution fees payable 11 (185,694) (226,708) (22,948) (285,173)Administration fees payable 11 (5,806) (8,348) - (9,000)Depositary and trustee fees payable 11 (1,129) (6,563) - (4,891)Other payables (32,864) (29,392) (17,704) (57,290)
Total liabilities (excluding net assets attributable to holders of redeemable participating shares) (529,935) (3,092,653) (672,713) (2,976,133)
Net Assets Attributable to Redeemable Participating Shareholders 160,824,907 209,254,440 26,793,398 262,108,046
The accompanying notes form an integral part of the financial statements.
Statement of financial positionas at 30 June 2015
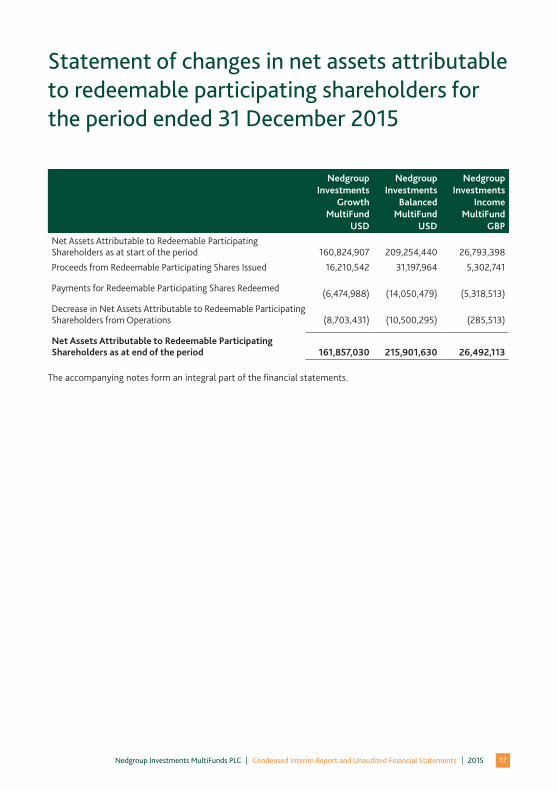
17Nedgroup Investments MultiFunds PLC Condensed Interim Report and Unaudited Financial Statements 2015
Nedgroup Investments
GrowthMultiFund
USD
Nedgroup Investments
Balanced MultiFund
USD
Nedgroup Investments
IncomeMultiFund
GBPNet Assets Attributable to Redeemable Participating Shareholders as at start of the period 160,824,907 209,254,440 26,793,398
Proceeds from Redeemable Participating Shares Issued 16,210,542 31,197,964 5,302,741
Payments for Redeemable Participating Shares Redeemed (6,474,988) (14,050,479) (5,318,513)
Decrease in Net Assets Attributable to Redeemable Participating Shareholders from Operations (8,703,431) (10,500,295) (285,513)
Net Assets Attributable to Redeemable Participating Shareholders as at end of the period 161,857,030 215,901,630 26,492,113
The accompanying notes form an integral part of the financial statements.
Statement of changes in net assets attributable to redeemable participating shareholders for the period ended 31 December 2015
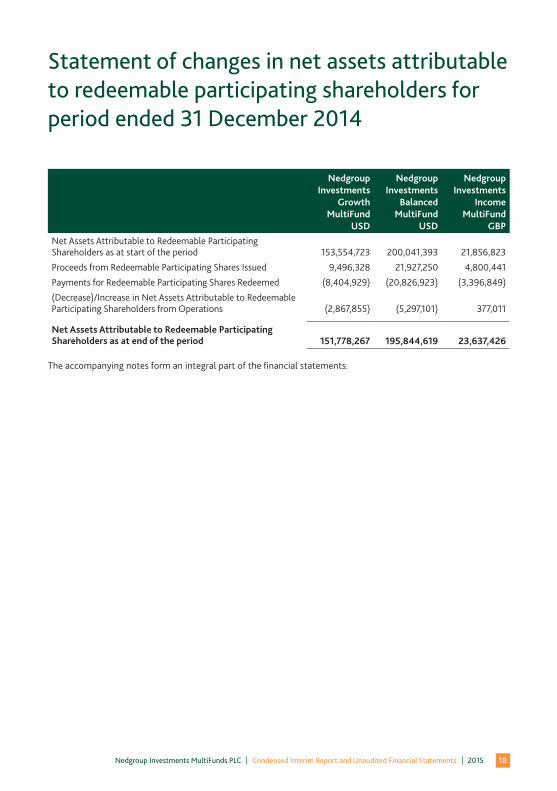
18Nedgroup Investments MultiFunds PLC Condensed Interim Report and Unaudited Financial Statements 2015
Nedgroup Investments
GrowthMultiFund
USD
Nedgroup Investments
Balanced MultiFund
USD
Nedgroup Investments
IncomeMultiFund
GBPNet Assets Attributable to Redeemable Participating Shareholders as at start of the period 153,554,723 200,041,393 21,856,823
Proceeds from Redeemable Participating Shares Issued 9,496,328 21,927,250 4,800,441
Payments for Redeemable Participating Shares Redeemed (8,404,929) (20,826,923) (3,396,849)
(Decrease)/Increase in Net Assets Attributable to Redeemable Participating Shareholders from Operations (2,867,855) (5,297,101) 377,011
Net Assets Attributable to Redeemable Participating Shareholders as at end of the period 151,778,267 195,844,619 23,637,426
The accompanying notes form an integral part of the financial statements.
Statement of changes in net assets attributable to redeemable participating shareholders for period ended 31 December 2014

19Nedgroup Investments MultiFunds PLC Condensed Interim Report and Unaudited Financial Statements 2015
Company Total
31 December2015GBP
Company Total
31 December2014GBP
Cash flows from operating activitiesIncrease in Net Assets Attributable to Redeemable Participating Shareholders 3,039,835 15,163,526Adjustments to reconcile income attributable redeemable participating shareholders to net cash used in operating activities:Financial assets at fair value through profit or loss (17,834,569) (22,023,230)
Amounts due from broker 1,259,812 (83,623)
Dividend receivable (14,573) (21,342)
Prepaid expenses 64,694 (113,054)
Financial liabilities at fair value through profit or loss 642,942 (320,304)
Amounts due to broker (1,588,617) (41,308)
Management and distribution fees payable 9,787 35,681
Administration fees payable (7,568) 8,878
Depositary and trustee fees payable 5,411 2,366
Other payables 70,555 141,124
Net cash used in operating activities (14,352,291) (7,251,286)
Cash flows from financing activities
Proceeds from issue of redeemable participating shares 35,999,198 23,939,566
Payment for redemption of redeemable participating shares (18,771,230) (21,531,734)
Net cash provided by financing activities 17,227,968 2,407,832
Net increase/(decrease) in cash and cash equivalents 2,875,677 (4,843,454)
Cash and cash equivalents at the beginning of the period 16,206,920 13,064,684
Cash and cash equivalents at the end of the period 19,082,597 8,221,230
Supplementary cash flow information
Dividends received 1,357,840 957,608
Interest received - 93
The accompanying notes form an integral part of the financial statements.
Statement of cash flows for the periods ended 31 December 2015 and 31 December 2014

20Nedgroup Investments MultiFunds PLC Condensed Interim Report and Unaudited Financial Statements 2015
1. General information Structure
Nedgroup Investments MultiFunds plc (the “Company”) is an umbrella fund with segregated liability between Sub-Funds (the “Funds”) established as an open-ended investment company with variable capital. It was redomiciled into Ireland on 19 August 2011 under the laws of Ireland as a public limited company pursuant to the Companies Act, 2014, the European Communities (Undertakings for Collective Investment in Transferable Securities) Regulations, 2011, as amended and the Central Bank (Supervision and Enforcement) Act 2013 (Section 48(1)) (Undertakings for Collective Investment in Transferable Securities) Regulations 2015 (the “Regulations”) and has been authorised by the Central Bank of Ireland as a UCITS. Its share capital is divided into a number of classes each representing interests in a Fund and each Fund may comprise various classes of shares. The subscriber shares do not entitle the holders to participate in the assets of any of the Sub-Funds.
As at 31 December 2015, the Company consisted of the following Funds and active share classes:
Sub-Fund Share Class
Nedgroup Investments Growth MultiFund A GBP, A USD, B GBP, B USD, C GBP, C USD
Nedgroup Investments Balanced MultiFund A GBP, A USD, B GBP, B USD, C GBP, C USD
Nedgroup Investments Income MultiFund A GBP Acc, A USD Acc, A GBP Dist, B GBP Acc, B USD Acc, B GBP Dist, C GBP Acc, C USD Acc*, C GBP Dist
*First subscriptions were made on 16 October 2015.
Investment Objectives of the Funds
Nedgroup Investments Growth MultiFund (the “Growth MultiFund”) The investment objective of the Growth MultiFund is to provide higher levels of growth with moderate to higher
levels of risk and volatility over the medium to longer term compared to the other Funds of the Company.
Nedgroup Investments Balanced MultiFund (the “Balanced MultiFund”) The investment objective of the Balanced MultiFund is to provide growth with moderate levels of risk and
volatility over the medium to longer term compared to the other Funds of the Company.
Nedgroup Investments Income MultiFund (the “Income MultiFund”) The investment objective of the Income MultiFund is to provide a lower risk, lower volatility investment option
compared to other Funds of the Company, targeting returns in excess of cash.
2. Significant Accounting Policies The accounting policies adopted by the Company are consistent with those of the previous financial year ended
30 June 2015.
a) Accounting Convention
These condensed interim financial statements for the six months ended 31 December 2015 have been prepared in accordance with IAS 34, ‘Interim Financial Reporting’. These condensed interim financial statements should be read in conjunction with the annual financial statements for the year ended 30 June 2015, which have been prepared in accordance with International Financial Reporting Standards (IFRS).
Notes to the financial statements forthe period ended 31 December 2015
21Nedgroup Investments MultiFunds PLC Condensed Interim Report and Unaudited Financial Statements 2015
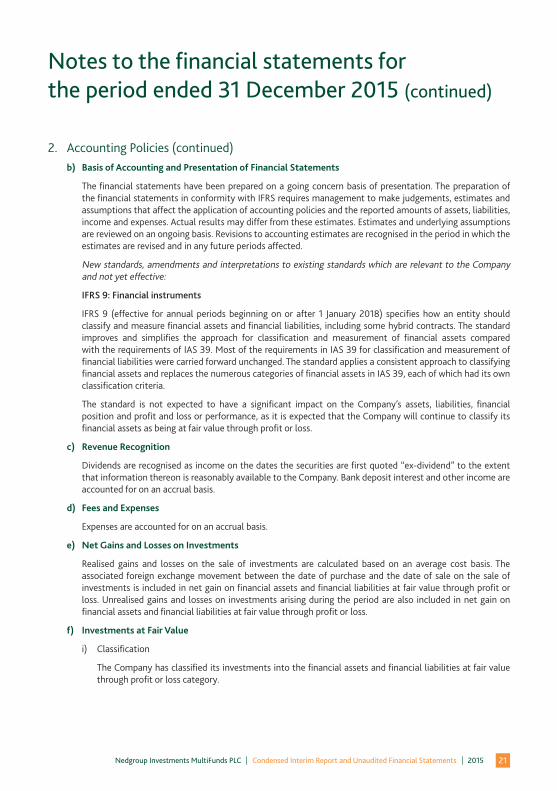
2. Accounting Policies (continued)b) Basis of Accounting and Presentation of Financial Statements
The financial statements have been prepared on a going concern basis of presentation. The preparation of the financial statements in conformity with IFRS requires management to make judgements, estimates and assumptions that affect the application of accounting policies and the reported amounts of assets, liabilities, income and expenses. Actual results may differ from these estimates. Estimates and underlying assumptions are reviewed on an ongoing basis. Revisions to accounting estimates are recognised in the period in which the estimates are revised and in any future periods affected.
New standards, amendments and interpretations to existing standards which are relevant to the Company and not yet effective:
IFRS 9: Financial instruments
IFRS 9 (effective for annual periods beginning on or after 1 January 2018) specifies how an entity should classify and measure financial assets and financial liabilities, including some hybrid contracts. The standard improves and simplifies the approach for classification and measurement of financial assets compared with the requirements of IAS 39. Most of the requirements in IAS 39 for classification and measurement of financial liabilities were carried forward unchanged. The standard applies a consistent approach to classifying financial assets and replaces the numerous categories of financial assets in IAS 39, each of which had its own classification criteria.
The standard is not expected to have a significant impact on the Company’s assets, liabilities, financial position and profit and loss or performance, as it is expected that the Company will continue to classify its financial assets as being at fair value through profit or loss.
c) Revenue Recognition
Dividends are recognised as income on the dates the securities are first quoted “ex-dividend” to the extent that information thereon is reasonably available to the Company. Bank deposit interest and other income are accounted for on an accrual basis.
d) Fees and Expenses
Expenses are accounted for on an accrual basis.
e) Net Gains and Losses on Investments
Realised gains and losses on the sale of investments are calculated based on an average cost basis. The associated foreign exchange movement between the date of purchase and the date of sale on the sale of investments is included in net gain on financial assets and financial liabilities at fair value through profit or loss. Unrealised gains and losses on investments arising during the period are also included in net gain on financial assets and financial liabilities at fair value through profit or loss.
f) Investments at Fair Value
i) Classification
The Company has classified its investments into the financial assets and financial liabilities at fair value through profit or loss category.
Notes to the financial statements forthe period ended 31 December 2015 (continued)
22Nedgroup Investments MultiFunds PLC Condensed Interim Report and Unaudited Financial Statements 2015
2. Accounting Policies (continued)f) Investments at Fair Value (continued)
i) Classification (continued)
The category of financial assets and financial liabilities at fair value through profit or loss comprises:
Financial instruments held for trading. These include collective investment schemes and all derivative financial instruments. All derivatives in a net receivable position (positive fair value), are reported as financial assets held for trading. All derivatives in a net payable position (negative fair value), are reported as financial liabilities held for trading.
Other financial assets classified as loans and receivables consist of deposits with credit institutions, amounts due from broker, amounts receivable for shares sold, dividends receivable and other receivables.
Financial liabilities that are not at fair value through profit or loss include amounts due to credit institutions, amounts payable for shares repurchased, amounts due to broker, accrued expenses, payables and financial liabilities arising on redeemable participating shares.
ii) Recognition
The Company recognises financial assets or financial liabilities on the date it becomes party to the contractual provisions of the instrument. Regular purchases or sales of financial assets are recognised using trade date accounting. Investments are originally recognised at fair value and transaction costs for all financial assets and financial liabilities carried at fair value through profit or loss are expensed as incurred.
A financial asset is derecognised when the contractual rights to the cash flows from the financial asset expire or when it transfers the financial asset in a transaction in which substantially all the risks and rewards of ownership are transferred. A financial liability is derecognised when the obligation specified in the contract is discharged, cancelled or expires.
iii) Measurement
Financial instruments are measured initially at fair value (transaction price). Transaction costs on financial assets and financial liabilities at fair value through profit or loss are expensed immediately. Subsequent to initial recognition, all instruments classified at fair value through profit or loss are measured at fair value with changes in their fair value recognised in the Statement of Comprehensive Income.
Financial assets classified as loans and receivables are carried at amortised cost using the effective interest rate method, less impairment losses, if any. Financial liabilities, other than those at fair value through profit or loss, are measured at amortised cost using the effective interest rate method.
Financial liabilities arising from redeemable shares issued by the Funds are carried at redemption amount representing the investor’s right to a residual interest in the Fund’s assets.
iv) Fair value measurement principles
Fair value is the amount for which an asset could be exchanged, or a liability settled, between knowledgeable, willing parties in an arm’s length transaction.
The fair value of financial assets and financial liabilities is based on their quoted market prices on a recognised exchange or sourced from reputable brokers/counterparties or independent market data providers, in the case of non-exchange traded instruments, at the period end date without any deduction for estimated future selling costs. Financial assets and financial liabilities are priced at their last traded prices.
Notes to the financial statements forthe period ended 31 December 2015 (continued)
23Nedgroup Investments MultiFunds PLC Condensed Interim Report and Unaudited Financial Statements 2015
2. Accounting Policies (continued)f) Investments at Fair Value (continued)
iv) Fair value measurement principles (continued)
For all other financial instruments not traded in an active market or where no broker/counterparty quotes can be obtained, the fair value is determined by using appropriate valuation techniques, which include using arm’s length transactions; reference to the current market value of another instrument that is substantially the same; discounted cash flow analysis and option pricing models making as much use of available and supportable market data as possible.
Where discounted cash flow techniques are used, estimated future cash flows are based on management’s best estimates and the discount rate used is a market rate at the period end date applicable for an instrument with similar terms and conditions. Where other pricing models are used, inputs are based on market data at the period end date. Fair values for unquoted equity investments are estimated, if possible, using applicable price/earnings ratios for similar listed companies adjusted to reflect the specific circumstances of the issuer.
The fair value of derivatives that are not exchange-traded is estimated at the amount that the Company would receive or pay to terminate the contract at the period end date taking into account current market conditions (volatility, appropriate yield curve) and the current creditworthiness of the counterparties.
The fair value of any investments in open-ended collective investment schemes shall be valued at market value. Market value is based on the underlying fund administrator’s calculation of the Net Asset Value per share (market value of the Fund’s assets less liabilities / number of shares) which will be the latest price published by the collective investment scheme.
The fair value of any investments in closed-ended collective investment schemes (exchange traded funds) shall be valued at market value. Market value is based on the prices available on the principal market for such security at the valuation date taking into account any adjustments that may be required to account for illiquidity, low trading volumes or any such factors that may indicate that the price may not be fair value.
v) Offsetting financial instruments
Financial assets and financial liabilities are offset and the net amount reported in the Statement of Financial Position where the Company has a legally enforceable right to set-off the recognised amounts and there is an intention to settle on a net basis or realise the asset and settle the liability simultaneously.
vi) Specific instruments
Deposits with credit institutions are short-term highly liquid investments that are readily convertible to known amounts of cash, are subject to an insignificant risk of changes in value, and are held for the purpose of meeting short-term cash commitments rather than for investment for other purposes.
Forward foreign exchange contracts are commitments to either purchase or sell a designated currency at a specified future date for a specified price. Forward foreign currency exchange contracts are valued by reference to the forward price at which a new contract of the same size and maturity could be undertaken at the valuation date.
The unrealised gain or loss on open forward foreign currency exchange contracts is calculated as the difference between the contract rate and this forward price (the rate to close out the contract). Unrealised gains and losses on forward foreign currency exchange contracts are recognised in the Statement of Comprehensive Income and reported in the Statement of Financial Position as an asset or a liability respectively.
Notes to the financial statements forthe period ended 31 December 2015 (continued)
24Nedgroup Investments MultiFunds PLC Condensed Interim Report and Unaudited Financial Statements 2015
2. Accounting Policies (continued)g) Functional and Presentation Currency
The functional currencies reflect the currencies of the primary economic environment in which the Funds and the Company operate. The presentation currency of the Growth MultiFund and the Balanced MultiFund is USD. The presentation currency of the Income MultiFund is GBP. The functional currency of the Company is USD. The Directors have chosen to present the results for the Company in GBP.
For the purpose of aggregating the financial statements of the Funds, the Statement of Financial Position figures for the Growth MultiFund and the Balanced MultiFund have been translated to GBP at the exchange rate at the period end, while the Statement of Comprehensive Income, Statement of Changes in Net Assets Attributable to Holders of Redeemable Participating Shares and the Statement of Cash Flows figures for the Growth MultiFund and the Balanced MultiFund have been translated to GBP at the average exchange rate for the period. The resulting gain or loss that arises at Company level has no effect on the Net Asset Value per share attributable to the individual Funds.
h) Foreign Currencies
Foreign currency transactions are recorded at the rate of exchange prevailing at the date of the transaction. Monetary assets and liabilities denominated in foreign currencies are translated into GBP at the exchange rate prevailing at the period end date. Non-monetary assets and liabilities denominated in foreign currencies that are measured at fair value are translated into GBP at the exchange rate at the date that the fair value was determined. Foreign currency exchange differences arising on translation and realised gains and losses on disposals or settlements of monetary assets and liabilities are recognised in the Statement of Comprehensive Income. Foreign currency exchange differences relating to investments at fair value through the profit or loss and derivative financial instruments are included in realised gains and losses on investments and realised and unrealised gains and losses on forward foreign currency exchange contracts, respectively.
i) Redeemable Shares
All redeemable shares issued by a Fund provide the investors with the right to require redemption for cash at the value proportionate to the investor’s share in the Fund’s net assets at the redemption date. Such instruments give rise to a financial liability for the present value of the redemption amount. In accordance with the Prospectus, each Fund is contractually obliged to redeem shares at the Net Asset Value per share on the relevant dealing day less any duties and charges. The carrying amount of redeemable shares approximates fair value.
j) Distributions
Distributions to holders of redeemable participating shares are recognised in the Statement of Comprehensive Income as finance costs when they are authorised and no longer at the discretion of the Fund.
k) Transaction Costs
Transaction costs are accounted for as of the date securities are purchased or sold and are included in the Statement of Comprehensive Income. Transaction costs include fees and commissions paid to agents (including employees acting as selling agents), advisers, brokers and dealers, levies by regulatory agencies and securities exchanges and transfer taxes and duties. Transaction costs do not include debt premiums or discounts, financing costs or internal administrative costs.
l) Withholding Tax Expense
The Company is exempt from paying income taxes under the current system of taxation in Ireland. Certain dividend and interest income received by the Funds is subject to withholding tax imposed in the country of origin.
Notes to the financial statements forthe period ended 31 December 2015 (continued)
25Nedgroup Investments MultiFunds PLC Condensed Interim Report and Unaudited Financial Statements 2015
3. Balances due from/to Broker Margin accounts represent cash deposits with brokers, transferred as collateral against open derivative contracts.
The Funds may use brokers to transact derivatives transactions, including those with central counterparties.
In accordance with the Company’s policy of trade-date accounting for regular-way sale and purchase transactions, sale/purchase transactions awaiting settlement represent amounts receivable/payable to securities sold/purchased but not yet settled as at the reporting date.
Balances due from and to broker for each of the Sub-Funds as at 31 December 2015 and 30 June 2015 are detailed in the Statement of Financial Position on pages 15 and 16 respectively.
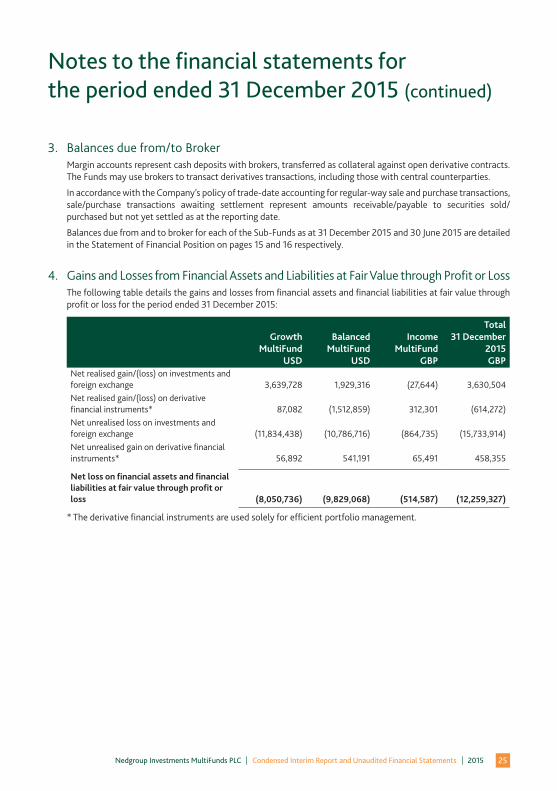
4. Gains and Losses from Financial Assets and Liabilities at Fair Value through Profit or Loss The following table details the gains and losses from financial assets and financial liabilities at fair value through
profit or loss for the period ended 31 December 2015:
GrowthMultiFund
USD
Balanced MultiFund
USD
IncomeMultiFund
GBP
Total31 December
2015GBP
Net realised gain/(loss) on investments and foreign exchange 3,639,728 1,929,316 (27,644) 3,630,504Net realised gain/(loss) on derivative financial instruments* 87,082 (1,512,859) 312,301 (614,272)Net unrealised loss on investments and foreign exchange (11,834,438) (10,786,716) (864,735) (15,733,914)Net unrealised gain on derivative financial instruments* 56,892 541,191 65,491 458,355
Net loss on financial assets and financial liabilities at fair value through profit or loss (8,050,736) (9,829,068) (514,587) (12,259,327)
* The derivative financial instruments are used solely for efficient portfolio management.
Notes to the financial statements forthe period ended 31 December 2015 (continued)

26Nedgroup Investments MultiFunds PLC Condensed Interim Report and Unaudited Financial Statements 2015
4. Gains and Losses from Financial Assets and Liabilities at Fair Value through Profit or Loss (continued)
The following table details the gains and losses from financial assets and financial liabilities at fair value through profit or loss for the period ended 31 December 2014:
GrowthMultiFund
USD
Balanced MultiFund
USD
IncomeMultiFund
GBP
Total31 December
2014GBP
Net realised gain on investments and foreign exchange 9,506,371 6,403,077 59,207 9,904,820Net realised (loss)/gain on derivative financial instruments* (8,028) (1,518,608) 361,933 (582,831)Net unrealised (loss) on investments and foreign exchange (12,411,240) (10,725,644) (195,068) (14,513,404)Net unrealised gain/(loss) on derivative financial instruments* 811,992 1,253,271 (2,231) 1,275,865
Net (loss)/gain on financial assets and financial liabilities at fair value through profit or loss (2,100,905) (4,587,904) 223,841 (3,915,550)
*The derivative financial instruments are used solely for efficient portfolio management.
5. Taxation Under current law and practice, the Company qualifies as an investment undertaking as defined in Section 739B
of the Taxes Consolidation Act, 1997, as amended. On this basis, it is generally not chargeable to Irish tax on its income or gains.
However, Irish tax can arise on the happening of a “chargeable event” in the Company. A chargeable event includes any payments of distributions to shareholders, any encashment, repurchase, redemption, cancellation or transfer of shares and any deemed disposal of shares as described below for Irish tax purposes arising as a result of holding shares in the Company for a period of eight years or more. Where a chargeable event occurs, the Company is required to account for the Irish tax thereon.
No Irish tax will arise on the Company in respect of chargeable events where:
(a) a shareholder who is not Irish resident nor ordinarily resident in Ireland at the time of the chargeable event, provided the necessary signed statutory declarations are held by the Company; or
(b) certain exempted Irish resident investors who have provided the Company with the necessary signed statutory declarations; or
(c) any transactions in relation to shares held in a recognised clearing system as designated by order of the Revenue Commissioners of Ireland; or
(d) an exchange of shares representing one Fund for another Fund of the Company; or
Notes to the financial statements forthe period ended 31 December 2015 (continued)
27Nedgroup Investments MultiFunds PLC Condensed Interim Report and Unaudited Financial Statements 2015
5. Taxation (continued)
(e) an exchange of shares arising on a qualifying amalgamation or reconstruction of the Company with another company; or
(f) certain exchanges of shares between spouses and former spouses.
In the absence of an appropriate declaration, the Company will be liable to Irish tax on the occurrence of a chargeable event.
There were no chargeable events during the period under review. Dividends, interest and capital gains (if any) received on investments made by the Company may be subject to withholding taxes imposed by the country of origin and such taxes may not be recoverable by the Company or its shareholders.
6. Directors’ & Related Parties’ Interests
Connected Party Transactions Regulation 41 of the UCITS Regulations “restrictions of transactions with connected persons” states that “a
responsible person shall ensure that any transaction between a UCITS and a connected person is conducted a) at arm’s length; and b) in the best interest of the unitholders of the UCITS”.
As required under UCITS Regulation 78.4, the Directors, as responsible persons are satisfied that there are in place arrangements, evidenced by written procedures, to ensure that the obligations that are prescribed by Regulation 41(1) are applied to all transactions with a connected party; and all transactions with a connected parties that were entered into during the period to which the report relates complied with the obligations that are prescribed by Regulation 41(1).
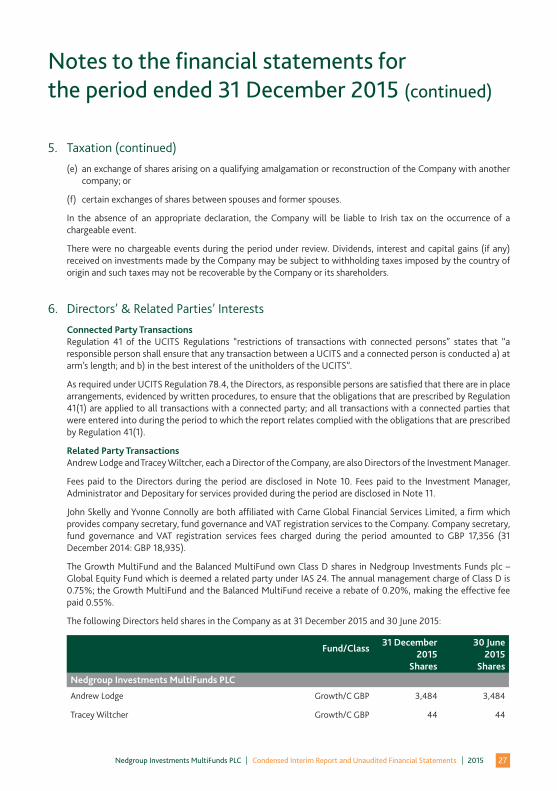
Related Party Transactions Andrew Lodge and Tracey Wiltcher, each a Director of the Company, are also Directors of the Investment Manager.
Fees paid to the Directors during the period are disclosed in Note 10. Fees paid to the Investment Manager, Administrator and Depositary for services provided during the period are disclosed in Note 11.
John Skelly and Yvonne Connolly are both affiliated with Carne Global Financial Services Limited, a firm which provides company secretary, fund governance and VAT registration services to the Company. Company secretary, fund governance and VAT registration services fees charged during the period amounted to GBP 17,356 (31 December 2014: GBP 18,935).
The Growth MultiFund and the Balanced MultiFund own Class D shares in Nedgroup Investments Funds plc – Global Equity Fund which is deemed a related party under IAS 24. The annual management charge of Class D is 0.75%; the Growth MultiFund and the Balanced MultiFund receive a rebate of 0.20%, making the effective fee paid 0.55%.
The following Directors held shares in the Company as at 31 December 2015 and 30 June 2015:
Fund/Class31 December
2015Shares
30 June2015
SharesNedgroup Investments MultiFunds PLC
Andrew Lodge Growth/C GBP 3,484 3,484
Tracey Wiltcher Growth/C GBP 44 44
Notes to the financial statements forthe period ended 31 December 2015 (continued)

28Nedgroup Investments MultiFunds PLC Condensed Interim Report and Unaudited Financial Statements 2015
7. Share Capital
The Company was incorporated as a public limited liability company in the Isle of Man on 28 August 2001. The Company was incorporated with unlimited duration under the provisions of the Companies Acts, 1931-1993 of the Isle of Man. On 24 April 2009, the Company re-registered as a company limited by shares pursuant to the provisions of the Companies Act, 2006 of the Isle of Man.
The Company was registered (by way of continuation) in Ireland under the Companies Acts as an open-ended umbrella investment company with variable capital and with segregated liability between Sub-Funds on 19 August 2011. At the date hereof, the authorised share capital of the Company is 100 subscriber shares of 1 EUR each and 1,000,000,000 shares of no par value initially designated as unclassified shares. The subscriber shares entitle the shareholders holding them to attend and vote at all meetings of the Company. The subscriber shares do not entitle the holders to participate in the dividends or net assets of any Fund. The Company’s capital currently meets the EUR 300,000 capital required to establish a self-regulated investment company under the UCITS Regulations.
The following share classes are currently active:
• GrowthMultiFundClassAGBP–Accumulating(Hedged)
• GrowthMultiFundClassAUSD–Accumulating
• GrowthMultiFundClassBGBP–Accumulating(Hedged)
• GrowthMultiFundClassBUSD–Accumulating
• GrowthMultiFundClassCGBP–Accumulating(Hedged)
• GrowthMultiFundClassCUSD–Accumulating
• BalancedMultiFundClassAGBP–Accumulating(Hedged)
• BalancedMultiFundClassAUSD–Accumulating
• BalancedMultiFundClassBGBP–Accumulating(Hedged)
• BalancedMultiFundClassBUSD–Accumulating
• BalancedMultiFundClassCGBP–Accumulating(Hedged)
• BalancedMultiFundClassCUSD–Accumulating
• IncomeMultiFundClassAGBP–Accumulating
• IncomeMultiFundClassAUSD–Accumulating(Hedged)
• IncomeMultiFundClassAGBP–Distributing
• IncomeMultiFundClassBGBP–Accumulating
• IncomeMultiFundClassBUSD–Accumulating(Hedged)
• IncomeMultiFundClassBGBP–Distributing
• IncomeMultiFundClassCGBP–Accumulating
• IncomeMultiFundClassCUSD–Accumulating(Hedged)*
• IncomeMultiFundClassCGBP–Distributing
* First subscriptions were made on 16 October 2015.
Notes to the financial statements forthe period ended 31 December 2015 (continued)
29Nedgroup Investments MultiFunds PLC Condensed Interim Report and Unaudited Financial Statements 2015
7. Share Capital (continued)
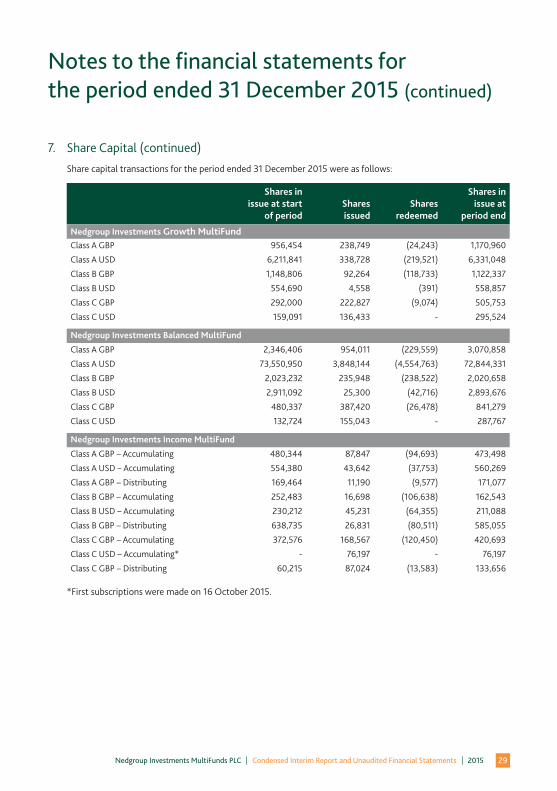
Share capital transactions for the period ended 31 December 2015 were as follows:
Shares in issue at start
of periodSharesissued
Sharesredeemed
Shares in issue at
period end
Nedgroup Investments Growth MultiFundClass A GBP 956,454 238,749 (24,243) 1,170,960
Class A USD 6,211,841 338,728 (219,521) 6,331,048
Class B GBP 1,148,806 92,264 (118,733) 1,122,337
Class B USD 554,690 4,558 (391) 558,857
Class C GBP 292,000 222,827 (9,074) 505,753
Class C USD 159,091 136,433 - 295,524
Nedgroup Investments Balanced MultiFund
Class A GBP 2,346,406 954,011 (229,559) 3,070,858
Class A USD 73,550,950 3,848,144 (4,554,763) 72,844,331
Class B GBP 2,023,232 235,948 (238,522) 2,020,658
Class B USD 2,911,092 25,300 (42,716) 2,893,676
Class C GBP 480,337 387,420 (26,478) 841,279
Class C USD 132,724 155,043 - 287,767
Nedgroup Investments Income MultiFund
Class A GBP – Accumulating 480,344 87,847 (94,693) 473,498
Class A USD – Accumulating 554,380 43,642 (37,753) 560,269
Class A GBP – Distributing 169,464 11,190 (9,577) 171,077
Class B GBP – Accumulating 252,483 16,698 (106,638) 162,543
Class B USD – Accumulating 230,212 45,231 (64,355) 211,088
Class B GBP – Distributing 638,735 26,831 (80,511) 585,055
Class C GBP – Accumulating 372,576 168,567 (120,450) 420,693
Class C USD – Accumulating* - 76,197 - 76,197
Class C GBP – Distributing 60,215 87,024 (13,583) 133,656
*First subscriptions were made on 16 October 2015.
Notes to the financial statements forthe period ended 31 December 2015 (continued)
30Nedgroup Investments MultiFunds PLC Condensed Interim Report and Unaudited Financial Statements 2015
7. Share Capital (continued)
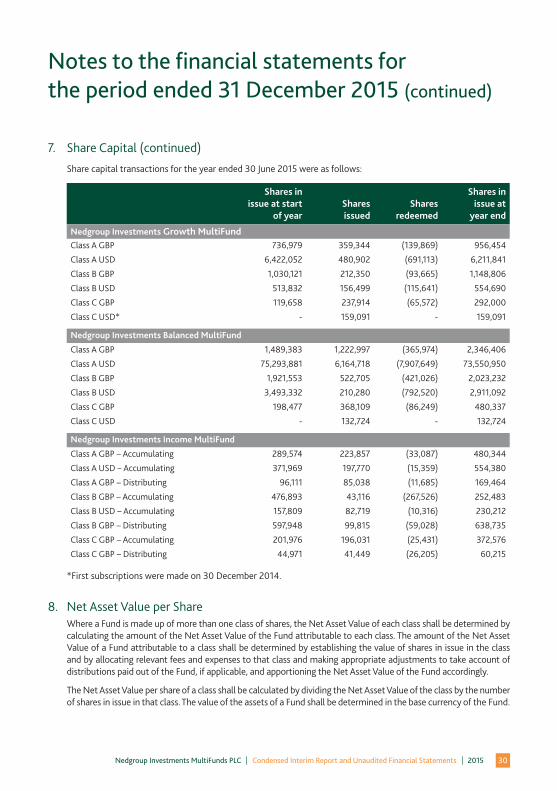
Share capital transactions for the year ended 30 June 2015 were as follows:
Shares in issue at start
of yearSharesissued
Sharesredeemed
Shares in issue at
year end
Nedgroup Investments Growth MultiFundClass A GBP 736,979 359,344 (139,869) 956,454
Class A USD 6,422,052 480,902 (691,113) 6,211,841
Class B GBP 1,030,121 212,350 (93,665) 1,148,806
Class B USD 513,832 156,499 (115,641) 554,690
Class C GBP 119,658 237,914 (65,572) 292,000
Class C USD* - 159,091 - 159,091
Nedgroup Investments Balanced MultiFund
Class A GBP 1,489,383 1,222,997 (365,974) 2,346,406
Class A USD 75,293,881 6,164,718 (7,907,649) 73,550,950
Class B GBP 1,921,553 522,705 (421,026) 2,023,232
Class B USD 3,493,332 210,280 (792,520) 2,911,092
Class C GBP 198,477 368,109 (86,249) 480,337
Class C USD - 132,724 - 132,724
Nedgroup Investments Income MultiFund
Class A GBP – Accumulating 289,574 223,857 (33,087) 480,344
Class A USD – Accumulating 371,969 197,770 (15,359) 554,380
Class A GBP – Distributing 96,111 85,038 (11,685) 169,464
Class B GBP – Accumulating 476,893 43,116 (267,526) 252,483
Class B USD – Accumulating 157,809 82,719 (10,316) 230,212
Class B GBP – Distributing 597,948 99,815 (59,028) 638,735
Class C GBP – Accumulating 201,976 196,031 (25,431) 372,576
Class C GBP – Distributing 44,971 41,449 (26,205) 60,215
*First subscriptions were made on 30 December 2014.
8. Net Asset Value per Share Where a Fund is made up of more than one class of shares, the Net Asset Value of each class shall be determined by
calculating the amount of the Net Asset Value of the Fund attributable to each class. The amount of the Net Asset Value of a Fund attributable to a class shall be determined by establishing the value of shares in issue in the class and by allocating relevant fees and expenses to that class and making appropriate adjustments to take account of distributions paid out of the Fund, if applicable, and apportioning the Net Asset Value of the Fund accordingly.
The Net Asset Value per share of a class shall be calculated by dividing the Net Asset Value of the class by the number of shares in issue in that class. The value of the assets of a Fund shall be determined in the base currency of the Fund.
Notes to the financial statements forthe period ended 31 December 2015 (continued)
31Nedgroup Investments MultiFunds PLC Condensed Interim Report and Unaudited Financial Statements 2015
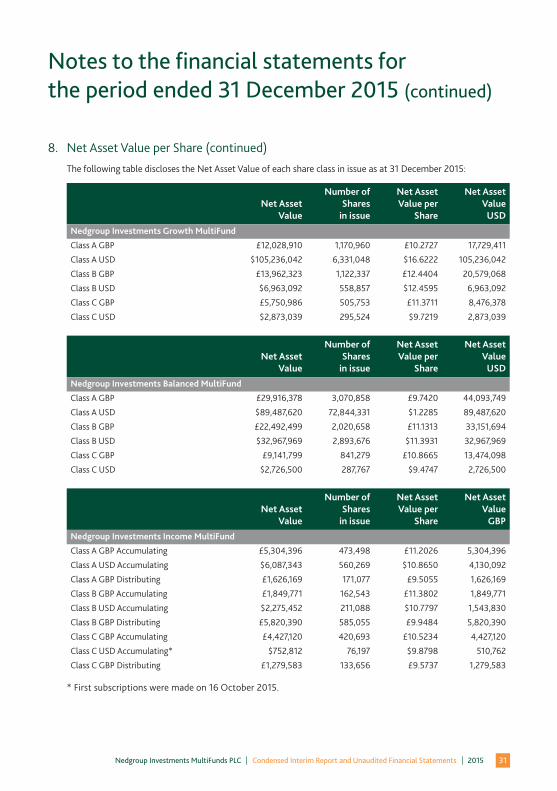
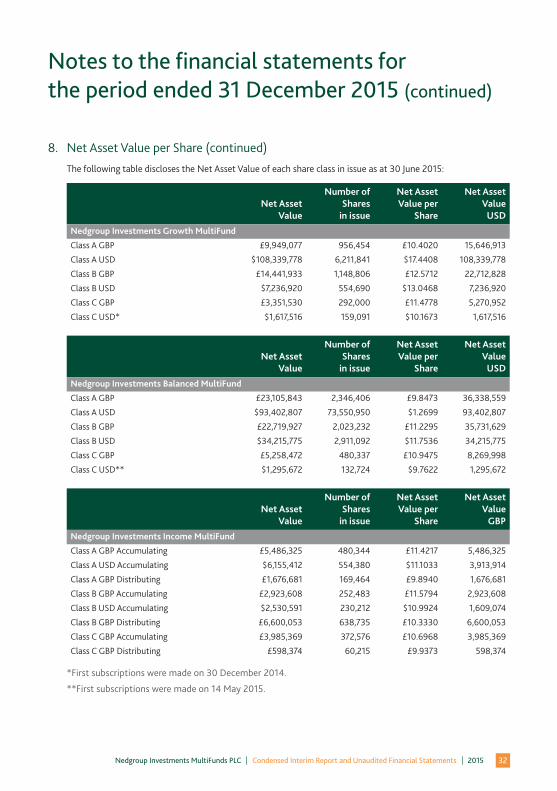
8. Net Asset Value per Share (continued)
The following table discloses the Net Asset Value of each share class in issue as at 31 December 2015:
Net AssetValue
Number of Shares
in issue
Net Asset Value per
Share
Net Asset Value
USD
Nedgroup Investments Growth MultiFund
Class A GBP £12,028,910 1,170,960 £10.2727 17,729,411
Class A USD $105,236,042 6,331,048 $16.6222 105,236,042
Class B GBP £13,962,323 1,122,337 £12.4404 20,579,068
Class B USD $6,963,092 558,857 $12.4595 6,963,092
Class C GBP £5,750,986 505,753 £11.3711 8,476,378
Class C USD $2,873,039 295,524 $9.7219 2,873,039
Net AssetValue
Number of Shares
in issue
Net Asset Value per
Share
Net Asset Value
USD
Nedgroup Investments Balanced MultiFund
Class A GBP £29,916,378 3,070,858 £9.7420 44,093,749
Class A USD $89,487,620 72,844,331 $1.2285 89,487,620
Class B GBP £22,492,499 2,020,658 £11.1313 33,151,694
Class B USD $32,967,969 2,893,676 $11.3931 32,967,969
Class C GBP £9,141,799 841,279 £10.8665 13,474,098
Class C USD $2,726,500 287,767 $9.4747 2,726,500
Net AssetValue
Number of Shares
in issue
Net Asset Value per
Share
Net Asset Value
GBP
Nedgroup Investments Income MultiFund
Class A GBP Accumulating £5,304,396 473,498 £11.2026 5,304,396
Class A USD Accumulating $6,087,343 560,269 $10.8650 4,130,092
Class A GBP Distributing £1,626,169 171,077 £9.5055 1,626,169
Class B GBP Accumulating £1,849,771 162,543 £11.3802 1,849,771
Class B USD Accumulating $2,275,452 211,088 $10.7797 1,543,830
Class B GBP Distributing £5,820,390 585,055 £9.9484 5,820,390
Class C GBP Accumulating £4,427,120 420,693 £10.5234 4,427,120
Class C USD Accumulating* $752,812 76,197 $9.8798 510,762
Class C GBP Distributing £1,279,583 133,656 £9.5737 1,279,583
* First subscriptions were made on 16 October 2015.
Notes to the financial statements forthe period ended 31 December 2015 (continued)
32Nedgroup Investments MultiFunds PLC Condensed Interim Report and Unaudited Financial Statements 2015
8. Net Asset Value per Share (continued)
The following table discloses the Net Asset Value of each share class in issue as at 30 June 2015:
Net AssetValue
Number of Shares
in issue
Net Asset Value per
Share
Net Asset Value
USD
Nedgroup Investments Growth MultiFund
Class A GBP £9,949,077 956,454 £10.4020 15,646,913
Class A USD $108,339,778 6,211,841 $17.4408 108,339,778
Class B GBP £14,441,933 1,148,806 £12.5712 22,712,828
Class B USD $7,236,920 554,690 $13.0468 7,236,920
Class C GBP £3,351,530 292,000 £11.4778 5,270,952
Class C USD* $1,617,516 159,091 $10.1673 1,617,516
Net AssetValue
Number of Shares
in issue
Net Asset Value per
Share
Net Asset Value
USD
Nedgroup Investments Balanced MultiFund
Class A GBP £23,105,843 2,346,406 £9.8473 36,338,559
Class A USD $93,402,807 73,550,950 $1.2699 93,402,807
Class B GBP £22,719,927 2,023,232 £11.2295 35,731,629
Class B USD $34,215,775 2,911,092 $11.7536 34,215,775
Class C GBP £5,258,472 480,337 £10.9475 8,269,998
Class C USD** $1,295,672 132,724 $9.7622 1,295,672
Net AssetValue
Number of Shares
in issue
Net Asset Value per
Share
Net Asset Value
GBP
Nedgroup Investments Income MultiFund
Class A GBP Accumulating £5,486,325 480,344 £11.4217 5,486,325
Class A USD Accumulating $6,155,412 554,380 $11.1033 3,913,914
Class A GBP Distributing £1,676,681 169,464 £9.8940 1,676,681
Class B GBP Accumulating £2,923,608 252,483 £11.5794 2,923,608
Class B USD Accumulating $2,530,591 230,212 $10.9924 1,609,074
Class B GBP Distributing £6,600,053 638,735 £10.3330 6,600,053
Class C GBP Accumulating £3,985,369 372,576 £10.6968 3,985,369
Class C GBP Distributing £598,374 60,215 £9.9373 598,374
*First subscriptions were made on 30 December 2014.
**First subscriptions were made on 14 May 2015.
Notes to the financial statements forthe period ended 31 December 2015 (continued)
33Nedgroup Investments MultiFunds PLC Condensed Interim Report and Unaudited Financial Statements 2015
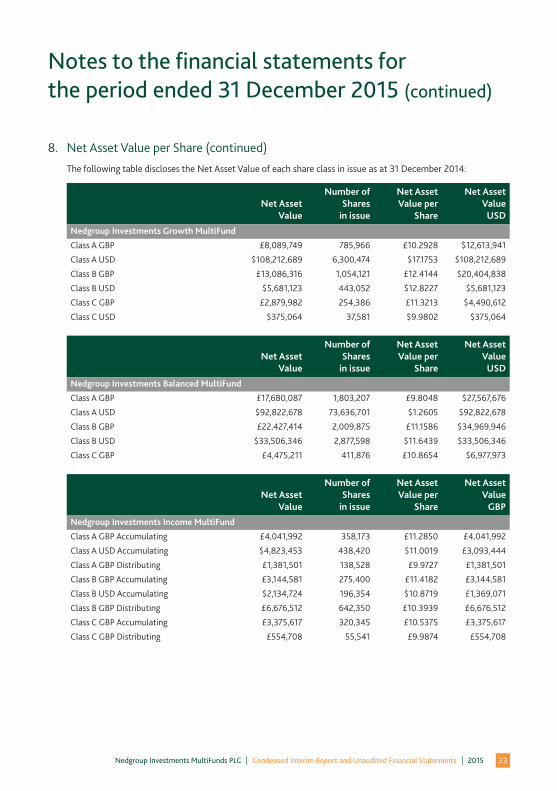
8. Net Asset Value per Share (continued)
The following table discloses the Net Asset Value of each share class in issue as at 31 December 2014:
Net AssetValue
Number of Shares
in issue
Net Asset Value per
Share
Net Asset Value
USD
Nedgroup Investments Growth MultiFund
Class A GBP £8,089,749 785,966 £10.2928 $12,613,941
Class A USD $108,212,689 6,300,474 $17.1753 $108,212,689
Class B GBP £13,086,316 1,054,121 £12.4144 $20,404,838
Class B USD $5,681,123 443,052 $12.8227 $5,681,123
Class C GBP £2,879,982 254,386 £11.3213 $4,490,612
Class C USD $375,064 37,581 $9.9802 $375,064
Net AssetValue
Number of Shares
in issue
Net Asset Value per
Share
Net Asset Value
USD
Nedgroup Investments Balanced MultiFund
Class A GBP £17,680,087 1,803,207 £9.8048 $27,567,676
Class A USD $92,822,678 73,636,701 $1.2605 $92,822,678
Class B GBP £22,427,414 2,009,875 £11.1586 $34,969,946
Class B USD $33,506,346 2,877,598 $11.6439 $33,506,346
Class C GBP £4,475,211 411,876 £10.8654 $6,977,973
Net AssetValue
Number of Shares
in issue
Net Asset Value per
Share
Net Asset Value
GBP
Nedgroup Investments Income MultiFund
Class A GBP Accumulating £4,041,992 358,173 £11.2850 £4,041,992
Class A USD Accumulating $4,823,453 438,420 $11.0019 £3,093,444
Class A GBP Distributing £1,381,501 138,528 £9.9727 £1,381,501
Class B GBP Accumulating £3,144,581 275,400 £11.4182 £3,144,581
Class B USD Accumulating $2,134,724 196,354 $10.8719 £1,369,071
Class B GBP Distributing £6,676,512 642,350 £10.3939 £6,676,512
Class C GBP Accumulating £3,375,617 320,345 £10.5375 £3,375,617
Class C GBP Distributing £554,708 55,541 £9.9874 £554,708
Notes to the financial statements forthe period ended 31 December 2015 (continued)
34Nedgroup Investments MultiFunds PLC Condensed Interim Report and Unaudited Financial Statements 2015
9. Cash at Bank
All cash balances and overdrafts are held with Citibank N.A. in the name of Citi Depositary Services Ireland Limited, as Depositary. Citi Depositary Services Ireland Limited’s credit rating as at 31 December 2015 was A1 (30 June 2015: A1) (Ratings Source: Moody’s Long Term).
Cash and demand balances at bank held by each of the Sub-Funds as at 31 December 2015 and 30 June 2015 are detailed in the Statement of Financial Position on pages 15 and 16 respectively.
10. Directors’ Remuneration The Directors are entitled to a fee by way of remuneration for their services at a rate to be determined from time
to time by the Directors. Those Directors who are not associated with the Investment Manager will be entitled to remuneration for their services as Directors provided however that the aggregate emoluments of such Directors in each financial year shall not exceed €45,000 (excluding VAT).
In addition, all of the Directors will be entitled to be reimbursed out of the assets of each Fund for their reasonable out-of-pocket expenses incurred in discharging their duties as Directors. Directors’ remuneration for the period amounted to GBP 14,286 (31 December 2014: GBP 15,633) with GBP 238 payable at period end (30 June 2015: GBP 12,906).
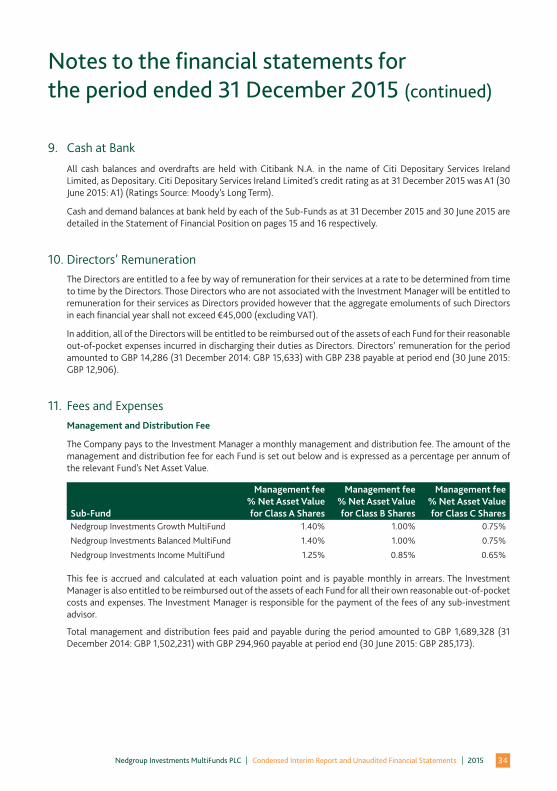
11. Fees and Expenses Management and Distribution Fee
The Company pays to the Investment Manager a monthly management and distribution fee. The amount of the management and distribution fee for each Fund is set out below and is expressed as a percentage per annum of the relevant Fund’s Net Asset Value.
Sub-Fund
Management fee% Net Asset Valuefor Class A Shares
Management fee% Net Asset Valuefor Class B Shares
Management fee% Net Asset Valuefor Class C Shares
Nedgroup Investments Growth MultiFund 1.40% 1.00% 0.75%
Nedgroup Investments Balanced MultiFund 1.40% 1.00% 0.75%
Nedgroup Investments Income MultiFund 1.25% 0.85% 0.65%
This fee is accrued and calculated at each valuation point and is payable monthly in arrears. The Investment Manager is also entitled to be reimbursed out of the assets of each Fund for all their own reasonable out-of-pocket costs and expenses. The Investment Manager is responsible for the payment of the fees of any sub-investment advisor.
Total management and distribution fees paid and payable during the period amounted to GBP 1,689,328 (31 December 2014: GBP 1,502,231) with GBP 294,960 payable at period end (30 June 2015: GBP 285,173).
Notes to the financial statements forthe period ended 31 December 2015 (continued)
35Nedgroup Investments MultiFunds PLC Condensed Interim Report and Unaudited Financial Statements 2015
11. Fees and Expenses (continued)
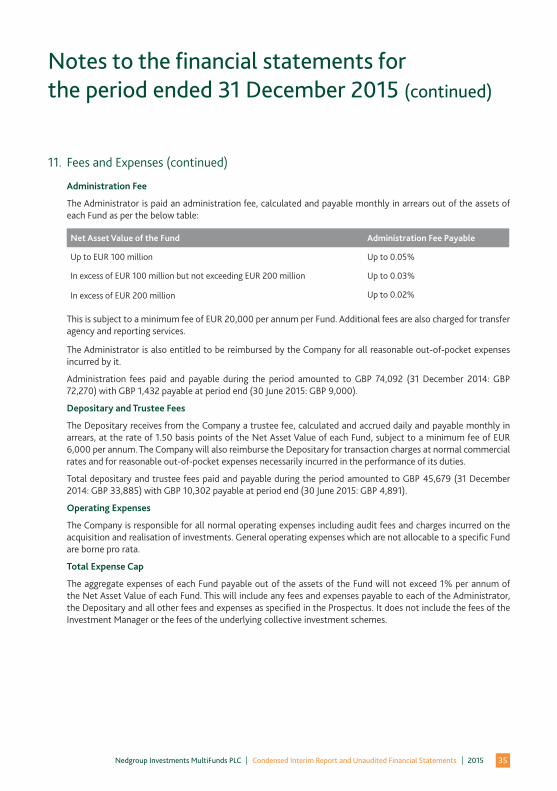
Administration Fee
The Administrator is paid an administration fee, calculated and payable monthly in arrears out of the assets of each Fund as per the below table:
Net Asset Value of the Fund Administration Fee Payable
Up to EUR 100 million Up to 0.05%
In excess of EUR 100 million but not exceeding EUR 200 million Up to 0.03%
In excess of EUR 200 million Up to 0.02%
This is subject to a minimum fee of EUR 20,000 per annum per Fund. Additional fees are also charged for transfer agency and reporting services.
The Administrator is also entitled to be reimbursed by the Company for all reasonable out-of-pocket expenses incurred by it.
Administration fees paid and payable during the period amounted to GBP 74,092 (31 December 2014: GBP 72,270) with GBP 1,432 payable at period end (30 June 2015: GBP 9,000).
Depositary and Trustee Fees
The Depositary receives from the Company a trustee fee, calculated and accrued daily and payable monthly in arrears, at the rate of 1.50 basis points of the Net Asset Value of each Fund, subject to a minimum fee of EUR 6,000 per annum. The Company will also reimburse the Depositary for transaction charges at normal commercial rates and for reasonable out-of-pocket expenses necessarily incurred in the performance of its duties.
Total depositary and trustee fees paid and payable during the period amounted to GBP 45,679 (31 December 2014: GBP 33,885) with GBP 10,302 payable at period end (30 June 2015: GBP 4,891).
Operating Expenses
The Company is responsible for all normal operating expenses including audit fees and charges incurred on the acquisition and realisation of investments. General operating expenses which are not allocable to a specific Fund are borne pro rata.
Total Expense Cap
The aggregate expenses of each Fund payable out of the assets of the Fund will not exceed 1% per annum of the Net Asset Value of each Fund. This will include any fees and expenses payable to each of the Administrator, the Depositary and all other fees and expenses as specified in the Prospectus. It does not include the fees of the Investment Manager or the fees of the underlying collective investment schemes.
Notes to the financial statements forthe period ended 31 December 2015 (continued)
36Nedgroup Investments MultiFunds PLC Condensed Interim Report and Unaudited Financial Statements 2015
12. Distributions
The following distributions per share were approved by the Board of Directors and the Investment Manager and were made during the period:
Income MultiFund Class A GBP Distributing Class B GBP Distributing Class C GBP Distributing31 August 2015 £0.145197 £0.150345 £0.14826530 November 2015 £0.055823 £0.058371 £0.056150
13. Financial Risk Management The investment process and other related activities expose the Company to a variety of financial risks, as
mentioned in the Prospectus and Supplements. Generally, risk management is a structured approach to managing uncertainty. It comprises a sequence of activities including: risk assessment (risk measurement and monitoring), strategies developed to manage it, mitigation of risk using managerial resources and using the commitment approach to calculate global exposure.
The main recognised risk areas are: Market Risk; Credit Risk; Liquidity Risk; Operational Risk and the Calculation of Global Exposure.
a) Market Risk
Market risk is the risk of loss arising from movements in market variables including observable variables such as interest rates, exchange rates and others that may be indirectly observable such as volatilities and correlations. The risk of price movements on securities and other obligations in tradable form resulting from risk factors and events specific to individual issuers is also considered market risk. The Funds invest primarily in shares or units of collective investment schemes. Collective investment schemes are subject to various risks in relation to their underlying investments.
Market risk is comprised of three main types of risk: Price Risk, Currency Risk and Interest Rate Risk. The concentration of market risk by type of investment is disclosed in more detail in the Schedule of Investments on pages 5 to 10.
i) Price risk
The Fund’s portfolios are exposed to market price risk. Market price risk is the risk that the value of investment holdings will fluctuate as a result of changes in market prices caused by factors specific to the security or factors affecting all securities traded in the market. These risks are monitored by the Investment Manager in pursuance of the investment objectives and policies of the Funds. Adherence to investment guidelines mitigates the risk of excessive exposure to any particular type of security or issuer.
Notes to the financial statements forthe period ended 31 December 2015 (continued)
37Nedgroup Investments MultiFunds PLC Condensed Interim Report and Unaudited Financial Statements 2015
13. Financial Risk Management (continued)
a) Market Risk (continued)
ii) Currency risk
The Funds can be exposed to currency risk as a result of investing in assets denominated in currencies other than the base currency of the Fund. Where the Investment Manager deems it necessary, this exposure to foreign currency fluctuations is mitigated by the use of forward foreign currency exchange contracts.
The Funds can also be exposed to indirect foreign currency risk where it is investing in assets which have underlying exposure to foreign currency, for example, funds which in turn invest in foreign currency denominated assets. Foreign exchange risk is an on-going consideration during the asset allocation and investment selection process.
All share classes in the Funds designated in a currency other than the base currency are partially hedged against exchange rate fluctuation risks between the designated currency of the class and the base currency.
The Investment Manager monitors the currency exposure of the underlying portfolio of each Fund by gathering data relating to each underlying collective investment scheme.
iii) Interest rate risk
The Funds can be indirectly exposed to interest rate risk through holding collective investment schemes which are themselves directly invested in interest bearing securities. Bond yields (and as a consequence, bond prices) are determined by market perception as to the appropriate level of yields given the economic background. Interest rate risk is examined by the Investment Manager using an internal monitoring system. The risk can be reduced by diversifying (investing in funds that invest in fixed income securities with different durations). The Investment Manager reviews on a regular basis the values of fixed interest rate securities in underlying investments.
b) Credit Risk
Credit risk is the risk that one party to a financial instrument will cause a financial loss for the other party by failing to discharge an obligation. This includes counterparty risk and issuer risk. The Funds hold cash and cash deposits which potentially expose the Funds to counterparty risk. The Funds also hold short-term debtors in the form of unsettled subscription amounts, unsettled securities sold, outstanding coupon and dividend amounts. The risk from these is deemed to be low. The Funds’ investments are predominantly in holdings of authorised funds. Such funds are subject to trustee/depositary oversight and as such the assets are protected from potential loss other than market movements in the value of such holdings. Investments are spread across a large number of investment management houses. Investment management reviews are frequently conducted and limits are also set on the amount that may be due from any one manager. The carrying amounts of financial assets best represent the maximum credit risk exposure at the Statement of Financial Position date.
This relates also to financial assets carried at amortised cost as they have a short-term to maturity. Substantially all of the assets of the Funds are held by Citi Depositary Services Ireland Limited. As such there is a concentration of credit risk with Citi Depositary Services Ireland Limited. Bankruptcy or insolvency of the Depositary may cause the Funds’ rights with respect to securities held by the Depositary to be delayed or limited. The Funds will be treated as a general creditor in respect of cash held. The Funds monitor their risk by monitoring the credit quality and the assets, liabilities, financial position and profit or loss of the Depositary the Funds use.
Notes to the financial statements forthe period ended 31 December 2015 (continued)
38Nedgroup Investments MultiFunds PLC Condensed Interim Report and Unaudited Financial Statements 2015
13. Financial Risk Management (continued)
c) Liquidity Risk
This is the risk that the Company will encounter difficulty in meeting obligations associated with financial liabilities. The Company is subject to cash redemptions of redeemable participating shares on each dealing day of the respective Funds. The dealing days are detailed in the Supplements to the Prospectus. It therefore invests the majority of its assets in investments that are traded in an active market and can be readily disposed of. The Funds’ underlying investments are considered readily realisable.
The Directors may at their discretion limit the number of shares of any Fund redeemed on any dealing day to shares representing 10% or more of the outstanding shares in any Fund or shares representing 10% or more of the total Net Asset Value of that Fund on that dealing day. In this event, the limitation will apply pro rata so that all shareholders wishing to have shares of that Fund redeemed on that dealing day realise the same proportion of such shares.
Shares not redeemed, but which would otherwise have been redeemed, will be carried forward for redemption on the next dealing day (subject always to the foregoing limit).
d) Operational Risk
Operational risk is the risk of direct or indirect loss arising from a wide variety of causes associated with the processes, technology and infrastructure supporting the Company’s activities with financial instruments, either internally within the Company or externally at the Company’s service providers, and from external factors other than credit, market and liquidity risks such as those arising from legal and regulatory requirements and generally accepted standards of investment management behaviour.
The Company’s objective is to manage operational risk so as to balance the limiting of financial losses and damage to its reputation with achieving its investment objective of generating returns to investors.
The primary responsibility for the development and implementation of controls over operational risk rests with the Board of Directors. This responsibility is supported by the development of overall standards for the management of operational risk, which encompasses the controls and processes at the service providers and the establishment of service levels with the service providers.
The Directors’ assessment of the adequacy of the controls and processes in place at the service providers with respect to operational risk is carried out via regular discussions with the service providers.
Substantially all of the assets of the Company are held by Citi Depositary Services Ireland Limited. The bankruptcy or insolvency of the Company’s Depositary may cause the Company’s rights with respect to the securities held by the Depositary to be limited. The Investment Manager monitors the credit ratings and capital adequacy of its Depositary on a regular basis.
e) Calculation of Global Exposure
The global exposure of the assets held within each Fund is monitored on a daily basis. In accordance with the regulatory requirements, global exposure can be calculated in two ways, either:
(1) the incremental exposure generated by the instruments held by a Fund (“the commitment approach”); or
(2) where complex investment strategies are used, an advanced risk management methodology such as Value at Risk (“VaR”) will be employed.
Notes to the financial statements forthe period ended 31 December 2015 (continued)
39Nedgroup Investments MultiFunds PLC Condensed Interim Report and Unaudited Financial Statements 2015
13. Financial Risk Management (continued)
c) Calculation of Global Exposure (continued)
The Board of Directors of the Investment Manager will monitor the assets of each Fund to ensure that global exposure and leverage will, at all times, remain within the limits set by the Central Bank of Ireland. The commitment approach is used to calculate global exposure on all Funds which use derivatives.
In accordance with the commitment approach, global exposure is broadly defined as the total market value of the equivalent underlying to all of the financial derivative instruments (“FDIs”) entered into by a Fund (subject to all specific valuation rules described in the European Securities and Markets Authority guidelines).
14. Fair Value of Financial Assets and Financial Liabilities
This requires the Funds to classify fair value measurements using a fair value hierarchy that reflects the significance of the inputs used in making the measurements. The three levels of the fair value hierarchy are described below:
Level 1: Quoted prices (unadjusted) in active markets for identical securities.
Level 2: Prices determined using significant observable inputs. Observable inputs are inputs that reflect the assumptions market participants would use in pricing a security and are developed based on market data obtained from sources independent of the reporting entity (including quoted prices for similar investments, interest rates, prepayment speeds, credit risk, etc.)
Level 3: Prices determined using significant unobservable inputs. In situations where quoted prices or observable inputs are unavailable or deemed less relevant (for example, when there is little or no market activity for an investment at the end of the period), unobservable inputs are inputs that reflect the reporting entity’s own assumptions about the factors market participants would use in pricing the security and would be based on the best information available under the circumstances.
The inputs or methodology used for valuing securities are not necessarily an indication of the risk associated with investing in those securities. The level in the fair value hierarchy within which the fair value measurement is categorised in its entirety is determined on the basis of the lowest level input that is significant to the fair value measurement in its entirety. For this purpose, the significance of an input is assessed against the fair value measurement in its entirety.
Assessing the significance of a particular input to the fair value measurement in its entirety requires judgement and considering the factors specific to the asset or liability. The determination of what constitutes “observable” requires significant judgement. The Directors consider observable data to be that market data that is readily available, regularly distributed or updated, reliable and verifiable, not proprietary and provided by independent sources that are actively involved in the relevant market.
Other than financial assets at fair value through profit or loss and financial liabilities at fair value through profit or loss, all other financial instruments not measured at fair value through profit or loss are short-term financial assets and financial liabilities whose carrying amounts approximate fair value.
In accordance with IFRS 13, these financial assets and financial liabilities are classified as Level 2 apart from cash and cash equivalents which are classified as Level 1.
Notes to the financial statements forthe period ended 31 December 2015 (continued)
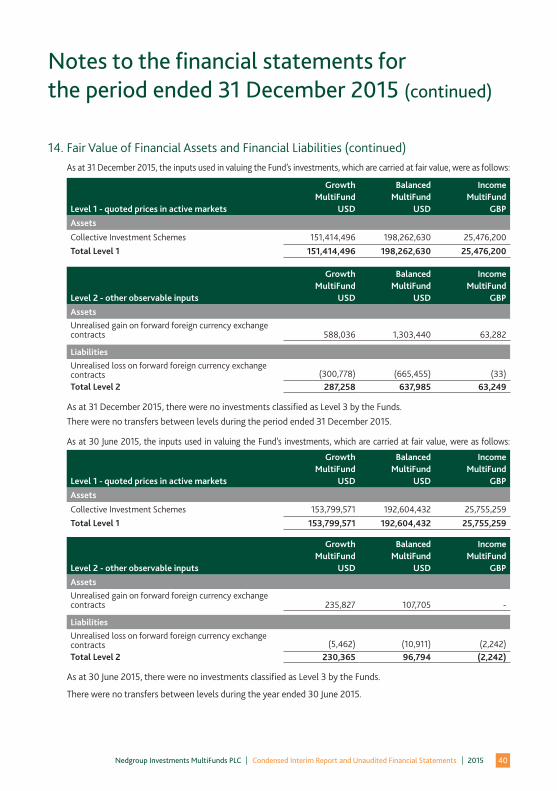
40Nedgroup Investments MultiFunds PLC Condensed Interim Report and Unaudited Financial Statements 2015
14. Fair Value of Financial Assets and Financial Liabilities (continued) As at 31 December 2015, the inputs used in valuing the Fund’s investments, which are carried at fair value, were as follows:
Level 1 - quoted prices in active markets
Growth MultiFund
USD
Balanced MultiFund
USD
IncomeMultiFund
GBP
Assets
Collective Investment Schemes 151,414,496 198,262,630 25,476,200Total Level 1 151,414,496 198,262,630 25,476,200
Level 2 - other observable inputs
Growth MultiFund
USD
Balanced MultiFund
USD
IncomeMultiFund
GBP
AssetsUnrealised gain on forward foreign currency exchange contracts 588,036 1,303,440 63,282
LiabilitiesUnrealised loss on forward foreign currency exchange contracts (300,778) (665,455) (33)Total Level 2 287,258 637,985 63,249
As at 31 December 2015, there were no investments classified as Level 3 by the Funds. There were no transfers between levels during the period ended 31 December 2015.
As at 30 June 2015, the inputs used in valuing the Fund’s investments, which are carried at fair value, were as follows:
Level 1 - quoted prices in active markets
Growth MultiFund
USD
Balanced MultiFund
USD
IncomeMultiFund
GBP
Assets
Collective Investment Schemes 153,799,571 192,604,432 25,755,259Total Level 1 153,799,571 192,604,432 25,755,259
Level 2 - other observable inputs
Growth MultiFund
USD
Balanced MultiFund
USD
IncomeMultiFund
GBP
AssetsUnrealised gain on forward foreign currency exchange contracts 235,827 107,705 -
LiabilitiesUnrealised loss on forward foreign currency exchange contracts (5,462) (10,911) (2,242)Total Level 2 230,365 96,794 (2,242)
As at 30 June 2015, there were no investments classified as Level 3 by the Funds.
There were no transfers between levels during the year ended 30 June 2015.
Notes to the financial statements forthe period ended 31 December 2015 (continued)
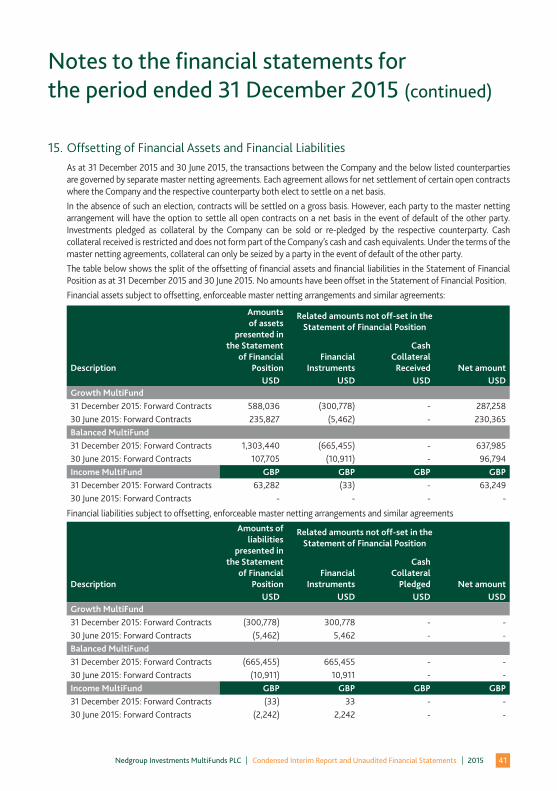
41Nedgroup Investments MultiFunds PLC Condensed Interim Report and Unaudited Financial Statements 2015
15. Offsetting of Financial Assets and Financial Liabilities As at 31 December 2015 and 30 June 2015, the transactions between the Company and the below listed counterparties
are governed by separate master netting agreements. Each agreement allows for net settlement of certain open contracts where the Company and the respective counterparty both elect to settle on a net basis.
In the absence of such an election, contracts will be settled on a gross basis. However, each party to the master netting arrangement will have the option to settle all open contracts on a net basis in the event of default of the other party. Investments pledged as collateral by the Company can be sold or re-pledged by the respective counterparty. Cash collateral received is restricted and does not form part of the Company’s cash and cash equivalents. Under the terms of the master netting agreements, collateral can only be seized by a party in the event of default of the other party.
The table below shows the split of the offsetting of financial assets and financial liabilities in the Statement of Financial Position as at 31 December 2015 and 30 June 2015. No amounts have been offset in the Statement of Financial Position.
Financial assets subject to offsetting, enforceable master netting arrangements and similar agreements:
Amounts of assets
presented in the Statement
of Financial Position
Related amounts not off-set in the Statement of Financial Position
DescriptionFinancial
Instruments
Cash Collateral
Received Net amountUSD USD USD USD
Growth MultiFund31 December 2015: Forward Contracts 588,036 (300,778) - 287,25830 June 2015: Forward Contracts 235,827 (5,462) - 230,365Balanced MultiFund31 December 2015: Forward Contracts 1,303,440 (665,455) - 637,98530 June 2015: Forward Contracts 107,705 (10,911) - 96,794Income MultiFund GBP GBP GBP GBP31 December 2015: Forward Contracts 63,282 (33) - 63,24930 June 2015: Forward Contracts - - - -
Financial liabilities subject to offsetting, enforceable master netting arrangements and similar agreementsAmounts of
liabilities presented in
the Statement of Financial
Position
Related amounts not off-set in the Statement of Financial Position
DescriptionFinancial
Instruments
Cash Collateral
Pledged Net amountUSD USD USD USD
Growth MultiFund31 December 2015: Forward Contracts (300,778) 300,778 - -30 June 2015: Forward Contracts (5,462) 5,462 - -Balanced MultiFund31 December 2015: Forward Contracts (665,455) 665,455 - -30 June 2015: Forward Contracts (10,911) 10,911 - -Income MultiFund GBP GBP GBP GBP31 December 2015: Forward Contracts (33) 33 - -30 June 2015: Forward Contracts (2,242) 2,242 - -
Notes to the financial statements forthe period ended 31 December 2015 (continued)
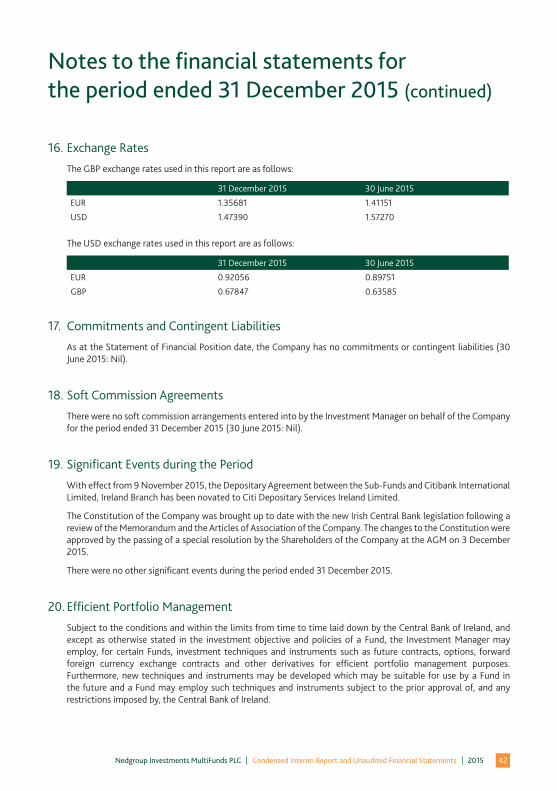
42Nedgroup Investments MultiFunds PLC Condensed Interim Report and Unaudited Financial Statements 2015
16. Exchange Rates
The GBP exchange rates used in this report are as follows:
31 December 2015 30 June 2015
EUR 1.35681 1.41151
USD 1.47390 1.57270
The USD exchange rates used in this report are as follows:
31 December 2015 30 June 2015
EUR 0.92056 0.89751
GBP 0.67847 0.63585
17. Commitments and Contingent Liabilities
As at the Statement of Financial Position date, the Company has no commitments or contingent liabilities (30 June 2015: Nil).
18. Soft Commission Agreements
There were no soft commission arrangements entered into by the Investment Manager on behalf of the Company for the period ended 31 December 2015 (30 June 2015: Nil).
19. Significant Events during the Period
With effect from 9 November 2015, the Depositary Agreement between the Sub-Funds and Citibank International Limited, Ireland Branch has been novated to Citi Depositary Services Ireland Limited.
The Constitution of the Company was brought up to date with the new Irish Central Bank legislation following a review of the Memorandum and the Articles of Association of the Company. The changes to the Constitution were approved by the passing of a special resolution by the Shareholders of the Company at the AGM on 3 December 2015.
There were no other significant events during the period ended 31 December 2015.
20. Efficient Portfolio Management
Subject to the conditions and within the limits from time to time laid down by the Central Bank of Ireland, and except as otherwise stated in the investment objective and policies of a Fund, the Investment Manager may employ, for certain Funds, investment techniques and instruments such as future contracts, options, forward foreign currency exchange contracts and other derivatives for efficient portfolio management purposes. Furthermore, new techniques and instruments may be developed which may be suitable for use by a Fund in the future and a Fund may employ such techniques and instruments subject to the prior approval of, and any restrictions imposed by, the Central Bank of Ireland.
Notes to the financial statements forthe period ended 31 December 2015 (continued)
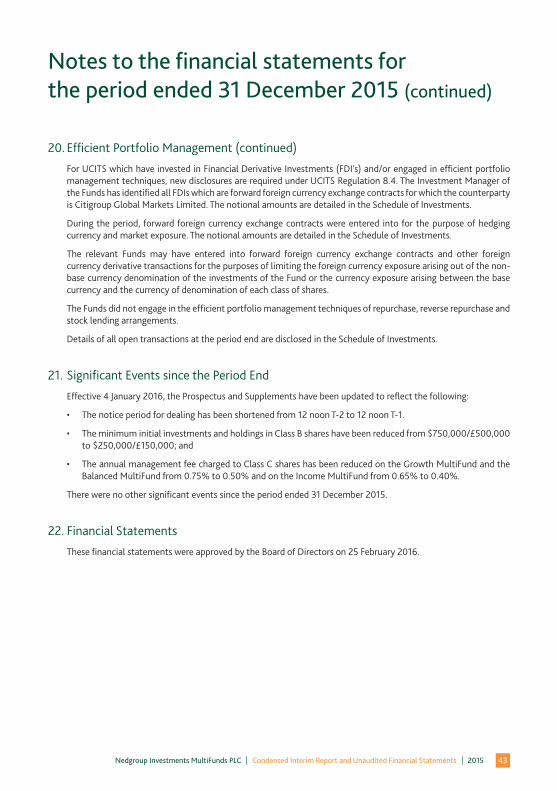
43Nedgroup Investments MultiFunds PLC Condensed Interim Report and Unaudited Financial Statements 2015
20. Efficient Portfolio Management (continued)
For UCITS which have invested in Financial Derivative Investments (FDI’s) and/or engaged in efficient portfolio management techniques, new disclosures are required under UCITS Regulation 8.4. The Investment Manager of the Funds has identified all FDIs which are forward foreign currency exchange contracts for which the counterparty is Citigroup Global Markets Limited. The notional amounts are detailed in the Schedule of Investments.
During the period, forward foreign currency exchange contracts were entered into for the purpose of hedging currency and market exposure. The notional amounts are detailed in the Schedule of Investments.
The relevant Funds may have entered into forward foreign currency exchange contracts and other foreign currency derivative transactions for the purposes of limiting the foreign currency exposure arising out of the non-base currency denomination of the investments of the Fund or the currency exposure arising between the base currency and the currency of denomination of each class of shares.
The Funds did not engage in the efficient portfolio management techniques of repurchase, reverse repurchase and stock lending arrangements.
Details of all open transactions at the period end are disclosed in the Schedule of Investments.
21. Significant Events since the Period End
Effective 4 January 2016, the Prospectus and Supplements have been updated to reflect the following:
• Thenoticeperiodfordealinghasbeenshortenedfrom12noonT-2to12noonT-1.
• TheminimuminitialinvestmentsandholdingsinClassBshareshavebeenreducedfrom$750,000/£500,000to $250,000/£150,000; and
• TheannualmanagementfeechargedtoClassCshareshasbeenreducedontheGrowthMultiFundandtheBalanced MultiFund from 0.75% to 0.50% and on the Income MultiFund from 0.65% to 0.40%.
There were no other significant events since the period ended 31 December 2015.
22. Financial Statements
These financial statements were approved by the Board of Directors on 25 February 2016.
Notes to the financial statements forthe period ended 31 December 2015 (continued)
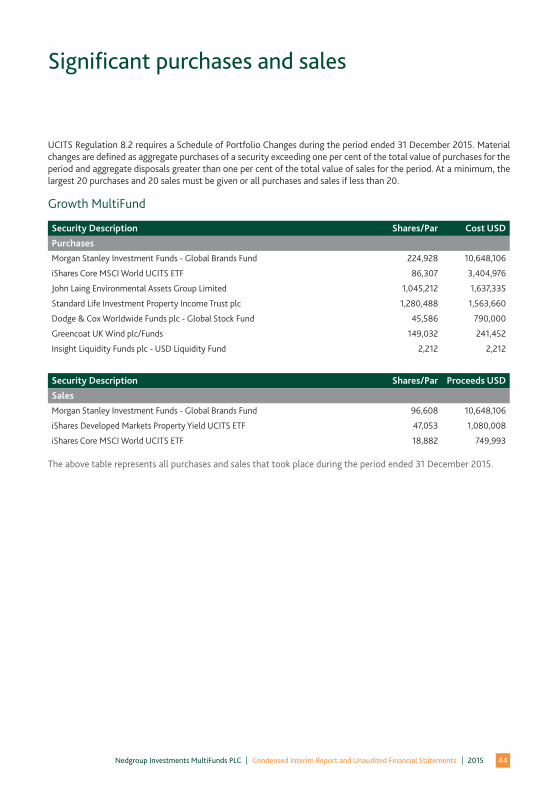
44Nedgroup Investments MultiFunds PLC Condensed Interim Report and Unaudited Financial Statements 2015
UCITS Regulation 8.2 requires a Schedule of Portfolio Changes during the period ended 31 December 2015. Material changes are defined as aggregate purchases of a security exceeding one per cent of the total value of purchases for the period and aggregate disposals greater than one per cent of the total value of sales for the period. At a minimum, the largest 20 purchases and 20 sales must be given or all purchases and sales if less than 20.
Growth MultiFund
Security Description Shares/Par Cost USD
PurchasesMorgan Stanley Investment Funds - Global Brands Fund 224,928 10,648,106
iShares Core MSCI World UCITS ETF 86,307 3,404,976
John Laing Environmental Assets Group Limited 1,045,212 1,637,335
Standard Life Investment Property Income Trust plc 1,280,488 1,563,660
Dodge & Cox Worldwide Funds plc - Global Stock Fund 45,586 790,000
Greencoat UK Wind plc/Funds 149,032 241,452
Insight Liquidity Funds plc - USD Liquidity Fund 2,212 2,212
Security Description Shares/Par Proceeds USD
SalesMorgan Stanley Investment Funds - Global Brands Fund 96,608 10,648,106
iShares Developed Markets Property Yield UCITS ETF 47,053 1,080,008
iShares Core MSCI World UCITS ETF 18,882 749,993
The above table represents all purchases and sales that took place during the period ended 31 December 2015.
Significant purchases and sales
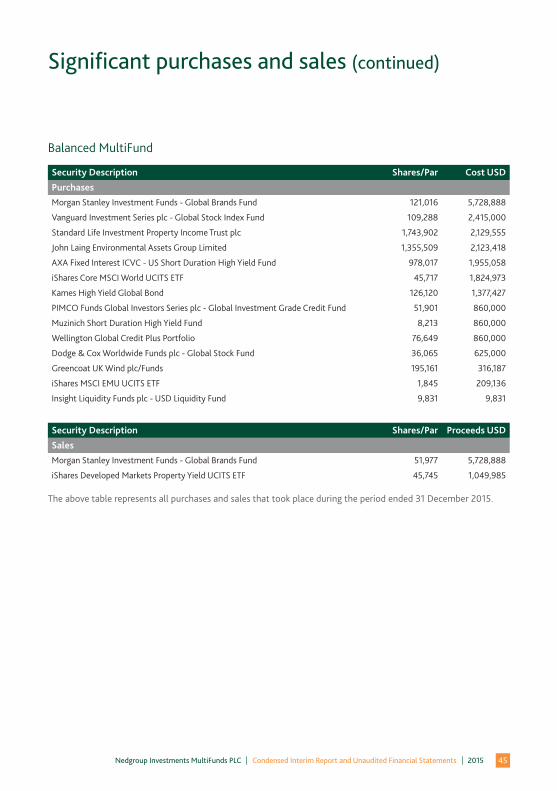
45Nedgroup Investments MultiFunds PLC Condensed Interim Report and Unaudited Financial Statements 2015
Balanced MultiFund
Security Description Shares/Par Cost USD
PurchasesMorgan Stanley Investment Funds - Global Brands Fund 121,016 5,728,888
Vanguard Investment Series plc - Global Stock Index Fund 109,288 2,415,000
Standard Life Investment Property Income Trust plc 1,743,902 2,129,555
John Laing Environmental Assets Group Limited 1,355,509 2,123,418
AXA Fixed Interest ICVC - US Short Duration High Yield Fund 978,017 1,955,058
iShares Core MSCI World UCITS ETF 45,717 1,824,973
Kames High Yield Global Bond 126,120 1,377,427
PIMCO Funds Global Investors Series plc - Global Investment Grade Credit Fund 51,901 860,000
Muzinich Short Duration High Yield Fund 8,213 860,000
Wellington Global Credit Plus Portfolio 76,649 860,000
Dodge & Cox Worldwide Funds plc - Global Stock Fund 36,065 625,000
Greencoat UK Wind plc/Funds 195,161 316,187
iShares MSCI EMU UCITS ETF 1,845 209,136
Insight Liquidity Funds plc - USD Liquidity Fund 9,831 9,831
Security Description Shares/Par Proceeds USD
SalesMorgan Stanley Investment Funds - Global Brands Fund 51,977 5,728,888
iShares Developed Markets Property Yield UCITS ETF 45,745 1,049,985
The above table represents all purchases and sales that took place during the period ended 31 December 2015.
Significant purchases and sales (continued)
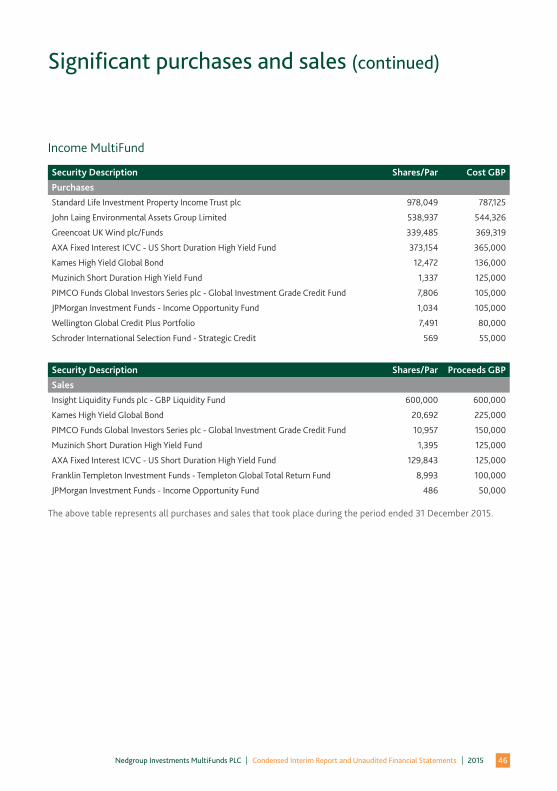
46Nedgroup Investments MultiFunds PLC Condensed Interim Report and Unaudited Financial Statements 2015
Income MultiFund
Security Description Shares/Par Cost GBP
PurchasesStandard Life Investment Property Income Trust plc 978,049 787,125
John Laing Environmental Assets Group Limited 538,937 544,326
Greencoat UK Wind plc/Funds 339,485 369,319
AXA Fixed Interest ICVC - US Short Duration High Yield Fund 373,154 365,000
Kames High Yield Global Bond 12,472 136,000
Muzinich Short Duration High Yield Fund 1,337 125,000
PIMCO Funds Global Investors Series plc - Global Investment Grade Credit Fund 7,806 105,000
JPMorgan Investment Funds - Income Opportunity Fund 1,034 105,000
Wellington Global Credit Plus Portfolio 7,491 80,000
Schroder International Selection Fund - Strategic Credit 569 55,000
Security Description Shares/Par Proceeds GBP
SalesInsight Liquidity Funds plc - GBP Liquidity Fund 600,000 600,000
Kames High Yield Global Bond 20,692 225,000
PIMCO Funds Global Investors Series plc - Global Investment Grade Credit Fund 10,957 150,000
Muzinich Short Duration High Yield Fund 1,395 125,000
AXA Fixed Interest ICVC - US Short Duration High Yield Fund 129,843 125,000
Franklin Templeton Investment Funds - Templeton Global Total Return Fund 8,993 100,000
JPMorgan Investment Funds - Income Opportunity Fund 486 50,000
The above table represents all purchases and sales that took place during the period ended 31 December 2015.
Significant purchases and sales (continued)
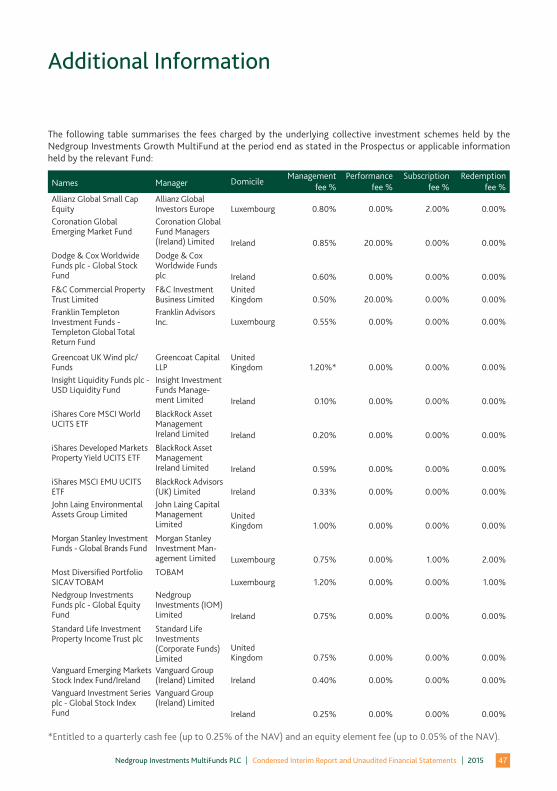
47Nedgroup Investments MultiFunds PLC Condensed Interim Report and Unaudited Financial Statements 2015
The following table summarises the fees charged by the underlying collective investment schemes held by the Nedgroup Investments Growth MultiFund at the period end as stated in the Prospectus or applicable information held by the relevant Fund:
Names Manager DomicileManagement
fee %Performance
fee %Subscription
fee %Redemption
fee %Allianz Global Small Cap Equity
Allianz Global Investors Europe Luxembourg 0.80% 0.00% 2.00% 0.00%
Coronation Global Emerging Market Fund
Coronation Global Fund Managers (Ireland) Limited Ireland 0.85% 20.00% 0.00% 0.00%
Dodge & Cox Worldwide Funds plc - Global Stock Fund
Dodge & Cox Worldwide Funds plc Ireland 0.60% 0.00% 0.00% 0.00%
F&C Commercial Property Trust Limited
F&C Investment Business Limited
United Kingdom 0.50% 20.00% 0.00% 0.00%
Franklin Templeton Investment Funds - Templeton Global Total Return Fund
Franklin Advisors Inc. Luxembourg 0.55% 0.00% 0.00% 0.00%
Greencoat UK Wind plc/Funds
Greencoat Capital LLP
United Kingdom 1.20%* 0.00% 0.00% 0.00%
Insight Liquidity Funds plc - USD Liquidity Fund
Insight Investment Funds Manage-ment Limited Ireland 0.10% 0.00% 0.00% 0.00%
iShares Core MSCI World UCITS ETF
BlackRock Asset Management Ireland Limited Ireland 0.20% 0.00% 0.00% 0.00%
iShares Developed Markets Property Yield UCITS ETF
BlackRock Asset Management Ireland Limited Ireland 0.59% 0.00% 0.00% 0.00%
iShares MSCI EMU UCITS ETF
BlackRock Advisors (UK) Limited Ireland 0.33% 0.00% 0.00% 0.00%
John Laing Environmental Assets Group Limited
John Laing Capital Management Limited
United Kingdom 1.00% 0.00% 0.00% 0.00%
Morgan Stanley Investment Funds - Global Brands Fund
Morgan Stanley Investment Man-agement Limited Luxembourg 0.75% 0.00% 1.00% 2.00%
Most Diversified Portfolio SICAV TOBAM
TOBAMLuxembourg 1.20% 0.00% 0.00% 1.00%
Nedgroup Investments Funds plc - Global Equity Fund
Nedgroup Investments (IOM) Limited Ireland 0.75% 0.00% 0.00% 0.00%
Standard Life Investment Property Income Trust plc
Standard Life Investments (Corporate Funds) Limited
United Kingdom 0.75% 0.00% 0.00% 0.00%
Vanguard Emerging Markets Stock Index Fund/Ireland
Vanguard Group (Ireland) Limited Ireland 0.40% 0.00% 0.00% 0.00%
Vanguard Investment Series plc - Global Stock Index Fund
Vanguard Group (Ireland) Limited
Ireland 0.25% 0.00% 0.00% 0.00%
*Entitled to a quarterly cash fee (up to 0.25% of the NAV) and an equity element fee (up to 0.05% of the NAV).
Additional Information
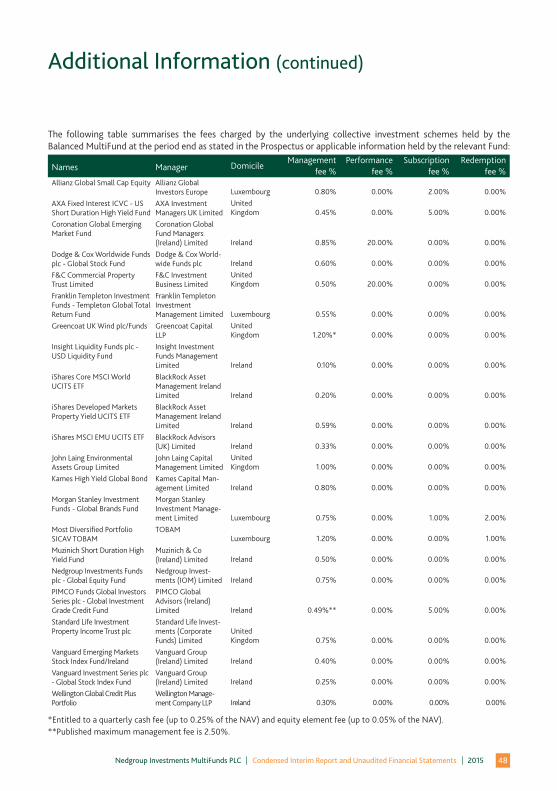
48Nedgroup Investments MultiFunds PLC Condensed Interim Report and Unaudited Financial Statements 2015
The following table summarises the fees charged by the underlying collective investment schemes held by the Balanced MultiFund at the period end as stated in the Prospectus or applicable information held by the relevant Fund:
Names Manager DomicileManagement
fee %Performance
fee %Subscription
fee %Redemption
fee %Allianz Global Small Cap Equity Allianz Global
Investors Europe Luxembourg 0.80% 0.00% 2.00% 0.00%AXA Fixed Interest ICVC - US Short Duration High Yield Fund
AXA Investment Managers UK Limited
United Kingdom 0.45% 0.00% 5.00% 0.00%
Coronation Global Emerging Market Fund
Coronation Global Fund Managers (Ireland) Limited Ireland 0.85% 20.00% 0.00% 0.00%
Dodge & Cox Worldwide Funds plc - Global Stock Fund
Dodge & Cox World-wide Funds plc Ireland 0.60% 0.00% 0.00% 0.00%
F&C Commercial Property Trust Limited
F&C Investment Business Limited
United Kingdom 0.50% 20.00% 0.00% 0.00%
Franklin Templeton Investment Funds - Templeton Global Total Return Fund
Franklin Templeton Investment Management Limited Luxembourg 0.55% 0.00% 0.00% 0.00%
Greencoat UK Wind plc/Funds Greencoat Capital LLP
United Kingdom 1.20%* 0.00% 0.00% 0.00%
Insight Liquidity Funds plc - USD Liquidity Fund
Insight Investment Funds Management Limited Ireland 0.10% 0.00% 0.00% 0.00%
iShares Core MSCI World UCITS ETF
BlackRock Asset Management Ireland Limited Ireland 0.20% 0.00% 0.00% 0.00%
iShares Developed Markets Property Yield UCITS ETF
BlackRock Asset Management Ireland Limited Ireland 0.59% 0.00% 0.00% 0.00%
iShares MSCI EMU UCITS ETF BlackRock Advisors (UK) Limited Ireland 0.33% 0.00% 0.00% 0.00%
John Laing Environmental Assets Group Limited
John Laing Capital Management Limited
United Kingdom 1.00% 0.00% 0.00% 0.00%
Kames High Yield Global Bond Kames Capital Man-agement Limited Ireland 0.80% 0.00% 0.00% 0.00%
Morgan Stanley Investment Funds - Global Brands Fund
Morgan Stanley Investment Manage-ment Limited Luxembourg 0.75% 0.00% 1.00% 2.00%
Most Diversified Portfolio SICAV TOBAM
TOBAMLuxembourg 1.20% 0.00% 0.00% 1.00%
Muzinich Short Duration High Yield Fund
Muzinich & Co (Ireland) Limited Ireland 0.50% 0.00% 0.00% 0.00%
Nedgroup Investments Funds plc - Global Equity Fund
Nedgroup Invest-ments (IOM) Limited Ireland 0.75% 0.00% 0.00% 0.00%
PIMCO Funds Global Investors Series plc - Global Investment Grade Credit Fund
PIMCO Global Advisors (Ireland) Limited Ireland 0.49%** 0.00% 5.00% 0.00%
Standard Life Investment Property Income Trust plc
Standard Life Invest-ments (Corporate Funds) Limited
United Kingdom 0.75% 0.00% 0.00% 0.00%
Vanguard Emerging Markets Stock Index Fund/Ireland
Vanguard Group (Ireland) Limited Ireland 0.40% 0.00% 0.00% 0.00%
Vanguard Investment Series plc - Global Stock Index Fund
Vanguard Group (Ireland) Limited Ireland 0.25% 0.00% 0.00% 0.00%
Wellington Global Credit Plus Portfolio
Wellington Manage-ment Company LLP Ireland 0.30% 0.00% 0.00% 0.00%
*Entitled to a quarterly cash fee (up to 0.25% of the NAV) and equity element fee (up to 0.05% of the NAV).**Published maximum management fee is 2.50%.
Additional Information (continued)
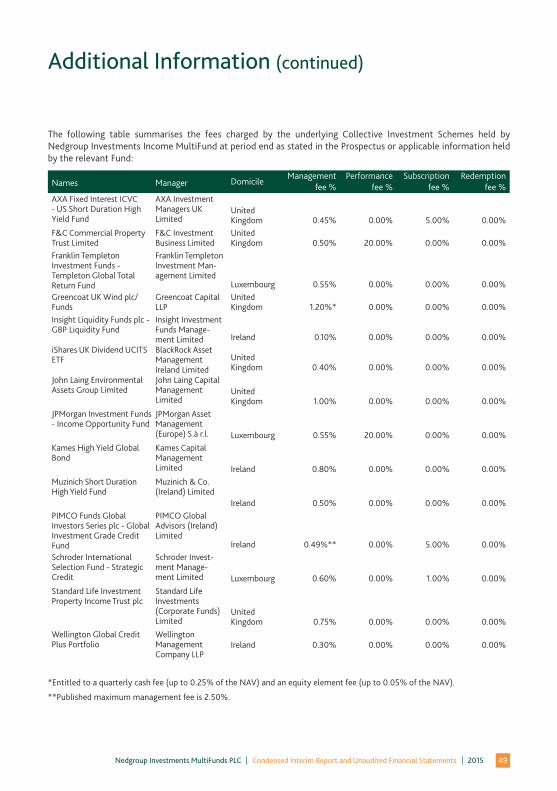
49Nedgroup Investments MultiFunds PLC Condensed Interim Report and Unaudited Financial Statements 2015
The following table summarises the fees charged by the underlying Collective Investment Schemes held by Nedgroup Investments Income MultiFund at period end as stated in the Prospectus or applicable information held by the relevant Fund:
Names Manager DomicileManagement
fee %Performance
fee %Subscription
fee %Redemption
fee %AXA Fixed Interest ICVC - US Short Duration High Yield Fund
AXA Investment Managers UK Limited
United Kingdom 0.45% 0.00% 5.00% 0.00%
F&C Commercial Property Trust Limited
F&C Investment Business Limited
United Kingdom 0.50% 20.00% 0.00% 0.00%
Franklin Templeton Investment Funds - Templeton Global Total Return Fund
Franklin Templeton Investment Man-agement Limited
Luxembourg 0.55% 0.00% 0.00% 0.00%Greencoat UK Wind plc/Funds
Greencoat Capital LLP
United Kingdom 1.20%* 0.00% 0.00% 0.00%
Insight Liquidity Funds plc - GBP Liquidity Fund
Insight Investment Funds Manage-ment Limited Ireland 0.10% 0.00% 0.00% 0.00%
iShares UK Dividend UCITS ETF
BlackRock Asset Management Ireland Limited
United Kingdom 0.40% 0.00% 0.00% 0.00%
John Laing Environmental Assets Group Limited
John Laing Capital Management Limited
United Kingdom 1.00% 0.00% 0.00% 0.00%
JPMorgan Investment Funds - Income Opportunity Fund
JPMorgan Asset Management (Europe) S.à r.l. Luxembourg 0.55% 20.00% 0.00% 0.00%
Kames High Yield Global Bond
Kames Capital Management Limited Ireland 0.80% 0.00% 0.00% 0.00%
Muzinich Short Duration High Yield Fund
Muzinich & Co. (Ireland) Limited
Ireland 0.50% 0.00% 0.00% 0.00%PIMCO Funds Global Investors Series plc - Global Investment Grade Credit Fund
PIMCO Global Advisors (Ireland) Limited
Ireland 0.49%** 0.00% 5.00% 0.00%Schroder International Selection Fund - Strategic Credit
Schroder Invest-ment Manage-ment Limited Luxembourg 0.60% 0.00% 1.00% 0.00%
Standard Life Investment Property Income Trust plc
Standard Life Investments (Corporate Funds) Limited
United Kingdom 0.75% 0.00% 0.00% 0.00%
Wellington Global Credit Plus Portfolio
Wellington Management Company LLP
Ireland 0.30% 0.00% 0.00% 0.00%
*Entitled to a quarterly cash fee (up to 0.25% of the NAV) and an equity element fee (up to 0.05% of the NAV).
**Published maximum management fee is 2.50%.
Additional Information (continued)

50Nedgroup Investments MultiFunds PLC Condensed Interim Report and Unaudited Financial Statements 2015

51Nedgroup Investments MultiFunds PLC Condensed Interim Report and Unaudited Financial Statements 2015
Investment Manager, Distributor & PromotorNedgroup Investments (IOM) Limited
Address:First FloorSamuel Harris HouseSt George’s StreetDouglasIsle of ManIM1 1AJ
Nedgroup Investments (IOM) Limited is licensed by the Isle of Man Financial Services Authority to provide collective investment scheme services. Registered in the Isle of Man No. 57917C
Nedgroup Investments MultiFunds PLC Registered in IrelandNumber 502599
www.nedgroupinvestments.com