
Near-infrared spectroscopy integrated catheter for...
18
Near-infrared spectroscopy integrated catheter for characterization of myocardial tissues: preliminary demonstrations to radiofrequency ablation therapy for atrial fibrillation Rajinder P. Singh-Moon, 1 Charles C. Marboe, 2 and Christine P. Hendon 1,* 1 Department of Electrical Engineering, Columbia University, 500 W 120th Street, New York, NY 10027, USA 2 Department of Pathology, Columbia University Medical Center, 630 W 168th Street, New York, NY 10032, USA * [email protected] Abstract: Effects of radiofrequency ablation (RFA) treatment of atrial fibrillation can be limited by the ability to characterize the tissue in contact. Parameters obtained by conventional catheters, such as impedance and temperature can be insufficient in providing physiological information pertaining to effective treatment. In this report, we present a near-infrared spectroscopy (NIRS)-integrated catheter capable of extracting tissue optical properties. Validation experiments were first performed in tissue phantoms with known optical properties. We then apply the technique for characterization of myocardial tissues in swine and human hearts, ex vivo. Additionally, we demonstrate the recovery of critical parameters relevant to RFA therapy including contact verification, and lesion transmurality. These findings support the application of NIRS for improved guidance in RFA therapeutic interventions. ©2015 Optical Society of America OCIS codes: (170.6510) Spectroscopy, tissue diagnostics; (170.1610) Clinical applications. References and links 1. A. S. Go, D. Mozaffarian, V. L. Roger, E. J. Benjamin, J. D. Berry, M. J. Blaha, S. Dai, E. S. Ford, C. S. Fox, S. Franco, H. J. Fullerton, C. Gillespie, S. M. Hailpern, J. A. Heit, V. J. Howard, M. D. Huffman, S. E. Judd, B. M. Kissela, S. J. Kittner, D. T. Lackland, J. H. Lichtman, L. D. Lisabeth, R. H. Mackey, D. J. Magid, G. M. Marcus, A. Marelli, D. B. Matchar, D. K. McGuire, E. R. Mohler 3rd, C. S. Moy, M. E. Mussolino, R. W. Neumar, G. Nichol, D. K. Pandey, N. P. Paynter, M. J. Reeves, P. D. Sorlie, J. Stein, A. Towfighi, T. N. Turan, S. S. Virani, N. D. Wong, D. Woo, and M. B. Turner; American Heart Association Statistics Committee and Stroke Statistics Subcommittee, “Heart disease and stroke statistics–2014 update: a report from the American Heart Association,” Circulation 129(3), e28–e292 (2014). 2. G. Y. Lip, R. Nieuwlaat, R. Pisters, D. A. Lane, and H. J. Crijns, “Refining clinical risk stratification for predicting stroke and thromboembolism in atrial fibrillation using a novel risk factor-based approach: the euro heart survey on atrial fibrillation,” Chest 137(2), 263–272 (2010). 3. D. L. Dries, D. V. Exner, B. J. Gersh, M. J. Domanski, M. A. Waclawiw, and L. W. Stevenson, “Atrial fibrillation is associated with an increased risk for mortality and heart failure progression in patients with asymptomatic and symptomatic left ventricular systolic dysfunction: a retrospective analysis of the SOLVD trials. Studies of Left Ventricular Dysfunction,” J. Am. Coll. Cardiol. 32(3), 695–703 (1998). 4. A. d’Avila and J. N. Ruskin, “Nonpharmacologic strategies: the evolving story of ablation and hybrid therapy,” Am. J. Cardiol. 102(6 6A), 20H–24H (2008). 5. O. M. Wazni, N. F. Marrouche, D. O. Martin, A. Verma, M. Bhargava, W. Saliba, D. Bash, R. Schweikert, J. Brachmann, J. Gunther, K. Gutleben, E. Pisano, D. Potenza, R. Fanelli, A. Raviele, S. Themistoclakis, A. Rossillo, A. Bonso, and A. Natale, “Radiofrequency ablation vs antiarrhythmic drugs as first-line treatment of symptomatic atrial fibrillation: a randomized trial,” JAMA 293(21), 2634–2640 (2005). 6. J. Dewire and H. Calkins, “Update on atrial fibrillation catheter ablation technologies and techniques,” Nat. Rev. Cardiol. 10(10), 599–612 (2013). 7. S. Nazarian and R. Beinart, “CMR-guided targeting of gaps after initial pulmonary vein isolation,” JACC Cardiovasc. Imaging 7(7), 664–666 (2014). #239806 Received 27 Apr 2015; revised 9 Jun 2015; accepted 9 Jun 2015; published 12 Jun 2015 (C) 2015 OSA 1 Jul 2015 | Vol. 6, No. 7 | DOI:10.1364/BOE.6.002494 | BIOMEDICAL OPTICS EXPRESS 2494
Transcript of Near-infrared spectroscopy integrated catheter for...
Near-infrared spectroscopy integrated catheter for characterization of myocardial tissues:
preliminary demonstrations to radiofrequency ablation therapy for atrial fibrillation
Rajinder P. Singh-Moon,1 Charles C. Marboe,2 and Christine P. Hendon1,* 1Department of Electrical Engineering, Columbia University, 500 W 120th Street, New York, NY 10027, USA
2Department of Pathology, Columbia University Medical Center, 630 W 168th Street, New York, NY 10032, USA *[email protected]
Abstract: Effects of radiofrequency ablation (RFA) treatment of atrial fibrillation can be limited by the ability to characterize the tissue in contact. Parameters obtained by conventional catheters, such as impedance and temperature can be insufficient in providing physiological information pertaining to effective treatment. In this report, we present a near-infrared spectroscopy (NIRS)-integrated catheter capable of extracting tissue optical properties. Validation experiments were first performed in tissue phantoms with known optical properties. We then apply the technique for characterization of myocardial tissues in swine and human hearts, ex vivo. Additionally, we demonstrate the recovery of critical parameters relevant to RFA therapy including contact verification, and lesion transmurality. These findings support the application of NIRS for improved guidance in RFA therapeutic interventions.
©2015 Optical Society of America
OCIS codes: (170.6510) Spectroscopy, tissue diagnostics; (170.1610) Clinical applications.
References and links 1. A. S. Go, D. Mozaffarian, V. L. Roger, E. J. Benjamin, J. D. Berry, M. J. Blaha, S. Dai, E. S. Ford, C. S. Fox, S.
Franco, H. J. Fullerton, C. Gillespie, S. M. Hailpern, J. A. Heit, V. J. Howard, M. D. Huffman, S. E. Judd, B. M. Kissela, S. J. Kittner, D. T. Lackland, J. H. Lichtman, L. D. Lisabeth, R. H. Mackey, D. J. Magid, G. M. Marcus, A. Marelli, D. B. Matchar, D. K. McGuire, E. R. Mohler 3rd, C. S. Moy, M. E. Mussolino, R. W. Neumar, G. Nichol, D. K. Pandey, N. P. Paynter, M. J. Reeves, P. D. Sorlie, J. Stein, A. Towfighi, T. N. Turan, S. S. Virani, N. D. Wong, D. Woo, and M. B. Turner; American Heart Association Statistics Committee and Stroke Statistics Subcommittee, “Heart disease and stroke statistics–2014 update: a report from the American Heart Association,” Circulation 129(3), e28–e292 (2014).
2. G. Y. Lip, R. Nieuwlaat, R. Pisters, D. A. Lane, and H. J. Crijns, “Refining clinical risk stratification for predicting stroke and thromboembolism in atrial fibrillation using a novel risk factor-based approach: the euro heart survey on atrial fibrillation,” Chest 137(2), 263–272 (2010).
3. D. L. Dries, D. V. Exner, B. J. Gersh, M. J. Domanski, M. A. Waclawiw, and L. W. Stevenson, “Atrial fibrillation is associated with an increased risk for mortality and heart failure progression in patients with asymptomatic and symptomatic left ventricular systolic dysfunction: a retrospective analysis of the SOLVD trials. Studies of Left Ventricular Dysfunction,” J. Am. Coll. Cardiol. 32(3), 695–703 (1998).
4. A. d’Avila and J. N. Ruskin, “Nonpharmacologic strategies: the evolving story of ablation and hybrid therapy,” Am. J. Cardiol. 102(6 6A), 20H–24H (2008).
5. O. M. Wazni, N. F. Marrouche, D. O. Martin, A. Verma, M. Bhargava, W. Saliba, D. Bash, R. Schweikert, J. Brachmann, J. Gunther, K. Gutleben, E. Pisano, D. Potenza, R. Fanelli, A. Raviele, S. Themistoclakis, A. Rossillo, A. Bonso, and A. Natale, “Radiofrequency ablation vs antiarrhythmic drugs as first-line treatment of symptomatic atrial fibrillation: a randomized trial,” JAMA 293(21), 2634–2640 (2005).
6. J. Dewire and H. Calkins, “Update on atrial fibrillation catheter ablation technologies and techniques,” Nat. Rev. Cardiol. 10(10), 599–612 (2013).
7. S. Nazarian and R. Beinart, “CMR-guided targeting of gaps after initial pulmonary vein isolation,” JACC Cardiovasc. Imaging 7(7), 664–666 (2014).
#239806 Received 27 Apr 2015; revised 9 Jun 2015; accepted 9 Jun 2015; published 12 Jun 2015 (C) 2015 OSA 1 Jul 2015 | Vol. 6, No. 7 | DOI:10.1364/BOE.6.002494 | BIOMEDICAL OPTICS EXPRESS 2494

8. H. Oral, B. P. Knight, M. Ozaydin, H. Tada, A. Chugh, S. Hassan, C. Scharf, S. W. Lai, R. Greenstein, F. Pelosi, Jr., S. A. Strickberger, and F. Morady, “Clinical significance of early recurrences of atrial fibrillation after pulmonary vein isolation,” J. Am. Coll. Cardiol. 40(1), 100–104 (2002).
9. A. d’Avila, C. Houghtaling, P. Gutierrez, O. Vragovic, J. N. Ruskin, M. E. Josephson, and V. Y. Reddy, “Catheter ablation of ventricular epicardial tissue: a comparison of standard and cooled-tip radiofrequency energy,” Circulation 109(19), 2363–2369 (2004).
10. E. R. Cosman, Jr., J. R. Dolensky, and R. A. Hoffman, “Factors that affect radiofrequency heat lesion size,” Pain Med. 15(12), 2020–2036 (2014).
11. S. P. Thomas, D. J. Guy, A. C. Boyd, V. E. Eipper, D. L. Ross, and R. B. Chard, “Comparison of epicardial and endocardial linear ablation using handheld probes,” Ann. Thorac. Surg. 75(2), 543–548 (2003).
12. S. Dixit, N. Narula, D. J. Callans, and F. E. Marchlinski, “Electroanatomic mapping of human heart: epicardial fat can mimic scar,” J. Cardiovasc. Electrophysiol. 14(10), 1128 (2003).
13. H. Høgh Petersen, X. Chen, A. Pietersen, J. H. Svendsen, and S. Haunsø, “Lesion dimensions during temperature-controlled radiofrequency catheter ablation of left ventricular porcine myocardium: impact of ablation site, electrode size, and convective cooling,” Circulation 99(2), 319–325 (1999).
14. M. Wright, E. Harks, S. Deladi, F. Suijver, M. Barley, A. van Dusschoten, S. Fokkenrood, F. Zuo, F. Sacher, M. Hocini, M. Haïssaguerre, and P. Jaïs, “Real-time lesion assessment using a novel combined ultrasound and radiofrequency ablation catheter,” Heart Rhythm the Official Journal of the Heart Rhythm Society 8(2), 304–312 (2011).
15. H. Calkins, R. el-Atassi, S. J. Kalbfleisch, J. J. Langberg, and F. Morady, “Effect of operator experience on outcome of radiofrequency catheter ablation of accessory pathways,” Am. J. Cardiol. 71(12), 1104–1105 (1993).
16. S. Bosman, “Heat-induced structural alterations in myocardium in relation to changing optical properties,” Appl. Opt. 32(4), 461–463 (1993).
17. W. J. Bowen, “The absorption spectra and extinction coefficients of myoglobin,” J. Biol. Chem. 179(1), 235–245 (1949).
18. C. P. Fleming, K. J. Quan, and A. M. Rollins, “Toward guidance of epicardial cardiac radiofrequency ablation therapy using optical coherence tomography,” J. Biomed. Opt. 15(4), 041510 (2010).
19. C. P. Fleming, K. J. Quan, H. Wang, G. Amit, and A. M. Rollins, “In vitro characterization of cardiac radiofrequency ablation lesions using optical coherence tomography,” Opt. Express 18(3), 3079–3092 (2010).
20. J. W. Pickering, S. Bosman, P. Posthumus, P. Blokland, J. F. Beek, and M. J. van Gemert, “Changes in the optical properties (at 632.8 nm) of slowly heated myocardium,” Appl. Opt. 32(4), 367–371 (1993).
21. J. Swartling, S. Pålsson, P. Platonov, S. B. Olsson, and S. Andersson-Engels, “Changes in tissue optical properties due to radio-frequency ablation of myocardium,” Med. Biol. Eng. Comput. 41(4), 403–409 (2003).
22. S. L. J. Thomsen and S. L. Flock, S. T. “Microscopic correlates of macroscopic optical property changes during thermal coagulation of myocardium,” Proc. Soc. Photo Opt. Instrum. Eng. 1202, 2–10 (1990).
23. M. Mercader, L. Swift, S. Sood, H. Asfour, M. Kay, and N. Sarvazyan, “Use of endogenous NADH fluorescence for real-time in situ visualization of epicardial radiofrequency ablation lesions and gaps,” Am. J. Physiol. Heart Circ. Physiol. 302(10), H2131–H2138 (2012).
24. H. Wang, W. Kang, T. Carrigan, A. Bishop, N. Rosenthal, M. Arruda, and A. M. Rollins, “In vivo intracardiac optical coherence tomography imaging through percutaneous access: toward image-guided radio-frequency ablation,” J. Biomed. Opt. 16(11), 110505 (2011).
25. X. Fu, Z. Wang, H. Wang, Y. T. Wang, M. W. Jenkins, and A. M. Rollins, “Fiber-optic catheter-based polarization-sensitive OCT for radio-frequency ablation monitoring,” Opt. Lett. 39(17), 5066–5069 (2014).
26. C. P. Fleming, H. Wang, K. J. Quan, and A. M. Rollins, “Real-time monitoring of cardiac radio-frequency ablation lesion formation using an optical coherence tomography forward-imaging catheter,” J. Biomed. Opt. 15(3), 030516 (2010).
27. C. M. Ambrosi, N. Moazami, A. M. Rollins, and I. R. Efimov, “Virtual histology of the human heart using optical coherence tomography,” J. Biomed. Opt. 14(5), 054002 (2009).
28. Y. Gan and C. P. Fleming, “Extracting three-dimensional orientation and tractography of myofibers using optical coherence tomography,” Biomed. Opt. Express 4(10), 2150–2165 (2013).
29. R. Beinart, S. Abbara, A. Blum, M. Ferencik, K. Heist, J. Ruskin, and M. Mansour, “Left atrial wall thickness variability measured by CT scans in patients undergoing pulmonary vein isolation,” J. Cardiovasc. Electrophysiol. 22(11), 1232–1236 (2011).
30. H. W. Tan, X. H. Wang, H. F. Shi, L. Zhou, J. N. Gu, and X. Liu, “Left atrial wall thickness: anatomic aspects relevant to catheter ablation of atrial fibrillation,” Chin. Med. J. (Engl.) 125(1), 12–15 (2012).
31. D. Sánchez-Quintana, J. R. López-Mínguez, Y. Macías, J. A. Cabrera, and F. Saremi, “Left atrial anatomy relevant to catheter ablation,” Cardiol. Res. Pract. 2014, 289720 (2014).
32. G. J. Derbyshire, D. K. Bogen, and M. Unger, “Thermally induced optical property changes in myocardium at 1.06 μm,” Lasers Surg. Med. 10(1), 28–34 (1990).
33. S. G. Demos and S. Sharareh, “Real time assessment of RF cardiac tissue ablation with optical spectroscopy,” Opt. Express 16(19), 15286–15296 (2008).
34. G. M. Palmer and N. Ramanujam, “Monte Carlo-based inverse model for calculating tissue optical properties. Part I: Theory and validation on synthetic phantoms,” Appl. Opt. 45(5), 1062–1071 (2006).
35. K. W. Calabro, “Improved mathematical and computational tools for modeling photon propagation in tissue,” Ph.D. Thesis, Boston University (2013).
#239806 Received 27 Apr 2015; revised 9 Jun 2015; accepted 9 Jun 2015; published 12 Jun 2015 (C) 2015 OSA 1 Jul 2015 | Vol. 6, No. 7 | DOI:10.1364/BOE.6.002494 | BIOMEDICAL OPTICS EXPRESS 2495

36. E. Alerstam, T. Svensson, and S. Andersson-Engels, “Parallel computing with graphics processing units for high-speed Monte Carlo simulation of photon migration,” J. Biomed. Opt. 13(6), 060504 (2008).
37. R. Reif, O. A’Amar, and I. J. Bigio, “Analytical model of light reflectance for extraction of the optical properties in small volumes of turbid media,” Appl. Opt. 46(29), 7317–7328 (2007).
38. R. P. Singh-Moon, D. M. Roblyer, I. J. Bigio, and S. Joshi, “Spatial mapping of drug delivery to brain tissue using hyperspectral spatial frequency-domain imaging,” J. Biomed. Opt. 19(9), 096003 (2014).
39. H. J. van Staveren, C. J. Moes, J. van Marie, S. A. Prahl, and M. J. van Gemert, “Light scattering in Intralipid-10% in the wavelength range of 400-1100 nm,” Appl. Opt. 30(31), 4507–4514 (1991).
40. S. L. Jacques, “Optical properties of biological tissues: a review,” Phys. Med. Biol. 58(11), R37–R61 (2013). 41. P. Taroni, A. Bassi, D. Comelli, A. Farina, R. Cubeddu, and A. Pifferi, “Diffuse optical spectroscopy of breast
tissue extended to 1100 nm,” J. Biomed. Opt. 14(5), 054030 (2009). 42. J. R. Mourant, T. Fuselier, J. Boyer, T. M. Johnson, and I. J. Bigio, “Predictions and measurements of scattering
and absorption over broad wavelength ranges in tissue phantoms,” Appl. Opt. 36(4), 949–957 (1997). 43. C. P. Fleming, N. Rosenthal, A. M. Rollins, and M. Arruda, “First in vivo real-time imaging of endocardial
radiofrequency ablation by optical coherence tomography: implications on safety and the birth of “electro-structural” substrate-guided ablation,” The Journal of Innovations in Cardiac Rhythm Management 2,199–201 (2011).
44. R. Agah, A. H. Gandjbakhche, M. Motamedi, R. Nossal, and R. F. Bonner, “Dynamics of temperature dependent optical properties of tissue: dependence on thermally induced alteration,” IEEE Trans. Biomed. Eng. 43(8), 839–846 (1996).
45. M. A. Wood, “Exposing gaps in linear radiofrequency lesions: form before function,” Circ Arrhythm Electrophysiol 4(3), 257–259 (2011).
46. F. Ouyang, M. Antz, S. Ernst, H. Hachiya, H. Mavrakis, F. T. Deger, A. Schaumann, J. Chun, P. Falk, D. Hennig, X. Liu, D. Bänsch, and K. H. Kuck, “Recovered pulmonary vein conduction as a dominant factor for recurrent atrial tachyarrhythmias after complete circular isolation of the pulmonary veins: lessons from double Lasso technique,” Circulation 111(2), 127–135 (2005).
47. R. Reif, M. S. Amorosino, K. W. Calabro, O. A’Amar, S. K. Singh, and I. J. Bigio, “Analysis of changes in reflectance measurements on biological tissues subjected to different probe pressures,” J. Biomed. Opt. 13(1), 010502 (2008).
48. E. Antonini and M. Brunori, Hemoglobin and Myoglobin in Their Reactions with Ligands, Frontiers of Biology (North-Holland Pub. Co., Amsterdam, 1971), pp. xx, 436.
49. J. S. Charnock, W. F. Dryden, E. J. McMurchie, M. Y. Abeywardena, and G. R. Russell, “Differences in the fatty acid composition of atrial and ventricular phospholipids of rat heart following standard and lipid-supplemented diets,” Comp. Biochem. Physiol. B 75(1), 47–52 (1983).
50. M. C. Schaub and H. O. Hirzel, “Atrial and ventricular isomyosin composition in patients with different forms of cardiac hypertrophy,” Basic Res. Cardiol. 82(Suppl 2), 357–367 (1987).
51. M. J. Legato, “Ultrastructure of the atrial, ventricular, and Purkinje cell, with special reference to the genesis of arrhythmias,” Circulation 47(1), 178–189 (1973).
1. Introduction
1.1 Radiofrequency ablation of atrial fibrillation
Atrial fibrillation (AF), the most prevalent arrhythmia, was estimated to affect some 2.7 to 6.1 million people in the US in 2010, and is projected to double by 2050 [1]. Cardiac arrhythmia, or aberrant beat cycles, have been associated with thromboembolic events, heart failure, cardiomyopathy, and is a potent risk factor of stroke [2, 3]. Radiofrequency ablation (RFA) therapy has emerged as an established treatment option for many arrhythmias both ventricular and supraventricular [4–6]. The goal of RFA treatment is to eliminate irregularities in cardiac contraction cycles by disrupting problematic circuits in cardiac tissue. Confined anatomical lesions are thermoelectrically induced to generate non-conducting scar to effectively inhibit propagation of aberrant electrical signals. Thus, treatment success is highly dependent on successful lesion formation. In pivotal RFA procedures, such as pulmonary vein isolation, successful isolation is often predicated on lesion continuity and transmurality. Studies show that lesion insufficiency and gaps in ablation lines are associated with increased recurrence rates of arrhythmias [7, 8]. Factors affecting transmurality are primarily attributed to catheter-tissue contact, applied energy, temperature, blood flow convection, and tissue composition (e.g. interposition of fat between catheter-tissue interface) [9–11]. Currently, conventional catheters do not provide information regarding the latter, in addition to confirming contact. Moreover, the presence of lipid can lead to misinterpretations in electroanatomic mapping [12]. Additionally, conventional methods of lesion size assessment are indirect and include
#239806 Received 27 Apr 2015; revised 9 Jun 2015; accepted 9 Jun 2015; published 12 Jun 2015 (C) 2015 OSA 1 Jul 2015 | Vol. 6, No. 7 | DOI:10.1364/BOE.6.002494 | BIOMEDICAL OPTICS EXPRESS 2496
measurement of impedance change, temperature change, and electrogram monitoring. However, a robust correlation between lesion depth and tissue impedance, or catheter tip-temperature, has yet to be observed [13, 14]. As a result, operator skill and facility experience play a large role in treatment outcome [15]. A method of evaluating physiological changes at the catheter-tissue interface could address such limitations by reporting tissue physiological parameters. Such information could be leveraged to enable feedback-mediated RF energy tuning and direct assessment of lesion transmurality. Thus, these added functionalities to ablation catheters have implications for improving overall procedural success.
1.2 Summary of optical characterization of the myocardium
Several groups have demonstrated experimental optical characterization of the myocardium [16–23]. High resolution images acquired using a bench top OCT system exhibited distinguishable features that could be used to discriminate between treated and untreated swine cardiac tissue [19]. It was also demonstrated that adipose tissue could be readily discerned from the normal myocardium in an OCT image [18]. Furthermore, OCT sample arms could be fiber-coupled and integrated into catheters to enable real-time imaging and tissue characterization at the catheter tip [18, 24–26]. While OCT-based catheters can obtain promising information, the imaging penetration depth is limited to <1.5 mm in myocardium tissue [27, 28]. Typical atrial wall thickness in humans range from 2 to 5 mm [29–31], thus a method with increased depth sampling may be more suited for evaluating lesion transmurality.
Diffuse reflectance measurements have been widely used for probing deeper into tissue volumes at the expense of spatial resolution. Furthermore, bulk tissue optical properties relate closely to the tissue biochemical and ultra-structural makeup. Several groups have assessed the effects of thermal coagulation on myocardium optical properties employing diffuse reflectance measurement schemes [16, 20–22, 32]. In general, these studies report that RFA treated tissue exhibits a consistent increase in both tissue absorption and reduced scattering spectra that was then related to macroscopic physiological changes. Although optical parameters were consistently different between ablated and normal myocardium tissue, these measurements required biopsy of the tissue specimen thereby limiting its application to real-time, human translation [21, 22]. Alternatively, Demos et. al. demonstrated the use of a NIR spectroscopy integrated-catheter for the real-time sampling of cardiac tissue reflectance during RFA treatment [33]. In vitro experiments revealed a monotonic increase in normalized reflectance slope as a function of applied RF energy duration; which showed a trend with increased lesion depth formation [33]. A catheter-based method for quantification of optical parameters could potentially facilitate confirmation of lesion sufficiency. In this work, we join the functionality of these prior contributions and present a NIR spectroscopy-integrated RFA catheter capable of extracting tissue optical properties from the zone of resistive heating. Cardiac tissue optical properties and constituent concentrations are simultaneously recovered using an inverse Monte Carlo (MC)-based framework similar to what is described in Palmer et. al [34]. We then apply this technique to characterize ex vivo human and swine atrial specimens. Specifically, optical properties and biochemical composition were obtained and compared for normal and RFA treated tissues.
2. Materials and methods
2.1 System overview
Figure 1(a) shows a schematic diagram of the RFA-NIRS system. The NIR spectroscopy arm consisted of a tungsten-halogen lamp (HL-2000 HP, Ocean Optics, Dunedin, FL, USA) as a light source (360-2400 nm) that illuminated the sample via a 400 micron fiber. Diffusely reflected light collected by an identical fiber was wavelength-discriminated (500-1000 nm) by a spectrometer (CCS-175, Thorlabs, Newton, NJ, USA) and recorded on a laptop computer.
#239806 Received 27 Apr 2015; revised 9 Jun 2015; accepted 9 Jun 2015; published 12 Jun 2015 (C) 2015 OSA 1 Jul 2015 | Vol. 6, No. 7 | DOI:10.1364/BOE.6.002494 | BIOMEDICAL OPTICS EXPRESS 2497
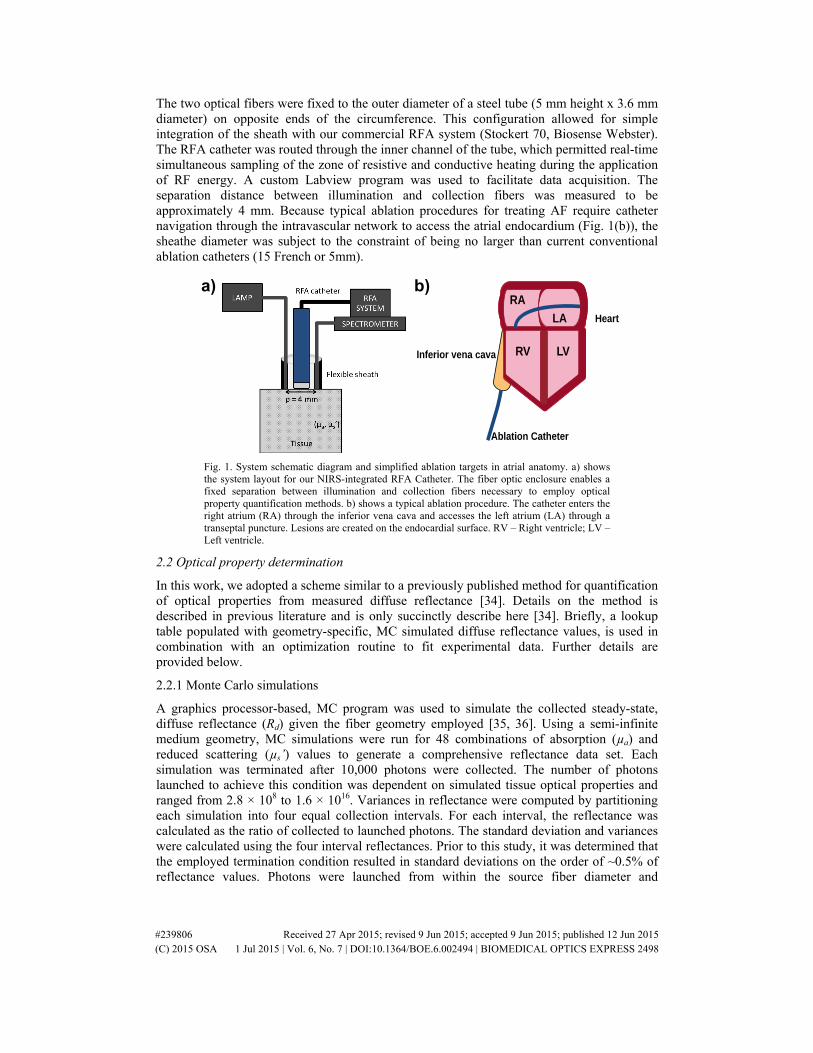
The two optical fibers were fixed to the outer diameter of a steel tube (5 mm height x 3.6 mm diameter) on opposite ends of the circumference. This configuration allowed for simple integration of the sheath with our commercial RFA system (Stockert 70, Biosense Webster). The RFA catheter was routed through the inner channel of the tube, which permitted real-time simultaneous sampling of the zone of resistive and conductive heating during the application of RF energy. A custom Labview program was used to facilitate data acquisition. The separation distance between illumination and collection fibers was measured to be approximately 4 mm. Because typical ablation procedures for treating AF require catheter navigation through the intravascular network to access the atrial endocardium (Fig. 1(b)), the sheathe diameter was subject to the constraint of being no larger than current conventional ablation catheters (15 French or 5mm).
b) a)
Fig. 1. System schematic diagram and simplified ablation targets in atrial anatomy. a) shows the system layout for our NIRS-integrated RFA Catheter. The fiber optic enclosure enables a fixed separation between illumination and collection fibers necessary to employ optical property quantification methods. b) shows a typical ablation procedure. The catheter enters the right atrium (RA) through the inferior vena cava and accesses the left atrium (LA) through a transeptal puncture. Lesions are created on the endocardial surface. RV – Right ventricle; LV – Left ventricle.
2.2 Optical property determination
In this work, we adopted a scheme similar to a previously published method for quantification of optical properties from measured diffuse reflectance [34]. Details on the method is described in previous literature and is only succinctly describe here [34]. Briefly, a lookup table populated with geometry-specific, MC simulated diffuse reflectance values, is used in combination with an optimization routine to fit experimental data. Further details are provided below.
2.2.1 Monte Carlo simulations
A graphics processor-based, MC program was used to simulate the collected steady-state, diffuse reflectance (Rd) given the fiber geometry employed [35, 36]. Using a semi-infinite medium geometry, MC simulations were run for 48 combinations of absorption (µa) and reduced scattering (µs’) values to generate a comprehensive reflectance data set. Each simulation was terminated after 10,000 photons were collected. The number of photons launched to achieve this condition was dependent on simulated tissue optical properties and ranged from 2.8 × 10⁸ to 1.6 × 10¹⁶. Variances in reflectance were computed by partitioning each simulation into four equal collection intervals. For each interval, the reflectance was calculated as the ratio of collected to launched photons. The standard deviation and variances were calculated using the four interval reflectances. Prior to this study, it was determined that the employed termination condition resulted in standard deviations on the order of ~0.5% of reflectance values. Photons were launched from within the source fiber diameter and
#239806 Received 27 Apr 2015; revised 9 Jun 2015; accepted 9 Jun 2015; published 12 Jun 2015 (C) 2015 OSA 1 Jul 2015 | Vol. 6, No. 7 | DOI:10.1364/BOE.6.002494 | BIOMEDICAL OPTICS EXPRESS 2498
propagated in 2D throughout the medium. In order to improve computational efficiency, simulations were run for a ring collection geometry where the source-detector separation was 4 mm and the collection ring thickness was set to 400 microns. The recovered ring reflectance was then scaled by the ratio of single-fiber collection area to the ring collection area. Absorption ranged between 0 to 20 cm−1 and reduced scattering ranged from 1 to 30 cm−1. The anisotropy factor, refractive index of the ambient medium (PBS) and tissue layer, tissue radius, tissue thickness were kept constant at 0.9, 1.33, 1.37, 10 cm, and 100 cm, respectively for all simulations [21, 34]. At the boundary, Fresnel’s formula was used to compute the reflection amount of photons that did not experience total internal reflection. Furthermore, the numerical aperture of the collection fiber was used to determine the range of exit angles that would be allowed to propagate through the fiber. The MC generated data was used to populate a two-variable lookup table of diffuse reflectance for a given µa and µs’ input combination.
In order to evaluate transmural sampling of optical measurements, the maximum depth visited by each collected photon was tracked during MC simulations. Simulated optical properties were adjusted according to typical myocardium values obtained by Swartling et. al. (i.e. µa = 1 cm−1 and µs’ = 10 cm−1) [21]. These values were measured for the ventricular epicardium in swine cardiac tissue. Because the optical properties of atrial tissue are not well reported in literature, the aforementioned values were used to approximate atrial values. A maximum visitation depth (MVD) distribution was obtained and then compared to typical atrial wall thicknesses found in humans [30]. The normalized MVD distribution was then fitted to a log-normal curve to obtain estimates for mean sampling depth. Finally, the ratio between the sum total of collected photons that traversed a depth of less than 5 mm over the total number of collected photons was calculated to approximate the portion of the signal that would sample the average atrial wall thickness.
2.2.2 Calibration
To eliminate the need to measure absolute reflectance and account for day-to-day variations in system response, all measurements were calibrated using a method employed by Reif et al. [37]. Spectral measurements were converted to relative reflectance, RRel, using the following expression:
( ) ( )( )
( )( )
0Re
0
.spectralontissuel
spectralon cal
IIR
I I
λλλ
λ λ= × (1)
where Ispectralon(λ), is a measurement taken from a flat, 75% diffuse reflectance standard (AS-01161-260 Labsphere, North Sutton, NH). Ispectralon(λo) and Ical(λo) is the intensity measured at 730 nm taken from the diffuse reflector and a phantom of known optical properties, respectively. Unless stated otherwise, all spectra were also decremented by a dark measurement taken with the light source blocked to minimize artifacts from ambient light. The integration time was 2s and remained unchanged for all data acquired in this study. In order to directly apply the aforementioned forward model, all values in the lookup table were converted to relative reflectance. This was done by normalizing the generated lookup table by the simulated reflectance for optical properties of the calibration phantom at 730 nm.
2.3 Validation experiments
Measurements in experimental phantoms were made in order to test the validity of µa and µs’ determination of the method. First, an absorption variation experiment was done by taking reflectance measurements in serial dilutions of Evans Blue (EB) dye (Sigma-Aldrich, St. Louis, MO) in 1% Intralipid. EB was selected for its localized, prominent absorption peak, which helped to assess a larger range of absorption values in a single dilution. Reflectance spectra taken from each preparation were fit using a linear combination of lipid, water, and
#239806 Received 27 Apr 2015; revised 9 Jun 2015; accepted 9 Jun 2015; published 12 Jun 2015 (C) 2015 OSA 1 Jul 2015 | Vol. 6, No. 7 | DOI:10.1364/BOE.6.002494 | BIOMEDICAL OPTICS EXPRESS 2499

EB absorption spectra. The absorption spectra for EB was obtained from Singh-Moon et. al. [38]. Extracted absorption values at 620 nm were compared to expected absorption from the known concentrations. Next, a scattering variation experiment was performed fixing the concentration of EB and varying the Intralipid volume fraction from 0.4% to 2.2% to cover the physiological range of µs’. Extracted µs’ values at 620 nm were compared with theoretical values for Intralipid scattering [39]. A total of 12 spectra were averaged for each preparation and the 600-1000 nm spectral region was used for fitting all experimental phantom data.
2.4 Ex vivo tissue preparation
Human hearts were acquired from the National Disease Research Interchange under two protocols: one for normal hearts and the other for diseased hearts. Hearts were required to be excised within 24 hours of donor death, preserved in PBS on ice, and shipped via courier. Protocols were gender neutral and restricted samples from donors less than 80 years of age. A total of five human hearts were used in this study. All measurements were taken within 48 hours of the donor’s death. Tissue wedges were excised from the left atrium (LA) and right atrium (RA) chambers for spectroscopic measurements. The numbers of measurements taken were as follows: LA (n = 34), RA (n = 30).
Three fresh swine hearts and whole blood samples were acquired from Green Village Packing Co. (Green Village, New Jersey). Reflectance measurements were taken with samples submerged in whole blood. To assess whether NIRS could be used for catheter-tissue contact verification, we compared measurements taken in contact to those taken 2 mm above the tissue surface using a micromanipulator. Because the aim was to identify a tissue-independent marker that could be used to discern catheter-tissue contact, both ventricular and supraventricular tissues were used.
2.5 Radiofrequency ablation
For RFA treatment, all tissues were supraperfused with temperature-maintained (37°C) PBS under pulsatile flow. Ablations were performed using a commercial RFA system (Stockert 70, Biosense Webster, Diamond Bar, CA) in temperature-controlled mode. The RFA catheter was routed through the inner channel of the spectroscopic sheath and was then placed in contact with the tissue surface. The power was set to 30W and the target temperature setting was 65°C to ensure tissue necrosis [23]. The total duration of applied energy varied from 2 to 60s in order to generate lesions of various depths. Lesions were created on the endocardial surface of the LA (n = 13) and RA (n = 11) in human samples.
In order to assess whether NIRS could detect gaps in ablated regions, linear lesions were created in the swine RA samples with intentional discontinuities (~3 mm wide). Spectra were then acquired in evenly spaced, 2 mm increments along the length of the segment. A linear stage was used to translate the NIRS catheter across the sample. Prior to linear lesion experiments, preliminary isolated lesions were first generated on separate samples to gauge the effect of injury on optical measurements in the swine myocardium.
2.6 NIRS data acquisition and processing
A total of 12 spectra were averaged for each untreated sample measurement. A spectrometer integration time of 2 s was used to acquire all data in this study. Optical measurements taken during RFA treatment were similarly sampled at 0.5 Hz.
#239806 Received 27 Apr 2015; revised 9 Jun 2015; accepted 9 Jun 2015; published 12 Jun 2015 (C) 2015 OSA 1 Jul 2015 | Vol. 6, No. 7 | DOI:10.1364/BOE.6.002494 | BIOMEDICAL OPTICS EXPRESS 2500

700 800 9000.00
0.02
0.04
0.06
0.08
Wavelength (nm)
Abs
orpt
ion
(cm
-1)
HbO (30μm)Hb (30µm)MbO (30µm)Mb (30µm)MMb (40µm)Lipid (60%)H2O (15%)Collagen (10%)
Fig. 2. Chromophores used in the fitting routine to approximate near-infrared absorption spectra in cardiac tissues. All spectra were obtained from previously published literature. Water (H2O)a; oxyhemoglobin (HbO2)
a; deoxyhemoglobin (Hb)a; lipidb; reduced oxymyoglobin (Mb)b; met-myoglobin (met-Mb)b; oxymyoglobin (MbO2)
b; and collagenc; a-Obtained from Jacques et al.; b-Obtained from Bowen et. al.; c-Obtained from Taroni et. al.
In order to reduce dimensionality of the inverse problem, absorption and reduced scattering were restricted to exhibit predefined spectral shapes. Absorption was parameterized by eight principle component spectra obtained from literature [17, 40, 41]. NIR absorption changes were assumed to be predominantly influenced by the following compounds: oxy- (HbO2) and deooxy-hemoglobin (Hb), oxy- (MbO2) and deoxy-myoglobin (Mb), met-myoglobin (Mmb), lipid, water (H2O), and collagen. Absorption spectra for HbO2, Hb, H2O, and lipid were obtained from Jacques et. al [40]. Spectra for MbO2, Mb, and Mmb were similarly obtained from Bowen et. al [17] and collagen from Taroni et. al [41]. Absorption profiles obtained from literature are showed in Fig. 2. Unless stated otherwise, all cardiac measurement spectral analysis was restricted to 680-950 nm, which was subject to the union of spectra ranges found in literature. Using the approach followed by Jacques et. al., we can write the expression for absorption as follows:
( ) ( ) ( ) ( )( )( ) ( ) ( )
( ) ( ) ( )2
, ,
, , ,
1
2.3
a a HbO a Hb
a H O a lipid a coll
MbO MbO Mb Mb Mmb Mmb
B S S
W F C
c c c
μ λ μ λ μ λ
μ λ μ λ μ λ
ε λ ε λ ε λ
= + −
+ + +
+ ⋅ + ⋅ + ⋅
(2)
where S is the oxygen saturation and B is the blood volume fraction. W, F, and C are the volume fractions of pure water (µa,H2O), lipid (µa,lipid), and collagen (µa,coll) spectra, respectively [40]. Finally, ε represents the extinction spectra and c is the concentration. This relationship helped to constrain possible solutions to more physiologically relevant coefficient values.
A power law expression was used to model the wavelength-dependent reduced scattering [21, 37]. Normalizing wavelength, λ, by 730 nm, we can write:
( )' .730
b
s anm
λμ λ−
=
(3)
where a corresponds to the scattering amplitude. The value b is the scattering slope, a parameter related to the mean scatterer size [21]. This parameter was bounded by 0.37 and 4 to ensure that only mean scatterer sizes relevant to biological tissues were considered in the optimization process [42].
#239806 Received 27 Apr 2015; revised 9 Jun 2015; accepted 9 Jun 2015; published 12 Jun 2015 (C) 2015 OSA 1 Jul 2015 | Vol. 6, No. 7 | DOI:10.1364/BOE.6.002494 | BIOMEDICAL OPTICS EXPRESS 2501

A Levenberg-Marquardt routine was used to determine coefficients in the derived expressions for µa and µs’ that minimized the error between the measured RRel and forward model predictions. Data was rejected when optimization did not converge. Matlab (The Mathworks, Inc., Natick, MA) was used to process all data used in this study.
2.7 Histological analysis
Subsequent to optical measurement, human samples were preserved in 10% formalin for 24 hours then transferred to 70% ethanol. Tissue samples were then embedded in paraffin and serial sections were cut using a microtome. To evaluate the degree of acute thermal damage, sections were stained with the Masson’s Trichrome technique and digitized using a digital microscope (Leica Microsystems). Digitized histological sections were reviewed by a pathologist for tissue composition and necrosis estimation.
For injury assessment in swine specimens, samples were submerged for 25 minutes in 1% triphenyltetrazolium chloride (TTC) at 21°C, then digitized using a digital camera.
2.8 Statistical analysis
Analysis of variance with post-hoc Tukey’s multiple comparison test was used to assess significance in extracted parameters values over the different tissue types. A p-value of 0.05 or less was considered significant.
3. Results
3.1 Monte Carlo simulations
Figure 3(a) shows RRel results from MC simulations ran considering the range of optical properties relevant for biological tissue in the NIR region. RRel increases as a function of µs’ for values less than approximately 10 cm−1, followed by a monotonic decrease thereafter. Absorption causes an exponential decay effect on measured RRel. Results were used to populate a two-dimensional lookup table and yielded a RRel value for a given µa and µs’ combination. The functional relationship formed a continuous plane; hence linear interpolation could be used for finer sampling of RRel for µa and µs’ pairs between the simulated values.
The photon visitation path was monitored during each collected photon during MC simulations for typical myocardium optical properties (i.e. µa = 1 cm−1 and µs’ = 10 cm−1). Figure 3(b) shows the MVD distribution obtained for 10,000 collected photons. Approximating the distribution with a log-normal fit, the mean MVD was determined to be 3.12 mm. This value suggests that the employed optical geometry may be sufficient for sampling average atrial wall thicknesses under normal conditions.
#239806 Received 27 Apr 2015; revised 9 Jun 2015; accepted 9 Jun 2015; published 12 Jun 2015 (C) 2015 OSA 1 Jul 2015 | Vol. 6, No. 7 | DOI:10.1364/BOE.6.002494 | BIOMEDICAL OPTICS EXPRESS 2502

Fig. 3. MC Simulated Characteristics of the NIRS-Integrated catheter. A) shows the effect of measured reflectance (RRel) due to changes in tissue optical properties as derived from MC simulations. RRel exhibited exponential decay as a function of increasing µa. RRel increases gradually for small µs’, then decreases monotonically after reaching an infection point at before 10 cm−1. B) shows the MVD distribution (black curve) for 10,000 collected photons simulated for normal myocardium tissue. The distribution was fit to a log-normal function (red curve) to approximate the mean MVD of the collected photons.
3.2 Validation experiment
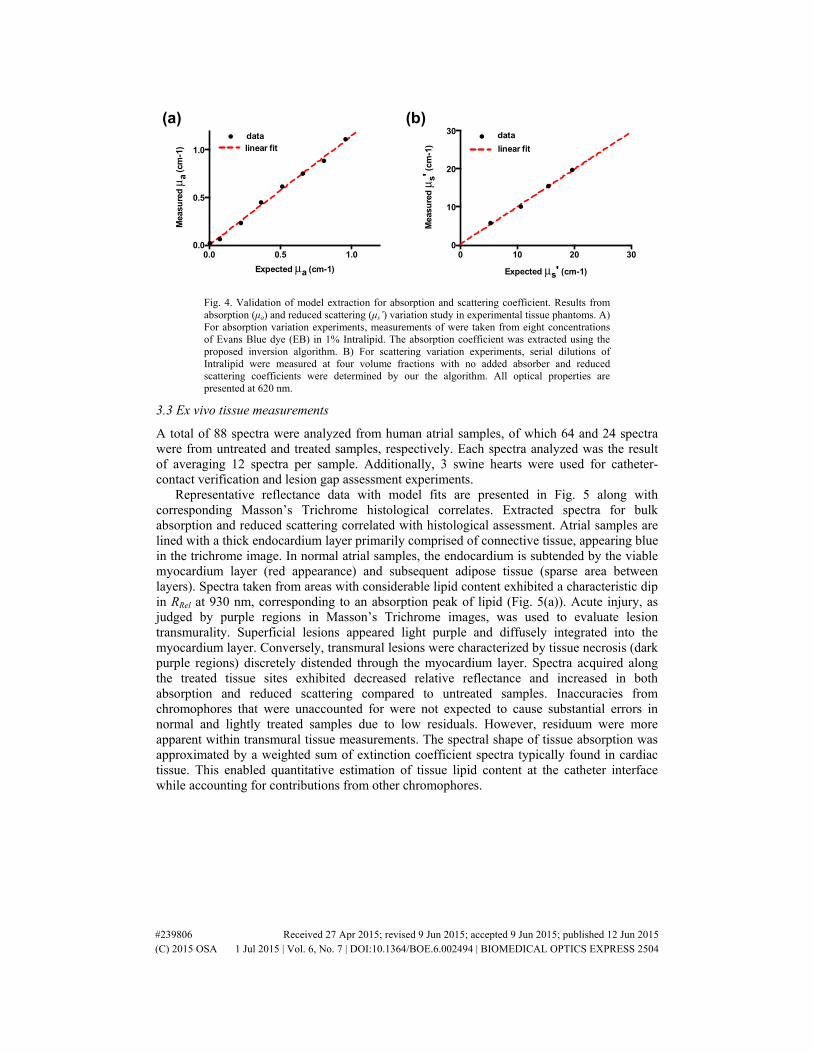
NIRS measurements were made in experimental tissue phantoms in order to validate the algorithm. An absorption variation study was done with different amounts of Evans Blue dye in 1% Intralipid. A total of 12 measurements were averaged for each dilution and fit using a linear combination of lipid, water, and Evans Blue absorption spectra to model absorption. A comparison for extracted and expected absorption at 620 nm is shown in Fig. 4(a). A linear correlation was observed with a slight overestimation (up to 12%) at higher values of absorptions. The reduced scattering experiment results (Fig. 4(b)) revealed a maximum error of about 3.3% within the range studied.
#239806 Received 27 Apr 2015; revised 9 Jun 2015; accepted 9 Jun 2015; published 12 Jun 2015 (C) 2015 OSA 1 Jul 2015 | Vol. 6, No. 7 | DOI:10.1364/BOE.6.002494 | BIOMEDICAL OPTICS EXPRESS 2503
0.0 0.5 1.00.0
0.5
1.0
Expected μa (cm-1)
Mea
sure
d μ a
(cm
-1)
• datalinear fit
0 10 20 300
10
20
30
Expected μs' (cm-1)
Mea
sure
d μ s
' (cm
-1)
• datalinear fit
A B(a) (b)
Fig. 4. Validation of model extraction for absorption and scattering coefficient. Results from absorption (μa) and reduced scattering (μs’) variation study in experimental tissue phantoms. A) For absorption variation experiments, measurements of were taken from eight concentrations of Evans Blue dye (EB) in 1% Intralipid. The absorption coefficient was extracted using the proposed inversion algorithm. B) For scattering variation experiments, serial dilutions of Intralipid were measured at four volume fractions with no added absorber and reduced scattering coefficients were determined by our the algorithm. All optical properties are presented at 620 nm.
3.3 Ex vivo tissue measurements
A total of 88 spectra were analyzed from human atrial samples, of which 64 and 24 spectra were from untreated and treated samples, respectively. Each spectra analyzed was the result of averaging 12 spectra per sample. Additionally, 3 swine hearts were used for catheter-contact verification and lesion gap assessment experiments.
Representative reflectance data with model fits are presented in Fig. 5 along with corresponding Masson’s Trichrome histological correlates. Extracted spectra for bulk absorption and reduced scattering correlated with histological assessment. Atrial samples are lined with a thick endocardium layer primarily comprised of connective tissue, appearing blue in the trichrome image. In normal atrial samples, the endocardium is subtended by the viable myocardium layer (red appearance) and subsequent adipose tissue (sparse area between layers). Spectra taken from areas with considerable lipid content exhibited a characteristic dip in RRel at 930 nm, corresponding to an absorption peak of lipid (Fig. 5(a)). Acute injury, as judged by purple regions in Masson’s Trichrome images, was used to evaluate lesion transmurality. Superficial lesions appeared light purple and diffusely integrated into the myocardium layer. Conversely, transmural lesions were characterized by tissue necrosis (dark purple regions) discretely distended through the myocardium layer. Spectra acquired along the treated tissue sites exhibited decreased relative reflectance and increased in both absorption and reduced scattering compared to untreated samples. Inaccuracies from chromophores that were unaccounted for were not expected to cause substantial errors in normal and lightly treated samples due to low residuals. However, residuum were more apparent within transmural tissue measurements. The spectral shape of tissue absorption was approximated by a weighted sum of extinction coefficient spectra typically found in cardiac tissue. This enabled quantitative estimation of tissue lipid content at the catheter interface while accounting for contributions from other chromophores.
#239806 Received 27 Apr 2015; revised 9 Jun 2015; accepted 9 Jun 2015; published 12 Jun 2015 (C) 2015 OSA 1 Jul 2015 | Vol. 6, No. 7 | DOI:10.1364/BOE.6.002494 | BIOMEDICAL OPTICS EXPRESS 2504

Fig. 5. Representative histological correlates of RF treated human atrial samples along with respective optical measurements. Panels (a) and (b) shows Masson’s Trichrome staining and corresponding measured tissue reflectance, absorption, and reduced scattering for normal LA and RA specimens, respectively. (c),(d) and (e),(f) shows similar LA and RA measurements obtained for superficial and transmural lesions, respectively. Collagen is represented by blue appearance, while red denotes the intact myocardium. Areas of tissue necrosis are identified with arrows and manifest as a purple hue in the trichrome stained slide. Spectral changes are clearly identified with respect to degree of RFA treatment. Specifically, progressive lesion transmurality is seen to be consistent with decreased tissue reflectance and increased absorption and reduced scattering. RA - right atrium, LA – left atrium; Bar is 2mm.
3.3.1 Statistical analysis of untreated and RFA treated tissue
Statistical comparisons for extracted chromophore concentrations are presented in Fig. 6. Significant changes were observed between normal and ablated tissue for both the RA and LA. Extracted values for HbO2 and MbO2 were significantly different between normal and ablated tissue measurements (p<0.0001) for both RA and LA. Concentrations for Hb were considerably lower than HbO2 and showed statistically significance between ablated RA and LA (p<0.0001), RA (p<0.0001), and ablated LA (p<0.05) in addition to LA and ablated LA samples (p<0.05). Changes in water content were also significant between ablated RA compared to both LA (p<0.001) and RA (p<0.0001). Similar differences were also observed comparing ablated LA to LA (p<0.0001) and RA (p<0.0001). The estimated collagen fraction with untreated LA and RA were significantly greater than treated RA (p<0.05), however this was not apparent in the treated LA.
#239806 Received 27 Apr 2015; revised 9 Jun 2015; accepted 9 Jun 2015; published 12 Jun 2015 (C) 2015 OSA 1 Jul 2015 | Vol. 6, No. 7 | DOI:10.1364/BOE.6.002494 | BIOMEDICAL OPTICS EXPRESS 2505

Fig. 6. Statistical analysis of determined chromophore concentrations for ex vivo human atrial samples. All parameters were extracted simultaneously for each sample in the each of the four cohorts. The number of samples for each group was as follows: untreated LA (n = 34), untreated RA (n = 30), treated LA (n = 13), treated RA (n = 11). Bars are presented as mean and standard deviation.. Statistical significance with respect to LA_abl group: °(p<0.05), °°(p<0.001), °°°(p<0.0001); Statistical significance with respect to RA_abl group: *(p<0.05), **(p<0.001), ***(p<0.0001).
In order to gauge the effect of lesion injury on optical measurements from swine cardiac tissue, preliminary lesions were first created in the swine RV. Representative spectra were taken from samples subjected to three different treatment levels (untreated, lightly treated, moderately treated). Figure 7 shows the gross, TTC-stained swine RV specimen along with corresponding results from optical measurements. A similar trend in tissue RRel, μa, and μs’ values were observed compared to human values. RRel decreased monotonically, while μa, μs’, and the scattering slope increased with injury. Compared to the human data, the magnitude of RRel was about 30-40% less in the swine tissue, however, the statistical significance was not determined.
#239806 Received 27 Apr 2015; revised 9 Jun 2015; accepted 9 Jun 2015; published 12 Jun 2015 (C) 2015 OSA 1 Jul 2015 | Vol. 6, No. 7 | DOI:10.1364/BOE.6.002494 | BIOMEDICAL OPTICS EXPRESS 2506

Fig. 7. Representative gross pathology and spectra taken from ex vivo swine cardiac tissues. Panel (a) shows from left to right a TTC stained, gross pathology cross-section of the normal myocardium and corresponding tissue reflectance, absorption, and reduced scattering measurements. Red denotes the uninjured, intact myocardium. (b) and (c) shows similar measurements obtained for superficial and deep lesions, respectively. The pale areas marked by the arrows denote the regions of tissue necrosis. It is observed that regions of increased lesion depth were also consistent also associated with decreased tissue reflectance and increased absorption and reduced scattering in swine cardiac tissue. Bar is 3mm.
Linear lesions were generated on the endocardial surface of the swine RA and were followed by subsequent NIRS measurement along the segment. Lesion depths along the line of ablation were revealed by TTC staining. Comparisons between lesion depth and extracted RRel and µa at 730 nm are shown in Fig. 8(a). Extracted values were upsampled using cubic spline interpolation for presentation. Areas of discontinuities were distinguished by higher µa, decreased RRel, and increased µs’. Finally, a linear correlation (R2 = 0.83) between lesion depth and the inverse of the RRel parameter was observed (Fig. 8(b)). Although linearity was demonstrated at 730 nm, a similar relationship was observed across the fitted spectral range considered (not shown).
0 1 2 30
1
2
3
4
5
Lesion Depth (mm)
1/R R
el(a
.u.)
• datalinear fit: R2 0.82
0 1 2 30.0
0.5
1.0
Lesion Depth (mm)
μ a [c
m-1
]
• datalinear fit: R2 0.84
B
X (mm)
0 5 10 15 20 250.5
1
1.5
2
2.5
3
1/RRe
l (a.u.
)
X ( )
0 5 10 15 20 250
0.2
0.4
0.6
0.8
μ a (cm-1 )
X (mm)
0 5 10 15 20 250
1
2
3
Lesio
n Dep
th (m
m)
X (mm) 0 5 10 15 20 25Lesi
on D
epth
(mm
)
0123
0 5 10 15 20 25
Rel
()
2
3
4
0 5 10 15 20 25
0.2
0.40.6
µ a (c
m-1
) 1/
RR
el (a
.u.)
Lesi
on D
epth
(mm
)
A (a) (b)
Fig. 8. Lesion Gap Assessment in Swine Atria. (a) shows two representative right atrial samples of measurements taken along a discontinuous lesion segment. From top to bottom shows a cross-section of TTC stained RA tissue after a discontinuous line RFA treatment, extracted lesion depth from image processing, inverted RRel, and extracted μa as a function of lateral distance. Bar is 3 mm. (b) shows a correlation of the inverted RRel parameter and absorption with lesion depth. Black dashed lines indicates the 95% confidence interval band. All optical properties are expressed at 730 nm and were determined from the mean of 12 spectra.
#239806 Received 27 Apr 2015; revised 9 Jun 2015; accepted 9 Jun 2015; published 12 Jun 2015 (C) 2015 OSA 1 Jul 2015 | Vol. 6, No. 7 | DOI:10.1364/BOE.6.002494 | BIOMEDICAL OPTICS EXPRESS 2507
3.5 Contact assessment
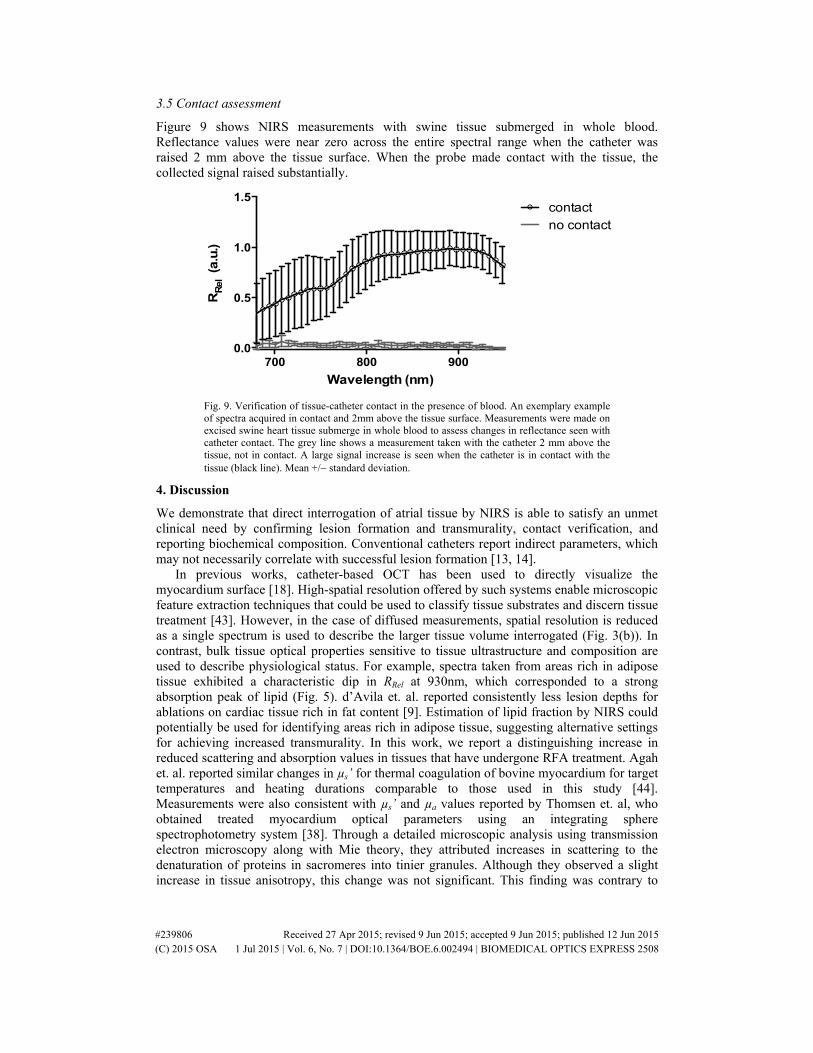
Figure 9 shows NIRS measurements with swine tissue submerged in whole blood. Reflectance values were near zero across the entire spectral range when the catheter was raised 2 mm above the tissue surface. When the probe made contact with the tissue, the collected signal raised substantially.
Wavelength (nm)
RRe
l (a
.u.)
700 800 9000.0
0.5
1.0
1.5contactno contact
Fig. 9. Verification of tissue-catheter contact in the presence of blood. An exemplary example of spectra acquired in contact and 2mm above the tissue surface. Measurements were made on excised swine heart tissue submerge in whole blood to assess changes in reflectance seen with catheter contact. The grey line shows a measurement taken with the catheter 2 mm above the tissue, not in contact. A large signal increase is seen when the catheter is in contact with the tissue (black line). Mean +/− standard deviation.
4. Discussion
We demonstrate that direct interrogation of atrial tissue by NIRS is able to satisfy an unmet clinical need by confirming lesion formation and transmurality, contact verification, and reporting biochemical composition. Conventional catheters report indirect parameters, which may not necessarily correlate with successful lesion formation [13, 14].
In previous works, catheter-based OCT has been used to directly visualize the myocardium surface [18]. High-spatial resolution offered by such systems enable microscopic feature extraction techniques that could be used to classify tissue substrates and discern tissue treatment [43]. However, in the case of diffused measurements, spatial resolution is reduced as a single spectrum is used to describe the larger tissue volume interrogated (Fig. 3(b)). In contrast, bulk tissue optical properties sensitive to tissue ultrastructure and composition are used to describe physiological status. For example, spectra taken from areas rich in adipose tissue exhibited a characteristic dip in RRel at 930nm, which corresponded to a strong absorption peak of lipid (Fig. 5). d’Avila et. al. reported consistently less lesion depths for ablations on cardiac tissue rich in fat content [9]. Estimation of lipid fraction by NIRS could potentially be used for identifying areas rich in adipose tissue, suggesting alternative settings for achieving increased transmurality. In this work, we report a distinguishing increase in reduced scattering and absorption values in tissues that have undergone RFA treatment. Agah et. al. reported similar changes in µs’ for thermal coagulation of bovine myocardium for target temperatures and heating durations comparable to those used in this study [44]. Measurements were also consistent with µs’ and µa values reported by Thomsen et. al, who obtained treated myocardium optical parameters using an integrating sphere spectrophotometry system [38]. Through a detailed microscopic analysis using transmission electron microscopy along with Mie theory, they attributed increases in scattering to the denaturation of proteins in sacromeres into tinier granules. Although they observed a slight increase in tissue anisotropy, this change was not significant. This finding was contrary to
#239806 Received 27 Apr 2015; revised 9 Jun 2015; accepted 9 Jun 2015; published 12 Jun 2015 (C) 2015 OSA 1 Jul 2015 | Vol. 6, No. 7 | DOI:10.1364/BOE.6.002494 | BIOMEDICAL OPTICS EXPRESS 2508

observations by Swartling et. al. who noted a reduction in anisotropy for ablated tissues [21]. Demos et. al reported an increase in scattering during ablation which manifested as an increase in normalized reflectance for their employed source-detector separation [33]. However, MC simulations (Fig. 3(a)) reveal that an increase in µs’ would result in a decrease in reflectance for our optical geometry. In addition, because a baseline-normalized parameter was used, it is unclear whether the technique could evaluate pre-existing lesions, such as in arrhythmia recurrence.
Tissue reflectance and absorption measurements showed stark correspondence with atrial lesion depth, as shown in Fig. 8. This showed that NIRS not only had the ability to detect lesion gaps along the linear segment, but potentially reveal transmurality of treated sites. Discontinuities along lesion lines may not readily be detected with electrical mapping techniques [45]. Gaps in lines may be momentarily electrically inactive despite efforts to reveal them with concurrent drugs or stimulation by pacing [45]. Uncovering spaces in linear ablations are particularly important during pulmonary vein isolation, where recurrence is often ascribed to inadequate lesion formation along the initial RFA treated segment [45, 46]. Optical data recovered from this method could provide in vivo confirmation of lesion line continuity and transmurality, potentially increasing success rates and minimizing patient repeat visits. In patients with recurrent arrhythmias, this technique could also be used to determine pre-ablated regions without a priori information.
Optical measurements were made on human left and right atrial tissue, ex vivo. Human hearts used in this study were derived from patients with a distribution of medical histories, including myocardial infarction, hypertension, diabetes, coronary artery disease, cardiomyopathy, and stent and pacemaker implantations. The underlying tissue pathology may have contributed to a difference in chromophore content or tissue ultrastructure that could have consequently affected spectral measurements. Moreover, the atrium composition is not necessarily uniform across a sample and may depend on anatomical location [31]. These factors may have contributed to increased variability and standard deviations within measurements (Fig. 6) since samples were taken from multiple sites within the atria. In essence, more experiments in healthy cardiac samples are needed to characterize anatomically dependent tissue substrates. Reif et. al. reported that the applied catheter contact pressure influences diffuse reflectance measurements and chromophore extraction in a predictable manner [47]. Although in this study, care was taken to establish gentle catheter contact with the tissue, incorporating correction factors for applied pressure could be used to improve accuracy of the proposed method. Another attributing factor may be subtle variations in Mb and Hb spectra that occur as a result of temperature, pH, or differences in species [48]. In regard to the latter, the principle component spectra used in the fitting procedure were retrieved from disparate species including equine, bovine, swine, and human data; however, this effect was not expected to significantly influence the results [21, 48]. Albeit, a slightly differing spectral shape for RRel was observed for swine tissue as compared with measurements from human tissue. A possible explanation could be the increased endocardium wall thickness found in human atrial tissue compared to that of the swine. Collagen structures such as those prevalent in the endocardium wall are known to exhibit increases in scattering slope due to increased Rayleigh-like scattering [40]. In addition, the spectrometer used in this study had a dynamic range of 300:1 and required long integration times to maximize SNR. Thus, due to the higher attenuation, RF treated samples may have been more prone to SNR related errors. One way to improve measurement robustness, considering the high absorption sensitivity of the employed optical geometry (Fig. 3), is to use a spectrometer with a larger dynamic range and optical throughput. Additionally, robustness of the inversion routine could be improved using an evolutionary algorithmic approach to ensure convergence of parameters at the global minima.
Myoglobin is the dominant chromophore in muscle tissue and is approximately 10 times more prevalent than Hb [48]. In this work, cardiac sample preparation involved atrial excision
#239806 Received 27 Apr 2015; revised 9 Jun 2015; accepted 9 Jun 2015; published 12 Jun 2015 (C) 2015 OSA 1 Jul 2015 | Vol. 6, No. 7 | DOI:10.1364/BOE.6.002494 | BIOMEDICAL OPTICS EXPRESS 2509

and rinsing in PBS, removing residual blood. In Swartling et. al., spectral analysis obtained from the excised myocardium revealed minimal contributions of Hb and regarded Mb as the dominant chromophore [21]. It has also been noted that the oxidation process that moves the normal ferrous state protein into a ferric state is more prone to occur in Mb than the former [21, 48]. Thus, the formation of methemoglobin in excised and irrigated cardiac samples, as used in this study, were expected to be minimal during treatment. Instead, metMb was considered to influence most of the ferric state contributions in absorption changes. Albeit, the extracted concentrations for Hb derivatives are non-zero, this may suggest some cross-talk between extraction of Hb and Mb coefficients. Swartling et. al. reported that differences in Hb and Mb spectra are minimal in the NIR window; the differences in the Q-band are inherently better suited for spectral unmixing. However, while the organometallic compounds may be subject to cross-talk, this may not necessarily influence the reliability of the determination of other compounds, such as lipid; which is a relevant parameter in electroanatomic mapping of arrhythmias or determining ablation energy [9, 12]. In future in vivo experiments, methemoglobin contributions will be added due to the increased Hb content in the surrounding media and perfused coronary circulation.
In general, employing a semi-infinite model can limit the fidelity of the reflectance inversion routine for relatively thin samples. The MVD simulation noted that the mean sampling depth falls within the average atrial wall thickness. Considering that the estimated fraction of collected photons that visited a depth of at least 5 mm was approximately 86.7%, this suggests that optical measurements are much less influenced by the medium beyond 5 mm under normal conditions. In addition, the MVD simulation employed optical properties obtained from Swartling et. al. which were derived from the ventricular epicardium; optical properties for atrial tissue are not well reported in literature. The atrial endocardium is expected to have an increase in bulk tissue scattering due to the thick fibrous layer superficial to the myocardium. This is expected to reduce the mean MVD, biasing more photons within the atrial wall thickness. Moreover, ablated tissues exhibit an increase in both absorption and reduced scattering that is expected to further reduce photon penetration depth. Thus, the error of using a semi-infinite model, as opposed to a heterogeneous model was not expected to produce significant error in our results.
A common culprit for insufficient lesion formation is unsustained catheter-tissue contact throughout the application of RF energy. Therefore an aim of this study was to evaluate whether a gross difference in measured spectra could be used to discern catheter contact. Thus, measurements were taken from various sites on the blood-immersed myocardium, including both atrial and ventricular tissues. Spectral reflectance values for non-contact measurements were near zero and increased substantially when catheter contact was established. A similar observation was made by Demos et. al., supporting the ability of NIRS to verify catheter-tissue contact [25]. Although large standard deviations of measured reflectance are shown for the contact case, likely due to differences in structure and composition between ventricular and supraventricular tissue [49–51], the pronounced change in reflected signal intensity suggests that a simple threshold-based method could be used to monitor tissue contact throughout the course of ablation. In an OCT-based catheter system, large changes in image penetration (increased signal intensity), can similarly discern contact [18, 43].
All human sample measurements were made in ex vivo samples acquired within 48 hours after donor death. We demonstrated the feasibility of our NIRS-catheter to characterize tissue substrates and optical properties. Although samples were continuously preserved in ice until experiments, ex vivo tissue biochemical changes may not be reflective of in vivo conditions. For example, tissue metabolism does not account for the conversion of oxygenated to deoxygenated hemoglobin in ex vivo samples. Thus, this poses limitations on accuracy of the reciprocal relationship of Hb and HbO2 concentrations assumed in the absorption model. Thus, future work will be aimed at in vivo experimentation in large animal models. Albeit,
#239806 Received 27 Apr 2015; revised 9 Jun 2015; accepted 9 Jun 2015; published 12 Jun 2015 (C) 2015 OSA 1 Jul 2015 | Vol. 6, No. 7 | DOI:10.1364/BOE.6.002494 | BIOMEDICAL OPTICS EXPRESS 2510

results from this pilot study provokes the need for such work. Another limitation of the optical parameter extraction routine is the assumption of chromophore homogeneity within the sample. In practice, atrial tissue is comprised of relatively discrete layers, each with a different architecture and dominant chromophore (Fig. 5(a), 5(d)). The endocardium is mostly comprised of dense connective tissue (collagen); Mb and adipose tissue dominate the myocardium and lipid layer, respectively. Results from MC simulations (Fig. 3(b)) suggest that measurement sensitivity is not uniform along the thickness of the sample and thus certain layers are likely to have more influence on the acquired signal than others. In regards to system design, the current implementation requires orthogonal contact with the tissue for reliable measurements. In practice however, catheters may ablate tissue at various angles of incidence. Therefore, prospective designs will require multiple source-detector pairs to better accommodate tilt angles used clinically.
5. Conclusion
In closing, we present a NIRS-integrated catheter for the characterization of parameters relevant to RFA therapies. An inverse MC method was used to quantify tissue optical properties observed at the tissue-catheter interface in ex vivo cardiac samples, which provided information regarding tissue composition, lesion transmurality, and catheter-tissue contact. Results were shown to be consistent with previous studies employing robust optical quantification methods unsuited for in vivo use. Results support the use of catheter-based NIRS for improved guidance of RFA procedures.
Acknowledgments
The authors would like to thank Christopher A. Hermawi for useful aid during experiments. This work was supported in part by National Institutes of Health grant NIH 1DP2HL127776-01 (CPH) and National Science Foundation funding, NSF EEC-1342273 (CPH) and NSF Career Award 1454365 (CPH).
#239806 Received 27 Apr 2015; revised 9 Jun 2015; accepted 9 Jun 2015; published 12 Jun 2015 (C) 2015 OSA 1 Jul 2015 | Vol. 6, No. 7 | DOI:10.1364/BOE.6.002494 | BIOMEDICAL OPTICS EXPRESS 2511


![Infrared Spectroscopy[1]](https://static.fdocuments.net/doc/165x107/5415f1617bef0a7f3f8b49ff/infrared-spectroscopy1.jpg)


