NDVI patterns and phytomass distribution in the ...for understanding arctic vegetation patterns,...
11
NDVI patterns and phytomass distribution in the circumpolar Arctic M.K. Raynolds ⁎ , D.A. Walker, H.A. Maier Alaska Geobotany Center, Institute of Arctic Biology, University of Alaska Fairbanks: 311 Irving, P.O. Box 757000, Fairbanks, AK 99775, United States Received 22 October 2004; received in revised form 30 January 2006; accepted 4 February 2006 Abstract The Circumpolar Arctic Vegetation Map (CAVM) was used to analyze the distribution of NDVI and phytomass in the Arctic, providing data for understanding arctic vegetation patterns, assessing change, and calibrating models. The dominant trend in the analysis of Normalized Difference Vegetation Index (NDVI) was a decrease from south to north, correlating with bioclimate subzones and vegetation units. NDVI also decreased at higher elevations and with higher substrate pH. In the coldest bioclimate subzone, increased elevation was not correlated with decreased NDVI. In the warmest tundra bioclimate subzone, especially in Alaska, NDVI did not decrease with the first several hundred meters of elevation. NDVI in this subzone varied more by region than by elevation or substrate chemistry, and was lowest in recently glaciated areas such as the Canadian Shield. Phytomass (above-ground plant biomass) was calculated from NDVI using a relationship derived from ground clip-harvest data. Phytomass for the tundra bioclimate subzone was estimated at 2.5 × 10 12 kg, with most of this in the warmest subzone, at the lowest elevations, and on acidic substrates. © 2006 Elsevier Inc. All rights reserved. Keywords: NDVI; Phytomass; Plant biomass; Arctic; Arctic vegetation; Tundra; Circumpolar; Circumpolar Arctic vegetation map; Bioclimate zones; Substrate pH; Elevation 1. Introduction Arctic land use is undergoing rapid change: expanding resource extraction and changing cultural practices are predicted to seriously impact over half of the Arctic within the next 50 years (Nellemann et al., 2001). In addition, the climate is changing; some areas are cooling while most are warming (Comiso, 2003; Hassol, 2004). As a result vegetation in the Arctic is changing (Goetz et al., 2005; Stow et al., 2004), including characteristics such as phytomass (aboveground plant biomass) (Jia et al., 2003). In order to determine the scale and importance of these changes and to evaluate any actions that might be taken in response, it is necessary to understand the present distribution of Arctic vegetation and phytomass. To meet this need, an international group of vegetation scientists collaborated to produce the Circumpolar Arctic Vegetation Map (CAVM) (CAVM Team, 2003; Walker et al., 2005). This paper summarizes vegetation characteristics indicated by spatial trends in the Normalized Difference Vegetation Index (NDVI) and phytomass shown on the CAVM. This analysis provides data for assessing change on global and regional levels, and is useful for modeling climate change, for land-use planning, resource development, education and conservation studies. 2. Methods 2.1. Overview of the circumpolar Arctic vegetation map The CAVM used AVHRR satellite data to produce a false- color-infrared base map for delineating circumpolar vegetation units. The mapped area included all of the arctic tundra, defined as the bioclimate zone north of the climatic limit of trees that is characterized by an arctic climate, arctic flora, and tundra vegetation. It excluded tundra regions that have a boreal flora such as the boreal oceanic areas of Iceland and the Aleutian Islands, and anthropogenic treeless areas such as parts of Iceland, Fennoscandia and the Kola Peninsula. Alpine tundra regions south of the latitudinal treeline were also excluded Remote Sensing of Environment 102 (2006) 271 – 281 www.elsevier.com/locate/rse ⁎ Corresponding author. Tel.: +1 907 474 6720; fax: +1 907 474 6967. E-mail addresses: [email protected] (M.K. Raynolds), [email protected] (D.A. Walker), [email protected] (H.A. Maier). 0034-4257/$ - see front matter © 2006 Elsevier Inc. All rights reserved. doi:10.1016/j.rse.2006.02.016
Transcript of NDVI patterns and phytomass distribution in the ...for understanding arctic vegetation patterns,...

nt 102 (2006) 271–281www.elsevier.com/locate/rse
Remote Sensing of Environme
NDVI patterns and phytomass distribution in the circumpolar Arctic
M.K. Raynolds ⁎, D.A. Walker, H.A. Maier
Alaska Geobotany Center, Institute of Arctic Biology, University of Alaska Fairbanks: 311 Irving, P.O. Box 757000, Fairbanks, AK 99775, United States
Received 22 October 2004; received in revised form 30 January 2006; accepted 4 February 2006
Abstract
The Circumpolar Arctic Vegetation Map (CAVM) was used to analyze the distribution of NDVI and phytomass in the Arctic, providing datafor understanding arctic vegetation patterns, assessing change, and calibrating models. The dominant trend in the analysis of NormalizedDifference Vegetation Index (NDVI) was a decrease from south to north, correlating with bioclimate subzones and vegetation units. NDVI alsodecreased at higher elevations and with higher substrate pH. In the coldest bioclimate subzone, increased elevation was not correlated withdecreased NDVI. In the warmest tundra bioclimate subzone, especially in Alaska, NDVI did not decrease with the first several hundred meters ofelevation. NDVI in this subzone varied more by region than by elevation or substrate chemistry, and was lowest in recently glaciated areas such asthe Canadian Shield. Phytomass (above-ground plant biomass) was calculated from NDVI using a relationship derived from ground clip-harvestdata. Phytomass for the tundra bioclimate subzone was estimated at 2.5×10¹² kg, with most of this in the warmest subzone, at the lowestelevations, and on acidic substrates.© 2006 Elsevier Inc. All rights reserved.
Keywords: NDVI; Phytomass; Plant biomass; Arctic; Arctic vegetation; Tundra; Circumpolar; Circumpolar Arctic vegetation map; Bioclimate zones; Substrate pH;Elevation
1. Introduction
Arctic land use is undergoing rapid change: expandingresource extraction and changing cultural practices arepredicted to seriously impact over half of the Arctic withinthe next 50 years (Nellemann et al., 2001). In addition, theclimate is changing; some areas are cooling while most arewarming (Comiso, 2003; Hassol, 2004). As a result vegetationin the Arctic is changing (Goetz et al., 2005; Stow et al., 2004),including characteristics such as phytomass (aboveground plantbiomass) (Jia et al., 2003). In order to determine the scale andimportance of these changes and to evaluate any actions thatmight be taken in response, it is necessary to understand thepresent distribution of Arctic vegetation and phytomass. Tomeet this need, an international group of vegetation scientistscollaborated to produce the Circumpolar Arctic Vegetation Map(CAVM) (CAVM Team, 2003; Walker et al., 2005). This paper
⁎ Corresponding author. Tel.: +1 907 474 6720; fax: +1 907 474 6967.E-mail addresses: [email protected] (M.K. Raynolds), [email protected]
(D.A. Walker), [email protected] (H.A. Maier).
0034-4257/$ - see front matter © 2006 Elsevier Inc. All rights reserved.doi:10.1016/j.rse.2006.02.016
summarizes vegetation characteristics indicated by spatialtrends in the Normalized Difference Vegetation Index (NDVI)and phytomass shown on the CAVM. This analysis providesdata for assessing change on global and regional levels, and isuseful for modeling climate change, for land-use planning,resource development, education and conservation studies.
2. Methods
2.1. Overview of the circumpolar Arctic vegetation map
The CAVM used AVHRR satellite data to produce a false-color-infrared base map for delineating circumpolar vegetationunits. The mapped area included all of the arctic tundra, definedas the bioclimate zone north of the climatic limit of trees that ischaracterized by an arctic climate, arctic flora, and tundravegetation. It excluded tundra regions that have a boreal florasuch as the boreal oceanic areas of Iceland and the AleutianIslands, and anthropogenic treeless areas such as parts ofIceland, Fennoscandia and the Kola Peninsula. Alpine tundraregions south of the latitudinal treeline were also excluded

272 M.K. Raynolds et al. / Remote Sensing of Environment 102 (2006) 271–281
(Walker et al., 2005). The total area of the arctic tundra asmapped by the CAVM was 7.11×10⁶ km2.
2.2. NDVI
Spectrum ratios such as NDVI were developed for non-destructive measurement of vegetation attributes from theground (Jordan, 1969), and were then successfully applied tosatellite spectral reflectance data (Rouse et al., 1974). NDVI is ameasure of relative greenness, calculated as: NDVI=(NIR−R) /(NIR+R), where NIR is the spectral reflectance in the near-infrared where light-reflectance from the plant canopy isdominant, and R is the reflectance in the red portion of thespectrum where chlorophyll absorbs maximally. The NDVI datafor this analysis were calculated from the CAVM AdvancedVery High Resolution Radiometer (AVHRR) image, comparingthe spectral reflectance in the near-infrared channel (0.725–
a)
c)
Fig. 1. Small-scale versions of CAVM ancillary maps: (a) NDVI/phytomass, (b) bi
1.1 μm) with reflectance in the red channel (0.5 to 0.68 μm)(Fig. 1a).
NDVI is affected by a variety of satellite and surfaceconditions, especially cloud cover and viewing angle, that canbe compensated for by compositing data over time (Goward etal., 1991). Pixel data for this study were chosen for maximumgreenness, selected from biweekly images from 11 July through31 August in 1993 and 1995 (CAVM Team, 2003). Thus thedata were composited first by taking the maximum value withintwo-week time periods, eliminating many pixels with cloudcover, then by taking the maximum of those pixels within tworelatively cloud-free summers. The result was an almost cloud-free data set of peak NDVI for the circumpolar Arctic in theearly 1990s.
NDVI has a theoretical maximum of 1 and is asymptoticallynon-linear as it approaches 1, and is therefore less sensitive toground characteristics at higher values. NDVI essentially
b)
d)
oclimate subzones, (c) substrate chemistry, (d) elevation (CAVM Team, 2003).
273M.K. Raynolds et al. / Remote Sensing of Environment 102 (2006) 271–281
saturates in areas with a leaf area index (LAI)N1 (van Wijk &Williams, 2005). This is generally not a severe problem in theArctic where vegetation is often sparse and patchy, with anLAIb1. Areas of dense shrub cover with NDVIN0.6 are notwell represented by this index, but do not cover large areas inthe Arctic (Fig. 1a). The mean NDVI for the CAVM mappedarea, excluding ice and water, was 0.32, well below thesaturation point.
NDVI has been found to relate well to biophysical propertiesof arctic tundra on the ground, increasing with the amount ofvegetation as measured by leaf area index (LAI) and phytomass(Riedel et al., 2005; Shippert et al., 1995). NDVI measuresground characteristics in a way that correlates well with arcticvegetation types (Hope et al., 1993; Stow et al., 1993) and ageof arctic glacial surfaces (Walker et al., 1995). NDVI has beenespecially useful for analyzing variation in vegetation overlarge, remote regions of the Arctic (Bogaert et al., 2002; Jia etal., 2002; Markon et al., 1995; Shippert et al., 1995; Walker etal., 2003; Zhou et al., 2001).
2.3. CAVM maps
The CAVM included an integrated ARC/INFO database of6717 polygons, coded for six geobotanical attributes, includingvegetation (16 units), bioclimate subzone (5 units), floristicprovince (23 units), substrate chemistry (3 units), lake cover(6 units), and landscape type (7 units). The CAVM also includedrastar images of elevation data (Digital Chart of the World;ESRI, 1993), and false-color-infrared (false-CIR), NDVI, andphytomass versions of the AVHRR composite image.
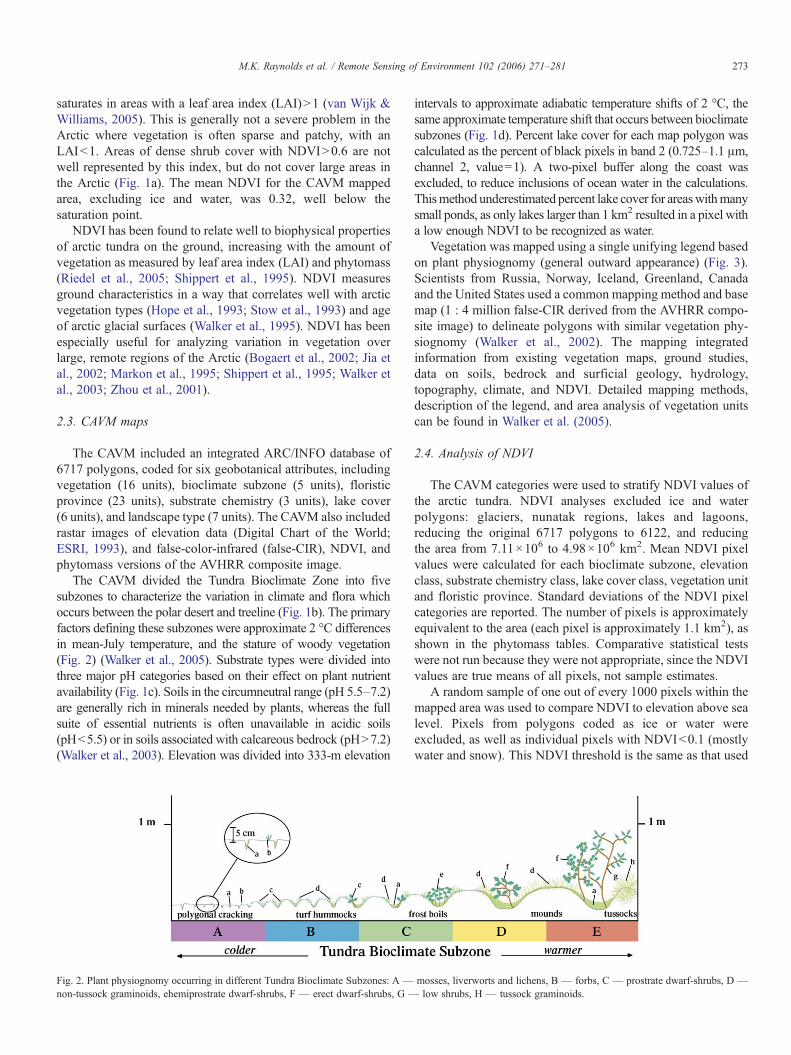
The CAVM divided the Tundra Bioclimate Zone into fivesubzones to characterize the variation in climate and flora whichoccurs between the polar desert and treeline (Fig. 1b). The primaryfactors defining these subzones were approximate 2 °C differencesin mean-July temperature, and the stature of woody vegetation(Fig. 2) (Walker et al., 2005). Substrate types were divided intothree major pH categories based on their effect on plant nutrientavailability (Fig. 1c). Soils in the circumneutral range (pH 5.5–7.2)are generally rich in minerals needed by plants, whereas the fullsuite of essential nutrients is often unavailable in acidic soils(pHb5.5) or in soils associated with calcareous bedrock (pHN7.2)(Walker et al., 2003). Elevation was divided into 333-m elevation
Fig. 2. Plant physiognomy occurring in different Tundra Bioclimate Subzones: A —non-tussock graminoids, ehemiprostrate dwarf-shrubs, F — erect dwarf-shrubs, G —
intervals to approximate adiabatic temperature shifts of 2 °C, thesame approximate temperature shift that occurs between bioclimatesubzones (Fig. 1d). Percent lake cover for each map polygon wascalculated as the percent of black pixels in band 2 (0.725–1.1 μm,channel 2, value=1). A two-pixel buffer along the coast wasexcluded, to reduce inclusions of ocean water in the calculations.Thismethod underestimated percent lake cover for areaswithmanysmall ponds, as only lakes larger than 1 km2 resulted in a pixel witha low enough NDVI to be recognized as water.
Vegetation was mapped using a single unifying legend basedon plant physiognomy (general outward appearance) (Fig. 3).Scientists from Russia, Norway, Iceland, Greenland, Canadaand the United States used a common mapping method and basemap (1 : 4 million false-CIR derived from the AVHRR compo-site image) to delineate polygons with similar vegetation phy-siognomy (Walker et al., 2002). The mapping integratedinformation from existing vegetation maps, ground studies,data on soils, bedrock and surficial geology, hydrology,topography, climate, and NDVI. Detailed mapping methods,description of the legend, and area analysis of vegetation unitscan be found in Walker et al. (2005).
2.4. Analysis of NDVI
The CAVM categories were used to stratify NDVI values ofthe arctic tundra. NDVI analyses excluded ice and waterpolygons: glaciers, nunatak regions, lakes and lagoons,reducing the original 6717 polygons to 6122, and reducingthe area from 7.11×10⁶ to 4.98×10⁶ km2. Mean NDVI pixelvalues were calculated for each bioclimate subzone, elevationclass, substrate chemistry class, lake cover class, vegetation unitand floristic province. Standard deviations of the NDVI pixelcategories are reported. The number of pixels is approximatelyequivalent to the area (each pixel is approximately 1.1 km2), asshown in the phytomass tables. Comparative statistical testswere not run because they were not appropriate, since the NDVIvalues are true means of all pixels, not sample estimates.
A random sample of one out of every 1000 pixels within themapped area was used to compare NDVI to elevation above sealevel. Pixels from polygons coded as ice or water wereexcluded, as well as individual pixels with NDVIb0.1 (mostlywater and snow). This NDVI threshold is the same as that used
mosses, liverworts and lichens, B — forbs, C — prostrate dwarf-shrubs, D —low shrubs, H — tussock graminoids.

Fig. 3. Small-scale version of the Circumpolar Arctic Vegetation Map (Walker et al., 2005).
274 M.K. Raynolds et al. / Remote Sensing of Environment 102 (2006) 271–281
to exclude snow and water pixels when tracking green-up andsenescence of tundra vegetation (Jia et al., 2004). Scatter plotsof NDVI by elevation were used to examine differencesbetween countries in each of the five bioclimate subzones. Eachsubzone was further stratified by elevation (20 random pixelswithin 200-m elevation categories) and analyzed by regression.
Weighted general linear models were run to examine thevariability in mean polygon NDVI weighted by area that wasexplained by bioclimate subzone, floristic province or country,elevation class, substrate chemistry class, and lake cover class(PROC GLM: SAS, 1989).
2.5. Estimates of phytomass from NDVI
NDVI has been used to estimate aboveground biomass(phytomass) for areas ranging from plots (Asrar et al., 1985) to
biomes (Goward et al., 1985). Studieswithin arctic vegetation typeshave found limited correlation between NDVI and phytomass, butthe relationship improves when more cover types are included(Boelman et al., 2005; Hope et al., 1993; Riedel et al., 2005).Researchers had assumed that NDVI would estimate greenphytomass better than total phytomass, but for reasons that havenot yet been explained the opposite has been the case (Riedel et al.,2005; Shippert et al., 1995), increasing confidence in estimates oftotal phytomass derived from NDVI. By using composited NDVIvalues such as annual peak NDVI, and analyzing larger regionswith a correspondingly larger range in NDVI values, researchershave found good correlation with total aboveground phytomass(Shippert et al., 1995; Walker et al., 2003).
The NDVI data from this study, doubly composited data of thewhole circumpolar arctic, should have a relatively robustrelationship to phytomass. The relationship was calculated by

0
0.1
0.2
0.3
0.4
0.5
0.6
CA B D E
Bioclimate subzone
ND
VI
Fig. 5. Mean NDVI of tundra bioclimate subzones, lines represent standarddeviation of pixel values.
275M.K. Raynolds et al. / Remote Sensing of Environment 102 (2006) 271–281
regression, using clip harvest data (Fig. 4), as described by Walkeret al. (2003). The phytomass datawere collected on theNorth Slopeof Alaska, with 6–10 replicates at each site, and correlated tomaximum NDVI for an area of homogeneous vegetation aroundeach sample site. Maximum NDVI was calculated from 14-daycomposites of 1 April to 31 October AVHRR data for 1995–1999.
Several researchers have shown linear relationships betweenNDVI and phytomass within arctic vegetation types (Boelmanet al., 2005, 2003; Hope et al., 1993; Riedel et al., 2005). However,when several vegetation types are sampled, including a larger rangeofNDVI values, the relationship is the curved form expected by theNDVI equation (asymptotic to 1) (Hope et al., 1993; Riedel et al.,2005; Walker et al., 2003). The relationship used in this analysisincluded a variety of vegetation types, but was based on a relativelysmall data set, with fewdata points for the lowest and highest valuesof NDVI. Attempts to increase the number of data points byincluding biomass data from other studies were hampered by lackof geo-referenced data and widely varying methods of harvestingand sorting samples (Walker et al., 2003). Points with high NDVIcorrespond to shrub communities with highly variable phytomass,so calculated phytomass values reported in this paper are onlyestimates. However, the relationship is useful for discerning majorpatterns of phytomass distribution in the Arctic.
A phytomass value for each pixel of the AVHRR image wascalculated based on its maximum NDVI value, using therelationship shown in Fig. 4. Phytomass data were summarizedin tables for bioclimate subzones, elevation class, substrate, andchemistry class. The 23 floristic provinces were summarized bycountry to simplify presentation of the results. No more than twosignificant digits were included in the tables, acknowledging thelimited precision of these figures. Due to rounding, the totals in thetables do not sum exactly.
3. Results
3.1. NDVI
Mean NDVI values for the CAVM polygons ranged from−0.04 to 0.66. The mean for all pixels in vegetated polygonswas 0.32 (s.d.= .038). NDVI in the Arctic increased from colder
y = 26.58e6.9357x
R2 = 0.8924
0
500
1000
1500
2000
2500
3000
0 0.1 0.2 0.3 0.4 0.5 0.6 0.7
NDVI
Phyt
omas
s (g
m-2
)
Fig. 4. Regression relationship between aboveground plant biomass (phyto-mass) and NDVI (Walker et al., 2003).
to warmer bioclimate subzones (Fig. 5), from 0.07 (s.d.=0.005)in Subzone A to 0.44 (s.d.=0.042) in Subzone E.
NDVI also decreased as elevation increased (Fig. 6). MeanNDVI for each 333-m elevation category (0 to N1667 m) were0.32, 0.22, 0.15, 0.09, 0.14 and −0.02. There were no values forSubzone A and B at higher elevations, because these areas arepermanently snow-covered. The only areas N1667 m elevation arein Greenland in Subzones C and D, with negative values of NDVIindicating that these areas are mostly rock and ice with littlevegetation. The mean NDVI values for the 0–333 m categoryrepresent the zonalNDVI values for each bioclimate subzone (0.07,0.15, 0.23, 0.35 and 0.46 for Subzones A–E, respectively).
Linear regression of NDVI by elevation for a random sample ofpixels (1/1000 of the total) showed little relationship, with an R2
value of 0.08. This sample was stratified by subzone and plottedagainst elevation in Fig. 7 (a–e). In Subzone A both NDVI valuesand elevation values were low, with little correlation (R2=0.01)(Fig. 7a). In Subzones B through D, NDVI values decreased withelevation, though there were also many low elevation pixels withlow NDVI (Fig. 7b–d). Regression yielded R2 values of 0.13, 0.18and 0.13 for Subzones B, C and D, respectively. In Subzone Eregional differences were pronounced (Fig. 7e). NDVI in Canadashowed no relationship with elevation, while both Russia and theUnited States showed decreases in NDVI after 300 and 600 m
-0.1
0
0.1
0.2
0.3
0.4
0.5
0.6
0-333 334-667 668-1000 1001-1333 1334-1668 >1668
Elevation (m)
ND
VI
A
B
C
D
E
Fig. 6. Mean NDVI of elevation classes divided by subzone, lines representstandard deviation of pixel values.

BioclimateSubzone A
0.00
0.10
0.20
0.30
0.40
0 200 400
Elevation (m)
ND
VI
BioclimateSubzone B
0.00
0.10
0.20
0.30
0.40
0.50
0.60
0.70
0.80
0 200 400 600 800 1000
Elevation (m)
ND
VI
Canada
Greenland
Iceland
Norway
Russia
United States
Bioclimate Subzone C
0.00
0.10
0.20
0.30
0.40
0.50
0.60
0.70
0 200 400 600 800 1000 1200 1400 1600 1800
Elevation (m)
ND
VI
Bioclimate Subzone D
0.00
0.10
0.20
0.30
0.40
0.50
0.60
0.70
0.80
0 200 400 600 800 1000 1200 1400 1600
Elevation (m)
ND
VI
BioclimateSubzone E
0.00
0.10
0.20
0.30
0.40
0.50
0.60
0.70
0.80
0 200 400 600 800 1000 1200 1400 1600 1800 2000
Elevation (m)
ND
VI
a)
b)c)
d) e)
Fig. 7. Mean NDVI value of CAVM polygons by elevation for Bioclimate Subzones a–e.
276M.K.Raynolds
etal.
/Rem
oteSensing
ofEnvironm
ent102
(2006)271–281

0
0.05
0.1
0.15
0.2
0.25
0.3
0.35
<2% 2-10% 10-25% 25-50% 50-75% >75%
Lake Cover Class
ND
VI
Fig. 10. Mean NDVI of arctic lake cover classes, lines represent standarddeviation of pixel values.
0
0.05
0.1
0.15
0.2
0.25
0.3
0.35
0.4
0.45
acidic circumneutral carbonate
ND
VI
Fig. 8. Mean NDVI of arctic substrate chemistry classes, lines represent standarddeviation of pixel values.
277M.K. Raynolds et al. / Remote Sensing of Environment 102 (2006) 271–281
elevation, respectively. R2 values within Subzone E were 0.02,0.26, 0.35 and 0.35 for Canada, Greenland, Russia and the UnitedStates respectively. Norway and Iceland had too few points in thisbioclimate subzone to carry out a regression. Stratifying byelevationwithin subzone did not change the regression relationship;the highest R2 value was still only 0.41, in Subzone D.
Another factor controlling NDVI was the pH of the underlyingsubstrate: NDVI increased with decreasing pH values (Fig. 8). Theeffect of changes in substrate on vegetation can be quite obvious onthe ground (Fig. 9), and was evident in the NDVI analysis when allof the Arctic was combined, even without controlling for factorssuch as bioclimate subzone or elevation.
NDVI did not change uniformly in response to lake cover: itwas highest for polygons with 10–25% lake cover, and lowerfor those with either less or more lake cover (Fig. 10). Polygonswith the most lake cover (N75%) had the lowest NDVI.
NDVI varied considerably between physiognomic vegeta-tion units (Fig. 11), increasing from vegetation units typicallyfound in more northern bioclimate subzones to those found insouthern bioclimate subzones.
Fig. 9. Variation in phytomass due to substrate chemistry, with more phytomass on thAlaska, photo by D. A. Walker).
NDVI of floristic provinces ranged from 0.03 in Svalbard–Franz Joseph Land, a region in the extreme High Arctic to 0.57in the Kanin–Pechora province, a region with relatively mildwinter climate, little permafrost and dense shrubs (Table 1).
The results of the general linear models showed that alleffects (country, floristic province, bioclimate subzone, eleva-tion class, substrate chemistry class, and lake cover class) werehighly significant (pb0.001). This result was not surprising,given the large sample size (6717 polygons). The amount ofvariability accounted for by the models increased with theaddition of each variable. The model that included all variables(country, bioclimate subzone, elevation, substrate chemistry andlake cover) accounted for 83.4% of the variance in NDVI(r-square coefficient).
3.2. Phytomass
Estimated total aboveground plant biomass (phytomass) ofthe Arctic was 2.5×10¹² kg (Table 2). The combination of
e acidic substrate on the left, and less on the carbonate area to the right (Council,

0
0.1
0.2
0.3
0.4
0.5
0.6
B1 B2 B3 B4 G1 G2 G3 G4 P1 P2 S1 S2 W1 W2 W3
ND
VI
Fig. 11. Mean NDVI of CAVM vegetation types, lines represent standarddeviation of pixel values. B = barren, G = graminoid, P = prostrate shrub, S =erect shrub, W = wetland. For legend of vegetation units, see Fig. 3.
Table 2Area and phytomass of arctic tundra bioclimate subzones
Tundra bio-climate subzone Area 1000 km2 Phytomass kg×109 (%)
A 114 6 (b1)B 450 53 (2)C 1179 220 (9)D 1564 680 (27)E 1840 1500 (60)Glaciers 1975 40 (2)Total 7122 2500 (100)
278 M.K. Raynolds et al. / Remote Sensing of Environment 102 (2006) 271–281
increasing NDVI towards the south and the increase in area ofsubzones as one goes from north to south, created a rapid rate ofincrease of phytomass with warmer subzones; 60% of the totalphytomass of the Arctic was found in Subzone E.
The area covered by each successively higher elevation classdecreased, except for elevations N2000 m, which included alarge portion of the Greenland Ice Sheet (low phytomass, butlarge area) (Table 3). As shown in Fig. 6, NDVI (and thusphytomass) decreased with elevation. The combination of thesetrends resulted in the lowest elevation class (0–333 m)accounting for 83% of the total phytomass in the Arctic.
Acidic substrates cover more area than circumneutral andcarbonate areas together (Table 4). That effect, combined withthe greater NDVI on acidic substrates resulted in 68% of theArctic phytomass occurring on acidic areas. Because the “other”
Table 1NDVI of Floristic provinces of the Arctic bioclimate zone (mean and standarddeviation of pixels)
Floristic province Mean NDVI s.d.
North Beringian Islands 0.38 0.03Beringian Alaska 0.51 0.04Northern Alaska 0.44 0.04Central Canada 0.23 0.03West Hudsonian 0.22 0.03Baffin–Labrador 0.22 0.02Ellesmere–North Greenland 0.05 0.00Western Greenland 0.20 0.02Eastern Greenland 0.06 0.00North Iceland–Jan Mayen 0.36 0.05North Fennoscandia 0.34 0.04Svalbard–Franz Joseph Land 0.03 0.00Kanin–Pechora 0.57 0.04Polar Ural–Novaya Zemlya 0.27 0.05Yamal–Gydan 0.47 0.03Taimyr 0.39 0.05Anabar–Olenyek 0.42 0.04Kharaulakh 0.39 0.03Yana–Kolyma 0.42 0.05West Chukotka 0.38 0.04East Chukotka 0.39 0.04South Chukotka 0.45 0.03Wrangel Island 0.31 0.02
category (especially glaciers) covers such a huge area, smallinclusions of vegetated areas added up to 2% of totalphytomass.
When averaged by country, the NDVI of the arctic portionsof Greenland (including the Greenland Ice Sheet) was thelowest (0.004), then arctic Norway (mostly Svalbard) at 0.05,arctic Canada at 0.21, arctic Iceland at 0.38, arctic Russia at0.41, and arctic United States at 0.48. Similar patterns were seenin phytomass values (Table 5). Both Iceland and Norway, due totheir small arctic areas, contributed only small amounts to totalarctic phytomass. Most arctic phytomass (57%) was found inthe Russian Arctic.
4. Discussion
4.1. Sources of variation in NDVI and phytomass
Arctic vegetation communities have similar physiognomiesaround the globe and share many species, but their distributionis far from uniform. The heterogeneity of the climate andenvironment due to factors such as latitude (Elvebakk et al.,1999; Razzhivin, 1999), elevation (Yurtsev, 1994), substrate(Walker & Everett, 1991), lake cover, glacial history (Hodkin-son et al., 2003) and continentality, has large effects on thedistribution of plant community types and distribution ofbiomass within the Arctic.
The dominant trend in the NDVI and phytomass of arcticvegetation is an increase from north to south (Subzones A to E).Arctic plant communities vary from sparsely vegetated typeswith very limited vascular flora in the coldest areas, to denseshrub stands and communities with up to 500 species neartreeline (Elvebakk et al., 1999). Higher NDVI values in warmersubzones are a result of greater horizontal and vertical cover ofplants, which in turn are due to more and larger plants, and more
Table 3Arctic area and phytomass of elevation classes
Elevation class Area 1000 km2 Phytomass kg×109 (%)
0–333 4035 2100 (83)334–667 945 300 (12)668–1000 245 55 (2)1001–1333 170 24 (1)1334–1667 25 4 (b1)1668–2000 5 b1 (b0.1)N2000 1697 36 (1)Total 7122 2500 (100)

Table 4Arctic area and phytomass of substrate chemistry classes
Substrate chemistry class Area 1000 km2 Total phytomass kg×109 (%)
Carbonate (pHN7.2) 370 58 (2)Circumneutral (pH 5.5–7.2) 1789 690 (27)Acidic (pHb5.5) 2949 1700 (68)Other (glacier, lakes, saline) 2015 60 (2)Total 7122 2500 (100)
Table 5Arctic area and phytomass of countries
Country Arctic area 1000 km2 Total phytomass kg×109 (%)
Canada 2553 500 (20)Greenland 2137 74 (3)Iceland 7 5 (b1)Norway 63 4 (1)Russia 1872 1400 (57)United States 491 510 (20)Total 7122 2500 (100)
279M.K. Raynolds et al. / Remote Sensing of Environment 102 (2006) 271–281
canopy layers. This expected pattern is corroborated by otherresearchers, who have documented increases in phytomass, LAIand NDVI correlated to increased summer warmth index andmore southern latitudes (Jia et al., 2002; Walker et al., 2003).
NDVI also decreases with increasing elevation. Air tempera-tures decrease with elevation due to adiabatic cooling, reducingplant growth. Conditions in hills and mountains can also be lessfavorable to plant growth due to wind, thin soil, erosion, and poorsun exposure. Analysis of the CAVM data shows that therelationship between NDVI and elevation is not simple, and evenwhen divided by bioclimate subzone, the correlation is not verygood. Most of Subzone A is low elevation, and all the pixels haverelatively low NDVI values. Plants in this region are already well-adapted to cold, short growing seasons, and thus variations inelevation do not affect these communities much, so long as they arenot frozen or snow covered year-round. In Subzones B–D, there ismore decrease in NDVI with elevation, though regression R2
coefficients are all b0.2. In Subzone E, regional patterns are strong,with low NDVI values for Greenland regardless of elevation, andmany low elevation–high NDVI pixels in arctic Russia. For theUnited States (arcticAlaska), there is little change inNDVIwith thefirst 666 m of elevation because the increase in elevation iscombined with increasing distance from the coast. Thus theadiabatic cooling is offset by warmer summer temperatures due tocontinentality.
The effect of differences in substrate pH is evident in theNDVI analysis. Low NDVI values in carbonate areas reflectlow nutrient availability and poor soil-forming properties ofcarbonate rocks. This result agrees with ground studies inAlaska which found more phytomass in acidic than non-acidicareas (Hope et al., 2003; Walker et al., 2001). Although areaswith circumneutral substrates are richer in soil nutrients andhave greater plant diversity, the abundance of forbs, lack ofacidophilic shrub species, and prevalence of cryoturbation withresulting bare patches lead to lower NDVI values (Walker et al.,2001). The effect is compounded by the fact that a greaterproportion of acidic substrates occur in Bioclimate Subzone Ewhere plant biomass and NDVI values are higher, whereas agreater proportion of circumneutral soils are found in coldersubzones. Higher plant productivity in warmer subzones leadsto the development of insulating organic layers, which in turnleads to shallower active layers, wetter soils, more moss growth,and acidification of the substrate (Walker et al., 2001).
Polygons with b10% lake cover have low NDVI values,indicating these areas are too dry for optimal plant growth. Areaswith 10–15% lake cover have the highest NDVI values. Theseareas on average have optimal amounts of soil moisture to supportplant growth, resulting from a combination of precipitation, soil
texture, slope and drainage. They also include enough land area tomaximize phytomass. Polygons with over 25% lake cover have thelowest mean NDVI values, as would be expected due to theinclusion of many water pixels with low NDVI value.
The strongest pattern in the NDVI of CAVM vegetation unitsis the higher NDVI values for types found in more southernbioclimate subzones. Barren types (B1–B4) have lower NDVIthan other types. In Bioclimate Subzones B and C, graminoidand wetland units (G2, W1) have higher NDVI than theprostrate shrub unit (P2). This is because the prostrate shrubtype occurs in drier areas, with larger proportions of bareground. The graminoid and wetland types occur in more moistareas and more often have complete vegetative cover. Thisdifference is not so pronounce in Bioclimate Subzone A (G1 vs.P1), because both of these types include high proportions ofbare ground. Well-vegetated areas are rarer in Subzone A,usually occurring along drainages that are too small to map atthe scale of the CAVM. In the warmest subzones (D and E), thegraminoid, shrub and wetland vegetation units all have similarmean NDVI. Units occurring primarily in Subzone D (G3, S1,W2) have lower values than those found mostly in Subzone E(G4, S2, W3).
Each country's averageNDVI value is a result of a combinationof the factors discussed above. As the general linear modelshowed, each of the factors is significant in explaining variation inNDVI. Arctic Norway's low NDVI is due to the fact that 69% ofthe area is in Bioclimate Subzone A in Svalbard. Greenland's lowvalue is due partly to its high average elevation (562 m). ArcticCanada's low value is partly due to a high proportion (48%) ofnon-acidic substrates (pHN5.5) and large proportion of area in theHigh Arctic (46% in Subzones A, B and C). The high averageNDVI in arctic Russia is partly due to relatively low meanelevation (134 m), and high proportion of area in the Low Arctic(77% in Subzones D and E). Similarly, 83% of the United States'arctic area is in Bioclimate Subzone E, resulting in high NDVIvalues. The highest NDVI values in the Arctic are found inEuropean Russian, the southern Taimyr, northwestern Alaska andthe Yukon–Kuskokwim Delta area, in areas of shrub tundra in thewarmest subzone (E), on low-elevation, non-carbonate substrates,often with well-developed alluvial soils, and where permafrost isabsent, discontinuous or sporadic (Brown et al., 1997).
Another factor affecting NDVI that has not been addressedby this analysis is recent geologic history. Large regions of theArctic with low NDVI in warmer subzones were recentlyglaciated. Glaciation removed soil and created a rockylandscape with many lakes. Decreased vegetation cover and

280 M.K. Raynolds et al. / Remote Sensing of Environment 102 (2006) 271–281
the increased water cover both lower NDVI values. Low NDVIvalues due to glaciation are especially prevalent in the CanadianShield area. This is an area of moderate elevation and favorablesubstrate chemistry that extends into the southern latitudes ofthe Arctic, where one would expect high NDVI values. Yet, ascan be seen in Fig. 2A, the area around Hudson Bay (theepicenter of the Laurentide Ice Sheet) has low NDVI values.Differences in the degree of glaciation of the landscape and agesince deglaciation are still evident after tens of thousands ofyears, as shown by studies on the Alaska North Slope whereolder glacial surfaces were shown to have higher NDVI valuesthan younger surfaces (Walker et al., 1995).
These trends in NDVI translate into similar trends inphytomass. Greenland, with slightly less arctic area thanCanada has only 15% of Canada's arctic phytomass becausemost of its area is covered by the Greenland Ice Sheet. Canada,though it has over five times as much arctic area as the UnitedStates, has less arctic phytomass than the U.S. Most of the arcticphytomass is found in Subzone E, below 333 m elevation, andon acidic substrates. Most of the arctic phytomass grows in theRussian Arctic, which has large areas meeting these criteria.
4.2. Modeling distribution of arctic vegetation
Researchers modeling the effect of warming on arctic tundravegetation have sometimes modeled all arctic tundra as one ortwo cover types, and have often assumed that warming willproduce a simple shift north in vegetation types. More realisticresults were produced by Kaplan et al. (2003) modeling plantfunctional types in a carbon and water flux model, but spatialdistribution of the five tundra vegetation types was not wellrepresented, especially in the glaciated areas of arctic Canada.The model is based on inputs of climate (temperature, sunlightand precipitation) and soil data (texture and depth). The resultsof this study indicate that including elevation and substrate, aswell as better spatial resolution of climate and soils data wouldlikely improve the results of this model.
5. Conclusion
The climate of the Arctic is changing, and there is stronginterest in understanding how vegetation will respond to andcontribute to this change (Hassol, 2004). One approach toanswering this question has been a coordinated set of internationalexperiments to examine how tundra responds to warming (ITEXexperiments, (Walker et al., 2006). Another approach is to look atthe existing variation in Arctic vegetation corresponding tobioclimate subzones. Because the trend of increasing phytomasswith warmer bioclimate subzones is so strong, it is tempting to usethat trend alone to predict climate-induced changes in vegetationcharacteristics. However, different factors control phytomass indifferent parts of the Arctic, as shown by this analysis of NDVI. Inthe coldest subzone (A), NDVI and phytomass values are notmuch affected by changes in elevation or substrate, and are similarin all regions of the Arctic. In this subzone there is a limitedvascular flora and all species are at the coldest extreme of theirgrowing range. Since these plants are so constrained by climate,
there is little variation in NDVI due to factors other thantemperature. In the intermediate subzones (B–D), factors such aselevation, substrate and regional characteristics begin to exert astronger influence. Increased plant diversity and a wider range ofhabitable conditions allow more competition and specialization ofplant communities, resulting in a larger range in NDVI values. Inthe warmest subzone (E), much of the variation in NDVI andphytomass is due to geologic history. Mountains, wetlands,glaciations, sea-level fluctuations, and fluvial depositions all affecthow long soils have had to develop and how long plants have hadto colonize and evolve into communities. Climate, substrate andflora all have to be optimal to reach maximum NDVI. This studyshows that modelers interested in including arctic phytomass intheir systems should not assume that phytomass will increaseuniformly across the Arctic with increases in temperature. Assubzones warm, existing local and regional environmental factorshave more influence on variation in plant growth and phytomass.Policy makers should not assume that vegetation types that arenow present farther south will simply move north. This analysis ofNDVI and phytomass distribution in the Arctic demonstrates thatpredictions of climate-induced changes in vegetation in the Arcticneed to take into account factors such as elevation, substratechemistry and glacial history.
Acknowledgments
Wewould like to acknowledge F .J. A. Daniëls, E. Einarsson,A. Elvebakk, W. A. Gould, A. E. Katenin, S. S. Kholod, C. J.Markon, E. S. Melnikov, N. G. Moskalenko, S. S. Talbot, and B.A. Yurtsev, our co-authors on the Circumpolar ArcticVegetation Map; Thierry Brossard for organizing the conferenceat which this paper was first presented; Eric Rexstad forreviewing the manuscript and providing valuable suggestionson the analysis of the data; Jonathan Burian for preliminaryanalysis of some of the data done as part of a ResearchExperience for Undergraduates (REU) project; Jamie Hollings-worth for running statistical analyses; and three anonymousreviewers for their valuable comments. The Circumpolar ArcticVegetation Map and the REU position were funded by theNational Science Foundation (OPP-9908829 and OPP-0120736). The full list of contributors to the CAVM can befound in the map credit and acknowledgement boxes printed onthe map (CAVM Team, 2003).
References
Asrar, G., Kanemasu, E. T., Jackson, R. D., & Pinter, P. J. (1985). Estimation oftotal above-ground phytomass production using remotely sensed data.Remote Sensing of Environment, 17, 211−220.
Boelman, N. T., Stieglitz, M., Griffin, K. L., & Shaver, G. R. (2005). Inter-annualvariability of NDVI in response to long-termwarming and fertilization in wetsedge and tussock tundra. Oecologia, 143, 588−597, doi:10.1007/s00442-005-0012-9
Boelman, N. T., Stieglitz, M., Rueth, H. M., Sommerkorn, M., Griffin, K. L.,Shaver, G. R., et al. (2003). Response of NDVI, biomass, and ecosystem gasexchange to long-term warming and fertilization in wet sedge tundra.Oecologia, 135, 414−421.
Bogaert, J., Zhou, L., Tucker, C. J., Myneni, R. B., & Ceulemans, R. (2002).Evidence for a persistent and extensive greening trend in Eurasia inferred

281M.K. Raynolds et al. / Remote Sensing of Environment 102 (2006) 271–281
from satellite vegetation index data. Journal of Geophysical Research, 107,1−14.
Brown, J., Ferrians, O.J., Heginbottom, J.A., & Melnikov, E.S. (1997). Circum-Arctic Map of Permafrost and Ground-ice Conditions, Map CP-45. U.S.Geological Survey.
CAVM Team. (2003). Circumpolar Arctic Vegetation Map, scale 1:7 500 000.Conservation of Arctic Flora and Fauna (CAFF) Map No. 1. U.S. Fish andWildlife Service, Anchorage, Alaska.
Comiso, J. C. (2003). Warming trends in the Arctic from clear sky satelliteobservations. Journal of Climate, 16, 3498−3510.
Elvebakk, A., Elven, R., & Razzhivin, V. Y. (1999). Delimitation, zonal andsectorial subdivision of the Arctic for the Panarctic Flora Project. In I.Nordal, & V. Y. Razzhivin (Eds.), The species concept in the high north— aPanarctic Flora initiative (pp. 375−386). Oslo: The Norwegian Academy ofScience and Letters.
ESRI. (1993). Digital chart of the world, Sept. 1993. Redlands, CA:Environmental Systems Research Institute, Inc.
Goetz, S. J., Bunn, A. G., Fiske, G. J., & Houghton, R. A. (2005). Satellite-observed photosynthetic trends across boreal North America associated withclimate and fire disturbance. Proceedings of the National Academy ofSciences, 102, 13521−13525.
Goward, S. N., Markham, B., Dye, D. G., Dulaney, W., & Yang, J. (1991).Normalized difference vegetation index measurements from the advancedvery high resolution radiometer. Remote Sensing of Environment, 35,257−277.
Goward, S. N., Tucker, C. T., & Dye, D. G. (1985). North American vegetationpatterns observed with the NOAA-7 advanced very high resolutionradiometer. Vegetatio, 64, 3−14.
Hassol, S. J. (2004). Impacts of a warming Arctic, Arctic climate impactassessment (pp. 146). Cambridge, UK: Cambridge University Press.
Hodkinson, I. D., Coulson, S. J., & Webb, N. R. (2003). Community assemblyalong proglacial chronosequences in the high Arctic: vegetation and soildevelopment in north-west Svalbard. Journal of Ecology, 91, 651−663.
Hope, A. S., Boynton, W. L., & Stow, D. A. (2003). Interannual growthdynamics of vegetation in the Kuparuk River watershed, Alaska based onthe normalized difference vegetation index. International Journal of RemoteSensing, 24, 3413−3425.
Hope, A. S., Kimball, J. S., & Stow, D. A. (1993). The relationship betweentussock tundra spectral reflectance properties, and biomass and vegetationcomposition. International Journal of Remote Sensing, 14, 1861−1874.
Jia, G. J., Epstein, H. E., & Walker, D. A. (2002). Spatial characteristics ofAVHRR-NDVI along latitudinal transects in northern Alaska. Journal ofVegetation Science, 13, 315−326.
Jia, G. J., Epstein, H. E., & Walker, D. A. (2003). Greening of arctic Alaska,1981–2001. Geophysical Research Letters, 30, 2067.
Jia, G. J., Epstein, H. E., & Walker, D. A. (2004). Controls over intra-seasonaldynamics of AVHRR NDVI for the Arctic tundra in northern Alaska.International Journal of Remote Sensing, 25, 1547−1564.
Jordan, C. F. (1969). Derivation of leaf-area index from quality of light on theforest floor. Ecology, 50, 663−666.
Kaplan, J. O., Bigelow, N. H., Prentice, I. C., Harrison, S. P., Bartlein, P. J.,Christensen, T. R., et al. (2003). Climate change and Arctic ecosystems: 2.Modeling, paleodata-model comparisons, and future projections. Journal ofGeophysical Research, 108, 8171.
Markon, C. J., Fleming, M. D., & Binnian, E. F. (1995). Characteristics ofvegetation phenology over the Alaskan landscape using AVHRR time-seriesdata. Polar Record, 31, 179−190.
Nellemann, C., Kullerud, L., Vistnes, I., Forbes, B. C., Husby, E., Kofinas, G. P.,et al. (2001).GLOBIO: Global methodology for mapping human impacts onthe biosphere.United Nations Environment Programme.
Razzhivin, V. Y. (1999). Zonation of vegetation in the Russian Arctic. In I.Nordal & V.Y. Razzhivin (Eds.), The species concept in the high north — apanarctic Flora initiative (pp. 113−130). Oslo: The Norwegian Academy ofScience and Letters.
Riedel, S. M., Epstein, H. E., Walker, D. A., Richardson, D. L., Calef, M. P.,Edwards, E., et al. (2005). Spatial and temporal heterogeneity of vegetationproperties among four tundra plant communities at Ivotuk, Alaska, U.S.A.Arctic, Antarctic, and Alpine Research, 37, 25−33.
Rouse, J. W., Haas, R. H., Schell, J. A., & Deering, D. W. (1974). Monitoringvegetation systems in the Great Plains with ERTS. Proceedings of the ThirdEarth Resources Technology Satellite-1 Symposium (pp. 301−317).Greenbelt, MD: NASA.
SAS. (1989). SAS/STAT User's Guide, Version 6, 4th edition. Cary, NC: SASInstitute, Inc.
Shippert, M. M., Walker, D. A., Auerbach, N. A., & Lewis, B. E. (1995).Biomass and leaf-area index maps derived from SPOT images for ToolikLake and Imnavait Creek areas, Alaska. Polar Record, 31, 147−154.
Stow, D. A., Hope, A., McGuire, D., Verbyla, D., Gamon, J., Huemmrich, F., etal. (2004). Remote sensing of vegetation and land-cover change in arctictundra ecosystems. Remote Sensing of Environment, 89, 281−308.
Stow, D. A., Hope, A. S., & George, T. H. (1993). Reflectance characteristics ofarctic tundra vegetation from airborne radiometry. International Journal ofRemote Sensing, 14, 1239−1244.
van Wijk, M. T., & Williams, M. (2005). Optical instruments for measuring leafarea index in low vegetation: Application in arctic ecosystems. EcologicalApplications, 15, 1462−1470.
Walker, D. A., Auerbach, N. A., & Shippert, M. M. (1995). NDVI, biomass, andlandscape evolution of glaciated terrain in northern Alaska. Polar Record,31, 169−178.
Walker, D. A., Bockheim, J. G., Chapin III, F. S., Eugster, W., Nelson, F. E., &Ping, C. -L. (2001). Calcium-rich tundra, wildlife, and the “MammothSteppe”. Quaternary Science Reviews, 20, 149−163.
Walker, D. A., Epstein, H. E., Jia, J. G., Balser, A., Copass, C., Edwards, E. J., etal. (2003). Phytomass, LAI, and NDVI in northern Alaska: Relationships tosummer warmth, soil pH, plant functional types, and extrapolation to thecircumpolar Arctic. Journal of Geophysical Research — Atmospheres, 108,8169, doi:10.1029/2001d00986
Walker, D. A., & Everett, K. R. (1991). Loess ecosystems of northern Alaska:regional gradient and toposequence at Prudhoe Bay. Ecological Mono-graphs, 61, 437−464.
Walker, D. A., Gould, W. A., & Raynolds, M. K. (2002). The circumpolar Arcticvegetation map: Environmental controls, AVHRR-derived base maps, andintegrated mapping procedures. International Journal of Remote Sensing,23, 2551−2570.
Walker, D. A., Raynolds, M. K., Daniels, F. J. A., Einarsson, E., Elvebakk, A.,Gould, W. A., et al. (2005). The circumpolar Arctic vegetation map. Journalof Vegetation Science, 16, 267−282.
Walker, M. D., Warren, C. H., Hollister, R. D., Henry, G. H. R., Ahlquist, L. E.,Alatalo, J. M., et al. (2006). Plant community responses to experimentalwarming across the tundra biome. Proceedings of the National Academy ofSciences, 103, 1342−1346.
Yurtsev, B. A. (1994). Floristic divisions of the Arctic. Journal of VegetationScience, 5, 765−776.
Zhou, L., Tucker, C. J., Kaufmann, R. K., Slayback, D., Shabanov, N. V., &Myneni, R. B. (2001). Variations in northern vegetation activity inferredfrom satellite data of vegetation index during 1981 to 1999. Journal ofGeophysical Research — Atmospheres, 106, 20069−20083.