NCPA-Pfizer Digest: Executive Summary and … Digest: Executive Summary and Management Tool...
38
NCPA-Pfizer Digest: Executive Summary and Management Tool Presented by: Steve LeFever, Business Resource Services; Donna M. West, Ph.D., Assistant Professor, University of Arkansas; and David Wendland, Vice President, Hamacher Resource Group 4:15 p.m. – 5:45 p.m. Tuesday, October 12, 2004 Boston, Massachusetts This program is approved by NCPA for 0.15 CEUs (1.5 contact hours) of continuing education credit. NCPA is approved by the Accreditation Council for Pharmacy Education as a provider of continuing pharmacy education. 311
Transcript of NCPA-Pfizer Digest: Executive Summary and … Digest: Executive Summary and Management Tool...

NCPA-Pfizer Digest: Executive Summary and Management Tool
Presented by:
Steve LeFever, Business Resource Services; Donna M. West, Ph.D., Assistant Professor, University of Arkansas; and David Wendland, Vice President,
Hamacher Resource Group
4:15 p.m. – 5:45 p.m. Tuesday, October 12, 2004
Boston, Massachusetts
This program is approved by NCPA for 0.15 CEUs (1.5 contact hours) of continuing education credit. NCPA is approved by the Accreditation Council for Pharmacy Education as a provider of continuing pharmacy education.
311

NCPA-Pfizer Digest: Executive Summary and Management Tool Educational Objectives: 1. Describe the financial performance and trends of independent community pharmacy in 2003. 2. Identify the top five patient care services and the top five disease state management programs offered by independent community pharmacy. 3. Describe the management efficiencies that exist in the top 25 percent - those who earned the highest owner's discretionary profit percentage. 4. Discuss how ratio analysis plays an important role in benchmarking an industry and an individual company.

1
Donna S. West, R.Ph., Ph.D.University of Arkansas for Medical Sciences
College of PharmacyCollege of Public Health
2004NCPA-Pfizer Digest
Introductions
• Steven LeFever, Chairman and Founder, Business Resource Services
• David Wendland, Vice President, Hamacher Resource Group
Donna S. West, R.Ph., Ph.D.University of Arkansas for Medical Sciences
The Pharmacy and Pharmacist Care

2
Demographics• 26% of independent owners own 2 or
more pharmacies• 68% of Digest respondents are located in
a rural area• Average Digest pharmacy is 3,799 square
feet
Prescription Sales
Other9%
Rx91%
Prescription Volume• 56,399 prescriptions per pharmacy location
• 53% of Rxs dispensed are generic

3
Jack Coffey, R.Ph.Shawnee, Oklahoma
Employee Wages2002 2003
Staff pharmacist $37.96 $40.10
Pharmacy technician $11.03 $11.60
Clerk/cashier $8.26 $8.45
Third-Party Trends
0
10
20
30
40
50
60
%
1999 2000 2001 2002 2003
MedicaidOther

4
Technology• 94% have Internet at pharmacy
• 88% have e-mail at pharmacy
• 48% have website
Technology• 18% have automated phone system
• 30% have point-of-sale system
• 17% have automatic dispensing system
• 52% have system for workflow
Patient Care Services85% Delivery 84% Patient Charge Accounts83% Nutrition 74% Durable Medical Goods 62% Compounding40% Long-term Care
1
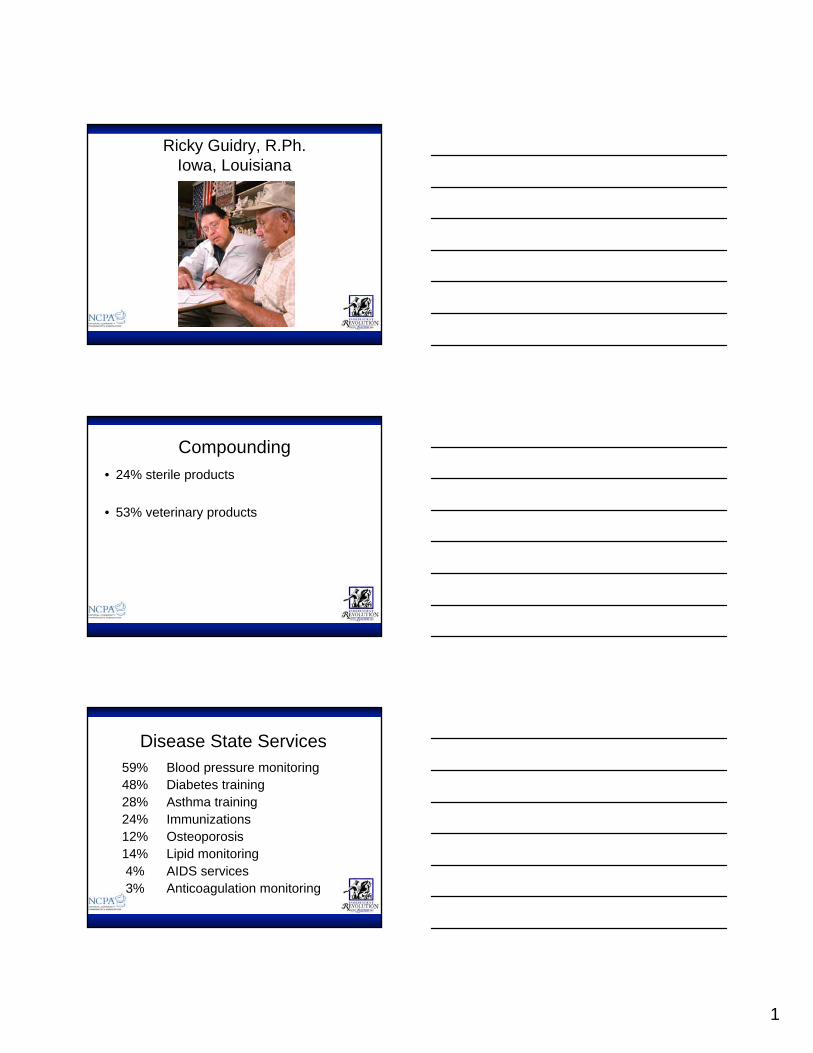
Ricky Guidry, R.Ph.Iowa, Louisiana
Compounding• 24% sterile products
• 53% veterinary products
Disease State Services59% Blood pressure monitoring 48% Diabetes training 28% Asthma training 24% Immunizations 12% Osteoporosis14% Lipid monitoring4% AIDS services3% Anticoagulation monitoring

2
Michael Kim, Pharm.D.Washington D.C.
Pharmacist Interaction with Other HC Professionals
• 7.0 times per day
– 92% generic recommendations
– 82% therapeutic recommendations
Mark Riley, Pharm.D.Little Rock, Arkansas

3
Together, community pharmacists and medicines provide an unequaled promise to keep Americans healthy.
Independent community pharmacy continues to be a dominant force in serving patients with their health care needs and a major force in the pharmaceutical marketplace.
AcknowledgementsPfizer
Business Resource Services
Hamacher Resouce Group
Doug Hoey, R.Ph.,M.B.A.
Woodpile Studios
2004 Digest
www.ncpanet.org

4
Thank you for your participation in the 2004
NCPA-Pfizer Digest

1
Key Financial Performance Indicators
•Profitability•Productivity•Financial Position•Cash Flow
Financial Data Presented
• All Participating Pharmacies• Top 25% • Sales Categories• Geographic Regions• High versus Low Third Party Rx• Rural versus Metropolitan
Guide To Benchmarking
• Available at www.ncpanet.org• Includes The Financial Cause and Effect
Road Map • Includes Suggested Action Plans For
Improving Your Profitability, Productivity, Financial Position and Cash Flow
• What To Do Next – Steps to integrate financial benchmarking into your management process

2
The Top 25% and Owner’s Discretionary Profit Percent
Net Profit Before TaxPlus Owner Compensation
----------------Divided by----------------Total Sales
Owner’s Discretionary Profit Percentages
10.5% Top
25% Median 7.5%
5.0%
Bottom 25%
2003 Highlights• Median sales increased by 13.0 percent• The trend of rising payroll expenses
continued.• Gross margin improved by offset the
increasing payroll expense.• While average owner’s discretionary profit
percentages were unchanged increasing sales drove owners discretionary profit dollars up by 11.5 percent.

3
Long Term TrendsAVERAGE ANNUAL SALES (IN THOUSANDS) PER PHARMACY LOCATION
$1,269 $1,339 $1,442$1,649 $1,746
$1,967
$2,296$2,480
$2,855
$3,244
$0
$1,000
$2,000
$3,000
$4,000
1994 1995 1996 1997 1998 1999 2000 2001 2002 2003
Long Term Trends
8.10%
8.30%
7.80% 7.90%8.10%
8.50%
7.60%
7.90%
8.10% 8.10%
7.00%7.20%7.40%7.60%7.80%8.00%8.20%8.40%8.60%
1994 1995 1996 1997 1998 1999 2000 2001 2002 2003
Owner's Discretionary Profit Percentages
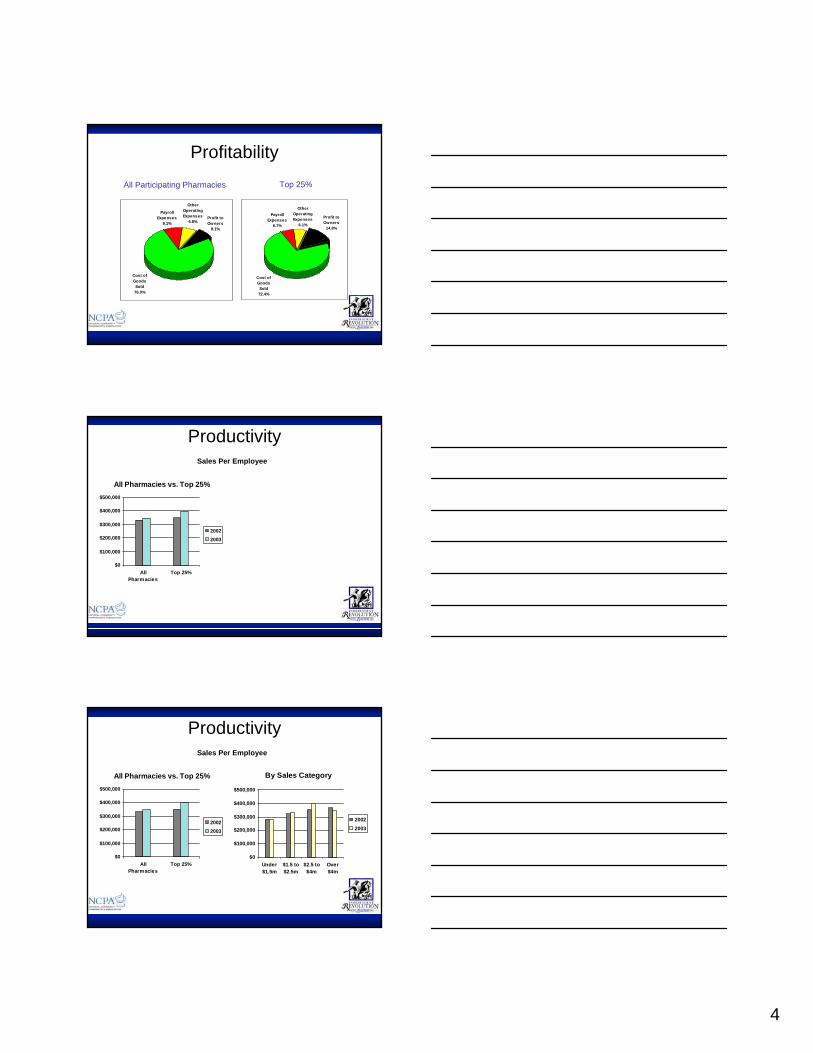
Profitability
Payroll Expenses
9.1%Profit to Owners
8.1%
Cost of Goods Sold76.0%
Other Operating Expenses
6.8%
All Participating Pharmacies
4
Profitability
Payroll Expenses
9.1%Profit to Owners
8.1%
Cost of Goods Sold76.0%
Other Operating Expenses
6.8%
All Participating Pharmacies
Payroll Expenses
6.7%
Other Operating Expenses
6.1%
Profit to Owners
14.8%
Cost of Goods Sold72.4%
Top 25%
Productivity
All Pharmacies vs. Top 25%
$0
$100,000
$200,000
$300,000
$400,000
$500,000
AllPharmacies
Top 25%
20022003
Sales Per Employee
Productivity
All Pharmacies vs. Top 25%
$0
$100,000
$200,000
$300,000
$400,000
$500,000
AllPharmacies
Top 25%
20022003
By Sales Category
$0
$100,000
$200,000
$300,000
$400,000
$500,000
Under$1.5m
$1.5 to$2.5m
$2.5 to$4m
Over$4m
20022003
Sales Per Employee

5
Payroll Costs Are IncreasingPayroll Expenses Excluding
Owners
8.1% 8.7% 9.1%7.2% 6.7%
0.0%
4.0%
8.0%
12.0%
2001 2002 2003 2002: Top25%
2003: Top25%
What Happens As Sales Increase?
Median Sales
$5,623,855
$3,100,275
$1,993,493
$1,132,308
$0
$1,000,000
$2,000,000
$3,000,000
$4,000,000
$5,000,000
$6,000,000
Under$1.5m
$1.5 to$2.5m
$2.5 to$4m
Over $4m
Gross Profit Margin Decreases…
24.3%
22.6%
23.5%
26.9%
20.00%
21.00%
22.00%
23.00%
24.00%
25.00%
26.00%
27.00%
28.00%
Under $1.5m $1.5 to $2.5m $2.5 to $4m Over $4m

6
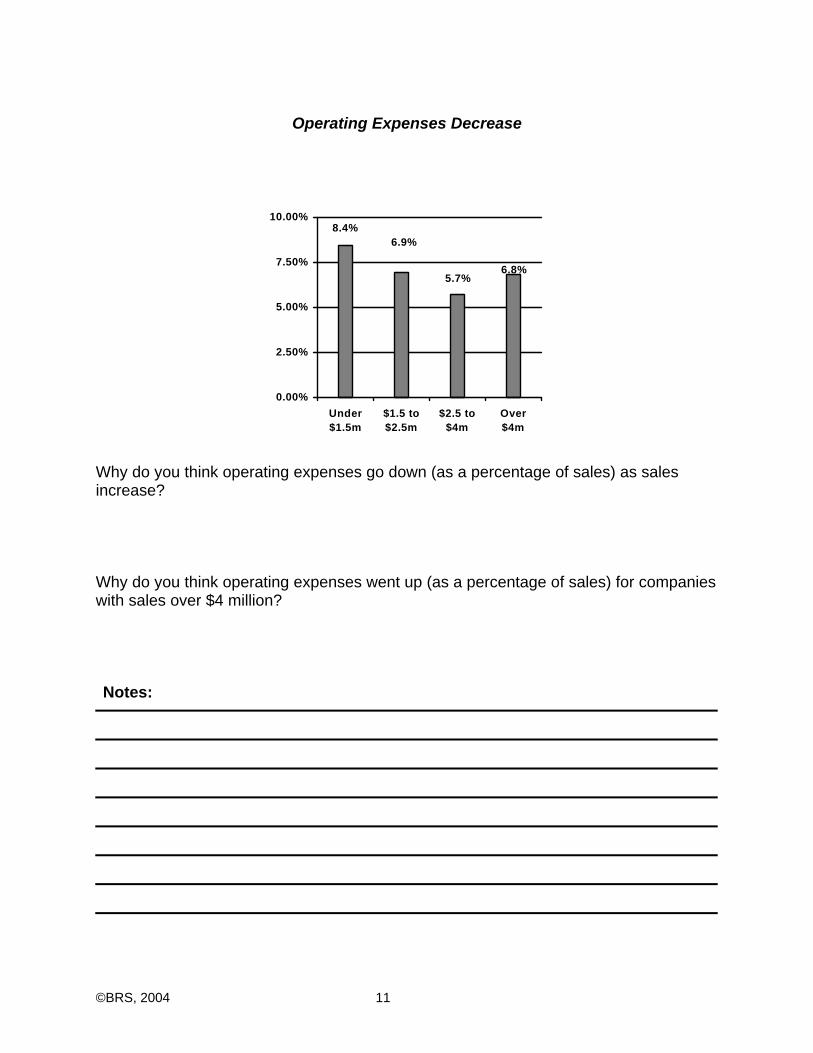
Operating Expenses Decrease…
6.8%5.7%
6.9%
8.4%
0.00%
2.50%
5.00%
7.50%
10.00%
Under $1.5m $1.5 to $2.5m $2.5 to $4m Over $4m
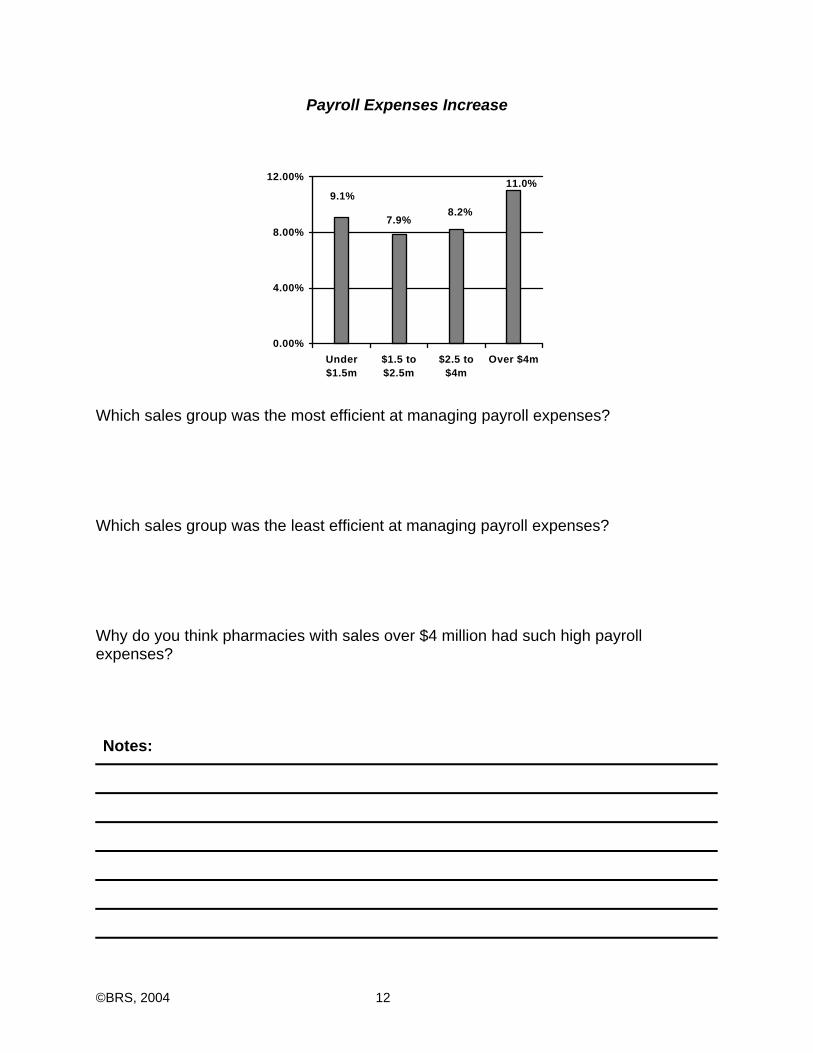
Payroll Expenses Increase…
11.0%
8.2%7.9%
9.1%
0.00%
4.00%
8.00%
12.00%
Under$1.5m
$1.5 to$2.5m
$2.5 to$4m
Over$4m
And Owner’s Discretionary Profit Percentages Decrease…
6.0%
8.1%8.1%
9.8%
0.00%
2.50%
5.00%
7.50%
10.00%
Under$1.5m
$1.5 to$2.5m
$2.5 to$4m
Over $4m
7
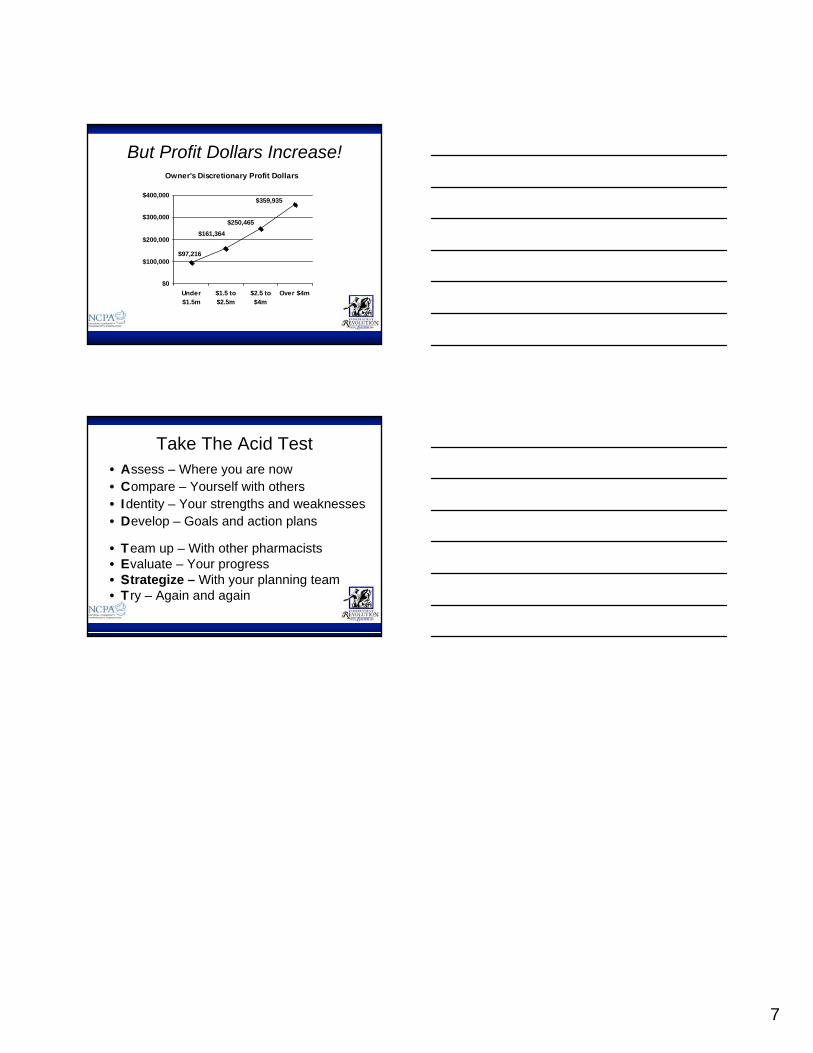
But Profit Dollars Increase!Owner's Discretionary Profit Dollars
$161,364
$359,935
$250,465
$97,216
$0
$100,000
$200,000
$300,000
$400,000
Under$1.5m
$1.5 to$2.5m
$2.5 to$4m
Over $4m
Take The Acid Test• Assess – Where you are now• Compare – Yourself with others• Identity – Your strengths and weaknesses• Develop – Goals and action plans
• Team up – With other pharmacists• Evaluate – Your progress• Strategize – With your planning team• Try – Again and again

1
OTC Categories
NCPANCPA--Pfizer Digest:Pfizer Digest:Executive Summary andExecutive Summary and
Management ToolManagement Tool
Presented by:David Wendland, VP
Hamacher Resource Group
Today’s OTC marketConsumer needs
Purchase trends
Product proliferation
Product innovation
Market outlook
Pharmacist’s role
2004 versus 2003 trends
Independent versus chain sales
Private label influence
New items – performance
NeverOuts™ – importance
OTC category performance

2
OTC categories - Digest insightsNew items continue to drive OTC category growth
Out-of-stock situation not improving across industry
Majority of shoppers are neglecting the front-end of pharmacy
OTC categories - Digest contentAnalgesics
Antacids/Laxatives
Cough/Cold
Diabetes Care
Eye/Ear
Vitamins
Smoking Cessation
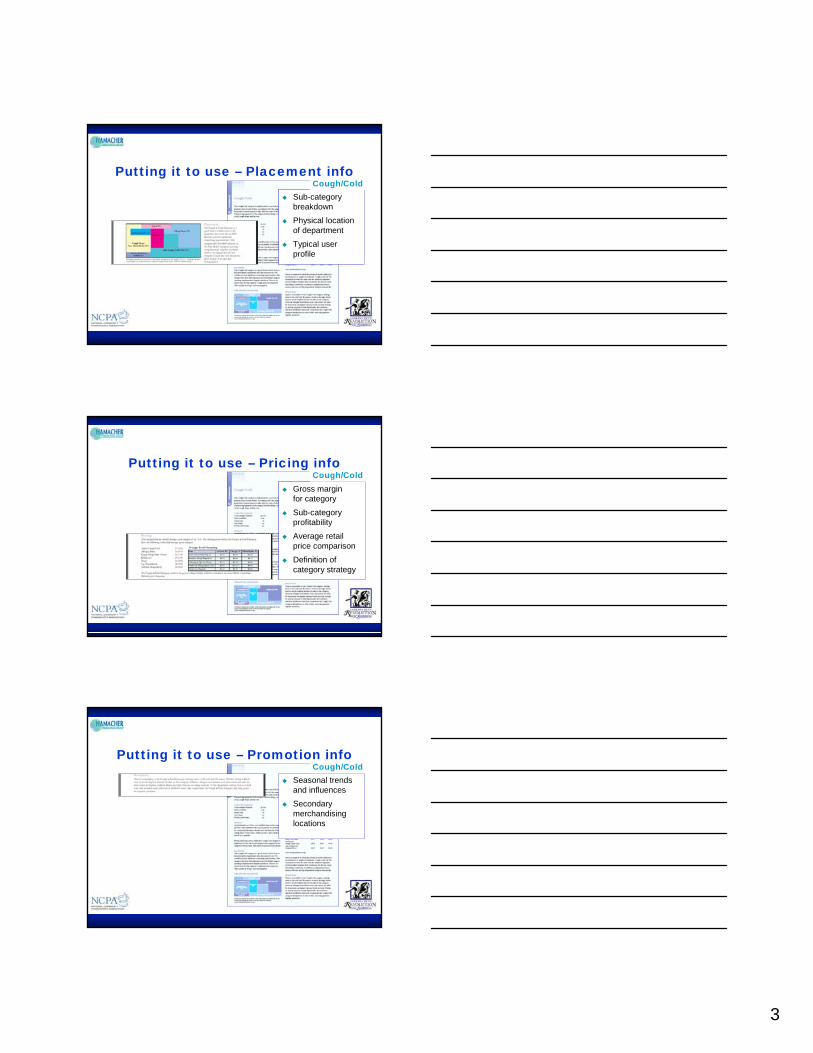
Putting it to use – Product info
38.71% average gross margin
1,748 total items within category
78 NeverOuts®
products
8% private label
Average gross profit for category
Number of available items
Number of NeverOuts®
Importance of private label
Cough/Cold
3
Position close to pharmacy due toRx-to-OTC
Allergy/sinus items represent 25% of space
Putting it to use – Placement info
Sub-category breakdown
Physical location of department
Typical user profile
Cough/Cold
Lip preparations have the highest average gross margin for the category - 48.56%
Nasalcrom costs more in Chicago than Philadelphia
Gross margin for category
Sub-category profitability
Average retail price comparison
Definition of category strategy
Putting it to use – Pricing infoCough/Cold
Peak cold and flu season is October through March … however allergies and asthma occur year round
Seasonal trends and influences
Secondary merchandising locations
Putting it to use – Promotion infoCough/Cold

4
OTCs and the front shop:OTCs and the front shop:Opportunity knocking!Opportunity knocking!
… or later.
Dave [email protected]
Questions. Now
NCPA-Pfizer Digest: Executive Summary

FinancialBenchmarking
presented bySteven C. LeFever, ChairmanBusiness Resource Services

©BRS, 2004 1
About Business Resource Services, Inc. And Their Work With NCPA
Business Resource Services, or BRS, specializes in financial management education for the owners and managers of independent businesses. The BRS team includes leading speakers and consultants in the area of small business finance, with backgrounds in banking, finance, accounting and business start-ups. BRS' clients include some of the world’s largest and most successful associations, corporations and banking institutions, including the National Community Pharmacists Association, the International Franchise Association, the American Rental Association, Anheuser-Busch, Chase Manhattan Bank and Harley-Davidson.
The BRS Three Legged Stool:
1. Education
2. Information
3. Implementation NCPA has partnered with BRS to assist in the development of a comprehensive financial management process – PROFIT MASTERY – designed to strengthen and develop members’ financial decision-making resources as a means for improving their profitability. The process includes:
1) Education: Practical, hands-on seminars in financial analysis, profit planning, pricing techniques, capital needs forecasting and strategic business planning
2) Information: Preparing the Financial Benchmarks section of the Digest,
identifying key financial performance issues affecting profitability and cash flow and establishing benchmarks for measuring future improvements
3) Implementation: BRS facilitated peer groups called “Performance Groups” use
financial benchmarking to develop goals, implement action plans and improve their financial success

©BRS, 2004 2
Steve LeFever is a national leader in the development of practical financial programs and training for the independent business community. His dual role as a successful entrepreneur and as a commercial banker gives him a unique perspective on financial analysis, business management and practical business decisions. Steve is a successful entrepreneur in his own right – having founded several successful companies. As an officer at Seattle First National Bank, Steve was a key figure in developing the most successful Business Advisory Services Group of any bank in the nation, tailoring financial services and training to the needs of small and mid-size companies. In 1983, Steve founded his current firm, Business Resource Services (BRS), to further design, develop and deliver practical financial training to the independent business community. Currently BRS' services are in high demand by over 100 commercial banks, a variety of industry trade groups and major U.S. corporations, including Anheuser-Busch, Ace Hardware and Harley Davidson. Steve was instrumental in developing NCPA’s Profit Mastery for Pharmacy financial management programs. Recognized by NCPA, state pharmacy associations and industry buying groups as a top-rated speaker, Steve brings a valued perspective and insight to the podium. His unique teaching techniques focus on developing practical financial skills as decision-making tools, and the response to his programs nationwide has been overwhelming. In addition, his presentation style is an extremely effective combination of information, motivation and entertainment. Steve earned his Master's Degree in Business Administration at the University of Washington in Seattle and has served as a management consultant for over fifteen years. He is a contributing writer to a variety of trade journals and is a frequent speaker for national associations. His particular consulting interests lie in managing capital and cash flow in start-up businesses and growth management.
Steven C. LeFever Chairman
200 First Avenue West Suite 301 Seattle, WA 98119
(206) 284-5102 (Telephone) (206) 282-4092 (Fax) [email protected] (e-mail) http://www.brs-seattle.com (website)

©BRS, 2004 3
Why Benchmark?
What Gets Measured, Gets Managed. This Year’s Digest Includes Financial Benchmarks For These Key Financial Performance Issues Critical Area Key Words Profitability Sales, Margin and Expense Control
Productivity People and Facilities
Financial Position Asset Management/Controlling Debt
Cash Flow Working Capital Cycle
Financial data is presented for
All Companies The Top 25% (based on owner’s discretionary profit percentage) Sales Categories Geographic Regions High versus Low Third Party Prescriptions Metropolitan versus Rural Locations
The Guide To Benchmarking – Available at www.NPCANet.org Includes The Financial Cause and Effect Road Map and Suggested Action Plans For These Same Critical Areas
Profitability Productivity Financial Position Cash Flow
Also in the Guide To Benchmarking… What To Do Next
A step-by-step approach for integrating financial benchmarking into your management process

©BRS, 2004 4
A Look At The Most Profitable Pharmacies The Top 25% And Owner’s Discretionary Profit Percentage
OWNER’S DISCRETIONARY PROFIT % = Net profit before tax plus owner compensation
Sales
Median Owner’s Discretionary Profit Percentages
10.5% Top*
25% Median 7.5%
5.0%
Bottom 25%
*When we refer to the top 25%, we’re including the results for all of the companies earning more than 10.5 percent in owner’s discretionary profit.
2003 Highlights
• Median sales increased by 13.0 percent (from $2,529,623 in 2002 to $2,857,981 in 2003).
• The trend of rising payroll expenses continued, increasing by 0.4 percent to 9.1 percent of sales.
• Gross margin improved by 0.5 percent (from 23.5 percent in 2002 to 24.0 percent in 2003) offsetting the increasing payroll expenses
• While average owner’s discretionary profit percentages were unchanged at 8.1 percent of sales for both 2002 and 2003, increasing sales drove owners discretionary profit dollars up by 11.5 percent (from $195,901 in 2002 to $218,390 in 2003).
Notes:

©BRS, 2004 5
Long Term Trends
AVERAGE ANNUAL SALES (IN THOUSANDS) PER PHARMACY LOCATION
$1,269 $1,339 $1,442$1,649 $1,746
$1,967$2,296
$2,480$2,855
$3,244
$0
$1,000
$2,000
$3,000
$4,000
1994 1995 1996 1997 1998 1999 2000 2001 2002 2003
AVERAGES OF PHARMACY OPERATIONS, 10-YEAR TRENDS
1994 1995 1996 1997 1998 1999 2000 2001 2002 2003 Sales 100% 100% 100% 100% 100% 100% 100% 100% 100% 100% Cost of Goods Sold 71.9 72.4 73.7 74.4 75.1 76.0 76.7 77.0 76.5 76.0 Gross Profit 28.1% 27.6% 26.3% 25.6% 24.9% 24.0% 23.3% 23.0% 23.5% 24.0% Payroll Expenses (Excluding Owners) 10.1% 9.5% 8.8% 8.3% 8.2% 7.9% 7.8% 8.1% 8.8% 9.1%
Owner Compensation 5.1 5.2 4.8 4.8 5.0 4.9 4.4 4.4 4.3 4.1 Other Operating Exp 9.9 9.8 9.7 9.4 8.6 7.6 7.9 6.9 6.6 6.8 Total Expenses 25.1% 24.5% 23.3% 22.5% 21.8% 20.4% 20.1% 19.4% 19.7% 20.0% Net Profit 3.0% 3.1% 3.0% 3.1% 3.1% 3.6% 3.2% 3.5% 3.8% 4.0% Add: Owner Comp 5.1% 5.2% 4.8% 4.8% 5.0% 4.9% 4.4% 4.4% 4.3% 4.1% Owner’s Discretionary Profit 8.1% 8.3% 7.8% 7.9% 8.1% 8.5% 7.6% 7.9% 8.1% 8.1%
©BRS, 2004 6
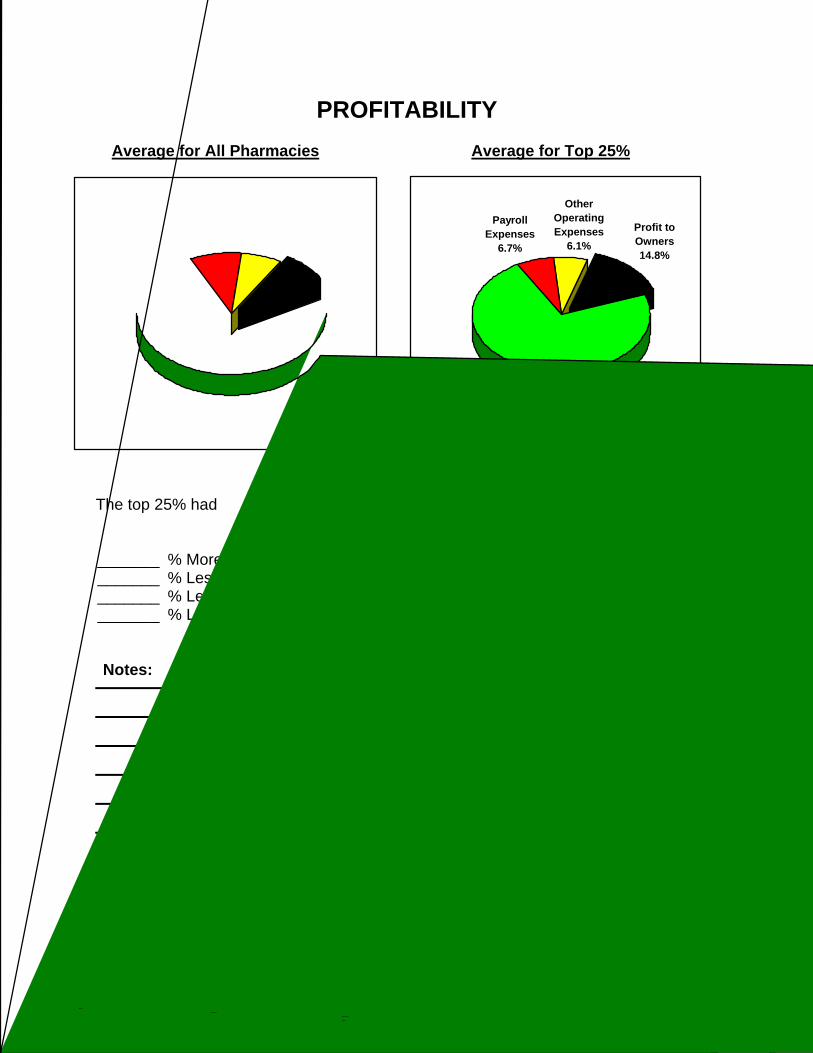
PROFITABILITY
Average for All Pharmacies Average for Top 25%
The top 25% had _______ % More in Profit to Owners (14.8 percent compared to 8.1 percent) _______ % Less COGS (72.4 percent compared to 76.0 percent) _______ % Less Payroll Expenses (6.7 percent compared to 9.1 percent) _______ % Less Other Operating Expenses (6.1 percent compared to 6.8 percent)
Notes:
Payroll Expenses
6.7%
Other Operating Expenses
6.1%
Profit to Owners14.8%
Cost of Goods Sold
72.4%
Payroll Expenses9.1%P r o f i t t o Owners8.1%Cost of G o o d s S o l d 7 0 2 0 % O t h e r Operating Expenses028%
©BRS, 2004 7
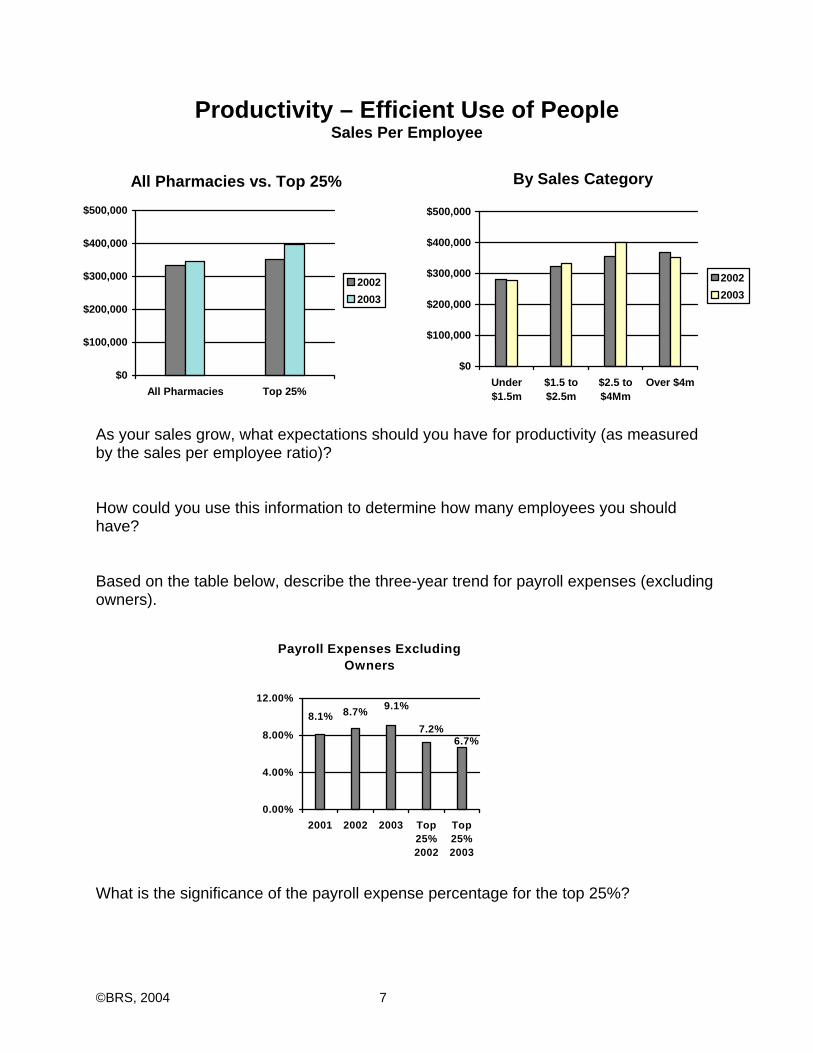
Productivity – Efficient Use of People Sales Per Employee
As your sales grow, what expectations should you have for productivity (as measured by the sales per employee ratio)? How could you use this information to determine how many employees you should have? Based on the table below, describe the three-year trend for payroll expenses (excluding owners). What is the significance of the payroll expense percentage for the top 25%?
By Sales Category
$0
$100,000
$200,000
$300,000
$400,000
$500,000
Under$1.5m
$1.5 to$2.5m
$2.5 to$4Mm
Over $4m
20022003
All Pharmacies vs. Top 25%
$0
$100,000
$200,000
$300,000
$400,000
$500,000
All Pharmacies Top 25%
20022003
Payroll Expenses Excluding Owners
6.7%7.2%
9.1%8.7%8.1%
0.00%
4.00%
8.00%
12.00%
2001 2002 2003 Top25%2002
Top25%2003

©BRS, 2004 8
Financial Position Asset Management and Controlling Debt
Ratio Computation All Pharmacies Top 25%
2001 2002 2003 2002 2003 Sales to Assets
Sales Assets 5.41 5.56 5.56 5.38 5.33
For 2003 the median participant generated $5.56 in sales for every dollar invested in assets. For the three years presented – have the companies participating in the Digest become more or less efficient at managing their assets?
Controlling Debt
Ratio Computation All Pharmacies Top 25% 2001 2002 2003 2002 2003
Debt To Worth
Total Liabilities Net Worth 0.69 0.57 0.56 0.33 0.37
Return On Investment
Owner’s Discretionary Profit
Net Worth 72.7% 72.6% 64.8% 100.7% 101.0%
For 2003, the median participant had 56 cents in debt for every dollar invested by owners. For the three years presented – have the companies participating in the Digest become more or less risky? Notes:

©BRS, 2004 9
Cash Flow
Managing the Working Capital Cycle
N o t e s :
A l l P h a r m a c i e s - 3 6 d a y s T o p 2 5 % - 4 0 d a y s A l l P h a r m a c i e s – 1 5 d a y s
T o p 2 5 % - 1 7 d a y s
©BRS, 2004 10
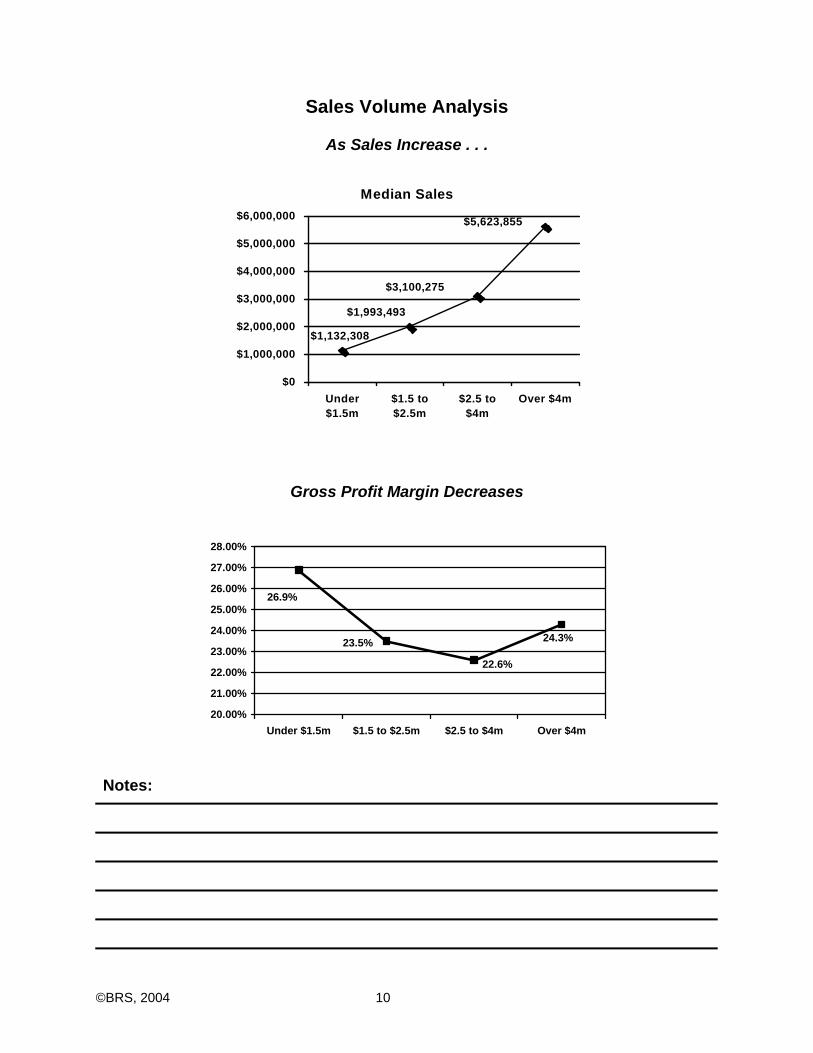
Sales Volume Analysis
As Sales Increase . . .
Median Sales
$1,132,308
$1,993,493
$3,100,275
$5,623,855
$0
$1,000,000
$2,000,000
$3,000,000
$4,000,000
$5,000,000
$6,000,000
Under$1.5m
$1.5 to$2.5m
$2.5 to$4m
Over $4m
Gross Profit Margin Decreases Notes:
26.9%
23.5%
22.6%
24.3%
20.00%
21.00%
22.00%
23.00%
24.00%
25.00%
26.00%
27.00%
28.00%
Under $1.5m $1.5 to $2.5m $2.5 to $4m Over $4m
©BRS, 2004 11
Operating Expenses Decrease
Why do you think operating expenses go down (as a percentage of sales) as sales increase? Why do you think operating expenses went up (as a percentage of sales) for companies with sales over $4 million? Notes:
6.8%5.7%
6.9%8.4%
0.00%
2.50%
5.00%
7.50%
10.00%
Under$1.5m
$1.5 to$2.5m
$2.5 to$4m
Over$4m
©BRS, 2004 12
Payroll Expenses Increase
11.0%
8.2%7.9%
9.1%
0.00%
4.00%
8.00%
12.00%
Under$1.5m
$1.5 to$2.5m
$2.5 to$4m
Over $4m
Which sales group was the most efficient at managing payroll expenses? Which sales group was the least efficient at managing payroll expenses? Why do you think pharmacies with sales over $4 million had such high payroll expenses?
Notes:

©BRS, 2004 13
What do these charts tell you?
In comparing the top 2 groups, insert the words higher or lower to make the statement true about pharmacies with sales over $4 million. They have ____________ gross profit margins. They have ____________ payroll expenses (as a percentage of sales). They have ____________ operating expenses. Even though they have ____________ owner’s discretionary profit percentages, since the percentage is applied to a ____________ sales amount, they end up with ___________ owner’s discretionary profit dollars.
Notes:
Owner's Discretionary Profit Dollars
$161,364
$359,935
$250,465
$97,216
$0
$100,000
$200,000
$300,000
$400,000
Under$1.5m
$1.5 to$2.5m
$2.5 to$4m
Over $4m
Owners Discretionary Profit Percentage
6.0%
8.1%8.1%
9.8%
0.00%
2.50%
5.00%
7.50%
10.00%
Under$1.5m
$1.5 to$2.5m
$2.5 to$4m
Over$4m

©BRS, 2004 14
What To Do Next Take the Acid Test
Assess – Where you are now
Compare – Yourself with others
Identify – Your strengths and weaknesses
Develop – Goals and action plans Team up – With other pharmacists
Evaluate – Your progress
Strategize – With your planning team
Try – Again and again
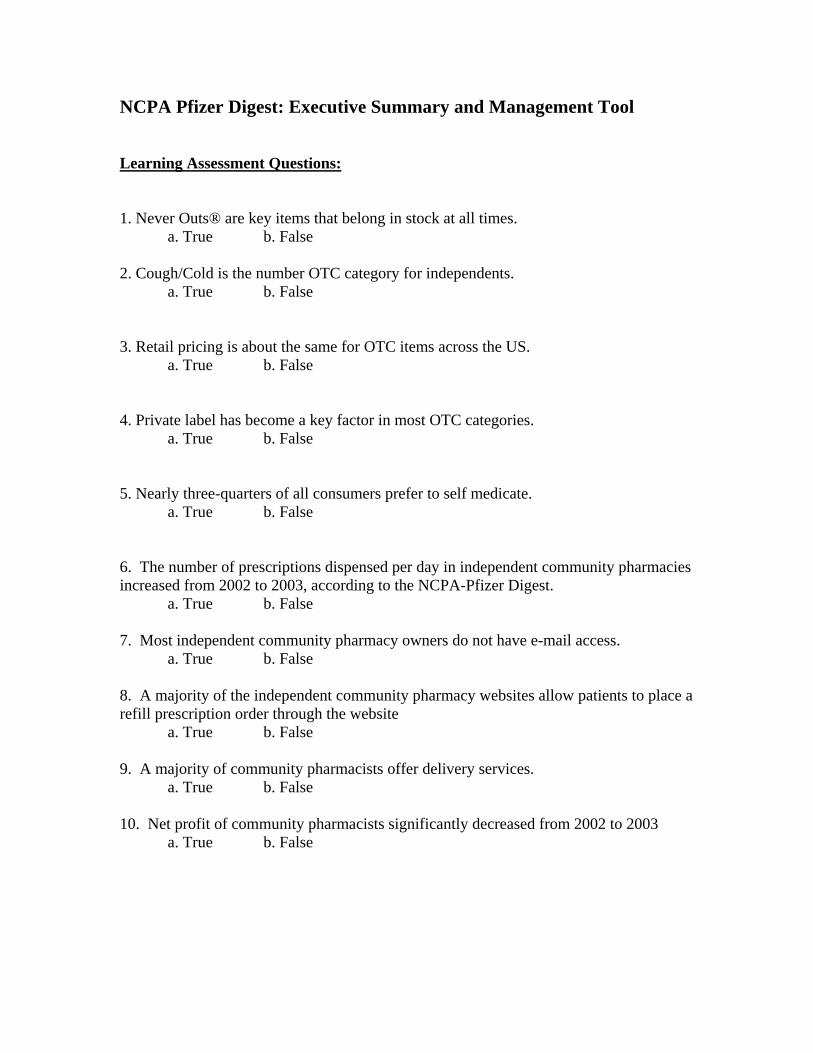
NCPA Pfizer Digest: Executive Summary and Management Tool Learning Assessment Questions: 1. Never Outs® are key items that belong in stock at all times. a. True b. False 2. Cough/Cold is the number OTC category for independents. a. True b. False 3. Retail pricing is about the same for OTC items across the US. a. True b. False 4. Private label has become a key factor in most OTC categories. a. True b. False 5. Nearly three-quarters of all consumers prefer to self medicate. a. True b. False 6. The number of prescriptions dispensed per day in independent community pharmacies increased from 2002 to 2003, according to the NCPA-Pfizer Digest. a. True b. False 7. Most independent community pharmacy owners do not have e-mail access. a. True b. False 8. A majority of the independent community pharmacy websites allow patients to place a refill prescription order through the website a. True b. False 9. A majority of community pharmacists offer delivery services. a. True b. False 10. Net profit of community pharmacists significantly decreased from 2002 to 2003 a. True b. False

NCPA Pfizer Digest: Executive Summary and Management Tool Learning Assessment Answers: 1. True 2. True 3. False 4. True 5. True 6. True 7. False 8. True 9. True 10. False


![Food security and nutrition: building a global narrative ... · EXECUTIVE SUMMARY EXECUTIVE SUMMARY EXECUTIVE SUMMARY EXECUTIVE SUMMAR Y [ 2 ] This document contains the Summary and](https://static.fdocuments.net/doc/165x107/5ff5433612d22125fb06e6b5/food-security-and-nutrition-building-a-global-narrative-executive-summary-executive.jpg)
