
expanding summer learning, meals and jobs for america's young ...
Upload
nguyennhanCategory
view
216download
0
TASK FORCE ON AMERICA’S FUTURE ENERGY JOBS
N A T I O N A L C O M M I S S I O N O N E N E RG Y P O L I C Y ’ S
NATIONAL COMMISSION ON ENERGY POLICY | D.C. 20005
T: 202-204-2400 | F:
NA
TIO
NA
L C
OM
MIS
SIO
N O
N E
NE
RG
Y P
OLIC
Y’S
TASK FO
RCE ON A
MER
ICA’S FU
TURE EN
ERGY JO
BS
55627_C1_C4_.indd 155627_C1_C4_.indd 1 8/14/09 9:56 AM8/14/09 9:56 AM
ber
Disclaimer
This report is a product of a Task Force with participants of diverse expertise
and affi liations, addressing many complex and contentious topics. It is inevi-
table that arriving at a consensus document in these circumstances entailed
compromises. Accordingly, it should not be assumed that every member is
entirely satisfi ed with every formulation in this document, or even that all
participants would agree with any given recommendation if it were taken in
isolation. Rather, this group reached consensus on these recommendations as
a package, which taken as a whole offers a balanced approach to the issue.
It is also important to note that this report is a product solely of the partici-
pants from the NCEP convened Task Force on America’s Future Energy Jobs.
The views expressed here do not necessarily refl ect those of the National Com-
mission on Energy Policy.
Acknowledgements
The National Commission on Energy Policy would like to express its thanks for
the strong support of its funders. The Commission was founded in 2002 by
the William and Flora Hewlett Foundation and its partners.
Special appreciation is due to Norm Augustine and Senator Pete Domenici
(ret.) for their valuable contributions to this effort. The NCEP staff gratefully
acknowledges the substantial guidance, research, and support offered by M.J.
Bradley & Associates, LLC throughout the course of this effort. In particular,
Michael Bradley, Managing Director, Carrie Jenks, Senior Consultant, Tom
Curry, Policy Analyst, and Kathleen Robertson, Policy Analyst, were essential
members of the project team as was Elizabeth Ewing, of Ewing Smith Consult-
ing, LLC. Additionally, special thanks to Ian Copeland, President, and Rick
Franzese, Senior Development Manager, both of Bechtel Power Corporation,
for generously lending their expertise to the Task Force. Thanks also to Todd
Barker, Partner, of the Meridian Institute for his guidance during the second
and third Task Force meetings, and to Revis James, Director of the Energy
Technology Assessment Center at the Electric Power Research Institute for al-
lowing the Task Force to draw on the EPRI analyses in this area.
55627_C1_C4_.indd 255627_C1_C4_.indd 2 8/13/09 6:26 PM8/13/09 6:26 PM

Task Force on America’s Future Energy Jobs i
Foreword
Jobs, energy, and climate change—these issues are not new, but they
have converged with greater urgency in the political spotlight over recent
months. Efforts to advance climate legislation in Congress have re-ener-
gized a long-standing debate about the jobs and competitiveness impacts
of greenhouse gas constraints, even as immediate measures to stimulate
the economy have emphasized the job-creating potential of clean energy
investments. In this fast-changing context, one central premise is beyond
dispute: Transforming our nation’s energy systems represents an enormous
undertaking. It will require not only new, low-carbon technologies and
systems, but people with the expertise to create those technologies and to
plan, design, build, operate, and maintain those technologies and systems.
In this report, the Task Force on America’s Future Energy Jobs makes
the compelling case that our nation’s educational infrastructure must be
improved and realigned to produce the next generation of profession-
als needed to orchestrate this critical transformation. The themes and
recommendations that emerge from this assessment particularly reso-
nate with the two of us. Our own long careers, spanning both the public
and private realms, refl ect a deep commitment to this nation’s continued
global leadership in the domains of science and technology—and a deep
conviction that strength in these areas is essential to America’s continued
prosperity and security. Through independent paths we have, in our own
ways, become students of the U.S. K–12 educational system and we have
concluded it is dangerously close to failing on a number of crucial fronts.
By grappling with these issues as they relate to the energy sector, the Task
Force has made an important contribution. We hope it will further mo-
tivate the movement to fi nally reform our nation’s educational systems.
Indeed, we hope this report is viewed as a call to action—one that comes
at a rare moment when new political will and fi nancial resources are
being directed to major investments in our nation’s energy and educa-
tion sectors. Implementing the recommendations in this report would
represent a major step forward in dealing with some of the most diffi cult
challenges our nation confronts in this century. We can’t think of a better
time than now to get started.
Norman R. Augustine
Retired Chairman and CEO, Lockheed Martin Corporation
Chair, National Academy of Sciences, Committee on Prosperity in the
Global Economy of the 21st Century, “Rising Above the Gathering Storm”
Senator Peter V. Domenici (retired) (R-NM)
Senior Fellow, Bipartisan Policy Center
55627_P001_104.indd i55627_P001_104.indd i 8/13/09 8:03 AM8/13/09 8:03 AM
i i Task Force on America’s Future Energy Jobs
Carol Berrigan—Senior Director, Industry Infrastructure, Nuclear Energy Institute (NEI)
Ian Copeland—President, New Technology, Bechtel Power Corporation
Joan Glickman—Special Assistant, Renewable Energy, U.S. Department of Energy
Dr. Nancy Grasmick—State Superinten-dent of Schools, State of Maryland
Lydia Logan—Executive Director, Institute for a Competitive Workforce, U.S. Chamber of Commerce
Mary Miller—Vice President of Human Resources, Edison Electric Institute
Ann Randazzo—Director, Center for Energy and Workforce Development (CEWD)
William Stevens—Senior Power Technology Advisor, U.S. Environmental Protection Agency
Task Force Advisors
Advisors to the Task Force on America’s Future Energy Jobs provided invaluable technical input and information but did not participate in Task Force decisions aimed at developing policy recommendations. Therefore, Task Force advisors do not endorse the recommendations put forward in this white paper.
Paul Allen—Senior Vice President, Corporate Affairs, Chief Environmental Offi cer, Constellation Energy
Bill Banig—Legislature Director, United Mine Workers of America
Bob Baugh—Executive Director, Industrial Union Council, AFL-CIO
Abe Breehey—Director of Legislative Affairs, International Brotherhood of Boilermakers
Marcy Drummond—Vice President of Academic Affairs, Los Angeles Trade-Technical College
Dr. Scott Farrow—Chair of Economics Department, University of Maryland, Baltimore County (UMBC)
Barbara Hins-Turner—Executive Director, Center of Excellence for Energy Technology, Centralia College (WA)
Jim Hunter—Director, IBEW Utility Department, International Brotherhood of Electrical Workers
Dr. Nicholas P. Jones—Dean, G.W.C. Whiting School of Engineering, Johns Hopkins University
Gary Kaplan—Executive Director, JFYNetWorks
Janice Kuczynski—Manager of Develop-mental Roles, Exelon Nuclear
David Manning—Executive Vice President, U.S. External Affairs, National Grid
Robert J. Pleasure—Director of Educa-tion, Building and Construction Trades Department, AFL-CIO
Dr. Nan Poppe—Campus President, Portland Community College
Bob Powers—President, AEP Utilities, American Electric Power
Roxanne Richards—Director, Workforce Development, Midwest Generation, Edison Mission Group
Van Ton-Quinlivan—Director, Strategic HR Programs, Pacifi c Gas and Electric Company (PG&E)
Jason Walsh—National Policy Director, Green For All
Jeff Williams—Manager, Corporate Environmental Initiatives, Entergy Corporation
Task Force Participants
55627_P001_104.indd ii55627_P001_104.indd ii 8/13/09 8:03 AM8/13/09 8:03 AM
TASK FORCE ON AMERICA’S FUTURE ENERGY JOBS
N A T I O N A L C O M M I S S I O N O N E N E RG Y P O L I C Y ’ S
55627_P001_104.indd iii55627_P001_104.indd iii 8/13/09 8:03 AM8/13/09 8:03 AM
iv Task Force on America’s Future Energy Jobs
55627_P001_104.indd iv55627_P001_104.indd iv 8/13/09 8:03 AM8/13/09 8:03 AM
Task Force on America’s Future Energy Jobs 1
Executive Summary .............................................................................................................................2
1: The Current Energy Workforce .................................................................................................... 12
2: Estimating the Workforce Implications of a
Transition to Low-Carbon Electricity Generation ....................................................................... 18
Summary: Future Workforce Needs .......................................................................................... 40
3: Training the Future Energy Workforce ....................................................................................... 42
4: Conclusion .....................................................................................................................................58
Task Force Recommendations ..........................................................................................................61
Appendix A: Bechtel Report on Design and Construction ............................................................ 67
Appendix B: Alternative Scenarios .................................................................................................. 88
Appendix C: Coordinated Training Program Case Studies ............................................................ 92
Appendix D: Insights from the Analysis and Next Steps ............................................................... 97
CONTENTS
55627_P001_104.indd 155627_P001_104.indd 1 8/13/09 8:03 AM8/13/09 8:03 AM
2 Task Force on America’s Future Energy Jobs
In January of 2009, the National Commission
on Energy Policy (NCEP) convened a group of
stakeholders with expertise in the workforce of
the U.S. electric power industry. The NCEP Task
Force on America’s Future Energy Jobs brought
together representatives from labor, the electric
power industry, and the training and educational
sectors to explore—over a series of three meetings
in six months—the existing demographic makeup
and anticipated workforce needs of the electric
power sector, along with the training institutions
and programs that support this sector. This report
summarizes the insights and conclusions resulting
from this effort.
EXECUTIVE SUMMARY
55627_P001_104.indd 255627_P001_104.indd 2 8/13/09 8:03 AM8/13/09 8:03 AM

Task Force on America’s Future Energy Jobs 3
THE UNITED STATES IS FACING
A CRITICAL SHORTAGE OF TRAINED
PROFESSIONALS TO MAINTAIN
THE EXISTING ELECTRIC POWER
SYSTEM AND DESIGN, BUILD,
AND OPERATE THE FUTURE ELECTRIC
POWER SYSTEM.
Broadly speaking, the Task Force believes the
United States is facing a critical shortage of
trained professionals to maintain the existing
electric power system and design, build, and
operate the future electric power system. The
implications of this shortfall are wide-ranging
and, in the view of the Task Force, of national
signifi cance. The ability to maintain a highly
reliable, economically affordable electric power
system while modernizing the nation’s gener-
ating infrastructure to support an advanced,
low-carbon technology portfolio is in serious
jeopardy. This report highlights the main forces
driving this situation and lays out a series of
recommendations for addressing the dominant
workforce challenges that will confront the elec-
tric power industry over the next several years.
Ensuring the proper systems and institutions
are in place to respond to these challenges is
important, not only in terms of advancing criti-
cal public policy goals with respect to energy,
the economy, and the environment, but because
a substantial opportunity exists to create new
high-skill, high-paying jobs in the energy sector
at a time when growing numbers of Americans
are unemployed or underemployed and face the
prospect of fi nancial insecurity.
Since the formation of this Task Force, the na-
tion has experienced signifi cant political and
economic changes. The Obama Administration
is committed to an energy policy that aims to
reduce the nation’s consumption of fossil fuels
and contribution to global greenhouse gas
emissions. At the same time, an unprecedented
economic crisis has crippled global fi nancial
markets, halted global economic growth, and
led to massive job losses in the United States
and elsewhere. Against this backdrop, the Task
Force set about examining the workforce supply
and demand dynamics in the electric power in-
dustry. The recently enacted American Recovery
and Reinvestment Act (ARRA) will likely pro-
vide a near-term infusion of resources that have
55627_P001_104.indd 355627_P001_104.indd 3 8/13/09 8:03 AM8/13/09 8:03 AM
4 Task Force on America’s Future Energy Jobs
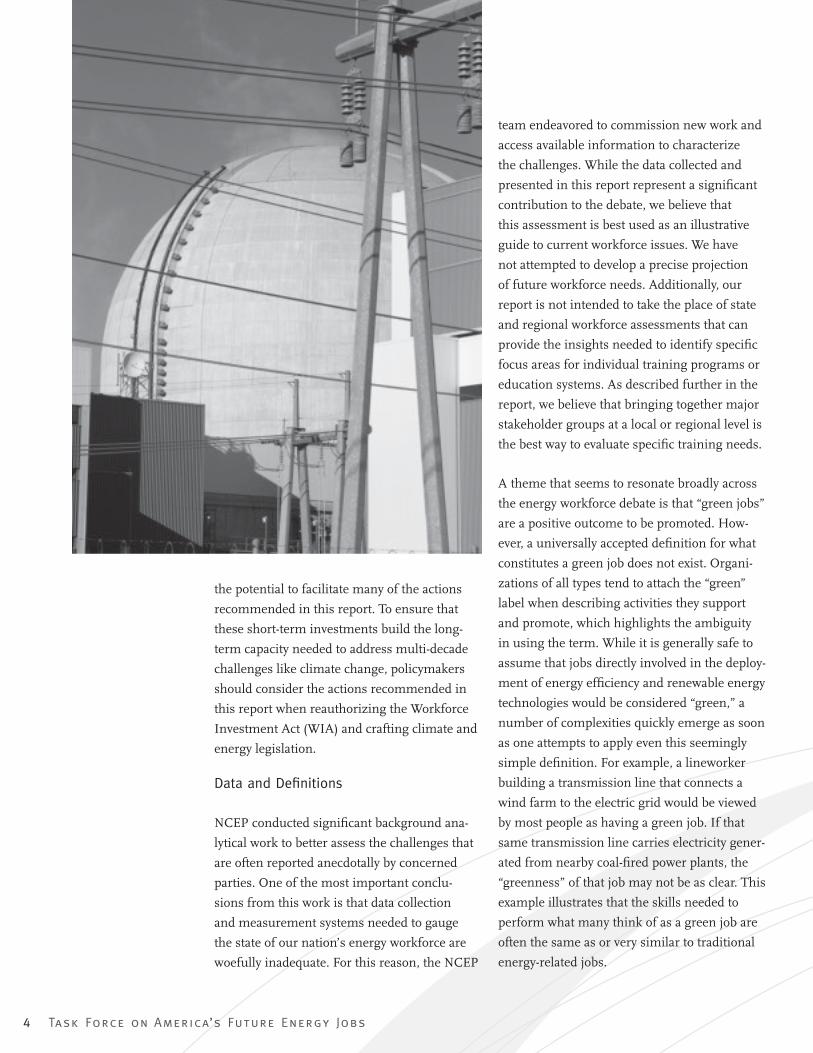
the potential to facilitate many of the actions
recommended in this report. To ensure that
these short-term investments build the long-
term capacity needed to address multi-decade
challenges like climate change, policymakers
should consider the actions recommended in
this report when reauthorizing the Workforce
Investment Act (WIA) and crafting climate and
energy legislation.
Data and Defi nitions
NCEP conducted signifi cant background ana-
lytical work to better assess the challenges that
are often reported anecdotally by concerned
parties. One of the most important conclu-
sions from this work is that data collection
and measurement systems needed to gauge
the state of our nation’s energy workforce are
woefully inadequate. For this reason, the NCEP
team endeavored to commission new work and
access available information to characterize
the challenges. While the data collected and
presented in this report represent a signifi cant
contribution to the debate, we believe that
this assessment is best used as an illustrative
guide to current workforce issues. We have
not attempted to develop a precise projection
of future workforce needs. Additionally, our
report is not intended to take the place of state
and regional workforce assessments that can
provide the insights needed to identify specifi c
focus areas for individual training programs or
education systems. As described further in the
report, we believe that bringing together major
stakeholder groups at a local or regional level is
the best way to evaluate specifi c training needs.
A theme that seems to resonate broadly across
the energy workforce debate is that “green jobs”
are a positive outcome to be promoted. How-
ever, a universally accepted defi nition for what
constitutes a green job does not exist. Organi-
zations of all types tend to attach the “green”
label when describing activities they support
and promote, which highlights the ambiguity
in using the term. While it is generally safe to
assume that jobs directly involved in the deploy-
ment of energy effi ciency and renewable energy
technologies would be considered “green,” a
number of complexities quickly emerge as soon
as one attempts to apply even this seemingly
simple defi nition. For example, a lineworker
building a transmission line that connects a
wind farm to the electric grid would be viewed
by most people as having a green job. If that
same transmission line carries electricity gener-
ated from nearby coal-fi red power plants, the
“greenness” of that job may not be as clear. This
example illustrates that the skills needed to
perform what many think of as a green job are
often the same as or very similar to traditional
energy-related jobs.
55627_P001_104.indd 455627_P001_104.indd 4 8/13/09 8:03 AM8/13/09 8:03 AM
Task Force on America’s Future Energy Jobs 5
THE NCEP TASK FORCE ON
AMERICA’S FUTURE ENERGY
JOBS BELIEVES DEBATING THE
DEFINITION OF GREEN JOBS
MAY BECOME A DISTRACTION
… WE BELIEVE THE TERM
“FUTURE ENERGY JOB” IS MORE
APPROPRIATE FOR OUR FOCUS.
1 Apollo Alliance and Green For All with Center for American Progress and Center on Wisconsin Strategy, “Green-Collar Jobs in America’s Cities: Building Pathways out of Poverty and Careers in the Clean Energy Economy.” 2008. Available http://www.green-forall.org/resources/green-collar-jobs-in-america2019s-cities. 2 While the Task Force future scenarios focus on electric power generation, transmission, and distribution, we recognize that electric utilities are frequently integrated with natural gas utilities and that natural gas utilities face similar workforce pressures. Accord-ing to the Bureau of Labor Statistics, natural gas utilities employ about 106,000 people. The CEWD data referenced in this report combine natural gas utility workforce estimates with the electric utility workforce estimates.
The NCEP Task Force on America’s Future
Energy Jobs believes debating the defi nition
of green jobs may become a distraction. In
fact, we do not use this term elsewhere in this
report. Rather, because our effort is focused on
workforce needs associated with building and
supporting energy infrastructure for a future
low-carbon energy system, we believe the term
“future energy job” is more appropriate for
our focus. It implies that all types of jobs that
support an energy system consistent with a
long-term goal of reducing greenhouse gas
emissions should be seen in the same light.
Some of the jobs related to the transition to a
carbon constrained economy will be new and
will require new skill sets. But many more will
use skills that are already in demand today, such
as those required for sheet metal workers, trans-
mission lineworkers, and electricians.1 In effect,
if the underlying policy framework refl ects the
objectives embedded in the term “green job”
then future energy jobs are green jobs.
Overarching Challenges
As a starting point, Task Force members shared
a common recognition that the electric power
sector faces near- and long-term workforce
challenges. Its workforce is aging and will need
to be replaced. Facing a wave of retirements
over the next decade, the electric power in-
dustry will need to expand hiring and training
programs just to maintain the level of qualifi ed
workers required to operate existing facilities.
In fact, new workers will be needed to fi ll as
many as one-third of the nation’s 400,000 cur-
rent electric power jobs by 2013.2 In the face of
this surge in demand, companies are fi nding
that applicants for open positions at electricity
companies are not as prepared as they were in
decades past. Companies are fi nding that U.S.
students are not graduating at the same rates
in the relevant fi elds and with the same quali-
fi cations as in the past. While the Task Force
focused on direct electric power sector jobs,
the Task Force members recognize that other
economic sectors, such as the manufacturing
sector, face similar demographic, education,
and training challenges.
In the long-term, the deployment of new tech-
nologies and generating assets—including new
energy effi ciency, nuclear, renewable, advanced
coal with carbon capture, and smart grid tech-
nologies—will require new design, construc-
tion, operation, and maintenance skills. This is
an important opportunity for new job creation
and economic growth. If too few individuals
with the necessary expertise are available when
they are needed, workforce bottlenecks could
slow the transition to a low-carbon economy
regardless of the commercial readiness of the
underlying technologies. If the result is to
delay the effi cient adoption of improved low-
carbon alternatives, workforce shortages would
represent more than a lost opportunity—they
could impose substantial costs, both in terms of
economic burden and environmental damages
and could damage U.S. global competitiveness.
Task Force Approach
The Task Force focused on three broad catego-
ries of jobs:
� Jobs associated with operating and maintain-
ing the existing electric power infrastructure;
55627_P001_104.indd 555627_P001_104.indd 5 8/13/09 8:03 AM8/13/09 8:03 AM
6 Task Force on America’s Future Energy Jobs
� Jobs associated with designing and building
new generation to meet future low-carbon
energy needs; and
� Jobs associated with operating and maintain-
ing the electric power industry of the future.
The fi rst chapter summarizes the Task Force’s
fi ndings on existing power industry labor mar-
kets. Rapid attrition due to retirements from an
aging pool of workers is the primary concern.
Chapter 2 examines what happens when an
expected surge in demand for new low-carbon
energy technologies is layered on top of this
declining base. Comparing pending workforce
requirements against the existing education
and training pipeline is the focus of the third
chapter. Chapter 4 presents suggested policy
solutions and Task Force recommendations.
We summarize key insights from each chapter
along with our primary recommendations be-
low. References for the data are included in the
corresponding chapters.
Chapter 1 Critical Insights – Existing Electric
Power Sector Workforce
� The electric power generation, transmission,
and distribution industry employs about
400,000 people.
� A large fraction (30–40 percent) of electric
power workers will be eligible for retirement
or leave the industry for other reasons by 2013.
� Of the 120,000 to 160,000 electric power
workers that will be eligible for retirement
or leave the industry for other reasons by
2013, industry surveys suggest 58,200 will be
skilled craft workers and another 11,200 will
be engineers.
� While recent industry estimates anticipate
that workers will delay retirement due to the
current economic downturn, it is impossible
to predict how long workers will extend em-
55627_P001_104.indd 655627_P001_104.indd 6 8/13/09 8:03 AM8/13/09 8:03 AM

Task Force on America’s Future Energy Jobs 7
A LARGE FRACTION
(30–40 PERCENT)
OF ELECTRIC POWER WORKERS
WILL BE ELIGIBLE FOR
RETIREMENT OR LEAVE
THE INDUSTRY FOR OTHER
REASONS BY 2013.
ployment. There is a concern in the industry
that delayed retirement could lead to more
acute worker shortages at some point in the
future if many workers retire around the
same time.
Chapter 2 Critical Insights – Potential Workforce
Demand Surge under a Federal Climate Policy
� In addition to needing skilled workers to
replace retiring workers, the industry will
need skilled construction workers to design
and construct new electric sector infrastruc-
ture. We estimate that in 2022, design and
construction work for the electric sector
will require about 150,000 professional and
skilled craft workers from the construction
sector. This construction workforce is about
40 percent the size of the existing electric
power workforce.
� Demand for skilled workers to operate and
maintain the electric generation systems of the
future will increase steadily as new technolo-
gies come online. The number of additional
workers that will be needed by 2030 is rough-
ly 60,000—an increase of almost 15 percent.
� The deployment trajectory for new genera-
tion technologies directly impacts workforce
demand. In scenarios with steady annual de-
ployment of new generating assets, workforce
demands will peak at a lower level and will
be spread out over more years. In scenarios
where construction is delayed and several
generating assets are planned to come into
operation in the same year, the workforce
peak is higher and the demand is more con-
centrated around the peak year. This variabil-
ity reinforces the need for local and regional
assessments of workforce demand as climate
policy becomes clearer.
� The industry needs to prepare to meet a long-
term, sustained need for training, beyond the
retirement gap.
� With respect to the design, construction, and
operation and maintenance (O&M) of infra-
structure and supporting technologies:
� Demand for construction labor to build new
high-voltage transmission lines and substa-
tions is expected to spike, especially in light
of the transmission investments antici-
pated under the recent economic stimulus
package. We estimate the peak demand for
construction labor and skilled crafts to be
about 10,000 to 15,000. However, policy
and regulatory delays have affected the con-
struction timetable of a number of proposed
transmission lines. These delays increase
the uncertainty around projections of future
workforce demand.
� The near-term deployment of smart grid
technologies will require over 90,000
workers. However, smart grid deployment
will result in about 25,000 electricity power
industry workers looking to transition to
new positions. This supply of workers high-
lights the need for training programs that
55627_P001_104.indd 755627_P001_104.indd 7 8/13/09 8:03 AM8/13/09 8:03 AM
8 Task Force on America’s Future Energy Jobs
retrain existing workers to take advantage
of new opportunities within the industry.
� Construction and maintenance of CO2
pipelines as part of a commitment to ex-
panded carbon capture and storage (CCS)
will marginally add to the demand for
skilled workers. While not directly calcu-
lated as part of the NCEP Task Force esti-
mates, additional workers will be needed to
retrofi t fossil fuel-fi red power plants with
carbon capture technologies.
� Running energy effi ciency programs requires
people to design and administer programs
and people to promote those programs
and sign up new customers. We estimate
that utility or other third-party managed
energy effi ciency programs in the United
States will require all or part of the time of
approximately 11,000 employees per year
through 2030. Additionally, we expect the
program managers to hire contractors to
implement or deploy effi ciency technolo-
gies. These contractors are expected to
signifi cantly outnumber the number of
direct employees required to administer
and promote customer-side effi ciency pro-
grams and could number in the thousands
for each program. While these jobs will be
an important component of future energy
jobs, the Task Force decided not to seek to
quantify these jobs.
Chapter 3 Challenges – Training the Future
Energy Workforce
� Challenges to preparing students in grades K-12:
� Low Graduation Rates. Of the approximate-
ly four million students who will begin
high school this fall in the United States,
less than three million are expected to com-
plete high school.
� Lack of Technical Skills. Of those who com-
plete high school, many are ill-prepared to
pursue a career that requires basic techni-
cal skills.
� Lack of Industry-Specifi c Training for
Educators. Teacher training and retraining
is a key component of repairing our basic
educational system.
� Challenges to training and educating skilled
craft workers:
� Individuals can acquire the technical skills
and training to enter the skilled craft electric
power or construction workforce from several
types of institutions or programs, including:
- community colleges,
- community-based organizations (CBOs),
- apprenticeship programs,
- company-specifi c training programs, and
- worker retraining programs.
� Understanding the Electric Power Sector
Demand for Skilled Workers. A key chal-
55627_P001_104.indd 855627_P001_104.indd 8 8/13/09 8:03 AM8/13/09 8:03 AM
Task Force on America’s Future Energy Jobs 9
A LACK OF STANDARDIZED
SKILL SETS AND CURRICULA
FOR SOME OF THE SKILLED
CRAFTS WITHIN THE ELECTRIC
POWER SECTOR PRESENTS
A SIGNIFICANT CHALLENGE
FOR STUDENTS, COMMUNITY
COLLEGES, AND EMPLOYERS.
lenge is aligning training programs with
the demand for workers. This challenge is
compounded by the current system used by
the Bureau of Labor Statistics (BLS) to esti-
mate future industry demand. That system
relies on historical trends to project future
industry growth and does not include esti-
mates for replacing positions lost through
retirements or other attrition.
� Lack of Communication among Stakehold-
er Groups. Compounding the assessment
challenge noted above is the fact that better
communication is needed among stake-
holders—particularly between training
institutions and the electric power sector.
� Lack of Credential Portability. A lack of
standardized skill sets and curricula for
some of the skilled crafts within the electric
power sector presents a signifi cant chal-
lenge for students, community colleges,
and employers. This issue is specifi c to a
subset of skilled crafts within the electric
power sector—it does not apply to skilled
crafts in the construction sector.
� Collecting and Tracking Skilled Workforce
Data. Information on the number of people
that pass through existing training systems
and their ultimate employment is currently
not well captured.
� Costs of Education. Even students who
have adequate education in technical skills
may have trouble paying for post-secondary
education.
� Improving the Image of Electricity Indus-
try Careers. Students and parents often do
not view apprenticeship programs or other
programs outside the four-year degree
construct as providing similar or better op-
portunities for career and salary potential.
� Lack of Career Preparatory Skills within
the Workforce. Because of a lack of techni-
cal skills among the potential workforce,
introductory courses have become more
prevalent at the community college level.
� Challenges to training and educating engineers:
� Lack of math and science skills in the
population of high school graduates.
� Mobilizing the Research Community. Pro-
fessional engineers are needed to develop,
design and implement new, low-carbon
technologies that produce electricity. There
is a need for active and invigorated research
programs in power engineering and related
areas. To appropriately engage students,
faculty need to be engaged through the de-
velopment of research programs, including
55627_P001_104.indd 955627_P001_104.indd 9 8/13/09 8:03 AM8/13/09 8:03 AM
10 Task Force on America’s Future Energy Jobs
programs that are multidisciplinary in their
approach and thinking.
� Encouraging Students to Work in the
Electric Power Sector. In addition to stimu-
lating research, it is important to foster
mechanisms for pulling both research and
students into the electric power sector.
� Costs of Education. The cost of education
in the United States is daunting and can be
a barrier to entry.
Task Force Recommendations
The workforce challenges identifi ed by the Task
Force are signifi cant and addressing them will
take a concerted and sustained effort by many
stakeholders. To advance that process, the Task
Force developed a set of fi ve primary recom-
mendations for federal policy. The recommenda-
tions, summarized here, are available following
the conclusions in Chapter 4 of the report.
While these recommendations are specifi cally
focused on the development of direct future
energy jobs associated with design, construc-
tion, and operation of assets in the energy
sector, many of the insights could be applied to
job training associated with deploying energy
effi ciency and manufacturing the materials
and equipment needed to build and operate the
future energy system.
Recommendation 1: Evaluate regional training needs and facilitate multi-stake-holder energy sector training programs across the country. In addition to the work
currently underway at the Department of Labor
(DOL) and the Department of Energy (DOE)
to address the workforce gaps associated with
55627_P001_104.indd 1055627_P001_104.indd 10 8/13/09 8:03 AM8/13/09 8:03 AM
Task Force on America’s Future Energy Jobs 11
IN ADDITION TO STIMULATING
RESEARCH, IT IS IMPORTANT
TO FOSTER MECHANISMS FOR
PULLING BOTH RESEARCH AND
STUDENTS INTO THE ELECTRIC
POWER SECTOR.
projected retirements and the initiatives in
the American Recovery and Reinvestment Act
of 2009, Congress should appropriate funds
through existing funding mechanisms that
allow DOL and DOE to work with existing
state or regional energy workforce consortia or
establish new state or regional energy work-
force consortia, as appropriate. These consortia
should be tasked with evaluating near- and
long-term needs for a skilled workforce. As a
part of this evaluation, DOL, DOE, and each
state or regional energy workforce consortium
should seek to identify policy uncertainties that
are currently delaying, or have the potential to
delay, the deployment of new generating assets
and infrastructure. In the regions of the country
where the energy workforce consortia high-
light workforce gaps, Congress should provide
fi nancial resources and coordination assistance
for the development of locally or regionally-co-
ordinated workforce training programs targeted
to the needs of the energy sector. DOL should
use the Green Jobs Act, or other appropriate
federal funding mechanisms, to award funding
for this purpose through a competitive process
to programs that meet established criteria.
Recommendation 2: Improve energy sector workforce data collection and performance measurement metrics and tools. Improve
the collection, management, and availability of
workforce data for the energy sector to facilitate
future efforts to measure progress and identify
emerging workforce needs.
Recommendation 3: Identify training stan-dards and best practices for energy sector jobs. DOL, in consultation with industry, labor,
and education stakeholders, including ED
and DOE, should develop a repository of best
practices for electric sector job training that is
widely accessible, transparently managed, and
maintained by a public entity. This repository
should include existing skill standards and reg-
istered apprenticeship programs for electric sec-
tor jobs. The purpose of the repository should
be threefold: (1) it should be a resource for
employers to evaluate training programs and
potential employees, (2) it should be a resource
for individuals to evaluate training options as
they move through a career, and (3) it should be
a resource for educators as they develop courses
and curricula. As a part of this initiative, DOL,
in consultation with stakeholders, should iden-
tify skill areas where best practices or training
standards do not exist or should be expanded,
and work to fi ll such gaps.
Recommendation 4: Provide funding sup-port to individuals seeking energy sector-related training and education. Using
existing funding mechanisms as appropriate,
provide fi nancial support, targeted to those
most in need, to individuals that wish to pursue
energy-related technical and professional train-
ing or retraining and to students interested in
pursuing post-secondary degrees in engineer-
ing and other energy-related technical fi elds.
Recommendation 5: Aggressively focus on revitalizing the math and science skills, education, and career counseling of indi-viduals who have the interest and skills to work in the energy sector. Enhance sci-
ence, technology, engineering, and math train-
ing for K-12 students, adults who wish to enter
the energy workforce, and teachers and instruc-
tors. Engage the next generation of scientists
and engineers in the energy sector by following
through on and enhancing commitments to
expanding U.S. investment in research and de-
velopment. Increase awareness of employment
opportunities in the energy sector.
55627_P001_104.indd 1155627_P001_104.indd 11 8/13/09 8:04 AM8/13/09 8:04 AM
12 Task Force on America’s Future Energy Jobs
C H A P T E R 1 .
THE CURRENT ENERGY WORKFORCE
3 See, e.g., NEI’s November/December 2007 newsletter (“Nuclear Renaissance Presents Job Opportunities in All Sectors”) available at http://www.nei.org/fi lefolder/insight_200711_12.pdf and M.B. Reilly’s “The New Energy Crisis: Power Industry in for a Jolt as About Half of Workforce Readies for Retirement” available at http://www.uc.edu/News/NR.aspx?ID=4226. 4 U.S. Department of Labor, Employment and Training Administration. “Identifying and Addressing Workforce Challenges in America’s Energy Industry.” March 2007. Available http://www.doleta.gov/BRG/pdf/Energy%20Report_fi nal.pdf.
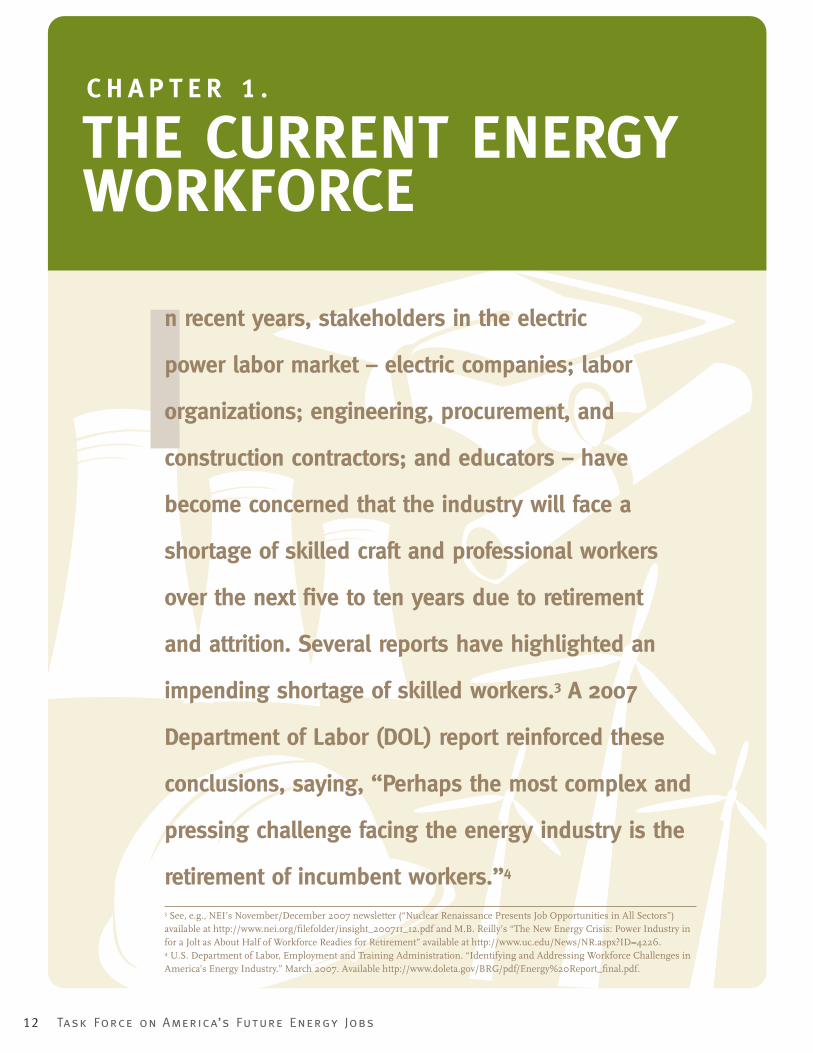
In recent years, stakeholders in the electric
power labor market – electric companies; labor
organizations; engineering, procurement, and
construction contractors; and educators – have
become concerned that the industry will face a
shortage of skilled craft and professional workers
over the next fi ve to ten years due to retirement
and attrition. Several reports have highlighted an
impending shortage of skilled workers.3 A 2007
Department of Labor (DOL) report reinforced these
conclusions, saying, “Perhaps the most complex and
pressing challenge facing the energy industry is the
retirement of incumbent workers.”4
55627_P001_104.indd 1255627_P001_104.indd 12 8/13/09 8:04 AM8/13/09 8:04 AM
Task Force on America’s Future Energy Jobs 13
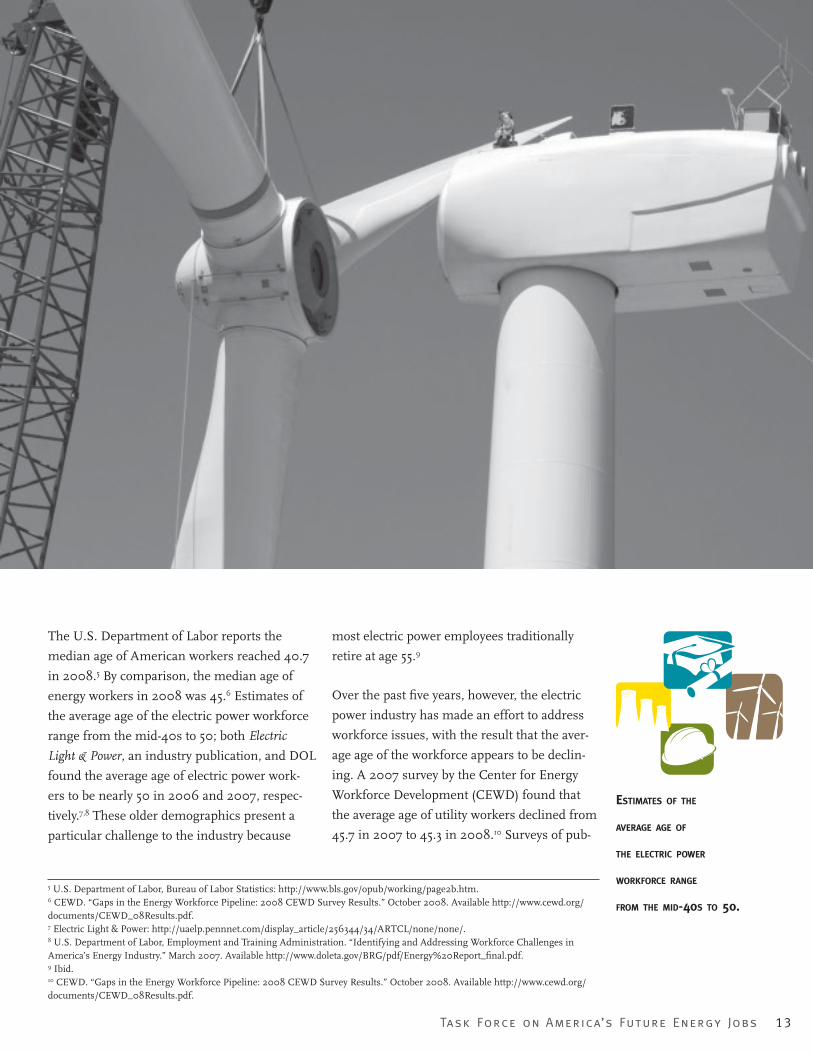
ESTIMATES OF THE
AVERAGE AGE OF
THE ELECTRIC POWER
WORKFORCE RANGE
FROM THE MID-40S TO 50.
5 U.S. Department of Labor, Bureau of Labor Statistics: http://www.bls.gov/opub/working/page2b.htm. 6 CEWD. “Gaps in the Energy Workforce Pipeline: 2008 CEWD Survey Results.” October 2008. Available http://www.cewd.org/documents/CEWD_08Results.pdf. 7 Electric Light & Power: http://uaelp.pennnet.com/display_article/256344/34/ARTCL/none/none/. 8 U.S. Department of Labor, Employment and Training Administration. “Identifying and Addressing Workforce Challenges in America’s Energy Industry.” March 2007. Available http://www.doleta.gov/BRG/pdf/Energy%20Report_fi nal.pdf. 9 Ibid. 10 CEWD. “Gaps in the Energy Workforce Pipeline: 2008 CEWD Survey Results.” October 2008. Available http://www.cewd.org/documents/CEWD_08Results.pdf.
The U.S. Department of Labor reports the
median age of American workers reached 40.7
in 2008.5 By comparison, the median age of
energy workers in 2008 was 45.6 Estimates of
the average age of the electric power workforce
range from the mid-40s to 50; both Electric
Light & Power, an industry publication, and DOL
found the average age of electric power work-
ers to be nearly 50 in 2006 and 2007, respec-
tively.7,8 These older demographics present a
particular challenge to the industry because
most electric power employees traditionally
retire at age 55.9
Over the past fi ve years, however, the electric
power industry has made an effort to address
workforce issues, with the result that the aver-
age age of the workforce appears to be declin-
ing. A 2007 survey by the Center for Energy
Workforce Development (CEWD) found that
the average age of utility workers declined from
45.7 in 2007 to 45.3 in 2008.10 Surveys of pub-
55627_P001_104.indd 1355627_P001_104.indd 13 8/13/09 8:04 AM8/13/09 8:04 AM
14 Task Force on America’s Future Energy Jobs
11 APPA. “Growing Your Employees of Tomorrow.” 2008. Available http://www.appanet.org/fi les/PDFs/2008WorkforceSurveyReport.pdf. 12 APPA. “Work Force Planning for Public Power Utilities: Ensuring Resources to Meet Projected Needs.” 2005. Available http://www.appanet.org/fi les/PDFs/WorkForcePlanningforPublicPowerUtilities.pdf. 13 While the Task Force future scenarios focus on electric power generation, transmission, and distribution, we recognize that electric utilities are frequently integrated with natural gas utilities and that natural gas utilities face similar workforce pressures. According to the Bureau of Labor Statistics, natural gas utilities employ about 106,000 people. The CEWD data referenced in this report combine natural gas utility workforce estimates with the electric utility workforce estimates.14 Badhul Chowdhury. “Power Education at the Crossroads.” IEEE Spectrum, October 2000.U.S. Department of Energy. “Workforce Trends In The Electric Utility Industry: A Report To The United States Congress Pursuant To Section 1101 Of The Energy Policy Act Of 2005.” August 2006. Available http://www.oe.energy.gov/DocumentsandMedia/Workforce_Trends_Report_090706_FINAL.pdf. 15 U.S. Department of Energy. “Workforce Trends In The Electric Utility Industry: A Report To The United States Congress Pursuant To Section 1101 Of The Energy Policy Act Of 2005.” August 2006. Available http://www.oe.energy.gov/DocumentsandMedia/Workforce_Trends_Report_090706_FINAL.pdf.
lic power companies by the American Public
Power Association (APPA) show a drop in the
average age of the public power workforce from
48 in 2005 to 43 in 2008.11,12
The declining average age of electric power
workers suggests that the industry has recog-
nized the impending shortage and has begun
accelerating the hiring of younger workers.
However, the same survey data suggest that
a wave of employees will become eligible for
retirement in the next fi ve to ten years. As dis-
cussed in more detail below, the electric power
industry estimates that 30 to 40 percent of its
workforce, which numbers about 400,000
employees, will be eligible to retire in the next
fi ve years.13 To make up for these retirements,
the industry will have to hire new employees at
a much higher rate.
As discussed in Chapter 3, new workers will
have to come from a training system that needs
to be refocused and reinvigorated. The number
of people who have trained to become part of
the electric power sector workforce has fl uctu-
ated over the years in response to the needs of
the industry, macroeconomic conditions, the at-
tractiveness of alternate career paths, and other
factors. After a period of relatively rapid growth
in the 1970s, when electricity demand grew
5 percent annually, the industry experienced
much lower demand growth in the 1980s and
1990s.14 The advent of a competitive market for
electric power companies led to an increased
focus on productivity, which dampened hiring
trends and led to an overall decline in workforce
levels through the end of the 1990s.15 Because
the industry’s demand for new workers slowed
signifi cantly over this period, companies scaled
back internal training programs. At the same
time, the pool of qualifi ed candidates for jobs
and training programs decreased dramatically.
To address the anticipated shortfall of skilled
workers, industry stakeholders formed CEWD
in 2006. CEWD is a non-profi t consortium of
electric, natural gas, and nuclear utilities, and
their associations that is tasked with addressing
the industry’s workforce training and education.
CEWD’s membership includes public, private,
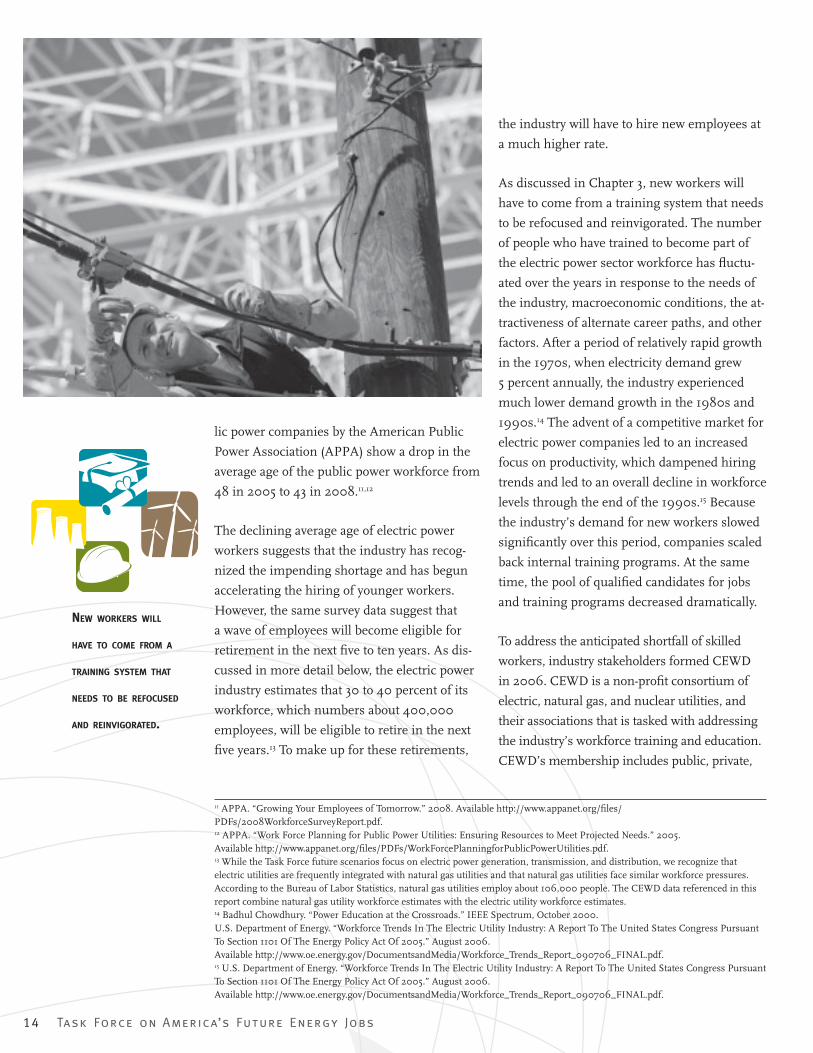
NEW WORKERS WILL
HAVE TO COME FROM A
TRAINING SYSTEM THAT
NEEDS TO BE REFOCUSED
AND REINVIGORATED.
55627_P001_104.indd 1455627_P001_104.indd 14 8/13/09 8:04 AM8/13/09 8:04 AM
Task Force on America’s Future Energy Jobs 15
16 CEWD, EEI, and NEI are advisors to the Task Force on America’s Future Energy Jobs.17 CEWD. “Gaps in the Energy Workforce Pipeline: 2008 CEWD Survey Results.” October 2008. Available http://www.cewd.org/documents/CEWD_08Results.pdf.18 CEWD defi ned potential retirees as employees who within the next fi ve years will be older than 58 with more than 25 years of service, older than 63 with 20 years of service, or older than 67. 19 CEWD defi ned possible retirees as employees who within the next fi ve years will be older than 53 with more than 25 years of service.20 U.S. Department of Labor, Bureau of Labor Statistics. “Career Guide to Industries, 2008-09 Edition, Utilities.” Available http://www.bls.gov/oco/cg/cgs018.htm.
and government-owned utilities as well as the
major utility trade associations: the Edison Elec-
tric Institute (EEI), American Gas Association,
Nuclear Energy Institute (NEI), and the National
Rural Electric Cooperative Association.16
Operation and Maintenance of Existing Generating Assets and Transmission Lines
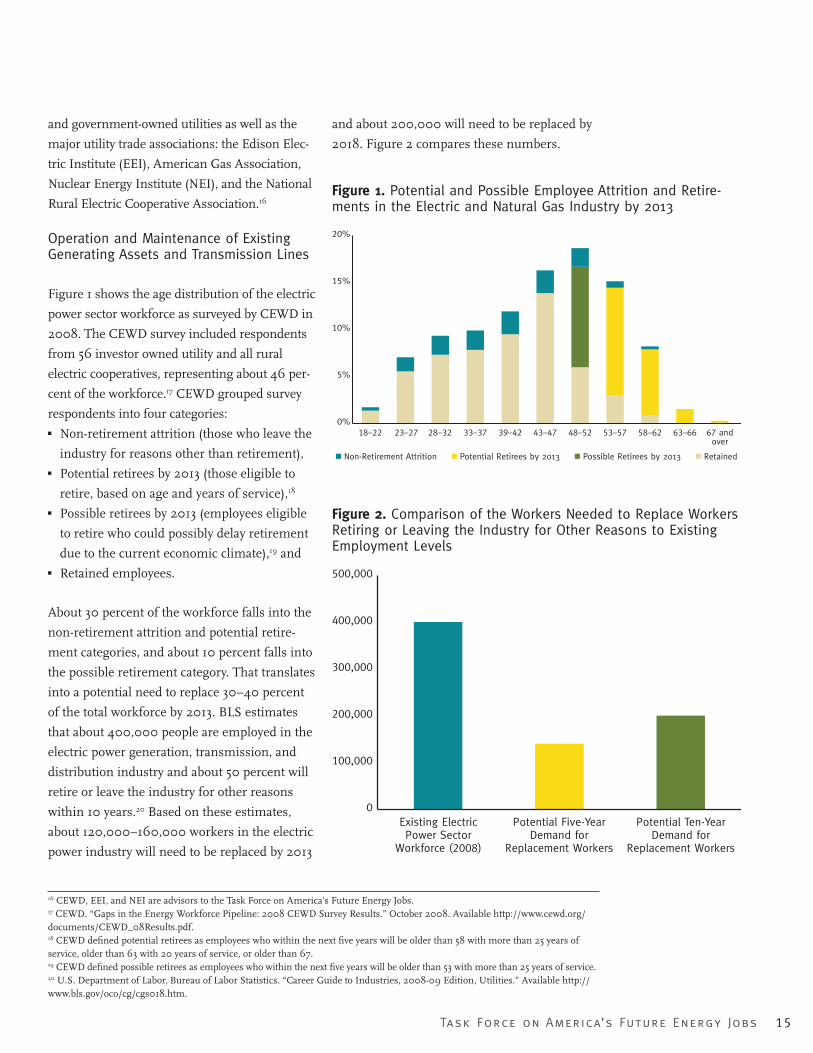
Figure 1 shows the age distribution of the electric
power sector workforce as surveyed by CEWD in
2008. The CEWD survey included respondents
from 56 investor owned utility and all rural
electric cooperatives, representing about 46 per-
cent of the workforce.17 CEWD grouped survey
respondents into four categories:
� Non-retirement attrition (those who leave the
industry for reasons other than retirement),
� Potential retirees by 2013 (those eligible to
retire, based on age and years of service),18
� Possible retirees by 2013 (employees eligible
to retire who could possibly delay retirement
due to the current economic climate),19 and
� Retained employees.
About 30 percent of the workforce falls into the
non-retirement attrition and potential retire-
ment categories, and about 10 percent falls into
the possible retirement category. That translates
into a potential need to replace 30–40 percent
of the total workforce by 2013. BLS estimates
that about 400,000 people are employed in the
electric power generation, transmission, and
distribution industry and about 50 percent will
retire or leave the industry for other reasons
within 10 years.20 Based on these estimates,
about 120,000–160,000 workers in the electric
power industry will need to be replaced by 2013
and about 200,000 will need to be replaced by
2018. Figure 2 compares these numbers.
0%
5%
10%
15%
20%
18–22 23–27 28–32 33–37 39–42 43–47 48–52 53–57 58–62 63–66 67 andover
Non-Retirement Attrition Potential Retirees by 2013 Possible Retirees by 2013 Retained
Figure 1. Potential and Possible Employee Attrition and Retire-ments in the Electric and Natural Gas Industry by 2013
0
100,000
200,000
300,000
400,000
500,000
Existing ElectricPower Sector
Workforce (2008)
Potential Five-YearDemand for
Replacement Workers
Potential Ten-YearDemand for
Replacement Workers
Figure 2. Comparison of the Workers Needed to Replace Workers Retiring or Leaving the Industry for Other Reasons to Existing Employment Levels
55627_P001_104.indd 1555627_P001_104.indd 15 8/13/09 8:04 AM8/13/09 8:04 AM
16 Task Force on America’s Future Energy Jobs
21 Because the CEWD assessment includes natural gas distribution, the CEWD data include a higher demand for technicians, engi-neers, and pipefi tters/pipelayers than would have been the case if only the electric utility sector were considered. 22 Carol L. Berrigan, Director, Industry Infrastructure, Nuclear Energy Institute. “Testimony for the Record to the U.S. Senate Committee on Energy and Natural Resources.” November 6, 2007. Available http://energy.senate.gov/public/_fi les/CBerriganTes-timony110607.pdf.
CEWD is particularly interested in assessing the
need for employees with technical skills, such as
skilled craft workers and engineers. These posi-
tions require signifi cant training, and thus are
an area of great concern for the industry, includ-
ing members of the Task Force. For example,
according to CEWD, a pipefi tter retiring with 30
years of experience would need to be replaced by
a pipefi tter with at least fi ve years of experience.
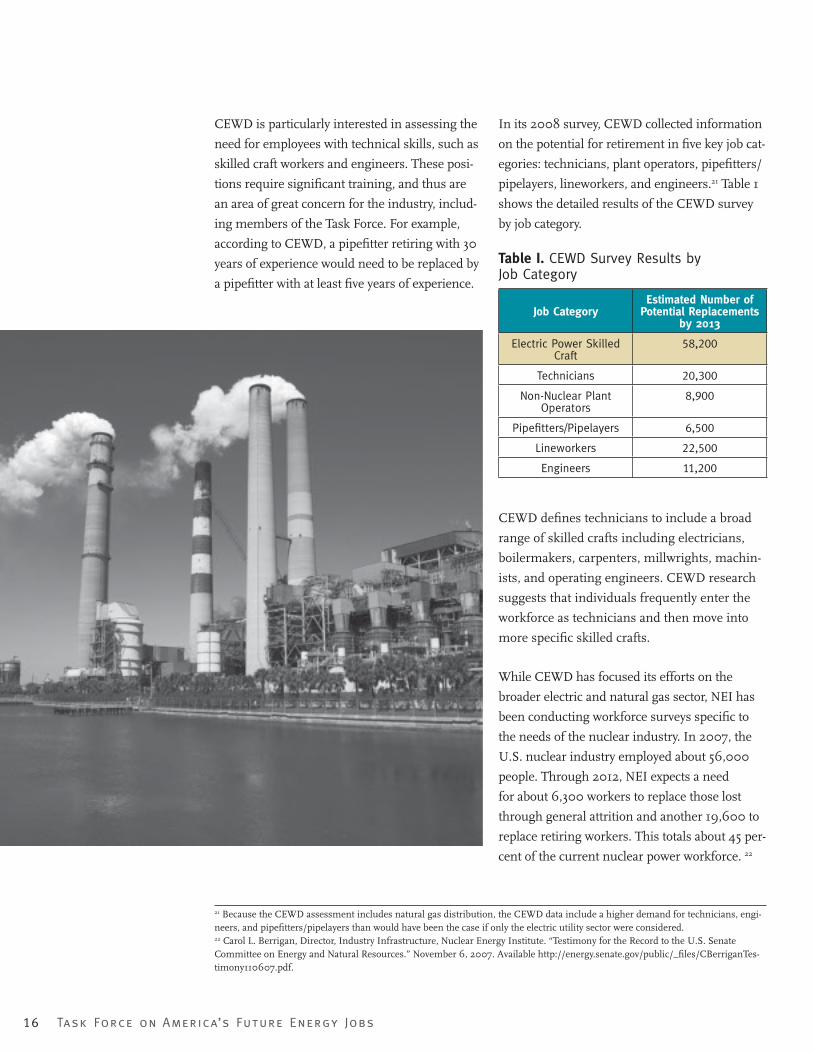
In its 2008 survey, CEWD collected information
on the potential for retirement in fi ve key job cat-
egories: technicians, plant operators, pipefi tters/
pipelayers, lineworkers, and engineers.21 Table 1
shows the detailed results of the CEWD survey
by job category.
Table I. CEWD Survey Results by Job Category
Job CategoryEstimated Number of
Potential Replacements by 2013
Electric Power Skilled Craft
58,200
Technicians 20,300
Non-Nuclear Plant Operators
8,900
Pipefi tters/Pipelayers 6,500
Lineworkers 22,500
Engineers 11,200
CEWD defi nes technicians to include a broad
range of skilled crafts including electricians,
boilermakers, carpenters, millwrights, machin-
ists, and operating engineers. CEWD research
suggests that individuals frequently enter the
workforce as technicians and then move into
more specifi c skilled crafts.
While CEWD has focused its efforts on the
broader electric and natural gas sector, NEI has
been conducting workforce surveys specifi c to
the needs of the nuclear industry. In 2007, the
U.S. nuclear industry employed about 56,000
people. Through 2012, NEI expects a need
for about 6,300 workers to replace those lost
through general attrition and another 19,600 to
replace retiring workers. This totals about 45 per-
cent of the current nuclear power workforce. 22
55627_P001_104.indd 1655627_P001_104.indd 16 8/13/09 8:04 AM8/13/09 8:04 AM
Task Force on America’s Future Energy Jobs 17
55627_P001_104.indd 1755627_P001_104.indd 17 8/13/09 8:04 AM8/13/09 8:04 AM
18 Task Force on America’s Future Energy Jobs
F
C H A P T E R 2 .
ESTIMATING THE WORKFORCE IMPLICATIONS OF A TRANSITION TO LOW-CARBON ELECTRICITY GENERATION
orecasting the long-term pace and trajectory of future
trends in the electric power industry is challenging in
any economic and political environment. The task is
even more challenging today, given the high degree
of uncertainty that surrounds any prediction of future
economic growth, climate policy, or technological de-
velopment. These uncertainties serve, however, to
reinforce the importance of understanding how policy
decisions made today can affect the workforce needs
of tomorrow. If the United States is going to substan-
tially reduce its greenhouse gas emissions over the
next two decades while continuing to meet the elec-
tricity demands of the economy, new low-carbon elec-
tricity generation and supporting infrastructure will
need to be designed, built, and operated.
55627_P001_104.indd 1855627_P001_104.indd 18 8/13/09 8:04 AM8/13/09 8:04 AM

Task Force on America’s Future Energy Jobs 19
THE ELECTRIC POWER INDUSTRY
WILL NEED TO DO MORE
THAN REPLACE THE WORKERS
WHO CURRENTLY OPERATE
AND MAINTAIN THE EXISTING
INFRASTRUCTURE, IT WILL NEED
TO ENGAGE WORKERS FROM THE
CONSTRUCTION SECTOR TO BUILD
NEW GENERATING ASSETS AND IT
WILL NEED TO EXPAND ITS OWN
WORKFORCE TO OPERATE AND
MAINTAIN THOSE NEW ASSETS.
23 Electric Power Research Institute. “The Power to Reduce CO2 Emissions: the Full Portfolio - 2008 Economic Sensitivity Studies
(EPRI Report 1018431),” December 2008.24 Note that the EPRI analysis consists of two distinct elements. The fi rst is the Prism analysis, which is an estimate of electricity sector CO
2 emissions reduction potential based on a hypothetical technology scenario. The second is driven by results from the
Model for Evaluating Regional and Global Effects (MERGE) energy-economic analysis, which examines the optimum portfolio of low-carbon energy technology over time under an assumed economy-wide CO
2 emissions constraint.
25 Electric Power Research Institute. “The Power to Reduce CO2 Emissions: the Full Portfolio - 2008 Economic Sensitivity Studies
(EPRI Report 1018431),” December 2008. 26 Although the EPRI Prism includes CCS on either supercritical or integrated gasifi cation combined cycle (IGCC) plants, the Task Force modeled IGCC with CCS.
That means the electric power industry will
need to do more than replace the workers who
currently operate and maintain the existing
infrastructure, it will need to engage work-
ers from the construction sector to build new
generating assets and it will need to expand its
own workforce to operate and maintain those
new assets.
Task Force members are concerned about the
ability of the existing training system to handle
the combined demand for technically-skilled
workers to both replace retiring workers and
support the rapid construction of new, low-
carbon generation capacity. While the United
States has yet to adopt a clear national cli-
mate policy, the Task Force sought to develop
national-level estimates of the demand for
labor to build and maintain low-carbon genera-
tion at the scale needed to achieve meaningful
reductions in greenhouse gas emissions. After
considering a number of modeled technol-
ogy pathways, the Task Force decided to use
an analysis developed by the Electric Power
Research Institute (EPRI).23, 24
The EPRI Prism analysis represents one scenar-
io for how the United States might reduce pow-
er-sector greenhouse gas emissions over the
next 20 years using a mix of low-carbon genera-
tion technologies (e.g. wind, solar, nuclear, and
coal with CCS) in combination with additional
energy effi ciency measures.26 This scenario
was attractive to Task Force members because
it was technology driven, assumed a balanced
mix of low-carbon options, and was not based
on a particular climate policy. The decision to
use the Prism analysis to develop a scenario
of future workforce needs, however, does not
imply an endorsement of a particular deploy-
ment pathway, nor does it mean that Task
Force members agree with the technology and
55627_P001_104.indd 1955627_P001_104.indd 19 8/13/09 8:04 AM8/13/09 8:04 AM
20 Task Force on America’s Future Energy Jobs
27 The features that made the Prism scenario attractive to Task Force members as a basis for estimating workforce needs are also important for understanding the limitations of the EPRI analysis. As the Prism is based on technological feasibility, it does not include the policy interventions that would likely be necessary to bring about a low-carbon transition, such as a CO
2 price or other
potential technology incentives like a renewable electricity standard. The Prism also does not consider potential constraints such as technology, materials or workforce availability.
policy assumptions that were used to develop
the Prism analysis. Rather, the Prism analysis
simply provided a reasonable approximation to
evaluate the possible future technology needs of
the power sector and allowed the Task Force to
impute potential workforce demands.27
Working from the Prism analysis, the Task
Force developed national-level estimates of the
numbers and the types of workers that would
be necessary to implement different low-carbon
technologies at the scale assumed by EPRI.
These estimates are intended to outline general
trends and needs rather than forecast specifi c
0
500
1000
1500
2000
2500
3000
3500
1990 1995 2000 2005 2010 2015 2020 2025 2030
U.S
. El
ectric
Sec
tor
CO2 Em
issi
ons
(mill
ion
met
ric
tons
)
Technology EIA 2008 Reference TargetEfficiency Load Growth ~+1.05%/yr Load Growth ~+0.75%/yr Renewables 55 GWe by 2030 100 GWe by 2030Nuclear Generation 15 GWe by 2030 64 GWe by 2030
Advanced CoalGeneration
No Heat Rate Improvementfor Existing Plants
40% New Plant Efficiencyby 2020–2030
1-3% Heat Rate Improvementfor 130 GWe Existing Plants46% New Plant Efficiencyby 2020; 49% in 2030
CCS None Widely Deployed After 2020
PHEV None10% of New Light-Duty VehicleSales by 2017; 33% by 2030
Distributed Energy < 0.1% of Base Load in 2030 5% of Base Load in 2030
EPRI PRISM
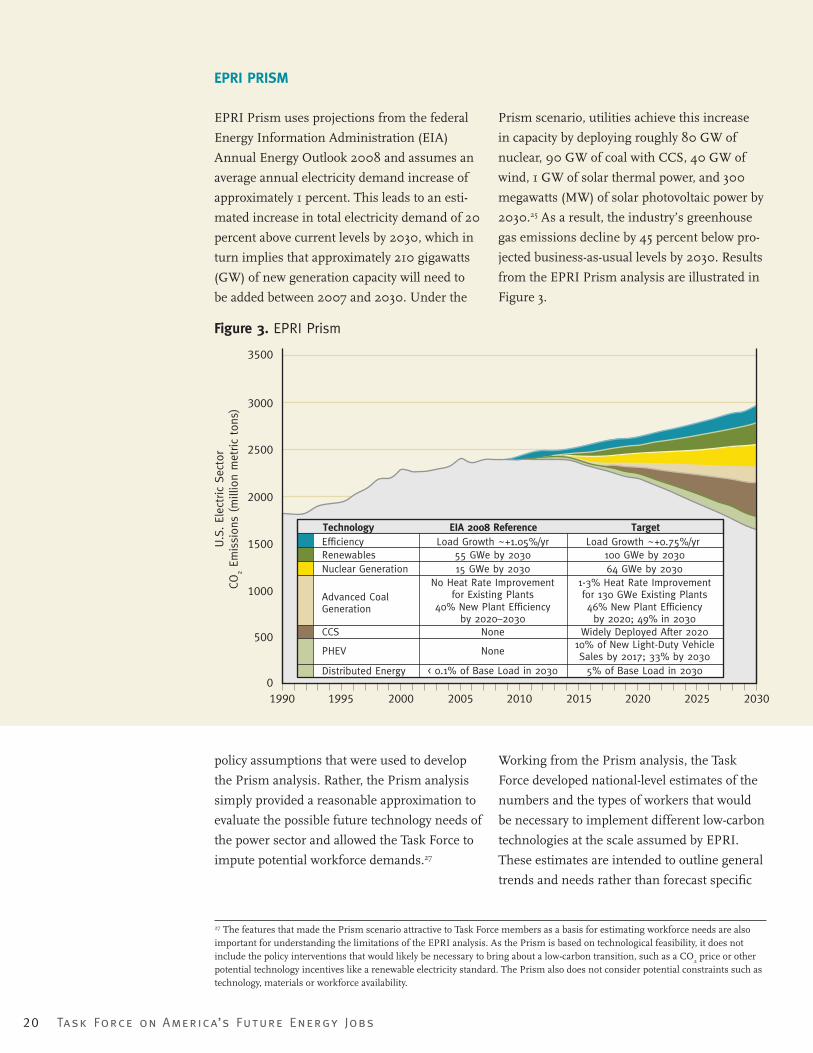
EPRI Prism uses projections from the federal
Energy Information Administration (EIA)
Annual Energy Outlook 2008 and assumes an
average annual electricity demand increase of
approximately 1 percent. This leads to an esti-
mated increase in total electricity demand of 20
percent above current levels by 2030, which in
turn implies that approximately 210 gigawatts
(GW) of new generation capacity will need to
be added between 2007 and 2030. Under the
Prism scenario, utilities achieve this increase
in capacity by deploying roughly 80 GW of
nuclear, 90 GW of coal with CCS, 40 GW of
wind, 1 GW of solar thermal power, and 300
megawatts (MW) of solar photovoltaic power by
2030.25 As a result, the industry’s greenhouse
gas emissions decline by 45 percent below pro-
jected business-as-usual levels by 2030. Results
from the EPRI Prism analysis are illustrated in
Figure 3.
Figure 3. EPRI Prism
55627_P001_104.indd 2055627_P001_104.indd 20 8/13/09 8:04 AM8/13/09 8:04 AM
Task Force on America’s Future Energy Jobs 21
AS THE U.S. CONGRESS
MOVES FORWARD WITH CLIMATE
POLICY, THE TASK FORCE
HOPES THAT THE ROUGH
ESTIMATES DEVELOPED FOR THIS
REPORT CAN BE HELPFUL IN
FUTURE EFFORTS BY FEDERAL
AGENCIES AND STATE AND
REGIONAL WORKFORCE BOARDS
TO DEVELOP MORE REFINED
WORKFORCE ESTIMATES.
needs by individual job type. The Task Force
was particularly interested in evaluating the
need for technically skilled workers. These
workers fell into three broad categories:
� Skilled craft electric power workers;
� Skilled craft construction workers; and
� Engineers.
Skilled craft electric power workers include those
individuals who work within the electric power
sector to operate and maintain generating as-
sets and supporting infrastructure. Skilled craft
construction workers, by contrast, are generally
hired by electric power companies to build gen-
erating assets and support infrastructure. Skilled
craft construction workers are not specifi c to
the energy industry. Rather, they are generally
employed in industrial construction and cross
over into heavy- and light-commercial construc-
tion. As considered by the Task Force, engineers
work in both O&M and design and construction
jobs. They perform the technical work associated
with designing generating assets and supporting
infrastructure and the technical work associated
with running energy systems.
The Task Force identifi ed and assessed poten-
tial workforce demands through 2030 across
the following categories:
� Design and construction of new generating assets;
� O&M of existing generating assets and trans-
mission lines (discussed in Chapter 1);
� O&M of new generating assets;
� Development and operation of the supporting
infrastructure; and
� Design, construction, and O&M of new
high-voltage transmission lines;
� Deployment and O&M of smart grid
technologies; and
� Design, construction, and O&M of CO2
pipelines;
� Deployment of energy effi ciency technologies
and measures.
To generate a rough estimate of the number of
workers needed in each category, the Task Force
drew upon the expertise of its members and
advisors. However, it is important to empha-
size that the Task Force does not believe these
estimates can or should take the place of state
and regional workforce assessments. Greater
geographic specifi city is needed to identify
focus areas for individual training programs or
education systems. As the U.S. Congress moves
forward with climate policy, the Task Force
hopes that the rough estimates developed for
this report can be helpful in future efforts by
federal agencies and state and regional work-
force boards to develop more refi ned workforce
estimates. (Appendix D further discusses the
Task Force’s approach for developing the work-
force estimates in this report and some areas
for additional refi nement.)
55627_P001_104.indd 2155627_P001_104.indd 21 8/13/09 8:04 AM8/13/09 8:04 AM
22 Task Force on America’s Future Energy Jobs
28 Idaho National Engineering and Environmental Laboratory and Bechtel Power Corporation. “U.S. Job Creation Due to Nuclear Power Resurgence in the United States: Volumes 1 and 2” (Prepared for the U.S. Department of Energy, Science, and Technology Under DOE Idaho Operations Offi ce Contract DE-AC07-99ID13727). November 2004. Available http://www.inl.gov/technicalpubli-cations/Documents/3772069.pdf. 29 BBC Research & Consulting (Prepared for Industrial Union Council, AFL-CIO; International Brotherhood of Boilermakers; Iron Ship Builders, Blacksmiths, Forgers, and Helpers; International Brotherhood of Electrical Workers; United Mine Workers of America; and American Coalition for Clean Coal Electricity). “Employment and Other Economic Benefi ts from Advanced Coal Electric Generation with Carbon Capture and Storage (Preliminary Results).” February 2009. Available http:// www.americaspower.org/content/download/1459/10428/fi le/BBC%20FINAL%20020709.pdf.
Design and Construction of New Generating Assets
To better understand the workforce implica-
tions of designing and constructing 210 GW
of new generation as implied by the EPRI
Prism scenario, NCEP commissioned a study
by Bechtel Power Corporation (Bechtel). As
detailed in Appendix A, experts at Bechtel
drew upon data from their project experience
(including actual and planned projects) and
from industry sources to estimate the workforce
needs associated with developing, designing,
procuring materials for, and constructing new
generating assets.
The Bechtel study focused solely on estimating
a range of direct jobs associated with con-
structing new generation infrastructure. First,
Bechtel staff developed 1-GW “building blocks”
for each of the different types of generation
assets being considered in various deployment
scenarios, including nuclear, conventional coal,
conventional coal with CCS, integrated gasifi ca-
tion combined cycle (IGCC), IGCC with CCS,
natural gas combined cycle, onshore wind, solar
thermal power, and solar photovoltaic (PV) power.
Bechtel staff then developed workforce estimates
for the design and construction of each 1-GW
building block of generation. This fi rst phase
resulted in a range of employment curves for
each of the different generation technologies.
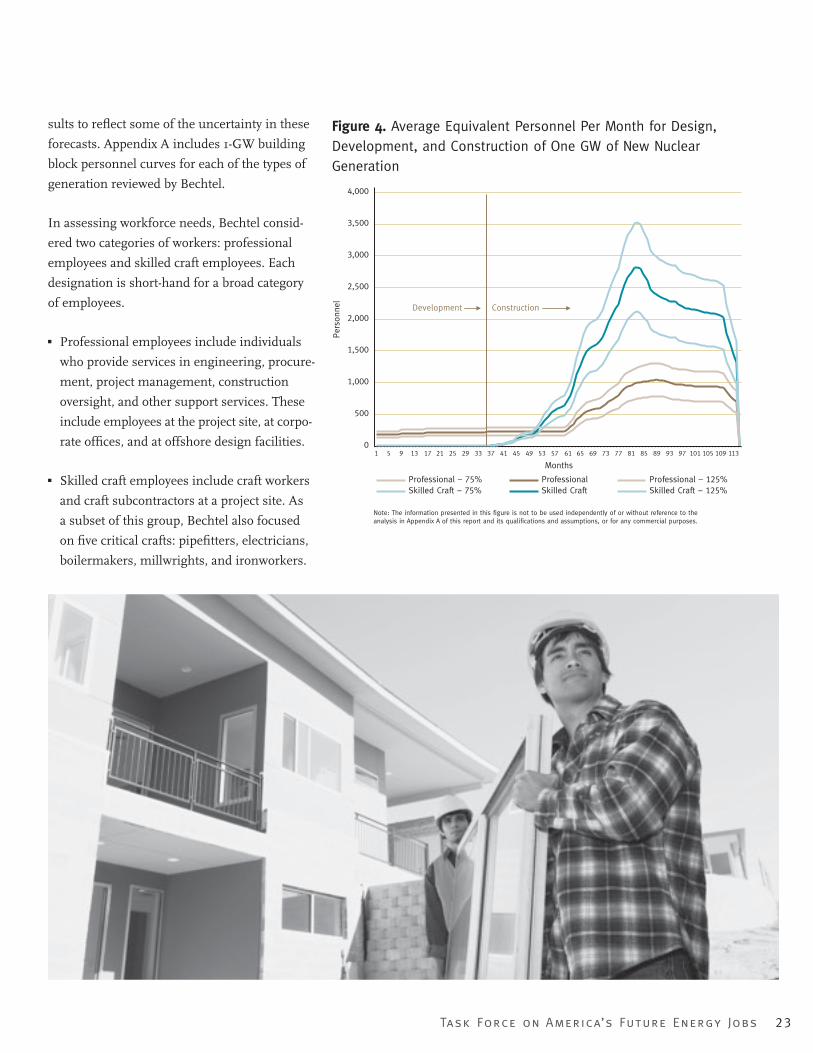
Figure 4 shows an example of estimated per-
sonnel requirements for the design, develop-
ment, and construction of 1 GW of new nuclear
generation. Bechtel’s estimates include a
confi dence interval of 25 percent around the re-
INDIRECT JOBS
This report estimates the number of direct jobs that will need to be fi lled to design, build, and maintain low-carbon
electric generation and associated infrastructure. The Task Force did not attempt to estimate manufacturing jobs at
facilities that supply the underlying technologies, such as wind turbine blades or nuclear plant components, nor did
the Task Force attempt to quantify downstream service jobs associated with demand-side management technologies
or customer-owned electric vehicles. However, the Task Force anticipates that a signifi cant number of these jobs,
often referred to as indirect and induced jobs, will be created in the transition to low-carbon energy systems.
Indirect and induced jobs are often estimated to be a multiple of the direct jobs. For example:
� A DOE report on the workforce implications of a resurgence in nuclear power estimated that about four indirect
and induced jobs would be created for every direct job in the nuclear industry and about fi ve indirect and induced
jobs would be created for every direct job in the broader electric industry.28
� A recent report on the economic benefi ts of advanced coal with CCS estimated that 4.8 indirect and induced jobs
would be created for every direct operations and maintenance job at a coal-fi red power plant with CCS.29
Some of the indirect or induced manufacturing jobs associated with expanded use of low-carbon technologies may
be outside the United States if these technologies end up being imported rather than being produced domestically.
55627_P001_104.indd 2255627_P001_104.indd 22 8/13/09 8:04 AM8/13/09 8:04 AM
Task Force on America’s Future Energy Jobs 23
sults to refl ect some of the uncertainty in these
forecasts. Appendix A includes 1-GW building
block personnel curves for each of the types of
generation reviewed by Bechtel.
In assessing workforce needs, Bechtel consid-
ered two categories of workers: professional
employees and skilled craft employees. Each
designation is short-hand for a broad category
of employees.
� Professional employees include individuals
who provide services in engineering, procure-
ment, project management, construction
oversight, and other support services. These
include employees at the project site, at corpo-
rate offi ces, and at offshore design facilities.
� Skilled craft employees include craft workers
and craft subcontractors at a project site. As
a subset of this group, Bechtel also focused
on fi ve critical crafts: pipefi tters, electricians,
boilermakers, millwrights, and ironworkers.
0
500
1,000
1,500
2,000
2,500
3,000
3,500
4,000
1 5 9 13 17 21 25 29 33 37 41 45 49 53 57 61 65 69 73 77 81 85 89 93 97 101 105 109 113
Development Construction
Months
Per
sonn
el
Professional – 75% Professional Professional – 125%Skilled Craft – 75% Skilled Craft Skilled Craft – 125%
Note: The information presented in this figure is not to be used independently of or without reference to the analysis in Appendix A of this report and its qualifications and assumptions, or for any commercial purposes.
Figure 4. Average Equivalent Personnel Per Month for Design, Development, and Construction of One GW of New Nuclear Generation
55627_P001_104.indd 2355627_P001_104.indd 23 8/13/09 8:04 AM8/13/09 8:04 AM
24 Task Force on America’s Future Energy Jobs
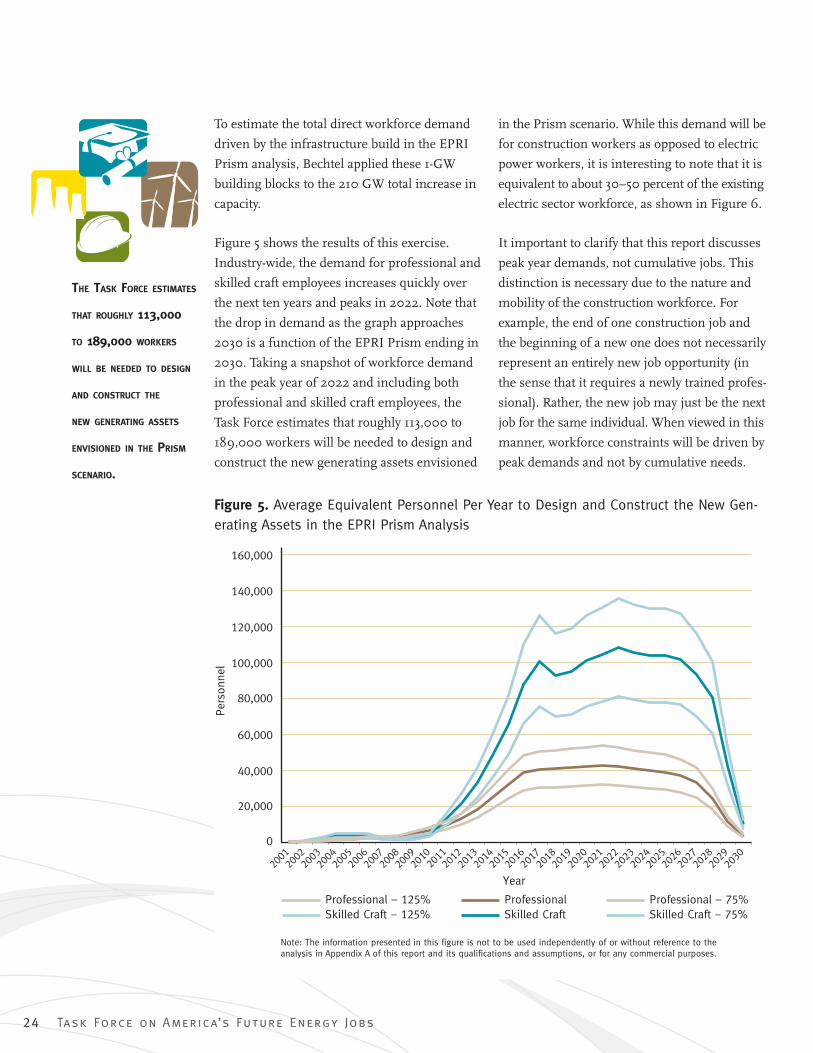
To estimate the total direct workforce demand
driven by the infrastructure build in the EPRI
Prism analysis, Bechtel applied these 1-GW
building blocks to the 210 GW total increase in
capacity.
Figure 5 shows the results of this exercise.
Industry-wide, the demand for professional and
skilled craft employees increases quickly over
the next ten years and peaks in 2022. Note that
the drop in demand as the graph approaches
2030 is a function of the EPRI Prism ending in
2030. Taking a snapshot of workforce demand
in the peak year of 2022 and including both
professional and skilled craft employees, the
Task Force estimates that roughly 113,000 to
189,000 workers will be needed to design and
construct the new generating assets envisioned
in the Prism scenario. While this demand will be
for construction workers as opposed to electric
power workers, it is interesting to note that it is
equivalent to about 30–50 percent of the existing
electric sector workforce, as shown in Figure 6.
It important to clarify that this report discusses
peak year demands, not cumulative jobs. This
distinction is necessary due to the nature and
mobility of the construction workforce. For
example, the end of one construction job and
the beginning of a new one does not necessarily
represent an entirely new job opportunity (in
the sense that it requires a newly trained profes-
sional). Rather, the new job may just be the next
job for the same individual. When viewed in this
manner, workforce constraints will be driven by
peak demands and not by cumulative needs.
Figure 5. Average Equivalent Personnel Per Year to Design and Construct the New Gen-erating Assets in the EPRI Prism Analysis
0
20,000
40,000
60,000
80,000
100,000
120,000
140,000
160,000
2001
2002
2003
2004
2005
2006
2007
2008
2009
2010
2011
2012
2013
2014
2015
2016
2017
2018
2019
2020
2021
2022
2023
2024
2025
2026
2027
2028
2029
2030
Year
Per
sonn
el
Note: The information presented in this figure is not to be used independently of or without reference to the analysis in Appendix A of this report and its qualifications and assumptions, or for any commercial purposes.
ProfessionalProfessional – 125% Professional – 75%Skilled Craft – 75%Skilled CraftSkilled Craft – 125%
THE TASK FORCE ESTIMATES
THAT ROUGHLY 113,000
TO 189,000 WORKERS
WILL BE NEEDED TO DESIGN
AND CONSTRUCT THE
NEW GENERATING ASSETS
ENVISIONED IN THE PRISM
SCENARIO.
55627_P001_104.indd 2455627_P001_104.indd 24 8/13/09 8:04 AM8/13/09 8:04 AM

Task Force on America’s Future Energy Jobs 25
Bechtel identifi ed fi ve “critical” craft categories
that comprise about sixty percent of skilled
labor necessary to deploy new low-carbon
generating capacity. These critical crafts include
pipefi tters, electricians, boilermakers, mill-
wrights, and ironworkers. The demand for
these job categories is identifi ed in Table 2.
Table 2. Estimated Peak Demand for Construction Skilled Crafts to Design and Construct New Generation in the EPRI Prism Analysis (Peak is in 2022)
Construction Skilled Craft
Range of Expected Demand
Critical Crafts 47,800 to 79,600
Electricians 16,900 to 28,100
Pipefi tters 16,800 to 28,000
Ironworkers 7,900 to 13,000
Boilermakers 5,200 to 8,700
Millwrights 1,500 to 2,500
Other Crafts 33,200 to 56,400
Total Skilled Construction Crafts
81,000 to 136,000
To evaluate the robustness of the Prism trajecto-
ries, the Task Force compared the Prism results
to results from two alternate EPRI technology
deployment scenarios that included economic
modeling. These alternate scenarios resulted in
different deployment rates of nuclear, coal with
CCS, and renewable technologies. Details of the
alternate scenarios are included in Appendices A
and B. One important insight from the alternate
scenarios is that the deployment path matters.
As the United States designs and constructs new
generation, the rate of deployment will drive
workforce needs. At slow but steady rates of
deployment, workforce needs are spread out over
time; at fast, compressed rates of deployment,
workforce demands build to a peak and drop off
quickly. Additionally, a scenario that relies on coal
with CCS may require a slightly different set of
workers than a scenario that relies on nuclear power.
0
100,000
200,000
300,000
400,000
500,000
Existing ElectricPower Sector
Workforce (2008)
PotentialFive-Year Demandfor Replacement
Workers
PotentialTen-Year Demandfor Replacement
Workers
Peak New GenerationDesign and
Construction WorkerDemand Under the
EPRI Prism Scenario (2022)
Figure 6. Comparison of the Workers Needed to Design and Construct the New Generating Assets in the EPRI Prism Analysis to Existing Employment Levels and Other Sources of Worker Demand
55627_P001_104.indd 2555627_P001_104.indd 25 8/13/09 8:04 AM8/13/09 8:04 AM
26 Task Force on America’s Future Energy Jobs
0
20,000
40,000
60,000
80,000
100,000
120,000
2010 2012 2014 2016 2018 2020 2022 2024 2026 2028 2030
Per
sonn
el
0
200
400
600
800
1000
Capa
city
(GW
)
Cumulative ProjectedAdditional O&M
Workforce Demand
Cumulative AdditionalGW Installed
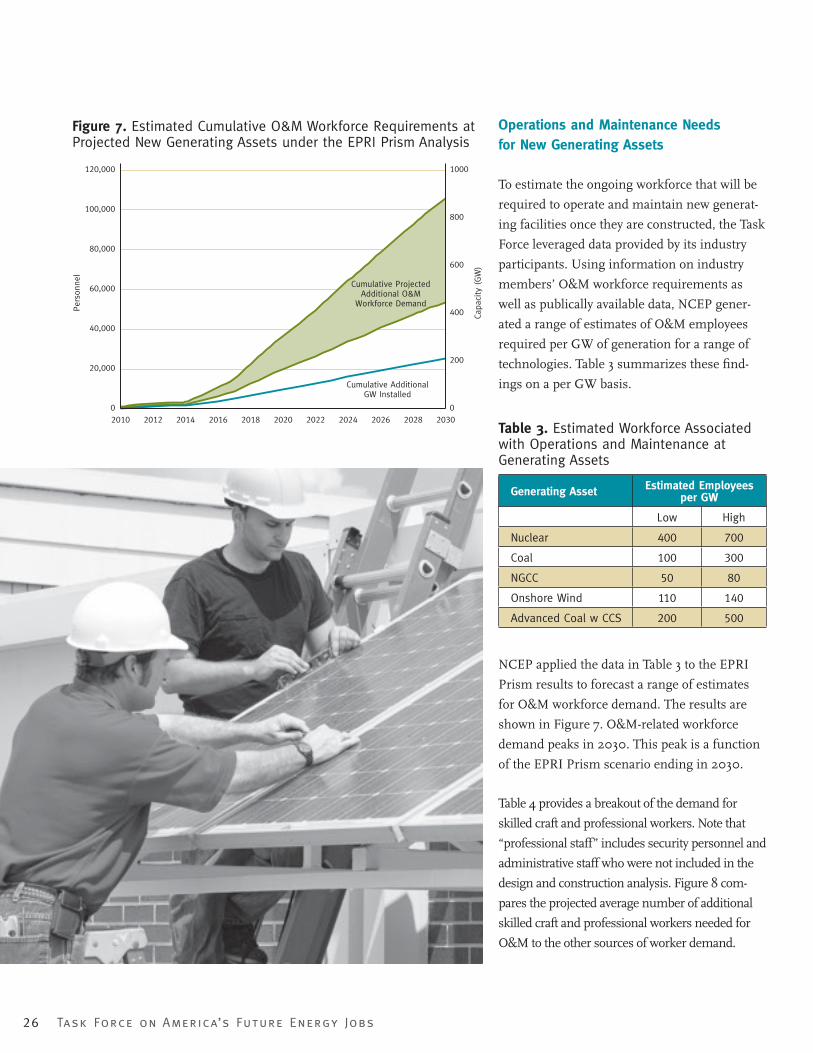
Figure 7. Estimated Cumulative O&M Workforce Requirements at Projected New Generating Assets under the EPRI Prism Analysis
Operations and Maintenance Needs for New Generating Assets
To estimate the ongoing workforce that will be
required to operate and maintain new generat-
ing facilities once they are constructed, the Task
Force leveraged data provided by its industry
participants. Using information on industry
members’ O&M workforce requirements as
well as publically available data, NCEP gener-
ated a range of estimates of O&M employees
required per GW of generation for a range of
technologies. Table 3 summarizes these fi nd-
ings on a per GW basis.
Table 3. Estimated Workforce Associated with Operations and Maintenance at Generating Assets
Generating Asset Estimated Employees per GW
Low High
Nuclear 400 700
Coal 100 300
NGCC 50 80
Onshore Wind 110 140
Advanced Coal w CCS 200 500
NCEP applied the data in Table 3 to the EPRI
Prism results to forecast a range of estimates
for O&M workforce demand. The results are
shown in Figure 7. O&M-related workforce
demand peaks in 2030. This peak is a function
of the EPRI Prism scenario ending in 2030.
Table 4 provides a breakout of the demand for
skilled craft and professional workers. Note that
“professional staff” includes security personnel and
administrative staff who were not included in the
design and construction analysis. Figure 8 com-
pares the projected average number of additional
skilled craft and professional workers needed for
O&M to the other sources of worker demand.
55627_P001_104.indd 2655627_P001_104.indd 26 8/13/09 8:04 AM8/13/09 8:04 AM

Task Force on America’s Future Energy Jobs 27
Table 4. Projected O&M Jobs in 2030 Given the Projected New Generation under the EPRI Prism Analysis
Job Category Range of Expected Demand
Skilled Electric Power Craft Workers
35,000 to 70,000
Professional Staff 18,500 to 35,000
Total 53,500 to 105,000
The growth in workforce O&M demand high-
lights the need for training solutions that ad-
dress long-term training needs. While expected
retirements create demand for training over the
next decade, the need to add new generating
assets will propel the demand to train electric
power workers into the following decade.
As with our estimates of workforce demand for
design and construction, these national-level es-
timates of O&M needs are highly approximate
and are not intended to substitute for the more
detailed state and regional assessments that will
be needed to identify specifi c training needs.
Workforce Needs for the Design, Construction, and O&M of Infrastructure and Supporting Technologies
In addition to hiring skilled workers to replace
retiring workers and to build and maintain
new generating assets, the electric power sector
will need skilled workers to design, build, and
maintain a host of infrastructure improvements
and supporting technologies.
Three of the most prominent areas of infra-
structure expansion are likely to include:
1. the construction of new high-voltage trans-
mission lines;
2. the deployment of smart grid technologies to
help customers use electricity more intelli-
gently, and;
3. pipelines to move captured CO2 from major
emissions sources to geologic sequestration
locations around the country.
Design, Construction, and O&M Workforce Needs for New High-Voltage Transmission Lines
The process of siting new high-voltage trans-
mission lines in the United States has become
very contentious. As a result, many projects
remain in the approval process phase for years
before they are approved for construction. Such
uncertainty makes it diffi cult for a company to
accurately project the commencement of con-
struction and the timing of hiring decisions.
0
100,000
200,000
300,000
400,000
500,000
Existing ElectricPower Sector
Workforce (2008)
PotentialFive-Year
Demand forReplacement
Workers
PotentialTen-Year
Demand forReplacement
Workers
Peak NewGeneration Designand ConstructionWorker Demand
Under the EPRI PrismScenario (2022)
New GenerationO&M Worker
Demand (2030)
Figure 8. Comparison of Peak O&M Worker Demand Associated with O&M at Projected New Generating Assets under the EPRI Prism Analysis to Existing Employment Levels and Other Sources of Worker Demand
55627_P001_104.indd 2755627_P001_104.indd 27 8/13/09 8:04 AM8/13/09 8:04 AM
28 Task Force on America’s Future Energy Jobs
30 Carol L. Berrigan, Director, Industry Infrastructure, Nuclear Energy Institute. “Testimony for the Record to the U.S. Senate Committee on Energy and Natural Resources.” November 6, 2007. Available http://energy.senate.gov/public/_fi les/CBerriganTes-timony110607.pdf. 31 NERC. “2008 Long-Term Reliability Assessment 2008-2017.” October 2008. Available http://www.nerc.com/fi les/LTRA2008.pdf. 32 Midwest Independent System Operator, et al. “Joint Coordinated System Plan 2008.” 2008. Available http://www.jcspstudy.org/. 33 U.S. Department of Energy Energy Effi ciency and Renewable Energy, “20% Wind Energy by 2030: Increasing Wind Energy’s Contribution to U.S. Electricity Supply.” July 2008. Available http://www1.eere.energy.gov/windandhydro/wind_2030.html 34 AEP. “Interstate Transmission Vision for Wind Integration.” June 2007. Available http://www.aep.com/about/i765project/docs/windtransmissionvisionwhitepaper.pdf.
OUTAGES
In addition to the O&M staff hired by power plants, workers, especially
skilled workers, will also be needed to perform maintenance on units
during scheduled outages. Nuclear plants, in particular, require skilled
craft workers to complement onboard electric power staff for this pur-
pose. Indeed, in some cases as many as 1,000 additional workers may
be needed over a four to eight week period, depending on the scope
of the work to be performed.30
The types of skills that are needed for an outage depends on the
scope of the work being conducted. The types of workers a utility
might supplement its full time staff with includes radiation protection
technicians, operator engineers, teamsters, non-manual supervisors,
pipefi tters, millwrights, laborers, electricians, boilermakers, carpenters,
insulators, and ironworkers.
As a result, career centers and training provid-
ers lack the information they need to develop
courses and direct students to the appropriate
training programs.
Despite these uncertainties, NCEP compared
a number of published estimates to assess the
miles of new transmission infrastructure that
will be needed to support the energy system of
the future.
� The North American Electric Reliability
Corporation (NERC) is the entity responsible
for ensuring the reliability of the bulk power
system in North America. NERC projects
that the total number of miles of high-voltage
transmission lines needed in the United
States will increase by 9.5 percent (15,700
circuit-miles) over the next ten years.31
� Several of the nation’s major power pool
operators, including the Midwest Indepen-
dent System Operator, the Southeast Electric
Reliability Council Reliability Region, PJM
Interconnection LLC, the Southwest Power
Pool, the Mid-Continent Area Power Pool, and
the Tennessee Valley Authority recently pro-
duced a Joint Coordinated Plan that examined
the additional transmission infrastructure
needed to integrate wind and other renewable
resources with the existing grid network and
electricity demand centers. The report esti-
mated that the eastern portion of the United
States alone would need:
� 10,000 miles of new high-voltage trans-
mission lines to achieve the goal of having
wind supply 5 percent of total electricity
needs by 2024, and
� 15,000 miles of new high voltage transmis-
sion lines to increase the wind contribution to
20 percent of total electricity supply by 2024.32
� A similar national-level study by DOE that
looked at increasing wind energy’s contribu-
tion to 20 percent of the overall U.S. elec-
tricity supply by 2030 concluded it would
be cost-effective to build more than 12,000
miles of additional high-voltage transmission
capacity. Much of this new capacity would be
required in later years after an initial period
during which new wind generation could use
the limited remaining capacity available on
the existing transmission grid.33
� American Electric Power (AEP) has produced
a conceptual transmission plan that includes
19,000 miles of new 765-kilovolt (kV) line
to integrate wind as 20 percent of the overall
electricity supply.34
55627_P001_104.indd 2855627_P001_104.indd 28 8/13/09 8:04 AM8/13/09 8:04 AM
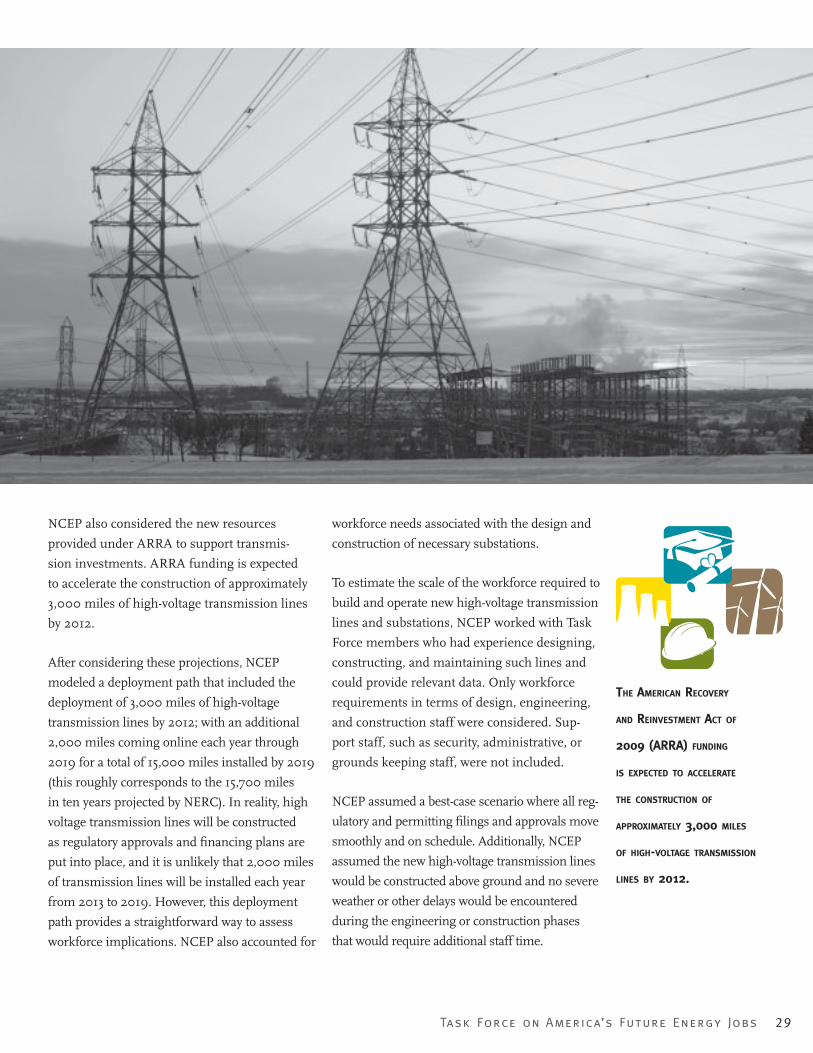
Task Force on America’s Future Energy Jobs 29
THE AMERICAN RECOVERY
AND REINVESTMENT ACT OF
2009 (ARRA) FUNDING
IS EXPECTED TO ACCELERATE
THE CONSTRUCTION OF
APPROXIMATELY 3,000 MILES
OF HIGH-VOLTAGE TRANSMISSION
LINES BY 2012.
NCEP also considered the new resources
provided under ARRA to support transmis-
sion investments. ARRA funding is expected
to accelerate the construction of approximately
3,000 miles of high-voltage transmission lines
by 2012.
After considering these projections, NCEP
modeled a deployment path that included the
deployment of 3,000 miles of high-voltage
transmission lines by 2012; with an additional
2,000 miles coming online each year through
2019 for a total of 15,000 miles installed by 2019
(this roughly corresponds to the 15,700 miles
in ten years projected by NERC). In reality, high
voltage transmission lines will be constructed
as regulatory approvals and fi nancing plans are
put into place, and it is unlikely that 2,000 miles
of transmission lines will be installed each year
from 2013 to 2019. However, this deployment
path provides a straightforward way to assess
workforce implications. NCEP also accounted for
workforce needs associated with the design and
construction of necessary substations.
To estimate the scale of the workforce required to
build and operate new high-voltage transmission
lines and substations, NCEP worked with Task
Force members who had experience designing,
constructing, and maintaining such lines and
could provide relevant data. Only workforce
requirements in terms of design, engineering,
and construction staff were considered. Sup-
port staff, such as security, administrative, or
grounds keeping staff, were not included.
NCEP assumed a best-case scenario where all reg-
ulatory and permitting fi lings and approvals move
smoothly and on schedule. Additionally, NCEP
assumed the new high-voltage transmission lines
would be constructed above ground and no severe
weather or other delays would be encountered
during the engineering or construction phases
that would require additional staff time.
55627_P001_104.indd 2955627_P001_104.indd 29 8/13/09 8:04 AM8/13/09 8:04 AM
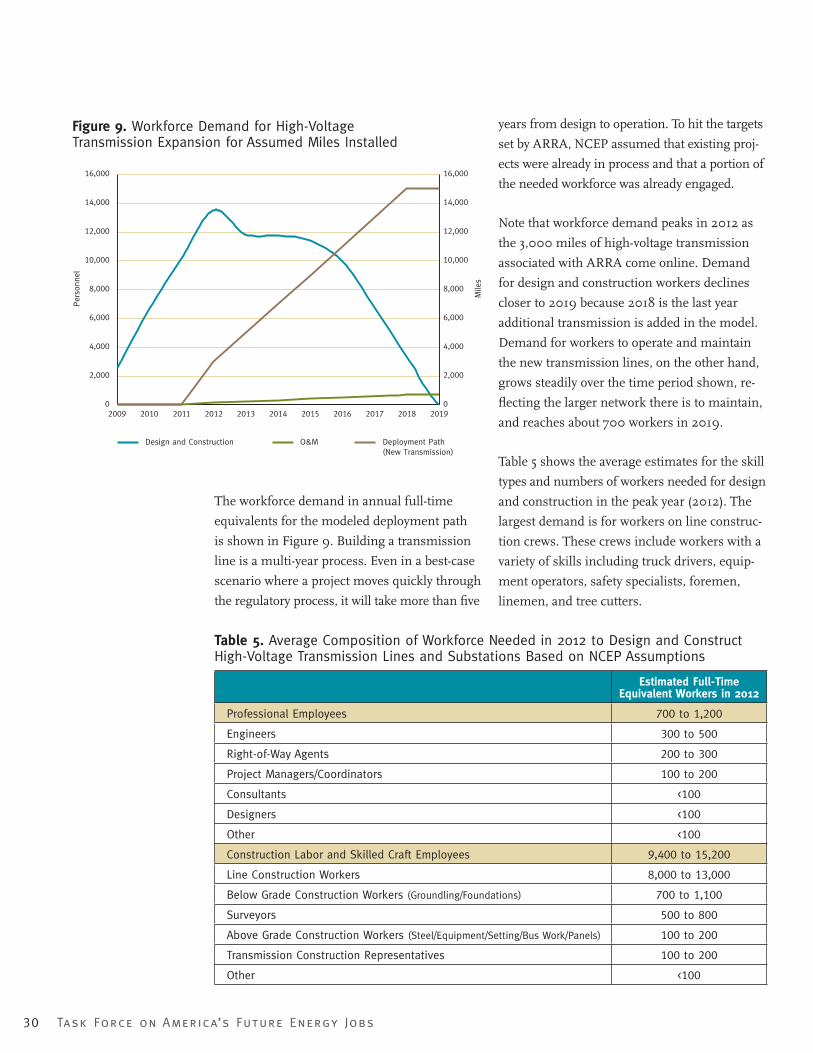
30 Task Force on America’s Future Energy Jobs
0
2,000
4,000
6,000
8,000
10,000
12,000
14,000
16,000
2009 2010 2011 2012 2013 2014 2015 2016 2017 2018 2019
Per
sonn
el
0
2,000
4,000
6,000
8,000
10,000
12,000
14,000
16,000
Mile
s
Design and Construction O&M Deployment Path(New Transmission)
Figure 9. Workforce Demand for High-Voltage Transmission Expansion for Assumed Miles Installed
The workforce demand in annual full-time
equivalents for the modeled deployment path
is shown in Figure 9. Building a transmission
line is a multi-year process. Even in a best-case
scenario where a project moves quickly through
the regulatory process, it will take more than fi ve
years from design to operation. To hit the targets
set by ARRA, NCEP assumed that existing proj-
ects were already in process and that a portion of
the needed workforce was already engaged.
Note that workforce demand peaks in 2012 as
the 3,000 miles of high-voltage transmission
associated with ARRA come online. Demand
for design and construction workers declines
closer to 2019 because 2018 is the last year
additional transmission is added in the model.
Demand for workers to operate and maintain
the new transmission lines, on the other hand,
grows steadily over the time period shown, re-
fl ecting the larger network there is to maintain,
and reaches about 700 workers in 2019.
Table 5 shows the average estimates for the skill
types and numbers of workers needed for design
and construction in the peak year (2012). The
largest demand is for workers on line construc-
tion crews. These crews include workers with a
variety of skills including truck drivers, equip-
ment operators, safety specialists, foremen,
linemen, and tree cutters.
Table 5. Average Composition of Workforce Needed in 2012 to Design and Construct High-Voltage Transmission Lines and Substations Based on NCEP Assumptions
Estimated Full-Time Equivalent Workers in 2012
Professional Employees 700 to 1,200
Engineers 300 to 500
Right-of-Way Agents 200 to 300
Project Managers/Coordinators 100 to 200
Consultants <100
Designers <100
Other <100
Construction Labor and Skilled Craft Employees 9,400 to 15,200
Line Construction Workers 8,000 to 13,000
Below Grade Construction Workers (Groundling/Foundations) 700 to 1,100
Surveyors 500 to 800
Above Grade Construction Workers (Steel/Equipment/Setting/Bus Work/Panels) 100 to 200
Transmission Construction Representatives 100 to 200
Other <100
55627_P001_104.indd 3055627_P001_104.indd 30 8/13/09 8:04 AM8/13/09 8:04 AM
Task Force on America’s Future Energy Jobs 31
55627_P001_104.indd 3155627_P001_104.indd 31 8/13/09 8:04 AM8/13/09 8:04 AM
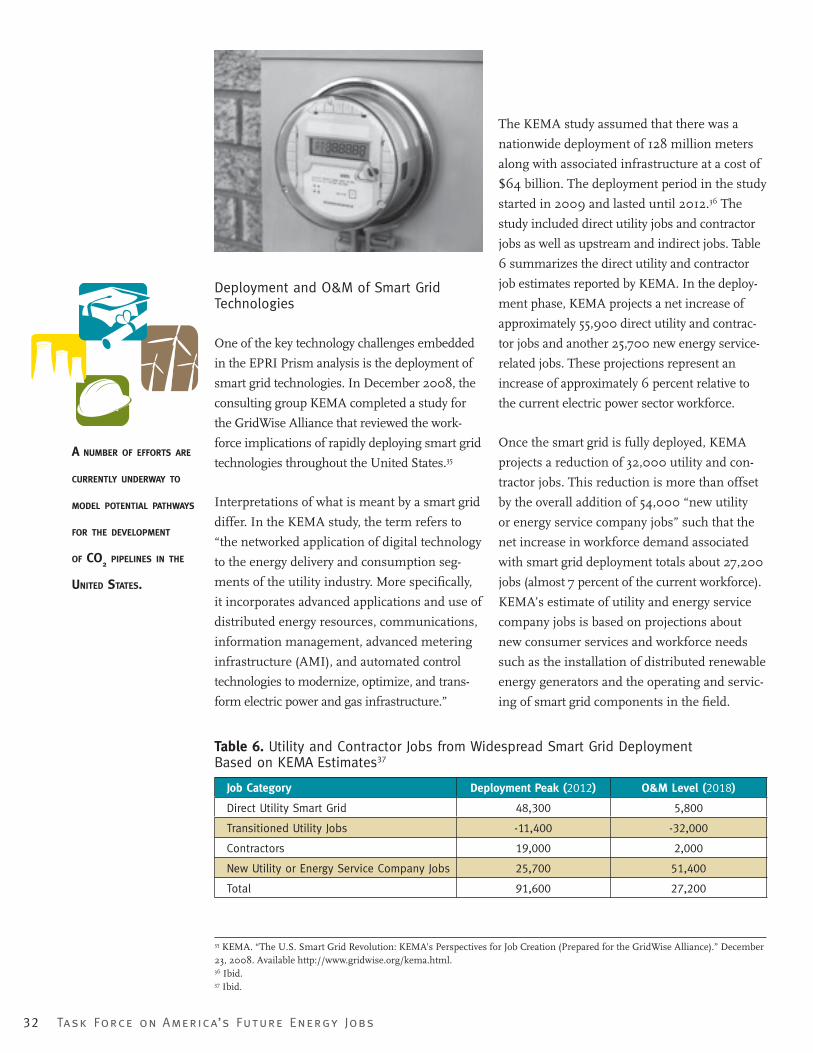
32 Task Force on America’s Future Energy Jobs
35 KEMA. “The U.S. Smart Grid Revolution: KEMA’s Perspectives for Job Creation (Prepared for the GridWise Alliance).” December 23, 2008. Available http://www.gridwise.org/kema.html.36 Ibid.37 Ibid.
Deployment and O&M of Smart Grid Technologies
One of the key technology challenges embedded
in the EPRI Prism analysis is the deployment of
smart grid technologies. In December 2008, the
consulting group KEMA completed a study for
the GridWise Alliance that reviewed the work-
force implications of rapidly deploying smart grid
technologies throughout the United States.35
Interpretations of what is meant by a smart grid
differ. In the KEMA study, the term refers to
“the networked application of digital technology
to the energy delivery and consumption seg-
ments of the utility industry. More specifi cally,
it incorporates advanced applications and use of
distributed energy resources, communications,
information management, advanced metering
infrastructure (AMI), and automated control
technologies to modernize, optimize, and trans-
form electric power and gas infrastructure.”
Table 6. Utility and Contractor Jobs from Widespread Smart Grid Deployment Based on KEMA Estimates37
Job Category Deployment Peak (2012) O&M Level (2018)
Direct Utility Smart Grid 48,300 5,800
Transitioned Utility Jobs -11,400 -32,000
Contractors 19,000 2,000
New Utility or Energy Service Company Jobs 25,700 51,400
Total 91,600 27,200
The KEMA study assumed that there was a
nationwide deployment of 128 million meters
along with associated infrastructure at a cost of
$64 billion. The deployment period in the study
started in 2009 and lasted until 2012.36 The
study included direct utility jobs and contractor
jobs as well as upstream and indirect jobs. Table
6 summarizes the direct utility and contractor
job estimates reported by KEMA. In the deploy-
ment phase, KEMA projects a net increase of
approximately 55,900 direct utility and contrac-
tor jobs and another 25,700 new energy service-
related jobs. These projections represent an
increase of approximately 6 percent relative to
the current electric power sector workforce.
Once the smart grid is fully deployed, KEMA
projects a reduction of 32,000 utility and con-
tractor jobs. This reduction is more than offset
by the overall addition of 54,000 “new utility
or energy service company jobs” such that the
net increase in workforce demand associated
with smart grid deployment totals about 27,200
jobs (almost 7 percent of the current workforce).
KEMA’s estimate of utility and energy service
company jobs is based on projections about
new consumer services and workforce needs
such as the installation of distributed renewable
energy generators and the operating and servic-
ing of smart grid components in the fi eld.
A NUMBER OF EFFORTS ARE
CURRENTLY UNDERWAY TO
MODEL POTENTIAL PATHWAYS
FOR THE DEVELOPMENT
OF CO2 PIPELINES IN THE
UNITED STATES.
55627_P001_104.indd 3255627_P001_104.indd 32 8/13/09 8:04 AM8/13/09 8:04 AM

Task Force on America’s Future Energy Jobs 33
38 Dooley, JJ, R.T. Dahowski, C.L. Davidson. “Comparing Existing Pipeline Networks with the Potential Scale of Future U.S. CO2
Pipeline Networks.” (Presented at the 9th Greenhouse Gas Technologies Conference, Washington, D.C.). November 16-20, 2008. Available http://www.sciencedirect.com/science?_ob=MImg&_imagekey=B984K-4W0SFYG-7D-1&_cdi=59073&_user=10&_orig=search&_coverDate=02%2F28%2F2009&_sk=999989998&view=c&wchp=dGLzVtb-zSkWz&md5=94d879be99ab31340ce9ffbce7eb8a64&ie=/sdarticle.pdf. 39 WRI. “CCS Guidelines: Guidelines for Carbon Dioxide Capture, Transport, and Storage.” October 2008. Available http://pdf.wri.org/ccs_guidelines.pdf. 40 Dooley, JJ, R.T. Dahowski, C.L. Davidson. “Comparing Existing Pipeline Networks with the Potential Scale of Future U.S. CO
2
Pipeline Networks.” (Presented at the 9th Greenhouse Gas Technologies Conference, Washington, D.C.). November 16-20, 2008. Available http://www.sciencedirect.com/science?_ob=MImg&_imagekey=B984K-4W0SFYG-7D-1&_cdi=59073&_user=10&_orig=search&_coverDate=02%2F28%2F2009&_sk=999989998&view=c&wchp=dGLzVtb-zSkWz&md5=94d879be99ab31340ce9ffbce7eb8a64&ie=/sdarticle.pdf.
Design and Construction of CO2 Pipelines
Under the EPRI Prism scenario, U.S. utilities
deploy 90 GW of advanced coal-fi red power
plants with CCS by 2030. As modeled by EPRI,
the plants start to come online in 2015, with
the majority—about 75 GW—constructed be-
tween 2020 and 2030. To support these plants,
developers will have to construct CO2 pipelines
to transport captured CO2 to secure geologic
storage formations.
A number of efforts are currently underway
to model potential pathways for the develop-
ment of CO2 pipelines in the United States. In
one effort, researchers at the Pacifi c Northwest
National Laboratory (PNNL) developed two
scenarios for national CCS pipeline develop-
ment based on different targets for stabiliz-
ing atmospheric concentrations of CO2.38 The
two scenarios are summarized in Table 7. The
pipeline miles shown in Table 7 are in addition
to the 3,900 miles of CO2 pipelines currently in
operation in the United States.39
Table 7. CO2 Pipeline Deployment Scenarios40
450 ppm Stabilization Target
550 ppm Stabilization Target
Average annual number of power plants adopting CCS
~dozen per year through 2030
1-3 per year through 2030
Average growth in CO
2 pipelines 2010-2030
<900 miles per year
~300 miles per year
Additional CO2 pipelines
in operation in 2030 ~18,000 miles ~6,000 miles
Using PNNL’s assumption that the average power
plant is approximately 50 miles from a storage
location and Bechtel’s assumption from the
construction estimates that advanced coal-fi red
power plants have an average capacity of 600
MW, NCEP estimates that the CCS deployment
55627_P001_104.indd 3355627_P001_104.indd 33 8/13/09 8:04 AM8/13/09 8:04 AM
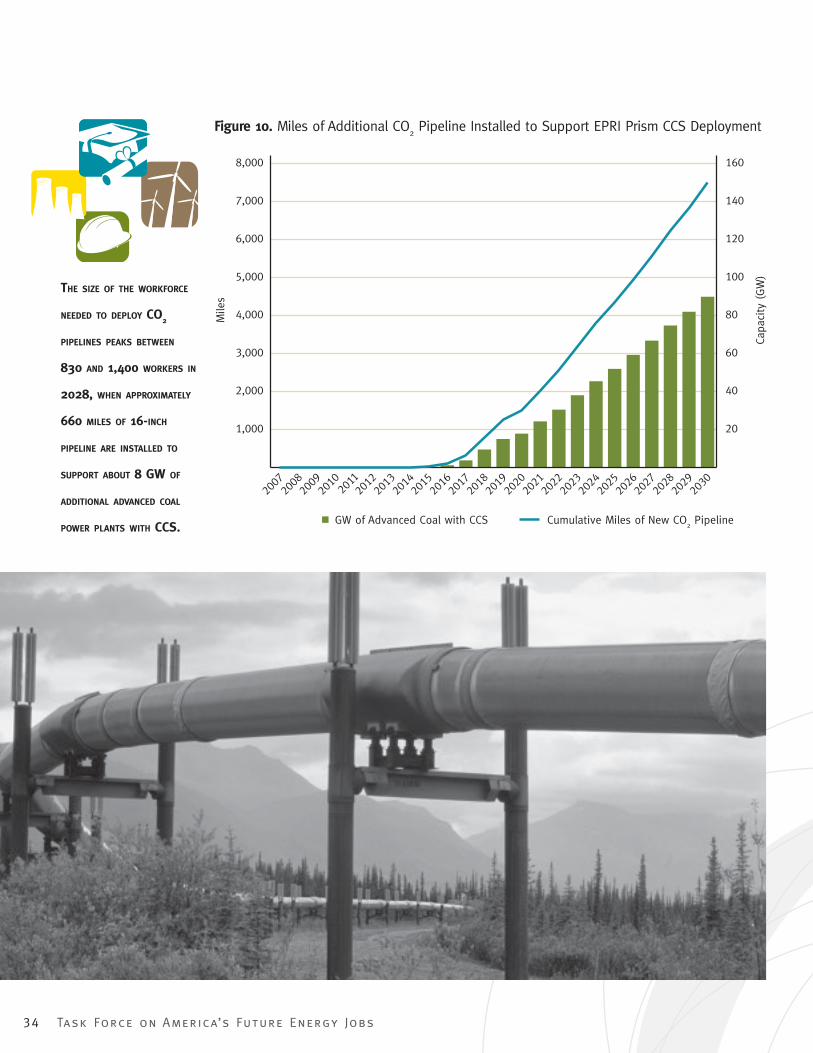
34 Task Force on America’s Future Energy Jobs
THE SIZE OF THE WORKFORCE
NEEDED TO DEPLOY CO2
PIPELINES PEAKS BETWEEN
830 AND 1,400 WORKERS IN
2028, WHEN APPROXIMATELY
660 MILES OF 16-INCH
PIPELINE ARE INSTALLED TO
SUPPORT ABOUT 8 GW OF
ADDITIONAL ADVANCED COAL
POWER PLANTS WITH CCS.
1,000
2,000
3,000
4,000
5,000
6,000
7,000
8,000
2007
2008
2009
2010
2011
2012
2013
2014
2015
2016
2017
2018
2019
2020
2021
2022
2023
2024
2025
2026
2027
2028
2029
2030
Mile
s
20
40
60
80
100
120
140
160
Capa
city
(GW
)
GW of Advanced Coal with CCS Cumulative Miles of New CO2 Pipeline
Figure 10. Miles of Additional CO2 Pipeline Installed to Support EPRI Prism CCS Deployment
55627_P001_104.indd 3455627_P001_104.indd 34 8/13/09 8:04 AM8/13/09 8:04 AM

Task Force on America’s Future Energy Jobs 35
41 90 GW of capacity divided by 600 MW plants times 50 miles of pipeline per plant equals 7,500 miles of pipeline.
scenario in the EPRI Prism will require approxi-
mately 7,500 miles of additional CO2 pipelines—
an estimate that is closer to PNNL’s 550 part
per million (ppm) stabilization target scenario.41
Figure 10 shows the modeled deployment path.
Task Force members provided NCEP with
estimates of the number of workers needed to
design and construct a CO2 pipeline in the
United States, assuming a pipeline diameter of
16 inches. Using those estimates, NCEP devel-
oped the worker demand curves shown in Figure
11. The variability in the curves refl ects the an-
nual deployment path of advanced coal with CCS
in the EPRI Prism. The pipelines associated with
each power plant are assumed to be constructed
in the year the plant comes online. As in the gen-
eration design and construction estimates, the
range of estimates for pipeline workers refl ects a
25 percent margin of accuracy.
200
400
600
800
1,000
1,200
1,400
1,600
2007 2012 2017 2022 2027
Per
sonn
el
1,000
2,000
3,000
4,000
5,000
6,000
7,000
8,000M
iles
Estimated Annual Worker Need
Cumulative Miles ofNew CO
2 Pipeline
Figure 11. Estimated Workforce to Design and Construct CO2 Pipelines to Support EPRI
Prism CCS Deployment
55627_P001_104.indd 3555627_P001_104.indd 35 8/13/09 8:04 AM8/13/09 8:04 AM
36 Task Force on America’s Future Energy Jobs
42 Information Insights, Inc. “Stranded Gas Development Act: Municipal Impact Analysis for the application by BP Exploration (Alaska) Inc., ConocoPhillips Alaska, Inc., and ExxonMobil Alaska Production, Inc.” (Prepared for the Alaska Department of Revenue Municipal Advisory Group.) November 2004. Available http://www.magalaska.com/pdf/Municipal_Impact_Analysis-Producers_Application-corrected.pdf. 43 49 CFR § 195.412.44 EPRI. “Assessment of Achievable Potential from Energy Effi ciency and Demand Response Programs in the U.S.” January 2009. Available http://my.epri.com/portal/server.pt?Abstract_id=000000000001016987.
The size of the workforce needed to deploy CO2
pipelines peaks between 830 and 1,400 work-
ers in 2028, when approximately 660 miles
of 16-inch pipeline are installed to support
about 8 GW of additional advanced coal power
plants with CCS. A number of different skilled
craft workers are needed to complete pipeline
construction. Table 8 shows an approximate
breakout of the types of skills required.
Table 8. Craft Skills Associated with Pipeline Construction42
Job Category Percentage
Operators 30%
Welders/Helpers 25%
Laborers 20%
Vehicle Drivers (Teamsters) 10%
Inspectors 5%
Surveyors <5%
Salaried Foreman <5%
Testing Technicians <5%
Given the varying lengths of pipeline expected to
be installed, it is diffi cult to estimate the number
of workers who will be employed to operate and
maintain the pipelines. Regulatory requirements
associated with pipeline safety include the
development and regular review of an operations
manual with an emergency response plan.
Current requirements also specify that “each
operator shall, at intervals not exceeding three
weeks, but at least 26 times each calendar year,
inspect the surface conditions on or adjacent to
each pipeline right-of-way.”43
Deployment of Energy Effi ciency Technologies and Measures
Energy effi ciency technologies and measures
are an essential strategy for reducing the cost of
greenhouse gas abatement and are included as
part of the Prism scenario. The workforce de-
mands associated with large-scale deployment
of energy effi ciency technologies, however, are
diffi cult to quantify.
In January 2009, Global Energy Partners and
The Brattle Group completed a report for EPRI
that assessed “the achievable potential for en-
ergy effi ciency and demand response programs
to reduce the growth rate in electricity con-
sumption and peak demand through 2030.”44
While the report was not explicitly designed to
estimate the energy effi ciency potential repre-
sented in the EPRI Prism analysis, the range
of reductions it estimates and the deployment
schedule it assumes are broadly consistent with
the Prism. Hence, the NCEP Task Force looked
at the energy effi ciency component of the
Global Energy Partners and The Brattle Group
55627_P001_104.indd 3655627_P001_104.indd 36 8/13/09 8:04 AM8/13/09 8:04 AM
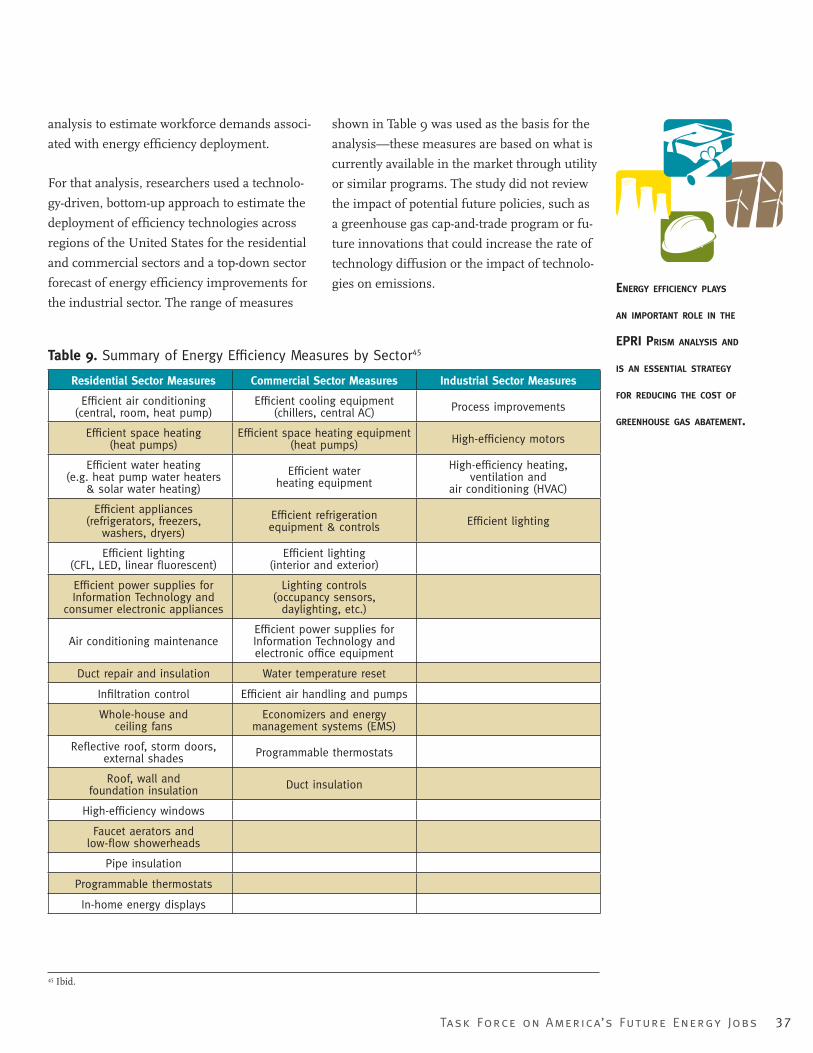
Task Force on America’s Future Energy Jobs 37
45 Ibid.
analysis to estimate workforce demands associ-
ated with energy effi ciency deployment.
For that analysis, researchers used a technolo-
gy-driven, bottom-up approach to estimate the
deployment of effi ciency technologies across
regions of the United States for the residential
and commercial sectors and a top-down sector
forecast of energy effi ciency improvements for
the industrial sector. The range of measures
shown in Table 9 was used as the basis for the
analysis—these measures are based on what is
currently available in the market through utility
or similar programs. The study did not review
the impact of potential future policies, such as
a greenhouse gas cap-and-trade program or fu-
ture innovations that could increase the rate of
technology diffusion or the impact of technolo-
gies on emissions.
Table 9. Summary of Energy Effi ciency Measures by Sector45
Residential Sector Measures Commercial Sector Measures Industrial Sector Measures
Effi cient air conditioning (central, room, heat pump)
Effi cient cooling equipment (chillers, central AC) Process improvements
Effi cient space heating (heat pumps)
Effi cient space heating equipment (heat pumps) High-effi ciency motors
Effi cient water heating (e.g. heat pump water heaters
& solar water heating)
Effi cient water heating equipment
High-effi ciency heating, ventilation and
air conditioning (HVAC)
Effi cient appliances (refrigerators, freezers,
washers, dryers)
Effi cient refrigeration equipment & controls Effi cient lighting
Effi cient lighting (CFL, LED, linear fl uorescent)
Effi cient lighting (interior and exterior)
Effi cient power supplies for Information Technology and
consumer electronic appliances
Lighting controls (occupancy sensors,
daylighting, etc.)
Air conditioning maintenanceEffi cient power supplies for Information Technology and electronic offi ce equipment
Duct repair and insulation Water temperature reset
Infi ltration control Effi cient air handling and pumps
Whole-house and ceiling fans
Economizers and energy management systems (EMS)
Refl ective roof, storm doors, external shades Programmable thermostats
Roof, wall and foundation insulation Duct insulation
High-effi ciency windows
Faucet aerators and low-fl ow showerheads
Pipe insulation
Programmable thermostats
In-home energy displays
ENERGY EFFICIENCY PLAYS
AN IMPORTANT ROLE IN THE
EPRI PRISM ANALYSIS AND
IS AN ESSENTIAL STRATEGY
FOR REDUCING THE COST OF
GREENHOUSE GAS ABATEMENT.
55627_P001_104.indd 3755627_P001_104.indd 37 8/13/09 8:04 AM8/13/09 8:04 AM
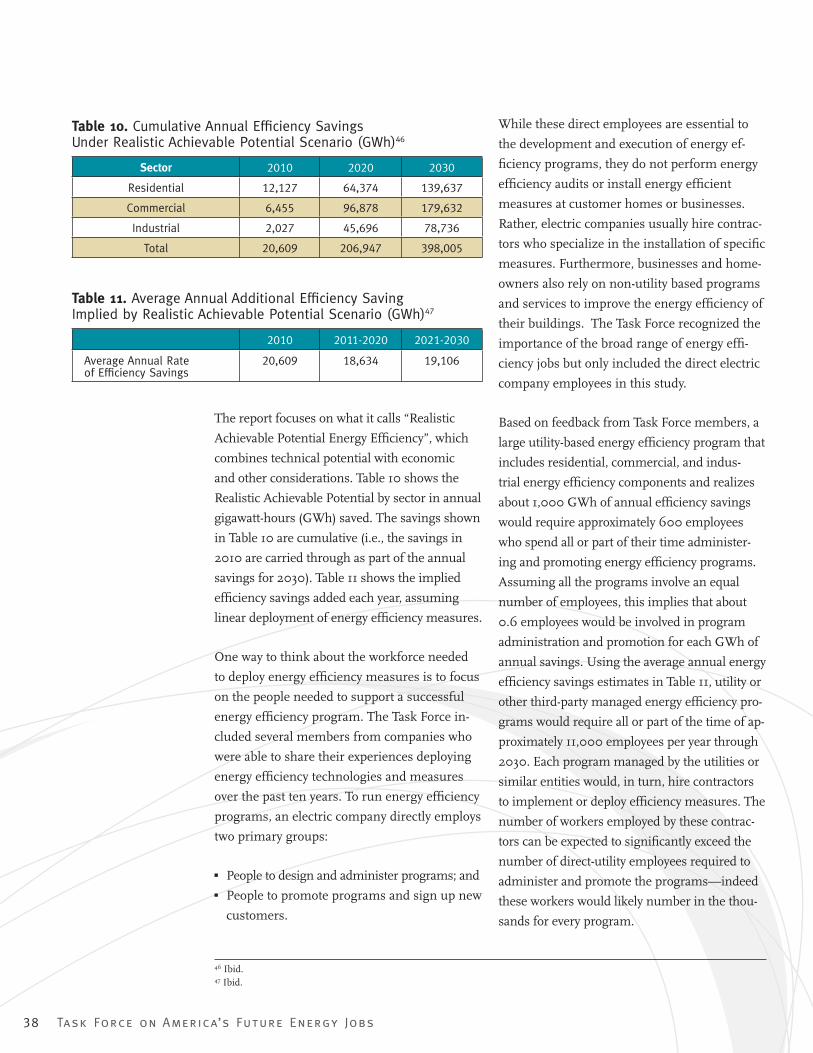
38 Task Force on America’s Future Energy Jobs
46 Ibid.47 Ibid.
Table 10. Cumulative Annual Effi ciency Savings Under Realistic Achievable Potential Scenario (GWh)46
Sector 2010 2020 2030
Residential 12,127 64,374 139,637
Commercial 6,455 96,878 179,632
Industrial 2,027 45,696 78,736
Total 20,609 206,947 398,005
Table 11. Average Annual Additional Effi ciency Saving Implied by Realistic Achievable Potential Scenario (GWh)47
2010 2011-2020 2021-2030
Average Annual Rate of Effi ciency Savings
20,609 18,634 19,106
The report focuses on what it calls “Realistic
Achievable Potential Energy Effi ciency”, which
combines technical potential with economic
and other considerations. Table 10 shows the
Realistic Achievable Potential by sector in annual
gigawatt-hours (GWh) saved. The savings shown
in Table 10 are cumulative (i.e., the savings in
2010 are carried through as part of the annual
savings for 2030). Table 11 shows the implied
effi ciency savings added each year, assuming
linear deployment of energy effi ciency measures.
One way to think about the workforce needed
to deploy energy effi ciency measures is to focus
on the people needed to support a successful
energy effi ciency program. The Task Force in-
cluded several members from companies who
were able to share their experiences deploying
energy effi ciency technologies and measures
over the past ten years. To run energy effi ciency
programs, an electric company directly employs
two primary groups:
� People to design and administer programs; and
� People to promote programs and sign up new
customers.
While these direct employees are essential to
the development and execution of energy ef-
fi ciency programs, they do not perform energy
effi ciency audits or install energy effi cient
measures at customer homes or businesses.
Rather, electric companies usually hire contrac-
tors who specialize in the installation of specifi c
measures. Furthermore, businesses and home-
owners also rely on non-utility based programs
and services to improve the energy effi ciency of
their buildings. The Task Force recognized the
importance of the broad range of energy effi -
ciency jobs but only included the direct electric
company employees in this study.
Based on feedback from Task Force members, a
large utility-based energy effi ciency program that
includes residential, commercial, and indus-
trial energy effi ciency components and realizes
about 1,000 GWh of annual effi ciency savings
would require approximately 600 employees
who spend all or part of their time administer-
ing and promoting energy effi ciency programs.
Assuming all the programs involve an equal
number of employees, this implies that about
0.6 employees would be involved in program
administration and promotion for each GWh of
annual savings. Using the average annual energy
effi ciency savings estimates in Table 11, utility or
other third-party managed energy effi ciency pro-
grams would require all or part of the time of ap-
proximately 11,000 employees per year through
2030. Each program managed by the utilities or
similar entities would, in turn, hire contractors
to implement or deploy effi ciency measures. The
number of workers employed by these contrac-
tors can be expected to signifi cantly exceed the
number of direct-utility employees required to
administer and promote the programs—indeed
these workers would likely number in the thou-
sands for every program.
55627_P001_104.indd 3855627_P001_104.indd 38 8/13/09 8:04 AM8/13/09 8:04 AM
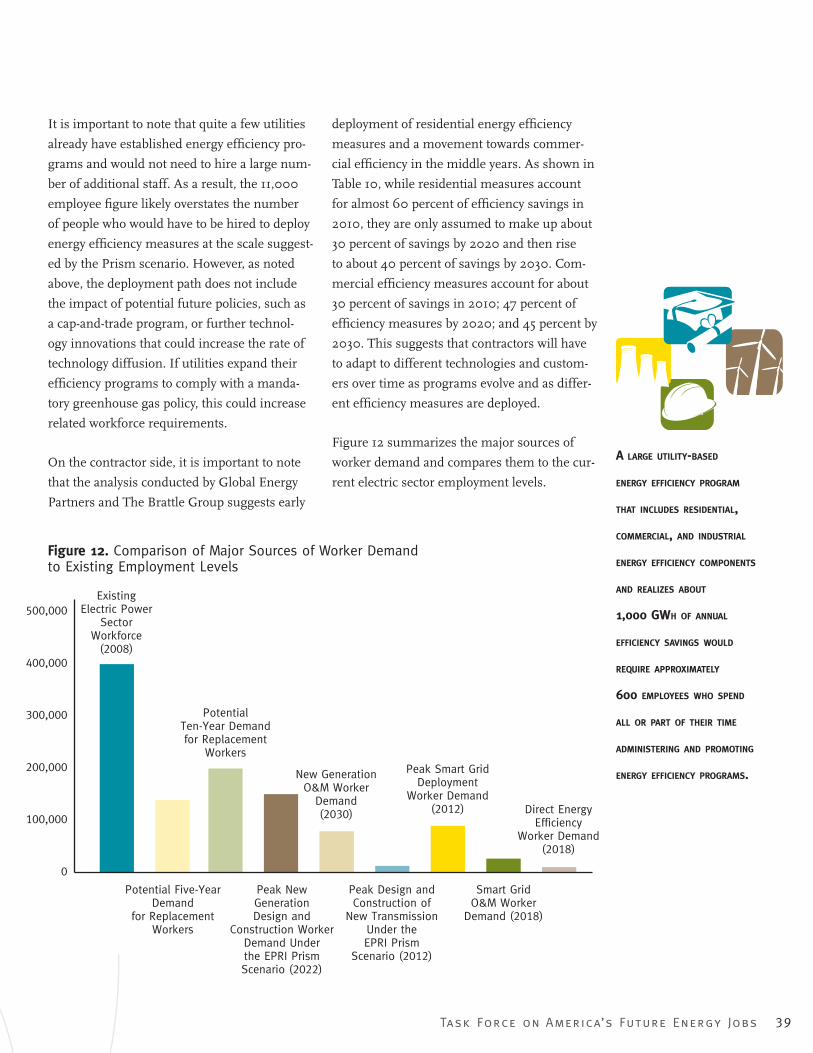
Task Force on America’s Future Energy Jobs 39
It is important to note that quite a few utilities
already have established energy effi ciency pro-
grams and would not need to hire a large num-
ber of additional staff. As a result, the 11,000
employee fi gure likely overstates the number
of people who would have to be hired to deploy
energy effi ciency measures at the scale suggest-
ed by the Prism scenario. However, as noted
above, the deployment path does not include
the impact of potential future policies, such as
a cap-and-trade program, or further technol-
ogy innovations that could increase the rate of
technology diffusion. If utilities expand their
effi ciency programs to comply with a manda-
tory greenhouse gas policy, this could increase
related workforce requirements.
On the contractor side, it is important to note
that the analysis conducted by Global Energy
Partners and The Brattle Group suggests early
deployment of residential energy effi ciency
measures and a movement towards commer-
cial effi ciency in the middle years. As shown in
Table 10, while residential measures account
for almost 60 percent of effi ciency savings in
2010, they are only assumed to make up about
30 percent of savings by 2020 and then rise
to about 40 percent of savings by 2030. Com-
mercial effi ciency measures account for about
30 percent of savings in 2010; 47 percent of
effi ciency measures by 2020; and 45 percent by
2030. This suggests that contractors will have
to adapt to different technologies and custom-
ers over time as programs evolve and as differ-
ent effi ciency measures are deployed.
Figure 12 summarizes the major sources of
worker demand and compares them to the cur-
rent electric sector employment levels.
A LARGE UTILITY-BASED
ENERGY EFFICIENCY PROGRAM
THAT INCLUDES RESIDENTIAL,
COMMERCIAL, AND INDUSTRIAL
ENERGY EFFICIENCY COMPONENTS
AND REALIZES ABOUT
1,000 GWH OF ANNUAL
EFFICIENCY SAVINGS WOULD
REQUIRE APPROXIMATELY
600 EMPLOYEES WHO SPEND
ALL OR PART OF THEIR TIME
ADMINISTERING AND PROMOTING
ENERGY EFFICIENCY PROGRAMS.
0
100,000
200,000
300,000
400,000
500,000Existing
Electric PowerSector
Workforce(2008)
Potential Five-YearDemand
for ReplacementWorkers
PotentialTen-Year Demandfor Replacement
Workers
Peak NewGenerationDesign and
Construction WorkerDemand Underthe EPRI PrismScenario (2022)
Peak Smart GridDeployment
Worker Demand(2012)
Smart GridO&M Worker
Demand (2018)
Direct EnergyEfficiency
Worker Demand(2018)
Peak Design andConstruction of
New TransmissionUnder theEPRI Prism
Scenario (2012)
New GenerationO&M Worker
Demand(2030)
Figure 12. Comparison of Major Sources of Worker Demand to Existing Employment Levels
55627_P001_104.indd 3955627_P001_104.indd 39 8/13/09 8:04 AM8/13/09 8:04 AM
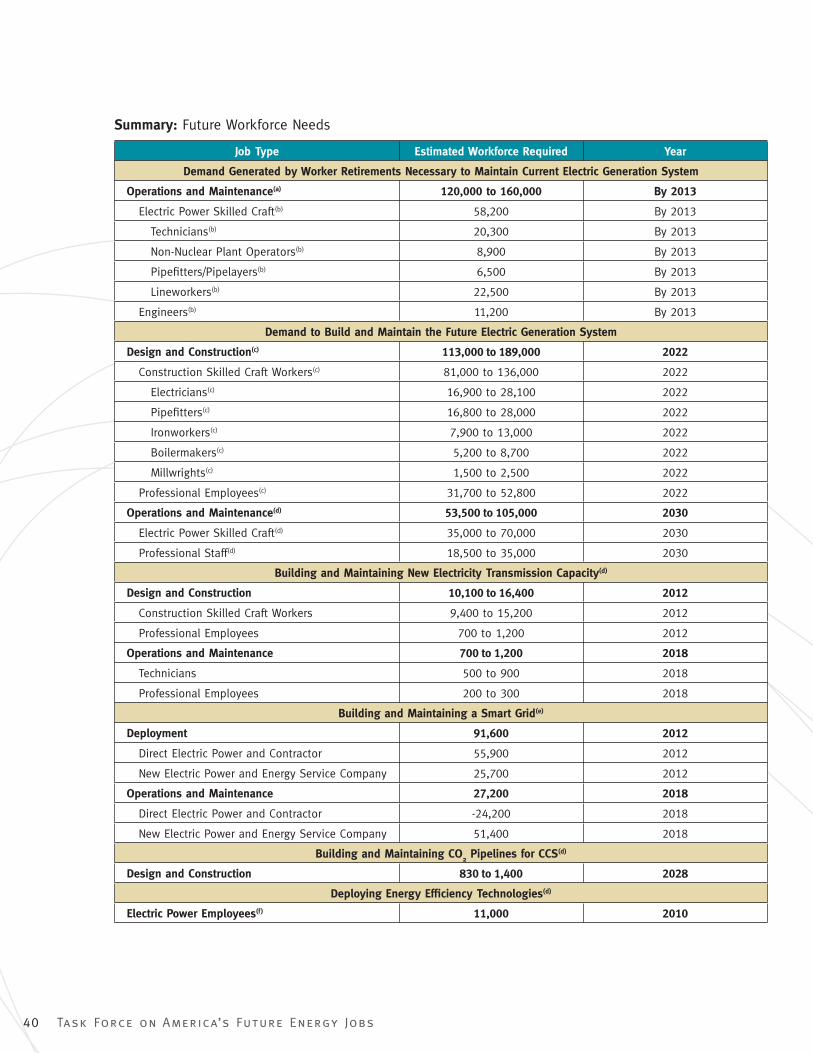
40 Task Force on America’s Future Energy Jobs
Summary: Future Workforce Needs
Job Type Estimated Workforce Required Year
Demand Generated by Worker Retirements Necessary to Maintain Current Electric Generation System
Operations and Maintenance(a) 120,000 to 160,000 By 2013
Electric Power Skilled Craft(b) 58,200 By 2013
Technicians(b) 20,300 By 2013
Non-Nuclear Plant Operators(b) 8,900 By 2013
Pipefi tters/Pipelayers(b) 6,500 By 2013
Lineworkers(b) 22,500 By 2013
Engineers(b) 11,200 By 2013
Demand to Build and Maintain the Future Electric Generation System
Design and Construction(c) 113,000 to 189,000 2022
Construction Skilled Craft Workers(c) 81,000 to 136,000 2022
Electricians(c) 16,900 to 28,100 2022
Pipefi tters(c) 16,800 to 28,000 2022
Ironworkers(c) 7,900 to 13,000 2022
Boilermakers(c) 5,200 to 8,700 2022
Millwrights(c) 1,500 to 2,500 2022
Professional Employees(c) 31,700 to 52,800 2022
Operations and Maintenance(d) 53,500 to 105,000 2030
Electric Power Skilled Craft(d) 35,000 to 70,000 2030
Professional Staff(d) 18,500 to 35,000 2030
Building and Maintaining New Electricity Transmission Capacity(d)
Design and Construction 10,100 to 16,400 2012
Construction Skilled Craft Workers 9,400 to 15,200 2012
Professional Employees 700 to 1,200 2012
Operations and Maintenance 700 to 1,200 2018
Technicians 500 to 900 2018
Professional Employees 200 to 300 2018
Building and Maintaining a Smart Grid(e)
Deployment 91,600 2012
Direct Electric Power and Contractor 55,900 2012
New Electric Power and Energy Service Company 25,700 2012
Operations and Maintenance 27,200 2018
Direct Electric Power and Contractor -24,200 2018
New Electric Power and Energy Service Company 51,400 2018
Building and Maintaining CO2 Pipelines for CCS(d)
Design and Construction 830 to 1,400 2028
Deploying Energy Effi ciency Technologies(d)
Electric Power Employees(f) 11,000 2010
55627_P001_104.indd 4055627_P001_104.indd 40 8/13/09 8:04 AM8/13/09 8:04 AM
Task Force on America’s Future Energy Jobs 41
Table Notes
The workforce estimates are based on pub-
lished sources, on projections developed by
Bechtel for the Task Force, or estimated by Task
Force staff. Except for the projected workforce
to replace those retiring, the estimates are
based on the peak number of jobs expected in
one year between now and 2030. The year listed
is the year of the projected peak. In the case of
projected retirements, the estimate represents
the total number of positions that will need
to be fi lled between now and 2013 based on
surveys developed by CEWD. All numbers are
rounded. The Task Force developed these esti-
mates as a way to understand the magnitude
of future workforce demand; these estimates
should not take the place of state and regional
workforce assessments.
(a) Based on estimates by BLS and CEWD.
U.S. Department of Labor, Bureau of
Labor Statistics. “Career Guide to Indus-
tries, 2008-09 Edition, Utilities.” Avail-
able http://www.bls.gov/oco/cg/cgs018.
htm. Accessed May 14, 2009.
CEWD. “Gaps in the Energy Workforce
Pipeline: 2008 CEWD Survey Results.”
2008. Available http://www.cewd.org/
documents/CEWD_08Results.pdf.
Accessed May 20, 2009. This estimate
includes all workers expected to retire
in the next fi ve years, including but not
limited to those listed below.
(b) Based on surveys conducted by CEWD
(as above).
(c) Based on estimates developed by Bechtel
for the Task Force. See Appendix A.
(d) Based on estimates developed by NCEP in
consultation with Task Force participants.
(e) Based on a report prepared by KEMA for
the GridWise Alliance.
KEMA, “The U.S. Smart Grid Revolution
KEMA’s Perspectives for Job Creation,
Prepared for the GridWise Alliance”, De-
cember 23, 2008. Available http://www.
gridwise.org/kema.html.
(f) This number includes employees who
spend all or part of their time adminis-
tering or promoting utility-run energy
effi ciency programs. It does not include
estimates for additional programs that
could be run by third parties, employees
or contractors necessary to implement
energy effi ciency programs.
55627_P001_104.indd 4155627_P001_104.indd 41 8/13/09 8:04 AM8/13/09 8:04 AM
42 Task Force on America’s Future Energy Jobs
C H A P T E R 3 .
TRAINING THE FUTURE ENERGY WORKFORCE
As described in Chapters 1 and 2, there will be sig-
nifi cant demand for technically-trained individuals to
work in the electric power sector and to design and
build the generating assets and infrastructure as-
sociated with a low-carbon economy. As discussed
in Chapter 2, the Task Force focused on technically-
trained individuals in three broad categories:
• Skilled craft electric power workers,
• Skilled craft construction workers, and
• Engineers.
55627_P001_104.indd 4255627_P001_104.indd 42 8/13/09 8:04 AM8/13/09 8:04 AM

Task Force on America’s Future Energy Jobs 43
DEMAND FOR SKILLED CRAFT
CONSTRUCTION WORKERS IS
GOING TO BE DRIVEN BY THE
EXPANSION OF THE ELECTRIC
POWER SECTOR OVER THE NEXT
20 YEARS TO MEET GROWING
DEMAND FOR ELECTRICITY WHILE
SIMULTANEOUSLY REDUCING THE
CARBON FOOTPRINT OF THE
ELECTRIC SECTOR.
48 See, e.g., the National Academy of Sciences’ “Rising Above the Gathering Storm: Energizing and Employing America for a Brighter Economic Future,” the New Commission on the Skills of the American Workforce’s “Tough Choices or Tough Times,” the Department of Energy’s “Workforce Trends In The Electric Utility Industry: A Report To The United States Congress Pursuant To Section 1101 Of The Energy Policy Act Of 2005,” and APPA’s “Growing Your Employees of Tomorrow: A Work Force Planning Model For Public Power Utilities.” Badhul Chowdhury. “Power Education at the Crossroads.” IEEE Spectrum, October 2000.
As highlighted in Chapters 1 and 2, demand for
skilled craft electric power workers is going to
be driven, at least in the near term, mainly by
retirements as well as some attrition for other
reasons. Over the longer term, demand for
electric sector workers will remain high as new
generation comes on line and as electric power
companies hire staff to operate and maintain
new facilities. In addition, skilled craft electric
power workers will be needed to perform fi eld
work associated with energy-system support
infrastructure, including maintaining the smart
grid, and to provide other services, such as
installing energy effi ciency measures.
Demand for skilled craft construction workers
is going to be driven by the expansion of the elec-
tric power sector over the next 20 years to meet
growing demand for electricity while simulta-
neously reducing the carbon footprint of the
electric sector. In addition, skilled craft construc-
tion workers will be needed to install electricity
transmission lines and CO2 pipelines.
Demand for engineers will cut across both
the electric power and construction sectors.
As highlighted in Chapters 1 and 2, employee
losses due to retirement and attrition will in-
crease the demand for new engineers over the
next fi ve to ten years. Longer term—that is, over
the next twenty years—the need to design and
construct low-carbon energy sources and associ-
ated infrastructure will become a major driver
of workforce needs in this area.
Overview of the Current Workforce Pipeline
Task Force members are concerned that the
existing pipeline for skilled craft electric power
workers, skilled craft construction workers, and
engineers is unprepared to meet the challenges
of the next two decades as the United States
seeks to transition to a low-carbon economy.
Several reports in recent years have examined
the nature and causes of this decline in qualifi ed
potential workers.48
55627_P001_104.indd 4355627_P001_104.indd 43 8/13/09 8:04 AM8/13/09 8:04 AM
44 Task Force on America’s Future Energy Jobs
K–12 EDUCATION IS
ESSENTIAL. STUDENTS WHO
ARE LOST BEFORE THEY
COMPLETE HIGH SCHOOL OR
THE EQUIVALENT FREQUENTLY
DO NOT HAVE THE SKILLS
THEY NEED TO ENTER THE
SKILLED CRAFT OR ENGINEER
WORKFORCE.
49 U.S. Department of Energy. “Workforce Trends In The Electric Utility Industry: A Report To The United States Congress Pursu-ant To Section 1101 Of The Energy Policy Act Of 2005.” August 2006. Available http://www.oe.energy.gov/DocumentsandMedia/Workforce_Trends_Report _090706_FINAL.pdf. 50 Ibid.
One of the challenges of assessing the work-
force pipeline is that there are multiple entry
and exit points. An effort to visualize the pipe-
line is presented in Figure 13. For example, an
individual could leave high school or a career
and technical school and move directly into an
apprenticeship program or a company-spon-
sored training program and then to the work-
force. Or, before entering an apprenticeship,
an individual could enter a pre-apprenticeship
program developed in coordination with labor
organizations at a community college. Alter-
nately, an individual could earn an associates
degree after high school before entering a four-
year college to earn a degree that provides them
with the training they need to directly enter the
workforce. While not shown in the fi gure, indi-
viduals could enter the future energy workforce
from the military or as part of a second career.
These individuals could enter the training
system at any point or could take advantage of
military-to-workforce transition programs, like
Helmets to Hardhats, which are discussed later
in this chapter.
Two key insights emerge from this graphic rep-
resentation. First, K–12 education is essential.
Students who do not complete high school or
the equivalent frequently do not have the skills
they need to enter the skilled craft or engineer
workforce. Second, there are multiple pathways
into the workforce. People can move from K–12
education to any one of a number of post-sec-
ondary education and training options includ-
ing community colleges, community-based
organizations, universities, pre-apprenticeship
programs, or other training programs. Indi-
viduals can also enter the military or embark on
a non-electric power career and then enter the
workforce through retraining programs. Addi-
tionally, there can be movement back and forth
between the workforce and post-secondary edu-
cation as workers get additional training and
education to further their career or move into a
different line of work. This diversity of path-
ways has the advantage of improving access, but
it can also make it diffi cult for career advisors to
guide individuals and for potential employers to
assess the capabilities of job applicants.
Within the Task Force, discussion focused on
the robustness of the post-secondary education
pipeline for skilled craft workers in the electric
power sector. The number of people trained to
take part in the skilled craft electric power work-
force has fl uctuated over the years as the needs
of the industry, macroeconomic conditions,
the attractiveness of alternate career paths,
and other factors have changed. After a period
of relatively rapid growth in the 1970s, when
electricity demand grew by 5 percent annually,
the electric industry faced much lower growth
rates in the 1980s and 1990s.49 As some states
created a competitive marketplace for the
electric sector, companies increased their focus
on productivity, which dampened hiring trends
and led to an overall decline in workforce levels
through the end of the 1990s.50 As the indus-
try’s demand for new workers slowed during
this period, training programs were scaled back,
and the pool of qualifi ed candidates for jobs and
training programs decreased dramatically.
At the same time, U.S. education policy became
increasingly focused on access to higher educa-
tion as the key to career success. Specifi cally,
access to and completion of a four-year college
degree has become a major goal of national
55627_P001_104.indd 4455627_P001_104.indd 44 8/13/09 8:04 AM8/13/09 8:04 AM
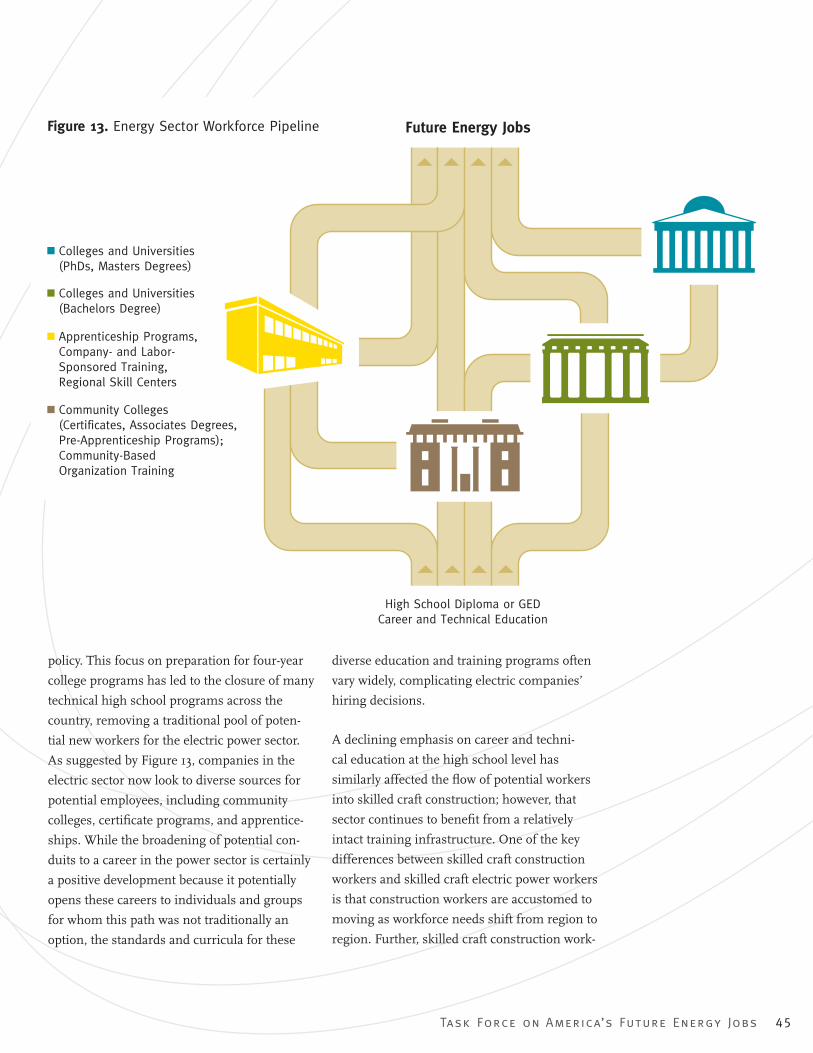
Task Force on America’s Future Energy Jobs 45
policy. This focus on preparation for four-year
college programs has led to the closure of many
technical high school programs across the
country, removing a traditional pool of poten-
tial new workers for the electric power sector.
As suggested by Figure 13, companies in the
electric sector now look to diverse sources for
potential employees, including community
colleges, certifi cate programs, and apprentice-
ships. While the broadening of potential con-
duits to a career in the power sector is certainly
a positive development because it potentially
opens these careers to individuals and groups
for whom this path was not traditionally an
option, the standards and curricula for these
diverse education and training programs often
vary widely, complicating electric companies’
hiring decisions.
A declining emphasis on career and techni-
cal education at the high school level has
similarly affected the fl ow of potential workers
into skilled craft construction; however, that
sector continues to benefi t from a relatively
intact training infrastructure. One of the key
differences between skilled craft construction
workers and skilled craft electric power workers
is that construction workers are accustomed to
moving as workforce needs shift from region to
region. Further, skilled craft construction work-
Figure 13. Energy Sector Workforce Pipeline Future Energy Jobs
High School Diploma or GEDCareer and Technical Education
Colleges and Universities(PhDs, Masters Degrees)
Colleges and Universities(Bachelors Degree)
Apprenticeship Programs,Company- and Labor-Sponsored Training, Regional Skill Centers
Community Colleges(Certificates, Associates Degrees,Pre-Apprenticeship Programs);Community-BasedOrganization Training
55627_P001_104.indd 4555627_P001_104.indd 45 8/13/09 8:04 AM8/13/09 8:04 AM
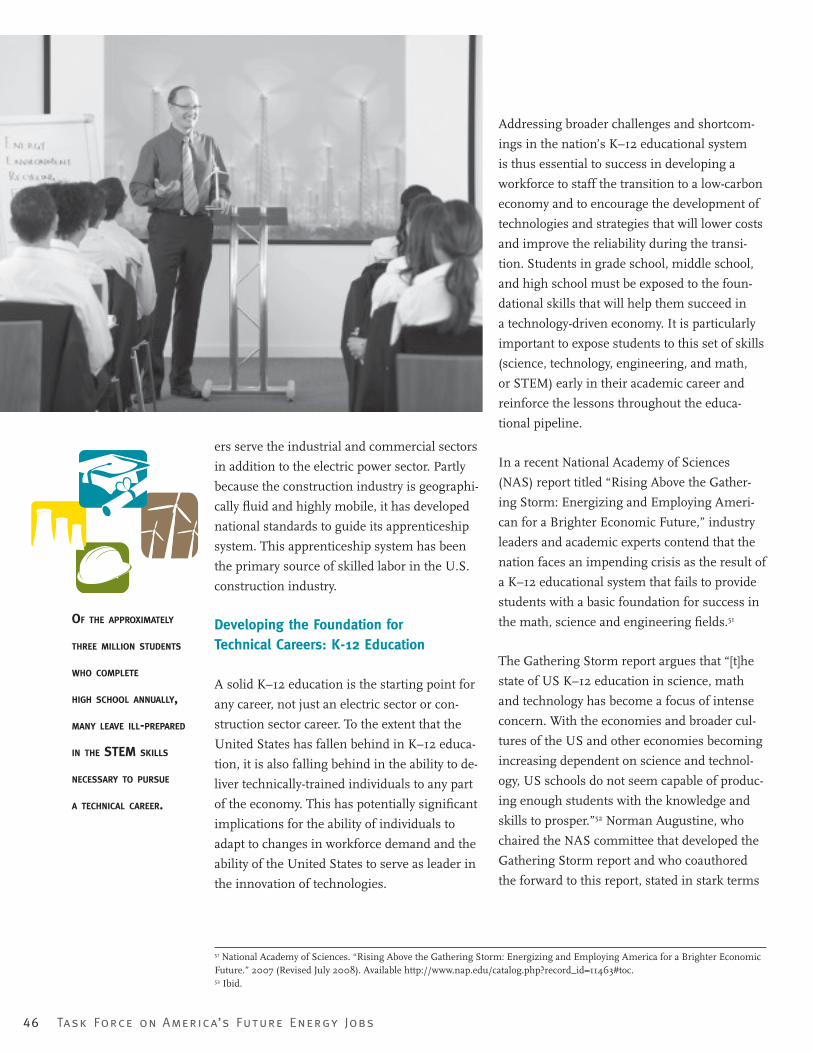
46 Task Force on America’s Future Energy Jobs
OF THE APPROXIMATELY
THREE MILLION STUDENTS
WHO COMPLETE
HIGH SCHOOL ANNUALLY,
MANY LEAVE ILL-PREPARED
IN THE STEM SKILLS
NECESSARY TO PURSUE
A TECHNICAL CAREER.
51 National Academy of Sciences. “Rising Above the Gathering Storm: Energizing and Employing America for a Brighter Economic Future.” 2007 (Revised July 2008). Available http://www.nap.edu/catalog.php?record_id=11463#toc. 52 Ibid.
ers serve the industrial and commercial sectors
in addition to the electric power sector. Partly
because the construction industry is geographi-
cally fl uid and highly mobile, it has developed
national standards to guide its apprenticeship
system. This apprenticeship system has been
the primary source of skilled labor in the U.S.
construction industry.
Developing the Foundation for Technical Careers: K-12 Education
A solid K–12 education is the starting point for
any career, not just an electric sector or con-
struction sector career. To the extent that the
United States has fallen behind in K–12 educa-
tion, it is also falling behind in the ability to de-
liver technically-trained individuals to any part
of the economy. This has potentially signifi cant
implications for the ability of individuals to
adapt to changes in workforce demand and the
ability of the United States to serve as leader in
the innovation of technologies.
Addressing broader challenges and shortcom-
ings in the nation’s K–12 educational system
is thus essential to success in developing a
workforce to staff the transition to a low-carbon
economy and to encourage the development of
technologies and strategies that will lower costs
and improve the reliability during the transi-
tion. Students in grade school, middle school,
and high school must be exposed to the foun-
dational skills that will help them succeed in
a technology-driven economy. It is particularly
important to expose students to this set of skills
(science, technology, engineering, and math,
or STEM) early in their academic career and
reinforce the lessons throughout the educa-
tional pipeline.
In a recent National Academy of Sciences
(NAS) report titled “Rising Above the Gather-
ing Storm: Energizing and Employing Ameri-
can for a Brighter Economic Future,” industry
leaders and academic experts contend that the
nation faces an impending crisis as the result of
a K–12 educational system that fails to provide
students with a basic foundation for success in
the math, science and engineering fi elds.51
The Gathering Storm report argues that “[t]he
state of US K–12 education in science, math
and technology has become a focus of intense
concern. With the economies and broader cul-
tures of the US and other economies becoming
increasing dependent on science and technol-
ogy, US schools do not seem capable of produc-
ing enough students with the knowledge and
skills to prosper.”52 Norman Augustine, who
chaired the NAS committee that developed the
Gathering Storm report and who coauthored
the forward to this report, stated in stark terms
55627_P001_104.indd 4655627_P001_104.indd 46 8/13/09 8:04 AM8/13/09 8:04 AM
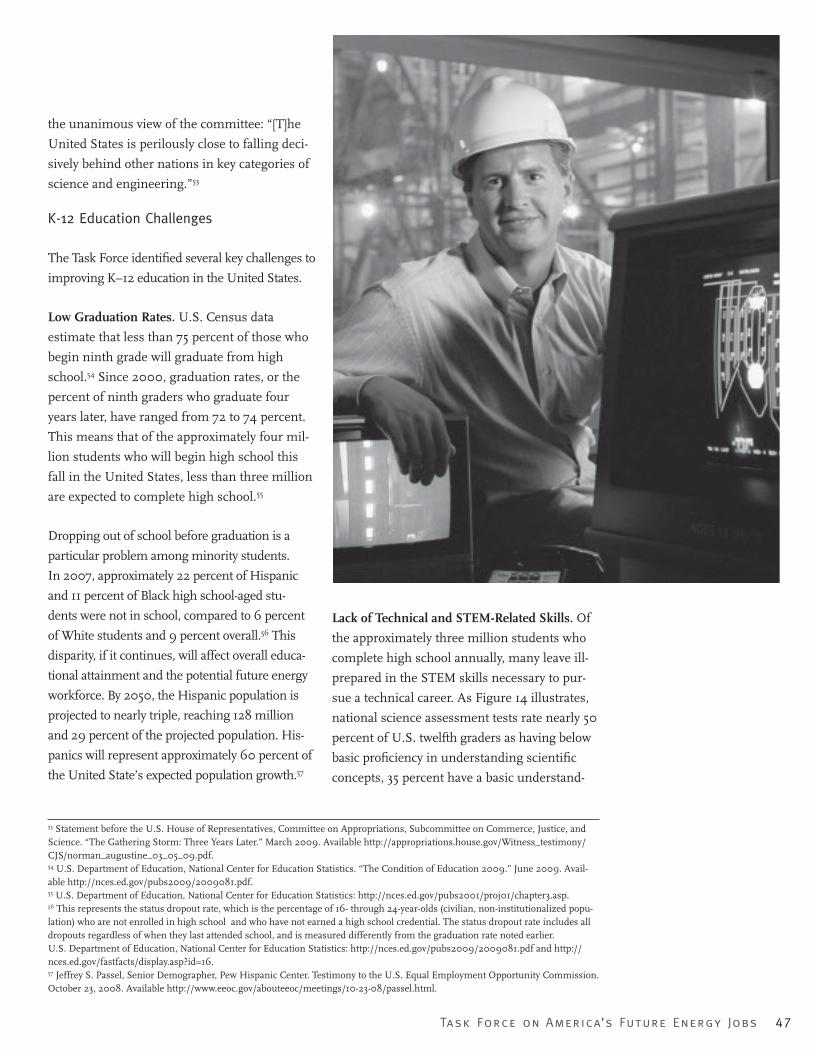
Task Force on America’s Future Energy Jobs 47
53 Statement before the U.S. House of Representatives, Committee on Appropriations, Subcommittee on Commerce, Justice, and Science. “The Gathering Storm: Three Years Later.” March 2009. Available http://appropriations.house.gov/Witness_testimony/CJS/norman_augustine_03_05_09.pdf. 54 U.S. Department of Education, National Center for Education Statistics. “The Condition of Education 2009.” June 2009. Avail-able http://nces.ed.gov/pubs2009/2009081.pdf. 55 U.S. Department of Education, National Center for Education Statistics: http://nces.ed.gov/pubs2001/proj01/chapter3.asp. 56 This represents the status dropout rate, which is the percentage of 16- through 24-year-olds (civilian, non-institutionalized popu-lation) who are not enrolled in high school and who have not earned a high school credential. The status dropout rate includes all dropouts regardless of when they last attended school, and is measured differently from the graduation rate noted earlier. U.S. Department of Education, National Center for Education Statistics: http://nces.ed.gov/pubs2009/2009081.pdf and http://nces.ed.gov/fastfacts/display.asp?id=16.57 Jeffrey S. Passel, Senior Demographer, Pew Hispanic Center. Testimony to the U.S. Equal Employment Opportunity Commission. October 23, 2008. Available http://www.eeoc.gov/abouteeoc/meetings/10-23-08/passel.html.
the unanimous view of the committee: “[T]he
United States is perilously close to falling deci-
sively behind other nations in key categories of
science and engineering.”53
K-12 Education Challenges
The Task Force identifi ed several key challenges to
improving K–12 education in the United States.
Low Graduation Rates. U.S. Census data
estimate that less than 75 percent of those who
begin ninth grade will graduate from high
school.54 Since 2000, graduation rates, or the
percent of ninth graders who graduate four
years later, have ranged from 72 to 74 percent.
This means that of the approximately four mil-
lion students who will begin high school this
fall in the United States, less than three million
are expected to complete high school.55
Dropping out of school before graduation is a
particular problem among minority students.
In 2007, approximately 22 percent of Hispanic
and 11 percent of Black high school-aged stu-
dents were not in school, compared to 6 percent
of White students and 9 percent overall.56 This
disparity, if it continues, will affect overall educa-
tional attainment and the potential future energy
workforce. By 2050, the Hispanic population is
projected to nearly triple, reaching 128 million
and 29 percent of the projected population. His-
panics will represent approximately 60 percent of
the United State’s expected population growth.57
Lack of Technical and STEM-Related Skills. Of
the approximately three million students who
complete high school annually, many leave ill-
prepared in the STEM skills necessary to pur-
sue a technical career. As Figure 14 illustrates,
national science assessment tests rate nearly 50
percent of U.S. twelfth graders as having below
basic profi ciency in understanding scientifi c
concepts, 35 percent have a basic understand-
55627_P001_104.indd 4755627_P001_104.indd 47 8/13/09 8:04 AM8/13/09 8:04 AM
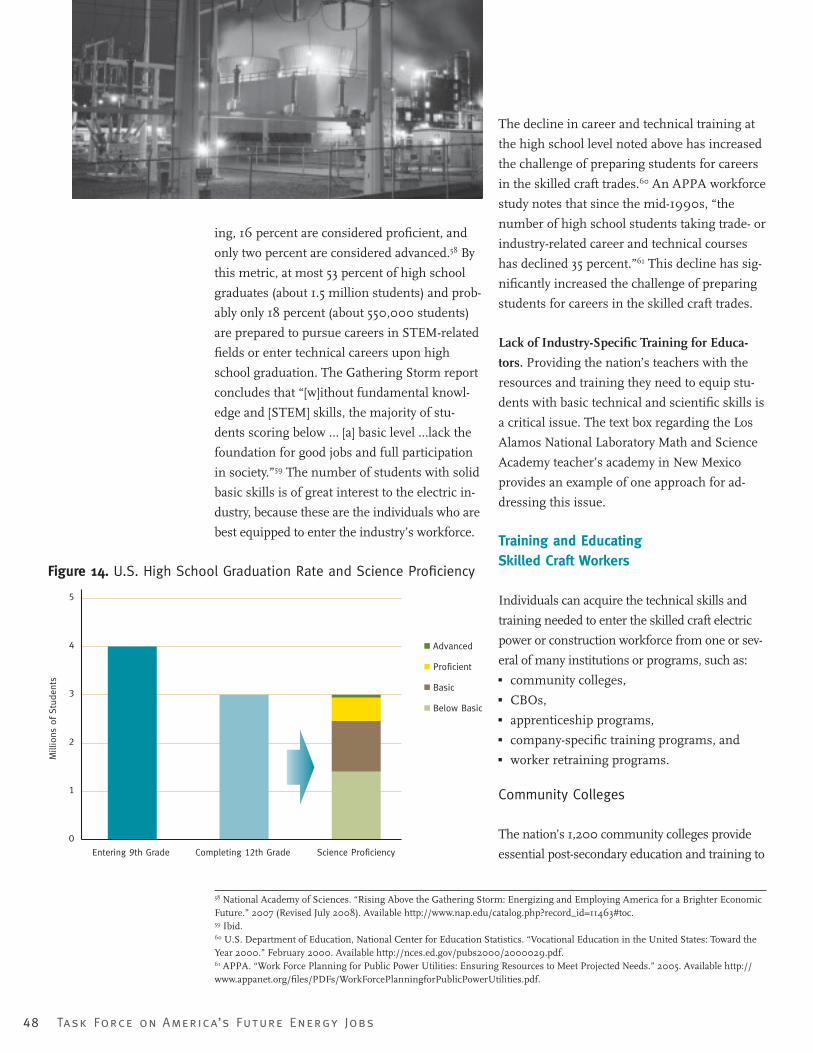
48 Task Force on America’s Future Energy Jobs
58 National Academy of Sciences. “Rising Above the Gathering Storm: Energizing and Employing America for a Brighter Economic Future.” 2007 (Revised July 2008). Available http://www.nap.edu/catalog.php?record_id=11463#toc. 59 Ibid. 60 U.S. Department of Education, National Center for Education Statistics. “Vocational Education in the United States: Toward the Year 2000.” February 2000. Available http://nces.ed.gov/pubs2000/2000029.pdf. 61 APPA. “Work Force Planning for Public Power Utilities: Ensuring Resources to Meet Projected Needs.” 2005. Available http://www.appanet.org/fi les/PDFs/WorkForcePlanningforPublicPowerUtilities.pdf.
ing, 16 percent are considered profi cient, and
only two percent are considered advanced.58 By
this metric, at most 53 percent of high school
graduates (about 1.5 million students) and prob-
ably only 18 percent (about 550,000 students)
are prepared to pursue careers in STEM-related
fi elds or enter technical careers upon high
school graduation. The Gathering Storm report
concludes that “[w]ithout fundamental knowl-
edge and [STEM] skills, the majority of stu-
dents scoring below … [a] basic level …lack the
foundation for good jobs and full participation
in society.”59 The number of students with solid
basic skills is of great interest to the electric in-
dustry, because these are the individuals who are
best equipped to enter the industry’s workforce.
0
1
2
3
4
5
Entering 9th Grade Completing 12th Grade Science Proficiency
Mill
ions
of St
uden
ts
Advanced
Proficient
Basic
Below Basic
Figure 14. U.S. High School Graduation Rate and Science Profi ciency
The decline in career and technical training at
the high school level noted above has increased
the challenge of preparing students for careers
in the skilled craft trades.60 An APPA workforce
study notes that since the mid-1990s, “the
number of high school students taking trade- or
industry-related career and technical courses
has declined 35 percent.”61 This decline has sig-
nifi cantly increased the challenge of preparing
students for careers in the skilled craft trades.
Lack of Industry-Specifi c Training for Educa-
tors. Providing the nation’s teachers with the
resources and training they need to equip stu-
dents with basic technical and scientifi c skills is
a critical issue. The text box regarding the Los
Alamos National Laboratory Math and Science
Academy teacher’s academy in New Mexico
provides an example of one approach for ad-
dressing this issue.
Training and Educating Skilled Craft Workers
Individuals can acquire the technical skills and
training needed to enter the skilled craft electric
power or construction workforce from one or sev-
eral of many institutions or programs, such as:
� community colleges,
� CBOs,
� apprenticeship programs,
� company-specifi c training programs, and
� worker retraining programs.
Community Colleges
The nation’s 1,200 community colleges provide
essential post-secondary education and training to
55627_P001_104.indd 4855627_P001_104.indd 48 8/13/09 8:04 AM8/13/09 8:04 AM

Task Force on America’s Future Energy Jobs 49
COMMUNITY COLLEGES ARE
WELL-POSITIONED TO PROVIDE
THE KIND OF TRAINING AND
RE-TRAINING PROGRAMS THAT
WILL BE NEEDED AS THE
UNITED STATES TRANSITIONS TO
A LOW-CARBON ECONOMY.
62 Stacy Teicher Khadaroo. “Community colleges play key role in tough economic times: Many schools have to turn away those seek-ing new job skills. Proposed federal funds could help.” Christian Science Monitor, April 11, 2009. Available http://www.csmonitor.com/2009/0411/p99s01-usgn.html. 63 American Association of Community Colleges: http://webadmin.aacc.nche.edu/Pages/default.aspx. 64 Green for All. “Going Green: The Vital Role of Community Colleges in Building a Sustainable Future and a Green Workforce.” 2009. Available http://www.greenforall.org/resources/going-green-the-vital-role-of-community-colleges-in-building-a-sustainable-future-and-a-green-workforce/download.
nearly half the nation’s undergraduate students.62
Specifi cally, they “provide open access to postsec-
ondary education, preparing students for transfer
to four-year institutions, providing workforce
development and skills training, and offering
noncredit programs ranging from English as a
second language to skills retraining to community
enrichment programs or cultural activities.”63
Many of the workers needed to fi ll electric indus-
try jobs in the future will utilize the community
college system as they prepare to enter the work-
force. Community colleges are well-positioned to
provide the kind of training and re-training pro-
grams that will be needed as the United States
transitions to a low-carbon economy. Not only
will some electric industry jobs require new and
different skills, but there will likely be mid-career
workers in other industries who seek re-training
in the electric industry for continued employ-
ment or career advancement. 64
Community colleges are also positioned to
partner with local industry and labor stake-
holders to develop courses and curricula that
serve the needs of stakeholders and benefi t the
local population. Through these partnerships,
community colleges are able to offer pre-
apprenticeship courses that prepare students
to enter formal apprenticeship programs and
offer training programs that prepare students
to fi ll specifi c needs identifi ed by industry. For
example, a community college might work with
an electric industry partner to develop a course
that provides the training needed to conduct
energy effi ciency audits at customer homes.
The fi rst case study described in Appendix
C highlights the Washington State Center of
Excellence for Energy Technology, Centralia
College which is part of a network of Centers of
Excellence developed by Washington State. As a
Center of Excellence, Centralia College serves as
a point of contact and resource hub for industry
trends, best practices, innovative curricula, and
professional development opportunities. The
objective is to maximize resources by bringing
together workforce education and industry part-
ners in order to develop highly-skilled employ-
ees for targeted industries.
Community-Based Organizations
CBOs and Workforce Investment Boards
(WIBs) serve an important function in the U.S.
workforce development system by connecting
people to jobs and to the skills necessary to
secure a job. WIBs were created as part of an
effort to overhaul federal support for workforce
development under the 1998 Workforce Invest-
ment Act (WIA). WIBs consist of public- and
private-sector members who provide strategic
leadership on workforce development issues
in their communities. WIBs plan and oversee
state and local workforce development and job
training programs, while CBOs, community
colleges, and other organizations carry out the
on-the-ground training.
At the local level, CBOs provide or play an
integral role in providing many workforce
development services. For example, the Mas-
sachusetts Workforce Alliance estimates that
CBOs provide 53 percent of workforce training
55627_P001_104.indd 4955627_P001_104.indd 49 8/13/09 8:04 AM8/13/09 8:04 AM

50 Task Force on America’s Future Energy Jobs
Los Alamos National Laboratory Math and Science Academy65
The Math and Science Academy (MSA) of the Los Alamos National Laboratory (LANL) is a three-
year intensive professional development program for math and science teachers in northern New
Mexico. LANL recognized a need to improve math and science education within northern New
Mexico to serve the needs of students, many of whom are low-income or minorities, as well as
the lab, which requires a highly skilled staff.
The MSA is considered a best practice example of a K-12 teacher professional development pro-
gram as outlined by the America COMPETES Act of 2007, building on educational principles that
are well-understood and supported by extensive research on effective math and science curricula.
The MSA strives to improve teacher knowledge of math and science content and instructional
skills. The program consists of a summer institute, regular online collaboration, and classroom
observation. Teachers participate in a three-week summer intensive program to refocus their
understanding of standards-based education, classroom management, professional collaboration,
effectively using technology as a tool, and math and science content. Participants interact online
and in-person during weekly collaboration sessions. MSA staff also observes classroom sessions
in order to provide customized, informal coaching and hands-on feedback. Additionally, teachers
have an opportunity to simultaneously enroll in a Masters of Arts in Teaching Math and Science
degree program administered online by New Mexico State University.
The program requires a three-year commitment from the participating teachers’ school district.
Three-year implementation costs for 10 teachers are estimated to be around $500,000, the major-
ity of which is covered by the LANL through grants and fundraising efforts. School districts have
begun to cover some costs, including the stipends paid to participating teachers. MSA, in its
tenth year, has provided this specialized training for 300 teachers from fi ve northern New Mexico
school districts, ultimately affecting more than 5,000 students to date.
The program provides sustained, long-term support for teacher participants and tailored monitor-
ing and metrics for students and school districts. The results have been measurable – students
taught by MSA-trained teachers have signifi cantly improved math profi ciency scores. For example,
in one New Mexico school district, students in MSA classrooms outperformed non-MSA class-
rooms on the math subtest of the 2007-2008 state assessment. MSA student performance was 37
percent higher in the third grade, 10 percent higher in the fourth grade, 5 percent higher in the
fi fth grade, and 25 percent higher in the sixth grade. MSA coordinators attribute the success of
the program to the intensive nature of the three-year engagement.
65 Program information and materials provided by Dr. Kurt A. Steinhaus (Director of Community Programs Offi ce at Los Alamos National Laboratory) to Sen. Pete Domenici (Retired), April 2009.
55627_P001_104.indd 5055627_P001_104.indd 50 8/13/09 8:04 AM8/13/09 8:04 AM
Task Force on America’s Future Energy Jobs 51
CBOS PLAY AN IMPORTANT
ROLE IN CONNECTING EMPLOYERS
AND WORKFORCE TRAINING
PROGRAMS TO
LOCAL COMMUNITIES AND
OTHERWISE-UNTAPPED
SOURCES OF UN- OR UNDER-
EMPLOYED WORKERS.
66 Statement before the U.S. House of Representatives, Select Committee on Energy Independence and Global Warming. January 15, 2009. Available http://www.greenforall.org/resources/recovery-package-1/transcript-of-testimony. 67 Jefferson County Public Schools (KY). “Apprenticeship Programs.” Available http://www.jefferson.k12.ky.us/Departments/SchooltoCareer/apprenticeship2.html.
in Massachusetts. CBOs generally target certain
groups, such as un- or underemployed adults,
and they often include workforce training as
a component of a broader set of community
development efforts. In many cases they also
provide complementary or “wrap-around” ser-
vices, such as housing or meal vouchers. CBOs
deliver comprehensive education and training
services to diverse populations that may lack
access to traditional opportunities such as com-
munity college or on-the-job training programs.
According to the Massachusetts Workforce Alli-
ance, a typical community-based education and
training program may provide:
� Classes in reading, writing, math, and com-
puter skills, and English language learning;
� Job readiness preparation and assistance with
career identifi cation, job search, and resume
development; and
� Training in specifi c job skill areas, intern-
ships, job shadowing, work experience, and
mentoring connections.
CBOs also help to fi ll the training gap for work-
ers outside traditional pipelines, such as return-
ing students or those in need of mid-career
retraining. Because of their community-based
structure, CBOs are able to reach potential
workers through existing programs, such as
language classes, and direct them to train-
ing opportunities. Unlike other pipeline entry
points, CBOs have existing relationships with
communities and individuals that pre-date—
and later continue beyond—the decision to seek
retraining or to pursue a particular training
pathway. As a result, CBOs play an important
role in connecting employers and workforce
training programs to local communities and
otherwise-untapped sources of un- or under-
employed workers.
Van Jones, Special Advisor for Green Jobs,
Enterprise and Innovation at the White House
Council on Environmental Quality, and founder
of the Oakland, California-based CBO Green
For All, has underscored the important role
that CBOs can play in transforming our energy
economy. Green For All was founded on the
concept that clean energy jobs are needed not
only to achieve federal energy policy objectives,
but also to provide “pathways out of poverty” for
low-income workers. In recent Congressional
testimony, Jones explained that “[w]e have an
opportunity to connect the people who most
need work with the work that most needs to
be done, and fi ght pollution and poverty at the
same time, and be one country about it.”66
Apprenticeship Programs
By offering supervised on-the-job training
in addition to formal classroom instruction,
apprenticeship programs serve as a key train-
ing resource for the industry. Apprenticeship
programs frequently involve a joint partnership
between an employer and a labor organiza-
tion. Through these joint labor-management
apprenticeship programs, workers learn skilled
trades through on-the-job training and related
classroom instruction. Apprentices progres-
sively earn more responsibility and earn wages
while learning skills. Apprenticeship programs
generally last three to fi ve years. After complet-
ing such a program, an apprentice becomes a
journeyperson, which means he or she is fully
qualifi ed to perform the work of the trade, and
earns full pay.67
55627_P001_104.indd 5155627_P001_104.indd 51 8/13/09 8:04 AM8/13/09 8:04 AM

52 Task Force on America’s Future Energy Jobs
68 Construction Labor Research Council. “Craft Labor Supply Outlook 2005-2015.” Available http://www.buildri.org/stuff/content-mgr/fi les/b80e3403e6c7cb9532d7645598cf3e85/misc/2005.craft_labor_supply_report.pdf.
The Construction Labor Research Council lists
average annual active apprentices in the United
States by craft as shown in Table 12. The electric
power industry will compete with other sectors
for these skilled workers.
Table 12. Average Expected Annual New Entrants in Selected Crafts 2005-201568
Occupational Title New Entrants
Boilermakers 1,000
Bricklayers 4,000
Carpenters 22,000
Cement Masons 8,400
Electricians 22,400
Equipment Operators 15,300
Insulators 2,700
Ironworkers 4,500
Laborers 20,100
Painters 8,000
Pipefi tters/Plumbers 17,500
Sheet Metal Workers 6,200
Under uncertain economic or policy circum-
stances, many employers, including those in
the electric power sector, will hesitate to recruit
relatively unskilled new hires for long-term
apprenticeship programs in which the em-
ployer will invest years of training. In response,
unions, electric power companies, community
colleges, and other stakeholders have begun
developing multi-employer and labor-sponsored
programs designed to share the benefi ts and
training costs of apprenticeship programs.
While these programs do not replace or sup-
plant traditional apprenticeship programs, they
allow students to effectively try out skills and
careers before competing for, or completing,
a full apprenticeship. Similarly, electric power
companies and labor unions gain additional
confi dence in potential hires and may select
new employees from a more skilled pool of
workers, increasing the likelihood that appren-
ticeships will be completed.
As highlighted in the review of multi-stake-
holder collaborations in Appendix C, the
International Brotherhood of Electrical Workers
(IBEW) signed an agreement in January 2009
with several electric companies to develop a
trust that would support multiple IBEW re-
gional training centers across the United States.
The goal of the program is to partner with
utilities to offer hands-on training for a new
generation of electric power employees. The
IBEW is currently working to identify sites for
additional centers in the southeast, the north-
east, the northwest, and Texas. Once centers are
established, IBEW envisions them as offering
regional resources that a range of stakeholders
may want to utilize.
55627_P001_104.indd 5255627_P001_104.indd 52 8/13/09 8:04 AM8/13/09 8:04 AM
Task Force on America’s Future Energy Jobs 53
A KEY CHALLENGE
IS ALIGNING TRAINING
PROGRAMS WITH
THE DEMAND FOR WORKERS.
69 Helmets to Hardhats: http://helmetstohardhats.org/.
In-House Training Programs
Electric power companies have traditionally
hired technically profi cient employees and put
them through their own intensive, customized
internal training programs to create a workforce
with the specifi c skills and knowledge required
by each company. While there has been some
coordination, this training has largely been
conducted in-house on a company-by-company
basis. Companies frequently require that em-
ployees go through company-specifi c training,
or test out of such training, even if they have
previous industry experience.
As discussed elsewhere, a movement to com-
petitive electric markets in some states led to an
overall decline in workforce levels through the
end of the 1990s. As the industry’s demand for
new workers slowed during this period, some
training activities were outsourced for the fi rst
time in the history of the industry.
As a part of this trend, some electric power
companies have begun partnering with local
community colleges and unions to develop
creative, fl exible training programs to supple-
ment the programs they previously conducted
in-house. These multi-stakeholder training
partnerships have allowed companies to suc-
cessfully partner with community colleges to
establish curricula and establish hiring consor-
tia. PG&E’s innovative training program, PG&E
PowerPathwayTM, is featured as the third case
study in Appendix C.
Re-Training Programs
Additionally, workers in other technically-pro-
fi cient fi elds may retrain for the electric power
industry. For example, Helmets to Hardhats is a
national program that connects National Guard,
Reserve, and transitioning active-duty military
members with career training and employment
opportunities within the construction and other
skilled industries.69 The program is designed
to provide career transition support for return-
ing veterans while also providing employers
with technically-profi cient workers who pos-
sess many soft workplace skills. Helmets to
Hardhats helps address the unique challenges
that confront individuals transitioning from
military service to civilian employment. At the
same time, it helps those individuals accentu-
ate qualifi cations, such as general technical
profi ciency and specifi c training gained while
in the military, that are unlikely to be formally
certifi ed in a way that is recognized by industry.
Skilled Craft Worker Training Challenges
The diversity of training programs for skilled
craft workers creates some unique challenges
for the electric power sector. Some of these
challenges are specifi c to preparing skilled craft
workers for work in the electric power sector
while other challenges apply more generally to
skilled craft workers in both the electric power
and construction sectors.
Understanding Electric Power Sector Demand
for Skilled Workers. A key challenge is align-
ing training programs with the demand for
workers. Chapters 1 and 2 review estimates of
potential future demand for skilled craft work-
ers in the electric power industry. While such
order-of-magnitude estimates are useful, devel-
oping specifi c training programs within each
of the institutions and programs highlighted
above requires a much more detailed under-
standing of workforce needs and opportunities.
As discussed in Chapters 1 and 2, the pace and
55627_P001_104.indd 5355627_P001_104.indd 53 8/13/09 8:04 AM8/13/09 8:04 AM

54 Task Force on America’s Future Energy Jobs
70 NEI is currently working with 46-plus community colleges to develop the Nuclear Uniform Curriculum Program. Curriculum requirements are laid out in ACAD 08-006, the Uniform Curriculum Guide for Nuclear Power Plant Technician, Maintenance, and Nonlicensed Operations Personnel Associate Degree Programs as well as NEI 09-04 Nuclear Uniform Curriculum Toolkit. Full pro-gram information is available only to members, but the NEI homepage will include basic information once the program is fi nalized.
direction of technology deployment will have
important impacts on future demand for work-
ers and types of skills. In addition, workforce
demand will likely vary by region of the country,
further complicating nationwide estimates.
These assessment challenges are compounded
by the current system used by BLS to estimate
future industry demand. BLS relies on histori-
cal trends to project future industry growth
and does not include estimates for replacing
positions lost through retirements or other
attrition. This methodology ignores important
demographic and technological shifts in the
electric power sector as well as the need for
skilled labor to design, build, and operate new
generating assets.
Lack of Communication among Stakeholder
Groups. A lack of communication among
stakeholders leads to a number of challenges.
Without effective communication, education
and training systems may duplicate efforts,
resulting in an ineffi cient use of limited re-
sources. Such gaps in communication can leave
students behind as one institution assumes
that another institution provided training in
critical subjects like math and science or basic
technical skills. Additionally, a lack of commu-
nication between employers and educators can
result in the training system producing poten-
tial employees without the proper skill sets.
Educational institutions need time to develop
quality training programs and hire faculty. By
encouraging the sharing of data on workforce
needs, employers can give educational institu-
tions valuable lead time to develop quality train-
ing programs tailored to current and future
industry needs.
Lack of Credential Portability. The lack of
standardized skill sets and curricula for some
skilled crafts within the electric power sector
presents a signifi cant challenge for students,
community colleges, and employers. From the
perspective of skilled craft workers within the
electric power sector, one of the challenges to
getting a job or moving through a career—par-
ticularly where this involves changing compa-
nies or re-entering the workforce after spending
time in another industry—is providing docu-
mentation of relevant skills. In part to address
this issue, the nuclear power industry, through
NEI, recently announced the development of a
set of core curricula intended to help develop a
widely recognized training system for workers
in that industry.70
As discussed above, the construction sector has
addressed credential portability by developing
national standards to guide its apprenticeship
system. Skilled craft construction workers are
accustomed to moving as workforce needs shift
from region to region and sector to sector.
55627_P001_104.indd 5455627_P001_104.indd 54 8/13/09 8:04 AM8/13/09 8:04 AM
Task Force on America’s Future Energy Jobs 55
SOME ELECTRIC POWER
COMPANIES HAVE BEGUN
PARTNERING WITH LOCAL
COMMUNITY COLLEGES
AND UNIONS TO DEVELOP
CREATIVE, FLEXIBLE TRAINING
PROGRAMS TO SUPPLEMENT
THE PROGRAMS THEY
PREVIOUSLY CONDUCTED
IN-HOUSE.
71 U.S. Department of Labor, National Center for Education Statistics: http://nces.ed.gov/IPEDS/. Some data are available on fi elds in which community college degrees are awarded. However, these data are reported on a voluntary basis with the U.S. Department of Education’s Integrated Post Secondary Education Data System and are incomplete.
Collecting and Tracking Skilled Workforce
Data. Information on the number of people
that pass through training systems is currently
not well captured.71 These data are needed to
establish a clear picture of the electric power
workforce pipeline. For example, knowing how
many students with an electrician’s degree are
working in the electricity sector versus in the
residential heating ventilation and air condi-
tioning (HVAC) industry would enable electric
power companies to better assess their work-
force needs. The lack of clear and complete data
complicates efforts to understand workforce
needs and can lead to over- or under-estimates
of the number of trained workers likely to be
employed by the industry in the future.
Costs of Education. Students who receive
adequate education in technical skills and who
would be prime candidates for electric sector
employment may have trouble paying for post-
secondary education. These students may not
complete degrees or take additional courses that
could provide long-term benefi ts. Scholarships
or grants that focus on the electric power sector
could help to address this challenge.
Improving the Image of Electricity Industry
Careers. As labor groups and companies look to
expand the pool of technically skilled workers,
many Task Force members are concerned that
students and their parents are focused on
attainment of four-year college degrees and
fail to view apprenticeship or other programs
outside four-year colleges as providing similar
or better opportunities for long-term career and
salary potential.
Lack of Career Preparatory Skills within the
Workforce. A lack of math and science skills
among many high school students represents a
major challenge in terms of training a new gen-
eration of skilled craft workers. Because of this
lack of preparatory skills, introductory courses
have become more prevalent at the community
college level. To better prepare students and
reduce the need for introductory classes, some
institutions are now partnering with K–12 edu-
cators to ensure that students receive instruc-
tion in basic math and science skills early in
their academic careers.
55627_P001_104.indd 5555627_P001_104.indd 55 8/13/09 8:04 AM8/13/09 8:04 AM

56 Task Force on America’s Future Energy Jobs
IT IS IMPORTANT TO
FOSTER MECHANISMS
FOR PULLING BOTH RESEARCH
AND STUDENTS INTO
THE ELECTRIC SECTOR.
72 Idaho National Engineering and Environmental Laboratory and Bechtel Power Corporation. “U.S. Job Creation Due to Nuclear Power Resurgence in the United States: Volumes 1 and 2” (Prepared for the U.S. Department of Energy, Offi ce of Nuclear Energy, Science, and Technology). November 2004. Available http://www.inl.gov/technicalpublications/Documents/3772069.pdf.
Training and Educating Engineers
Many of the skilled positions essential to
design, build, operate, and maintain the low-
carbon economy will require four-year college
degrees, usually in science, engineering, or a
related technical fi eld.72 The United States has
an extensive system of colleges and universities
that excel in the training of students in engi-
neering and technology. These schools have
established programs and draw students from
around the world to undergraduate and gradu-
ate programs.
Engineers will be among the most important of
the professionals needed. A number of the lead-
ing engineering schools have research centers
that attract faculty and expose students to the
skills and thinking required for technically-rigor-
ous professions. Beyond providing educational
experiences for students, colleges and universi-
ties that emphasize research help drive technolo-
gy innovation. Innovation in energy technologies
like nuclear energy, renewable energy, and CCS
will be critical to meeting the challenges of tran-
sitioning to a low-carbon economy.
Professional Engineer Challenges
As discussed in previous sections, a challenge
for developing engineers to work in the elec-
tric power sector is ensuring that high school
graduates are properly equipped to pursue a
technical career. Once students are appropri-
ately prepared for a four-year college or uni-
versity, students must be encouraged to enroll
in engineering programs related to the electric
sector. The text box on Electric Power and
Transmission Engineers highlights some of the
challenges by looking at the example of electric
power engineers. Elements of the challenges
are expanded below.
Mobilizing the Research Community. Profes-
sional engineers are needed to develop, design,
and implement new, low-carbon technologies
that produce electricity. This requires graduates
with Bachelor of Science, Master of Science,
and doctoral degrees in engineering and related
disciplines. While some of the technologies
already exist, some have not yet been devel-
oped. There is a need for active and invigorated
research programs in power engineering and
related areas. To appropriately engage stu-
dents, faculty need to be engaged through the
development of research programs, including
programs that are multidisciplinary in their ap-
proach and thinking.
Encouraging Students to Work in the Electric
Industry. In addition to stimulating research, it is
important to foster mechanisms for pulling both
research and students into the electric sector.
One way to do this is through partnerships with
industry. Industrial partners can expose students
to the application of technologies in the business
world through involvement in research initia-
tives and through internships to students.
Costs of Education. The cost of post-secondary
education in the United States is daunting and
can be a barrier to entry. Scholarships or grants
that focus on the electric power sector could
help address this challenge.
55627_P001_104.indd 5655627_P001_104.indd 56 8/13/09 8:04 AM8/13/09 8:04 AM

Task Force on America’s Future Energy Jobs 57
Electric Power and Transmission Engineers73
It is important to identify trends within the
subset of engineers who undertake training in
electric sector-related fi elds. These engineers
focus on the generation of electricity, construc-
tion of delivery systems, and management of
electricity usage.74 A recent DOE analysis of
workforce trends noted that “[i]n the 1970s,
power concentration represented approximately
10.5% of undergraduate electrical engineering
students in the United States. Over time, enroll-
ments dropped, and by 2001, that percentage
dropped almost in half to 6%.”75 Additionally,
DOE concluded that “the number of power
engineering programs at universities has de-
clined over the past twenty years.”76 A recent
report by the U.S. Power and Energy Engineer-
ing Workforce Collaborative found that “there
are less than fi ve very strong university power
engineering programs in the U.S.”77 The report
defi ned such programs as having:
� four or more full-time power engineering
faculty;
� research funding per faculty member that
supports a large but workable number of
graduate students;
� a broad set of undergraduate and graduate
course offerings in electric power systems,
power electronics, and electric machines; and
� sizable class enrollments of undergraduates
and graduate students in those courses.
Without strong support for strategic research in
power systems and without qualifi ed replace-
ments for retiring faculty, the strength of exist-
ing power engineering degree programs at U.S.
universities could begin to erode.78 And, with-
out such programs, the United States is likely
to lose its leadership position in technology
innovation. As one industry commentator notes,
“the application of [the fundamental principles
of electric power engineering], as well as our
understanding of the electric system, continues
to evolve. This enables technology enhance-
ments that signifi cantly improve the capabil-
ity, performance, and reliability of the entire
electricity system. The electric power engineer
is critical to this process.”79
Many expert groups have recommended
focused attention and investment to maintain
the quality and productivity of engineering
programs in the United States. The Gathering
Storm report, DOE’s Workforce Trends report,
the U.S. Power and Energy Engineering Work-
force Collaborative report, and the National
Science Foundation’s Power Engineering Work-
shop 2008 report, among others, recommend
focusing on faculty retention and research and
development opportunities for engineering
programs.80
73 U.S. Department of Energy. “Workforce Trends In The Electric Utility Industry: A Report To The United States Congress Pursuant To Section 1101 Of The Energy Policy Act Of 2005.” August 2006. Available http://www.oe.energy.gov/DocumentsandMedia/Work-force_Trends_Report_090706_FINAL.pdf.74 Ibid75 Ibid76 Ibid77 U.S. Power and Energy Engineering Workforce Collaborative, “Preparing the U.S. Foundation for Future Electric Energy Systems: A Strong Power and Energy Engineering Workforce,” IEEE Power & Energy Society. April 2009. Available http://www.ieee.org/portal/cms_docs_pes/pes/subpages/pescareers-folder/workforce/US_Power-Energy_Collaborative_Action_Plan_April_2009_Adobe7.pdf. 78 U.S. Department of Energy. “Workforce Trends In The Electric Utility Industry: A Report To The United States Congress Pursu-ant To Section 1101 Of The Energy Policy Act Of 2005.” August 2006. 79 Badhul Chowdhury. “Power Education at the Crossroads.” IEEE Spectrum, October 2000.80 National Science Foundation. “Report of the National Science Foundation Workshop on the Future Power Engineering Workforce (Held November 29-30, 2007).” September 2008. Available http://ecpe.ece.iastate.edu/nsfws/Report%20of%20NSF%20Workshop.pdf.
55627_P001_104.indd 5755627_P001_104.indd 57 8/13/09 8:04 AM8/13/09 8:04 AM
58 Task Force on America’s Future Energy Jobs
C H A P T E R 4 .
CONCLUSION
The Task Force on America’s Future Energy Jobs
strongly believes that addressing the need for a
well-qualifi ed electric power sector workforce must
be a major national priority.
Building the workforce needed to enable a transition
to low-carbon energy systems is essential to realizing
important national policy objectives, including
maintaining economic competitiveness, reducing
greenhouse gas emissions, and improving energy
security. Without near-term investment in the next
generation of electric power and construction workers,
we could fi nd ourselves constrained in our ability to
make necessary infrastructure changes.
55627_P001_104.indd 5855627_P001_104.indd 58 8/13/09 8:04 AM8/13/09 8:04 AM

Task Force on America’s Future Energy Jobs 59
IT IS CLEAR THAT THERE WILL
BE SUBSTANTIAL OVERALL
DEMAND FOR TECHNICALLY
EDUCATED STUDENTS; SKILLED
CRAFT ELECTRIC POWER AND
CONSTRUCTION WORKERS;
AND MATH, SCIENCE, AND
ENGINEERING PROFESSIONALS.
While the need for different types of specialized
workers will vary depending on the deployment
trajectory of different generation technologies, it
is clear that there will be substantial overall de-
mand for technically educated students; skilled
craft electric power and construction workers;
and math, science, and engineering profession-
als. Investments in training infrastructure are
benefi cial to our broader socioeconomic well-be-
ing and economic recovery efforts. If well-placed,
such investments can also play a critical role in
rebuilding our long-term ability to innovate and
lead in technical fi elds.
In exploring the workforce challenges specifi c
to the electric sector, the Task Force has evalu-
ated the potential demand for and supply of
workers in three broad categories: skilled craft
electric power workers, skilled craft construc-
tion workers, and engineers. A closer look at
these categories suggests that the current train-
ing pipeline will be insuffi cient to meet antici-
pated demand. Task Force members agree that
this critical workforce gap must be addressed in
an urgent and deliberate way so that near-term
measures create maximum long-term economic
benefi ts.
Skilled Craft Electric Power and Construction Workforce
The Task Force sought to develop order-of-
magnitude estimates of the potential need for
skilled crafts workers in the fi elds of electricity
infrastructure design, construction, operations
and maintenance. Due to policy and other un-
certainties, it was not our aim to generate pre-
cise forecasts of workforce demand and supply.
Based only on the age distribution of current
workers in the industry and on historical retire-
ment patterns, there will be a large need for
qualifi ed candidates to replace existing workers.
Filling that need, by itself, is not likely to be an
easy task. Moreover, the situation is likely to
be exacerbated by competition for skilled craft
workers from other sectors of the economy as
55627_P001_104.indd 5955627_P001_104.indd 59 8/13/09 8:04 AM8/13/09 8:04 AM

60 Task Force on America’s Future Energy Jobs
FOCUSED NATIONAL POLICY
SUPPORT AND INVESTMENT
IS NEEDED TO ADDRESS
WORKFORCE CHALLENGES IN
THE ELECTRICAL SECTOR
IN A TIMELY WAY.
anticipated large-scale infrastructure projects
are undertaken over the next ten years. Addi-
tional workforce needs as the nation transforms
to a low-carbon economy will further strain the
potential workforce.
Professional Workforce for Electric Power Industry
As with the skilled craft trades generally, esti-
mating the potential shortage of professionals
in the electric power sector is complicated by
a lack of specifi city in the data concerning quali-
fi cations for many professional categories. The
data that are available point to a trend of declin-
ing interest in electrical and power engineer-
ing, just as we are experiencing an increased
need for research, development, and innovation
in these areas. With the fl ow of students into
four-year colleges and universities increasingly
ill-prepared for math, science, and engineering
studies, it is important to connect all the pieces
and maintain a consistent focus on all the ele-
ments of the workforce pipeline, starting with
K–12 education.
In keeping with the Gathering Storm report,
the Task Force believes efforts to ensure that
the nation is producing signifi cant numbers of
Masters- and PhD-level scientists and engineers
provide a dual benefi t. First, having these pro-
fessionals available in the workforce is crucial
to enabling a low-carbon energy transition.
Second, these same professionals can contrib-
ute to the electrical technology innovations that
the U.S. and world economy will need to secure
long-term energy and environmental security.
The Task Force concludes that focused national
policy support and investment is needed to
address workforce challenges in the electrical
sector in a timely way. Investments in improv-
ing and enlarging the training pipeline for
future energy-sector workers will also provide a
foundation for long term economic health and
global competitiveness.
The workforce challenges identifi ed by the Task
Force are signifi cant and addressing them will
take a concerted and sustained effort by many
stakeholders. To advance that process, the Task
Force developed a set of fi ve primary recom-
mendations for federal policy. While these
recommendations are specifi cally focused on the
development of direct future energy jobs associ-
ated with design, construction, and operation of
assets in the energy sector, many of the insights
could be applied to job training associated with
deploying energy effi ciency and manufacturing
the materials and equipment needed to build
and operate the future energy system.
The Task Force’s recommendations follow.
55627_P001_104.indd 6055627_P001_104.indd 60 8/13/09 8:04 AM8/13/09 8:04 AM

Task Force on America’s Future Energy Jobs 61
IN REGIONS OF THE COUNTRY
WHERE WORKFORCE GAPS ARE
IDENTIFIED, CONGRESS SHOULD
PROVIDE FINANCIAL RESOURCES
AND COORDINATION ASSISTANCE
TO SUPPORT THE DEVELOPMENT
OF TARGETED LOCAL OR
REGIONAL TRAINING PROGRAMS
FOR ENERGY SECTOR WORKERS.
Task Force Recommendations
Recommendation 1: Evaluate regional training needs and facilitate multi-stake-holder energy sector training programs across the country
In addition to the work currently underway at
DOL and DOE to address the workforce gaps
associated with projected retirements and
the initiatives in the American Recovery and
Reinvestment Act of 2009, Congress should
appropriate funds through existing funding
mechanisms that allow DOL and DOE to work
with existing state or regional energy workforce
consortia or establish new state or regional en-
ergy workforce consortia, as appropriate. These
consortia should be tasked with evaluating
near- and long-term needs for a skilled work-
force, including:
� Workforce gaps at existing facilities over
the next ten years associated with workforce
retirements;
� Workforce gaps over the next twenty years
associated with;
� constructing new low-carbon generating as-
sets and retrofi ting existing generating assets,
� constructing the additional electric infra-
structure needed to effectively use new and
retrofi tted generating assets (e.g. transmis-
sion lines, CO2 pipelines, local distribution
systems),
� operating and maintaining new and retro-
fi tted generating assets and the accompany-
ing infrastructure, and
� deploying energy effi ciency in the retrofi t-
ting of the nation’s building stock and in
Smart Grid technologies.
As a part of this evaluation, DOL, DOE, and
each state or regional energy workforce consor-
tium should highlight any policy uncertainties
that are currently delaying or have the potential
to delay the deployment of new generating
assets, retrofi t technologies, and infrastructure
that are essential to the transition to a low-
carbon economy.
In regions of the country where workforce gaps
are identifi ed, Congress should provide fi nancial
resources and coordination assistance to support
the development of targeted local or regional
training programs for energy sector workers.
DOL should award funding on a competitive
basis through the Green Jobs Act, or other appro-
priate federal funding mechanisms, to training
programs that meet the following criteria:
� Involve a wide range of stakeholders from in-
dustry, education, labor, professional organi-
zations, and workforce development agencies
or non-profi t community groups that focus
on workforce development in all stages of
program development.
55627_P001_104.indd 6155627_P001_104.indd 61 8/13/09 8:04 AM8/13/09 8:04 AM
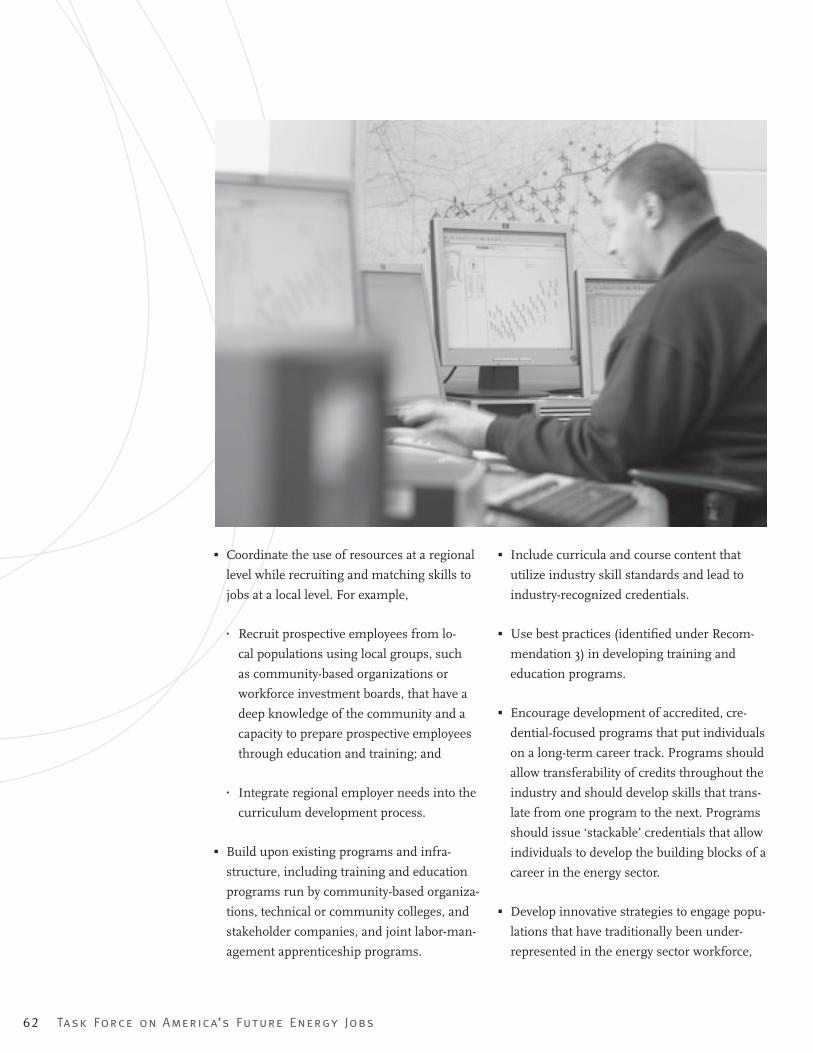
62 Task Force on America’s Future Energy Jobs
� Coordinate the use of resources at a regional
level while recruiting and matching skills to
jobs at a local level. For example,
� Recruit prospective employees from lo-
cal populations using local groups, such
as community-based organizations or
workforce investment boards, that have a
deep knowledge of the community and a
capacity to prepare prospective employees
through education and training; and
� Integrate regional employer needs into the
curriculum development process.
� Build upon existing programs and infra-
structure, including training and education
programs run by community-based organiza-
tions, technical or community colleges, and
stakeholder companies, and joint labor-man-
agement apprenticeship programs.
� Include curricula and course content that
utilize industry skill standards and lead to
industry-recognized credentials.
� Use best practices (identifi ed under Recom-
mendation 3) in developing training and
education programs.
� Encourage development of accredited, cre-
dential-focused programs that put individuals
on a long-term career track. Programs should
allow transferability of credits throughout the
industry and should develop skills that trans-
late from one program to the next. Programs
should issue ‘stackable’ credentials that allow
individuals to develop the building blocks of a
career in the energy sector.
� Develop innovative strategies to engage popu-
lations that have traditionally been under-
represented in the energy sector workforce,
55627_P001_104.indd 6255627_P001_104.indd 62 8/13/09 8:04 AM8/13/09 8:04 AM
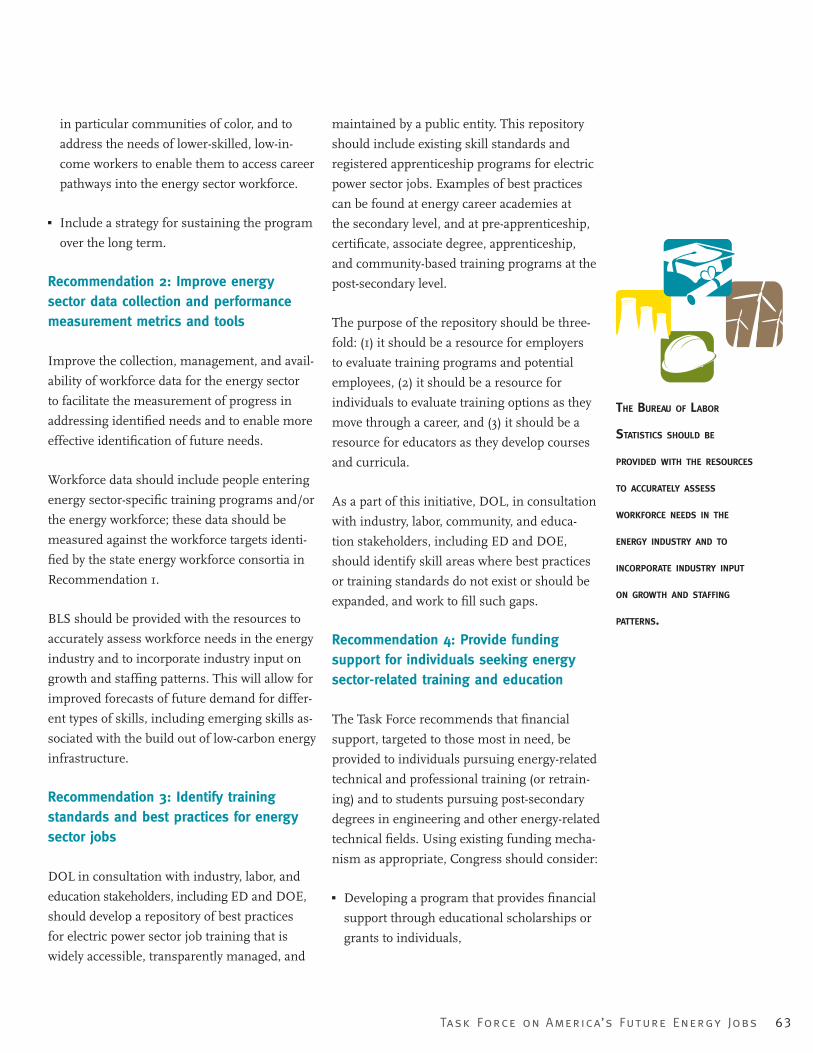
Task Force on America’s Future Energy Jobs 63
THE BUREAU OF LABOR
STATISTICS SHOULD BE
PROVIDED WITH THE RESOURCES
TO ACCURATELY ASSESS
WORKFORCE NEEDS IN THE
ENERGY INDUSTRY AND TO
INCORPORATE INDUSTRY INPUT
ON GROWTH AND STAFFING
PATTERNS.
in particular communities of color, and to
address the needs of lower-skilled, low-in-
come workers to enable them to access career
pathways into the energy sector workforce.
� Include a strategy for sustaining the program
over the long term.
Recommendation 2: Improve energy sector data collection and performance measurement metrics and tools
Improve the collection, management, and avail-
ability of workforce data for the energy sector
to facilitate the measurement of progress in
addressing identifi ed needs and to enable more
effective identifi cation of future needs.
Workforce data should include people entering
energy sector-specifi c training programs and/or
the energy workforce; these data should be
measured against the workforce targets identi-
fi ed by the state energy workforce consortia in
Recommendation 1.
BLS should be provided with the resources to
accurately assess workforce needs in the energy
industry and to incorporate industry input on
growth and staffi ng patterns. This will allow for
improved forecasts of future demand for differ-
ent types of skills, including emerging skills as-
sociated with the build out of low-carbon energy
infrastructure.
Recommendation 3: Identify training standards and best practices for energy sector jobs
DOL in consultation with industry, labor, and
education stakeholders, including ED and DOE,
should develop a repository of best practices
for electric power sector job training that is
widely accessible, transparently managed, and
maintained by a public entity. This repository
should include existing skill standards and
registered apprenticeship programs for electric
power sector jobs. Examples of best practices
can be found at energy career academies at
the secondary level, and at pre-apprenticeship,
certifi cate, associate degree, apprenticeship,
and community-based training programs at the
post-secondary level.
The purpose of the repository should be three-
fold: (1) it should be a resource for employers
to evaluate training programs and potential
employees, (2) it should be a resource for
individuals to evaluate training options as they
move through a career, and (3) it should be a
resource for educators as they develop courses
and curricula.
As a part of this initiative, DOL, in consultation
with industry, labor, community, and educa-
tion stakeholders, including ED and DOE,
should identify skill areas where best practices
or training standards do not exist or should be
expanded, and work to fi ll such gaps.
Recommendation 4: Provide funding support for individuals seeking energy sector-related training and education
The Task Force recommends that fi nancial
support, targeted to those most in need, be
provided to individuals pursuing energy-related
technical and professional training (or retrain-
ing) and to students pursuing post-secondary
degrees in engineering and other energy-related
technical fi elds. Using existing funding mecha-
nism as appropriate, Congress should consider:
� Developing a program that provides fi nancial
support through educational scholarships or
grants to individuals,
55627_P001_104.indd 6355627_P001_104.indd 63 8/13/09 8:04 AM8/13/09 8:04 AM

64 Task Force on America’s Future Energy Jobs
� Providing worker training tax credits to en-
ergy companies who support apprenticeships
and internships, and
� Clarifying and streamlining support for ap-
prenticeships, technical certifi cations, and
on-the-job training for veterans by combining
the benefi ts of the Post-9/11 GI Bill and the
Montgomery GI Bill into one program.
Recommendation 5: Aggressively focus on revitalizing the math and science skills, education, and career counseling of individuals who have the interest and skills to work in the energy sector
Enhance preparatory skill training for techni-
cally rigorous careers by:
� Improving and expanding contextual educa-
tion in science, technology, engineering, math,
and environmental literacy for students in all
grades from kindergarten through 12th grade,
� Expanding the use of instructional technology
at all levels to provide access to computerized
and on-line educational resources and infor-
mation about science, technology, engineer-
ing and math,
� Integrating lessons in applied math and sci-
ence into the foundational curriculum for all
students, with a particular emphasis on early
(K–4) education,
� Expanding educational opportunities that
include reading, writing, and applied math
and science for adults who wish to enter the
energy workforce,
� Providing opportunities for teachers and
instructors to learn about the energy sec-
tor and greenhouse gas emissions through
off-site programs organized by local colleges,
universities, and industry partners,
� Ensuring that students are at or above grade
level in math,
� Developing energy-related, contextual
modules for math and science teacher train-
ing carried out at colleges and universities,
55627_P001_104.indd 6455627_P001_104.indd 64 8/13/09 8:04 AM8/13/09 8:04 AM
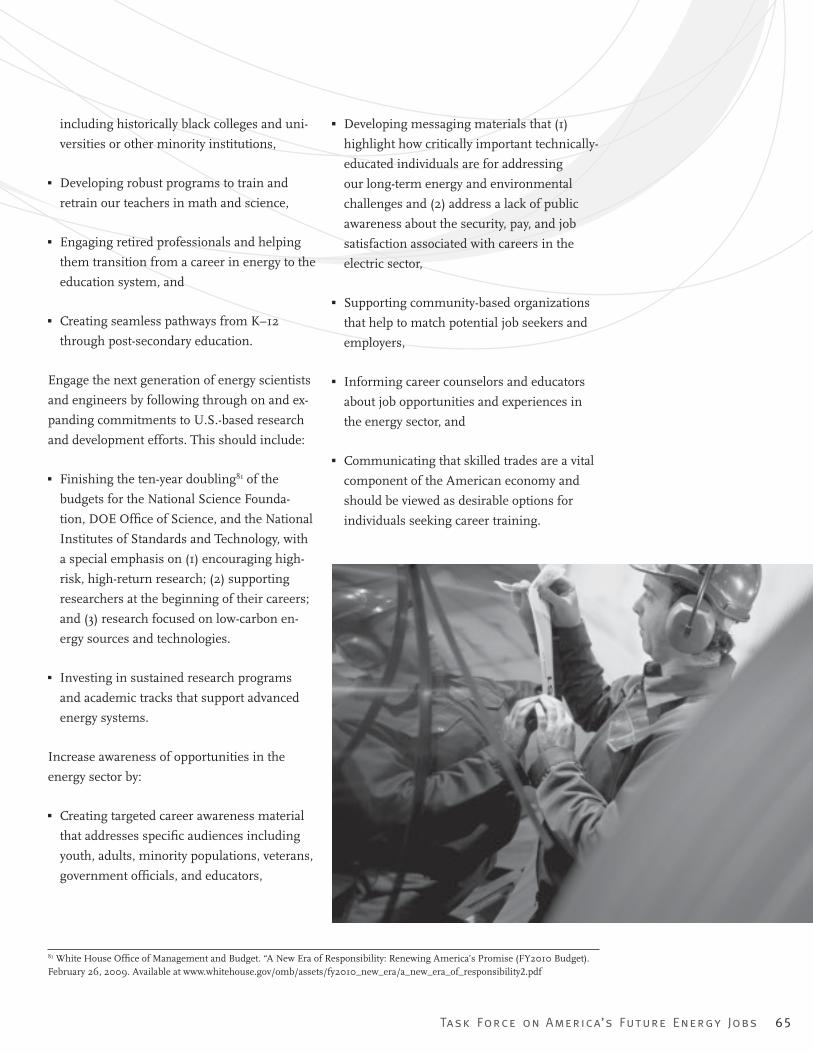
Task Force on America’s Future Energy Jobs 65
81 White House Offi ce of Management and Budget. “A New Era of Responsibility: Renewing America’s Promise (FY2010 Budget). February 26, 2009. Available at www.whitehouse.gov/omb/assets/fy2010_new_era/a_new_era_of_responsibility2.pdf
including historically black colleges and uni-
versities or other minority institutions,
� Developing robust programs to train and
retrain our teachers in math and science,
� Engaging retired professionals and helping
them transition from a career in energy to the
education system, and
� Creating seamless pathways from K–12
through post-secondary education.
Engage the next generation of energy scientists
and engineers by following through on and ex-
panding commitments to U.S.-based research
and development efforts. This should include:
� Finishing the ten-year doubling81 of the
budgets for the National Science Founda-
tion, DOE Offi ce of Science, and the National
Institutes of Standards and Technology, with
a special emphasis on (1) encouraging high-
risk, high-return research; (2) supporting
researchers at the beginning of their careers;
and (3) research focused on low-carbon en-
ergy sources and technologies.
� Investing in sustained research programs
and academic tracks that support advanced
energy systems.
Increase awareness of opportunities in the
energy sector by:
� Creating targeted career awareness material
that addresses specifi c audiences including
youth, adults, minority populations, veterans,
government offi cials, and educators,
� Developing messaging materials that (1)
highlight how critically important technically-
educated individuals are for addressing
our long-term energy and environmental
challenges and (2) address a lack of public
awareness about the security, pay, and job
satisfaction associated with careers in the
electric sector,
� Supporting community-based organizations
that help to match potential job seekers and
employers,
� Informing career counselors and educators
about job opportunities and experiences in
the energy sector, and
� Communicating that skilled trades are a vital
component of the American economy and
should be viewed as desirable options for
individuals seeking career training.
55627_P001_104.indd 6555627_P001_104.indd 65 8/13/09 8:04 AM8/13/09 8:04 AM

66 Task Force on America’s Future Energy Jobs
APPENDICES
55627_P001_104.indd 6655627_P001_104.indd 66 8/13/09 8:04 AM8/13/09 8:04 AM
Task Force on America’s Future Energy Jobs 67
82 Although Bechtel has performed and attached the requested calculations, we have not reviewed any of the deployment scenarios provided by NCEP for reasonableness or feasibility (technical, commercial, or otherwise). The scenarios and their resulting data, including the long-term workforce demands refl ected in this study, should be viewed as solely refl ecting the opinions of NCEP.
Appendix A: Bechtel Report on Design and Construction
A Report to the Bipartisan Policy Center
National Commission on Energy Policy’s
Task Force on America’s Future Energy Jobs
Prepared by
Bechtel Power Corporation
May 2009
Bechtel Confi dential
Bipartisan Policy Center
National Commission on Energy Policy
Task Force on America’s Future Energy Jobs
Scope of Study
The National Commission on Energy Policy
(NCEP) requested that Bechtel Power Corpora-
tion (Bechtel) provide an approximate quan-
tifi cation of workforce demand requirements
associated with the addition of new power
generation for a number of technologies. The
study’s primary task was to approximate the
number of people (jobs) required for the engi-
neering, procurement, and construction (EPC)
services to deploy 1 gigawatt (GW, which equals
1,000 megawatts (MW)) of generation for each
identifi ed technology, with the following detail:
- differentiate between project development
and project engineering/construction
phases
- differentiate between domestic and off-
shore jobs
- differentiate between hourly and salaried
jobs
- for hourly jobs, provide further details
with respect to certain “critical crafts”
NCEP requested that Bechtel perform the above
analyses with respect to building new power
generating assets for each of the following
technologies:
1. Nuclear
2. Conventional coal (super-critical, pulver-
ized coal, or SCPC)
3. Conventional coal including carbon cap-
ture and storage (SCPC w/CCS)
4. Integrated gasifi cation combined cycle
(IGCC)
5. IGCC including carbon capture and stor-
age (IGCC w/CCS)
6. Natural gas combined cycle (NGCC)
7. Onshore wind
8. Solar thermal
9. Solar photovoltaic (PV)
Upon completion of the workforce demand
ranges per GW of new generation for each
technology above, NCEP requested that Bechtel
calculate total long-term workforce demands as-
sociated with three separate, approximately 20-
year, generation deployment scenarios provided
by NCEP, summarized as follows:82
1. “EPRI PRISM” Scenario: this scenario
forecasts the addition of approximately
210 GW of new generation between 2007
and 2030
2. “EPRI Nuclear/Renewables” Scenario:
this scenario forecasts the addition of
approximately 235 GW of new generation
between 2007 and 2030
3. “EPRI Coal + CCS” Scenario: this scenario
forecasts the addition of approximately
221 GW of new generation between 2007
and 2030
55627_P001_104.indd 6755627_P001_104.indd 67 8/13/09 8:04 AM8/13/09 8:04 AM

68 Task Force on America’s Future Energy Jobs
83 Bechtel estimates pertaining to CCS do not consider the transportation or storage of carbon.84 The study also did not attempt to quantify the tertiary jobs associated with implementing new generating capacity, such as those in the transportation, restaurant, hospitality, and other sectors that would result from the power generation facilities.
Study Limitations
Bechtel analyzed data readily available from
our direct experience (actuals or projections) or
from industry sources considered reliable for
the intended purpose of this task. The study’s
scope was limited to approximate quantifi ca-
tions of the direct jobs required to develop,
design, procure material for, and construct
the power generating facility itself. The study
specifi cally did not attempt to quantify the
indirect jobs associated with implementing new
generation capacity, such as those related to
the manufacture of the power generation and
other equipment and materials that are integral
to the facility. However, we are providing an
approximate dollar spend range for the power
generation and other equipment and materials
associated with the engineering and construc-
tion of 1 GW of each technology for NCEP’s fur-
ther use (e.g., others working with NCEP may
be able to utilize this data to quantify a range of
indirect workforce requirements attributed to
such spend).83
The study also did not attempt to quantify
indirect jobs associated with the design and
construction of supporting infrastructure such
as transmission lines, natural gas pipelines,
roads, or CO2 pipelines and sequestration sites
that may be required for the facility to operate.84
Average quantifi cations of workforce demands
and construction schedules are inherently un-
certain and highly variable. Site conditions can
greatly infl uence the scope of work within each
specifi c power generation technology and local
conditions can affect workforce demands and
construction schedules based on factors such
as weather and labor productivity. Also, specifi c
(e.g., proprietary) designs within any given tech-
nology can lead to differences in project scope
and workforce requirements, as can design
advancements that occur over time which lead
to improvements in areas such as technology ef-
fi ciency, project cost, emissions, safety, and other
characteristics. As a result, the workforce quanti-
fi cations provided in this study are expressed as
a range, refl ecting the study’s expected general
+/- 25 percent level of accuracy.
Construction schedules can similarly vary based
on major equipment lead-time assumptions, the
project’s ability to commit to certain purchases
prior to full Notice to Proceed, and other factors.
Although for simplicity in presentation we have
not depicted a time-axis range to address such
variabilities in construction schedules, it should
be recognized that the base construction pe-
riod used for each technology is also inherently
uncertain and highly variable, and therefore,
should also be considered to have a similar +/-
25 percent general level of accuracy.
While estimates of workforce demand and dollar
spend range information is provided for each
technology, the cumulative effects of the inher-
ent uncertainties must be considered when
reviewing the individual results for each spe-
cifi c technology. Because of these variances, we
believe that relative comparisons across the tech-
nologies provide the most revealing insights and
therefore suggest they be given the most weight
when utilizing the results of this study.
55627_P001_104.indd 6855627_P001_104.indd 68 8/13/09 8:04 AM8/13/09 8:04 AM

Task Force on America’s Future Energy Jobs 69
Study Methodology
1. Development Phase
The development phases for the projects con-
sidered in this study create salaried workforce
requirements related to tasks such as project
conceptual design, plant permitting, and project
fi nancing activities. However, except for nuclear
power generation, the numbers of jobs required
during this phase are small when compared to
the requirements created during the construc-
tion phase. The primary reason for addressing
the development phase in this study is to illus-
trate the inherent lag between the time a project
is approved for development and the beginning
of project engineering and construction.
Bechtel has relevant experience with the devel-
opment of projects across each of the technolo-
gies covered in this study, as an EPC contractor
supporting the efforts of project developers,
and as a project developer through its affi liated
company, Bechtel Enterprises. To estimate the
workforce requirements associated with the
development phase, we drew upon this collec-
tive experience to establish, for each technology,
the following:
� An expected development time in months
for a typically-sized plant based on recent
experience. Technology-specifi c development
time periods used in this study may lengthen
or contract as a result of incentives included
in the economic stimulus bill, passage of
legislation pertaining to carbon emissions,
experience and comfort level of permitting
agencies as they become more familiar with
applications for plants based on new nuclear
and emerging technologies, or other similar
factors.
� Approximate job-hours required for all enti-
ties supporting the typical project develop-
ment effort. This includes both the developer
and its consultants, who typically include
siting, environmental and permitting, legal,
engineering, fuel, and other specialists.
� To normalize our results to a per GW basis,
we assumed that multiple units of the typical
plant would be developed to achieve 1 GW of
generation (i.e., if an 800 MW plant could
be developed over 30 months, we assumed
that 1.25 such plants would be developed in
the same 30 month period to achieve the
standard 1 GW of generation, as opposed
to scaling up the 800 MW typical plant to a
1,000MW plant).
Once the above information was fi nalized, we
converted the resulting salaried job-hours per
GW of development into equivalent man-
months using a 154 job-hour per man-month
conversion factor, a standard industry factor
that accounts for holiday and vacation time off.
We then converted the total man-months into
equivalent development phase staffi ng curves
for each technology by spreading the total man-
months over the development period duration
in a manner consistent with actual industry ex-
perience. All curves in this study are presented
as equivalent staffi ng since the aforementioned
conversion factor assumes a standard 40-hour
work week. The use of regularly scheduled
overtime, six-day work weeks, or other incen-
tives would result in actual staffi ng levels being
somewhat lower than those refl ected on each
curve (the use of such incentives is currently
common practice with respect to attracting
hourly workers (and, to a lesser extent, salaried
workers) during the construction phase).
55627_P001_104.indd 6955627_P001_104.indd 69 8/13/09 8:04 AM8/13/09 8:04 AM

70 Task Force on America’s Future Energy Jobs
Finally, the resulting staffi ng curves are pre-
sented in a generalized range of +/- 25 percent
in recognition of the uncertainty factors dis-
cussed earlier.
2. Construction Phase
For each technology listed above, Bechtel
reviewed its database of historical and ongoing
projects and selected a cross section of repre-
sentative projects based on plant size, location,
date of construction, and other factors. For
those technologies that we had a large number
of datapoints (i.e., nuclear, coal, NGCC, and
IGCC), we were able to cull from our analyses
any projects determined to be “outliers” (e.g.,
a project that experienced a suspension during
construction) that might skew the resulting per
GW ranges substantially and make them less
relevant to the study purposes. For those tech-
nologies that are still evolving (i.e., CCS, solar
(PV and thermal), and wind), there are fewer
datapoints available, and as such the study
results for these technologies have a somewhat
lower degree of confi dence. Not all individual
projects are expected to conform to the ranges
shown, but in general it is expected that the
ranges cover the majority of outcomes and are
relevant to the purposes of the study.
Once Bechtel formulated a working list of proj-
ects for each given technology, we populated an
analysis template at the individual project level
as follows:
� For salaried (professional) services, which
include engineering, project management,
construction oversight, and other support
services, we identifi ed hours for the entire
project, and also noted the subtotals at the
project site, at corporate offi ces, and at any
offshore design facility.
� For hourly (craft) services, we identifi ed
hours at the project site for all such workers,
whether direct employees or subcontrac-
tors (where actual subcontractor job-hour
data was not available, estimated hours were
derived from subcontractor dollars using
historical metrics).
� Subtotals within the hourly (craft) services
for certain critical crafts were also identifi ed.
For the purposes of this study, critical crafts
include pipefi tters, electricians, boilermakers,
millwrights, and ironworkers.
� Each specifi c project’s size (net MW), start
and end date, and overall schedule duration
in months was noted.
� Costs for the power generation and other
plant equipment and materials required to
construct the project were identifi ed. For this
data to be useful to the study, we escalated
the identifi ed dollars to current day. This was
done by noting the midpoint of the construc-
tion schedule for that project and applying
the CPI US city average escalation factor
to the base dollars for each year from the
midpoint to current day. Although there are
inherent inaccuracies within this methodol-
ogy that compound with the age of the data,
we believe the results obtained are generally
consistent with the level of accuracy repre-
sented for all other study results.
Once the above data w as assembled for each
project within the given technology, we es-
tablished a base case plant for that technol-
ogy by averaging the job-hour data, escalated
equipment and material costs, plant size, and
schedule duration across each project. These
resulting, base case plants were the building
blocks for further analysis across each technol-
55627_P001_104.indd 7055627_P001_104.indd 70 8/13/09 8:04 AM8/13/09 8:04 AM
Task Force on America’s Future Energy Jobs 71
ogy, although they clearly do not and should not
be interpreted to refl ect or be applicable to any
one specifi c project. As with the development
phase, to normalize the results to a per GW ba-
sis. we again assumed that multiple units of the
resultant base case plant would be installed to
achieve 1 GW of generation (i.e., if the base case
plant refl ected an average size of 800 MW and
an average construction duration of 48 months,
we assumed that 1.25 plants would be built in
the same 48 months to achieve the standard 1
GW of generation, as opposed to scaling up the
800 MW base case plant to a longer duration,
1,000 MW plant).
Job-hour information was translated into staff-
ing curves as follows:
� Each labor category of the 1 GW standard capac-
ity block was converted into equivalent man-
months using the standard 154 job-hour per
man-month conversion factor discussed earlier.
� The total man-months for each labor category,
including the hourly services subsets of critical
crafts, were converted into equivalent staff-
ing curves over the capacity block’s duration,
using historical staffi ng curves from specifi c
projects for each technology as guidance.
The individual curves for the hourly services
subsets of critical crafts were developed using
the overall shape of the total hourly curve as a
template. This approach does not address the
time phasing of the critical craft activities that
normally occurs as construction progresses
however, we expect that this approach yields
results consistent with the level of accuracy
represented for all other study results.
Bechtel then analyzed the resulting staffi ng
curves for each labor category for reasonable-
ness and addressed any inconsistencies via
minor modifi cations based on engineering and
estimating judgment. Finally, these staffi ng
curves are presented with the same 25 percent
margin of error discussed above.
The curves depicting salaried (professional)
services are inclusive of all positions associated
with this scope of work. However, it is common
practice for engineering fi rms to utilize global
execution centers when performing certain as-
pects of the design and procurement activities
for the power generating facilities addressed in
this study. As a result, the construction phase
staffi ng levels for salaried personnel as de-
picted on the attached staffi ng curves include
a small percentage of offshore positions. The
percentage of work done offshore varies in ac-
cordance with each individual contractor’s (or
consortium’s) execution strategy and can also
vary across technologies. For this study, it can
be assumed that a general range of 5 percent
to 15 percent of the salaried personnel staffi ng
levels refl ected during the construction phase
are actually workforce requirements that will be
fulfi lled offshore.
Overview by Technology
Below is a summary of the analysis performed
for each technology included in this study.
Tables at the end of this section refl ect the fol-
lowing results of the study:
- Base salaried and hourly man-years associ-
ated with adding 1 GW of each technology;
and
- The range of equipment and material
spend developed (as discussed herein) as-
sociated with the construction of 1 GW of
each technology.
55627_P001_104.indd 7155627_P001_104.indd 71 8/13/09 8:04 AM8/13/09 8:04 AM
72 Task Force on America’s Future Energy Jobs
1. Nuclear: The study’s analysis of nuclear
technology considered ten units at four sites.
Nine of the units are completed (dating
back to the 1970s and 1980s), and one is a
current working projection for a project we
are currently supporting in its early develop-
ment phase based on a new generation plant
design. Unit sizes range from approximately
800 MW to 1,600 MW. The projected staff-
ing plans assume a development period
of three years and a construction period of
six and a half years for an approximately
1,600MW new nuclear generation unit.
2. Conventional coal: The study’s analysis of
conventional coal technology considered 11
units utilizing various technologies at nine
sites. Five of the units are completed (1990s
and newer), and six are currently under
construction. Unit sizes range from approxi-
mately 200 MW to 800 MW. The projected
staffi ng plans assume a development period
of two and a half years and a construction
period of four years for an approximately
600 MW new super-critical, pulverized coal
generation unit.
3. Conventional coal including carbon capture
and storage: The study’s analysis of CCS
technology was done on a stand-alone basis
and draws from work we either are perform-
ing or have reviewed at three separate sites
with respect to the separation and capture of
CO2. These data points include sites adding
this capability either on a retrofi t basis or as
part of initial construction, which is inher-
ently more effi cient. Although the blended
results of this analysis likely yield higher
workforce requirements than would be
expected going forward (where CCS will be
implemented with initial construction), it is
expected that the results presented for the
CCS analyses are consistent with the level
of accuracy represented for all other study
results. Each of these applications is target-
ing CO2 capture effi ciencies in the 85-90
percent range, which is the basis for the
CCS technologies included in this study.
This approach resulted in a “CO2 Capture
Adder” (i.e., the hourly and salaried job-
hours, and the equipment and material
dollars spend, associated with the imple-
mentation of CCS technology) that we
normalized to a per GW of plant treated
basis and then applied to both the SCPC and
IGCC options. To apply this adder to SCPC,
we took the base data from item 2 above and
increased all parameters by 33 percent to
offset the approximately 25 percent parasitic
loads that will be imposed by adding CCS
technology to a SCPC power plant. In other
words, a starting SCPC generating capacity
of 1,333 MW without CCS is needed to end
up with a SCPC generating capacity of 1,000
MW with CCS, assuming a 25 percent loss
of output associated with powering the CCS
equipment. The CO2 Capture Adder staffi ng
curves and spend dollars were then added to
these revised results. We have not attempted
to analyze the staffi ng requirements associ-
ated with transportation and sequestration
of CO2.
4. IGCC: The study’s analysis of IGCC technol-
ogy considered six units at four sites. Two
of the units are completed (dating back to
the 1980s and 1990s), two are currently in
execution, and two are current projections
for projects we are familiar with. Unit sizes
range from approximately 100 MW to 300
MW. The projected staffi ng plans assume a
55627_P001_104.indd 7255627_P001_104.indd 72 8/13/09 8:04 AM8/13/09 8:04 AM

Task Force on America’s Future Energy Jobs 73
development period of two years and a con-
struction period of four years for an approxi-
mately 600 MW new multi-unit IGCC plant.
5. IGCC including carbon capture and stor-
age: The study’s analysis of IGCC with
CCS is similar to item 3 above, but with an
adjustment factor of 25 percent to the item
4 results to offset the approximately 20 per-
cent parasitic loads that will be imposed by
adding CCS technology to an IGCC power
plant. In other words, a starting IGCC gen-
erating capacity of 1,250 MW without CCS
is needed to achieve an IGCC generating
capacity of 1,000 MW with CCS, assuming
a 20 percent loss of output associated with
powering the CCS equipment.
6. Natural gas combined cycle: The study’s
analysis of NGCC technology considered 21
units at seven sites. Fifteen of the units are
completed (within the past 10 years), and six
are current projections for projects we are
familiar with. Unit sizes range from approxi-
mately 250 MW to 350 MW. The projected
staffi ng plans assume a development period
of two years and a construction period of
two and a half years for an approximately
800 MW new multi-unit NGCC plant.
7. Onshore wind: The study’s analysis of wind
technology considered wind farms at three
separate sites that we have reviewed within
the past several years. The wind farm sizes
ranged from 20 MW to 150 MW. The pro-
jected staffi ng plans assume a development
period of two years and a construction pe-
riod of one year for approximately 100MW
of wind generation.
8. Solar thermal: The study’s analysis of solar
thermal technology is based on our analysis
of a limited number of projects we are fa-
miliar with, as well as from industry sources
considered reliable for this technology. The
projected staffi ng plans assume a develop-
ment period of two years and a construction
period of two years for an approximately 100
MW solar thermal plant.
9. Solar PV: The study’s analysis of solar PV
technology is based upon current projections
for two projects we are familiar with, as well
as from industry sources considered reliable
for this technology. The projected staffi ng
plans assume a development period of two
years and a construction period of two years
for an approximately 100 MW solar PV plant.
Development Plus Construction Phases: Man-Years per GW of Generation*
Technology Salaried Hourly
1. Nuclear 4,785 9,575
2. Conventional coal (super-critical, pulverized coal)
1,390 4,980
3. Conventional coal including CCS 2,140 8,435
4. IGCC 2,130 5,150
5. IGCC including CCS 2,795 8,145
6. Natural gas combined cycle 495 1,270
7. Onshore wind 305 1,180
8. Solar thermal 3,345 5,185
9. Solar PV 2,560 8,720
* Man-years per GW block of generation refl ect base data for both develop-ment and construction phases; a +/- 25 percent level of accuracy applies to all workforce requirements and associated data presented in this report.
55627_P001_104.indd 7355627_P001_104.indd 73 8/13/09 8:04 AM8/13/09 8:04 AM

74 Task Force on America’s Future Energy Jobs
Equipment and Material Dollar Spend Ranges per GW of Generation Capacity ($ in millions) *
Technology 75 percent Base Case 125 percent
1. Nuclear $1,000 $1,325 $1,650
2. Conventional coal (super-critical, pulverized coal)
$725 $975 $1,225
3. Conventional coal including CCS $1,275 $1,700 $2,125
4. IGCC $925 $1,225 $1,550
5. IGCC including CCS $1,450 $1,925 $2,400
6. Natural gas combined cycle $285 $380 $475
7. Onshore wind $935 $1,250 $1,550
8. Solar thermal $915 $1,220 $1,525
9. Solar PV $1,550 $2,050 $2,555
* Data in table above are intended to provide an approximate dollar spend range for the equipment and materials needed to construct 1 GW of each technology. These estimates do not address specifi c plant operational characteristics, nor do they include the cost of supporting infrastructure, such as transmission lines, natural gas pipelines, roads, or CO
2 pipelines and sequestration sites that may be required for the
facility to operate. All of these factors, in addition to the capital costs shown in the table above, can affect the cost of electricity to the consumer.
Appendix: Bechtel Qualifi cations
� Bechtel, headquartered in Frederick, MD, is
one of the preeminent EPC contractors in the
world. With power experience dating back
more than seventy years, Bechtel has been
ranked by Engineering News-Record maga-
zine as the #1 EPC contractor in the industry
in each of the past eleven years. Its corpo-
rate resume includes over 200,000 MW of
completed power projects, with the following
highlights:
� 118,000 MW (500 units) of fossil power
� 76,000 MW (80 units) of nuclear power
� 26,000 MW (180 units) of hydro power
� 20 years of gasifi cation/IGCC experience
(6 major projects, over 60 studies)
� Signifi cant renewables experience with
completed projects utilizing waste-to en-
ergy, biomass, solar, geothermal, and wind
technologies
� Bechtel Enterprises Holdings, Inc. (BEn),
also headquartered in Frederick, MD, is the
Bechtel Group’s project fi nance and devel-
opment arm. With close to forty years of
experience, BEn has been involved in the
development of seventy seven projects repre-
senting $32 billion in project costs. Included
in this are fi fty power projects totaling more
than 28,000 MW of generation across a vari-
ety of technologies.
Attachments
Attachment 1 - Staffi ng curves, by technology,
for a standard 1 GW of generation
- Part 1: curves are provided for each tech-
nology assessed, which identify the range
of hourly and salaried workforce require-
ments, with the vertical line on each curve
denoting the transition from the develop-
ment phase to the construction phase.
- Part 2: separate curves are also provided
for each technology refl ecting the critical
crafts component of the hourly workforce
requirements.
55627_P001_104.indd 7455627_P001_104.indd 74 8/13/09 8:04 AM8/13/09 8:04 AM

Task Force on America’s Future Energy Jobs 75
The information provided in these curves was
not prepared for the purposes of being repre-
sentative of any past, current or future project
utilizing the identifi ed technology. As such, this
information should not in any way be deemed
to be representative of or applicable to any par-
ticular project utilizing the identifi ed technol-
ogy and should not in any way be utilized for
the purposes of any commercial discussions,
analyses or determinations in respect of any
particular project.
Attachment 2 - Details of generating capacity
additions for the NCEP-provided scenarios
This table shows the total GW additions by
technology and by year for each of the scenarios
provided by NCEP. Results of the workforce
requirements analyses associated with each of
these scenarios are provided in Attachment 3.
Attachment 3 - Staffi ng curves for the NCEP-
provided scenarios
- Base curves for each scenario (Each curve
tails down to zero workforce requirement
by the year 2030 since there are no capac-
ity additions beyond that point in any of
the deployment scenarios)
- Hourly workforce requirements curve
across all scenarios
- Salaried workforce requirements curve
across all scenarios
- Critical craft components for each sce-
nario
55627_P001_104.indd 7555627_P001_104.indd 75 8/13/09 8:04 AM8/13/09 8:04 AM
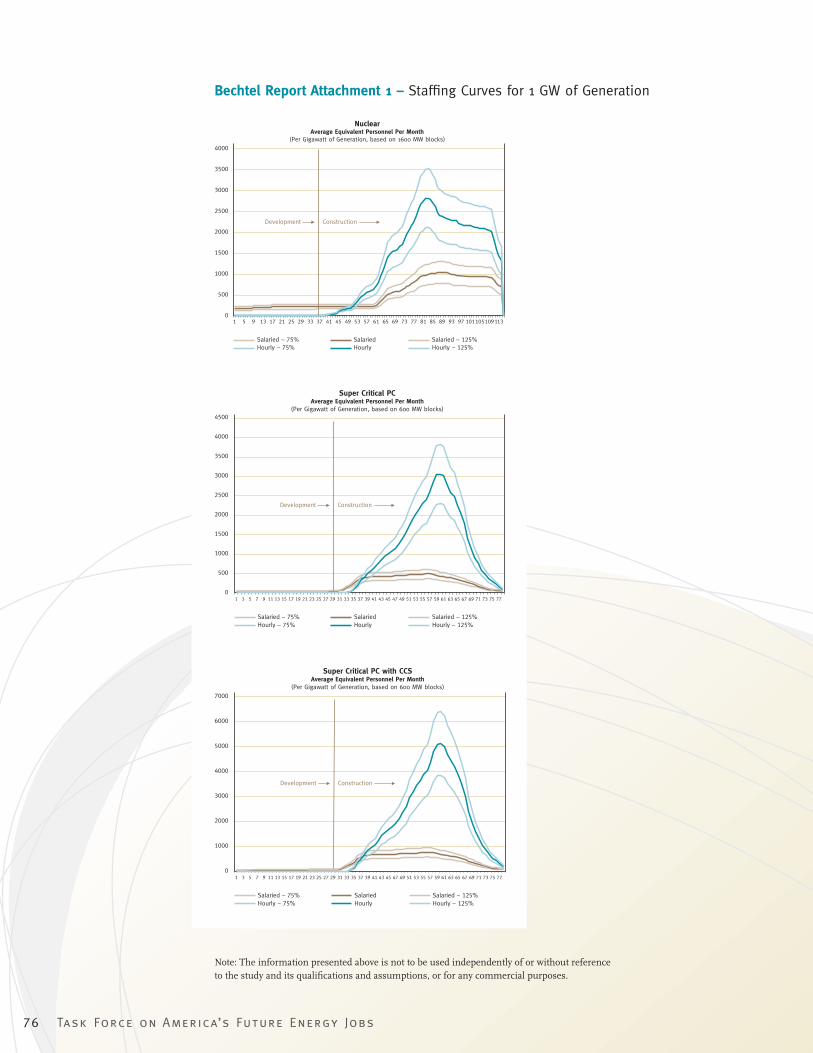
76 Task Force on America’s Future Energy Jobs
Note: The information presented above is not to be used independently of or without reference to the study and its qualifi cations and assumptions, or for any commercial purposes.
Bechtel Report Attachment 1 – Staffi ng Curves for 1 GW of Generation
0
500
1000
1500
2000
2500
3000
3500
4000
1 5 9 13 17 21 25 29 33 37 41 45 49 53 57 61 65 69 73 77 81 85 89 93 97 101105109113
NuclearAverage Equivalent Personnel Per Month
(Per Gigawatt of Generation, based on 1600 MW blocks)
Salaried – 75% Salaried Salaried – 125%Hourly – 75% Hourly Hourly – 125%
Development Construction
0
500
1000
1500
2000
2500
3000
3500
4000
4500
1 3 5 7 9 11 13 15 17 19 21 23 25 27 29 31 33 35 37 39 41 43 45 47 49 51 53 55 57 59 61 63 65 67 69 71 73 75 77
Super Critical PCAverage Equivalent Personnel Per Month
(Per Gigawatt of Generation, based on 600 MW blocks)
Salaried – 75% Salaried Salaried – 125%Hourly – 75% Hourly Hourly – 125%
Development Construction
0
1000
2000
3000
4000
5000
6000
7000
1 3 5 7 9 11 13 15 17 19 21 23 25 27 29 31 33 35 37 39 41 43 45 47 49 51 53 55 57 59 61 63 65 67 69 71 73 75 77
Super Critical PC with CCSAverage Equivalent Personnel Per Month
(Per Gigawatt of Generation, based on 600 MW blocks)
Salaried – 75% Salaried Salaried – 125%Hourly – 75% Hourly Hourly – 125%
Development Construction
55627_P001_104.indd 7655627_P001_104.indd 76 8/13/09 8:04 AM8/13/09 8:04 AM
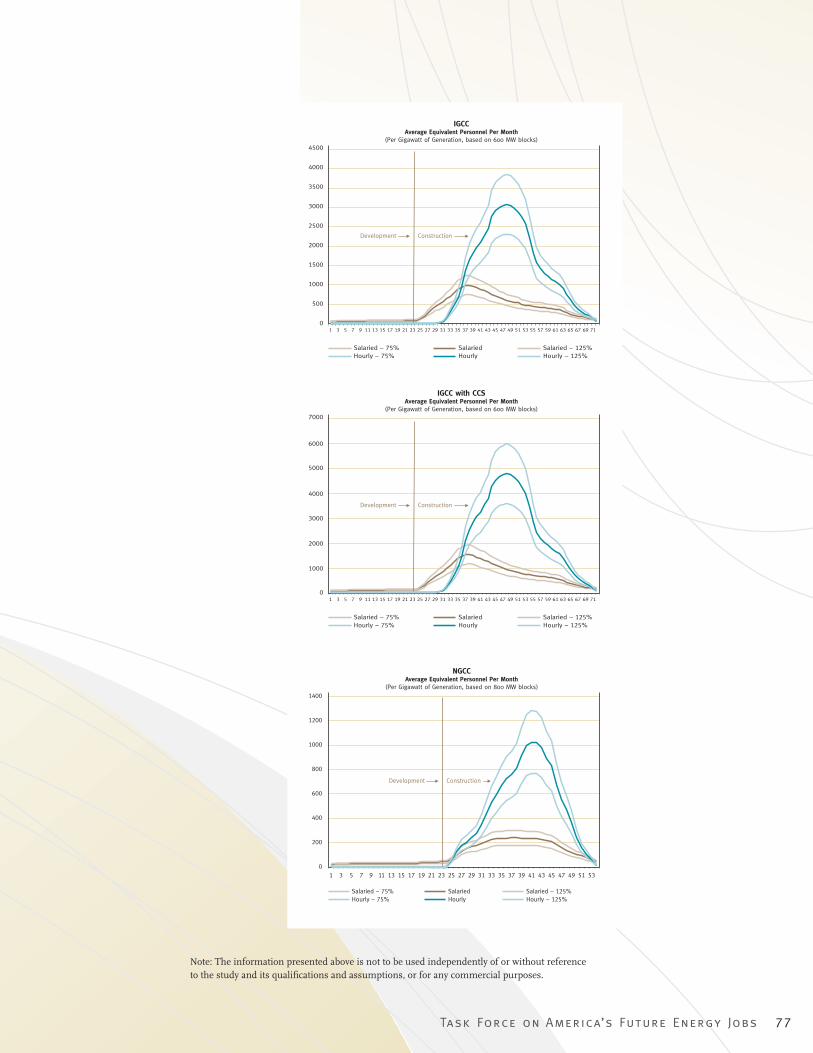
Task Force on America’s Future Energy Jobs 77
Note: The information presented above is not to be used independently of or without reference to the study and its qualifi cations and assumptions, or for any commercial purposes.
0
1000
2000
3000
4000
5000
6000
7000
1 3 5 7 9 11 13 15 17 19 21 23 25 27 29 31 33 35 37 39 41 43 45 47 49 51 53 55 57 59 61 63 65 67 69 71
IGCC with CCSAverage Equivalent Personnel Per Month
(Per Gigawatt of Generation, based on 600 MW blocks)
Salaried – 75% Salaried Salaried – 125%Hourly – 75% Hourly Hourly – 125%
Development Construction
NGCCAverage Equivalent Personnel Per Month
(Per Gigawatt of Generation, based on 800 MW blocks)
0
200
400
600
800
1000
1200
1400
1 3 5 7 9 11 13 15 17 19 21 23 25 27 29 31 33 35 37 39 41 43 45 47 49 51 53
Salaried – 75% Salaried Salaried – 125%Hourly – 75% Hourly Hourly – 125%
Development Construction
0
500
1000
1500
2000
2500
3000
3500
4000
4500
1 3 5 7 9 11 13 15 17 19 21 23 25 27 29 31 33 35 37 39 41 43 45 47 49 51 53 55 57 59 61 63 65 67 69 71
IGCCAverage Equivalent Personnel Per Month
(Per Gigawatt of Generation, based on 600 MW blocks)
Salaried – 75% Salaried Salaried – 125%Hourly – 75% Hourly Hourly – 125%
Development Construction
55627_P001_104.indd 7755627_P001_104.indd 77 8/13/09 8:04 AM8/13/09 8:04 AM
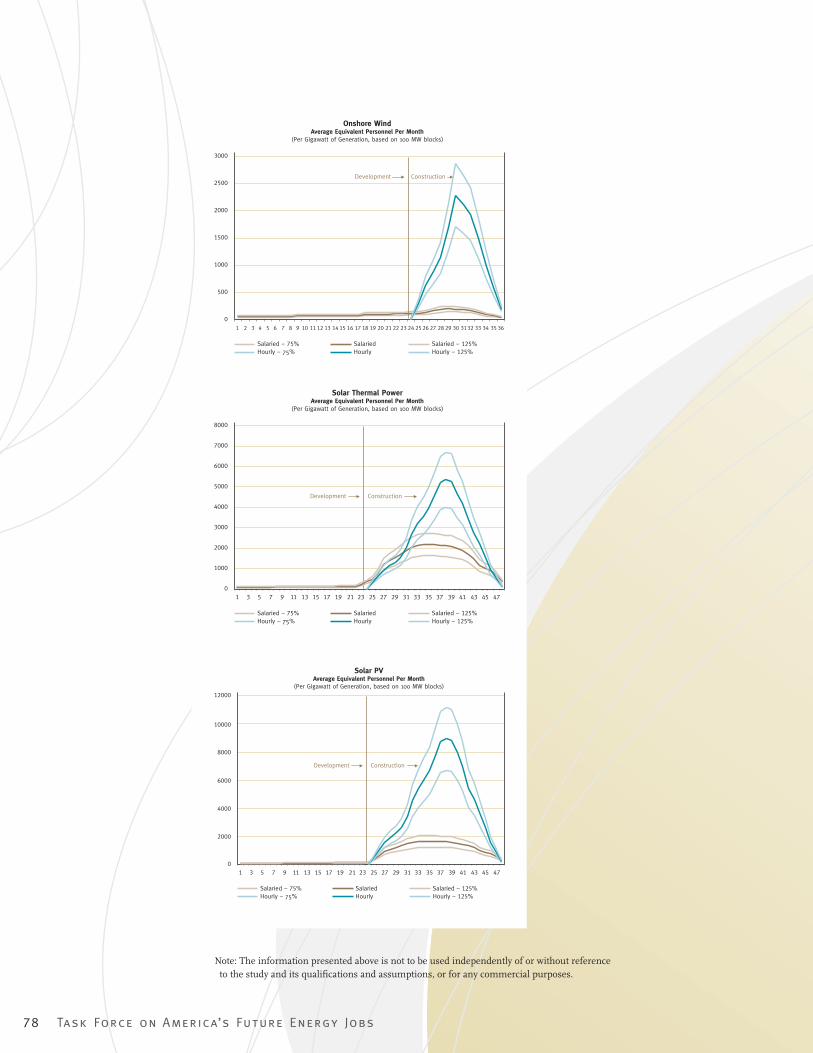
78 Task Force on America’s Future Energy Jobs
Note: The information presented above is not to be used independently of or without reference to the study and its qualifi cations and assumptions, or for any commercial purposes.
Solar Thermal PowerAverage Equivalent Personnel Per Month
(Per Gigawatt of Generation, based on 100 MW blocks)
0
2000
3000
1000
4000
5000
6000
7000
8000
1 3 5 7 9 11 13 15 17 19 21 23 25 27 29 31 33 35 37 39 41 43 45 47
Salaried – 75% Salaried Salaried – 125%Hourly – 75% Hourly Hourly – 125%
Development Construction
Onshore WindAverage Equivalent Personnel Per Month
(Per Gigawatt of Generation, based on 100 MW blocks)
0
1000
500
1500
2000
2500
3000
1 2 3 4 5 6 7 8 9 10 11 12 13 14 15 16 17 18 19 20 21 22 23 24 25 26 35 3627 28 29 30 3132 33 34
Salaried – 75% Salaried Salaried – 125%Hourly – 75% Hourly Hourly – 125%
Development Construction
Solar PVAverage Equivalent Personnel Per Month
(Per Gigawatt of Generation, based on 100 MW blocks)
0
2000
4000
6000
8000
10000
12000
1 3 5 7 9 11 13 15 17 19 21 23 25 27 29 31 33 35 37 39 41 43 45 47
Salaried – 75% Salaried Salaried – 125%Hourly – 75% Hourly Hourly – 125%
Development Construction
55627_P001_104.indd 7855627_P001_104.indd 78 8/13/09 8:04 AM8/13/09 8:04 AM
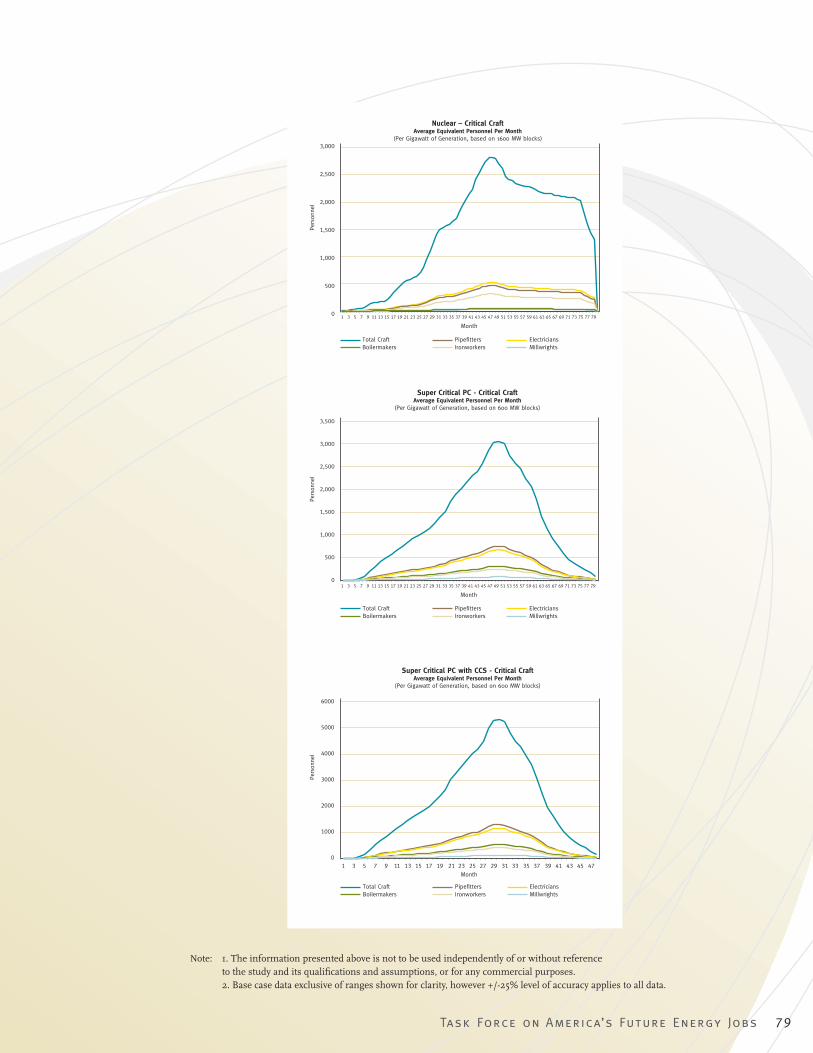
Task Force on America’s Future Energy Jobs 79
Note: 1. The information presented above is not to be used independently of or without reference to the study and its qualifi cations and assumptions, or for any commercial purposes.
2. Base case data exclusive of ranges shown for clarity, however +/-25% level of accuracy applies to all data.
0
500
1,000
1,500
2,000
2,500
3,000
1 3 5 7 9 11 13 15 17 19 21 23 25 27 29 31 33 35 37 39 41 43 45 47 49 51 53 55 57 59 61 63 65 67 69 71 73 75 77 79
Nuclear – Critical CraftAverage Equivalent Personnel Per Month
(Per Gigawatt of Generation, based on 1600 MW blocks)
Per
sonn
el
Month
MillwrightsIronworkersBoilermakersElectriciansPipefittersTotal Craft
0
2000
3000
1000
4000
5000
6000
1 3 5 7 9 11 13 15 17 19 21 23 25 27 29 31 33 35 37 39 41 43 45 47
Super Critical PC with CCS - Critical CraftAverage Equivalent Personnel Per Month
(Per Gigawatt of Generation, based on 600 MW blocks)
Pers
onne
l
Month
MillwrightsIronworkersBoilermakersElectriciansPipefittersTotal Craft
0
500
1,000
1,500
2,000
3,000
2,500
3,500
1 3 5 7 9 11 13 15 17 19 21 23 25 27 29 31 33 35 37 39 41 43 45 47 49 51 53 55 57 59 61 63 65 67 69 71 73 75 77 79
Super Critical PC - Critical CraftAverage Equivalent Personnel Per Month
(Per Gigawatt of Generation, based on 600 MW blocks)
Pers
onne
l
Month
MillwrightsIronworkersBoilermakersElectriciansPipefittersTotal Craft
55627_P001_104.indd 7955627_P001_104.indd 79 8/13/09 8:04 AM8/13/09 8:04 AM
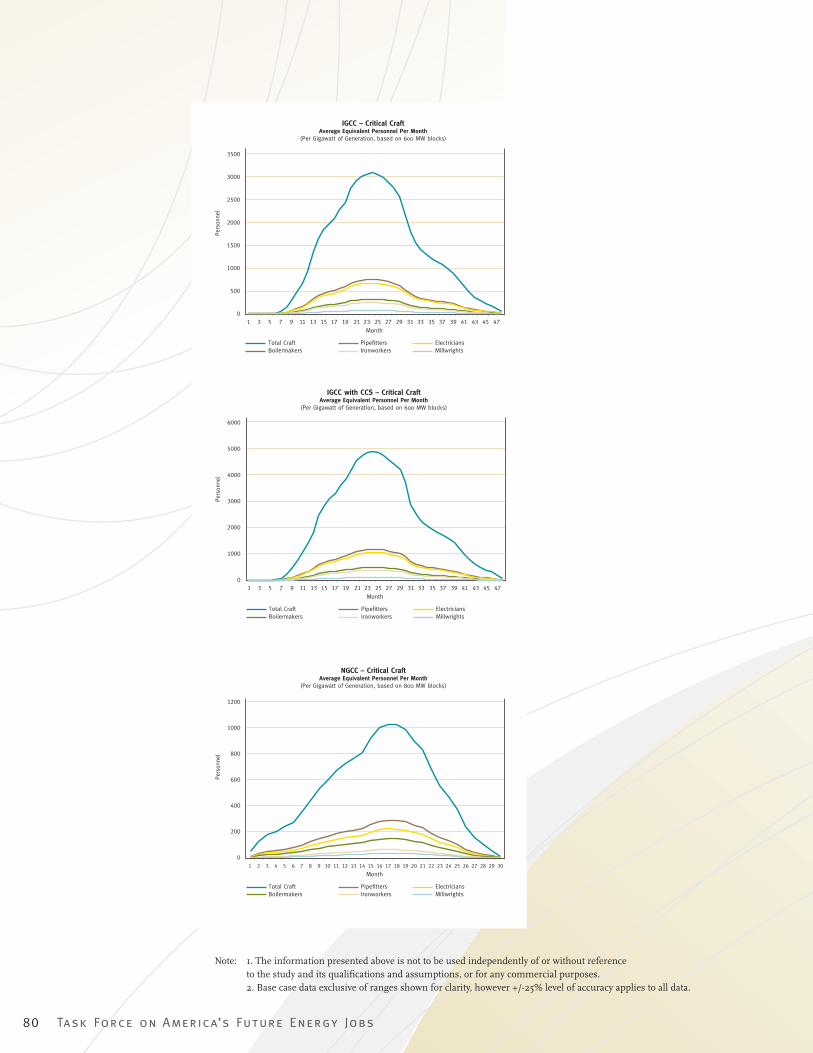
80 Task Force on America’s Future Energy Jobs
Note: 1. The information presented above is not to be used independently of or without reference to the study and its qualifi cations and assumptions, or for any commercial purposes.
2. Base case data exclusive of ranges shown for clarity, however +/-25% level of accuracy applies to all data.
0
500
1000
1500
2000
2500
3000
3500
IGCC – Critical CraftAverage Equivalent Personnel Per Month
(Per Gigawatt of Generation, based on 600 MW blocks)
1 3 5 7 9 11 13 15 17 19 21 23 25 27 29 31 33 35 37 39 41 43 45 47
Pers
onne
l
Month
MillwrightsIronworkersBoilermakersElectriciansPipefittersTotal Craft
0
1000
2000
3000
4000
5000
6000
IGCC with CCS – Critical CraftAverage Equivalent Personnel Per Month
(Per Gigawatt of Generation, based on 600 MW blocks)
1 3 5 7 9 11 13 15 17 19 21 23 25 27 29 31 33 35 37 39 41 43 45 47
Pers
onne
l
Month
MillwrightsIronworkersBoilermakersElectriciansPipefittersTotal Craft
0
200
400
600
800
1000
1200
NGCC – Critical CraftAverage Equivalent Personnel Per Month
(Per Gigawatt of Generation, based on 800 MW blocks)
Pers
onne
l
Month1 2 3 4 5 6 7 8 9 10 11 12 13 14 15 16 17 18 19 20 21 22 23 24 25 26 27 28 29 30
MillwrightsIronworkersBoilermakersElectriciansPipefittersTotal Craft
55627_P001_104.indd 8055627_P001_104.indd 80 8/13/09 8:04 AM8/13/09 8:04 AM
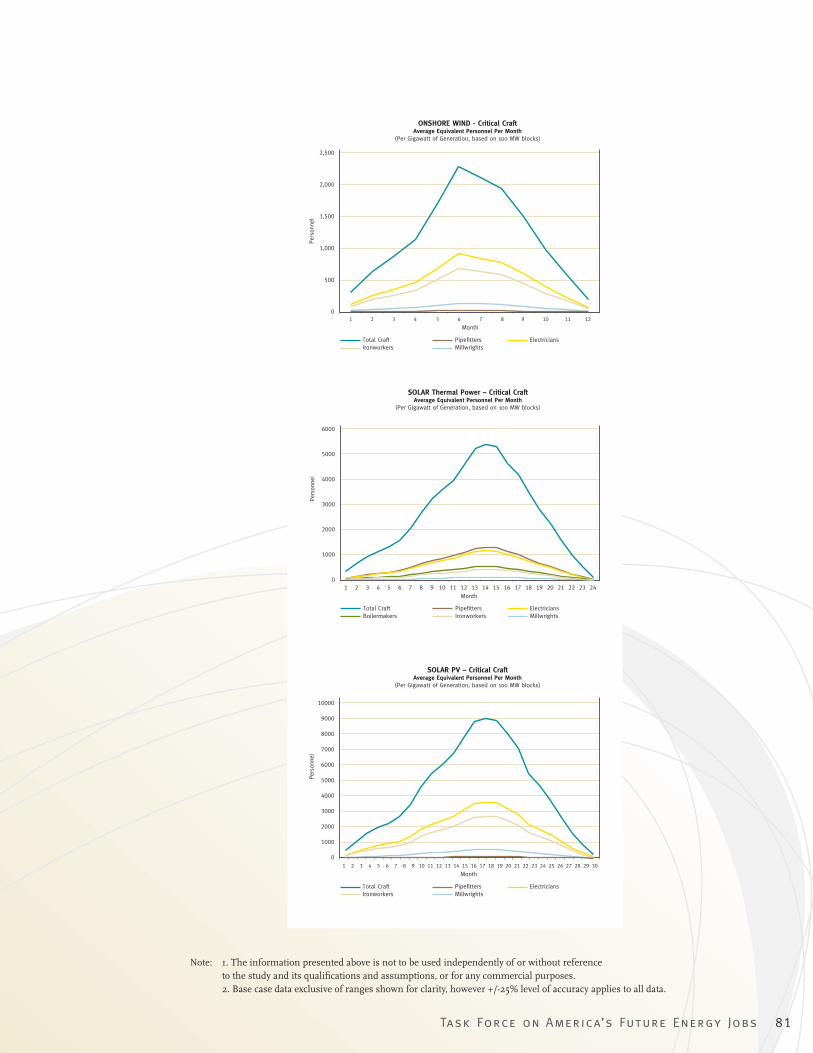
Task Force on America’s Future Energy Jobs 81
Note: 1. The information presented above is not to be used independently of or without reference to the study and its qualifi cations and assumptions, or for any commercial purposes.
2. Base case data exclusive of ranges shown for clarity, however +/-25% level of accuracy applies to all data.
0
500
1,000
1,500
2,000
2,500
ONSHORE WIND - Critical CraftAverage Equivalent Personnel Per Month
(Per Gigawatt of Generation, based on 100 MW blocks)
Pers
onne
l
Month1 2 3 4 5 6 7 8 9 10 11 12
MillwrightsIronworkersElectriciansPipefittersTotal Craft
0
1000
2000
3000
4000
5000
6000
SOLAR Thermal Power – Critical CraftAverage Equivalent Personnel Per Month
(Per Gigawatt of Generation, based on 100 MW blocks)
Pers
onne
l
Month1 2 3 4 5 6 7 8 9 10 11 12 13 14 15 16 17 18 19 20 21 22 23 24
MillwrightsIronworkersBoilermakersElectriciansPipefittersTotal Craft
0
1000
2000
3000
4000
5000
6000
7000
8000
10000
9000
SOLAR PV – Critical CraftAverage Equivalent Personnel Per Month
(Per Gigawatt of Generation, based on 100 MW blocks)
Pers
onne
l
Month1 2 3 4 5 6 7 8 9 10 11 12 13 14 15 16 17 18 19 20 21 22 23 24 25 26 27 28 29 30
MillwrightsIronworkersElectriciansPipefittersTotal Craft
55627_P001_104.indd 8155627_P001_104.indd 81 8/13/09 8:04 AM8/13/09 8:04 AM
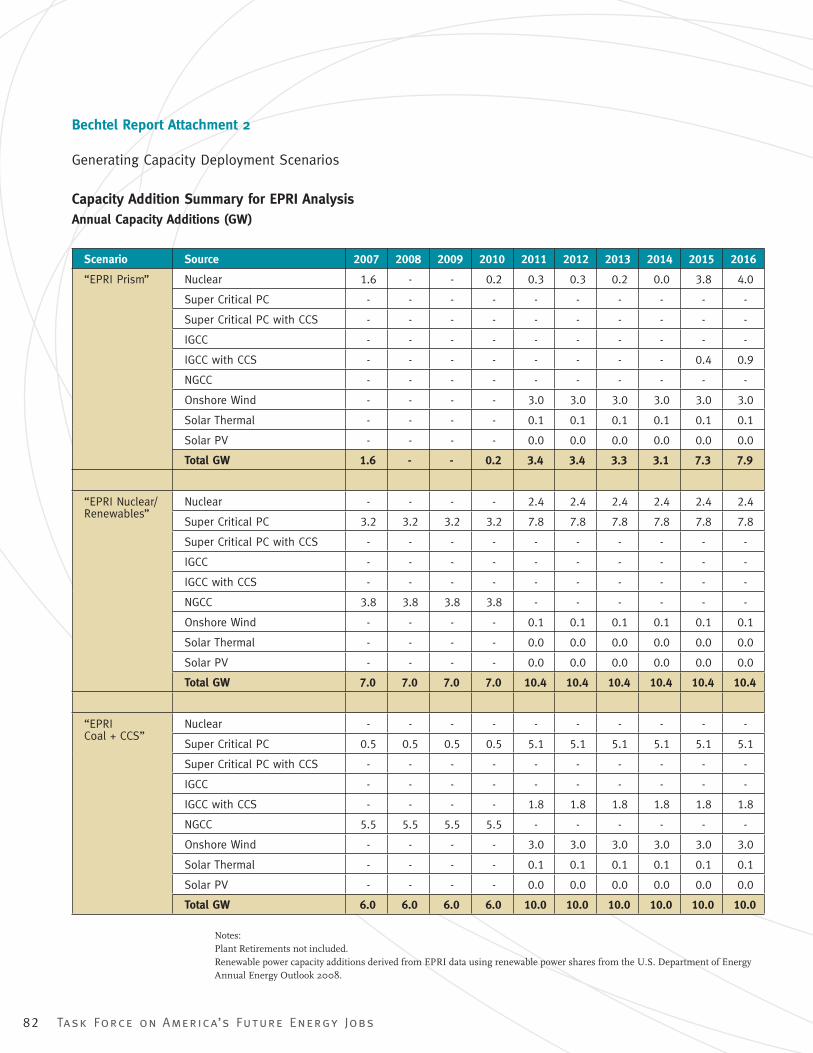
82 Task Force on America’s Future Energy Jobs
Notes:Plant Retirements not included.Renewable power capacity additions derived from EPRI data using renewable power shares from the U.S. Department of Energy Annual Energy Outlook 2008.
Bechtel Report Attachment 2
Generating Capacity Deployment Scenarios
Capacity Addition Summary for EPRI AnalysisAnnual Capacity Additions (GW)
Scenario Source 2007 2008 2009 2010 2011 2012 2013 2014 2015 2016
“EPRI Prism” Nuclear 1.6 - - 0.2 0.3 0.3 0.2 0.0 3.8 4.0
Super Critical PC - - - - - - - - - -
Super Critical PC with CCS - - - - - - - - - -
IGCC - - - - - - - - - -
IGCC with CCS - - - - - - - - 0.4 0.9
NGCC - - - - - - - - - -
Onshore Wind - - - - 3.0 3.0 3.0 3.0 3.0 3.0
Solar Thermal - - - - 0.1 0.1 0.1 0.1 0.1 0.1
Solar PV - - - - 0.0 0.0 0.0 0.0 0.0 0.0
Total GW 1.6 - - 0.2 3.4 3.4 3.3 3.1 7.3 7.9
“EPRI Nuclear/Renewables”
Nuclear - - - - 2.4 2.4 2.4 2.4 2.4 2.4
Super Critical PC 3.2 3.2 3.2 3.2 7.8 7.8 7.8 7.8 7.8 7.8
Super Critical PC with CCS - - - - - - - - - -
IGCC - - - - - - - - - -
IGCC with CCS - - - - - - - - - -
NGCC 3.8 3.8 3.8 3.8 - - - - - -
Onshore Wind - - - - 0.1 0.1 0.1 0.1 0.1 0.1
Solar Thermal - - - - 0.0 0.0 0.0 0.0 0.0 0.0
Solar PV - - - - 0.0 0.0 0.0 0.0 0.0 0.0
Total GW 7.0 7.0 7.0 7.0 10.4 10.4 10.4 10.4 10.4 10.4
“EPRICoal + CCS”
Nuclear - - - - - - - - - -
Super Critical PC 0.5 0.5 0.5 0.5 5.1 5.1 5.1 5.1 5.1 5.1
Super Critical PC with CCS - - - - - - - - - -
IGCC - - - - - - - - - -
IGCC with CCS - - - - 1.8 1.8 1.8 1.8 1.8 1.8
NGCC 5.5 5.5 5.5 5.5 - - - - - -
Onshore Wind - - - - 3.0 3.0 3.0 3.0 3.0 3.0
Solar Thermal - - - - 0.1 0.1 0.1 0.1 0.1 0.1
Solar PV - - - - 0.0 0.0 0.0 0.0 0.0 0.0
Total GW 6.0 6.0 6.0 6.0 10.0 10.0 10.0 10.0 10.0 10.0
55627_P001_104.indd 8255627_P001_104.indd 82 8/13/09 8:04 AM8/13/09 8:04 AM
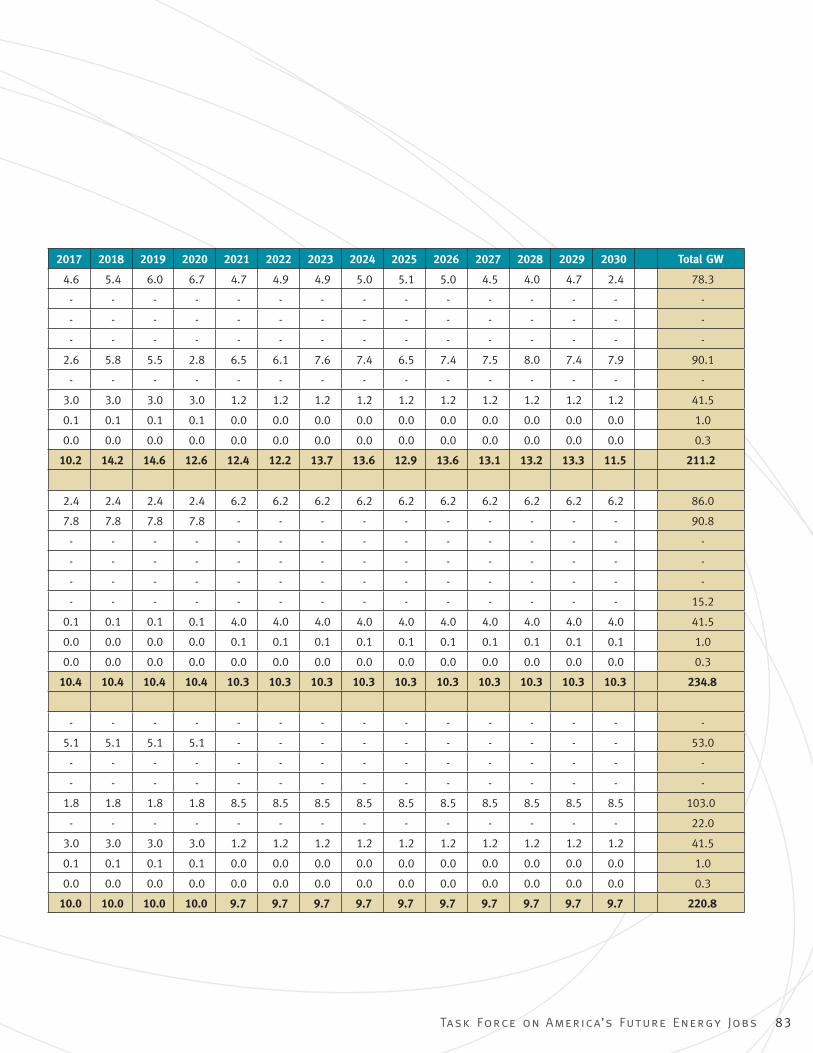
Task Force on America’s Future Energy Jobs 83
2017 2018 2019 2020 2021 2022 2023 2024 2025 2026 2027 2028 2029 2030 Total GW
4.6 5.4 6.0 6.7 4.7 4.9 4.9 5.0 5.1 5.0 4.5 4.0 4.7 2.4 78.3
- - - - - - - - - - - - - - -
- - - - - - - - - - - - - - -
- - - - - - - - - - - - - - -
2.6 5.8 5.5 2.8 6.5 6.1 7.6 7.4 6.5 7.4 7.5 8.0 7.4 7.9 90.1
- - - - - - - - - - - - - - -
3.0 3.0 3.0 3.0 1.2 1.2 1.2 1.2 1.2 1.2 1.2 1.2 1.2 1.2 41.5
0.1 0.1 0.1 0.1 0.0 0.0 0.0 0.0 0.0 0.0 0.0 0.0 0.0 0.0 1.0
0.0 0.0 0.0 0.0 0.0 0.0 0.0 0.0 0.0 0.0 0.0 0.0 0.0 0.0 0.3
10.2 14.2 14.6 12.6 12.4 12.2 13.7 13.6 12.9 13.6 13.1 13.2 13.3 11.5 211.2
2.4 2.4 2.4 2.4 6.2 6.2 6.2 6.2 6.2 6.2 6.2 6.2 6.2 6.2 86.0
7.8 7.8 7.8 7.8 - - - - - - - - - - 90.8
- - - - - - - - - - - - - - -
- - - - - - - - - - - - - - -
- - - - - - - - - - - - - - -
- - - - - - - - - - - - - - 15.2
0.1 0.1 0.1 0.1 4.0 4.0 4.0 4.0 4.0 4.0 4.0 4.0 4.0 4.0 41.5
0.0 0.0 0.0 0.0 0.1 0.1 0.1 0.1 0.1 0.1 0.1 0.1 0.1 0.1 1.0
0.0 0.0 0.0 0.0 0.0 0.0 0.0 0.0 0.0 0.0 0.0 0.0 0.0 0.0 0.3
10.4 10.4 10.4 10.4 10.3 10.3 10.3 10.3 10.3 10.3 10.3 10.3 10.3 10.3 234.8
- - - - - - - - - - - - - - -
5.1 5.1 5.1 5.1 - - - - - - - - - - 53.0
- - - - - - - - - - - - - - -
- - - - - - - - - - - - - - -
1.8 1.8 1.8 1.8 8.5 8.5 8.5 8.5 8.5 8.5 8.5 8.5 8.5 8.5 103.0
- - - - - - - - - - - - - - 22.0
3.0 3.0 3.0 3.0 1.2 1.2 1.2 1.2 1.2 1.2 1.2 1.2 1.2 1.2 41.5
0.1 0.1 0.1 0.1 0.0 0.0 0.0 0.0 0.0 0.0 0.0 0.0 0.0 0.0 1.0
0.0 0.0 0.0 0.0 0.0 0.0 0.0 0.0 0.0 0.0 0.0 0.0 0.0 0.0 0.3
10.0 10.0 10.0 10.0 9.7 9.7 9.7 9.7 9.7 9.7 9.7 9.7 9.7 9.7 220.8
55627_P001_104.indd 8355627_P001_104.indd 83 8/13/09 8:04 AM8/13/09 8:04 AM
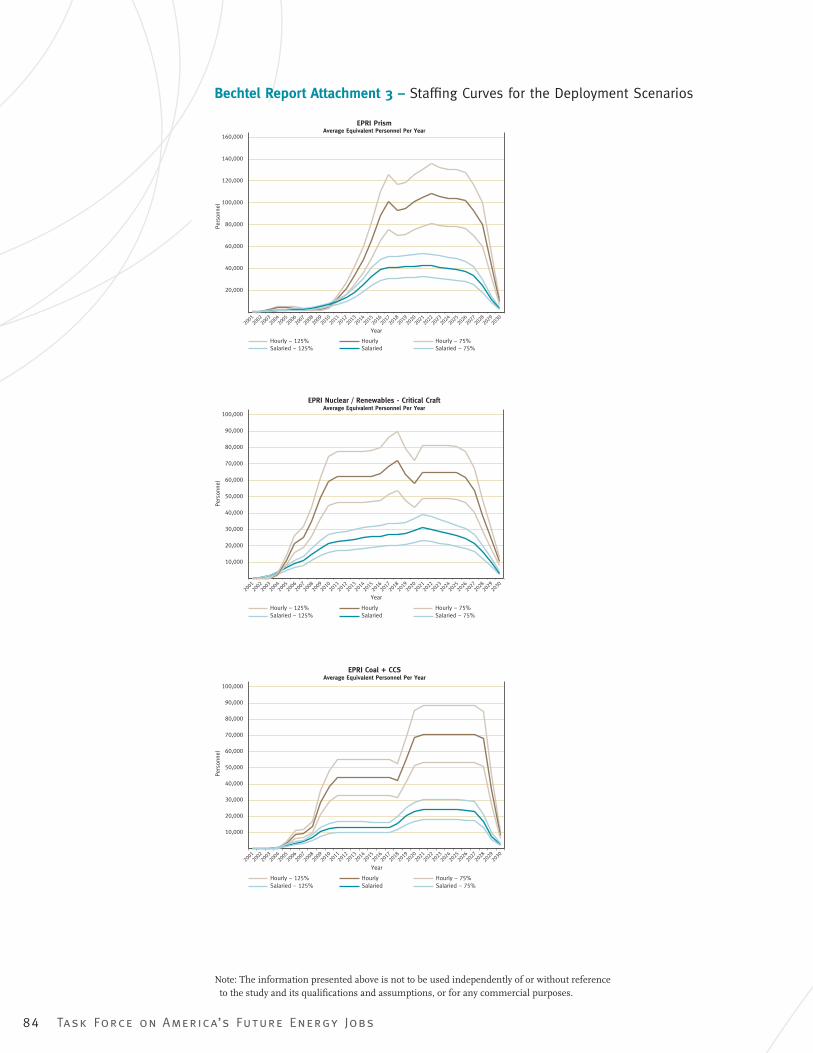
84 Task Force on America’s Future Energy Jobs
Note: The information presented above is not to be used independently of or without reference to the study and its qualifi cations and assumptions, or for any commercial purposes.
Bechtel Report Attachment 3 – Staffi ng Curves for the Deployment Scenarios
20,000
40,000
60,000
80,000
160,000
140,000
120,000
100,000
EPRI PrismAverage Equivalent Personnel Per Year
Year20
0120
0220
0320
0420
0520
0620
0720
0820
0920
1020
1120
1220
1320
1420
1520
1620
1720
1820
1920
2020
2120
2220
2320
2420
2520
2620
2720
2820
2920
30
Salaried – 75%SalariedSalaried – 125%Hourly – 75%HourlyHourly – 125%
Pers
onne
l
10,000
20,000
30,000
40,000
50,000
60,000
100,000
90,000
80,000
70,000
EPRI Nuclear / Renewables - Critical CraftAverage Equivalent Personnel Per Year
Year
Per
sonn
el
2001
2002
2003
2004
2005
2006
2007
2008
2009
2010
2011
2012
2013
2014
2015
2016
2017
2018
2019
2020
2021
2022
2023
2024
2025
2026
2027
2028
2029
2030
Salaried – 75%SalariedSalaried – 125%Hourly – 75%HourlyHourly – 125%
10,000
20,000
30,000
40,000
50,000
60,000
80,000
100,000
70,000
90,000
EPRI Coal + CCSAverage Equivalent Personnel Per Year
Salaried – 75%SalariedSalaried – 125%Hourly – 75%HourlyHourly – 125%
Year
Per
sonn
el
2001
2002
2003
2004
2005
2006
2007
2008
2009
2010
2011
2012
2013
2014
2015
2016
2017
2018
2019
2020
2021
2022
2023
2024
2025
2026
2027
2028
2029
2030
55627_P001_104.indd 8455627_P001_104.indd 84 8/13/09 8:04 AM8/13/09 8:04 AM
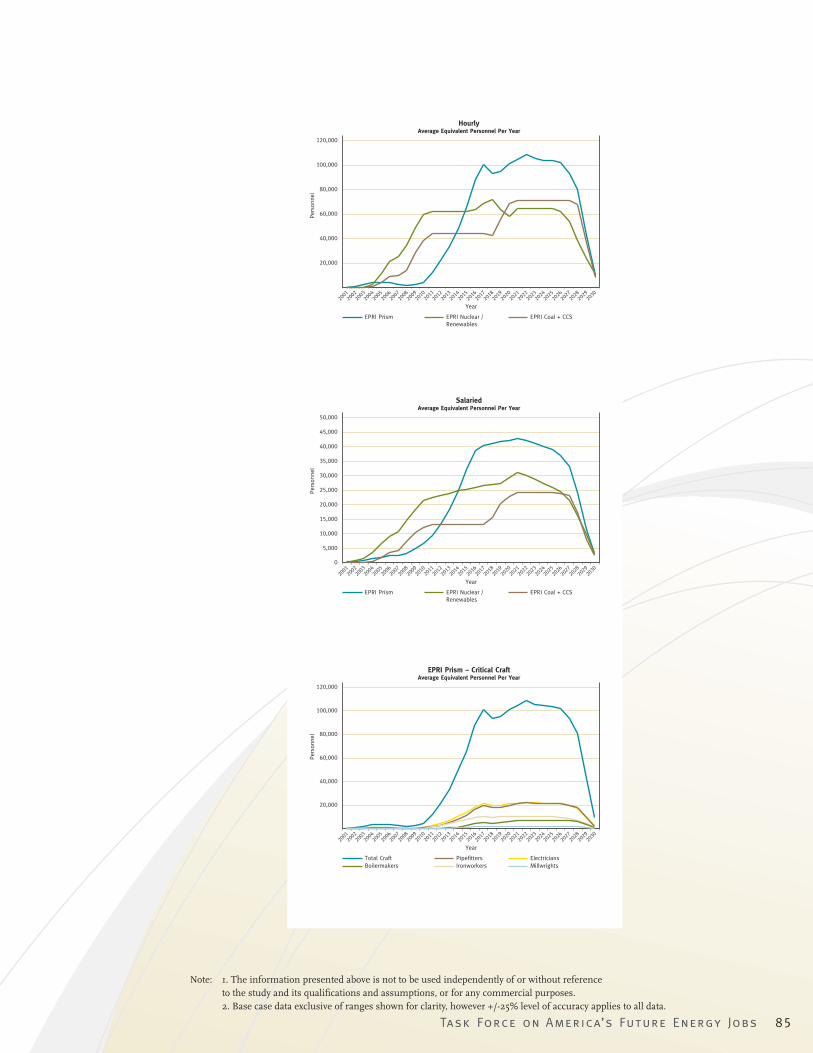
Task Force on America’s Future Energy Jobs 85
Note: 1. The information presented above is not to be used independently of or without reference to the study and its qualifi cations and assumptions, or for any commercial purposes.
2. Base case data exclusive of ranges shown for clarity, however +/-25% level of accuracy applies to all data.
5,000
0
20,000
15,000
10,000
25,000
35,000
30,000
50,000
45,000
40,000
SalariedAverage Equivalent Personnel Per Year
Year20
0120
0220
0320
0420
0520
0620
0720
0820
0920
1020
1120
1220
1320
1420
1520
1620
1720
1820
1920
2020
2120
2220
2320
2420
2520
2620
2720
2820
2920
30
Per
sonn
el
EPRI Coal + CCSEPRI Nuclear / Renewables
EPRI Prism
20,000
40,000
60,000
80,000
120,000
100,000
EPRI Prism – Critical CraftAverage Equivalent Personnel Per Year
Year20
0120
0220
0320
0420
0520
0620
0720
0820
0920
1020
1120
1220
1320
1420
1520
1620
1720
1820
1920
2020
2120
2220
2320
2420
2520
2620
2720
2820
2920
30
Per
sonn
el
MillwrightsIronworkersBoilermakersElectriciansPipefittersTotal Craft
20,000
40,000
60,000
80,000
120,000
100,000
HourlyAverage Equivalent Personnel Per Year
Year20
0120
0220
0320
0420
0520
0620
0720
0820
0920
1020
1120
1220
1320
1420
1520
1620
1720
1820
1920
2020
2120
2220
2320
2420
2520
2620
2720
2820
2920
30
Per
sonn
elEPRI Coal + CCSEPRI Nuclear /
RenewablesEPRI Prism
55627_P001_104.indd 8555627_P001_104.indd 85 8/13/09 8:04 AM8/13/09 8:04 AM
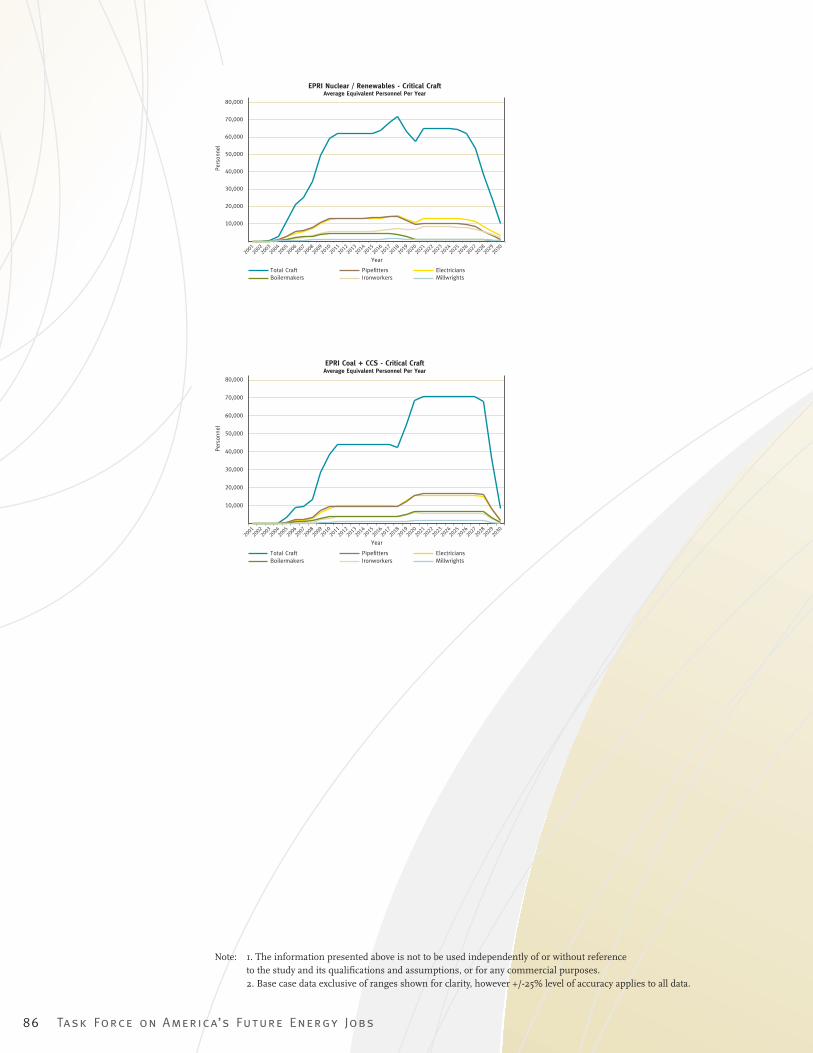
86 Task Force on America’s Future Energy Jobs
Note: 1. The information presented above is not to be used independently of or without reference to the study and its qualifi cations and assumptions, or for any commercial purposes.
2. Base case data exclusive of ranges shown for clarity, however +/-25% level of accuracy applies to all data.
10,000
20,000
30,000
40,000
50,000
60,000
80,000
70,000
EPRI Nuclear / Renewables - Critical CraftAverage Equivalent Personnel Per Year
Year
Pers
onne
l
2001
2002
2003
2004
2005
2006
2007
2008
2009
2010
2011
2012
2013
2014
2015
2016
2017
2018
2019
2020
2021
2022
2023
2024
2025
2026
2027
2028
2029
2030
MillwrightsIronworkersBoilermakersElectriciansPipefittersTotal Craft
10,000
20,000
30,000
40,000
50,000
60,000
80,000
70,000
EPRI Coal + CCS - Critical CraftAverage Equivalent Personnel Per Year
Year
Per
sonn
el
2001
2002
2003
2004
2005
2006
2007
2008
2009
2010
2011
2012
2013
2014
2015
2016
2017
2018
2019
2020
2021
2022
2023
2024
2025
2026
2027
2028
2029
2030
MillwrightsIronworkersBoilermakersElectriciansPipefittersTotal Craft
55627_P001_104_X.indd 8655627_P001_104_X.indd 86 8/20/09 3:34 PM8/20/09 3:34 PM

Task Force on America’s Future Energy Jobs 87
55627_P001_104.indd 8755627_P001_104.indd 87 8/13/09 8:04 AM8/13/09 8:04 AM
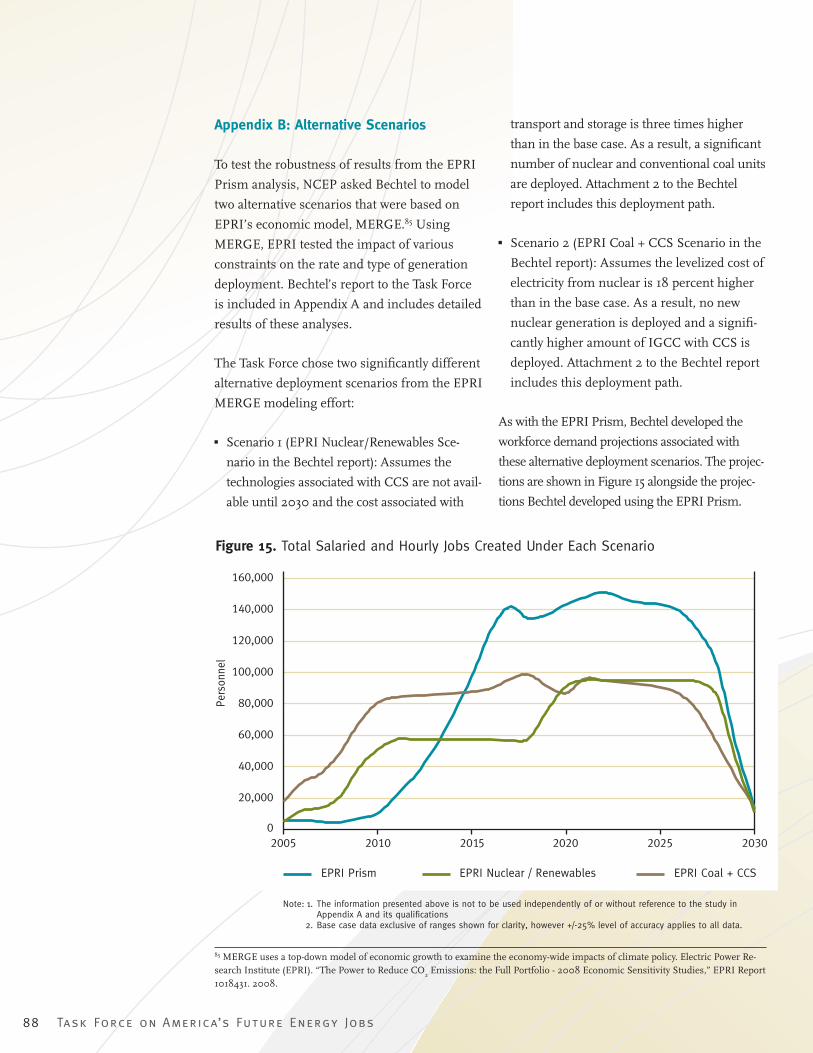
88 Task Force on America’s Future Energy Jobs
85 MERGE uses a top-down model of economic growth to examine the economy-wide impacts of climate policy. Electric Power Re-search Institute (EPRI). “The Power to Reduce CO
2 Emissions: the Full Portfolio - 2008 Economic Sensitivity Studies,” EPRI Report
1018431. 2008.
Appendix B: Alternative Scenarios
To test the robustness of results from the EPRI
Prism analysis, NCEP asked Bechtel to model
two alternative scenarios that were based on
EPRI’s economic model, MERGE.85 Using
MERGE, EPRI tested the impact of various
constraints on the rate and type of generation
deployment. Bechtel’s report to the Task Force
is included in Appendix A and includes detailed
results of these analyses.
The Task Force chose two signifi cantly different
alternative deployment scenarios from the EPRI
MERGE modeling effort:
� Scenario 1 (EPRI Nuclear/Renewables Sce-
nario in the Bechtel report): Assumes the
technologies associated with CCS are not avail-
able until 2030 and the cost associated with
transport and storage is three times higher
than in the base case. As a result, a signifi cant
number of nuclear and conventional coal units
are deployed. Attachment 2 to the Bechtel
report includes this deployment path.
� Scenario 2 (EPRI Coal + CCS Scenario in the
Bechtel report): Assumes the levelized cost of
electricity from nuclear is 18 percent higher
than in the base case. As a result, no new
nuclear generation is deployed and a signifi -
cantly higher amount of IGCC with CCS is
deployed. Attachment 2 to the Bechtel report
includes this deployment path.
As with the EPRI Prism, Bechtel developed the
workforce demand projections associated with
these alternative deployment scenarios. The projec-
tions are shown in Figure 15 alongside the projec-
tions Bechtel developed using the EPRI Prism.
0
20,000
40,000
60,000
80,000
100,000
120,000
140,000
160,000
2005 2010 2015 2020 2025 2030
Pers
onne
l
EPRI Prism EPRI Nuclear / Renewables EPRI Coal + CCS
Note: 1. The information presented above is not to be used independently of or without reference to the study in Appendix A and its qualifications 2. Base case data exclusive of ranges shown for clarity, however +/-25% level of accuracy applies to all data.
Figure 15. Total Salaried and Hourly Jobs Created Under Each Scenario
55627_P001_104.indd 8855627_P001_104.indd 88 8/13/09 8:04 AM8/13/09 8:04 AM
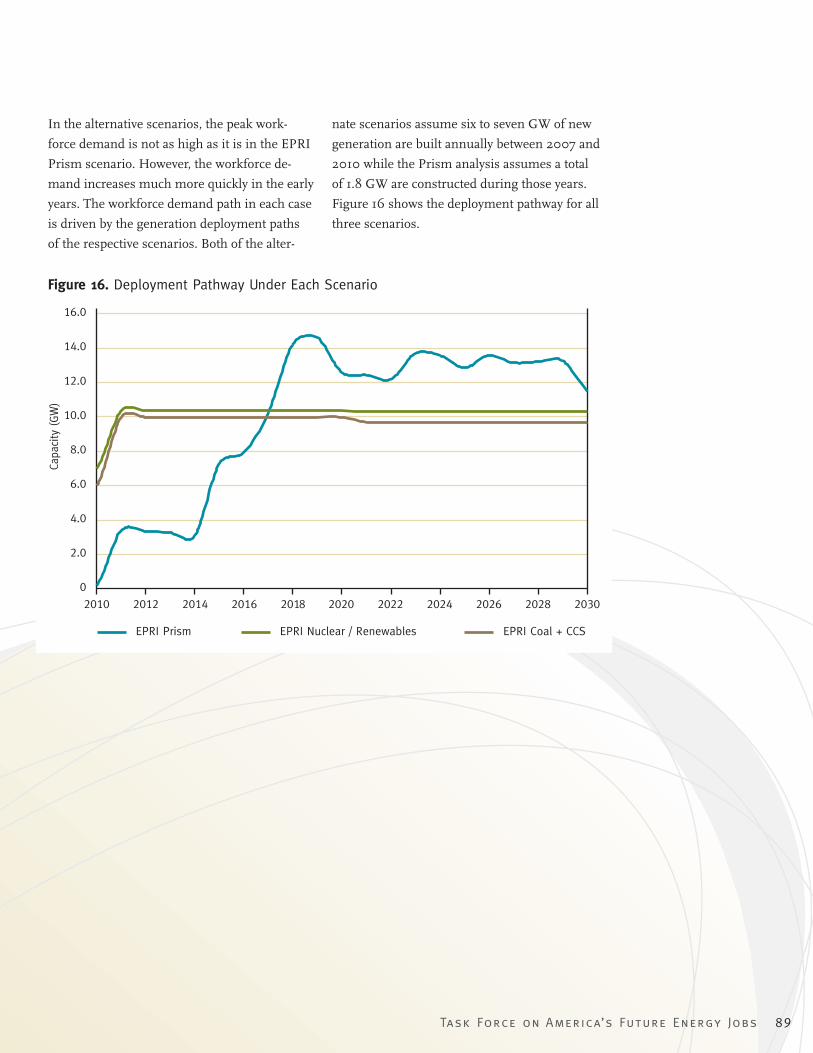
Task Force on America’s Future Energy Jobs 89
In the alternative scenarios, the peak work-
force demand is not as high as it is in the EPRI
Prism scenario. However, the workforce de-
mand increases much more quickly in the early
years. The workforce demand path in each case
is driven by the generation deployment paths
of the respective scenarios. Both of the alter-
nate scenarios assume six to seven GW of new
generation are built annually between 2007 and
2010 while the Prism analysis assumes a total
of 1.8 GW are constructed during those years.
Figure 16 shows the deployment pathway for all
three scenarios.
0
2.0
4.0
6.0
8.0
10.0
12.0
14.0
16.0
2010 2012 2014 2016 2018 2020 2022 2024 2026 2028 2030
Capa
city
(GW
)
EPRI Prism EPRI Nuclear / Renewables EPRI Coal + CCS
Figure 16. Deployment Pathway Under Each Scenario
55627_P001_104.indd 8955627_P001_104.indd 89 8/13/09 8:04 AM8/13/09 8:04 AM
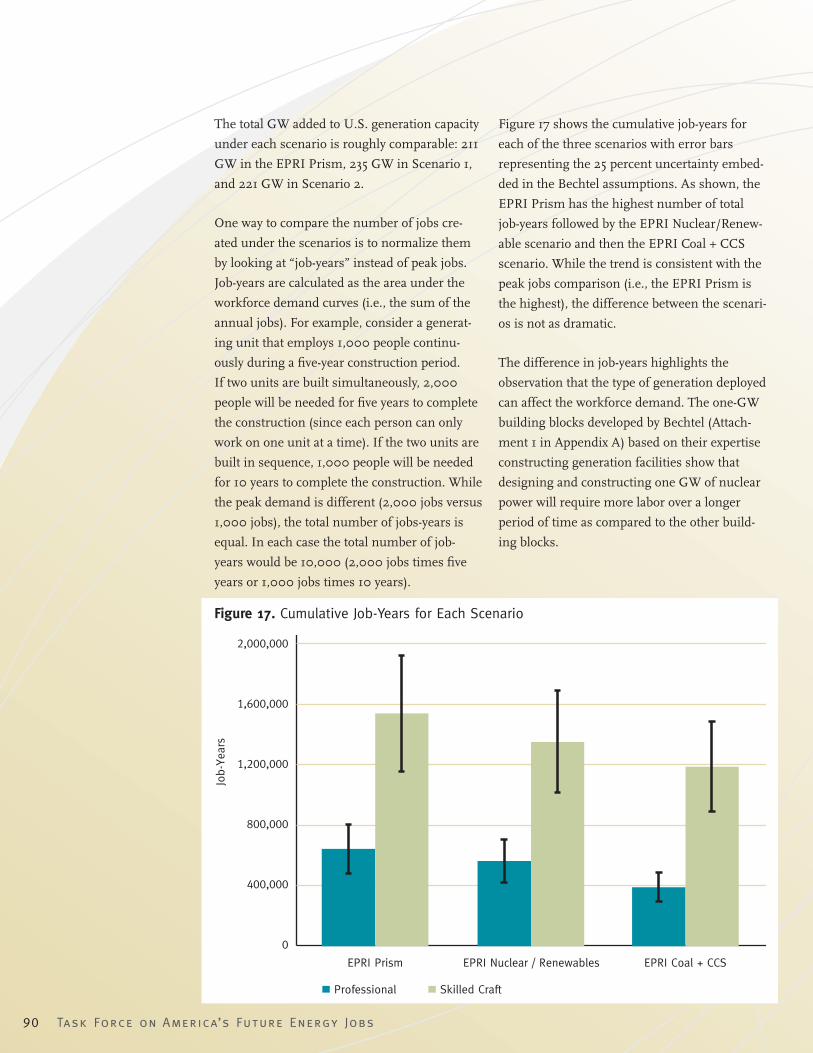
90 Task Force on America’s Future Energy Jobs
The total GW added to U.S. generation capacity
under each scenario is roughly comparable: 211
GW in the EPRI Prism, 235 GW in Scenario 1,
and 221 GW in Scenario 2.
One way to compare the number of jobs cre-
ated under the scenarios is to normalize them
by looking at “job-years” instead of peak jobs.
Job-years are calculated as the area under the
workforce demand curves (i.e., the sum of the
annual jobs). For example, consider a generat-
ing unit that employs 1,000 people continu-
ously during a fi ve-year construction period.
If two units are built simultaneously, 2,000
people will be needed for fi ve years to complete
the construction (since each person can only
work on one unit at a time). If the two units are
built in sequence, 1,000 people will be needed
for 10 years to complete the construction. While
the peak demand is different (2,000 jobs versus
1,000 jobs), the total number of jobs-years is
equal. In each case the total number of job-
years would be 10,000 (2,000 jobs times fi ve
years or 1,000 jobs times 10 years).
Figure 17 shows the cumulative job-years for
each of the three scenarios with error bars
representing the 25 percent uncertainty embed-
ded in the Bechtel assumptions. As shown, the
EPRI Prism has the highest number of total
job-years followed by the EPRI Nuclear/Renew-
able scenario and then the EPRI Coal + CCS
scenario. While the trend is consistent with the
peak jobs comparison (i.e., the EPRI Prism is
the highest), the difference between the scenari-
os is not as dramatic.
The difference in job-years highlights the
observation that the type of generation deployed
can affect the workforce demand. The one-GW
building blocks developed by Bechtel (Attach-
ment 1 in Appendix A) based on their expertise
constructing generation facilities show that
designing and constructing one GW of nuclear
power will require more labor over a longer
period of time as compared to the other build-
ing blocks.
0
400,000
800,000
1,200,000
1,600,000
2,000,000
EPRI Prism EPRI Nuclear / Renewables EPRI Coal + CCS
Job-
Year
s
Professional Skilled Craft
Figure 17. Cumulative Job-Years for Each Scenario
55627_P001_104.indd 9055627_P001_104.indd 90 8/13/09 8:04 AM8/13/09 8:04 AM

Task Force on America’s Future Energy Jobs 91
The Task Force wanted to assess the impact
of the different scenarios on the demand for
the critical skilled crafts identifi ed by Bechtel.
Figure 18 compares the demand for the vari-
ous critical crafts under each of the different
scenarios in job-years.
0
200,000
400,000
600,000
800,000
1,000,000
Job-
Year
s
Millwrights
Ironworkers
Boilermakers
Electricians
Pipefitters
EPRI Prism EPRI Nuclear/Renewable EPRI Coal + CCS
Figure 18. Critical Craft Workforce Composition under Modeled Scenarios
55627_P001_104.indd 9155627_P001_104.indd 91 8/13/09 8:04 AM8/13/09 8:04 AM
92 Task Force on America’s Future Energy Jobs
Appendix C: Coordinated Training Program Case Studies
The NCEP Task Force on America’s Future
Energy Jobs discussed the need to improve
or reestablish the training pipeline for skilled
workers in the electricity generation sector.
After reviewing a number of local and regional
examples of coordinated training programs, the
Task Force chose three examples to study fur-
ther. The three programs, sponsored by Centra-
lia College, IBEW, and PG&E, respectively, are:
- Washington State Center of Excellence for
Energy Technology, Centralia College,
- IBEW Regional Training Centers, and
- PG&E PowerPathwayTM.
Brief program summaries and key fi ndings are
summarized below. In general, the key points
shared across these three successful programs
were
1. participation by multiple stakeholders
(e.g., industry, academia, labor, and com-
munity groups),
2. the importance of national or regional
standards, and
3. a long-term approach by stakeholders,
funders, and students.
The Task Force’s Policy Recommendation 1
is a direct result of lessons learned in these
programs. These programs also informed our
understanding of multi-stakeholder programs
generally, and contributed to several other rec-
ommendations.
Case Study A: Washington State Center of Excellence for Energy Technology, Centralia College
In response to a lack of strategic policy co-
ordination between the state’s educational
centers, Washington State developed a network
of Centers of Excellence to serve as points of
contact and resource hubs for industry trends.
The distributed and duplicative nature of many
in-demand fi elds (for example, nursing/health
care, energy) prompted the state Board of Edu-
cation to call for one central program of study
with common course numbering, which would
enable credit transfer and standardization of
programs, with associated reduced administra-
tive costs and content certainty. Each Center
focuses on a targeted industry considered
important to the state’s economy and intends to
create fast, fl exible, quality education and train-
ing programs. The Washington State Board of
Community and Technical Colleges designated
Centralia College a Center of Excellence for En-
ergy Technology in 2004. The Center serves as
a statewide resource hub for students seeking
training for a career in the energy industry.
Role of the Center of Excellence for Energy
Technology
As a Center of Excellence, Centralia College
serves as a point-of-contact and resource hub
for industry trends, best practices, innovative
curricula, and professional development oppor-
tunities. The objective is to maximize resources
by bringing together workforce education and
industry partners in order to develop highly-
skilled employees for targeted industries.
The Center also:
- Maintains an institutional reputation for
innovation and responsive education and
training delivery to the energy industry.
- Acts as a broker of information and
resources related to the energy industry
for industry representatives, community-
based organizations, economic develop-
ment organizations, community and
technical colleges, secondary education
55627_P001_104.indd 9255627_P001_104.indd 92 8/13/09 8:04 AM8/13/09 8:04 AM

Task Force on America’s Future Energy Jobs 93
institutions, and four-year colleges and
universities.
- Translates industry research into best
practices.
- Provides system coordination, coach-
ing, and mentoring to assist in building
statewide seamless educational and work-
related systems.
- Builds a competitive workforce for the
energy industry in Washington.
Industry Partners
- Avista
- Bonneville Power Administration
- Bureau of Reclamation, Grand Coulee
Dam
- Centralia City Light
- Energy Northwest
- Grays Harbor County Public Utility Dis-
trict (PUD)
- Hampton Lumber
- Lewis County PUD
- Mid Columbia PUDs (Chelan PUD, Doug-
las County PUD, Grant PUD)
- North West Public Power Association
- Pacifi Corp
- Portland General Electric
- Puget Sound Energy
- Seattle City Light
- Seattle Steam
- Tacoma Power
- TransAlta Centralia Power
Labor Partners
Community college programs are considered
pre-apprenticeship, and labor representatives
play an advisory role in each program. Labor
partners include:
- IBEW Local #77
- IBEW Local #125
- Washington State Labor Council
Initial Lessons
The Task Force identifi ed territorialism among
community colleges and policy and market
uncertainty as the key challenges to program
development. Elements of the Centers of Excel-
lence models critical to success have included
support from the state board of education;
ownership of the initiative by stakeholders
including educators, industry representatives,
and union representatives; and pathways for
communication between stakeholders.
Case Study B: IBEW Regional Training Centers
The International Brotherhood of Electrical
Workers (IBEW) signed an agreement with
electric power leaders in January 2009 to de-
velop a training trust to support multiple IBEW
regional electric power training centers across
the United States. The goal of the program is to
partner with electric power companies to train
a new generation of workers. The training cen-
ters will offer hands-on training for potential
electric power employees.
Program Components
The IBEW regional training centers provide a
centralized location for electric power workers
to learn skills necessary to future employment
in the electric power industry. One of the core
offerings of the program is an eight-week “boot
camp” to provide foundational training for a
variety of potential electric power employment
paths (i.e., operators, linemen, etc.). The boot
55627_P001_104.indd 9355627_P001_104.indd 93 8/13/09 8:04 AM8/13/09 8:04 AM

94 Task Force on America’s Future Energy Jobs
camp is designed to address remedial educa-
tion, drug testing, and basic electric power
skills (e.g., climbing a pole for lineworkers or
time inside a power plant).
The boot camp also screens potential workers
and prepares them for industry pre-employ-
ment tests such as the Edison Electric Insti-
tute’s Construction and Skilled Trades Selection
System (CAST). CAST is a battery of aptitude
tests designed to aid in the selection of candi-
dates for diverse construction and skilled trades
occupations. CAST aims to predict candidates’
probability of success in the following catego-
ries of construction and skilled trade jobs:
1. Transmission and Distribution
2. Power Generation
3. Facilities and Repair
4. Other Facilities (e.g., Carpentry)
5. Electrical Repair
6. Machining and Vehicle Repair
7. Meter Service and Repair
Utility Partners
The IBEW is currently working to develop re-
gional training centers with the following utility
partners:
- Kansas City Power and Light (Missouri)
- DTE Energy (Detroit)
- Tucson Electric (Arizona)
The IBEW is currently working to identify sites
for additional centers in the southeast, the
northeast, the northwest, and Texas. Once the
centers are established, the IBEW envisions
them as being regional resources utilized by
a range of stakeholders. Toward this goal, the
Kansas site is developing a mobile training
trailer to enable training in rural areas.
Initial Lessons
There is tension between the effi ciencies of
developing regional training centers and chal-
lenges of recruiting a workforce locally. Task
Force participants suggested pairing regional
training centers that offered capital-intensive
training elements (e.g., hands-on lineworker
training components) with localized classroom-
based training (e.g., basic skills, electricity
basics). Classroom-based skills would benefi t
from integration with local community colleges
and CBOs. Additionally, technical training cen-
ters could develop mobile classrooms to bring
some skills training to community colleges or
community-based training centers.
The Task Force believes that developing na-
tional skill standards and providing funding to
students are important parts of a strategy for
training the workforce. National skill stan-
dards could increase portability of credits and
certifi cations from school to school, company
to company, and state to state. In addition to
portability concerns, a major barrier remains
funding. Many students are reluctant to un-
dertake adequate training programs without
an employment guarantee; similarly, employ-
ers are reluctant to offer employment guar-
antees before course completion. One option
discussed was potentially pooling employer
resources to ensure a greater pool of available
jobs. Additionally, national skills standards may
alleviate some risk as students would be guar-
anteed a widely-recognized certifi cation upon
successful completion (similar to a degree that
is recognized nationwide) and employers would
be guaranteed what skills successful students
mastered.
55627_P001_104.indd 9455627_P001_104.indd 94 8/13/09 8:04 AM8/13/09 8:04 AM
Task Force on America’s Future Energy Jobs 95
Case Study C: PG&E PowerPathwayTM
The PowerPathwayTM program, offered at com-
munity colleges throughout California, trains
and prepares individuals for high-demand posi-
tions at PG&E and throughout the energy sector.
In addition to one- and two-year curricula at
selected institutions, individuals may participate
in a customized short-term course designed to
strengthen their candidacy for employment and
their knowledge of the industry.
Benefi ts of PG&E PowerPathwayTM Program for
Participants
PowerPathwayTM helps individuals better pre-
pare for employment at PG&E and other high-
growth energy sector jobs. The coursework
covers a range of topics, including technical
skills, industry knowledge, pre-employment test
preparation, soft skills, physical conditioning,
and interview and resume preparation. With
the support of state, federal, and foundation
grants, most course tuition is covered; however,
individuals are not paid while in the program
and there is no guarantee of employment to
participants.
There are three types of PG&E PowerPathwayTM
programs:
- Bridge (a standalone course usually 10-16
weeks in length).
- Endorsed Program (a community college
certifi cate or associates degree program
that is 1- or 2-years in length).
- Capstone (additional coursework for stu-
dents who have completed a prerequisite
associates degree or certifi cate).
Benefi ts of PG&E PowerPathwayTM Program
For PG&E
PowerPathwayTM graduates qualify at an
unprecedented level on PG&E’s Physical Test
Battery pre-employment test. Rates at which
students qualifi ed increased over time as the
program was refi ned, with the fi nal class reach-
ing a 100 percent qualifying rate. One hundred
percent of PG&E supervisors would consider
hiring another PowerPathwayTM graduate.
Classes in the PowerPathwayTM College Cur-
riculum
Using the Bridge to Utility Worker course as an
example, in general, candidates must demon-
strate mastery of at least 8th-10th grade level
literacy and mathematics skills to be considered
for PowerPathwayTM courses. Spatial reasoning,
the ability to follow directions, the candidate’s
comfort with working at heights, and the abil-
ity to handle the physical demands of the jobs
are evaluated during the selection process. If
accepted into the Utility Worker / Apprentice
Lineworker course, candidates will undergo a
training curriculum that will include:
- Reading and Comprehension: This will
strengthen the candidate’s ability to read
and understand required documents such
as job instructions and drawings, con-
struction standard manuals, and material
lists essential to performing the work.
- Applied Mathematics: Understanding
calculations involving addition, subtrac-
tion, and multiplication of percentages
and fractions.
- Physical conditioning: Exercises that
strengthen and prepare a student for the
rigors of pole climbing, lifting, and other
55627_P001_104.indd 9555627_P001_104.indd 95 8/13/09 8:04 AM8/13/09 8:04 AM
96 Task Force on America’s Future Energy Jobs
required physical tasks.
- Industry-specifi c knowledge: safe working
practices, basic electricity, pole climbing,
using ropes, confi ned working spaces,
and other areas of knowledge required to
perform the work.
- Soft skills training: Time management,
interviewing skills, general workplace
communication skills.
Initial Lessons
The Task Force identifi ed a long-term approach
as a key to success, including:
- Consistent funding versus short-term
grants,
- Involvement of multiple employers to in-
crease the employment opportunities over
time and reduce hiring volatility from the
student perspective,
- Building a regional program that connects
with local educators and employers, and
- Developing a program structure with a
coordinating body (employment panel)
that can bring together numerous com-
munity colleges, companies, labor groups,
and other stakeholders including CBOs
and potentially WIBs.
Additionally, establishing consistent training
standards and a common curriculum is a key
to success. Industry partners are looking for
skilled workers who can pass or have already
passed company entrance exams, while com-
munity college partners are looking for ap-
proved programs and labor groups are looking
for training that complements existing appren-
ticeship structure.
55627_P001_104.indd 9655627_P001_104.indd 96 8/13/09 8:04 AM8/13/09 8:04 AM

Task Force on America’s Future Energy Jobs 97
Appendix D: Insights from the Analysis and Next Steps
The NCEP Task Force on America’s Future
Energy Jobs brought together representatives
from the labor, electric industry, and training
and educational sectors to explore the existing
demographic makeup and anticipated profes-
sional needs of the electricity industry, along
with the training institutions and programs that
support this sector. The report summarizes the
analysis and recommendations resulting from
this effort. Following this analysis, the NCEP
staff wants to highlight a number of specifi c
insights about possible next steps in support of
policymaking.
Additional Modeling
NCEP staff contracted with Bechtel to conduct
the analysis summarized in Appendix A. The
report applies the per-GW workforce estimates
developed by Bechtel for the EPRI Prism
scenario and two alternative scenarios (sum-
marized in Appendices A and B). NCEP staff
believes it is important to conduct updated es-
timates of workforce demand as policy choices
are debated to gain additional insight.
As discussed in Appendix C, the types of tech-
nologies available for deployment and the rate
of deployment determine the size, and poten-
tially the desired skill sets, of the workforce
needed. Both the types of technologies deployed
and the rate of deployment are heavily depen-
dent on the direction of policy decisions that
are currently being considered in Congress.
For this reason, we propose that economic
models that incorporate emissions limits and
complimentary policies (such as renewable
energy standards or transmission deployment
incentives) contained in proposed climate bills
be used as a foundation for updated workforce
demand estimates. These updated estimates
should refl ect potential policy decisions that
will drive actual workforce demand. NCEP staff
believes that the workforce demand building
blocks presented in this report can assist gov-
ernment agencies and other organizations as
they develop these economic models because,
without substantial intervention, workforce
shortages may be a signifi cant constraint on
deployment paths.
Additionally, as noted in the report, there will
be state and regional variability in the deploy-
ment of generating assets, retrofi t technologies,
infrastructure, and other technologies. The
building blocks used in this report could also
be used in developing future state and regional
workforce models.
Consideration of Supplementary Factors
The workforce estimates presented in this
report focus on direct jobs associated with the
construction and operation of electric generat-
ing assets and the associated infrastructure
and technologies. In these workforce estimates
no constraints on the feasibility of low-carbon
infrastructure build out were examined aside
from workforce availability. Policymakers may,
however, want to evaluate potential constraints
as they work towards low-carbon infrastructure
policies.
Additional macroeconomic factors beyond the
scope of the report contribute to the complex-
ity of projections of future workforce demand
and supply and should be considered as a part
of future work to help inform federal policy
decisions.
55627_P001_104.indd 9755627_P001_104.indd 97 8/13/09 8:04 AM8/13/09 8:04 AM

98 Task Force on America’s Future Energy Jobs
86 According to the KEMA/GridWise Alliance study, as a result of smart grid deployment, about 32,000 existing utility jobs, such as meter-readers, will be transitioned to other jobs in the electric sector.
- Competition for workforce: The con-
struction workforce is not specifi c to the
electrical industry and the industry will
likely face competition for skilled craft
workers with other sectors that may also
be concurrently investing in infrastructure
projects.
- Industrial policy: Manufacturing implica-
tions should also be considered for the
technology mixes and deployment paths
considered in updated workforce esti-
mates. The manufacturing jobs associated
with the low-carbon technologies deployed
could be very signifi cant and could both
increase the demand for skilled workers
and contribute to competitive pressures in
the labor market.
- Worker re-training: There is a potential
for displacement of traditional electric
power jobs as the industry deploys new
technologies. This implies that there may
be signifi cant re-training needs for some
of the current workforce and that the net
number of new employees needed in this
sector will be affected by the extent of this
displacement.86
55627_P001_104.indd 9855627_P001_104.indd 98 8/13/09 8:04 AM8/13/09 8:04 AM

Task Force on America’s Future Energy Jobs 99
Notes
55627_P001_104.indd 9955627_P001_104.indd 99 8/13/09 8:04 AM8/13/09 8:04 AM

100 Task Force on America’s Future Energy Jobs
Notes
55627_P001_104.indd 10055627_P001_104.indd 100 8/13/09 8:04 AM8/13/09 8:04 AM
The Bipartisan Policy Center has engaged MOSAIC, a carbon neutral EPA Green Power Partner, for the production of this brochure, using 100% wind power and a waterless printing process. The brochure was printed on FSC certifi ed stock with 100% environmentally friendly soy-based inks. The savings below are achieved when PC recycled fi ber is used in place of virgin fi ber. This project uses 3136 lbs of paper which has a postconsumer recycled percentage of 20%.
6 trees preserved for the future
17 lbs waterborne waste not created
2,558 gallons wastewater fl ow saved
283 lbs solid waste not generated
557 lbs net greenhouse gases prevented
4,264,960 BTUs energy not consumed
1,414 lbs ghg emissions not generated
1.5 barrels fuel oil unused
not driving 1,400 miles
planting 96 trees
design: www.katetallentdesign.com
NCEP Task Force Staff
Sasha MacklerResearch Director
David RosnerSenior Policy Analyst
Marika TatsutaniWriter and Technical Editor
Disclaimer
and affi
entirely satisfi
mission on Energy Policy.
Acknowledgements
55627_C1_C4_.indd 255627_C1_C4_.indd 2 8/13/09 6:26 PM8/13/09 6:26 PM

AMERICA’S JOBS
O N
NATIONAL COMMISSION ON ENERGY POLICY | 1225 I STREET, NW, SUITE 1000 | WASHINGTON, D.C. 20005
T: 202-204-2400 | F: 202-637-9220 | WWW.ENERGYCOMMISSION.ORG
NA
TIO
NA
L C
OM
MIS
SIO
N O
N E
NE
RG
Y P
OLIC
Y’S
TASK FO
RCE ON A
MER
ICA’S FU
TURE EN
ERGY JO
BS
55627_C1_C4_.indd 155627_C1_C4_.indd 1 8/14/09 9:56 AM8/14/09 9:56 AM