
Christmas Advent Calendar Click on the numbers to see the surprises!

NCE and SEE Annual Report
Calendar Year 2020
Summary of NCE and SEE Performance
and Clinical Experience
January 1, 2020 – December 31, 2020
Copyright © 2021 by the National Board of Certification and Recertification for Nurse Anesthetists (NBCRNA). All Rights Reserved.

Table of Contents
Introduction .................................................................................................................................................. 1
Candidate Performance on the NCE ............................................................................................................. 2
Demographic Characteristics of NCE Candidate Population, 2020 .............................................................. 3
Descriptive Information on Number of Clinical Experiences, 2020 .............................................................. 5
NCE Exit Survey Results ............................................................................................................................... 13
Demographic Characteristics of the SEE Candidate Population, 2020 ....................................................... 18
Appendix A - Additional NCE and SEE Performance Data ........................................................................... 22

NBCRNA Summary of NCE and SEE Performance and Clinical Experiences CY 2020 Data Rev 02242021 1
Introduction This report presents a summary of information on individual performance on the National Certification Examination (NCE) and the Self-Evaluation Examination (SEE) in the calendar year 2020 (CY2020), January 1, 2020 through December 31, 2020. It should be noted that starting in 2019, the NBCRNA has transitioned to align its fiscal year (FY) with the calendar year (CY). Performance on the NCE is summarized first, with pass/fail outcomes presented according to several demographic variables: gender, age, clinical background, and type of graduate degree. Trend data summarizing pass rates over the past five years are also provided in the last column of each table for each demographic. Readers should note that there was no change to the NCE passing standard in 2020. The passing standard was last changed on January 1, 2014; the NBCRNA Board of Directors reviewed the results of the 2017 standard setting study and voted to retain the standard established in 2014. NCE pass rate summaries are followed by an analysis of candidates’ responses on a satisfaction survey administered at the end of the NCE. The survey requested information pertaining to candidates’ satisfaction with their registration and test experience. Additionally, descriptive statistics (e.g., mean, standard deviation) are provided for the number of cases performed in various clinical areas by students of nurse anesthesia educational programs who graduated in 2020. Finally, information about scaled scores for the SEE is presented in the last part of the report, summarizing performance by gender, age, clinical background, type of graduate degree, and year in program. Trend data summarizing the past five years in each demographic subgroup are also provided in the final column of each table. The pandemic brought about some changes in NCE and SEE testing during 2020. In mid-March, all Pearson Professional Centers were briefly closed. When they reopened it was with limited and frequently fluctuating capacities due to local and state regulatory influences. Scheduling was limited to critical occupation certification programs, which included both the NCE and SEE. The NBCRNA acted quickly to expand testing opportunities by supplementing the traditional testing channel from PPC only, to include both PPCs and “third-party channel testing locations.” These third-party channels are most often colleges and universities, who are not owned or operated by PearsonVUE, but are required to meet test-delivery requirements established by PearsonVUE. All third-party locations offer secure proctored testing, although without the standardization common to the Pearson owned and operated PPCs. To further accommodate candidates, the testing channel was expanded in July of 2020 to include testing for the NCE and SEE on US military bases (where testing is available), for active-duty military candidates.

NBCRNA Summary of NCE and SEE Performance and Clinical Experiences CY 2020 Data Rev 02242021 2
Candidate Performance on the NCE The information in Table 1 addresses the performance of candidates on the NCE during the CY2020 reporting period. Pass rates appear separately for first-time candidates versus repeat candidates, based on the passing standard that took effect on January 1, 2014. The pass rate for the 2,630 first-time candidates is 85.2%. The pass rate is lower for repeat examinees, consistent with the previous year’s data. The CY2020 first-time pass rate (85.2%) is higher than the CY2019 pass rate (84.4%). The cumulative first-time pass rate averaged over the previous five years is 84.2% as shown in the final column of Table 1 (Years 2016–2020 represents January 1, 2016–December 31, 2020, total N = 15,551). First-time examinee pass rates for the NCE, by year since 2008, can be found in Table A1 in Appendix A of this report. Numbers of NCE candidates testing increased in 2020, despite pandemic constraints. In CY2020 there were 2,630 first-time candidates compared to 2,421 in CY2019.
Table 1. Pass/Fail Summary for NCE Candidates, 2020
First-Time Candidates Frequency Percent 5-year Trend %
Pass 2,242 85.2% 84.2% Fail 388 14.8% 15.8% Total 2,630 100.0% 100.0%
Repeat Candidates Frequency Percent 5-year Trend %
Pass 314 62.8% 61.3% Fail 186 37.2% 38.7% Total 500 100.0% 100.0%
The NCE total scores and domain-level information for first-time candidates can be found in Table A2 of Appendix A. Table 2 shows the distribution of test length and pass/fail status. Only first-time candidates are included in Table 2. Of the candidates who passed, the majority (59.3%) were administered 70 items (not including the 30 unscored pretest items). Only 3.3% of NCE candidates failed the test in 70 items. Approximately 19.2% of the candidates took the maximum test length of 140 items. The number of candidates getting a score determination in 70 items increased slightly in CY2020 over CY2019. In 2019, 60.9% of candidates fell into this category compared to 62.6% in CY2020. The five-year trend is 61.4%.
Table 2. Pass/Fail Summary by Test Length for First-Time NCE Candidates, 2020
Frequency Percent 5-year Trend %
Pass in 70 items 1,559 59.3% 57.1% Pass in 71 to 139 items 378 14.4% 15.0% Pass in 140 items 305 11.6% 12.1%
Fail in 70 items 86 3.3% 4.3% Fail in 71 to 139 items 103 3.9% 4.3% Fail in 140 items 199 7.6% 7.2%
Total 2,630 100.0% 100.0%

NBCRNA Summary of NCE and SEE Performance and Clinical Experiences CY 2020 Data Rev 02242021 3
Demographic Characteristics of NCE Candidate Population, 2020 The next several tables present pass rates on the NCE grouped by gender, age, clinical background, and degree earned. Only first-time candidates are included in these tables. Table 3 indicates that 60.3% of the NCE candidates were female and 39.7% were male. The pass rates for both females and males in 2020 were slightly higher, with males continuing to show a slightly higher pass rate: 2020 (84.6% vs. 86.3%); 2019 (83.9% vs. 85.1%); FY2018 (83.2% vs. 85.9%), consistent with the five-year trend (final column of Table 3). The percent of females in the population increased in CY2020 to 60.3% from 59.0% in CY2019.
Table 3. Gender of NCE Candidates, 2020
Gender
Pass Fail Total 5-year Trend
N Percent N Percent N Percent Pass %
Female 1,341 84.6% 245 15.4% 1,586 60.3% 83.5% Male 901 86.3% 143 13.7% 1,044 39.7% 85.3% Total 2,242 85.2% 388 14.8% 2,630 100.0% 84.2%
Table 4 presents the pass rate by age group. The pass rate decreased as examinee age increased, both for the 2020 sample and the five-year trend analysis. Younger students tend to perform better on the NCE. The pass rate differences between the age groups of 30-35 and 36-39 were substantially smaller in 2020 than in 2019 (84.4% vs. 81.3% in 2020, 86.4% vs. 73.1% in 2019). The average age of the 2020 first-time NCE candidates was 32.6 years.
Table 4. Age of NCE Candidates, 2020
Age
Pass Fail Total 5-year Trend
N Percent N Percent N Percent Pass %
Under 30 707 92.5% 57 7.5% 764 29.0% 90.3% 30 - 35 1,097 84.4% 202 15.6% 1,299 49.4% 84.6% 36 - 39 257 81.3% 59 18.7% 316 12.0% 76.7% 40 or more 181 72.1% 70 27.9% 251 9.5% 67.8% Total 2,242 85.2% 388 14.8% 2,630 100.0% 84.2%
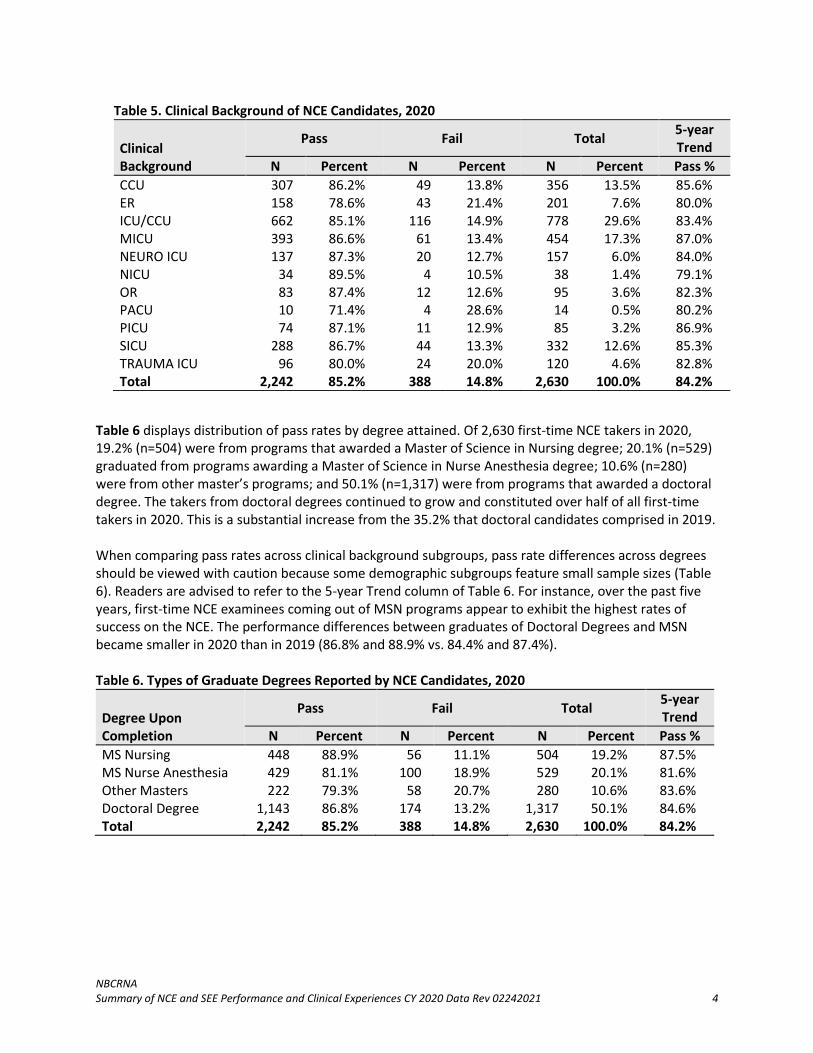
Table 5 displays pass rates for candidates’ clinical background. Approximately 30% of the candidates reported their clinical background as ICU/CCU, down from 34.8% in 2019. Pass rate comparisons between different clinical settings should be made with caution, however, because some subgroups for the 2020 data feature small sample sizes. Also, the clinical background categories tend not to be mutually exclusive. While examinees report their clinical background as discrete categories, actual experience may be more diverse and complex (e.g., SICU in some facilities may include CVICU patients, and many other permutations can exist). Finally, this data is self-reported and could subject to inaccuracies. When comparing pass rates across clinical background subgroups, readers are advised to refer to the 5-year trend column of Table 5. The pass rates in this column are more reliable for comparisons because they are based on a much larger sample. For instance, over the past five years, first-time NCE examinees with MICU, PICU, CCU, and SICU clinical backgrounds respectively have demonstrated the highest rates of success on the NCE.
NBCRNA Summary of NCE and SEE Performance and Clinical Experiences CY 2020 Data Rev 02242021 4
Table 5. Clinical Background of NCE Candidates, 2020
Clinical Background
Pass Fail Total 5-year Trend
N Percent N Percent N Percent Pass %
CCU 307 86.2% 49 13.8% 356 13.5% 85.6% ER 158 78.6% 43 21.4% 201 7.6% 80.0% ICU/CCU 662 85.1% 116 14.9% 778 29.6% 83.4% MICU 393 86.6% 61 13.4% 454 17.3% 87.0% NEURO ICU 137 87.3% 20 12.7% 157 6.0% 84.0% NICU 34 89.5% 4 10.5% 38 1.4% 79.1% OR 83 87.4% 12 12.6% 95 3.6% 82.3% PACU 10 71.4% 4 28.6% 14 0.5% 80.2% PICU 74 87.1% 11 12.9% 85 3.2% 86.9% SICU 288 86.7% 44 13.3% 332 12.6% 85.3% TRAUMA ICU 96 80.0% 24 20.0% 120 4.6% 82.8% Total 2,242 85.2% 388 14.8% 2,630 100.0% 84.2%
Table 6 displays distribution of pass rates by degree attained. Of 2,630 first-time NCE takers in 2020, 19.2% (n=504) were from programs that awarded a Master of Science in Nursing degree; 20.1% (n=529) graduated from programs awarding a Master of Science in Nurse Anesthesia degree; 10.6% (n=280) were from other master’s programs; and 50.1% (n=1,317) were from programs that awarded a doctoral degree. The takers from doctoral degrees continued to grow and constituted over half of all first-time takers in 2020. This is a substantial increase from the 35.2% that doctoral candidates comprised in 2019. When comparing pass rates across clinical background subgroups, pass rate differences across degrees should be viewed with caution because some demographic subgroups feature small sample sizes (Table 6). Readers are advised to refer to the 5-year Trend column of Table 6. For instance, over the past five years, first-time NCE examinees coming out of MSN programs appear to exhibit the highest rates of success on the NCE. The performance differences between graduates of Doctoral Degrees and MSN became smaller in 2020 than in 2019 (86.8% and 88.9% vs. 84.4% and 87.4%). Table 6. Types of Graduate Degrees Reported by NCE Candidates, 2020
Degree Upon Completion
Pass Fail Total 5-year Trend
N Percent N Percent N Percent Pass %
MS Nursing 448 88.9% 56 11.1% 504 19.2% 87.5% MS Nurse Anesthesia 429 81.1% 100 18.9% 529 20.1% 81.6% Other Masters 222 79.3% 58 20.7% 280 10.6% 83.6% Doctoral Degree 1,143 86.8% 174 13.2% 1,317 50.1% 84.6% Total 2,242 85.2% 388 14.8% 2,630 100.0% 84.2%

NBCRNA Summary of NCE and SEE Performance and Clinical Experiences CY 2020 Data Rev 02242021 5
Descriptive Information on Number of Clinical Experiences, 2020 The tables in this section report data collected about the number of anesthesia cases performed in clinical areas, as submitted by program directors to the NBCRNA for individuals completing nurse anesthesia programs in the reporting period. This data reflects records of clinical experiences submitted for individuals with a graduation date in 2020, and not the sample of NCE candidates during this time frame. As a result, sample sizes presented in this section (2,576) will not equal the number of first-time NCE candidates (2,630) as reported in Tables 1 through 6. In previous years, there were different academic requirements for Doctoral and Master’s candidates, so results were reported separately. While requirements are now the same, results in this section still break out by Doctoral and Master’s candidates to allow analysis of differences as well as comparison to previous periods. For clarity, these two groups of students are reported separately in Tables 7a through 15a for Master’s students (n=1,241), and in Tables 7b through 15b, for Doctoral students (n=1,335), respectively. Clinical experiences are aligned in the table pairs to easily compare the degree types. The columns are the same in Tables 7 through 15, presenting the following information:
• The first column contains the clinical area in which cases were performed.
• The N column represents the number of master’s or doctoral records submitted in the reporting period.
• The Number of Cases Required column indicates the minimum number of cases that must be completed by an applicant for the applicant to be deemed eligible to take the NCE. If a minimum number of cases is not required, a “0” is entered in this column.
• The Mean column indicates the average number of cases reported on the 2020 records.
• The Standard Deviation column describes the dispersion in the number of cases reported on the 2020 records.
• The Median column indicates the median number of cases (50th percentile) reported on the records in the reporting period. Half the records contained values higher than this number and half contained a value below this number.
• The Minimum column indicates the smallest number of cases reported on the 2020 records. Table 7a. Sections I, II and III: Clinical Experience (Master’s)
Area N Number of
Cases Required Mean Standard Deviation Median Minimum
Total Number of Cases 1,241 600 801.6 113.6 779 600
Total Hours of Anesthesia 1,241 0 1,604.9 289.0 1,558 857
Total Clinical Hours 1,241 0 2,419.2 367.5 2,382 1,923
Table 7b. Sections I, II and III: Clinical Experience (Doctoral)
Area N
Number of Cases
Required Mean Standard Deviation Median Minimum
Total Number of Cases 1,335 600 839.7 138.3 813 600
Total Hours of Anesthesia 1,335 0 1,645.2 331.1 1,609 816
Total Clinical Hours 1,335 0 2,644.0 343.8 2,598 2,000

NBCRNA Summary of NCE and SEE Performance and Clinical Experiences CY 2020 Data Rev 02242021 6
Table 8a. Section IV: Patient Physical Status (Master’s)
Area N Number of
Cases Required Mean Standard Deviation Median Minimum
Class I 1,241 0 71.4 33.9 66 0
Class II 1,241 0 318.1 79.6 308 75
Class III-VI Total 1,241 200 412.2 89.9 403 206
Class III 1,241 50 332.7 76.9 322 100
Class IV 1,241 10 75.7 31.2 72 10
Class V 1,241 0 3.2 3.8 2 0
Class VI 1,241 0 0.6 1.1 0 0
Table 8b. Section IV: Patient Physical Status (Doctoral)
Area
N
Number of Cases
Required Mean Standard Deviation Median Minimum
Class I 1,335 0 79.5 38.9 72 4
Class II 1,335 0 335.1 90.8 324 109
Class III-VI Total 1,335 200 424.9 98.9 416 200
Class III 1,335 50 347.0 83.3 339 156
Class IV 1,335 10 74.4 34.0 68 10
Class V 1,335 0 3.0 3.9 2 0
Class VI 1,335 0 0.5 0.9 0 0

NBCRNA Summary of NCE and SEE Performance and Clinical Experiences CY 2020 Data Rev 02242021 7
Table 9a. Section V: Special Cases (Master’s)
Area N Number of
Cases Required Mean Standard Deviation Median Minimum
Geriatric, 65+ years 1,241 100 252.6 69.1 241 104
Pediatric, 2-12 years 1,241 30 59.6 26.8 53 30
Pediatric, under 2 years 1,241 10 18.9 10.3 16 10
Neonatal, under 4 weeks 1,241 0 1.0 1.6 0 0
Trauma/Emergency 1,241 30 51.5 18.7 47 30
Obstetrical Management 1,241 30 65.3 31.7 57 30
Cesarean delivery 1,241 10 31.3 15.3 28 10
Analgesia for labor 1,241 10 33.5 21.6 27 10
Pain Management Encounters 1,241 15 45.1 32.9 34 15
Table 9b. Section V: Special Cases (Doctoral)
Area N Number of Cases Required Mean
Standard Deviation Median Minimum
Geriatric, 65+ years 1,335 100 252.1 70.6 243 107
Pediatric, 2-12 years 1,335 30 65.8 32.4 58 30
Pediatric, under 2 years 1,335 10 20.5 10.4 17 10
Neonatal, under 4 weeks 1,335 0 1.1 1.7 0 0
Trauma/Emergency 1,335 30 50.9 19.7 46 30
Obstetrical Management 1,335 30 63.5 30.6 56 30
Cesarean delivery 1,335 10 27.9 13.1 25 10
Analgesia for labor 1,335 10 35.6 23.3 29 10
Pain Management Encounters 1,335 15 52.6 41.6 40 15

NBCRNA Summary of NCE and SEE Performance and Clinical Experiences CY 2020 Data Rev 02242021 8
Table 10a. Section VII: Anatomical Categories (Master’s)
Area N Number of
Cases Required
Mean Standard Deviation
Median Minimum
Intra-abdominal 1,241 75 172.9 54.8 161 77
Intracranial Total 1,241 5 13.8 9.0 12 5
Intracranial Open 1,241 3 9.8 5.6 8 3
Intracranial Closed 1,241 0 4.0 6.3 3 0
Oropharyngeal 1,241 20 82.1 41.9 75 20
Intrathoracic Total 1,241 15 42.9 24.0 39 15
Heart 1,241 5 26.8 14.2 24 5
Open Heart Total 1,241 5 14.6 8.0 13 5
Open Heart with CPB 1,241 0 12.8 7.5 11 0
Open Heart without CPB 1,241 0 1.8 2.6 1 0
Closed Heart 1,241 0 12.2 11.0 9 0
Lung 1,241 5 10.5 5.9 9 5
Other 1,241 0 5.6 16.9 3 0
Neck 1,241 5 21.1 9.6 20 5
Neuroskeletal 1,241 20 42.2 21.1 37 20
Vascular 1,241 10 36.9 18.2 34 10
Table 10b. Section VII: Anatomical Categories (Doctoral)
Area N Number of
Cases Required
Mean Standard Deviation
Median Minimum
Intra-abdominal 1,335 75 177.3 61.2 167 79
Intracranial Total 1,335 5 14.2 8.2 12 5
Intracranial Open 1,335 3 10.5 6.0 9 3
Intracranial Closed 1,335 0 3.7 4.8 2 0
Oropharyngeal 1,335 20 94.0 46.5 87 20
Intrathoracic Total 1,335 15 41.1 18.3 37 15
Heart 1,335 5 23.5 13.2 20 5
Open Heart Total 1,335 5 12.9 7.0 11 5
Open Heart with CPB 1,335 0 11.3 6.4 10 0
Open Heart without CPB 1,335 0 1.5 2.1 1 0
Closed Heart 1,335 0 10.6 9.7 8 0
Lung 1,335 5 10.5 5.5 9 5
Other 1,335 0 7.1 9.3 4 0
Neck 1,335 5 22.9 10.9 21 5
Neuroskeletal 1,335 20 44.4 22.2 39 20
Vascular 1,335 10 37.3 17.2 35 10

NBCRNA Summary of NCE and SEE Performance and Clinical Experiences CY 2020 Data Rev 02242021 9
Table 11a. Section IX: Methods of Anesthesia (Master’s)
Area N Number of Cases Required
Mean Standard Deviation
Median Minimum
General Anesthesia 1,241 400 578.3 100.9 561 403
Inhalation Induction 1,241 25 70.9 37.0 61 25
Mask Management 1,241 25 50.2 46.7 37 25
Supraglottic Airway Devices (total of a & b) 1,241 35 105.9 46.6 99 35
a. Laryngeal mask 1,241 0 101.2 45.0 95 0
b. Other 1,241 0 4.7 16.9 0 0
Tracheal Intubation (total of a & b) 1,241 250 376.2 69.8 369 250
a. Oral 1,241 0 361.3 68.3 354 0
b. Nasal 1,241 0 14.7 12.7 12 0
Alternative Tracheal Intub/Endo (total of a & b) 1,241 25 70.1 47.8 60 25
a. Endoscopic techniques, total 1,241 5 14.5 15.6 9 5
1. Actual Placement 1,241 0 10.5 14.8 6 0
2. Simulated Placement 1,241 0 3.9 6.9 2 0
3. Airway Assessment 1,241 0 14.1 55.5 6 0
b. Other techniques 1,241 5 55.6 48.4 48 5
Emergence from Anesthesia 1,241 300 544.7 115.2 528 311
Regional Techniques 1,241
Actual Administration (total of a, b, c & d) 1,241 35 121.6 74.2 104 35
a. Spinal (total of 1 & 2) 1,241 10 44.4 29.1 38 10
1. Spinal Anesthesia 1,241 0 40.3 26.7 35 0
2. Spinal Pain Management 1,241 0 4.1 9.3 1 0
b. Epidural (total of 1 & 2) 1,241 10 32.5 22.2 26 10
1. Epidural Anesthesia 1,241 0 9.2 13.7 4 0
2. Epidural Pain Management 1,241 0 23.3 19.2 18 0
c. Peripheral (total of 1, 2, 3 & 4) 1,241 10 37.4 52.6 23 10
1. Anesthesia Upper 1,241 0 9.8 15.6 6 0
2. Anesthesia Lower 1,241 0 9.3 21.5 5 0
3. Pain Management Upper 1,241 0 7.5 14.7 3 0
4. Pain Management Lower 1,241 0 10.9 23.8 5 0
d. Other 1,241
1. Anesthesia 1,241 0 4.3 10.6 1 0
2. Pain Management 1,241 0 2.0 4.4 0 0
Management (total of 1 & 2) 1,241 35 89.4 48.2 78 35
1. Anesthesia 1,241 0 50.7 36.8 43 0
2. Pain Management 1,241 0 38.7 30.7 32 0
Moderate/deep sedation 1,241 25 116.1 67.1 102 25

NBCRNA Summary of NCE and SEE Performance and Clinical Experiences CY 2020 Data Rev 02242021 10
Table 11b. Section IX: Methods of Anesthesia (Doctoral)
Area N Number of Cases Required
Mean Standard Deviation
Median Minimum
General Anesthesia 1,335 400 593.6 107.5 580 400
Inhalation Induction 1,335 25 78.6 44.6 70 26
Mask Management 1,335 25 55.2 55.3 39 25
Supraglottic Airway Devices (total of a & b) 1,335 35 114.1 52.5 108 35
a. Laryngeal mask 1,335 0 109.2 46.6 104 0
b. Other 1,335 0 4.8 24.0 0 0
Tracheal Intubation (total of a & b) 1,335 250 385.6 76.6 376 251
a. Oral 1,335 0 367.6 73.2 357 202
b. Nasal 1,335 0 18.0 15.2 14 0
Alternative Tracheal Intub/Endo (total of a & b) 1,335 25 74.3 37.2 68 25
a. Endoscopic techniques, total 1,335 5 13.4 16.8 8 5
1. Actual Placement 1,335 0 9.5 15.5 6 0
2. Simulated Placement 1,335 0 3.9 8.5 2 0
3. Airway Assessment 1,335 0 10.2 27.5 6 0
b. Other techniques 1,335 5 60.9 34.4 57 5
Emergence from Anesthesia 1,335 300 576.9 135.2 558 300
Regional Techniques 1,335
Actual Administration (total of a, b, c & d) 1,335 35 132.2 72.1 113 36
a. Spinal (total of 1 & 2) 1,335 10 42.9 27.2 36 10
1. Spinal Anesthesia 1,335 0 37.8 24.5 32 1
2. Spinal Pain Management 1,335 0 5.1 9.9 2 0
b. Epidural (total of 1 & 2) 1,335 10 33.8 22.6 27 10
1. Epidural Anesthesia 1,335 0 10.9 13.4 6 0
2. Epidural Pain Management 1,335 0 22.9 19.4 18 0
c. Peripheral (total of 1, 2, 3 & 4) 1,335 10 47.0 40.6 34 10
1. Anesthesia Upper 1,335 0 11.5 12.4 8 0
2. Anesthesia Lower 1,335 0 12.1 18.1 7 0
3. Pain Management Upper 1,335 0 8.4 12.9 4 0
4. Pain Management Lower 1,335 0 15.1 23.6 7 0
d. Other 1,335
1. Anesthesia 1,335 0 3.0 7.5 0 0
2. Pain Management 1,335 0 5.5 12.3 1 0
Management (total of 1 & 2) 1,335 35 96.5 57.8 79 35
1. Anesthesia 1,335 0 52.6 38.3 44 0
2. Pain Management 1,335 0 43.9 37.3 35 0
Moderate/deep sedation 1,335 25 145.0 88.8 131 25

NBCRNA Summary of NCE and SEE Performance and Clinical Experiences CY 2020 Data Rev 02242021 11
Table 12a. Section X: Arterial Technique (Master’s)
Area N
Number of Cases Required Mean
Standard Deviation Median Minimum
Arterial Puncture/Catheter Insertion 1,241 25 50.9 20.1 47 25
Intraarterial Blood Pressure Monitoring 1,241 30 75.1 25.2 72 30
Table 12b. Section X: Arterial Technique (Doctoral)
Area N
Number of Cases Required Mean
Standard Deviation Median Minimum
Arterial Puncture/Catheter Insertion 1,335 25 55.0 23.6 50 25
Intraarterial Blood Pressure Monitoring 1,335 30 79.6 26.7 75 30
Table 13a. Section XI: Central Venous Pressure Catheter (Master’s)
Area N
Number of Cases Required Mean
Standard Deviation Median Minimum
Placement—Non-PICC (total of a & b) 1,241 10 14.9 7.1 12 10
a. Non-PICC, Actual 1,241 0 10.6 8.8 10 0
b. Non-PICC, Simulated 1,241 0 4.2 4.5 3 0
Placement—PICC (total of a & b) 1,241 0 0.8 2.9 0 0
a. PICC, Actual 1,241 0 0.6 2.4 0 0
b. PICC, Simulated 1,241 0 0.2 1.1 0 0
Monitoring 1,241 15 22.9 8.5 20 15
Table 13b. Section XI: Central Venous Pressure Catheter (Doctoral)
Area N
Number of Cases Required Mean
Standard Deviation Median Minimum
Placement—Non-PICC (total of a & b) 1,335 10 14.3 6.1 12 10
a. Non-PICC, Actual 1,335 0 10.3 7.3 10 0
b. Non-PICC, Simulated 1,335 0 4.0 3.9 3 0
Placement—PICC (total of a & b) 1,335 0 0.5 1.8 0 0
a. PICC, Actual 1,335 0 0.4 1.4 0 0
b. PICC, Simulated 1,335 0 0.1 0.7 0 0
Monitoring 1,335 15 22.0 8.6 19 15

NBCRNA Summary of NCE and SEE Performance and Clinical Experiences CY 2020 Data Rev 02242021 12
Table 14a. Section XII: Pulmonary Artery Catheter (Master’s)
Area N Number of Cases
Required Mean
Standard Deviation
Median Minimum
Placement 1,241 0 5.2 5.9 3 0
Monitoring 1,241 0 10.9 7.7 10 0
Table 14b. Section XII: Pulmonary Artery Catheter (Doctoral)
Area N Number of Cases
Required Mean
Standard Deviation
Median Minimum
Placement 1,335 0 4.7 5.0 4 0
Monitoring 1,335 0 9.5 7.2 9 0
Table 15a. Section XIII: Other (Master’s)
Area N
Number of Cases Required Mean
Standard Deviation Median Minimum
Ultrasound (US)-Guided Techniques (total of a & b)
1,241
0
38.6
50.3
25
0
a. Regional 1,241 0 26.3 45.2 13 0 b. Vascular 1,241 0 12.3 15.0 8 0
Intravenous Catheter Placement 1,241 100 160.2 70.0 136 100 Advanced Noninvasive Hemodynamic Monitoring
1,241
0
20.1
85.7
2
0
Table 15b. Section XIII: Other (Doctoral)
Area N
Number of Cases Required Mean
Standard Deviation Median Minimum
Ultrasound (US)-Guided Techniques (total of a & b)
1,335
0
49.7
50.6
36
0 a. Regional 1,335 0 34.4 43.2 20 0 b. Vascular 1,335 0 15.4 16.0 11 0
Intravenous Catheter Placement 1,335 100 184.3 88.5 155 100 Advanced Noninvasive Hemodynamic Monitoring
1,335
0
24.9
103.8
3
0

NBCRNA Summary of NCE and SEE Performance and Clinical Experiences CY 2020 Data Rev 02242021 13
NCE Exit Survey Results
Candidates provide important ongoing sources of evaluative information about the examination
process. This information serves as essential input for the continuous quality improvement initiatives of
the NBCRNA. Candidates are asked to complete a post-examination survey regarding their testing
experience. The post-examination survey addressed the following four areas:
• Seven statements related to pre-examination activities such as registration and scheduling, locating the testing center, and interaction with test center staff;
• Nine statements related to aspects of the examination experience such as readability, fairness of test questions, and use of testing software;
• Six statements related to examinee perception of the alternative question formats; and
• Three statements related to their personal preparation prior to examination.
Most of the questions employ a Likert-type rating scale, where respondents are asked to indicate their
level of agreement with the survey statements. For the purposes of this report, the Likert response
categories, Strongly Agree and Agree, are combined into a single Agree category, and Strongly Disagree
and Disagree are combined into Disagree. Completion of the survey is not required as part of the
examination process and is not part of the three-hour time limit for the NCE.
The responses represent tests administered. If a candidate tested more than once during 2020, their
responses would be counted each time they completed the survey.
The N for each response differs for two reasons.
• Respondents do not always answer all the questions, as reflected by the unequal sample size across the sections of the survey.
• Due to its length, the survey is split into two unique parts, which are randomly administered. There are small differences in the final numbers of candidates exposed to each of these two survey parts.
Responses were analyzed based on samples of NCE test takers who were administered the exit survey
during the period of CY2020. After each test administration, the test taker can contact the NBCRNA
office to address any problems or concerns related to the NCE.
The first seven statements pertain to pre-examination scheduling and registration activities. The
responses to a question concerning scheduling mode – internet or phone, not included in the table
below, indicate that 93.4% of NCE candidates scheduled their examination on the Internet rather than
by phone. This is a lower percent than in previous years (in CY2019 it was 99.5%). Candidates may have
needed additional help finding openings with capacity limited due to the pandemic. As seen from
responses to later questions, satisfaction with ultimately finding convenient centers registered high
overall. Responses to the other six survey questions are summarized in Table 16.
The numbers of candidates registering satisfaction with scheduling an acceptable test date and time
increased over the previous year (86.9% and 89.7% for CY2019 respectively), surprising as Pearson VUE
centers had reduced capacity during the March-December time period due to the pandemic. NBCRNA
did work with Pearson VUE to make some centers other than the top tier Pearson Professional Centers
available to candidates and it appears that this created needed availability.

NBCRNA Summary of NCE and SEE Performance and Clinical Experiences CY 2020 Data Rev 02242021 14
Overall satisfaction with scheduling and registration remains high.
Table 16. Responses to Survey Questions: Scheduling and Registration
Survey Question
Agree Disagree
Count Percent Count Percent
I was able to schedule an acceptable test date. 1,452 92.7% 115 7.3%
I was able to schedule an acceptable test center
location. 1,424 91.0% 141 9.0%
The exam reservation process was easy to use. 1,516 96.7% 51 3.3%
The test center was easy to locate. 1,545 98.3% 26 1.7%
The test center staff was helpful and
knowledgeable. 1,553 99.0% 16 1.0%
The testing center registration/check-in process
was handled in a professional and efficient manner. 1,545 98.6% 22 1.4%
The next nine statements relate to topics such as the fairness of test questions and readability of the
examination. Table 17 summarizes the responses to these survey questions. Overall (98.1% agreement),
the CY2020 NCE examinees were satisfied with their testing experience. Agreement concerning the
fairness of test questions increased from 85.1% in 2019 to 87.1% in CY2020.
87.3% of candidates agreed that the content outline was fairly represented. It should be noted that the
content outline is rigidly adhered to for the scored items on the exam. Pretest items may not reflect
content outline specifications however, and, as candidates cannot distinguish these from scored items,
it may appear to them that the exam does not reflect the outline.

NBCRNA Summary of NCE and SEE Performance and Clinical Experiences CY 2020 Data Rev 02242021 15
Table 17. Responses to Survey Questions: Examination and Testing Experience
Survey Question
Agree Disagree
Count Percent Count Percent
I thought the examination questions were fair. 1,346 87.1% 199 12.9%
The graphs, figures, and diagrams in the
questions were easy to read. 1,414 91.9% 124 8.1%
The graphs, figures, and diagrams in the
questions fit onto the screen. 1,314 85.8 % 218 14,2%
I was able to 'scroll' the test window in order to
view an entire graph or figure in a question. 1,509 98.1% 30 1.9%
The areas of the content outline were fairly
represented. 1,344 87.3% 196 12.7%
My testing environment was clean, quiet, and
comfortable. 1,526 97.3% 43 2.7%
I encountered no technical problems with the
test administration software. 1,529 97.6% 37 2.4%
The test administration software was
user-friendly. 1,558 99.4% 9 0.6%
Overall, I was satisfied with my testing
experience. 1,540 98.1% 30 1.9%
Since August 2009, the NBCRNA has administered alternative question formats on the NCE in addition to
traditional multiple-choice items. These question formats include multiple correct response (MCR,
where the examinee is directed to select an indicated number of correct responses), short
answer/calculation (SA, where the examinee enters short numerical responses), drag and drop (used for
matching or ordering of elements in question), and hotspot (where an examinee is directed to point
with their computer mouse and click on the correct region of an image). Table 18 summarizes the
responses to six survey questions related to the MCR, SA, drag and drop, and hotspot question formats.
Overall candidates responded positively to questions concerning fairness of these item types, consistent
with responses seen in past years.

NBCRNA Summary of NCE and SEE Performance and Clinical Experiences CY 2020 Data Rev 02242021 16
Table 18. Responses to Survey Questions: Alternative Question Formats
Survey Question
Agree Disagree
Count Percent Count Percent
The questions in the Multiple Correct
Response format were fair. 1,412 91.5% 132 8.5%
The questions in the Short Answer/Calculation
format were fair. 1,443 93.6% 99 6.4%
The questions in the Drag and Drop format
were fair. 1,460 94.4% 86 5.6%
The questions in the Hotspot format were fair. 1,412 91.2% 136 8.8%
I understood how to respond to the questions
in the alternative formats. 1,514 98.0% 31 2.0%
I needed help figuring out how to respond to
the questions in the alternative formats. 591 38.2% 956 61.8%
Responses to the last three items on the exit survey, addressing methods that candidates used to
prepare for their examination, are summarized in Table 19. Of the NCE examinees tested in CY2020,
over 79% (79.2% increased from 77.4% in 2019) stated that the SEE helped them in their certification
examination preparation. This is a substantial and steady increase in the past two years (under 60% in
FY2017 to 67.9% in FY2018). Of 1,570 who completed the question regarding preparation for the NCE,
95.4% responded they attended a review course. Finally, 94% reported that their nurse anesthesia
educational program featured computerized testing; this number has been increasing since 2013.
Although it is lower than 98.7% in CY2019, and the decrease was likely caused by the pandemic learning
solutions.

NBCRNA Summary of NCE and SEE Performance and Clinical Experiences CY 2020 Data Rev 02242021 17
Table 19. Responses to Survey Questions: Preparation for the NCE
Survey Question Response Count Percent
Taking the SEE helped
prepare me to take the
certification examination.
Agree 1,234 79.2%
Disagree 261 16.7%
If you took a review course in
preparation for this
examination, please indicate
below which review course
you took.
Valley Anesthesia 138 9%
Core Concepts 36 2.3%
Howard Review 4 0.3%
R&R Board Review 1 0.1%
PACES 44 2.9%
CRNA Secrets 3 0.2%
APEX Anesthesia Review 1,194 77.9%
Other commercial 11 0.7%
Course Organized by My Program 32 2.1%
Did Not Take 70 4.6%
Please indicate below if your
nurse anesthesia educational
program featured any
academic tests using
computer-based testing.
Yes 1,450 94.0%
No 92 6.0%

NBCRNA Summary of NCE and SEE Performance and Clinical Experiences CY 2020 Data Rev 02242021 18
Demographic Characteristics of the SEE Candidate Population, 2020
The following section of this report summarize performance, as indicated by overall average examination scores on the SEE, according to a variety of demographic variables, including gender, age, clinical background, and degree. The scores are presented by year in the program for each variable. Also, the last column on the right of each table displays the five-year trend average (Year 2016 through 2020, January 1, 2016–December 31, 2020, N = 20,483) for each demographic subgroup. Finally, summaries of SEE total scores and domain-level information can be found in Tables A3 of Appendix A. Table 20 summarizes SEE scores by gender: 38.7% of SEE examinees were male and 61.3% were female. The mean total score for Year-2 examinees (416.7, n=1,455) was higher than the mean total score for Year-1 examinees (404.1, n=99). The mean SEE score for the Year-3-and-above students was highest at 432.4 (n=2,896). The five-year trend information (last column) shows a similar pattern. Average scores for Year-3-and-above students are higher than for Year-2, which are higher than Year-1 students. Also, males consistently attained higher scores on the SEE than females.
Table 20. SEE Candidate Performance by Gender and Program Year, 2020
Program Year Gender Count Mean Standard Deviation
5-year Trend Mean
Year 1 Female 60 397.2 45.8 388.0 Male 39 414.6 55.0 404.6 Total 99 404.1 50.1 395.6
Year 2 Female 835 411.2 46.6 403.3 Male 620 424.2 46.8 413.4 Total 1,455 416.7 47.1 407.5
Year 3 and above Female 1,834 429.2 39.0 419.9 Male 1,062 438.1 40.0 427.8 Total 2,896 432.4 39.6 423.0
Total Female 2,729 423.0 42.6 411.2 Male 1,721 432.6 43.5 420.0 Total 4,450 426.7 43.2 414.8

NBCRNA Summary of NCE and SEE Performance and Clinical Experiences CY 2020 Data Rev 02242021 19
Table 21 summarizes SEE scores by age group. The average age of Year-1 SEE examinees was 31.4 years.
The average age of Year-2 SEE examinees was 31.8 years. The average age of Year-3 SEE examinees was
32.3 years. The mean age of all SEE examinees during the period was 32.1 years, on average similar to
the sample of first-time NCE examinees (32.6 years). The largest age groups were composed of
examinees under the age of 30 (35.0%) and examinees between the ages of 30 and 35 (44.9%). In 2020,
the same as in previous years, younger examinees scored higher than older examinees within the same
training year. The same results were found in the five-year trending sample.
Table 21. SEE Candidate Performance by Age and Program Year, 2020
Program Year Age Count Mean Standard Deviation
5-year Trend Mean
Year 1 Under 30 49 400.8 52.5 398.6 30 - 35 31 411.5 48.1 396.3 36 - 39 13 401.2 53.9 389.1 40 or above 6 398.2 37.3 384.0 Total 99 404.1 50.1 395.6
Year 2 Under 30 565 418.9 46.9 410.9 30 - 35 614 418.7 48.2 407.2 36 - 39 162 407.9 45.3 401.2 40 or above 114 408.0 42.5 395.8 Total 1,455 416.7 47.1 407.5
Year 3 and above Under 30 944 436.9 39.6 427.4 30 - 35 1,351 431.1 39.5 423.5 36 - 39 348 429.9 38.9 417.2 40 or above 253 426.3 40.0 410.8 Total 2,896 432.4 39.6 423.0
Total Under 30 1,558 429.3 43.9 417.7 30 - 35 1,996 427.0 42.9 415.6 36 - 39 523 422.4 42.7 409.5 40 or above 373 420.3 41.6 403.5 Total 4,450 426.7 43.2 414.8

NBCRNA Summary of NCE and SEE Performance and Clinical Experiences CY 2020 Data Rev 02242021 20
Table 22 displays summaries of SEE scores by clinical background. Overall, the most commonly identified clinical setting was ICU/CCU (28.8%). When comparing SEE performance across clinical background subgroups, readers are advised to refer to the five-year trend columns of Table 22. The averages in these columns are more reliable because they are based on much larger sample sizes.
Table 22. SEE Candidate Performance by Clinical Background and Program Year, 2020
Clinical Background
Count Mean Std Dev
5-Yr Mean
Program Year
Clinical Background
Count Mean Std Dev
5-Yr Mean
Year 1 CCU 23 393.7 41.3 394.7 Year 3 & CCU 405 433.0 38.0 426.7
ER 6 425.7 30.6 398.3 Above ER 190 435.5 43.6 420.5
ICU/CCU 29 407.9 55.9 394.5 ICU/CCU 867 433.2 40.3 422.2
MICU 16 398.6 47.1 395.1 MICU 489 428.9 38.5 424.0
NEURO ICU 8 393.0 25.5 395.2 NEURO ICU 168 427.0 37.9 422.1
NICU 3 441.3 55.7 395.6 NICU 41 429.6 41.7 414.4
OR 3 408.0 78.7 381.0 OR 138 431.0 42.6 428.6
PACU 1 394.0 . 382.8 PACU 15 421.4 27.2 418.1
PICU 2 413.5 51.6 399.4 PICU 91 435.7 41.3 422.1
SICU 4 456.3 57.4 400.1 SICU 370 433.5 40.0 424.0
Trauma ICU 4 361.8 76.6 398.0 Trauma ICU 122 439.9 33.1 423.3
Total 99 404.1 50.1 395.8 Total 2,896 432.4 39.6 423.1
Year 2 CCU 196 417.7 46.5 410.1 Total CCU 624 426.8 42.0 417.4
ER 123 416.4 50.1 404.3 ER 319 427.9 46.8 412.5
ICU/CCU 386 413.7 47.7 405.1 ICU/CCU 1,282 426.8 44.0 413.6
MICU 266 418.6 46.8 409.5 MICU 771 424.8 42.1 415.8
NEURO ICU 82 429.3 44.8 409.5 NEURO ICU 258 426.7 40.3 415.4
NICU 23 429.7 33.6 401.0 NICU 67 430.2 39.1 407.8
OR 48 403.3 48.1 402.3 OR 189 423.6 46.0 419.3
PACU 8 419.9 27.8 393.5 PACU 24 419.8 26.7 407.3
PICU 56 410.7 43.9 412.5 PICU 149 426.0 43.8 416.3
SICU 201 416.7 47.7 408.8 SICU 575 427.8 43.7 415.9
Trauma ICU 66 419.3 47.1 409.0 Trauma ICU 192 431.2 41.7 415.6
Total 1455 416.7 47.1 407.4 Total 4,450 426.7 43.2 414.9

NBCRNA Summary of NCE and SEE Performance and Clinical Experiences CY 2020 Data Rev 02242021 21
Table 23 displays summaries of SEE scores by degree to be attained. As is noted, starting in FY2017,
“Post-Master’s Certificate” is no longer reported as a separate category; instead, it is reported together
with Other Master’s degrees. Due to a transcript category change, MS Nurse Anesthesia/Anesthesiology
is reported in the MS Nurse Anesthesia category, not in the Other Masters as in the past. Although MSN
is still a popular degree, the percentage of SEE candidates enrolled in MSN programs continued to
decrease in 2020 (16.2%) in comparison to 2019 (20.9%) and FY2018 (23.7%). The number of SEE
examinees in doctoral programs continued to increase in 2020 (N=2,620, 58.9%) over the previous fiscal
years 2019 (N = 2,047, 44.2%) and FY2018 (N = 1,291, 30.8%). Score comparisons among groups in this
table should be made with caution because of the small sample size of some subgroups.
Table 23. SEE Candidate Performance by Graduate Degree and Program Year, 2020
Program Year Degree Upon Completion Count Mean
Standard Deviation
5-year Trend Mean
Year 1* MS Nurse Anesthesia 2 471.0 15.6 400.3 MS Nursing Major 14 360.1 40.2 387.5 Other Masters 47 424.2 54.2 399.2 Doctoral 36 391.1 28.6 386.7 Total 99 404.1 50.1 395.6
Year 2 MS Nurse Anesthesia 287 427.4 51.4 407.5 MS Nursing Major 387 421.7 49.6 413.3 Other Masters 152 420.0 47.5 411.0 Doctoral 629 408.0 41.6 398.2 Total 1,455 416.7 47.1 407.5
Year 3 and above MS Nurse Anesthesia 362 437.2 38.6 421.5 MS Nursing Major 318 441.2 37.4 426.4 Other Masters 261 431.6 41.5 422.9 Doctoral 1,955 430.2 39.6 422.6 Total 2,896 432.4 39.6 423.0
Total MS Nurse Anesthesia 651 433.0 44.9 412.3 MS Nursing Major 719 429.2 46.4 416.1 Other Masters 460 427.0 45.2 415.2 Doctoral 2,620 424.4 41.3 415.6 Total 4,450 426.7 43.2 414.8
*There were few students in Year 1 taking SEE in 2020 overall and by Degree program and in past 5-year trend sample. The performance results should be viewed with caution because of very small sample size.

NBCRNA Summary of NCE and SEE Performance and Clinical Experiences CY 2020 Data Rev 02242021 22
Appendix A - Additional NCE and SEE Performance Data Table A1. NCE Pass Rate Trends—First-Time Candidates 2008 through December 31, 2020
Reporting Period Percent Passing
2008* (Graduates 2007 – 2008) 89.9 2009 (Graduates after 2008) 87.7 2010 88.9 2011 89.1 FY2012 88.5 FY2013 88.4 FY2014** 87.8 FY2015 85.0 FY2016 84.5 FY2017 82.6 FY2018 84.3 2019*** 84.4 2020*** 85.2
*Passing standard increased in August 2008 **Passing standard increased in January 2014 ***Indicating Calendar Years 2019 and 2020. Table A2. Descriptive Statistics for NCE Total and Domain-Level Scores—First-Time Candidates 2020 (January 1, 2020 – December 31, 2020)
Mean Standard Deviation
Total Score 496.2 44.5
Basic Science 500.7 60.5
Equipment, Instrumentation and Technology 507.0 70.6
General Principles of Anesthesia 496.7 55.8 Anesthesia for Surgical Procedures and Special Populations 499.8 57.9
Table A3. Descriptive Statistics for SEE Scores and Domain-Level Information, 2020 (January 1, 2020 – December 31, 2020)
1st Year in Program
2nd Year in Program
3rd Year in Program All
Avg SD Avg SD Avg SD Avg SD
Total 404.1 50.1 416.7 47.1 432.4 39.6 426.7 43.2 Basic Science 400.1 60.2 419.2 53.6 429.7 46.4 425.6 49.6 Equipment, Instrumentation and Technology
407.3 53.6 419.5 51.6 436.8 45.5 430.4 48.6
General Principles of Anesthesia 412.8 54.7 416.8 51.6 432.2 44.4 426.7 47.7 Anesthesia for Surgical Procedures and Special Populations
399.9 51.9 414.8 51.1 434.1 45.3 427.0 48.4