NCDR 13 Annual Confere e ACTION Registry-GWTG Workshop #1 · 2007 2008 2009 2010 2011 2012 2013 ......
31
2/28/2013 1 NCDR 13 Annual Conference ACTION Registry-GWTG Workshop #1 Disclosures • Dr. Fonarow, MD, FACC, FAHA – Boston Scientific, Takeda, Amgen, Johnson&Johnson, Medtronic, Gambro, NIH/NIAID, Novartis, NHLBI • Kim Hustler RN No Disclosures • Susan Rogers RN, MSN, NE-BC No Disclosures Objectives Discuss the registry updates for ACTION Registry-GWTG Verbalize ACTION Registry-GWTG recognition criteria
Transcript of NCDR 13 Annual Confere e ACTION Registry-GWTG Workshop #1 · 2007 2008 2009 2010 2011 2012 2013 ......
2/28/2013
1
NCDR 13 Annual Conference
ACTION Registry-GWTG
Workshop #1
Disclosures
• Dr. Fonarow, MD, FACC, FAHA
– Boston Scientific, Takeda, Amgen,
Johnson&Johnson, Medtronic, Gambro,
NIH/NIAID, Novartis, NHLBI
• Kim Hustler RN
No Disclosures
• Susan Rogers RN, MSN, NE-BC
No Disclosures
Objectives
� Discuss the registry updates for ACTION
Registry-GWTG
�Verbalize ACTION Registry-GWTG recognition
criteria

2/28/2013
2
ARS Question # 1How Long Have YOU Been Participating In THE
ACTION Registry-GWTG Data Collection Process?
1. Less than 1 year
2. 1-3 Years
3. 4-7 years
4. Not applicable
Registry Updates
175300
575640 656 680
800
0
200
400
600
800
1000
2007 2008 2009 2010 2011 2012 2013
Enrolled Participants
Recognition Levels

2/28/2013
3
Recognition
2012
• 164 hospitals met the Platinum level• 20 hospitals met the Gold level
• 73 hospitals met the Silver level
2011
• 171 hospitals met Gold level
• 88 hospitals met Silver level
2/28/2013
1
©2011, American Heart Association
Mission:Lifeline ® Reports and Data
• Mission: Lifeline
– Implementation of national recommendations and
guidelines on a community level
– Addresses care of the STEMI patients across the patient
care continuum
– Recognizes there is no “one size fits all” solution to barriers
– Preserves a role for local STEMI Referral Center
– Takes process improvement outside the doors of the
hospitals and into the community (EMS)
Mission:Lifeline ® Program
2/28/2013 2012 AHA Mission: Lifeline 2
• Mission: Lifeline Reports
– Provides data feedback to identify process
improvement success as STEMI care is approached
from a systems perspective
– EMS involvement is critical to meeting the FMC to PCI
< 90 minutes
– Serves as a tool to actively involve all STEMI care
partners including Referral Centers, EMS and other
Receiving Centers
Mission:Lifeline ® Program Report Goals
2/28/2013 2012 AHA Mission: Lifeline 3

2/28/2013
2
2/28/2013 2012 AHA Mission: Lifeline 4
M:L Reports
AHA
ACC
DCRI• Quality Improvement Specialists• Mission: Lifeline Implementation• Provide M:L Reports using AR-G
data
• Keeper of AR-G Data• Operational Support for data
upload• Executes Data Release Consent
Forms• Analyze the AR-G data using
logic specific to ACTION reports• Posts AR-G and M:L Reports
• Analyze the AR-G data using logic specific to M:L
Mission: Lifeline and ACTION Registry-GWTG Relationship
Where are the Mission: Lifeline® Receiving Report Companion Guides located?
2/28/2013 2012 AHA Mission: Lifeline 5
AHA Mission: Lifeline Report Resources
WWW.HEART.ORG/MISSIONLIFELINE
2/28/2013
3
2/28/2013 2012 AHA Mission: Lifeline 7
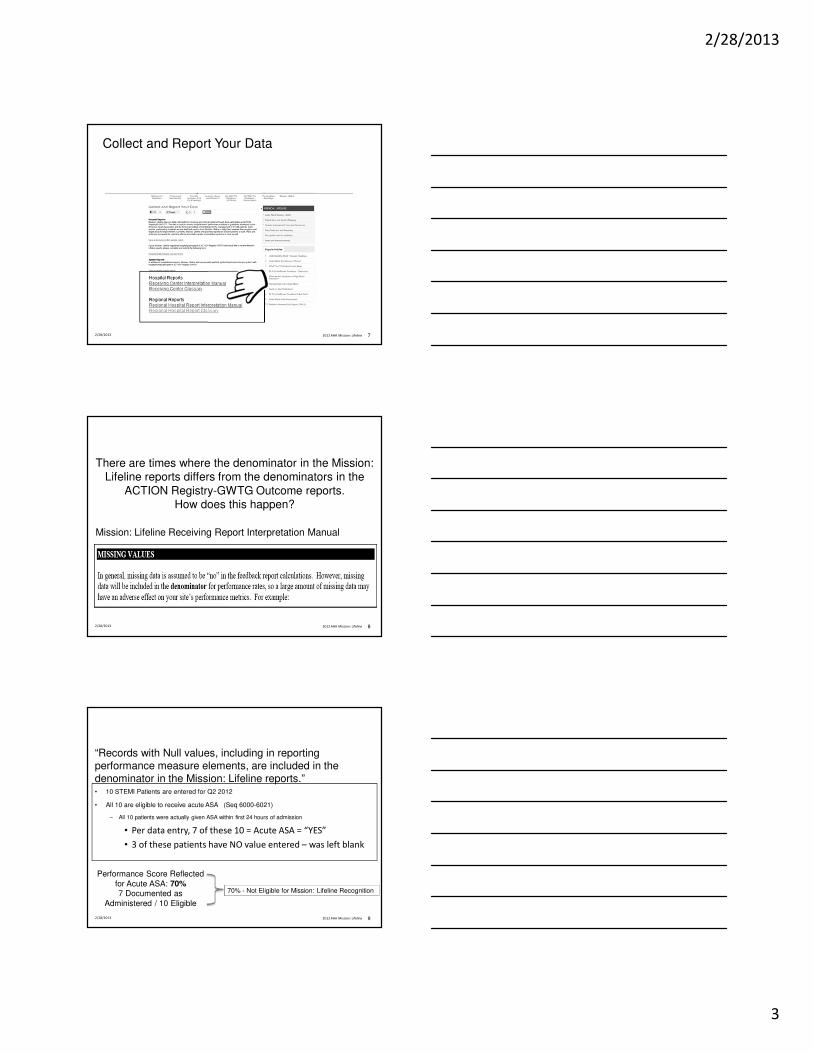
Collect and Report Your Data
Mission: Lifeline Receiving Report Interpretation Manual
There are times where the denominator in the Mission: Lifeline reports differs from the denominators in the
ACTION Registry-GWTG Outcome reports. How does this happen?
2/28/2013 2012 AHA Mission: Lifeline 8
2/28/2013 2012 AHA Mission: Lifeline 9
• 10 STEMI Patients are entered for Q2 2012
• All 10 are eligible to receive acute ASA (Seq 6000-6021)
– All 10 patients were actually given ASA within first 24 hours of admission
• Per data entry, 7 of these 10 = Acute ASA = “YES”
• 3 of these patients have NO value entered – was left blank
Performance Score Reflected for Acute ASA: 70%
7 Documented as Administered / 10 Eligible
70% - Not Eligible for Mission: Lifeline Recognition
“Records with Null values, including in reportingperformance measure elements, are included in the denominator in the Mission: Lifeline reports.”

2/28/2013
4
Highlighted Area = Elements NOT available in the Limited Form
Our hospital is “missing” some data in the Mission: Lifeline report. Why is this?
2/28/2013 2012 AHA Mission: Lifeline 10
Mission: Lifeline Receiving Hospital report Glossary
Limited Users Premier Users
11
Seq 3220, 3221, 3222
Mission: Lifeline Report Stacked Bar Graphs
12
LIMITED USERS
PREMIER USERS
2/28/2013 2012 AHA Mission: Lifeline

2/28/2013
5
Explain the First Medical Contact to PCI < 90 Minutes Measure ?
2/28/2013 2013 AHA Mission: Lifeline 13
Mission: Lifeline Measure:
• Mission: Lifeline First Medical Contact to Primary PCI ≤ 90 Minutes Variable (%) – All STEMI admissions who
receive a primary PCI within 90 minutes from first medical contact prior to arrival at the Receiving Center.
2/28/2013 2012 AHA Mission: Lifeline 14
ACTION Registry-GWTG DATA Definition:
• FMC – What exactly is FMC ?
• Pre-Arrival 1st Med Contact Date/Time = Eye to Eye contact
between the STEMI patient and the 1st Medical provider to
deliver (ACS) Acute Coronary Syndrome care –
• 12 Lead ECG
• Aspirin Administration
• Nitroglycerine Administration
What is the data definition for FMC used in the FMC to PCI measure?
First Medical Contact to PCI < 90 Minutes MeasureWhat patients are included?
2/28/2013 2012 AHA Mission: Lifeline 15

2/28/2013
6
First Medical Contact to PCI < 90 Minutes MeasureWhat patients are NOT included?
2/28/2013 2012 AHA Mission: Lifeline 16
1) The time that should be entered for Seq 3106
(PreArrival FMC Time)?
a) 0930 b) 0955 c) 1015
2) What is the total FMC to PCI time?
a) 75 mins b) 95 mins c) 120 mins
Mission: Lifeline FMC to PCI Scenario 1
0930 –Pt. arrives at Urgent Care
C/C Nausea, Indigestion
0955 – 12 Lead ECG Acquired
1005 – MD reads 12 Lead as “possible STEMI”
1015– 911 EMS is Called
1025 – EMS arrives at patient
1032 – EMS Departs Scene, confirms STEMI
1035 – EMS notifies ED via radio of patient
status and 12 Lead ECG findings
1037 – STEMI Alert is activated
1045- EMS arrives and is directed through ED
1047 – Patient arrives in Cath Lab
1105 – 1st Device Activated
2/28/2013 172012 AHA Mission: Lifeline
1500 - Betty White presents to The
Dental Clinic of America – She happens
to be Weak and Dizzy
1520 - EMS Called
1530 - EMS at Betty’s Side
1535 – EMS acquires a 12 Lead ECG –No STEMI noted
1540 - EMS enroute to ED
1555 - EMS arrives at PCI ED
1600 - ECG Acquired in ED- Showed Same as EMS’s ECG
1650 - Repeat ECG Acquired in ED
1652 - STEMI Alert Activated
Mission: Lifeline FMC to PCI Scenario 2
2/28/2013 2012 AHA Mission: Lifeline 18

2/28/2013
7
2/28/2013 2012 AHA Mission: Lifeline 19
INCLUDED OR EXCLUDED
FMC = a) 1500 Arrival to clinicb) 1520 Time EMS is calledc) 1530 EMS at Betty’s side
AR-G Limited and Premier Forms
AR-G Limited and Premier Forms
In Mission: Lifeline FMC to PCI Measure Denominator?
2/28/2013 2012 AHA Mission: Lifeline 20
INCLUDED OR EXCLUDED
FMC = a) 1500 Arrival to clinicb) 1520 Time EMS is calledc) 1530 EMS at Betty’s side
AR-G Limited and Premier Forms
AR-G Limited and Premier Forms
In Mission: Lifeline FMC to PCI Measure Denominator?
1530
0000 - EMS Arrives at Patient with a chief complaint of Chest Pain and SOB
0030 – Patient Arrives at ED - Basic EMT Crew – No Pre-hospital12 Lead Acquired
0035 – 12 Lead ECG Acquired in ED
0045 - STEMI Noted on 12 Lead
0050 – STEMI Alert Called
0125 – Patient to Cath Lab
0140 - 1st Device Activated
Total FMC to PCI = a) 80 Minutes b) 90 Minutes c) 100 minutes
Door to Balloon = a) < 90 Minutes b) > 90 Minutes
Mission: Lifeline FMC to PCI Measure - INCLUDED OR EXCLUDED
Mission: Lifeline FMC to PCI Scenario 3
2/28/2013 2012 AHA Mission: Lifeline 21

2/28/2013
8
• Looks at the Mission: Lifeline data across a user-specified region
– Physical Region
– Functional Region
– State as a Region
– Corporate Region
• Provides state, national and regional benchmarks
• Option for Blinded versus Un-Blinded Data
• Requires Data Release Consent Forms specific to M:L Regional Reports
• Region organized through a Region Champion and local AHA Quality
Improvement and/or Mission: Lifeline staff
• Cost – One time fee $475.00 per 20 hospitals (so long as the template does not
change)
Mission: Lifeline Regional Reports
2/28/2013 2012 AHA Mission: Lifeline 22
Examples of Regions Receiving M:L Regional Reports
2/28/2013 2012 AHA Mission: Lifeline 23Tampa Bay, FL
Mission: Lifeline Regional Reports
2/28/2013 2012 AHA Mission: Lifeline 24

2/28/2013
9
2/28/2013 2012 AHA Mission: Lifeline 25
2/28/2013 2012 AHA Mission: Lifeline 26
2/28/2013 2012 AHA Mission: Lifeline 27

2/28/2013
10
• WWW.HEART.ORG/MISSIONLIFELINE
• Lori Hollowell, Quality and Systems Improvement Consultant,
Mission: Lifeline and ACTION Registry-GWTG
• Katherine Kuban, Mission: Lifeline Program Manager
– Chris Bjerke, National Director, Mission: Lifeline
For More Mission: Lifeline Information
2/28/2013 2012 AHA Mission: Lifeline 28

2/28/2013
1
ACTION Registry-GWTG
Using the Dashboard Comparator
Susan Rogers RN, MSN, NE-BC
Objectives
�Discuss the basic dashboard functionality
�Describe the methods that may help to
identify performance successes and gaps
�Discuss the results of using the comparator
�Access Your Hospital’s Reports
�On Demand Reports
�Drill Down:Patient Level
�Access Your Hospital’s Reports
�Create Your Hospital’s compare Groups
�On Demand Reports
�Drill Down: Patient Level

2/28/2013
2
H_7KYi
Filter Criteria
Comparator
• Select Filter Criteria
• Run Analysis
• Export Results
• Six or more hospitals are required for
comparison
Click
2/28/2013
3
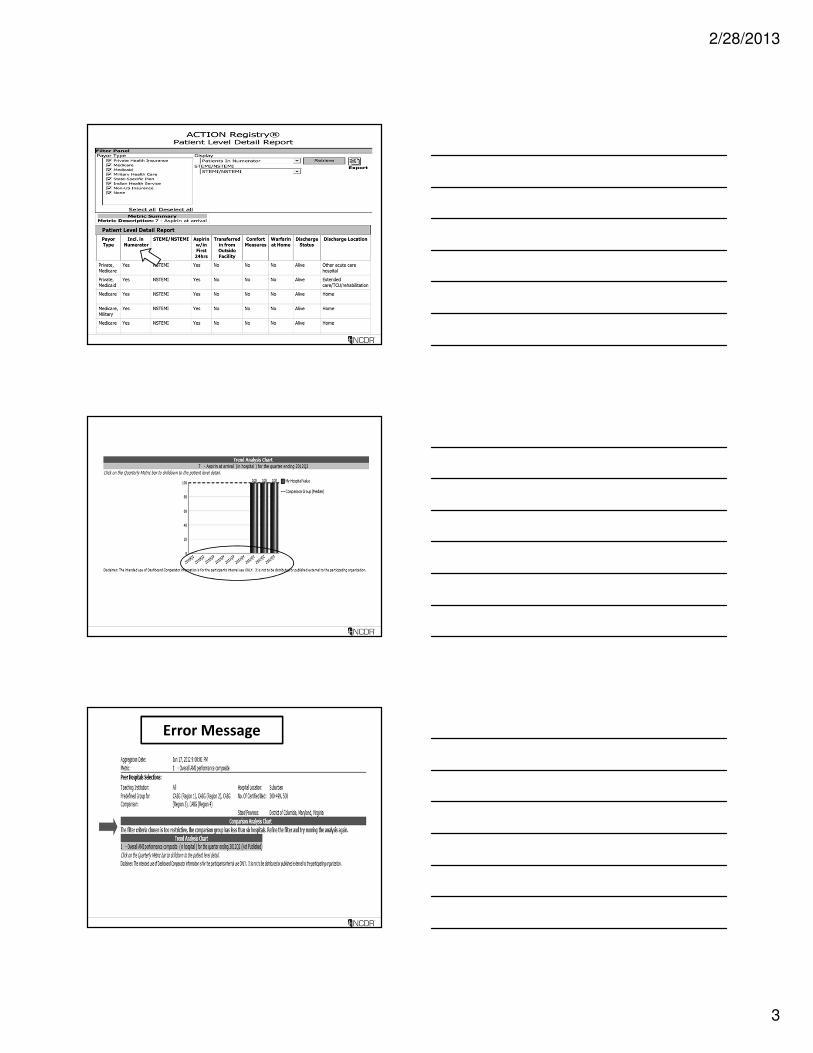
Error Message

2/28/2013
4
Documentation:
Your hospital belongs to a
system of hospitals.
The QI committee members at
your hospital requested data
comparing the other hospitals
in your System on Metric 22.
All AMI Patients who receive an ECG
within 10 minutes of arrival
Comparator Drill Down
Dashboard Comparator:
How would you interpret these results?
ARS Question:
How would you interpret these
results?
1. My hospital is able to perform an ECG on AMI
patients within 10 minutes of arrival more often
then the other hospitals in my System.
2. The other hospitals in my System have larger
volumes of patients.
2/28/2013
5
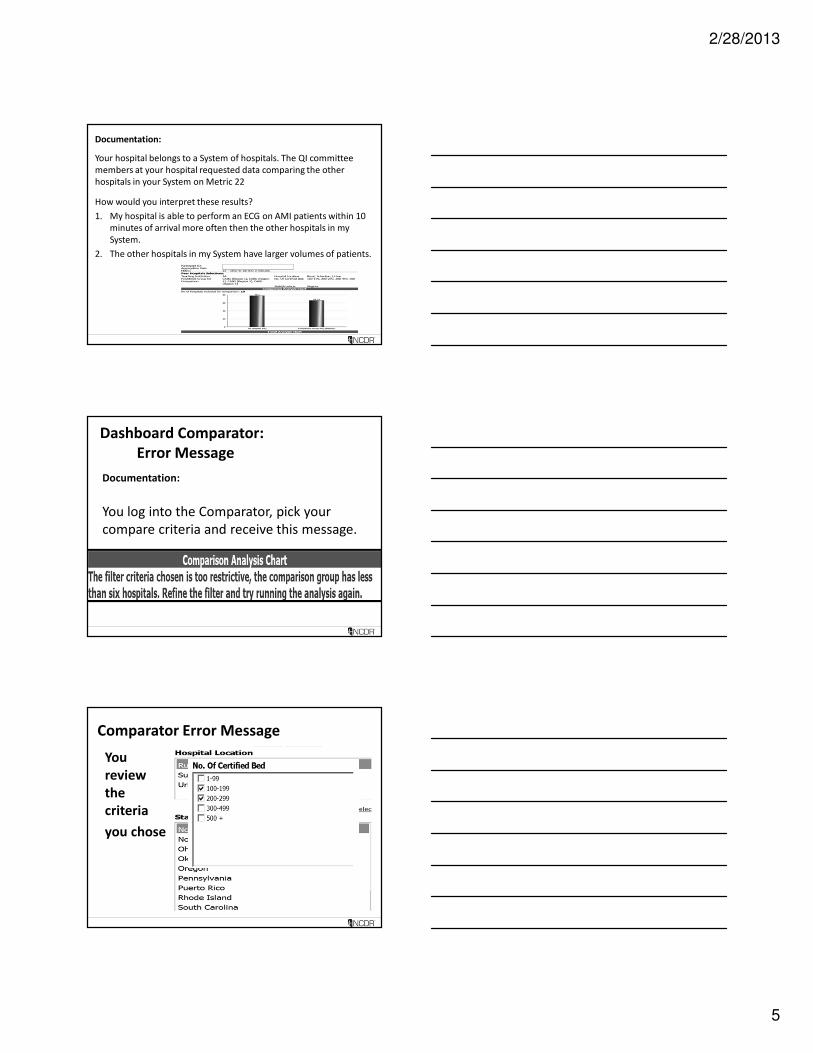
Documentation:
Your hospital belongs to a System of hospitals. The QI committee
members at your hospital requested data comparing the other
hospitals in your System on Metric 22
How would you interpret these results?
1. My hospital is able to perform an ECG on AMI patients within 10
minutes of arrival more often then the other hospitals in my
System.
2. The other hospitals in my System have larger volumes of patients.
Dashboard Comparator:
Error Message
Documentation:
You log into the Comparator, pick your
compare criteria and receive this message.
Comparator Error Message
You
review
the
criteria
you chose

2/28/2013
6
ARS Question
What do I do to receive the compare report?
1. Change the criteria selected
2. Expand the number of beds
3. Expand the number of hospitals
4. Include additional states in your region
5. All of the above
Documentation:
What steps do I take to receive the compare
report?
1. Change the criteria selected
2. Expand the number of beds
3. Expand the number of hospitals
4. Include additional states in your region
5. All of the above
Thank You
2/28/2013
1
NCDR. 13 Case Scenario Presentation
ACTION Registry-GWTG
Kim Hustler, RN
Clinical Quality Consultant
Case Scenarios
• Unique sessions for beginners to experts
• Real case scenarios
• Process for utilizing the dashboard
• ARS participation
Objectives for the ACTION Registry-
GWTG
Case Scenario Presentation
Discuss the implication of data entry on dashboard
and outcome reports
Discuss the utilization of the companion guide in
determining reasons for dashboard fall outs
Demonstrate knowledge of data abstraction
through participation with ARS
2/28/2013
2
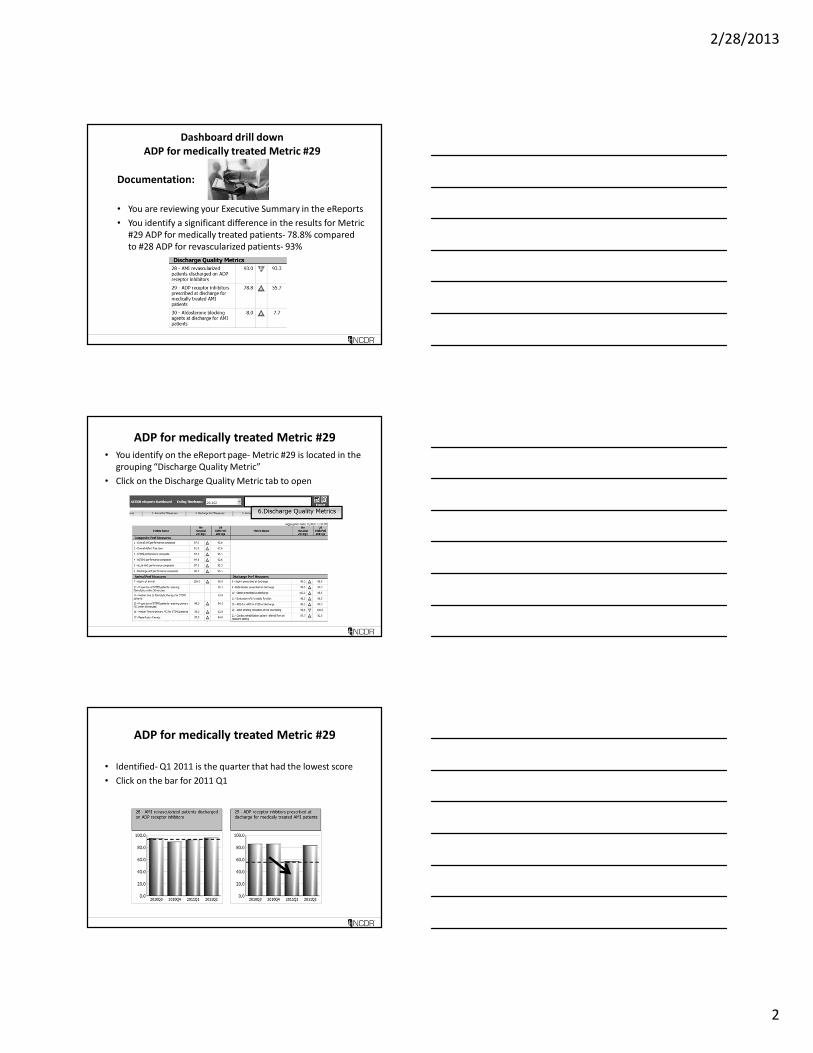
Dashboard drill down
ADP for medically treated Metric #29
Documentation:
• You are reviewing your Executive Summary in the eReports
• You identify a significant difference in the results for Metric
#29 ADP for medically treated patients- 78.8% compared
to #28 ADP for revascularized patients- 93%
ADP for medically treated Metric #29
• You identify on the eReport page- Metric #29 is located in the
grouping “Discharge Quality Metric”
• Click on the Discharge Quality Metric tab to open
ADP for medically treated Metric #29
• Identified- Q1 2011 is the quarter that had the lowest score
• Click on the bar for 2011 Q1

2/28/2013
3
ADP for medically treated Metric #29
• The drill down provides the individual patient
performance
• Look for “no’s” in the numerator column
• There are 3 “no’s”
ADP for medically treated Metric #29
• Export to excel- to narrow down search- helpful with high
volume of patients
ADP for medically treated Metric #29
Highlight the row you wish to be utilized for filtering (title row)
To filter- select “data”- click on filter (funnel shape)

2/28/2013
4
ADP for medically treated Metric #29
• The filtering arrows appear- click on arrow
ADP for medically treated Metric #29
• You review the patient records to assess if data entry error or
issue with care provided
• Findings- patient 1782677 presented with symptoms of ACS
• STEMI- to cath lab- left heart cath completed
• No PCI- anatomy not suitable to primary PCI
• Recommended for CABG- patient refused
Review drill down to see if data was entered
correctly

2/28/2013
5
ARS Question # 1
Should this patient be included in the denominator
since they did not have reperfusion (no PCI/ no
stent)?
1. No
2. Yes
ADP for medically treated Metric #29
Documentation:
• Findings- patient 1782677 presented with symptoms of ACS
• STEMI- to cath lab- left heart cath completed
• No PCI- anatomy not suitable to primary PCI
• Recommended for CABG- patient refused
Should this patient be included in the denominator since
they did not have reperfusion (no PCI/ no stent)?
1. No
2. Yes
Overall AMI Performance Composite
Documentation:
• The Executive summary dashboard & Outcomes report has
a score or 75%
• The Overall AMI Performance Composite has:
• Denominator of 8
• Numerator of 6

2/28/2013
6
ARS Question # 2
Does this mean there were 8 patients in the registry
for the rolling 4 quarters?
1. No
2. Yes
Overall AMI Performance CompositeDocumentation:
• The Overall AMI Performance Composite (75%) has:
• Denominator of 8
• Numerator of 6
Does this mean there were 8 patients in the registry for the
rolling 4 quarters?
1. No
2. Yes
Overall AMI Performance Composite
Documentation:
• Higher volume facility
• Overall performance composite score is 98.2%
2/28/2013
7
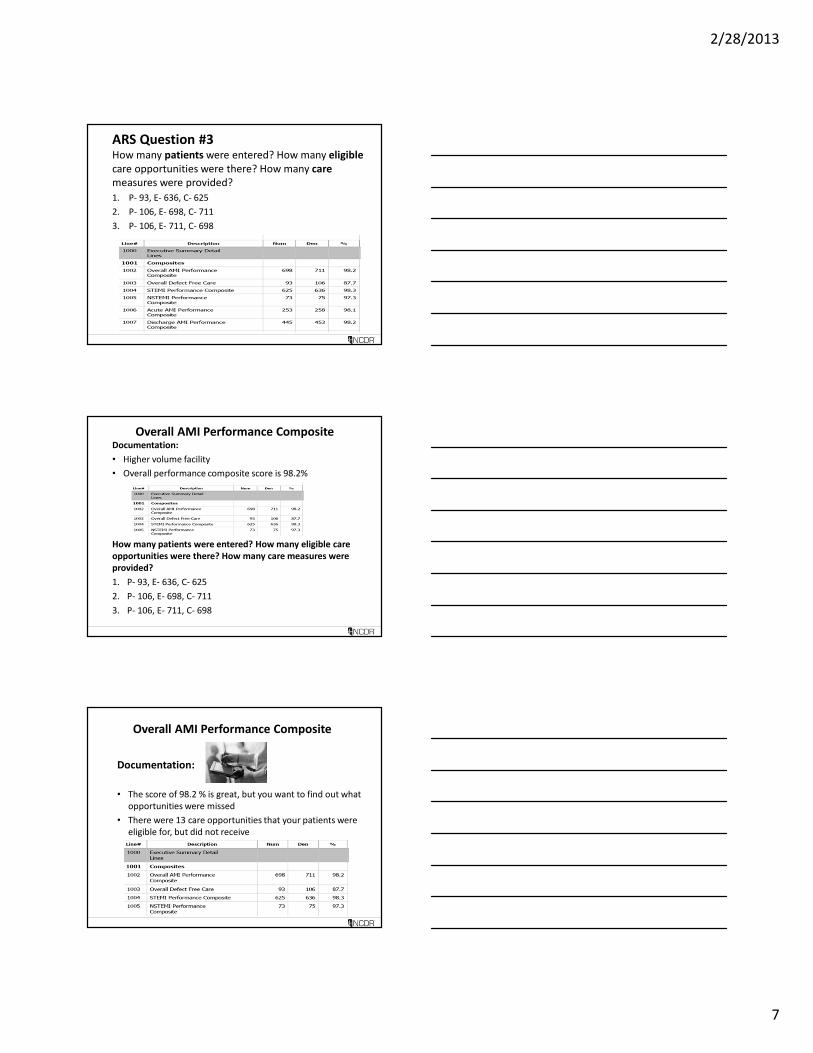
ARS Question #3How many patients were entered? How many eligible
care opportunities were there? How many care
measures were provided?
1. P- 93, E- 636, C- 625
2. P- 106, E- 698, C- 711
3. P- 106, E- 711, C- 698
Overall AMI Performance CompositeDocumentation:
• Higher volume facility
• Overall performance composite score is 98.2%
How many patients were entered? How many eligible care
opportunities were there? How many care measures were
provided?
1. P- 93, E- 636, C- 625
2. P- 106, E- 698, C- 711
3. P- 106, E- 711, C- 698
Overall AMI Performance Composite
Documentation:
• The score of 98.2 % is great, but you want to find out what
opportunities were missed
• There were 13 care opportunities that your patients were
eligible for, but did not receive

2/28/2013
8
ARS Question #4
How would you identify which patients and which
care measures were not provided to these patients?
1. Dashboard Overall Composite
2. Outcomes Report detail lines
3. Dashboard Overall Composite drill down
Overall AMI Performance Composite
Documentation:
• The score of 98.2 % is great, but you want to find out what
opportunities were missed
• There were 13 care opportunities that your patients were
eligible for, but did not receive
How would you identify which patients and which
care measures were not provided to this patient?
1. Dashboard Overall Composite
2. Outcomes Report detail lines
3. Dashboard Overall Composite drill down
Dashboard
Door to ECG Metric #22
Documentation:
• You have been working hard to reduce your door to ECG
times
• You review your Outcomes Report and note a negative
value for Pre-Hospital to Balloon time, detail line 1268 ECG
to arrival time
1268 ECG to Arrival - 60

2/28/2013
9
ARS Question #5
What could cause the “ECG to arrival time” to be a
negative value?
1. ECG was performed prior to arrival
2. ECG- Pre-Hospital, ECG #4021- time prior to arrival
3. ECG- After 1st hosp. arrival, #4021- time after arrival
4. Selection for #4010 & time for #4021 do not coincide
Door to ECG
Documentation:
• You review your Outcomes Report and note a negative
value for Pre-Hospital to Balloon time, detail line 1268 ECG
to arrival time
What could cause the “ECG to arrival time” to be a negative
value?
1. ECG was performed prior to arrival
2. ECG- Pre-Hospital, ECG #4021- time prior to arrival
3. ECG- After 1st hosp. arrival, #4021- time after arrival
4. Selection for #4010 & time for #4021 do not coincide
Dashboard
Submission near data deadline
Documentation:
• You are working through the quarter and want to verify the
data entered is correct for the next Outcomes report
• You review the dashboard graphs and individual metric
drill downs for the performance measures and quality
metrics
• You find a few errors- make the corrections- data collection
tool- then resubmit your data through the DQR on Sunday
at 09:00
2/28/2013
10
ARS Question #6
Will the corrections be included in the Sunday
dashboard data aggregation?
1. No
2. Yes
Overall AMI Performance Composite
Documentation:
• You review the dashboard graphs and individual metric drill
downs for the performance measures & quality metrics
• You find a few errors and make corrections- data collection
tool- resubmit your data through the DQR on Sunday at
09:00
Will the corrections be included in the Sunday
dashboard data aggregation?
1. No
2. Yes
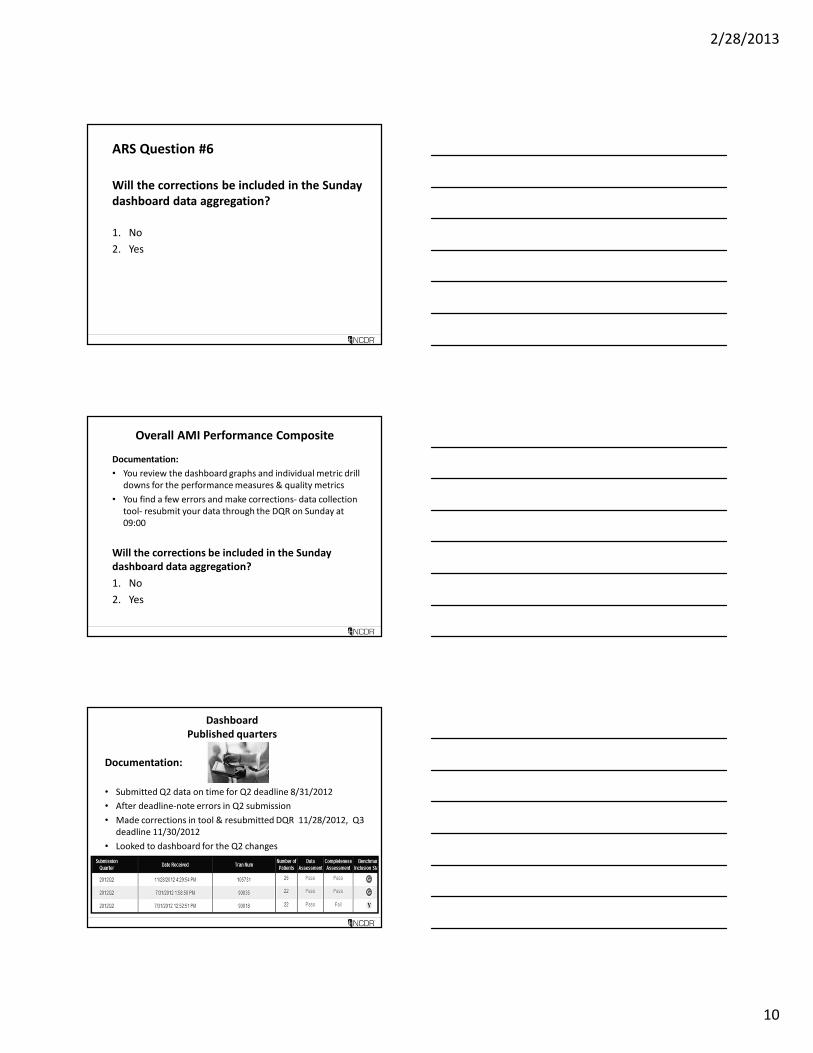
Dashboard
Published quarters
Documentation:
• Submitted Q2 data on time for Q2 deadline 8/31/2012
• After deadline-note errors in Q2 submission
• Made corrections in tool & resubmitted DQR 11/28/2012, Q3
deadline 11/30/2012
• Looked to dashboard for the Q2 changes

2/28/2013
11
ARS Question #7
When will the Q2 changes be reflected in the
dashboard?
1. With the next Sunday’s data aggregation
2. After the Q3 Outcomes Report is created
3. Upon request Q2 Outcomes Report will be re-aggregated
4. The changes will not be available in the dashboard
Published quarters
Documentation:
• Submitted Q2 data on time for Q2 deadline 8/31/2012
• After deadline-note errors in Q2 submission
• Made corrections in tool & resubmitted DQR 11/28/2012,
Q3 deadline 11/30/2012
• Looked to dashboard for the Q2 changes
When will the Q2 changes be reflected in the
dashboard?
1. With the next Sunday’s data aggregation
2. After the Q3 Outcomes Report is created
3. Upon request Q2 Outcomes Report will be re-aggregated
4. The changes will not be available in the dashboard
Dashboard
Overall Defect Free Care
Documentation:
• Reviewing Defect Free
Composite
• Q1-79.7%, Q2-86.1%
• Defect free care is % of time
providing perfect care
• Drill down to see what metric
needs improvement
2/28/2013
12
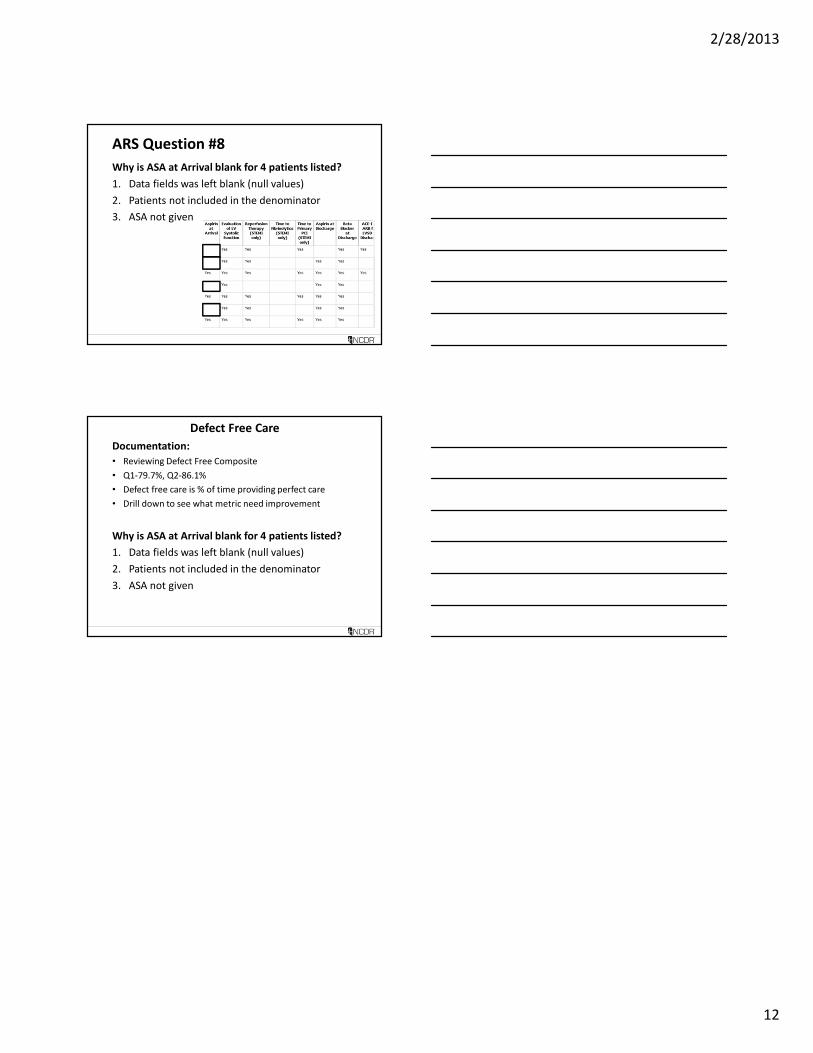
ARS Question #8
Why is ASA at Arrival blank for 4 patients listed?
1. Data fields was left blank (null values)
2. Patients not included in the denominator
3. ASA not given
Defect Free Care
Documentation:
• Reviewing Defect Free Composite
• Q1-79.7%, Q2-86.1%
• Defect free care is % of time providing perfect care
• Drill down to see what metric need improvement
Why is ASA at Arrival blank for 4 patients listed?
1. Data fields was left blank (null values)
2. Patients not included in the denominator
3. ASA not given