
NCDA 2012 Winter Legislative & Policy Meeting Ben Winter, Policy Development, PD&R, HUD Paul Joice,...
17
NCDA 2012 Winter Legislative & Policy Meeting Ben Winter, Policy Development, PD&R, HUD Paul Joice, Office of Evaluation, PD&R, HUD Redistribution Effects of Introducing ACS and Census 2010 Data Into the CDBG Formula
-
Upload
christina-constance-todd -
Category
Documents
-
view
222 -
download
0
Transcript of NCDA 2012 Winter Legislative & Policy Meeting Ben Winter, Policy Development, PD&R, HUD Paul Joice,...

NCDA 2012 Winter Legislative & Policy Meeting
Ben Winter, Policy Development, PD&R, HUD
Paul Joice, Office of Evaluation, PD&R, HUD
Redistribution Effects of Introducing ACS and Census 2010 Data
Into the CDBG Formula

• Policy Development & Research (PD&R) & Community Planning and Development (CPD)
• CDBG Analysis
• Needs Study• Distribution Effects of New Data• huduser.org
Introduction

• Census Long form to ACS• Goal: Isolate and examine the effects of introducing
new data into the CDBG formula • Holds constant FY 2011 appropriation amount and
grantee universe • Examines changes in variables
Introduction to Analysis
Factors FY 2011 Allocation FY 2012 Allocation
Formula A Factors
Population 2009 Population Estimates 2010 CensusPoverty 2000 Census 2005–2009 ACSOvercrowding 2000 Census 2005–2009 ACS
Formula B Factors
Growth lag 2009 Population Estimates and 1960 Census 2010 Census and 1960 CensusPoverty 2000 Census 2005–2009 ACSPre-1940 housing 2000 Census 2005–2009 ACS

Formula Mechanics for Entitlements
• 3 Grantees: metropolitan cities, urban counties, & states (non-entitlement communities)
• Formula A: {0.25 x Pop (a) + 0.50 x Pov (a) + 0.25 x Ocrowd (a) } x {0.7 x Appropriation}
Pop (MA) Pov (MA) Ocrowd (MA)
• Formula B (cities):{0.20 x Glag (a) + 0.30 x Pov (a) + 0.50 x Age (a) } x {0.7 x Appropriation}
Glag (MC) Pov (MA) Age (MA)
• Formula B (urban counties):{0.20 x Glag (a) + 0.30 x Pov (a) + 0.50 x Age (a) } x {0.7 x Appropriation}
Glag (ENT) Pov (MA) Age (MA)

Mechanics for Non-entitlements
• Formula A: {0.25 x Pop (a) + 0.50 x Pov (a) + 0.25 x Ocrowd (a) } x {0.3 x Appropriation}
Pop (Nent) Pov (Nent) Ocrowd (Nent)
• Formula B:{0.20 x Pop (a) + 0.30 x Pov (a) + 0.50 x Age (a) } x {0.3 x Appropriation}
Pop (Nent) Pov (Nent) Age (Nent)

Overall Trends in Variables
CitiesBalance of
Metro Areas Metro Areas
Population2009 Population Estimates 126,330,750 134,795,096 261,125,8462010 Census 125,843,466 136,008,672 261,852,138Percent Change -0.4% 0.9% 0.3%PovertyCensus 2000 18,401,833 10,308,189 28,710,022ACS 05/09 20,671,664 12,724,840 33,396,504Percent Change 12.3% 23.4% 16.3%OvercrowdingCensus 2000 3,861,310 1,813,634 5,674,944ACS 05/09 2,002,160 1,037,538 3,039,698Percent Change -48.1% -42.8% -46.4%Pre-1940 HousingCensus 2000 8,338,128 5,032,353 13,370,481ACS 05/09 9,320,169 5,084,319 14,404,488Percent Change 11.8% 1.0% 7.7%
Entitlement Jurisdictions
Nonentilement Areas
Population2009 Population Estimates 201,180,773 108,932,4892010 Census 201,270,119 110,340,632Percent Change 0.0% 1.3%Poverty Census 2000 23,471,950 11,978,807ACS 05/09 27,014,044 14,008,083Percent Change 15.1% 16.9%OvercrowdingCensus 2000 5,019,582 1,232,717ACS 05/09 2,630,534 778,680Percent Change -47.6% -36.8%Pre-1940 HousingCensus 2000 10,576,185 6,825,438ACS 05/09 11,578,443 6,882,096Percent Change 9.5% 0.8%

Grantee Examples
Formula A – Phoenix, AZ
Variable Population Poverty Overcrowdin
g Total Data FY 2011 (n) 1,593,659 205,320 58,109 Census 2010 & ACS 05/09 data (n) 1,445,632 276,784 33,552 Change (%) -9.3% 34.8% -42.3% Share (%) FY 2011 0.61% 0.72% 1.02% Census 2010 & ACS 05/09 data 0.55% 0.83% 1.10% Change -10% 16% 8% Grant FY 2011 ($000s) 3,081 7,221 5,169 15,471
Census 2010 & ACS 05/09 data ($000s) 2,787 8,345 5,549 16,681
Change (%) -10% 16% 7% 7.82%
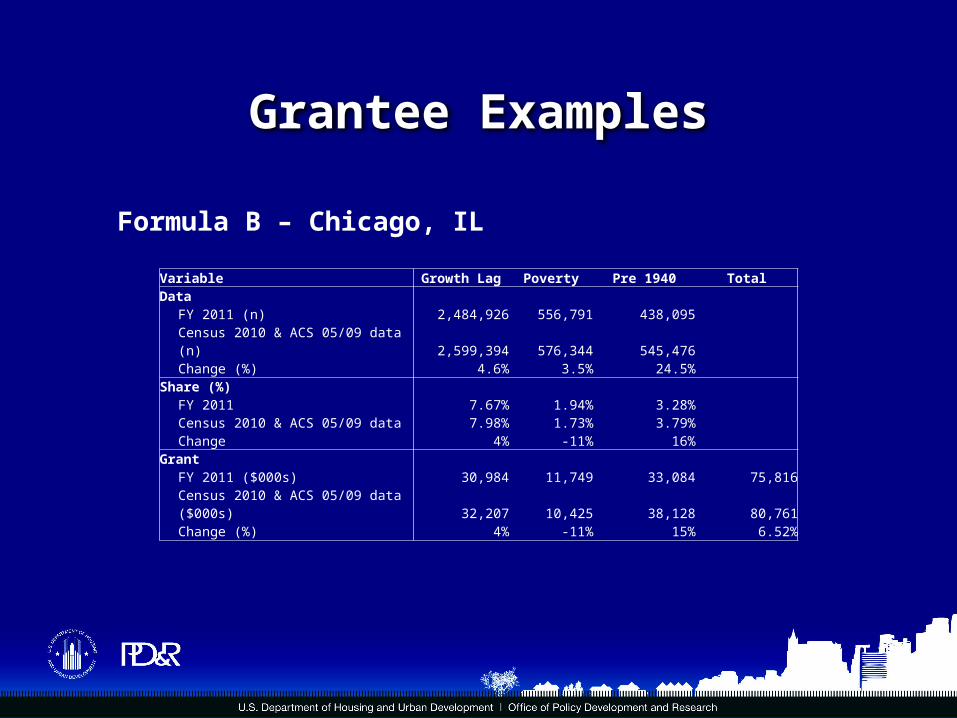
Grantee Examples
Formula B – Chicago, IL
Variable Growth Lag Poverty Pre 1940 TotalData FY 2011 (n) 2,484,926 556,791 438,095 Census 2010 & ACS 05/09 data (n) 2,599,394 576,344 545,476 Change (%) 4.6% 3.5% 24.5% Share (%) FY 2011 7.67% 1.94% 3.28% Census 2010 & ACS 05/09 data 7.98% 1.73% 3.79% Change 4% -11% 16% Grant FY 2011 ($000s) 30,984 11,749 33,084 75,816
Census 2010 & ACS 05/09 data ($000s) 32,207 10,425 38,128 80,761
Change (%) 4% -11% 15% 6.52%

Grantee Examples
Switch Formula – Madison, WI
VariablePopulatio
n Growth Lag Poverty Overcrowdi
ng Pre 1940 Total Data FY 2011 (n) 235,419 0 29,287 3,103 15,626
Census 2010 & ACS 05/09 data (n) 233,209 0 42,238 1,947 16,991
Change (%) -1% 44% -37% 9% Share (%) FY 2011 0.09% 0.00% 0.10% 0.05% 0.12%
Census 2010 & ACS 05/09 data 0.09% 0.00% 0.13% 0.06% 0.12%
Change -1% 24% 17% 1% Grant FY 2011 ($000s) 0 0 618 0 1,180 1,798
Census 2010 & ACS 05/09 data ($000s) 450 0 1,273 321 0 2,044
Change (%) 14%

Change by Grantee Type
Jurisdiction Type
No. of
Jurisdictions
Grant Amount (000,000’s)
% Change Due To
Formula Switch
Percent Change by Variable
Formula A Formula B
FY 2011New Data
Total % Change Population Poverty
Overcrowding
Growth Lag Poverty
Pre-1940
Principal city 637 1,523 1,526 0.2 – 0.4 0.0 0.1 – 0.2 0.2 – 0.9 1.3
Satellite city 347 288 279 – 3.1 0.2 0.0 – 1.1 – 1.1 – 0.8 0.0 – 0.3
Urban county 182 496 502 1.2 0 0.3 2.7 0.1 – 0.5 0.0 – 1.4
[1] Percent change by variable does not add up exactly to the total percent change due to rounding.
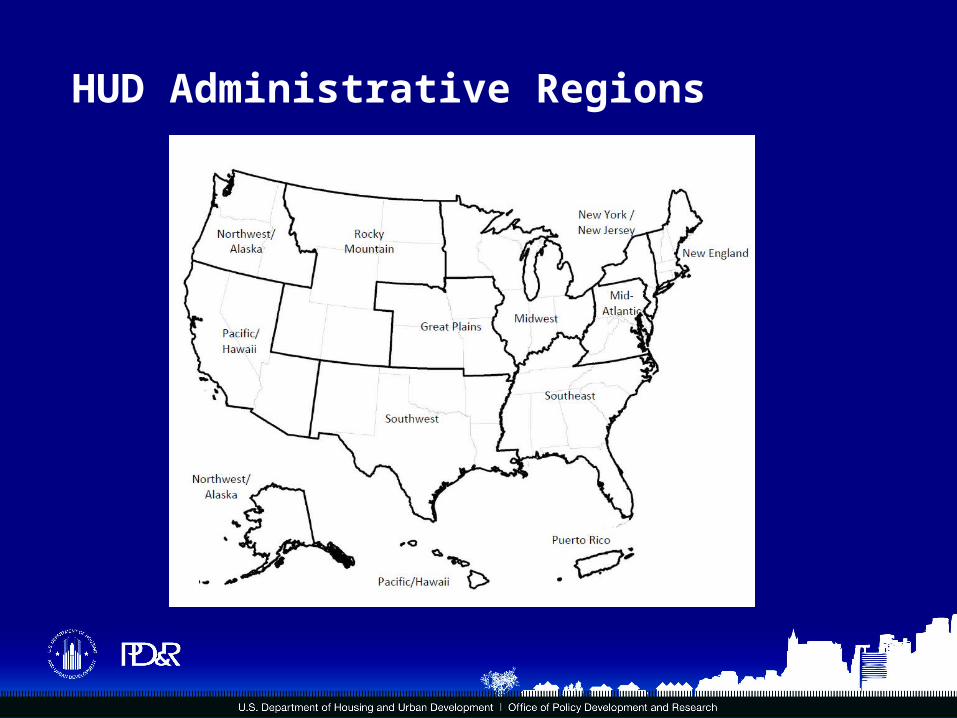
HUD Administrative Regions

Regional Shifts, Entitlement Grantees
RegionNum.
GranteesFY 2011
New Data
% Change of Funding
New England 77 5.0 5.0 1.3New York/New Jersey 105 15.4 15.3 – 0.6Mid-Atlantic 102 11.4 10.8 – 4.9Southeast 189 11.2 11.2 – 0.2Midwest 205 18.1 19.0 5.3Southwest 120 9.6 10.0 3.5Great Plains 39 2.9 3.1 6.8Rocky Mountain 46 2.0 2.1 9.5Pacific/Hawaii 204 19.2 18.6 – 3.1Northwest/Alaska 52 2.8 2.9 2.2Puerto Rico 27 2.4 1.9 – 22.6Total 1,166 100.0 100.0 0.0

Regional Shifts, Entitlement Grantees
Region Number
Grant Amount (000,000’s)
Due to Switching Formulas
Formula A Formula B
FY 2011 New Data Total % Change Pop. Poverty Over-
crowdingGrowth
Lag PovertyPre-1940 Hsng
New England 77 115 116 1.3 0.0 0.00 0.00 0.00 – 1.10 – 0.70 3.20
New York/New Jersey 105 354 352 – 0.6 0.1 0.00 – 0.10 0.10 – 0.40 – 2.80 2.60
Mid-Atlantic 102 263 250 – 4.9 – 0.1 0.10 – 0.10 – 0.40 – 0.80 – 0.90 – 2.80
Southeast 189 259 258 – 0.2 – 1.3 0.10 3.90 – 3.30 0.60 – 0.20 0.20
Midwest 205 417 439 5.3 0.1 0.10 1.80 0.20 0.50 0.60 2.00
Southwest 120 222 230 3.5 0.0 0.10 4.20 0.60 0.00 – 0.70 – 0.70
Great Plains 39 68 73 6.8 0.4 0.10 2.30 0.40 0.70 0.80 2.10
Rocky Mountain 46 45 49 9.5 — – 0.10 9.10 1.70 – 0.30 0.40 – 1.30
Pacific/Hawaii 204 442 428 – 3.1 0.0 0.00 – 4.00 1.00 0.00 – 0.20 0.00
Northwest/Alaska 52 66 67 2.2 0.0 0.10 3.60 0.20 – 0.60 0.10 – 1.20
Puerto Rico 27 56 43 – 22.6 – 4.2 – 0.50 – 10.00 – 7.90 – – –
TOTAL 1,166 2,307 2,307 0.0 – 0.2 0.00 0.50 – 0.20 – 0.10 – 0.60 0.60

Census Long Form vs. ACS
Similarities:
• Common questions
• Response rate (97%+)
• Sampling frame (all addresses in the US)
Differences:
• Sample size (18 million vs. 15 million)
• Point-in-time vs. period estimates
• Precision and accuracy of data

Confirming Key Trends
Overcrowding (more than 1 person per room): 5.7% 3%
• Moves closer to AHS estimates (around 2.2% to 2.5% during 2001-2009)• Results from fewer small units; not change in household size
Pre-1940 housing (structure built before 1940): 20.4% 3%
• AHS: net decrease in pre-1940 units from 2001 to 2007• Non-response problem, particularly in older rental buildings• ACS estimates are closer to administrative data

HOME Formula and LMI Data
HOME Formula affected by similar issues to CDBG. Overcrowding not a factor. Pre-1950 housing instead of pre-1940.
Low & Moderate Income (LMI) Data for CDBG Area Benefit:
• Will be based on census tracts instead of block groups• Produced by Census Bureau along with CHAS data and other custom tabulations of ACS. Delivery of 2005-2009 LMI Data delayed, but expected by February 2012.