NCCA Proj Maths LCS2 v2 · Project Maths Mathematics Resources for Students Leaving Certificate –...
32
Project Maths Mathematics Resources for Students Leaving Certificate – Strand 2 Geometry and Trigonometry © NCCA 2009
Transcript of NCCA Proj Maths LCS2 v2 · Project Maths Mathematics Resources for Students Leaving Certificate –...

Project Maths
Mathematics Resources for Students
Leaving Certificate – Strand 2
Geometry and Trigonometry
© NCCA 2009

PROJECT MATHS - Mathematics Resources for Students
InTROduCTIOn
This booklet is designed to supplement the work you have done in Leaving Cert geometry with your teacher. There are activities included for use as homework or in school. The activities will help you to understand more about the concepts you are learning in geometry. Some of the activities have spaces for you to fill in answers, while others will require you to use drawing instruments and paper of your own. You may not need or be able to complete all of the activities; your teacher will direct you to activities and/or questions that are suitable.
You should note that Foundation level material is a subset of Ordinary level. Students at OL can expect to be tested on material from the Foundation level course, but at a greater degree of difficulty. The same will apply to Higher level students, who can be tested on syllabus material from a lower level, but at a greater degree of difficulty. The sequence in which the sections/topics are presented here is not significant. You may be studying these in a different order, or dipping in and out of various sections over the course of your study and/or revision.
In the first section (synthetic geometry), it is important you understand the approach taken. Although only Higher level students are required to reproduce the proof of some theorems, all students are expected to follow the logic and deduction used in the proofs. This type of understanding is required when solving problems such as those from activity 5 onwards.
Each activity or question you complete should be kept in a folder for reference and used for revision at a later date. A modified version of this booklet and syllabus documents are available at www.ncca.ie/projectmaths and other related materials at www.projectmaths.ie.

1
Leaving Certificate Mathemathics - Strand 2 - GEOMETRY And TRIGOnOMETRY
InTROduCTIOnThe activities described below and the questions that follow allow you to deepen your understanding of concepts in geometry as well as to solve problems using these concepts and their applications.
GEOMETRY 1
SYllAbuS TOPIC: Synthetic geoMetRy
lEARnInG OuTCOMEAs a result of completing the activities in this section you will be able to• complete a number of constructions
• use the listed terms related to logic and deductive reasoning: theorem, proof, axiom, corollary, converse, implies;
• investigate theorems and solve problems.
HL learners will
• extend their understanding of geometry through the use of formal proof for certain theorems.

2
PROJECT MATHS - Mathematics Resources for Students
Activity 1.1 lCFlIn a developing country an engineer is given the problem of digging a new well in a community where there are three villages. The ideal situation would be to have a well in each village, but this is not possible due to cutbacks. He has a map with the towns on it and he wants to minimise the walking to be done by the people who will carry the water.
Map
i. Where is the best place to dig the well?
ii. How would you find the nearest point to the three villages?
iii. Is there any other point that is also nearest, or is it unique?
iv. What would happen to this point if the Thirstyblock was more to the left or right?
v. What do we call this ‘nearest’ point?
The ‘nearest’ point for the three villages seems always to be inside the triangle. Could it ever be outside the triangle? Try drawing a triangle with a circumcentre outside of the triangle.
Thirstyblock
Dryside
Aridzona

3
Leaving Certificate Mathemathics - Strand 2 - GEOMETRY And TRIGOnOMETRY
Activity 1.2 lCOlAn architect wants to design the biggest circular clock-face that will fit onto the wall of a train station. The diagram of an isosceles triangle represents the top section of the gable of the building. She needs to find where the centre of the clock will be located in this triangle.
i. Mark what you think are the two sides that are equal in length.
ii. Write a sentence which describes an isosceles triangle.
iii. Find the centre of the face of the clock on the diagram, showing how you found it by including all lines of construction. The clock can touch the edges of the triangle but not go outside of it.
iv. There are other types of triangles. List these and draw a diagram of each one that shows its properties.
Activity 1.3 lCFl and lCOlThis activity could be very long and boring if you tried to define all terms in geometry. The selection here is to make you think about how we define things in geometry. We always need to be as clear as we can when trying to solve problems or prove that things are true when using geometry. Your teacher will guide you through the differences and the uses of terms in geometry.
State what you understand by each of the following terms, writing one sentence in each case.
(i) angle (ii) definition (iii) theorem (iv) axiom(v) corollary (vi) converse (vii) geometrical proof
Make out a list of 6 other terms you use in geometry.
Gable end of the train stationonto which the clock will fit.

4
PROJECT MATHS - Mathematics Resources for Students
Q. 1 LCOL
PQRS is a parallelogram, as shown.
i. Name four pairs of equal angles.
Calculate the length of [RS] if |PR|=12, |PS|= 13 and |∠PRS|= 90°.
ii. Find the area of the parallelogram.
iii. If |∠RPS|= 25°, show that |∠PQR|= 65°
Q. 2 LCOL
In the diagram XY|| BC.
i. If |AX|:|XB|= 4:3 and |XY|= 8, write down|BC|.
ii. If |AY|= 7 find |AC| and |YC|
Q. 3 LCOL
Each tangent is perpendicular to the radius that goes to the point of contact (Theorem 20).
DE is a tangent to the circle at D and DB is a diameter. Show that |∠CDE|=|∠CAD|

5
Leaving Certificate Mathemathics - Strand 2 - GEOMETRY And TRIGOnOMETRY
Q. 4 LCHL
The diagram below shows a circle with two intersecting chords.Prove that the triangles ACE and DBE are equiangular.
What theorem(s) are we using to prove this?
Q. 5 LCHL
The diagram below shows a circle with two chords CD and HG which intersect outside the circle at the point X. Prove that the triangles HDX and CGX are equiangular.
6
PROJECT MATHS - Mathematics Resources for Students
Q. 6 LCHL
The diagram below shows the incircle of a triangle ABC. Given the measures of the angles of triangle ABC as in the diagram, find the measures of the angles of the triangle XYZ

7
Leaving Certificate Mathemathics - Strand 2 - GEOMETRY And TRIGOnOMETRY
Activity 1.4 lCHlAt higher level you are expected to prove certain theorems. The proof of theorem 11 is given here. The theorem is stated and a diagram with proof is given. You may have done a slightly different proof with your teacher, but that should not prevent you from following the logic and deductive reasoning of the proof given here.
Theorem 11. If three parallel lines cut off equal segments on some transversal line, then they will cut off equal segments on any other transversal.
Proof. [This uses opposite sides of a parallelogram, AAS, and the axiom of parallels.]
Suppose AD||BE||CF and |AB|= |BC|. We wish to show that |DE|=|EF|.
Draw AE’ ||DE, cutting EB at E’ and FC at F’.
Draw F’B’ ||AB, cutting EB at B’ Write the justification in the spaces below
|B’F’| = |BC|
= |AB|
|∠BAE’| = |∠E’F’B’|
|∠AE’B| = |∠F’E’B’|
∴ ∆ABE’ is congruent to ∆F’B’E∴|AE’| = |E’ F’|
But |AE’|= |DE| and |E’ F’|= |EF|∴|DE| = |EF|
8
PROJECT MATHS - Mathematics Resources for Students
GEOMETRY 2
SYllAbuS TOPIC: co-oRdinate geoMetRy
lEARnInG OuTCOMEAs a result of completing the activities in this section you will be able to
• co-ordinate the plane
• calculate distance, slope, and the equations of lines; find the point of intersection of two lines
• use the equations of lines to solve problems
• explore the properties of circles and perform calculations using the equations of circles and lines
HL learners will
• further extend their understanding of co-ordinate geometry through solving problems involving lines and circles
InTROduCTIOnThe activities described below and the questions that follow allow you to deepen your understanding of concepts in co-ordinate geometry as well as solve problems using these concepts and their applications. You will investigate various properties of lines and circles and perform calculations and solve problems based on distance, slope and the equations of lines and circles.

9
Leaving Certificate Mathemathics - Strand 2 - GEOMETRY And TRIGOnOMETRY
Activity 2.1 lCFlIf you and your friends in school have a grid with each letter of the alphabet on it you can compose messages to each other that cannot be read by anyone who does not have the grid. Use the grid below to answer the questions following.
i. What is your first name?
ii. Who is your favourite band or singer?
iii. What is your favourite TV programme
Here are my answers to those questions; can your figure them out?
i. (4,-2), (6,8), (-8, -6), (-8, -6), (-4,-2)
ii. (2,12), (2,0), (-4,10), (2,6) (8,0), (-4,10), (-10,10), (-8,10)
iii. (8,-4), (-8,-6), (6,8), (-8,10), (-2,-4) (-10,10),(-4,2), (-10,10), (4,-2), (2,0) (-4,6), (-8,10)
Q. 1 LCFL
Make up five questions that you can contribute in class tomorrow that could be answered in codes by other students.
Q. 2 LCFL
Write a message of one sentence in code that you can give to another student to decrypt in class tomorrow. The sentence should contain at least eight words and should be written with spaces for the words and brackets for each pair of co-ordinates.

10
PROJECT MATHS - Mathematics Resources for Students
Activity 2.2 lCFl and lCOl
There are a lot of points marked on the Cartesian plane shown above. One of the sets of points is joined to make a straight line. If they are on the same line they must have a common link!
There is another set of points which appear to form a straight line. Join them to check if they all belong to this line.
The lines appear to be going upwards or downwards at constant rates. What do we call this? If the rate of rising/falling is constant, we should be able to measure this at different places and it should remain the same. Pick two points and find the slope of the line, then pick two different points on the same line and show that the slope is the same.
We can see where the line cuts the X-axis (16,0). Where does the line cut the Y-axis? Do we have a name for that point?
The point (14, 2) is a significant point. What do we call it? If we did not have the point given to us, could we have found it by drawing the two lines? Is there another way to find that point without drawing? Is there a connection with algebra here?
11
Leaving Certificate Mathemathics - Strand 2 - GEOMETRY And TRIGOnOMETRY
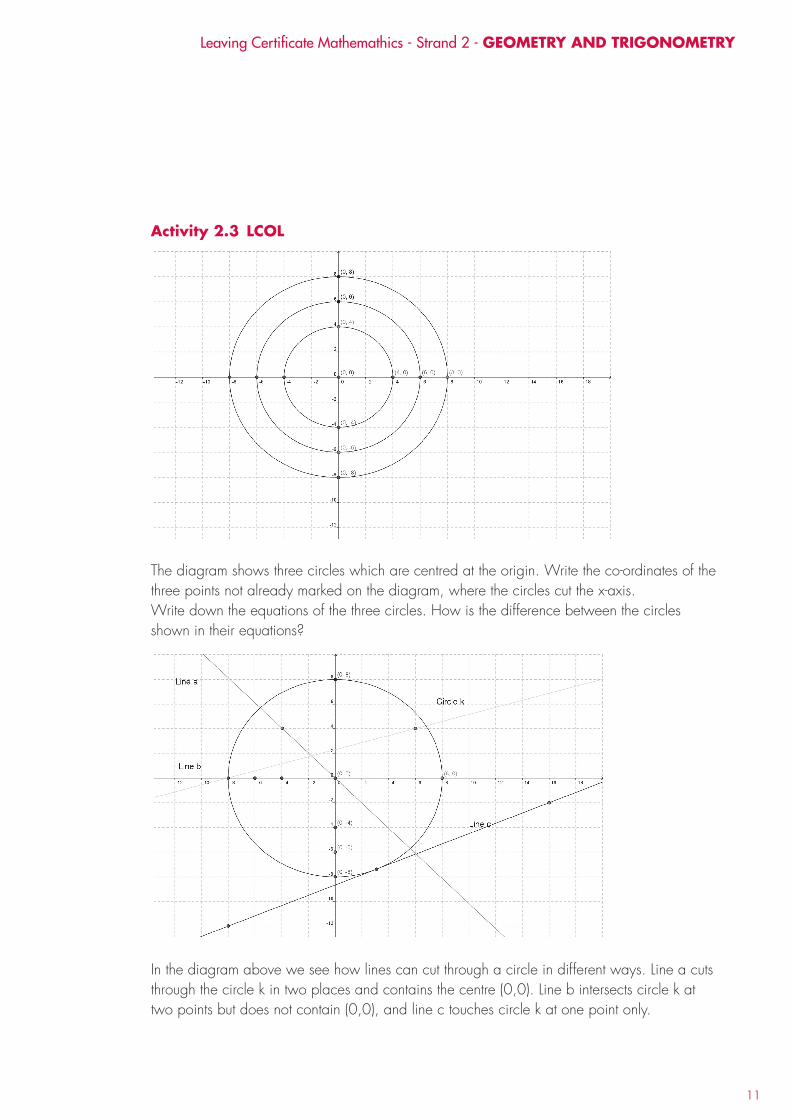
Activity 2.3 lCOl
The diagram shows three circles which are centred at the origin. Write the co-ordinates of the three points not already marked on the diagram, where the circles cut the x-axis.Write down the equations of the three circles. How is the difference between the circles shown in their equations?
In the diagram above we see how lines can cut through a circle in different ways. Line a cuts through the circle k in two places and contains the centre (0,0). Line b intersects circle k at two points but does not contain (0,0), and line c touches circle k at one point only.

12
PROJECT MATHS - Mathematics Resources for Students
Line a is called
Line b is called
Line c is called
Consider the circle k which has the equation x2 + y2 = 82.
The task now is to find the points of intersection between the three lines and this circle.
i. Read off the values of the points of intersection from the diagram. Is this an accurate way to find the points?
ii. Could we do this activity using algebra, and be more confident of our answers? It involves the equations of the three lines so we need to find them first.
iii. Find the three equations and then use them and the equation of the circle to get more accurate results for the points of intersection between the lines and the circle.
For further consideration
iv. Repeat the exercise above for the situation when the centre of the circle is not at (0,0) but at (2,2) as shown in the diagram below.
13
Leaving Certificate Mathemathics - Strand 2 - GEOMETRY And TRIGOnOMETRY
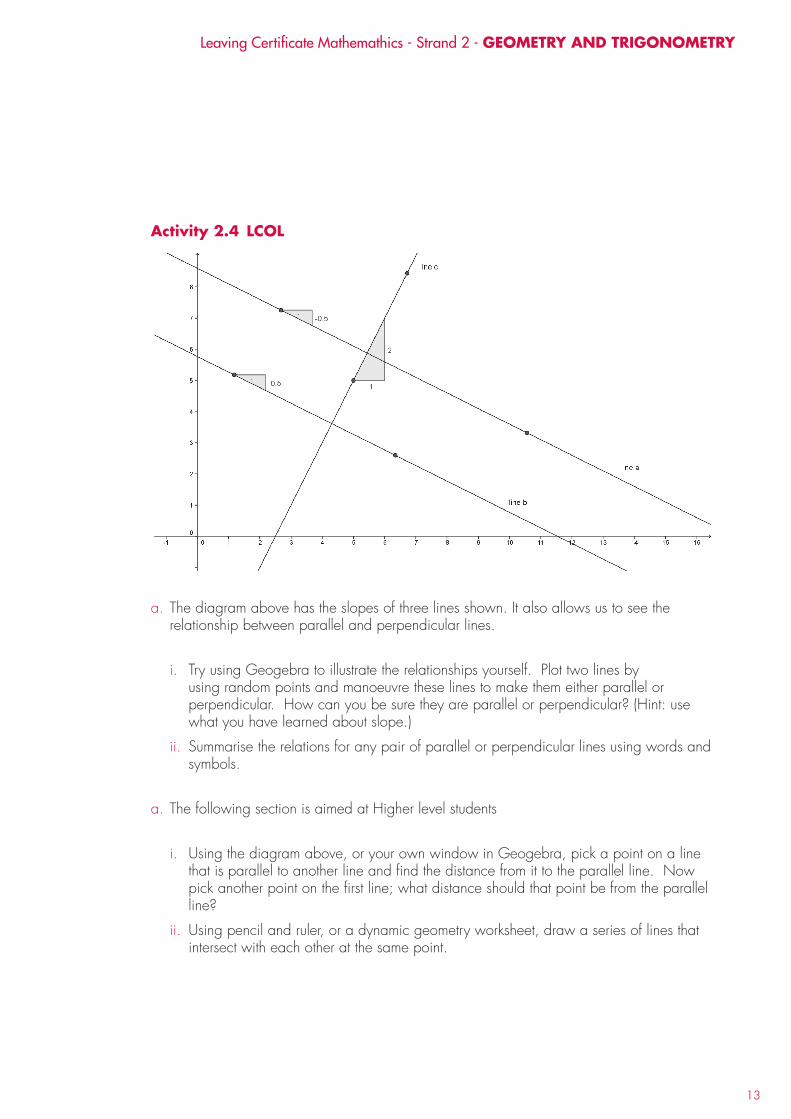
Activity 2.4 lCOl
a. The diagram above has the slopes of three lines shown. It also allows us to see the relationship between parallel and perpendicular lines.
i. Try using Geogebra to illustrate the relationships yourself. Plot two lines by using random points and manoeuvre these lines to make them either parallel or perpendicular. How can you be sure they are parallel or perpendicular? (Hint: use what you have learned about slope.)
ii. Summarise the relations for any pair of parallel or perpendicular lines using words and symbols.
a. The following section is aimed at Higher level students
i. Using the diagram above, or your own window in Geogebra, pick a point on a line that is parallel to another line and find the distance from it to the parallel line. Now pick another point on the first line; what distance should that point be from the parallel line?
ii. Using pencil and ruler, or a dynamic geometry worksheet, draw a series of lines that intersect with each other at the same point.

14
PROJECT MATHS - Mathematics Resources for Students
In the diagram above, the acute angle between line a and line c is marked. You can see how this angle will vary when the point B on line a is rotated towards line c. It is easy to visualise this as line a will coincide with line d in this rotation at some point, and we can see that the angle between line d and line c is smaller than 53.13°.
iii. Is there a relationship between the angle between lines and the slopes of the lines? Write down any observations you have made as the angle between the lines gets bigger or smaller.
iv. How is this relationship stated?
v. Find the angle between line a and line c.
vi. Why is the angle either + or -?
For further exploration at Higher level You have learned that another way of representing the equation of a circle is x2 + y2 + 2gx +2fy + c = 0, where the centre is (−g, −f) and r =
Q. 1 H is a circle x2 + y2 + 8x − 10y + 32 = 0
Write down the co-ordinates of the centre of the circle, the length of the radius, and make an accurate drawing of the circle.
)( 22 cfg −+

15
Leaving Certificate Mathemathics - Strand 2 - GEOMETRY And TRIGOnOMETRY
Q. 2 The circles (x+2)2 + (y−1)2 = 8 and (x−5)2 + (y+2)2 = 50 intersect at two points.
Use the theorem of Pythagoras to show the tangents to both circles at the point of intersection are perpendicular.
Q. 3 Find the point of contact between the line 3x − 4y + 13 = 0 and the circle x2 + y2 +6y −16 = 0.
Q. 4 Find the length of the tangents from p(−4,0) to the circle x2 + y2 – 4x – 8y −30= 0
Find the equations of the tangents to the circle from P.The line joining the centre of the circle to the point of tangency T cuts the x-axis inside the circle at Q. Find the co-ordinates of T and the |QT|.

16
PROJECT MATHS - Mathematics Resources for Students
InTROduCTIOnThe activities described below and the questions that follow allow you to deepen your understanding of concepts in trigonometry as well as solve problems using these concepts and their applications.
Activity 3.1 lCOl
The theorem of Pythagoras gives us a way of calculating this distance to a desired degree of accuracy.
GEOMETRY 3
SYllAbuS TOPIC: tRigonoMetRy
lEARnInG OuTCOMEAs a result of completing the activities in this section you will be able to
• solve right angle triangle problems, use the theorem of Pythagoras and the trigonometry ratios of sin, cos and tan
and you will also
• extend your knowledge of the trigonometric ratios
• solve problems using rules; find areas of given shapes
HL learners will be able to
• graph trigonometric functions
• solve trigonometric equations, including use of radians
• apply trigonometric formulae
17
Leaving Certificate Mathemathics - Strand 2 - GEOMETRY And TRIGOnOMETRY
i. Find the length of the diagonal to
• one decimal place
• two decimal places
• three decimal places
ii. Now measure the diagonal with a piece of string, metre stick or a tape measure and compare this with the values calculated at (i).
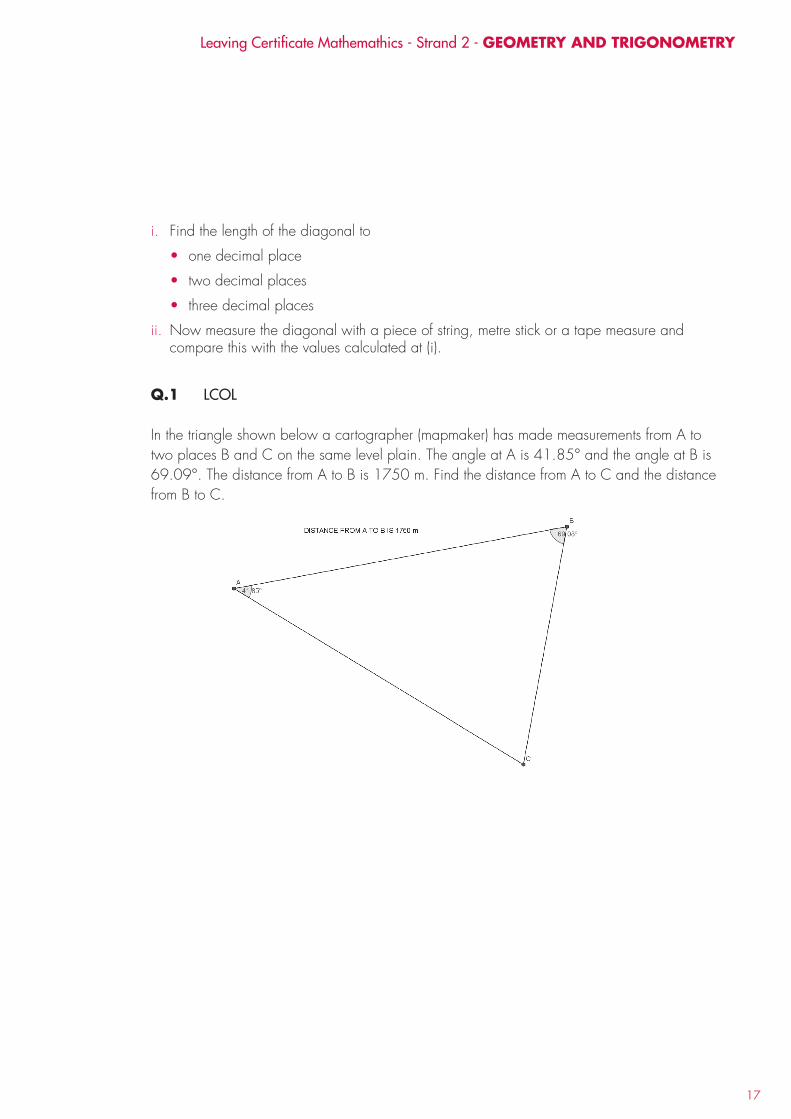
Q.1 LCOL
In the triangle shown below a cartographer (mapmaker) has made measurements from A to two places B and C on the same level plain. The angle at A is 41.85° and the angle at B is 69.09°. The distance from A to B is 1750 m. Find the distance from A to C and the distance from B to C.

18
PROJECT MATHS - Mathematics Resources for Students
Q.2 LCOL
The climber on top of the mountain on the right wants to know how much higher the mountain on the left is. The angle of elevation from right to left is 11.18° and the horizontal distance between the peaks is 4000m. Find the difference in height between the peaks.
Q.3 LCOL
In fighting crime, police forces in recent years have been able to pinpoint the location of mobile phones at the times calls are made from them. By drawing as accurately as you can on the grid below, show the location of the phone, given the following data:
i. from tower Alpha, the phone is 25° south of east
ii. from tower Bravo the phone is 30° north of east.
Angle of elevation = 11.18o
4000m

19
Leaving Certificate Mathemathics - Strand 2 - GEOMETRY And TRIGOnOMETRY
Q.4 LCHL
The sails on the boats that were in the recent ‘round the world yacht race’ that visited Galway are where the power for the boats comes from. The bigger they are, the more wind they catch and the faster the boat can go. However, the sail designers are restricted by the length of the boom (bottom) of the sail and the height of the mast. Our designer has two models to work from. The Captain has told him that a height of 9 m is the tallest the mast can be, and a boom of length 10 m is the longest that is permitted.
i. Work out the height of the mast in design A.
ii. Work out the length of the boom in design B.
iii. Work out the area of each triangle to find which one has the bigger area?
iv. There is a problem with design A; explain why.
v. There is a problem with design B; explain why.
vi. Restrict the mast height in design A to what is permitted and recalculate the area.
vii. Restrict the boom size in design B to what is permitted and recalculate the area.
Which design now gives the greater sail area?

20
PROJECT MATHS - Mathematics Resources for Students
Activity 3.2 lCOl and lCHlHow do you measure the heights of trees without climbing them, or distances between planets? Making measurements can be difficult in space or in environments that are too small or too hostile. Trigonometry helps us to make measurements and use them to find more difficult measurements easily. You may have tried some of these in school.
A compass clinometer is a useful tool to find ‘dip and strike’ for geologists in the field. They use this information to track underground rock formations that they cannot see but are trying to map. The information is useful for mining companies, farmers, planners and archaeologists. A clinometer is also useful for approximating heights.
Students are given a challenge by their teacher to find the height of the local water tower in the town without leaving the school grounds. The students made two measurements of angles using the clinometer. The first angle, measured at the side of the school was 25° and the second angle, at a spot 100 m away from the school, was 35°.
We can start to solve this problem by drawing a triangle that shows the measurements made by the students (as shown above). This drawing can be extended to include the height of the tower as a vertical to the horizontal ground. We have made a right-angled triangle and that is generally useful when solving triangles.
School
100m
21
Leaving Certificate Mathemathics - Strand 2 - GEOMETRY And TRIGOnOMETRY
i. Draw separate diagrams to help you solve the problem in stages.
ii. Write out the rule that you are going to use to solve the problem.
iii. What level of accuracy would be suitable for the answer to this problem?
iv. Work out the height of the tower.
For further consideration
v. Work out how far away the tower is from the position of the first measurement.
vi. If the sun is behind the tower when viewed from the school, and its angle of elevation is 40°, how long is the shadow? Would the shadow reach the school?
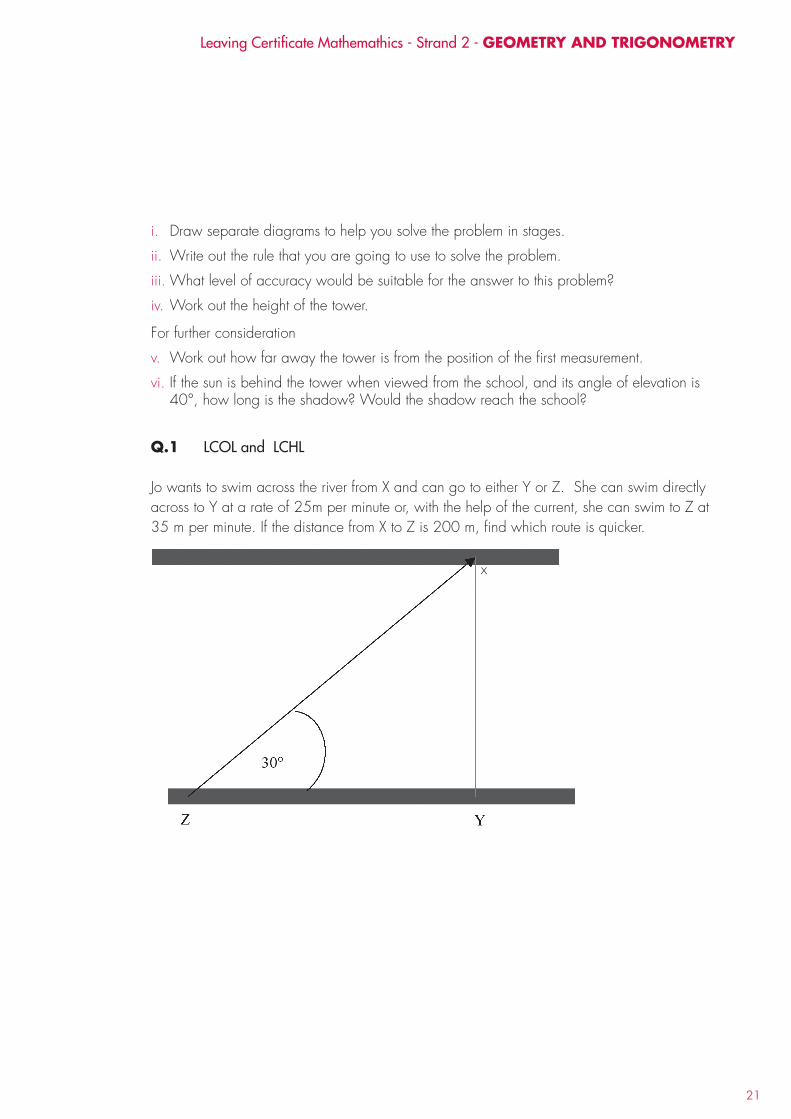
Q.1 LCOL and LCHL
Jo wants to swim across the river from X and can go to either Y or Z. She can swim directly across to Y at a rate of 25m per minute or, with the help of the current, she can swim to Z at 35 m per minute. If the distance from X to Z is 200 m, find which route is quicker.
x
22
PROJECT MATHS - Mathematics Resources for Students
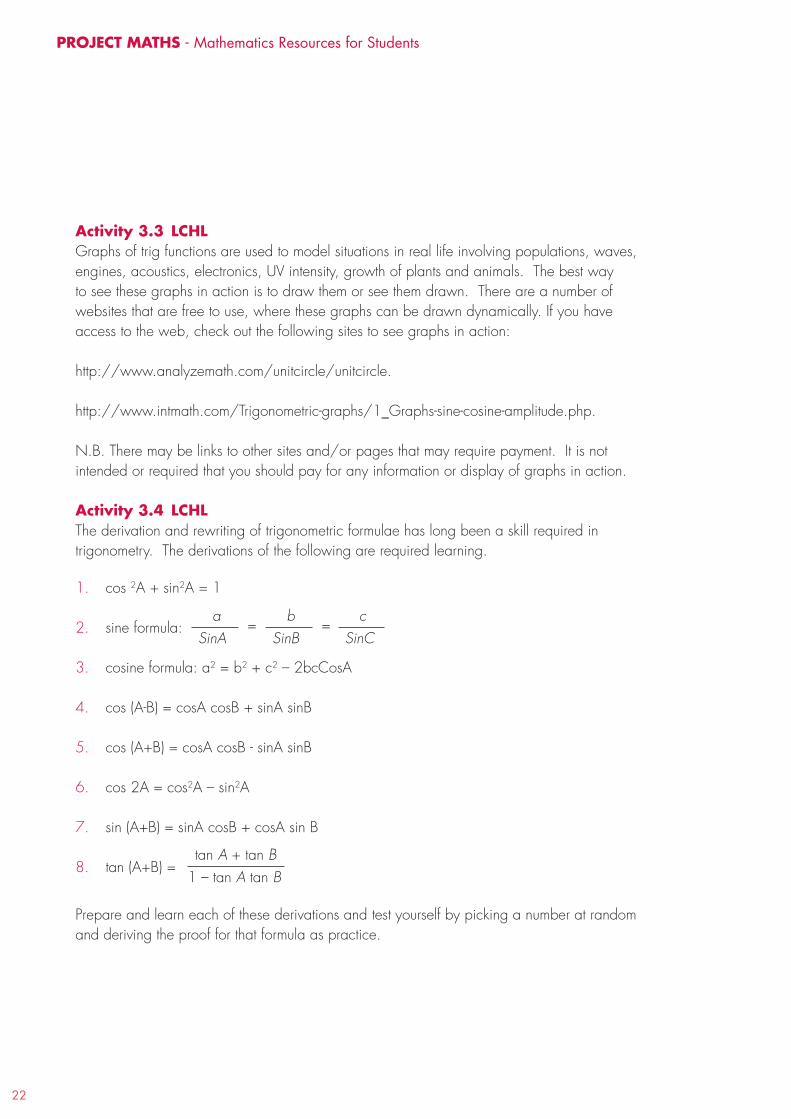
Activity 3.3 lCHlGraphs of trig functions are used to model situations in real life involving populations, waves, engines, acoustics, electronics, UV intensity, growth of plants and animals. The best way to see these graphs in action is to draw them or see them drawn. There are a number of websites that are free to use, where these graphs can be drawn dynamically. If you have access to the web, check out the following sites to see graphs in action:
http://www.analyzemath.com/unitcircle/unitcircle.
http://www.intmath.com/Trigonometric-graphs/1_Graphs-sine-cosine-amplitude.php.
N.B. There may be links to other sites and/or pages that may require payment. It is not intended or required that you should pay for any information or display of graphs in action.
Activity 3.4 lCHlThe derivation and rewriting of trigonometric formulae has long been a skill required in trigonometry. The derivations of the following are required learning.
1. cos 2A + sin2A = 1
2. sine formula:
3. cosine formula: a2 = b2 + c2 – 2bcCosA
4. cos (A-B) = cosA cosB + sinA sinB
5. cos (A+B) = cosA cosB - sinA sinB
6. cos 2A = cos2A – sin2A
7. sin (A+B) = sinA cosB + cosA sin B
8. tan (A+B) =
Prepare and learn each of these derivations and test yourself by picking a number at random and deriving the proof for that formula as practice.
tan A + tan B1 – tan A tan B
a b cSinA SinB SinC
= =
23
Leaving Certificate Mathemathics - Strand 2 - GEOMETRY And TRIGOnOMETRY
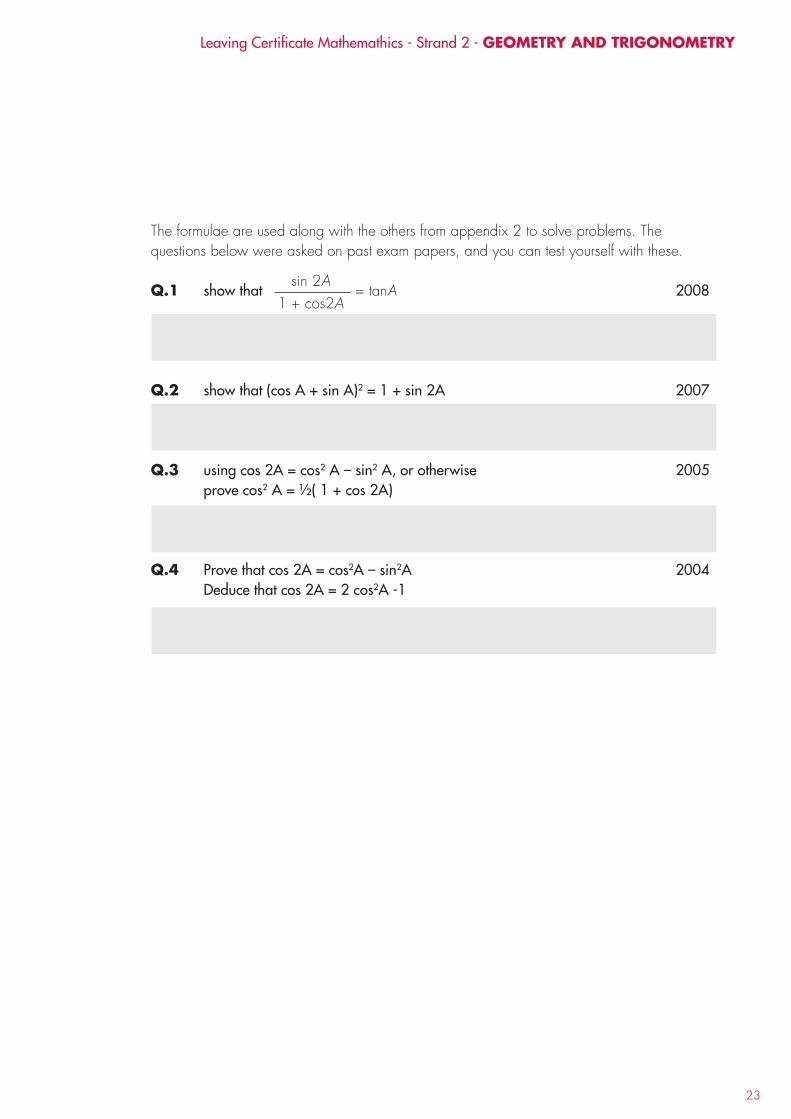
The formulae are used along with the others from appendix 2 to solve problems. The questions below were asked on past exam papers, and you can test yourself with these.
Q.1 show that 2008
Q.2 show that (cos A + sin A)2 = 1 + sin 2A 2007
Q.3 using cos 2A = cos2 A – sin2 A, or otherwise 2005 prove cos2 A = ½( 1 + cos 2A)
Q.4 Prove that cos 2A = cos2A – sin2A 2004 Deduce that cos 2A = 2 cos2A -1
sin 2A1 + cos2A
= tanA

24
PROJECT MATHS - Mathematics Resources for Students
GEOMETRY 4
SYllAbuS TOPIC: tRanSfoRMationS
lEARnInG OuTCOMEAs a result of completing the activities in this section you will be able to
• draw scale figures
• solve problems involving lengths, scale factors and centres of enlargement
• solve problems involving area and scale factor
InTROduCTIOnThe activities described below and the questions that follow allow you to deepen your understanding of concepts in transformations as well as solve problems using these concepts and their applications. Knowledge of Junior Certificate geometry is assumed.
25
Leaving Certifi cate Mathemathics - Strand 2 - GEOMETRY And TRIGOnOMETRY
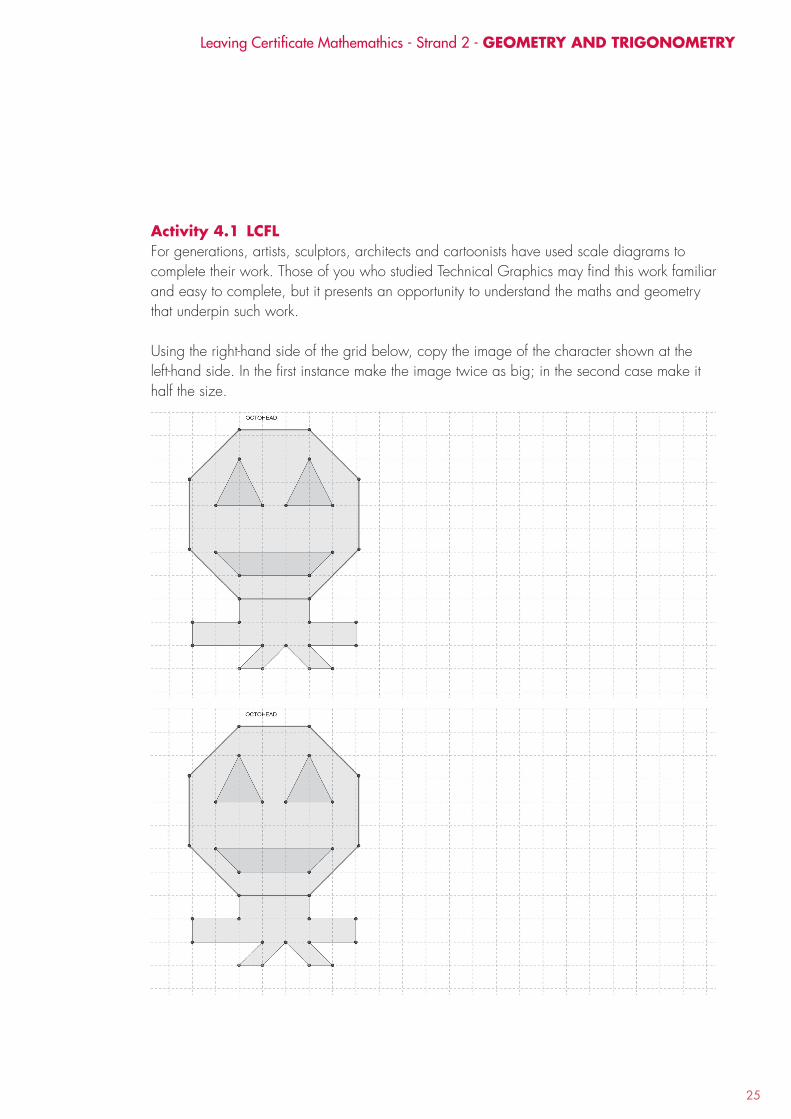
Activity 4.1 lCFlFor generations, artists, sculptors, architects and cartoonists have used scale diagrams to complete their work. Those of you who studied Technical Graphics may fi nd this work familiar and easy to complete, but it presents an opportunity to understand the maths and geometry that underpin such work.
Using the right-hand side of the grid below, copy the image of the character shown at the left-hand side. In the fi rst instance make the image twice as big; in the second case make it half the size.

26
PROJECT MATHS - Mathematics Resources for Students
Activity 4.2 lCFl and lCOlWhen making a scale diagram we start with an object and make an image of it that is either smaller or larger, depending on the scale factor (k). Below is a well known diagram that you can use to test your skill. Can you complete the diagram without lifting the pencil from the page or going over the same line twice? In the diagram, two images are shown, one which is twice as big (k=2) and the other which is half the original size (k= 0.5). This is easy to do if you use graph paper, a pencil and a ruler. The use of dynamic geometry software can also give you accurate images very quickly, but doing the drawing manually is the best way to start.
i. Draw in the rays that connect the marked points back to the centre of enlargement on your diagram.
ii. Make measurements on the corresponding sides of the objects and the images. What do you notice?
iii. Measure the distance from any point on the larger image to the centre of enlargement. Compare this distance to the corresponding measurement for the smaller image. What do you notice?

27
Leaving Certificate Mathemathics - Strand 2 - GEOMETRY And TRIGOnOMETRY
Q1 Try to find the centre of enlargement in the diagram below if the scale factor is k = 3.
What is the most important point of reference in a circle when finding its centre of enlargement? Do co-ordinates make it easier to find the centre of enlargement?
How would you find the centre of enlargement without the co-ordinates?
Activity 4.3 lCOlThe area of an image is closely related to the scale factor and the object. Examine the triangles below. The scale factor is 4.i. Calculate the area of the object triangle.
ii. Calculate the area of the image triangle.
iii. Divide the area of the image by the area of the object.
iv. Compare your answer to the scale factor. What is the relationship between them?
28
PROJECT MATHS - Mathematics Resources for Students
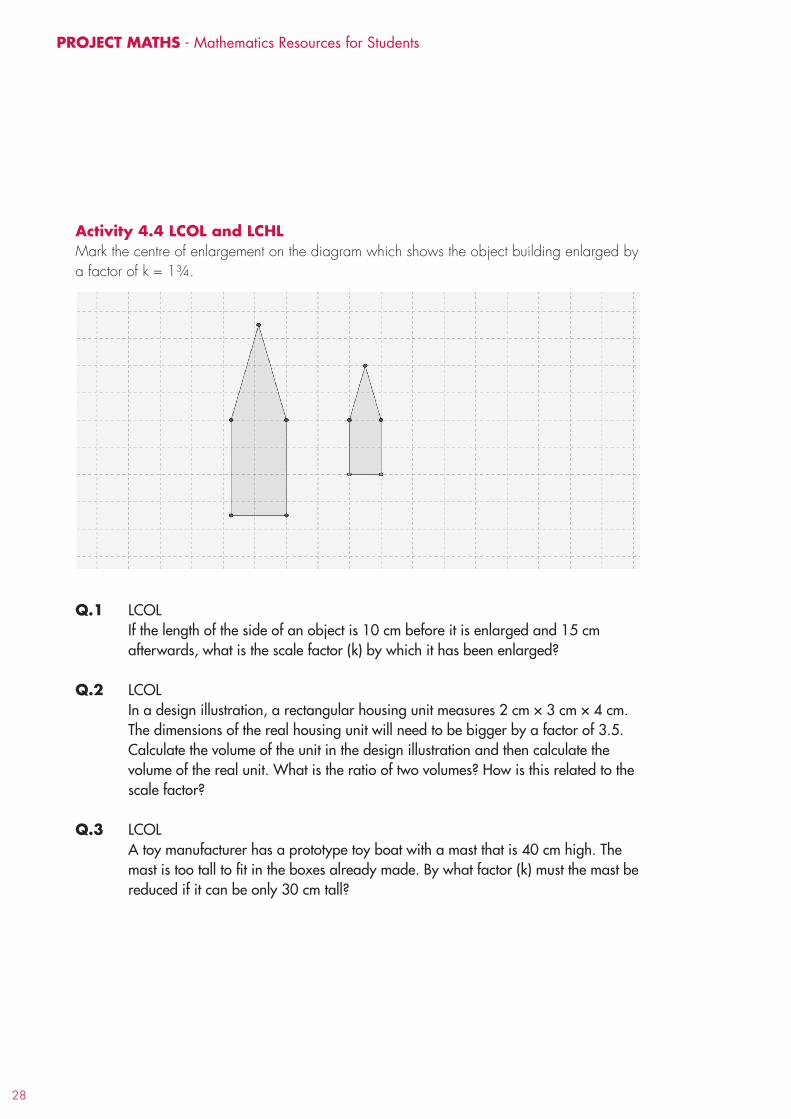
Activity 4.4 lCOl and lCHlMark the centre of enlargement on the diagram which shows the object building enlarged by a factor of k = 1¾.
Q.1 LCOL If the length of the side of an object is 10 cm before it is enlarged and 15 cm
afterwards, what is the scale factor (k) by which it has been enlarged?
Q.2 LCOL In a design illustration, a rectangular housing unit measures 2 cm × 3 cm × 4 cm.
The dimensions of the real housing unit will need to be bigger by a factor of 3.5. Calculate the volume of the unit in the design illustration and then calculate the volume of the real unit. What is the ratio of two volumes? How is this related to the scale factor?
Q.3 LCOLA toy manufacturer has a prototype toy boat with a mast that is 40 cm high. The mast is too tall to fit in the boxes already made. By what factor (k) must the mast be reduced if it can be only 30 cm tall?

29
Leaving Certificate Mathemathics - Strand 2 - GEOMETRY And TRIGOnOMETRY
Q.4 LCOL and LCHL A TV company wants to replace their current plasma screen with a newer, bigger one. The old one is drawn below, with the centre of enlargement shown. They want to increase the dimensions of the screen by 20%, so the scale factor is 1.2. Draw the image of the new screen on the diagram below.
Plasmatron electronics – new developments
i. If the original screen measures 40 cm × 25 cm, find the area of the screen.
ii. Find the area of the new, enlarged screen.
iii. Divide the new area by the old area, and then find the square root of the answer. Correct your answer to one decimal place. What have you discovered?
Q.5 LCOL and LCHL
Triadtechnics have been using the same logo for 20 years, but then decided to change the corporate logo to show that they have grown a lot in size in the 20 years. Their logo is an equilateral triangle and the company has grown by 200% in the 20 years. The new image of the triangle is to illustrate this growth.
i. Work out what the scale factor should be.
ii. On graph paper draw the object and the image for the new logo, with the rays included; a sample diagram is given

30
PROJECT MATHS - Mathematics Resources for Students
Q. 6 LCHL
An A3 sheet of paper is as large as two A4 sheets placed side-by-side, as shown below.
A4
A3 If I have a map that is A3 in size and want to reduce it so that it fits on an A4 sheet, the photocopier selects 70% as the scale factor, not 50%. Based on what you have learned already in this section, explain why the scale factor should be (approximately) 70% .