1 NC Affordable Housing Conference November 1-2, 2011 ∙ Raleigh, NC.
Upload
piers-stanleyCategory
view
214download
0
NC ConferenceNC ConferenceFinancial OverviewFinancial Overview
June 10, 2010June 10, 2010
Presented by Christine Dodson to Presented by Christine Dodson to
The NC Annual Conference The NC Annual Conference

Financial OverviewFinancial Overview
Economic Advisory CommitteeEconomic Advisory Committee
Leadership Summit – January 2010Leadership Summit – January 2010– Council on Finance and AdministrationCouncil on Finance and Administration– Connectional TableConnectional Table– Ministry CabinetMinistry Cabinet– Board of Ordained MinistryBoard of Ordained Ministry
Cabinet and Connectional Table Cabinet and Connectional Table DiscussionDiscussion

Economic Advisory CommitteeEconomic Advisory Committee
Financial professionals, pastors, GCFA Financial professionals, pastors, GCFA staff, annual conferencestaff, annual conference
Make recommendation for budget for 2012 Make recommendation for budget for 2012 General Conference budgetGeneral Conference budget
Met over last two yearsMet over last two years
Preliminary projection reportedPreliminary projection reported
FactorsFactors– Financial, Statistical, RealityFinancial, Statistical, Reality

EAC – Financial FactorsEAC – Financial Factors
Projections to date:Projections to date:– Economy in recovery in 2010Economy in recovery in 2010– Slower recovery than seen beforeSlower recovery than seen before– Inflation lowInflation low– Unemployment highUnemployment high– Some market recovery but not pre-08 levelsSome market recovery but not pre-08 levels

EAC – Statistical FactorsEAC – Statistical Factors
Membership in US in declineMembership in US in decline
Worship attendance in declineWorship attendance in decline
Local church expenses increasedLocal church expenses increased
Giving per member increased - $ and %Giving per member increased - $ and %
Local giving increasedLocal giving increased
Building spending increasedBuilding spending increased
Apportioned spending decreased by %Apportioned spending decreased by %

EAC – Reality FactorsEAC – Reality Factors
Benefit Plan FundingBenefit Plan Funding
Local Church SpendingLocal Church Spending
Annual Conference BudgetAnnual Conference Budget
Local Church DemographicsLocal Church Demographics

EAC – Benefit Plan FundingEAC – Benefit Plan Funding
Pension LiabilitiesPension Liabilities– Additional bill - $80M/year for 7 yearsAdditional bill - $80M/year for 7 years– CPP holidayCPP holiday– Now - $40M/year for 3 years and $80M for 4 Now - $40M/year for 3 years and $80M for 4
yearsyears
Next Issue – Retiree Health InsuranceNext Issue – Retiree Health Insurance– Maybe larger than pensionMaybe larger than pension– Some ACs doing away with benefitsSome ACs doing away with benefits

EAC – Local MinistriesEAC – Local Ministries
NACBA Survey:NACBA Survey:– 48% giving down48% giving down– 47% frozen or cut compensation47% frozen or cut compensation– 76% not cutting local mission spending76% not cutting local mission spending
Stat tables – increase in spending, Stat tables – increase in spending, decrease in apportioned spendingdecrease in apportioned spending
Increase in building spending, now expect Increase in building spending, now expect interest only, deferred maintenanceinterest only, deferred maintenance

EAC – Annual ConferenceEAC – Annual Conference
AC Squeeze In BetweenAC Squeeze In BetweenGCFA/GBOP survey (2009):GCFA/GBOP survey (2009):– 84% pay out rate in 200884% pay out rate in 2008– Predicted 81% in 2009Predicted 81% in 2009– Churches and ACs used reserves in 2008Churches and ACs used reserves in 2008– Reserve levels down 25%Reserve levels down 25%
ACs feel:ACs feel:– Pressure from local church to reduce apportionmentsPressure from local church to reduce apportionments– Encouragement from GC to pay outEncouragement from GC to pay out
EAC predicts overall pay out not likely to EAC predicts overall pay out not likely to increase over 84% and may decrease over next increase over 84% and may decrease over next 6 years6 years

EAC – Local Church DemographicsEAC – Local Church Demographics
Potential ChangesPotential Changes– Hear a lot about churches with <100 AWA – Hear a lot about churches with <100 AWA –
What does that mean to us?What does that mean to us?
In the US - ~34,000 local churchesIn the US - ~34,000 local churches– <150 members <150 members 62%62%– <100 AWA<100 AWA 76%76%– <50 AWA<50 AWA 50%50%

Local Church DemographicsLocal Church Demographics
In NC in 2009 – 813 local churches reportingIn NC in 2009 – 813 local churches reporting– <150 members<150 members 409 409 50% 50% – <100 AWA<100 AWA 604604 74% 74% – <50 AWA<50 AWA 337337 41%41%– <25 AWA<25 AWA 137137 17%17%– <15 AWA<15 AWA 5050 6%6%
Average = 44% of membership in attendanceAverage = 44% of membership in attendanceConcern not based on cost to AC or GC but Concern not based on cost to AC or GC but concern for viabilityconcern for viability

EAC – Local Church DemographicsEAC – Local Church Demographics
Also hear about 80/20 ruleAlso hear about 80/20 rule
In NC, about 80% of churches pay about one In NC, about 80% of churches pay about one third of budgetthird of budget
Of those 80% of churches:Of those 80% of churches:– <100 AWA<100 AWA 90%90%– <50 AWA<50 AWA 50%50%
If concerned about viability and they close, what If concerned about viability and they close, what happens to the third of budget?happens to the third of budget?
Can the other 20% of churches absorb?Can the other 20% of churches absorb?

EAC - ConclusionsEAC - Conclusions
Annual Conference and local churches Annual Conference and local churches must decide what to pay:must decide what to pay:– Pensions?Pensions?– Retiree health insurance?Retiree health insurance?– Apportionments?Apportionments?– Local church missions?Local church missions?
With reduced reserves, decisions are harder.With reduced reserves, decisions are harder.

Local Church ChallengeLocal Church Challenge
Fewer congregations able to support full-Fewer congregations able to support full-time pastorstime pastors
Resulting alternatives:Resulting alternatives:– Part-time clergyPart-time clergy– Multi-point chargesMulti-point charges– Large funds in connectional supportLarge funds in connectional support
Pension and health insurance costs in Pension and health insurance costs in budgetbudget

Changing LandscapeChanging Landscape
Changes over the last 25 yearsChanges over the last 25 years
ThenThen NowNow ChangeChange
# of clergy# of clergy ~28,000~28,000 ~28,000~28,000 EqualEqual
# of retirees# of retirees ~7,000~7,000 ~18,000~18,000 ~+2.5 ~+2.5 timestimes
MembersMembers ~10M~10M <8M<8M ~-20%~-20%
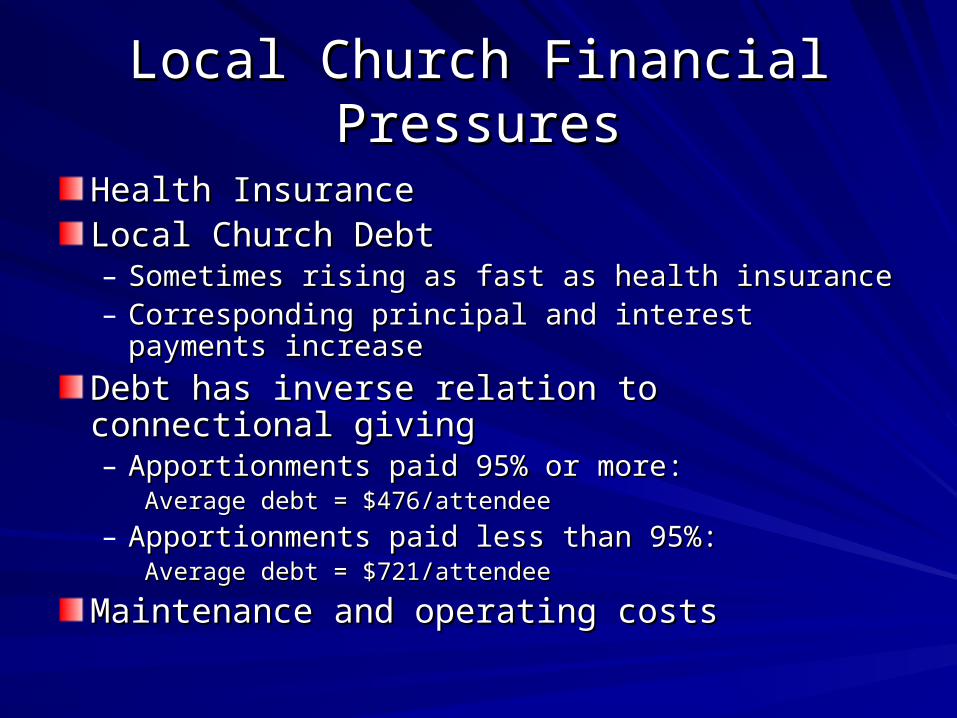
Local Church Financial PressuresLocal Church Financial Pressures
Health InsuranceHealth InsuranceLocal Church DebtLocal Church Debt– Sometimes rising as fast as health insuranceSometimes rising as fast as health insurance– Corresponding principal and interest payments Corresponding principal and interest payments
increaseincrease
Debt has inverse relation to connectional givingDebt has inverse relation to connectional giving– Apportionments paid 95% or more:Apportionments paid 95% or more:
Average debt = $476/attendeeAverage debt = $476/attendee
– Apportionments paid less than 95%:Apportionments paid less than 95%:Average debt = $721/attendeeAverage debt = $721/attendee
Maintenance and operating costsMaintenance and operating costs

Local Church DemographicsLocal Church Demographics
Professions of Faith – 2009Professions of Faith – 2009– Total of 2,772Total of 2,772– 386 churches report none (47% of churches)386 churches report none (47% of churches)– 99 churches report one (10% of churches)99 churches report one (10% of churches)– 80 churches report two (almost 10%)80 churches report two (almost 10%)– Rest more than 2 up to high of 84Rest more than 2 up to high of 84
**numbers revised very slightly since Annual Conference for final statistics report****numbers revised very slightly since Annual Conference for final statistics report****from 2009 Statistical Table II, Question 2a****from 2009 Statistical Table II, Question 2a**

Local Church DemographicsLocal Church Demographics
Apportioned GivingApportioned Giving
% Paid% Paid 20092009 20082008 20052005
100%100% 85% (684)85% (684) 86% (691)86% (691) 88% (708)88% (708)
>95%>95% 87% (699)87% (699) 89% (714)89% (714) 94% (754)94% (754)
55 churches - ~7%

Financial Best PracticesFinancial Best PracticesKey Metrics: Conferences, ChurchesKey Metrics: Conferences, Churches
Self-sustainingSelf-sustaining
Healthy reservesHealthy reserves
Right sizedRight sized
Full apportionmentsFull apportionments
Benefit levelsBenefit levels
Budgets: Realistic, forecasts, long-termBudgets: Realistic, forecasts, long-term
Transparency: pensions, retiree medicalTransparency: pensions, retiree medical

Bottom LineBottom Line
Sustainable ChurchesSustainable Churches
==
Sustainable ConferencesSustainable Conferences
==
Sustainable United Methodist ChurchSustainable United Methodist Church

Ministry Must ContinueMinistry Must Continue
Leadership, energy and ingenuityLeadership, energy and ingenuity
Hard decisionsHard decisions
Cross-boundary discussionsCross-boundary discussions
Meaningful metricsMeaningful metrics

Address Financial VulnerabilitiesAddress Financial Vulnerabilities
Indentify/support financially vulnerableIndentify/support financially vulnerable
Focus on asset development and long-Focus on asset development and long-term financial planningterm financial planning
Indentify and address systemic issuesIndentify and address systemic issues

Overview DiscussionOverview Discussion
Leadership ConcernLeadership Concern
Overarching ResponsibilityOverarching Responsibility
Big Picture of RelationshipsBig Picture of Relationships
Goal Today – Begin to form total pictureGoal Today – Begin to form total picture
ProcedureProcedure– ReportsReports– QuestionsQuestions– Move AdoptionMove Adoption
ReportsReports
Council on Finance and AdministrationCouncil on Finance and Administration
Board of PensionBoard of Pension
Insurance CommitteeInsurance Committee
Task Force on Retiree BenefitsTask Force on Retiree Benefits
Equitable Compensation CommitteeEquitable Compensation Committee
Joint Committee on IncapacityJoint Committee on Incapacity