
NBG PANGAEA R.E.I.C. - Intertrust PANGAEA R.E.I.C. ANNUAL FINANCIAL REPORT FOR THE YEAR ENDED 31...
40
NBG PANGAEA R.E.I.C. ANNUAL FINANCIAL REPORT FOR THE YEAR ENDED 31 DECEMBER 2012 This financial report has been translated from the original report that has been prepared in the Greek language. Reasonable care has been taken to ensure that this report represents an accurate translation of the original text. In the event that differences exist between this translation and the original Greek language financial report, the Greek language financial report will prevail over this document. January 2013
Transcript of NBG PANGAEA R.E.I.C. - Intertrust PANGAEA R.E.I.C. ANNUAL FINANCIAL REPORT FOR THE YEAR ENDED 31...

NBG PANGAEA R.E.I.C.
ANNUAL FINANCIAL REPORT FOR THE YEAR ENDED 31 DECEMBER 2012
This financial report has been translated from the original report that has been prepared in the Greek language. Reasonable care has been taken to ensure that this report represents an accurate translation of the original text. In the event that differences exist between this translation and the original Greek language financial report, the Greek language financial report will prevail over this document.
January 2013
Annual Financial Report For the year ended 31 December 2012
2
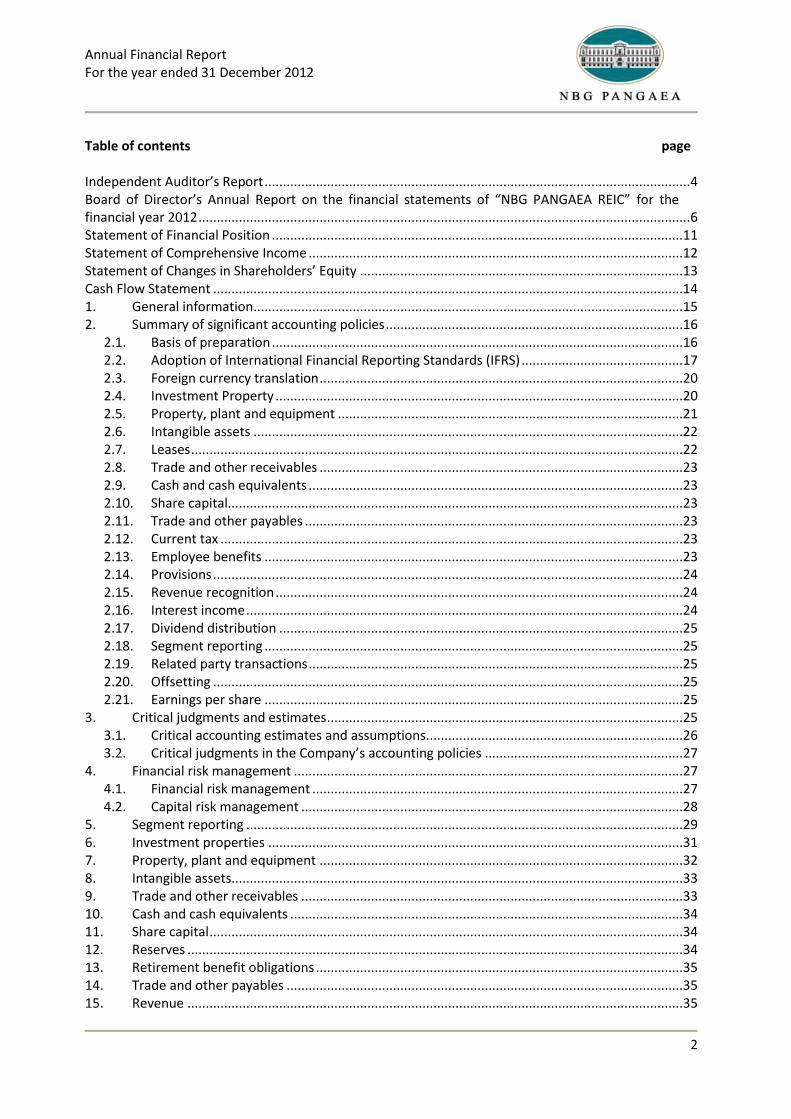
Table of contents page Independent Auditor’s Report .................................................................................................................... 4 Board of Director’s Annual Report on the financial statements of “NBG PANGAEA REIC” for the financial year 2012 ...................................................................................................................................... 6 Statement of Financial Position ................................................................................................................11 Statement of Comprehensive Income ......................................................................................................12 Statement of Changes in Shareholders’ Equity ........................................................................................13 Cash Flow Statement ................................................................................................................................14 1. General information .....................................................................................................................15 2. Summary of significant accounting policies .................................................................................16
2.1. Basis of preparation ................................................................................................................16 2.2. Adoption of International Financial Reporting Standards (IFRS) ............................................17 2.3. Foreign currency translation ...................................................................................................20 2.4. Investment Property ...............................................................................................................20 2.5. Property, plant and equipment ..............................................................................................21 2.6. Intangible assets .....................................................................................................................22 2.7. Leases ......................................................................................................................................22 2.8. Trade and other receivables ...................................................................................................23 2.9. Cash and cash equivalents ......................................................................................................23 2.10. Share capital............................................................................................................................23 2.11. Trade and other payables .......................................................................................................23 2.12. Current tax ..............................................................................................................................23 2.13. Employee benefits ..................................................................................................................23 2.14. Provisions ................................................................................................................................24 2.15. Revenue recognition ...............................................................................................................24 2.16. Interest income .......................................................................................................................24 2.17. Dividend distribution ..............................................................................................................25 2.18. Segment reporting ..................................................................................................................25 2.19. Related party transactions ......................................................................................................25 2.20. Offsetting ................................................................................................................................25 2.21. Earnings per share ..................................................................................................................25
3. Critical judgments and estimates .................................................................................................25 3.1. Critical accounting estimates and assumptions ......................................................................26 3.2. Critical judgments in the Company’s accounting policies ......................................................27
4. Financial risk management ..........................................................................................................27 4.1. Financial risk management .....................................................................................................27 4.2. Capital risk management ........................................................................................................28
5. Segment reporting .......................................................................................................................29 6. Investment properties .................................................................................................................31 7. Property, plant and equipment ...................................................................................................32 8. Intangible assets...........................................................................................................................33 9. Trade and other receivables ........................................................................................................33 10. Cash and cash equivalents ...........................................................................................................34 11. Share capital .................................................................................................................................34 12. Reserves .......................................................................................................................................34 13. Retirement benefit obligations ....................................................................................................35 14. Trade and other payables ............................................................................................................35 15. Revenue .......................................................................................................................................35

Annual Financial Report For the year ended 31 December 2012
3
16. Direct property related expenses ................................................................................................36 17. Personnel expenses......................................................................................................................36 18. Other expenses ............................................................................................................................37 19. Tax ................................................................................................................................................37 20. Dividends per shares ....................................................................................................................37 21. Earnings per share ........................................................................................................................37 22. Contingent Liabilities ....................................................................................................................38 23. Related party transactions ...........................................................................................................38 24. Independent auditor’s fees ..........................................................................................................40 25. Events after the balance sheet date ............................................................................................40
Independent Auditor’s Report
[Translation from the original text in Greek]
Independent Auditor’s Report
To the shareholders of
“NBG PANGAEA REAL ESTATE INVESTMENT COMPANY”
Report on the Financial Statements We have audited the accompanying financial statements of NBG PANGAEA REAL ESTATE INVESTMENT COMPANY (the “Company”) which comprise the statement of financial position as of 31 December 2012, the statement of comprehensive income, statement of changes in equity and cash flow statement for the year then ended and a summary of significant accounting policies and other explanatory information. Management’s Responsibility for the Financial Statements Management is responsible for the preparation and fair presentation of these financial statements in accordance with International Financial Reporting Standards, as adopted by the European Union, and for such internal control as management determines is necessary to enable the preparation of financial statements that are free from material misstatement, whether due to fraud or error. Auditor’s Responsibility Our responsibility is to express an opinion on these financial statements based on our audit. We conducted our audit in accordance with International Standards on Auditing. Those standards require that we comply with ethical requirements and plan and perform the audit to obtain reasonable assurance about whether the financial statements are free from material misstatement. An audit involves performing procedures to obtain audit evidence about the amounts and disclosures in the financial statements. The procedures selected depend on the auditor's judgment, including the assessment of the risks of material misstatement of the financial statements, whether due to fraud or error. In making those risk assessments, the auditor considers internal control relevant to the entity's preparation and fair presentation of the financial statements in order to design audit procedures that are appropriate in the circumstances, but not for the purpose of expressing an opinion on the effectiveness of the entity's internal control. An audit also includes evaluating the appropriateness of accounting policies used and the reasonableness of accounting estimates made by management, as well as evaluating the overall presentation of the financial statements. We believe that the audit evidence we have obtained is sufficient and appropriate to provide a basis for our audit opinion.
Independent Auditor’s Report
5
Opinion In our opinion, the accompanying financial statements present fairly, in all material respects, the financial position of the NBG PANGAEA REAL ESTATE INVESTMENT COMPANY as at 31 December 2012, and its financial performance and cash flows for the year then ended in accordance with International Financial Reporting Standards, as adopted by the European Union. Reference on Other Legal and Regulatory Matters We verified the conformity and consistency of the information given in the Board of Directors’ report with the accompanying financial statements in accordance with the requirements of articles 43a and 37 of Codified Law 2190/1920.
Athens, 31 January 2013
The Certified Public Accountant
Alexandra Β. Kostara Reg. No. SOEL: 19981
Deloitte. Hadjipavlou Sofianos & Cambanis S.A
3a Fragoklissias & Granikou Str., 151 25 Marousi Reg. No. SOEL: Ε 120

Director’s Report
All amounts expressed in € thousand, unless otherwise stated
6
Board of Director’s Annual Report on the financial statements of “NBG PANGAEA REIC”
for the financial year 2012
In accordance with the law and the articles of association of the Company, we present below the Company’s activities during the third fiscal year from 1 January 2012 to 31 December 2012.
Α) Financial position of the Company As at December 31, 2012 the Company’s portfolio consisted of 242 commercial properties (mainly bank branches and offices) located in prime areas throughout Greece. Total fair value of investment properties as at 31 December 2012, in accordance with the relevant valuation performed by the Body of Greek Sworn-in Valuers of Greece (“S.Ο.Ε.”), amounted to €770,609 (31 December 2011: €820,990). Revenue: Total revenue for the year ended 31 December 2012 amounted to €70,024, which relates to rental income, compared to €68,300 in 2011, representing an increase of 2.5%. Net loss for the fair value adjustment of investment properties: Suring the current year, the fair value of investment properties decreased by €50,416 (compared to €61,607 of the previous year). This decline is directly linked to the crisis of the Greek economy and has influenced the Greek real estate market. Operating expenses: Total operating expenses for the year ended 31 December 2012 amounted to €3,598, compared to €4,029 of the previous year, representing a decrease of 10.7%. Operating profit: As a result of the above, operating profit of the Company for the year 2012 amounted to €16,010 compared to €2,664 of the previous year. Operating profit of the Company, not including the net loss from the fair value adjustment of investment properties, amounted to €66,426 compared to €64,271 of the previous year (an increase of 3.4%). Interest income: The Company’s total interest income for the year 2012 amounted to €5,522 compared to €3,300 of the previous year (an increase of 67.3%). Tax: As a Real Estate Investment Company, and in accordance with law 2778/1999, the Company is exempted from corporate income tax and is subject to an annual tax based on its assets. More specifically, the tax is determined by reference to the average fair value of its investment properties and cash and cash equivalents (as depicted on the Company’s biannual investment schedules) at the tax rate of 10% of the aggregate European Central Bank (“E.C.B.”) reference rate plus 1% (the taxation formula is as follows: 10% * (ECB reference rate + 1%)) . This tax for the year ended 31 December 2012 amounted to €1,747 compared to €2,088 for the previous year. The 16.3% decrease is mainly due to the fact that ECB decreased in 2012 the reference rate compared to 2011.
Director’s Report
All amounts expressed in € thousand, unless otherwise stated
7
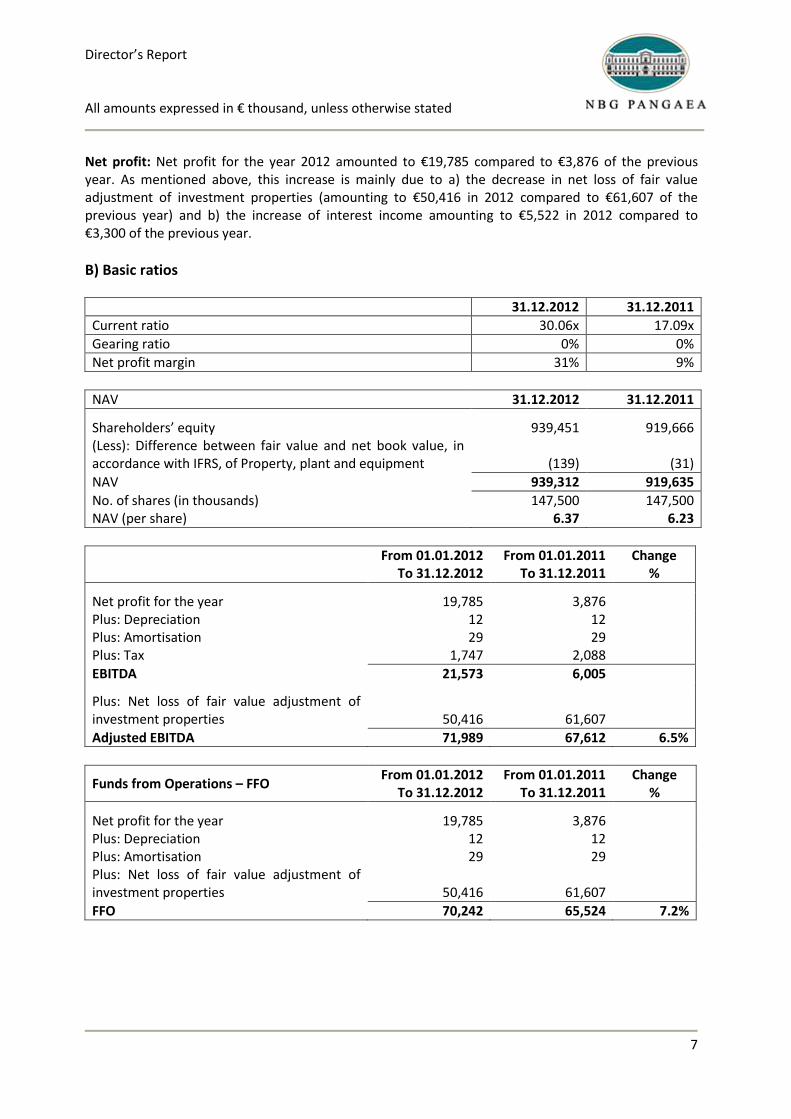
Net profit: Net profit for the year 2012 amounted to €19,785 compared to €3,876 of the previous year. As mentioned above, this increase is mainly due to a) the decrease in net loss of fair value adjustment of investment properties (amounting to €50,416 in 2012 compared to €61,607 of the previous year) and b) the increase of interest income amounting to €5,522 in 2012 compared to €3,300 of the previous year.
Β) Basic ratios
31.12.2012 31.12.2011
Current ratio 30.06x 17.09x
Gearing ratio 0% 0%
Net profit margin 31% 9%
NAV 31.12.2012 31.12.2011
Shareholders’ equity 939,451 919,666 (Less): Difference between fair value and net book value, in accordance with IFRS, of Property, plant and equipment
(139)
(31)
NAV 939,312 919,635
No. of shares (in thousands) 147,500 147,500 NAV (per share) 6.37 6.23
From 01.01.2012
To 31.12.2012 From 01.01.2011
To 31.12.2011 Change
%
Net profit for the year 19,785 3,876 Plus: Depreciation 12 12 Plus: Amortisation 29 29 Plus: Tax 1,747 2,088
EBITDA 21,573 6,005
Plus: Net loss of fair value adjustment of investment properties
50,416
61,607
Adjusted EBITDA 71,989 67,612 6.5%
Funds from Operations – FFO From 01.01.2012
To 31.12.2012 From 01.01.2011
To 31.12.2011 Change
%
Net profit for the year 19,785 3,876 Plus: Depreciation 12 12 Plus: Amortisation 29 29 Plus: Net loss of fair value adjustment of investment properties
50,416
61,607
FFO 70,242 65,524 7.2%

Director’s Report
All amounts expressed in € thousand, unless otherwise stated
8
C) Post balance sheet events There were no significant events after the date of the financial statements.
D) Significant risks
Fluctuations in property values (price risk) The Company is exposed to risk from changes in property values and rents which can originate from a) the developments in the real estate market in which the Company operates, b) the characteristics of properties owned by the Company and c) events concerning existing tenants of the Company. The Company minimizes its exposure to this risk, as the majority of the Company’s leases consist of long-term operating leases with the National Bank of Greece (the "Bank" or "parent company"), for a minimum period of 20 years, in which the annual rental adjustment is associated with the Consumer Price Index plus a spread of up to 1%. The Company is governed by an institutional framework under which a) periodic valuation of properties by SOE is required, b) a valuation of properties prior to an acquisition or a sale by SOE is required, c) development or repair of properties is permitted if the cost of works does not exceed 25% of the final commercial value after the completion of works and d) the value of each property must not exceed 25% of the value of the property portfolio. This framework contributes significantly to prevent or / and timely manage related risks. Non-performance of tenants (credit risk) Credit risk relates to cases of default of counterparties to meet their transactional obligations. No material losses are anticipated as the majority of the Company's portfolio is leased to NBG (99.03% of total rental income). Inflation risk The Company minimizes its exposure to inflation risk as the majority of the Company’s leases consist of long-term operating leases with tenants for a minimum period of 20 years, in which the annual rental adjustment is linked to the Consumer Price Index plus a spread of up to 1%. Cash flow risk and fair value interest rate risk The Company has significant interest bearing assets, which include demand deposits and short-term deposits. However, the Company is not exposed to cash flow risk and fair value interest rate risk, since short-term deposits have a maximum duration of 3 months (hence their interest rate is adjusted on a quarterly basis) and the Company has no finance leases and bank loans. Trade and other receivables do not bare interest and are short-term.

Director’s Report
All amounts expressed in € thousand, unless otherwise stated
9
Liquidity risk The current or future risk for earnings and capital arising from the inability of the Company to collect outstanding financial obligations without suffering significant losses. There is no significant risk due to the low balance of the Company’s obligations compared to receivables from operating leases, as well as the Company’s good access in the money market, through its parent company. Capital risk Capital risk for the Company does exist due to the large amount of funds and minimum obligations. The Company on December 31, 2012 did not have any borrowings, including finance leases. External factors and international investments
The Company has investments only within Greece
Ε) Outlook of the year 2013 In 2012, the crisis in the Greek market continued to have an impact, as the years 2011 and 2010, on the demand and supply both for different property types and markets (prime areas and secondary markets) with an immediate effect on sale prices, rental income and yields. In 2013, the downward trend in the real estate market is expected to continue, however at a slower rate than in previous years, and signs of stabilization are expected since late 2014. In 2012, like the previous two years, investors have suspended their investments in Greek real estate market monitoring developments. The Company's key objectives for 2013 include: the ability to increase the existing high-quality portfolio, taking into account the regulatory framework governing REICs and the current market conditions, the expansion of the Company’s customer base and maximization of returns on investment properties. Moreover, according to current law governing REICs, the Company is required to apply for the listing of its shares in the Athens Stock Exchange by the end of March 2013. Major events are imminent in the short-term and prior to 30 March 2013, such as the completion of the voluntary tender offer of the parent company "NATIONAL BANK OF GREECE SA" for the acquisition of all shares of «EUROBANK ERGASIAS SA». Upon completion of the Voluntary Tender Offer, the NBG Group will acquire a percentage of the listed Eurobank Properties REIC, an event which may have an affect on the way the Company lists its shares in the Athens Stock Exchange. The Company's management, depending on the developments of the abovementioned event and taking into account the prevailing conditions in the Greek real estate market and in the banking industry, will evaluate the various alternatives that will arise and will decide by 30 March 2013 for the direct or indirect listing of the Company's shares in the Athens Stock Exchange.

Director’s Report
All amounts expressed in € thousand, unless otherwise stated
10
Athens, 30 January 2013
CEO and Executive Member of the BOD
Aristotelis Karytinos

Statement of Financial Position as at 31 December 2012
All amounts expressed in € thousand, unless otherwise stated
The notes on pages 15 to 42 form an integral part of these financial statements 11
Statement of Financial Position
Note 31.12.2012 31.12.2011 ASSETS Non-current assets Investment properties 6 770,609 820,990 Property, plant and equipment 7 1,385 1,322 Intangible assets 8 274 303
772,268 822,615
Current assets Trade and other receivables 9 7,550 7,270 Cash and cash equivalents 10 165,408 95,829
172,958 103,099
Total assets 945,226 925,714
SHAREHOLDERS’ EQUITY Share capital 11 590,000 590,000 Reserves 12 325,984 325,790 Retained earnings 23,467 3,876
Total shareholders’ equity 939,451 919,666
LIABILITIES Long-term liabilities Retirement benefit obligations 13 22 17 22 17 Short-term liabilities Trade and other payables 14 4,918 4,892 Current tax liabilities 835 1,139 5,753 6,031 Total liabilities 5,775 6,048 Total shareholders’ equity and liabilities 945,226 925,714
Athens, 30 January 2013
The Chairman of the
BoD The CEO and Executive
Member of the BoD The CFO The Accountant
Christos Protopapas Aristotelis Karytinos Thiresia Messari Anna Chalkiadaki ID No. Σ061431 Passport No. ΑΙ2053388 ID No. ΑΑ003175 License No. 78785 Α’
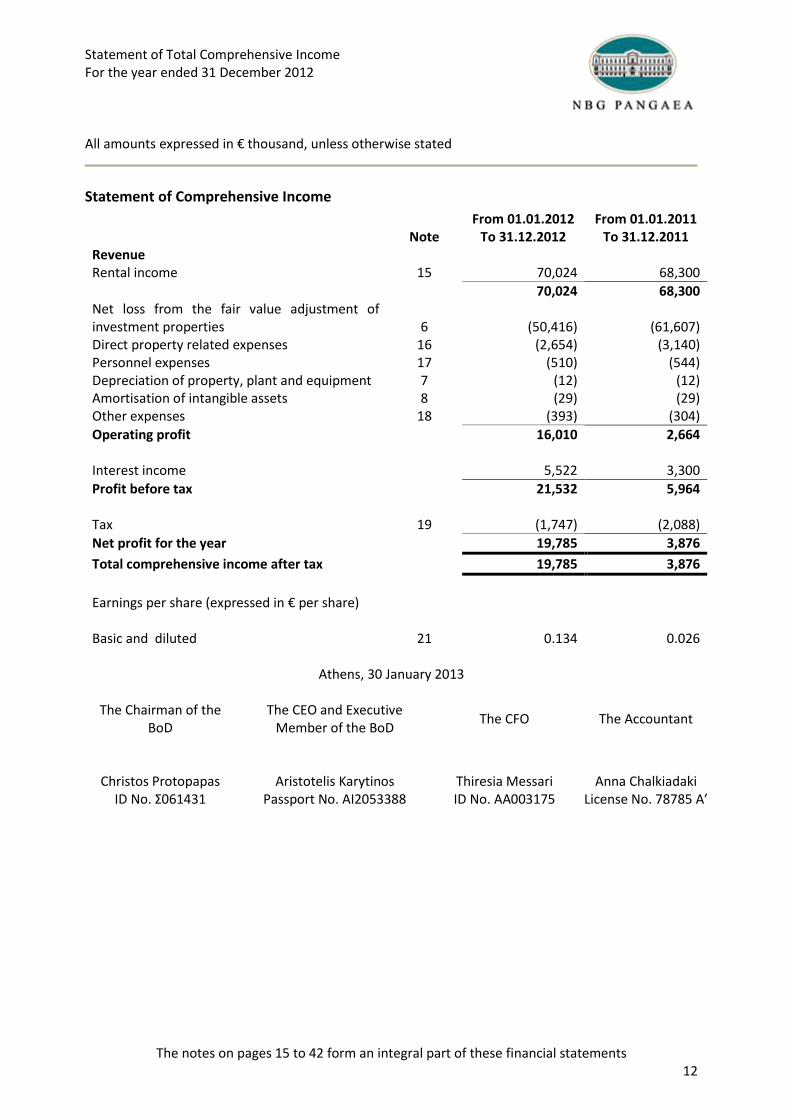
Statement of Total Comprehensive Income For the year ended 31 December 2012
All amounts expressed in € thousand, unless otherwise stated
The notes on pages 15 to 42 form an integral part of these financial statements 12
Statement of Comprehensive Income
From 01.01.2012 From 01.01.2011 Note To 31.12.2012 To 31.12.2011 Revenue Rental income 15 70,024 68,300
70,024 68,300 Net loss from the fair value adjustment of investment properties
6
(50,416)
(61,607)
Direct property related expenses 16 (2,654) (3,140) Personnel expenses 17 (510) (544) Depreciation of property, plant and equipment 7 (12) (12) Amortisation of intangible assets 8 (29) (29) Other expenses 18 (393) (304)
Operating profit 16,010 2,664 Interest income 5,522 3,300
Profit before tax 21,532 5,964 Tax 19 (1,747) (2,088)
Net profit for the year 19,785 3,876
Total comprehensive income after tax 19,785 3,876
Earnings per share (expressed in € per share)
- Basic and diluted 21 0.134 0.026
Athens, 30 January 2013
The Chairman of the BoD
The CEO and Executive Member of the BoD
The CFO The Accountant
Christos Protopapas Aristotelis Karytinos Thiresia Messari Anna Chalkiadaki ID No. Σ061431 Passport No. ΑΙ2053388 ID No. ΑΑ003175 License No. 78785 Α’

Statement of Changes in Shareholders’ Equity for the year ended 31 December 2012
All amounts expressed in € thousand, unless otherwise stated
The notes on pages 15 to 42 form an integral part of these financial statements 13
Statement of Changes in Shareholders’ Equity
Note Share capital Reserves Retained
Earnings Total Equity
Balance 1 January 2011 590,000 323,987 36,064 950,051 Net Profit for the year - - 3,876 3,876 Total comprehensive income after tax - - 3,876 3,876 Transfer to reserves 12 - 1,803 (1,803) - Dividend relating to 2010 20 - - (34,261) (34,261) Balance 31 December 2011 590,000 325,790 3,876 919,666
Balance 1 January 2012 590,000 325,790 3,876 919,666 Net Profit for the year - - 19,785 19,785 Total comprehensive income after tax - - 19,785 19,785 Transfer to reserves 12 - 194 (194) -
Balance 31 December 2012 590,000 325,984 23,467 939,451
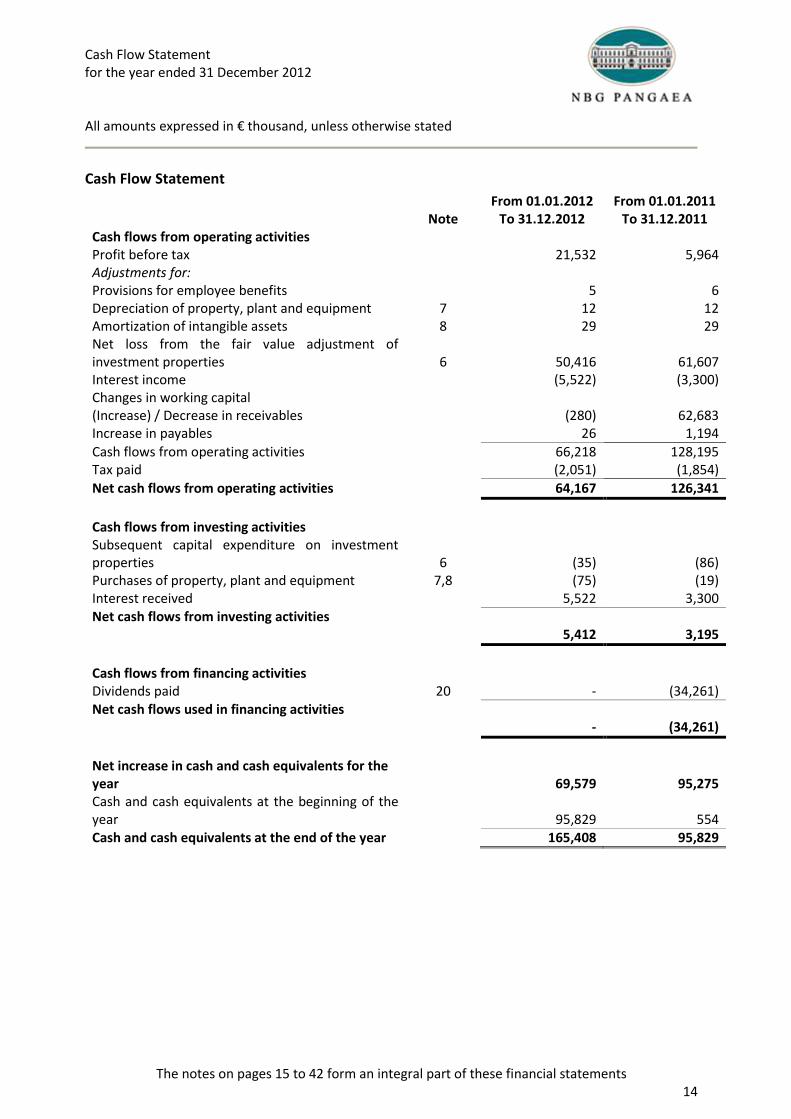
Cash Flow Statement for the year ended 31 December 2012
All amounts expressed in € thousand, unless otherwise stated
The notes on pages 15 to 42 form an integral part of these financial statements 14
Cash Flow Statement
From 01.01.2012 From 01.01.2011 Note To 31.12.2012 To 31.12.2011 Cash flows from operating activities Profit before tax 21,532 5,964 Adjustments for:
- Provisions for employee benefits 5 6 - Depreciation of property, plant and equipment 7 12 12 - Amortization of intangible assets 8 29 29 - Net loss from the fair value adjustment of
investment properties
6
50,416
61,607 - Interest income (5,522) (3,300)
Changes in working capital - (Increase) / Decrease in receivables (280) 62,683 - Increase in payables 26 1,194
Cash flows from operating activities 66,218 128,195 Tax paid (2,051) (1,854)
Net cash flows from operating activities 64,167 126,341
Cash flows from investing activities Subsequent capital expenditure on investment properties
6
(35)
(86)
Purchases of property, plant and equipment 7,8 (75) (19) Interest received 5,522 3,300 Net cash flows from investing activities
5,412
3,195
Cash flows from financing activities Dividends paid 20 - (34,261) Net cash flows used in financing activities
-
(34,261)
Net increase in cash and cash equivalents for the year
69,579
95,275
Cash and cash equivalents at the beginning of the year
95,829
554
Cash and cash equivalents at the end of the year 165,408 95,829

Notes to the Financial Statements All amounts expressed in € thousand, unless otherwise stated
15
1. General information
NBG Pangaea Real Estate Investment Company (the “Company”) is an investment property company and its objective, in accordance with article 3 of articles of association, is solely the acquisition and management: a) of real estate, option of asset acquisition via forward purchases agreements and the acquisition of shares in societes anonyme pursuant to Article 22 of Law 2778/1999 as in force and b) money market instruments as per Article 3 of Law 3283/2004, as in force. The National Bank of Greece SA ("NBG" or "Bank" or "Parent company") by its 29 September 2009 decision of the Board of Directors approved the establishment of a 100% owned real estate investment company in accordance with the provisions of par. 4, article 31 of L.2778/1999, as in force and articles 1-5 of L.2166/1993 and C.L.2190/1920, as in force, with contribution as capital of properties and cash. The balance sheet date (the date of contribution of the industry) was 30 September 2009. The Company was incorporated at 30 March 2010 with the No. 5941/30.03.2010 decision of the Athens Prefecture and is registered in the Societe Anonymes Register of the Ministry of Development (no. 69474/001/B/10/0128). The Company, as a Real Estate Investment Company (R.E.I.C.), is supervised by the Hellenic Capital Market Commission which granted it operating license No. 9/544/18.3.2010. The address of the Company’s registered office is 6, Karageorgi Servias street, Syntagma. The Company is controlled by NBG, which owns 100% of the Company’s shares. The financial statements of the Company are included in the consolidated financial statements of NBG (incorporated in Greece) by the full consolidation method. The current Board of Directors that has a term of three years and expires at the annual General Meeting of Shareholders of 2013, within 2014, was elected by the Annual General Meetings of Shareholders held on 30 June 2011 and 30 June 2012 and was constituted as a body in its 25 June 2012 meeting. The current Board has the following composition:
Christos I. Protopapas, Chairman (Non-executive member),
Spyridon G. Makrydakis, Vice Chairman (Non-executive member),
Aristotelis D. karytinos, CEO (Executive Member),
George E. Kountouris, Executive Member
Thiresia G. Messari, Executive Member
Prodromos G. Vlamis, Non-executive member. These financial statements have been approved for issue by the Company’s Board of Directors at 30 January 2013 and are subject to approval by the Company’s Annual Shareholders Meeting.
Notes to the Financial Statements All amounts expressed in € thousand, unless otherwise stated
16
2. Summary of significant accounting policies
The principal accounting policies applied in the preparation of these financial statements are set out below.
2.1. Basis of preparation
The above financial statements for the year ended 31 December 2012 (the «financial statements») have been prepared in accordance with International Financial Reporting Standards (“IFRSs») as endorsed by the European Union (the “ΕU”). EU endorsed IFRSs may differ from IFRSs as issued by the International Accounting Standards Board (the “IASB”), if, at any point in time, new or amended IFRSs have not been endorsed by the EU. At 31 December 2012, there were no unendorsed standards effective for the year ended 31 December 2012, which affect these financial statements and hence there was no difference between IFRSs endorsed by the EU and IFRSs issued by the IASB in terms of their application to the Company. Accordingly, the Company’s financial statements for the year ended 31 December 2012 are prepared in accordance with IFRSs as issued by the IASB.
The amounts are expressed in € thousand (unless otherwise stated).
The financial statements have been prepared in accordance with the going concern principle, under the historical cost convention, except for investment properties, which have been measured at fair value. Moreover, according to current law governing REICs, the Company is required to apply for the listing of its shares in the Athens Stock Exchange by the end of March 2013. Major events are imminent in the short-term and prior to 30 March 2013, such as the completion of the voluntary tender offer of the parent company "NATIONAL BANK OF GREECE SA" for the acquisition of all shares of «EUROBANK ERGASIAS SA». Upon completion of the Voluntary Tender Offer, the NBG Group will acquire a percentage of the listed Eurobank Properties REIC, an event which may have an effect on the way the Company lists its shares in the Athens Stock Exchange. The Company's management, depending on the developments of the abovementioned event and taking into account the prevailing conditions in the Greek real estate market and in the banking industry, will evaluate the various alternatives that will arise and will decide by 30 March 2013 for the direct or indirect listing of the Company's shares in the Athens Stock Exchange.
The preparation of financial statements in conformity with IFRS requires the use of estimates and assumptions that affect the reported amounts of assets and liabilities, the disclosure of contingent assets and liabilities at the date of the financial statements and the reported amounts of revenues and expenses during the reporting period. Use of available information and application of judgment are inherent in the formation of estimates in the following areas: estimation of the “fair value” of investment properties, estimation of retirement benefit obligations, liabilities from unaudited tax years and contingencies from litigations. Actual results in the future may differ from those reported.
The areas involving a higher degree of judgment or complexity, or areas where assumptions and estimates are significant t the financial statements are disclosed in Note 3.

Notes to the Financial Statements All amounts expressed in € thousand, unless otherwise stated
17
2.2. Adoption of International Financial Reporting Standards (IFRS)
2.2.1. New standards, amendments and interpretations to existing standards applied from 1 January 2012
- IFRS 7 “Financial Instruments: Disclosures” (Amendment) (effective for annual periods
beginning on or after 1 July 2011). The amendment requires certain additional disclosures in relation to transferred financial assets that are not de-recognised and for any continuing involvement in a transferred asset, existing at the reporting date, irrespective of when the related transfer transaction occurred. This amendment does not have an impact on the Company’s financial statements.
- IAS 12 “Income Tax” (Amendment) (effective for annual periods beginning on or after 1 January 2012). The amendments provide a practical approach for measuring deferred tax liabilities and deferred tax asset when investment property is measured using the fair value model of IAS 40 Investment Property. This amendment does not have an impact on the Company’s financial statements.
2.2.2. New standards, amendments and interpretations to existing standards effective after 2012
- IFRS 10 “Consolidated Financial Statements”, IFRS 11 “Joint Arrangements”, IFRS 12
«Disclosure of Interest in Other Entities”, IAS 27 “Separate Financial Statements” (Amendment), IAS 28 “Investments in Associates and Joint Ventures” (Amendment) (effective for annual periods beginning on or after 1 January 2013).
IFRS 10 provides a single consolidation model and builds on existing principles by identifying the concept of control as the determining factor in whether an entity should be included within the consolidated financial statements of the parent company. The standard provides addition guidance to assist in the determination of control where this is difficult to assess. IFRS 10 replaces the consolidation requirements in IAS 27 “Consolidated and Separate Financial Statements», which now only deals with the requirements of separate financial statements and SIC-12 “Consolidation – Special Purpose Entities».
IFRS 11 replaces IAS 31 “Interest in Joint Ventures” and SIC-13 “Jointly Controlled Entities — Non-monetary Contributions by Venturers”. It requires a party to a joint arrangement to determine the type of the joint arrangement in which it is involved by assessing its rights and obligations and then account for those rights and obligations in accordance with that type of joint arrangement. Joint arrangements are either joint operations or joint ventures. Unlike IAS 31, the use of “proportionate consolidation” to account for joint ventures is not permitted.
IAS 28 “Investments in Associates and Joint Ventures” (2011) supersedes IAS 28 “Investments in Associates” and prescribes the accounting for investments in associates and sets out the requirements for the application of the equity method when accounting for investments in associates and joint ventures.
IFRS 12 combines, enhances and replaces the disclosure requirements for subsidiaries, joint arrangements, associates and unconsolidated structured entities.
The Company has not applied these standards and amendments but they are not expected to have a material impact on the financial statements.

Notes to the Financial Statements All amounts expressed in € thousand, unless otherwise stated
18
- IFRS 13 «Fair Value Measurement» (effective for annual periods beginning on or after 1 January 2013). IFRS 13:
• defines fair value as the price that would be received to sell an asset or paid to transfer a
liability in an orderly transaction between market participants at the measurement date (i.e. an exit price);
• sets out in a single IFRS a framework for measuring fair value; and • requires disclosures for fair value measurements. IFRS 13 applies to IFRSs that require or permit fair value measurements or disclosures about fair value measurements (and measurements, such as fair value less costs to sell, based on fair value or disclosures about those measurements), except in specified circumstances. IFRS 13 explains how to measure fair value for financial reporting. It does not require fair value measurements in addition to those already required or permitted by other IFRSs and is not intended to establish valuation standards or affect valuation practices outside financial reporting.
The Company has not applied this standard and is currently evaluating the impact of IFRS 13 on the financial statements.
- IAS 1 “Presentation of Financial Statements” (Amendment) (effective for annual periods
beginning on or after 1 July 2012). The amendment requires to group together items within other comprehensive income (“OCI”) that may be reclassified to the profit and loss section of the income statement subsequently. The Company has not applied this amendment but it is not expected to have a material impact on the financial statements.
- IAS 19 “Employee Benefits” (Amendment) (effective for annual periods beginning on or after 1 January 2013). The amendments: • eliminate the option to defer the recognition of gains and losses, known as the “corridor
method” and require companies to recognize these changes as they occur. As a result any deficit or surplus in a plan will be included in the statement of financial position;
• require to include service and finance cost in income statement and measurements in OCI; • introduces more extensive disclosure requirements relating to the characteristics, risks and
amounts in the financial statements regarding defined benefit plans, as well as the effect of the defined benefit plans on the amount, timing and uncertainty of the entity’s future cash flows;
• modify the accounting for termination benefits including distinguishing benefits provided in exchange for service and benefits provided in exchange for the termination of employment and affect the recognition and measurement of termination benefits.
The Company has not applied this amendment but it is not expected to have a material impact on the financial statements.
- IFRS 7 “Financial Instruments: Disclosures” (Amendment) (effective for annual periods beginning on or after 1 January 2013). The amendment requires information about all recognized financial instruments that are set off in accordance with paragraph 42 of IAS 32. The amendment also requires disclosure of information about recognized financial instruments that are subject to enforceable master netting arrangements and similar agreements even if they are not set off under IAS 32. The Company has not applied this amendment.
- Annual improvements to IFRSs, May 2012 (effective for annual periods beginning on or after 1
January 2013). The Company has not applied these amendments.

Notes to the Financial Statements All amounts expressed in € thousand, unless otherwise stated
19
- IFRS 10 “Consolidated Financial Statements”, IFRS 11 “Joint Arrangements”, IFRS 12
“Disclosure of Interests in Other Entities” (Amendment) (effective for annual periods beginning on or after 1 January 2013).
The amendments clarify the transition guidance in IFRS 10. The amendments also provide additional transition relief in IFRS 10, IFRS 11 and IFRS 12, limiting the requirement to provide adjusted comparative information to only the preceding comparative period. Furthermore, for disclosures related to unconsolidated structured entities, the amendments will remove the requirement to present comparative information for periods before IFRS 12 is first applied. The Company will apply these amendments when it first applies IFRS 10, IFRS 11 and IFRS 12.
- IAS 32 “Financial Instruments: Presentation” (Amendment) (effective for annual periods beginning on or after 1 January 2014). The amendment provides clarification on the application of the offsetting rules. The Company has not applied this amendment.
- IFRS 10 “Consolidated Financial Statements”, IFRS 12 “Disclosure of Interest in Other Entities”,
IAS 27 “Separate Financial Statements” (Amendment) (effective for annual periods beginning on or after 1 January 2014).
These amendments provide “investment entities” (as defined) an exemption from the consolidation of particular subsidiaries and instead require that an investment entity measure the investment in each eligible subsidiary at fair value through profit and loss. “Investment entity” is defined as an entity whose business purpose is to invest funds solely for returns from capital appreciation, investment income or both. An investment entity must also evaluate the performance of its investments on a fair value basis. The Company has not applied these amendments.
- IFRS 9 “Financial Instruments” (effective for annual periods beginning on or after 1 January 2015). IFRS 9, issued in November 2009, introduced new requirements for the classification and measurement of financial assets. IFRS 9 was amended in October 2010 to include requirements for the classification and measurement of financial liabilities and for derecognition. The new standard requires all financial instruments: (a) to be classified based on the business model of the entity for the financial instruments
and the cash flow characteristics of the instruments. (b) to be initially measured at fair value plus transaction costs, except for financial
instruments at fair value through profit and loss, and for which transaction costs are not included.
(c) to be subsequently measured at amortized cost or fair value. (d) investments in shares can be identified as valued "at fair value through OCI" and only
dividends are recognized in the income statement. e) the concept of embedded derivatives is removed for financial assets within the scope of
the standard and the instruments should be classified and measured in accordance with the above.
The standard also stipulates financial liabilities to be classified as measured either at fair value through profit or loss or at amortized cost. For financial liabilities designated as at fair value through profit or loss, the change in fair value attributable to changes in credit risk is recognized
Notes to the Financial Statements All amounts expressed in € thousand, unless otherwise stated
20
directly in OCI, unless it creates or enlarges an accounting asymmetry. The amount recognized in OCI is not recognized in the income statement when the liability is settled or extinguished. The Company has not applied this standard and is currently evaluating the impact of IFRS 9 on the financial statements and the timing of its adoption.
There are no other IFRSs or IFRIC Interpretations that are not yet effective that would be expected to have a material impact in the Company’s financial statements.
2.3. Foreign currency translation
The Company’s financial statements are presented in thousands of euro (€ ‘000) which is the functional currency of the Company.
Foreign currency transactions are translated into the functional currency using the exchange rates prevailing at the dates of the transactions. When preparing the financial statements, assets and liabilities denominated in foreign currencies are translated into euro at the official exchange rates prevailing at the reporting date as issued by the European Central Bank (the “ECB”). Foreign exchange gains and losses resulting from the settlement of such transactions and from the translation at year-end exchange rates of monetary assets and liabilities denominated in foreign currencies are recognised in the income statement. 2.4. Investment Property
Investment property comprises land and buildings, owned by the Company (or held through a finance leasing agreement) with the intention of earning rental or capital appreciation or both. Investment property is measured initially at its cost, including related transaction costs. After initial recognition, investment property is carried at fair value. Fair value is based on active market prices, adjusted, if necessary, for any difference in the nature, location or condition of the specific asset. If this information is not available, the Company uses alternative valuation methods such as recent prices on less active markets or discounted cash flow projections. These valuations are appraised as at June 30 and December 31 each year by the Greek Body of Sworn-In Valuers (the “SOE”) in accordance with the guidance issued by the International Valuation Standards Committee.
Investment property further qualified for continued use as investment property, or for which the market has become less active, continues to be valued at fair value. The fair value of investment property reflects, among other things, rental income from current leases and assumptions about rental income from future leases in the light of current market conditions. The fair value also reflects, on a similar basis, any cash outflows (including rental payments and other outflows) that could be expected in respect of the property. Some of those outflows are reflected as a liability; whereas others, including contingent rent payments, are not recognised in the financial statements.
Subsequent expenditure is charged to the asset’s carrying amount only when it is probable that future economic benefits associated with the item will flow to the Company and the cost of the item can be measured reliably.

Notes to the Financial Statements All amounts expressed in € thousand, unless otherwise stated
21
Repairs and maintenance costs are charged to the income statement during the financial period in which they are incurred.
Changes in fair values are recorded in the income statement. Investment property is derecognised when disposed or when use of investment property is ended and there is no future economic benefit expected from the disposal. If an investment property becomes owner-occupied, it is reclassified as property, plant and equipment and its fair value at the date of reclassification becomes its cost for accounting purposes. If an item of property, plant and equipment becomes an investment property because its use has changed, any difference resulting between the carrying amount and the fair value of this item at the date of transfer, is recognised in equity as a revaluation of property, plant and equipment under IAS 16. However, if a fair value gain reverses a previous impairment loss, the gain is recognised in the income statement to the extent that this gain reverses a previous impairment loss. Any remaining profit is recognized in OCI by increasing the asset revaluation reserve in equity. Property that is being developed for future use as investment property is classified as property, plant and equipment and stated at cost until the development is complete, so it is reclassified and subsequently accounted for as investment property. Investment property held for sale without redevelopment is classified within non-current assets held for sale under IFRS 5. 2.5. Property, plant and equipment
Property, plant and equipment include land, buildings and equipment held by the Company for use in the supply of services or for administrative purposes. Property, plant and equipment are initially recorded at cost, which includes all costs that are required to bring an asset into operating condition.
Subsequent to initial recognition, property, plant and equipment are measured at cost less accumulated depreciation and accumulated impairment losses. Costs incurred subsequent to the acquisition of an asset, which is classified as property, plant and equipment, are capitalized only when it is probable that they will result in future economic benefits to the Company beyond those originally anticipated from the asset, otherwise they are expensed as incurred.
Depreciation of an item of property, plant and equipment begins when it is available for use and ceases only when the asset is derecognised. Therefore, the depreciation of an item of property, plant and equipment that is retired from active use does not cease unless it is fully depreciated. Property, plant and equipment are depreciated on a straight-line basis over their estimated useful lives, which can be reassessed. Estimated useful lives of property, plant and equipment per category is as follows:
Land: No depreciation Buildings: 40 years Furniture and other equipment: 3 – 5 years
At each reporting date, the Company assesses whether there is an indication that an item of property, plant and equipment may be impaired. If any such indication exists, the Company estimates the recoverable amount of the asset. When the carrying amount of an asset is greater than its estimated recoverable amount, it is written down immediately to its recoverable amount. Gains

Notes to the Financial Statements All amounts expressed in € thousand, unless otherwise stated
22
and losses on disposal of property, plant and equipment are determined by reference to their carrying amount and are taken into account in determining profit / (loss) before tax. 2.6. Intangible assets
Intangible assets relate to software acquisition costs.
Software includes costs that are directly associated with identifiable and unique software products controlled by the Company that are anticipated to generate future economic benefits exceeding costs beyond one year. Expenditure, which enhances or extends the performance of computer software programs beyond their original specifications is recognised as a capital movement and added to the original cost of the software.
Intangible assets are amortised using the straight-line method over their useful life, not exceeding 12 years.
Expenditure on starting up an operation, training personnel, advertising and promotion and relocating or reorganising part or the entire Company is recognised as an expense when it is incurred.
At each reporting date, management reviews intangible assets and assesses whether there is any indication of impairment. If any such indications exist, an analysis is performed to assess whether the carrying amount of intangible assets is fully recoverable. A write-down is made if the carrying amount exceeds its recoverable amount.
2.7. Leases
The determination of whether an arrangement is or contains a lease is based on the substance of the arrangement. It requires an assessment of whether: a) fulfillment of an arrangement is dependent on the use of a specific asset or assets (the asset) and b) the arrangement conveys a right to use the asset.
2.7.1. The Company is the lessor
Operating leases: The Company leases out owned properties under operating leases and are included in the statement of financial position as investment property (Note 7). Rental income (net of any incentives given to the lessees) is recognised on a straight-line basis over the lease term. Rental guarantees received at the inception of the lease contract are recognized as liabilities and carried at cost. Finance leases: The Company does not currently lease out properties under finance leases.
2.7.2. The Company is the lessee
Operating leases: Leases where a significant portion of the risks and rewards of ownership of the asset are retained by the lessor are classified as operating leases. The total payments made under operating leases (net of any incentives received by the lessor) are charged to the income statement on a straight-line basis over the period of the lease. When an operating lease is terminated before the lease period has expired, any payment required to be made to the lessor by way of penalty is recognised as an expense in the period in which termination takes place. There were no material operating leases for the periods covered by the financial statements.
Notes to the Financial Statements All amounts expressed in € thousand, unless otherwise stated
23
Finance leases: The Company currently does not engage, as a lessee, in finance leases.
2.8. Trade and other receivables
Trade receivables are recognised initially at their fair value and subsequently measured at amortised cost using the effective interest rate method (if these are payable after one year), unless the effects of discounting are not material, less provision for impairment. A provision for impairment of trade receivables is established when there is objective evidence that the Company will not be able to collect all amounts due according to the original terms of the receivables. The amount of the provision is the difference between the asset’s carrying amount and the present value of estimated future cash flows, discounted at the effective interest rate and recognised as an expense in the income statement.
2.9. Cash and cash equivalents
For the purposes of the cash flow statement, cash and cash equivalents comprise balances of accounts "cash in hand" and "demand deposits". Cash equivalents comprise short-term time deposits. Cash and cash equivalents are used by the Company to serve the short-term liabilities and the risk of change in fair value is immaterial. 2.10. Share capital
Ordinary shares are classified as equity. Incremental costs directly attributable to the issue of new shares or options are shown in equity as a deduction (net of tax), from the proceeds. Expenditure on starting up an operation is recognised as an expense when it is incurred. 2.11. Trade and other payables
Trade payables are recognised initially at fair value and subsequently measured using the effective interest rate method. 2.12. Current tax
As a Real Estate Investment Company, and in accordance with law 2778/1999, the Company is exempted from corporate income tax and is subject to an annual tax based on its assets. More specifically, the tax is determined by reference to the average fair value of its investment properties and cash and cash equivalents (as depicted on the Company’s biannual investment schedules) at the tax rate of 10% of the aggregate European Central Bank (“E.C.B.”) reference rate plus 1% (the taxation formula is as follows: 10% * (ECB reference rate + 1%)). Current tax liabilities include short-term liabilities to the tax authorities related to the above payable tax.
As the Company's tax liability is calculated on the basis of assets rather than on its profits, no temporary differences arise and therefore no deferred tax liabilities and / or assets arise. 2.13. Employee benefits
A defined contribution plan is a post-employment benefit plan under which the Company pays fixed contributions into a separate entity and has no legal or constructive obligations to pay further contributions, if the entity does not hold a=sufficient assets to pay all employees’ benefits relating to

Notes to the Financial Statements All amounts expressed in € thousand, unless otherwise stated
24
employee service in the current and prior period. Company contributions to defined contribution plans are charged to the income statement in the year to which they relate and are included in personnel expenses.
A defined benefit plan is a post-employment benefit plan under that defines an amount of benefit to be provided, usually as a function of one or more factors such as age, year of service or compensation. The difference with defined contribution plans is that the Company is liable for the payment of the agreed benefits to the employee. The only existing defined benefit plan for the Company relates to the payment of a compensation of L.2112/1920. This program is not self-funded. For defined benefit plans, the liability is the present value of the defined benefit obligation as at the reporting date minus the fair value of the plan assets, including any adjustments for unrecognized actuarial gains/losses and past service costs. The Company follows the “corridor” approach of IAS 19 “Employee benefits”, according to which a certain amount of actuarial gains and losses remains unrecognised and are amortised over the average remaining service lives of the employees participating in the plan.
The defined benefit obligations and related costs are calculated by independent actuaries on an annual basis using the projected unit credit method. The present value of the defined obligation is determined by discounting the estimated future outflows using interest rates of high quality corporate bonds or government bonds that are denominated in the currency in which the benefits will be paid and which have terms to maturity approximating the terms of the related liability. Defined benefit plan costs, as estimated, are charged to the income statement and are included in personnel expenses. 2.14. Provisions
Provisions for legal claims are recognised when: the Company has a present legal or constructive obligation as a result of past events; it is probable that an outflow of resources will be required to settle the obligation; and the amount has been reliably estimated.
2.15. Revenue recognition
Rental income from operating leases is recognised in income statement on a straight-line basis over the lease term. When the Company provides incentives to its customers, the cost of incentives are recognised over the lease term, on a straight-line basis, as a reduction from rental income.
Revenue from sale of properties is recognised with the actual sale.
Interest income is recognised on a time-proportion basis using the effective interest method. 2.16. Interest income
Interest income relating to interest on demand deposits and time deposits is recognised in the income statement using the effective interest method.
Once a financial asset or a group of similar financial assets has been written down as a result of an impairment loss, interest income is recognised using the rate of interest used to discount the future cash flows for the purpose of measuring the impairment loss.

Notes to the Financial Statements All amounts expressed in € thousand, unless otherwise stated
25
2.17. Dividend distribution
Dividend distribution to the Company’s shareholders is recognised as a liability in the financial statements in the period in which the dividends are approved by the General Assembly of Shareholders. 2.18. Segment reporting
Operating segments are reported in a manner consistent with the internal reporting provided to the chief operating decision-maker. The chief operating decision-maker is the person or group that allocates resources to and assesses the performance of the operating segments of an entity. The Company has determined that its chief operating decision-maker is the Investment Committee of the Company. 2.19. Related party transactions
Related parties include the parent company, NBG, as well as entities which the Bank has the ability to exercise influence in making financial and operating decisions. Related parties include directors, their close relatives, companies owned or controlled by them and companies over which they can influence the financial and operating cycles. All transactions with related parties are made on substantially the same terms as those applicable to similar transactions with unrelated parties, including interest rates and collateral, and do not involve a risk greater than normal. 2.20. Offsetting
Financial assets and liabilities are offset and the net amount is reported in the statement of financial position when, and only when, there is a legally enforceable right to offset the recognised amounts and there is an intention to realize the asset and settle the liability simultaneously or on an net basis. 2.21. Earnings per share
A basic earnings per share (EPS) ratio is calculated by dividing the net profit or loss for the period attributable to ordinary shareholders by the weighted average number of ordinary shares outstanding during the period, excluding the average number of ordinary shares purchased by the Company or held as treasury shares.
The ratio of "diluted" earnings per share is calculated using the same method as the basic earnings per share ratio, however the profits and the number of shares are adjusted in order to reflect any reduction in earnings per share, which could result in the conversion of any convertible debentures or the exercise of options, warrants or other contracts, into common shares.
3. Critical judgments and estimates
The preparation of financial statements in accordance with IFRS requires management to make judgments, estimates and assumptions that affect the reported amounts of assets, liabilities, income and expense in the financial statements. The Company's management believes that the judgments, estimates and assumptions used in the preparation of the financial statements are appropriate given the factual circumstances as of 31 December 2012 and 2011.

Notes to the Financial Statements All amounts expressed in € thousand, unless otherwise stated
26
Estimates and judgments are continually evaluated and are based on historical experience and other factors, including expectations of future events that may, under current circumstances, be undertaken.
3.1. Critical accounting estimates and assumptions
The Company makes estimates and assumptions concerning the outcome of future events. Estimates will, by definition, seldom equal the related actual results. The estimates and assumptions that have a significant risk of causing a material adjustment to the carrying amounts of assets and liabilities within the next financial year are as follows: a) Estimate of fair value of investment properties.
The best evidence of fair value is current prices in an active market for similar leases and other contracts. In the absence of such information, the Company determines the amount within a range of reasonable fair value estimates. Under current legislation REIC, estimates of investment property should be supported by independent appraisals performed by SOE on 30 June and 31 December each year. The valuations are based primarily on discounted cash flows due to the absence of sufficient current prices in an active market. In making its judgment, the Company considers information from various sources, including:
(i) Current prices in an active market for properties of different nature, condition or location (or
subject to different lease or other contracts), adjusted to reflect those differences; (ii) Recent prices of similar properties in less active markets, with adjustments to reflect any
changes in economic conditions since the date of the transactions that occurred at those prices; and
(iii) Discounted cash flow projections based on reliable estimates of future cash flows, derived from the terms of any existing leases and other contacts, and (where possible) from external evidence such as current market rents for similar properties in the same location and condition, and using discount rates that reflect current market assessments of the uncertainty in the amount and timing of the cash flows.
b) Principal assumptions for management’s estimation of fair value.
If information on current or recent prices of assumptions underlying the discounted cash flow approach is not available, the fair values of investment properties are determined using discounted cash flow valuation techniques. The Company uses assumptions that are mainly based on market conditions existing at each balance sheet date. The principal assumptions underlying management’s estimation of fair value are those related to: the receipt of contractual rentals; expected future market rentals; vacant periods; maintenance requirements; and appropriate discount rates. These valuations are regularly compared to actual market yield data, and actual transactions by the Company and those reported by the market. The future rental rates are estimated on the basis of current rents for similar properties on the same location and quality. Were the length of vacant periods as at 31 December 2012, were to increase or decrease in the discounted cash flow analysis by +/-10% from management’s estimates, the carrying amount of investment properties that are valued would be estimated €1,229 lower or higher, respectively.

Notes to the Financial Statements All amounts expressed in € thousand, unless otherwise stated
27
Were the discount rate as at 31 December 2012, used in the discounted cash flow analysis, to increase or decrease by +/-10% from management estimates, the carrying amount of investment properties would be an estimated €40,911 lower or €45,480 higher, respectively.
3.2. Critical judgments in the Company’s accounting policies
The Company has not made significant judgments in 2012.
4. Financial risk management
4.1. Financial risk management
The Company's activities expose it to a variety of financial risks such as market risk, credit risk and liquidity risk. The financial risks relate to the following financial instruments: trade and other receivables, cash and cash equivalents and trade and other payables. The accounting policy with respect to these financial instruments is described in Note 2. The risk management policy, followed by the Company, focuses on minimizing the impact of unexpected market changes.
a) Market risk
i) Foreign exchange risk The Company operates in Greece, so it is not exposed to significant risks from foreign currency.
ii) Price risk The Company is exposed to risk from changes in property values and rents which can originate from a) the developments in the real estate market in which the Company operates, b) the characteristics of properties owned by the Company and c) events concerning existing tenants of the Company. The Company minimizes its exposure to this risk, as the majority of the Company’s leases consist of long-term operating leases with creditworthy tenants, for a minimum period of 20 years, in which the annual rental adjustment is associated with the Consumer Price Index plus a spread of up to 1%. The Company is governed by an institutional framework under which a) periodic valuation of properties by SOE is required, b) a valuation of properties prior to an acquisition or a sale by SOE is required, c) development or repair of properties is permitted if the cost of works does not exceed 25% of the final commercial value after the completion of works and d) the value of each property must not exceed 25% of the value of the property portfolio. This framework contributes significantly to prevent or / and timely manage related risks.
iii) Cash flow and fair value interest rate risk
The Company has significant interest bearing assets comprising demand deposits and short term deposits. However, the Company is not exposed to cash flow risk and fair value interest rate risk, since short-term deposits have a maximum duration of 3 months (hence their interest rate is adjusted on a quarterly basis) and the Company has no finance leases and bank loans. Trade and other receivables do not bare interest and are short-term.

Notes to the Financial Statements All amounts expressed in € thousand, unless otherwise stated
28
b) Credit risk
The Company has concentration of credit risk with respect to lease receivables from operating leases. Credit risk relates to cases of default of counterparties to meet their transactional obligations. No are anticipated as lease agreements are conducted with customers - tenants of sufficient creditworthiness and the majority of the Company's property portfolio is leased to NBG (99.03% of total rental income). The Company's maximum exposure to credit risk is set out below (liquidity risk). c) Liquidity risk
The current or future risk for earnings and capital arising from the inability of the Company to collect outstanding financial obligations without suffering significant losses. The financial liabilities of the Company as at December 31 2012 amounted to €643 (31 December 2011: 296) and are payable with twelve months. There is no significant risk due to the low balance of the Company’s obligations above compared to cash and cash equivalents and receivables from operating leases, as well as the Company’s good access in the money market, through its parent company.
4.2. Capital risk management
The Company’s objective when managing capital is to safeguard the Company’s ability to continue as a going concern in order to provide returns for shareholders and benefits for other stakeholders and to maintain an optimal capital structure and to comply with L.2778/1999, as in force. There is no capital risk for the Company due to the large amount of funds and minimum obligations. For the acquisition of new properties, the Company may issue new shares or borrow within the framework set by L.2778/1999, as in force.
Consistent with others in the industry, the Group monitors capital on the basis of the gearing ratio (debt ratio). This ratio is calculated as total borrowings (including finance leases) divided by total assets, as shown in the statement of financial position. The regulatory regime governing REICs in Greece permit Greek REICs to borrow up to 50% of the value of total assets, for acquisitions and improvements on properties. The Company’s goal is to optimise its capital structure through effective use of debt financing. The Company at 31 December 2012 did not have any borrowings, including finance leases. As a result, the gearing ratio is 0% (31 December 2011: 0%).

Notes to the Financial Statements All amounts expressed in € thousand, unless otherwise stated
29
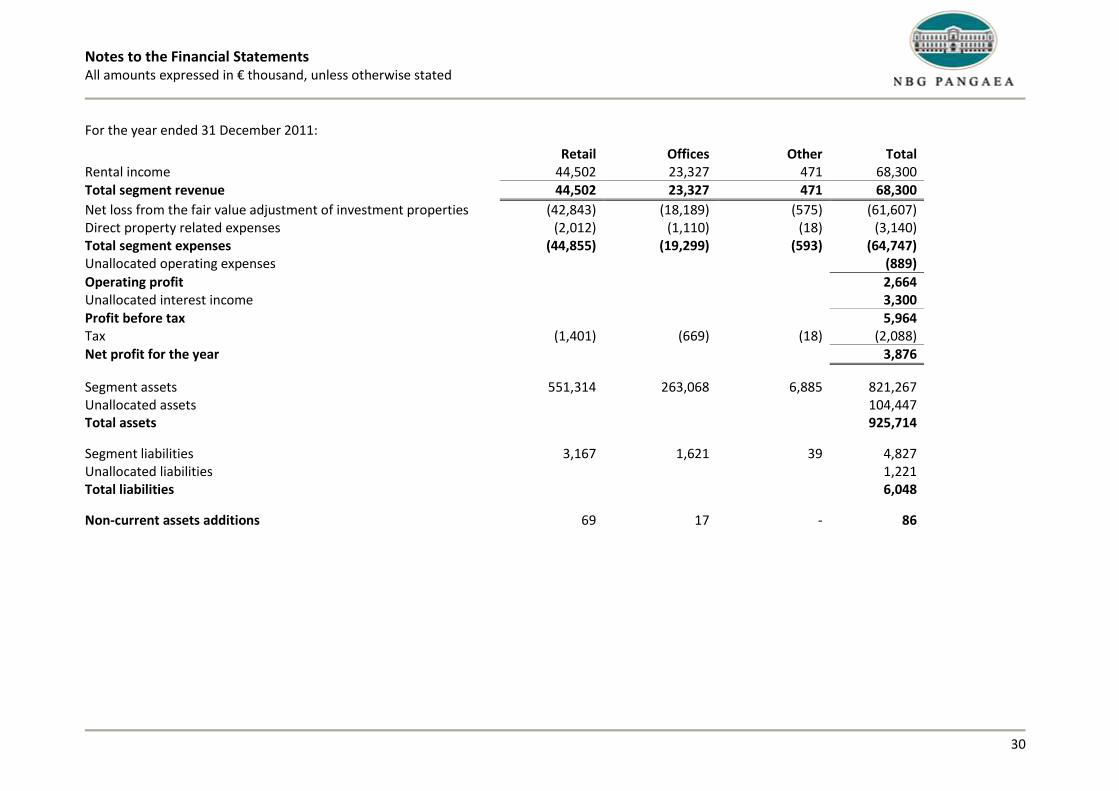
5. Segment reporting
The business segments of the Company, depending on the origin of the revenues per type of properties, are: a) retail, b) offices c) other (which include storage and parking spaces). The Company operates only in the Greek market, therefore no secondary segments’ analysis exists. For the year ended 31 December 2012: Retail Offices Other Total Rental income 45,552 23,954 518 70,024 Total segment revenue 45,552 23,954 518 70,024
Net loss from the fair value adjustment of investment properties (35,697) (14,014) (705) (50,416) Direct property related expenses (1,663) (973) (18) (2,654) Total segment expenses (37,360) (14,987) (723) (53,070) Unallocated operating expenses (944)
Operating profit 16,010 Unallocated interest income 5,522 Profit before tax 21,532 Tax (1,168) (565) (14) (1,747)
Net profit for the year 19,785
Segments assets 515,443 249,504 6,212 771,159 Unallocated assets 174,067 Total assets 945,226
Segments liabilities 3,155 1,619 37 4,811 Unallocated liabilities 964 Total liabilities 5,775
Non-current assets additions 10 25 - 35
Notes to the Financial Statements All amounts expressed in € thousand, unless otherwise stated
30
For the year ended 31 December 2011: Retail Offices Other Total Rental income 44,502 23,327 471 68,300 Total segment revenue 44,502 23,327 471 68,300
Net loss from the fair value adjustment of investment properties (42,843) (18,189) (575) (61,607) Direct property related expenses (2,012) (1,110) (18) (3,140) Total segment expenses (44,855) (19,299) (593) (64,747) Unallocated operating expenses (889)
Operating profit 2,664 Unallocated interest income 3,300 Profit before tax 5,964 Tax (1,401) (669) (18) (2,088) Net profit for the year 3,876
Segment assets 551,314 263,068 6,885 821,267 Unallocated assets 104,447 Total assets 925,714
Segment liabilities 3,167 1,621 39 4,827 Unallocated liabilities 1,221 Total liabilities 6,048
Non-current assets additions 69 17 - 86

Notes to the Financial Statements All amounts expressed in € thousand, unless otherwise stated
31
In relation to the above segment analysis we state that: (a) There are no transactions between business segments. (b) Segment assets include investment properties and trade receivables. (c) Unallocated assets include property, plant and equipment, intangible assets, cash and cash
equivalents and other receivables. Concentration of customers NBG, a lease of the Company, represents more than 10% of the Company’s rental income. Rental income for the year ended 31 December 2012 from NBG amounted to €69,347, ie. 99.03% (31 December 2011: €67,429, i.e. 98.72%).
6. Investment properties
Year ended 31 December 2012 2011 Balance at the beginning of the year 820,990 882,511 Additions:
- Subsequent capital expenditure on investment properties 35 86 Net loss from the fair value adjustment of investment properties (50,416) (61,607)
Balance at the end of the year 770,609 820,990
In accordance with existing Greek REIC legislation, property valuations are supported by independent appraisals performed by S.O.E. for June 30 and December 31 each year. Valuations are based primarily on discounted cash flow projections due to the absence of sufficient market prices from an active market. The last valuation of the Company’s properties was performed at 31 December 2012, based on S.O.E.’s valuations dated 31 December 2012, as stipulated by the relevant provisions of L.2778/1999. From the fair value adjustment of investment properties losses resulted that amounted to €50,416 (year 2011: €61,607).
Notes to the Financial Statements All amounts expressed in € thousand, unless otherwise stated
32
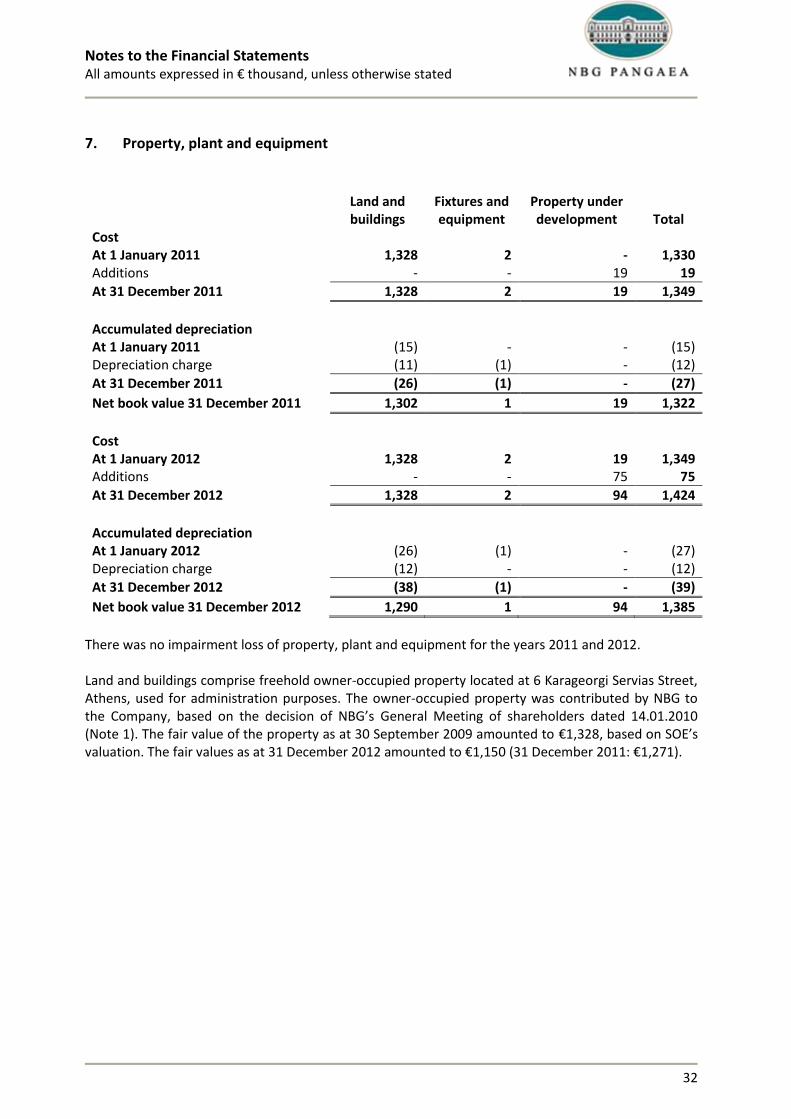
7. Property, plant and equipment
Land and buildings
Fixtures and equipment
Property under development Total
Cost At 1 January 2011 1,328 2 - 1,330 Additions - - 19 19
At 31 December 2011 1,328 2 19 1,349
Accumulated depreciation At 1 January 2011 (15) - - (15) Depreciation charge (11) (1) - (12)
At 31 December 2011 (26) (1) - (27)
Net book value 31 December 2011 1,302 1 19 1,322
Cost At 1 January 2012 1,328 2 19 1,349 Additions - - 75 75
At 31 December 2012 1,328 2 94 1,424
Accumulated depreciation At 1 January 2012 (26) (1) - (27) Depreciation charge (12) - - (12)
At 31 December 2012 (38) (1) - (39)
Net book value 31 December 2012 1,290 1 94 1,385
There was no impairment loss of property, plant and equipment for the years 2011 and 2012. Land and buildings comprise freehold owner-occupied property located at 6 Karageorgi Servias Street, Athens, used for administration purposes. The owner-occupied property was contributed by NBG to the Company, based on the decision of NBG’s General Meeting of shareholders dated 14.01.2010 (Note 1). The fair value of the property as at 30 September 2009 amounted to €1,328, based on SOE’s valuation. The fair values as at 31 December 2012 amounted to €1,150 (31 December 2011: €1,271).

Notes to the Financial Statements All amounts expressed in € thousand, unless otherwise stated
33
8. Intangible assets
Software Cost At 1 January 2011 346
At 31 December 2011 346
Accumulated amortisation At 1 January 2011 (14) Amortisation charge (29)
At 31 December 2011 (43)
Net book value 31 December 2011 303
Cost At 1 January 2012 346
At 31 December 2012 346
Accumulated amortisation At 1 January 2012 (43) Amortisation charge (29)
At 31 December 2012 (72)
Net book value 31 December 2012 274
9. Trade and other receivables
The analysis of trade and other receivables is as follows:
31.12.2012 31.12.2011 Trade receivables 458 271 Receivables from related parties (Note 23) 101 17 Receivables from Greek State 5,904 5,904 Prepaid expenses 1,057 1,055 Other receivables 30 23
Total 7,550 7,270
The fair value of the Company’s receivables is estimated to approximate their carrying value, as the recovery is expected to take place over a period such that the effect of the time value of money is considered immaterial. Receivables from Greek state mainly relate to capital accumulation tax paid by the Company at 14.4.2010. Upon payment of this tax, the Company expressed its reservation on the obligation to pay the tax and at the same time it requested the refund of this amount (incl. relevant interest) as a result of paragraph 1, article 31 of Law 2778/1999 , which states that "the shares issued by a REIC and the transfer of properties to a REIC are exempt of any tax, fee, stamp duty, levies, duties or any other charge in favour of the State, public entities and third parties in general." Because of the lack of response of the relevant authority after a three months period, the Company filed an appeal and the Company's management, based on the advice of its legal advisors, believes that the reimbursement of the amount is in essence certain.

Notes to the Financial Statements All amounts expressed in € thousand, unless otherwise stated
34
Prepaid expenses at 31 December 2012 and 2011 mainly relate to legal and valuation expenses for the preparation of the listing of the Company’s shares in a stock exchange.
10. Cash and cash equivalents
The analysis of cash and cash equivalents is as follows:
31.12.2012 31.12.2011 Cash at hand - 1 Demand deposits 408 128 Short term deposits 165,000 95,700
Total 165,408 95,829
The fair value of the Company’s cash and cash equivalents is estimated to approximate their carrying value.
11. Share capital
The total authorized number of ordinary shares at 31 December 2012 and 2011 amounted to 147,500,000 with a par value of €4.00 per share. Share capital, of €590,000, is fully paid up. The Company shares are ordinary shares with voting right. The Company does not hold own shares.
12. Reserves
Reserves are analysed as follows: Statutory
Reserve Special
Reserve
Total
Balance 01.01.2011 - 323,987 323,987
Transfer to statutory reserve 1,803 - 1,803
Balance 31.12.2011 1,803 323,987 325,790
Balance 01.01.2012 1,803 323,987 325,790 Transfer to statutory reserve 194 - 194
Balance 31.12.2012 1,997 323,987 325,984
As discussed in Note 1, NBG contributed 241 properties to the Company in exchange for shares. An amount of €589,868, which equals the value of the properties as presented in NBG’s tax books at 30 September 2009, was recorded as Company’s share capital (Note 11). The fair value of the properties at 30 September 2009 amounted to €913,855, according to the valuation performed by S.O.E. (Notes 6 and 7). The Extraordinary General Meeting of the Company’s Shareholders held at 3 August 2010 decided to record the difference between the fair and the tax value of the contributed properties at 30 September 2009, amounting to €323,987, in a special reserve account.

Notes to the Financial Statements All amounts expressed in € thousand, unless otherwise stated
35
13. Retirement benefit obligations
According to Greek labour law (L.2112/1920, as amended by L.4093/2012), each employee is entitled to a lump sum in the event of termination of the employment contract by the employer or in case of retirement. Such lump sum is based on years of service and final salary. If the employee remains with the Company until his normal retirement, he is entitled to a lump sum equal to 40% of the compensation he would take if dismissed on the same day. The C.L.2190/1920, provides that companies should form a provision relating to all employees of a minimum of which amounts to the liability created on retirement (40% of total liability). The retirement benefit obligations were determined by an actuarial study based on IAS 19. The movement of the liability is analysed as follows:
31.12.2012 31.12.2011 Net liability at the beginning of the period 17 11 Total expense recognised in the statement of comprehensive income 5
6
Net liability recognised in the statement of financial position 22
17
14. Trade and other payables
The analysis of trade and other payables is as follows:
31.12.2012 31.12.2011 Trade payables 54 8 Amounts due to related parties (Note 23) 28 15 Taxes – levies 4,275 4,596 Other payables 561 273
Total 4,918 4,892
Trade and other payables are short term and do not bare interest. Taxes – levies at 31 December 2012 include lease stamp duties of €2,520 (31 December 2011: €2,457) and a provision for the special tax on electrically powered properties (Ε.Ε.Τ.Η.D.Ε.) of L. 4021/2011, of €1,717 (31 December 2011: €2,098).
15. Revenue
From 01.01.2012 To 31.12.2012
From 01.01.2011 To 31.12.2011
Rental income 70,024 68,300
Total 70,024 68,300
The period of leases whereby the Company leases out its investment properties under operating leases is, in most cases, for a minimum 20 years term. Lease rentals are revised annually in accordance with the lease terms by reference to the consumer price index plus a spread up to1%. There were no contingent rental arrangements under the existing operating leases. Rental income is not subject to seasonality.

Notes to the Financial Statements All amounts expressed in € thousand, unless otherwise stated
36
No future non-cancellable leases existed at 31 December 2012 and 2011.
16. Direct property related expenses
Direct property related expenses include the following:
From 01.01.2012 To 31.12.2012
From 01.01.2011 To 31.12.2011
Property taxes 2,204 2,695 Valuation expenses 320 383 Service charges 63 20 Lawyers, notaries and technical advisors fees 30 11 Insurance expenses 25 22 Other expenses 9 6 Repair and maintenance expenses 3 3
Total 2,654 3,140
Property taxes in 2012 and 2011 include Real Estate Tax (FAP). FAP is calculated on the value of the properties owned by the taxpayer at 01.01 each year. FAP of REICs is calculated at 0.1% of the tax (“objective”) value of the properties. Moreover, property taxes include Ε.Ε.Τ.Η.D.Ε. of L. 4021/2011, amounting to €1,723 (2011: €2,208). Direct property related expenses incurred in leased and vacant properties were as follows:
From 01.01.2012 To 31.12.2012
From 01.01.2011 To 31.12.2011
Leased properties 2,514 3,046 Vacant properties 140 94
Total 2,654 3,140
17. Personnel expenses
From 01.01.2012 To 31.12.2012
From 01.01.2011 To 31.12.2011
Wages 406 443 Social security costs 92 94 Retirement benefit obligations expenses 5 6 Other expenses 7 1
Total 510 544
The total number of employees of the Company as at 31 December 2012 was 9 (31 December 2011: 8).
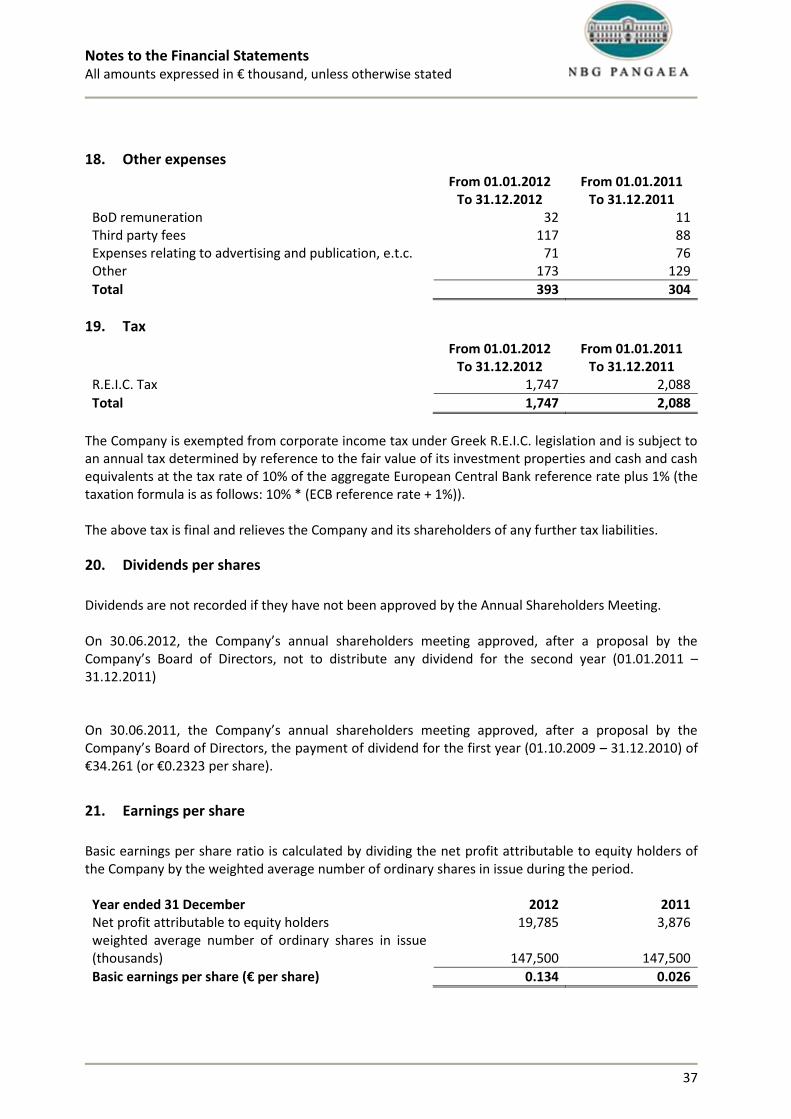
Notes to the Financial Statements All amounts expressed in € thousand, unless otherwise stated
37
18. Other expenses
From 01.01.2012 To 31.12.2012
From 01.01.2011 To 31.12.2011
BoD remuneration 32 11 Third party fees 117 88 Expenses relating to advertising and publication, e.t.c. 71 76 Other 173 129
Total 393 304
19. Tax
From 01.01.2012 To 31.12.2012
From 01.01.2011 To 31.12.2011
R.E.I.C. Tax 1,747 2,088
Total 1,747 2,088
The Company is exempted from corporate income tax under Greek R.E.I.C. legislation and is subject to an annual tax determined by reference to the fair value of its investment properties and cash and cash equivalents at the tax rate of 10% of the aggregate European Central Bank reference rate plus 1% (the taxation formula is as follows: 10% * (ECB reference rate + 1%)). The above tax is final and relieves the Company and its shareholders of any further tax liabilities.
20. Dividends per shares
Dividends are not recorded if they have not been approved by the Annual Shareholders Meeting. On 30.06.2012, the Company’s annual shareholders meeting approved, after a proposal by the Company’s Board of Directors, not to distribute any dividend for the second year (01.01.2011 – 31.12.2011) On 30.06.2011, the Company’s annual shareholders meeting approved, after a proposal by the Company’s Board of Directors, the payment of dividend for the first year (01.10.2009 – 31.12.2010) of €34.261 (or €0.2323 per share).
21. Earnings per share
Basic earnings per share ratio is calculated by dividing the net profit attributable to equity holders of the Company by the weighted average number of ordinary shares in issue during the period.
Year ended 31 December 2012 2011 Net profit attributable to equity holders 19,785 3,876 weighted average number of ordinary shares in issue (thousands) 147,500 147,500
Basic earnings per share (€ per share) 0.134 0.026
Notes to the Financial Statements All amounts expressed in € thousand, unless otherwise stated
38
There were no dilutive potential ordinary shares. Therefore, the dilutive earnings per share is the same as the basic earnings per share for all periods presented.
22. Contingent Liabilities
The Company has not been subject to tax audit for the year ended 31 December 2010. The year 2011 has been audited by the Company’s certified auditors, Deloitte, according to article 82, L.2238/1994 article, and a tax certificate was issued at 19 July 2012. The year 2011 will be considered as tax-settled after 18 months, a period during which the tax authorities can perform a review pursuant to article 6 of POL 1159/22.7.2011. The year 2012 will be audited by the Company’s certified auditors during the first semester of 2013. Management does not believe that any significant additional taxes will be finally assessed by the tax authorities for the open tax years. There are no pending lawsuits against the Company, nor other contingent liabilities resulting from commitments at 31 December 2012, which would affect the Company’s financial position.
23. Related party transactions
The nature of the significant transactions entered into by the Company with related parties during the year ended 31 December 2012 and 2011 and the significant balances outstanding at 31 December 2012 and 2011 are presented below. All transactions with related parties are objective and carried out on normal commercial terms for comparable transactions with third parties.
i. Balances arising from transactions with related parties 31.12.2012 31.12.2011 Trade receivables from related parties Parent company 101 14 EKTENEPOL, a company of NBG Group - 3
101 17
Amounts due to related parties Parent company 11 - Ethniki Hellenic National Insurance Company, a company of NBG Group
17
15
28 15
Cash and cash equivalents
Parent company 165,408 95,828
ii. Rental income
From 01.01.2012
To 31.12.2012 From 01.01.2011
To 31.12.2011 Parent company 69,374 67,429 Other companies of NBG Group1 275 361
Total 69,649 67,790
1 Ethnodata, National Securities, EKTENEPOL, Ethniki Factors, Ethniki Kefalaiou, EthnikiLeasing, National
Insurance Brokers (only for 2012).
Notes to the Financial Statements All amounts expressed in € thousand, unless otherwise stated
39
iii. Insurance expenses
From 01.01.2012
To 31.12.2012 From 01.01.2011
To 31.12.2011 Ethniki Hellenic National Insurance Company, a company of NBG Group 25 23
Total 25 23
iv. Technical inspections expenses (energy performance certificates)
From 01.01.2012
To 31.12.2012 From 01.01.2011
To 31.12.2011 Parent company 9 -
Total 9 -
v. Other expenses
From 01.01.2012
To 31.12.2012 From 01.01.2011
To 31.12.2011 Parent company 4 1 Ethniki Leasing, a company of NBG Group 12 15
Total 16 16
vi. Interest income
From 01.01.2012
To 31.12.2012 From 01.01.2011
To 31.12.2011 Parent company 5,522 3,300
Total 5,522 3,300
vii. Due to key management
31.12.2012 31.12.2011 BoD fees payable - -
Total - -
viii. Key management compensation
From 01.01.2012 To 31.12.2012
From 01.01.2011 To 31.12.2011
BoD compensation 32 11
Total 32 11
ix. Commitment and contingent liabilities

Notes to the Financial Statements All amounts expressed in € thousand, unless otherwise stated
40
There are no commitments and contingent liabilities between the Company and related parties.
24. Independent auditor’s fees
Deloitte Hadjipavlou, Sofianos and Cambanis S.A. has served as the Company’s independent public accountant for the year ended 31 December 2012. The fees for the annual audit for 2012 amounted to €40.5 (2011: €40.5) and the fees for the issuance of the annual tax certificate for 2012 amounted to €9.0 (2011: €10.5).
25. Events after the balance sheet date
Until the date of approval of financial statements no significant events have taken place that affect the financial position of the Company on 31 December 2012.


![Harrisson’s Workshop | Pangaea [estranged]](https://static.fdocuments.net/doc/165x107/6216411096ee9065c65379b6/harrissons-workshop-pangaea-estranged.jpg)


