NBER WORKING PAPER SERIES U.S. COMMERCIAL BANKS …
78
NBER WORKING PAPER SERIES U.S. COMMERCIAL BANKS AND THE DEVELOPING COUNTRY DEBT CRISIS Jeffrey Sachs Harry Huizinga Working Paper No. 2455 NATIONAL BUREAU OF ECONOMIC RESEARCH 1050 Massachusetts Avenue Cambridge, MA 02138 December 1987 The research reported here is part of the NBER's research program in International Studies. Any opinions expressed are those of the authors and not those of the National Bureau of Economic Research. Support from the Ford Foundation, the Tinker Foundation Incorporated, and the Rockefeller Brothers Fund is gratefully acknowledged.
Transcript of NBER WORKING PAPER SERIES U.S. COMMERCIAL BANKS …

NBER WORKING PAPER SERIES
U.S. COMMERCIAL BANKSAND THE DEVELOPINGCOUNTRY DEBT CRISIS
Jeffrey Sachs
Harry Huizinga
Working Paper No. 2455
NATIONAL BUREAU OF ECONOMIC RESEARCH1050 Massachusetts Avenue
Cambridge, MA 02138December 1987
The research reported here is part of the NBER's research program in InternationalStudies. Any opinions expressed are those of the authors and not those of theNational Bureau of Economic Research. Support from the Ford Foundation, the TinkerFoundation Incorporated, and the Rockefeller Brothers Fund is gratefully acknowledged.

NBER Working Paper #2455December 1987
U.S. Coimnercial Banks and the Developing Country Debt Crisis
ABSTRACT
The major theme of this paper is that the commercial banks haveweathered the debt crisis, while many debtor countries remain ineconomic paralysis or worse. There is a growing consensus that much ofthe LDC debt will not be fully serviced in the future, and thatconsensus is reflected in at least two ways: in the discounts observedin the secondary market prices for LDC debt, and in the discounts inthe stock market pricing of banks with exposure in the LDCs.
Jeffrey SachsHarry Fluizinga
Department of Economics Department of EconomicsHarvard University Harvard UniversityCambridge, MA 02138 Cambridge. MA 02138

The debt crisis of the less developed countries (LDCs) broke out
in August 1982, with the announcement by Mexico that it would be
unable to meet its debt obligations then falling due. Since then,
more than 40 developing countries have been forced to reschedule their
debts with commercial bank creditors and to seek additional lending
and other forms of relief from the international financial coimnunityJ
From its inception, the debt crisis has been viewed as posing serious
risks to the major U.S. commercial banks, since the exposure of these
banks in the developing countries has significantly exceeded their
total bank capital.
Table 1 shows the exposures of the U.S. banks in the major debtor
countries as of the end of 1986. The exposure is divided by size of
bank (the large money center banks versus the rest of the U.S. banks),
and by type of claim (on the public sector of the LDCs versus private
sector borrowers). Note the high concentration of the claims. The
exposure of the top 9 banks in just the top 4 countries (Argentina,
Brazil, Mexico, and Venezuela) accounts for $41 billion, or 45 percent
of total U.S. exposure in the developing countries shown in the table.
The top 9 banks account for a remarkable 65 percent of total exposure
of U.S. banks in Latin America, Note also that sovereign loans (i.e.
loans to foreign public sector borrowers) account for about two thirds
of U.S. bank lending to the LDCs.2
As described in Sachs (1986) the debt management strategy
pursued by the U.S. and the official financial conirnunity after 1982
1

Table 1. Claims of U.S. banks in the debtor countries.(millions of dollars)
Country lop 9 Banks Remaining Banks Bid Secondary MarketPublic Other Public Other Price Value of All
Public Debt
Argentina 3961 1966 1677 920 47.0 2650Bolivia 41 3 34 18 10.0 8Brazil 10176 5162 3822 3249 55.0 7699Chile 2850 1296 1097 1216 67.0 2644Colombia 968 560 236 384 81.0 975Costa Rica 204 10 169 35 33.0 123Dom. Rep. 286 35 78 28 42.0 153Ecuador 1161 197 712 100 45.0 843Gabon 34 10 3 0 82.0 30Guatemala 28 7 14 30 72.0 30Honduras 84 19 33 38 38.0 44Ivory Coast 217 57 74 17 60.0 175Jamaica 158 13 24 10 37.0 67Liberia 24 493 5 126 5.0 1Malawi 25 12 1 4 74.0 19Mexico 8960 4393 5571 4730 53.0 7701Morocco 405 282 65 140 65.5 308Nicaragua 17 8 41 0 5.0 3
Nigeria 404 263 144 92 28.0 153Panama 261 1116 114 700 64.0 240Peru 86 12 808 438 11.0 98Philippines 2611 1092 942 462 67.0 2381Poland 290 73 89 17 43.0 163Romanja 93 22 14 11 87.0 93Senegal 20 2 6 0 61.0 16Sudan 31 6 1 1 2.0 1
Uruguay 653 45 162 69 68.0 554Venezuela 4206 2301 1355 1250 67.0 3726Yugoslavia 965 350 413 337 70.0 965Zaire 8 4 1 0 24.5 2Zambia 69 4 2 2 18.0 13
Total 39296 19813 17707 14424 31879
% of Capital 84 42 26 21 28
Sources: Country Exposure Lending Survey, Federal FinancialInstitutions Council, April 1987;Indicative Prices for Less Developed Country Bank Loans,July 27, 1987, Salomon Brothers.

has been geared towards the protection of the large commercial banks,
at least on a short-mn accounting basis. The weight of U.S. foreign
policy has been to maintain current interest servicing by the debtor
countries to the U.S. banks, and to avoid any explicit debt
forgiveness or even capitalization of interest payments.3 U.S.
regulators have also taken an easy line in applying prudential
standards to banks with large LDC exposures. The banks have been
allowed to carry almost all of their LDC exposure on the books at face
value, and they have been able to count as current income all the
interest payments they receive on the loans, even when the interest
payments are made possible only by new "involtintary" loans to the
debtor country.
By acting as if all is normal regarding the bulk of LDC loans,
the regulators have hoped to accomplish three things: to keep thedebtor countries from halting interest payments or promoting
alternative proposals for debt forgiveness; to keep the banks from
withdrawing precipitously from the debtor countries; and to keep
depositors and other creditors of the banks from withdrawing
precipitously from the banks. In a limited sense this strategy has
worked. Worst-case scenarios of financial panic have been avoided,
and the banks have been given time to increase their capital ratios,
U.S. bank exposure in the problem debtor countries as a percent of the
book value of primary capital has declined significantly since 1982,
as shown in Table 2.
At a deeper level, however, the regulatory treatment has not
hidden certain economic truths from debtors, the banks, or the
2
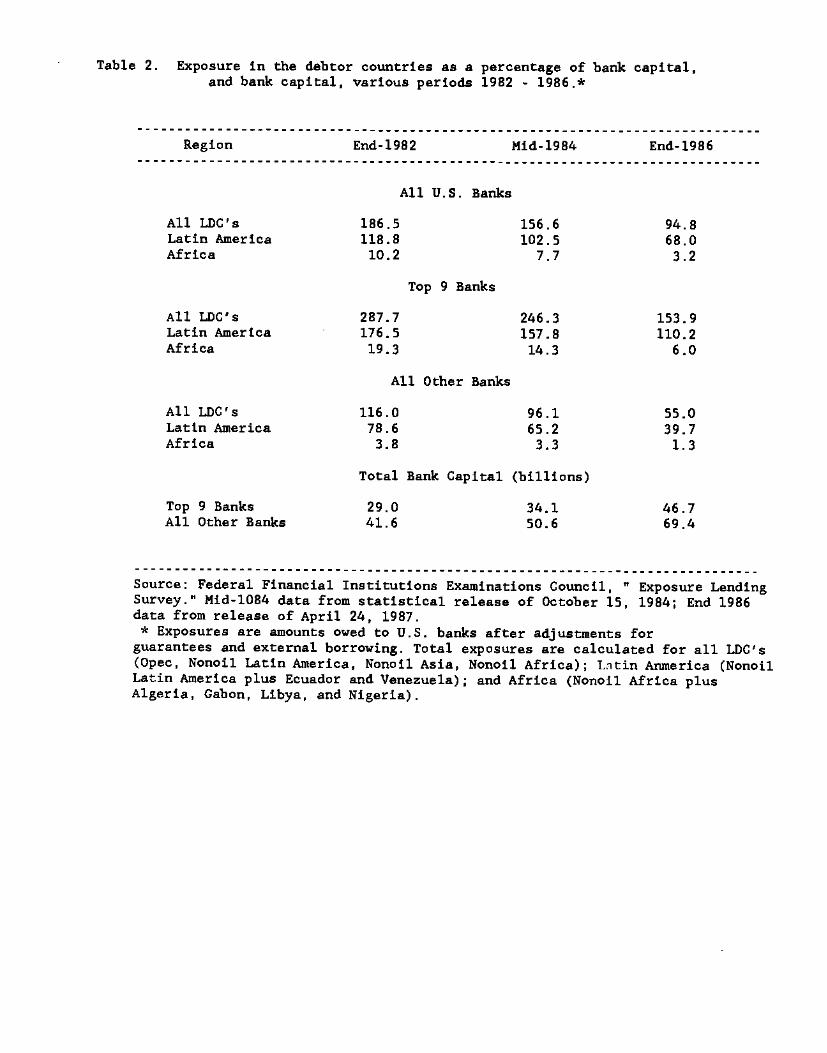
Table 2. Exposure in the debtor countries as a percentage of bank capital,and bank capital, various periods 1982 - 1986.*
Region End-1982 Mid-1984 End-1986
All U.S. Banks
All LDC's 186.5 156.6 94.8Latin America 118.8 102.5 68.0Africa 10.2 7.7 3.2
Top 9 Banks
All LDC's 287.7 246.3 153.9Latin Anerica 176.5 157.8 110.2Africa 19.3 14.3 6.0
All Other Banks
All LDC's 116.0 96.1 55.0Latin America 78.6 65.2 39.7Africa 3.8 3.3 1.3
Total Bank Capital (billions)
Top 9 Banks 29.0 34.1 46.7All Other Banks 41.6 50.6 69.4
Source: Federal Financial Institutions Examinations Council Exposure LendingSurvey.' Mid-i.084 data from statistical release of October 15, 1984; End 1986data from release of April 24, 1987.* Exposures are amounts owed to U.S. banks after adjustments forguarantees and external borrowing. Total exposures are calculated for all LDC's(Opec, Nonoil Latin America, Nonoil Asia, Nonoil Africa); Lntin Anmerica (NonoilLatin America plus Ecuador and Venezuela); and Africa (Nonoil Africa plusAlgeria, Cabon, Libya, and Nigeria).

marketplace more generally. Despite the official optimism of the U.S.
and the creditor community regarding the debt crisis, and the
seemingly relaxed attitudes of the U.S. regulators, most market
participants have conceeded that much of the LDC debt will not be
fully serviced on market terms In the longer term. Moreover, the
regulatory laxness may have had deleterious effects on the adjustment
of the U.S. banks to the crisis, by allowing the banks to move slowlyin the process of rebuilding their capital base. Some banks have been
allowed tb pay unduly large dividends at the expense of their capital
in recent years, since they have been allowed to overstate their
economic incomes.
A good indicator of long-term expectations regarding LDC claims
is the price of those claims on the secondary market. Column 5 of
Table 1 records the secondary bid price for a $100 claim, as of July
1987. The price for claims on the major debtors, Argentina, Brazil
and Mexico, is in the range of $45-55. The weighted average price for
the entire U.S. bank portfolio weighting by exposure in the various
countries, is $55.9 per $100 claim. (Specifically, the $ 57.0
billion of U.S. bank exposure in Table 1 had a secondary market value
of $ 31.9 billion).4
A major theme of this paper is that the stock market prices of
the commercial banks also reflect the secondary-market valuation of
the LDC exposure. Specifically, since the stock market values the
commercial banks according to the value of the underlying portfolios
of the banks, equity prices of banks have weakened in line with the
growing pessimism over the value of the LDC claims.5 This is an
3

important finding since many bankers and U.S. Administration officials
have argued erroneously that the secondary market price of LDC debt is
a poor guide to more general market sentiments concerning the LOC
debt. In fact, the secondary market prices of the debt and the
implicit stock market valuations of the debt are closely in line as of
mid-1987.
The fact that stock market prices have been discounted helps to
explain the current eagerness of banks to sell their LDC exposures at
a discount, since the banks can accept a capital loss in the books
without further depressing the market value of the bank. It appears
that Citicorp's decision this past spring to increase its loan loss
reserves against Latin Anerican exposure (an action that was followed
by the other major banks in the U.S. and abroad) is a prelude to a
policy of selling off the LDC exposure at a significant discount. As
we discuss later, this new policy of selling off debt may have
important implications for public policy in this area.
We organize our discussion in the following manner. The next
section of the paper briefly considers some of the underlying causes
for the growing market discount on the LDC debt. Then, we turn to an
analysis of how the banks and regulators have responded to the crisis
since 1982. Next we examine the effects of the crisis on the market
valuation of the commercial banks, showing the clear evidence that the
stock market is now valuing the LDC debt at the substantial discounts
reflected in the secondary market. In the final section, we explore
some of the implications of the market discount for the future of debt
negotiations and for various debt relief proposals.
4

Why the LDC Debt Sells at a Discount
Many of the shortcomings of the current debt management strategy
were outlined in Sachs (1986). It was pointed out in that study that
most of the optimistic assessments of the debt crisis ignored the
internal economic dislocations caused by the Large debt overhang.
Most optimistic observers such as William dine, have viewed the
problem for the debtor countries purely in terms of various external
parameters: OECD growth, world interest rates, and global commodities
prices. They have failed to factor in the economic and political
disarray within the debtor countries that has resulted from, or has at
least been greatly aggravated by, the debt crisis: low rates of
national savings and investment, large budget deficits, recourse to
inflationary finance
Most of the debtor countries have little prospect of servicing a
large proportion of the interest due on their external debt in the
next few years. In the past five years, the debtor countries have
made significant net resource transfers to the creditors (in Latin
Anerica, amounting to about 5 percent of CNP per year). &it as we see
in Table 3, these transfers have not been enough to prevent a rise in
the debt-export ratios of the major debtor countries, not the fall
that was predicted in influential studies in 1983 and 1984 by dUne
and DeVries.
Recently, some primary corodity prices have increased
significantly, apparently in a lagged response to the depreciation of
the dollar, giving hope that the export prospects of the LDCs will
5

Table 3. External debt-to-export ratio's.
1982 1984 1986 1987P
Argentina 405 461 536 554Brazil 339 322 425 471Chile 333 402 402 370Colombia 191 254 198 235Ecuador 239 259 333 464Mexico 299 292 413 366
Nigeria 84 158 300 310Peru 269 356 497 551
Philippines 269 309 308 309Venezuela 84 158 322 278
Average 264 290 385 385
Note. The debt-to-export ratio is the average gross external debtas a percentage of goods, services, and private transfers.P means projection.Source: Table 6 in "World Financial Markets", June/July 1987 MorganGuaranty Trust Company of New York.

significantly improve. Ironically, however, most of the improvement
in prices has been for non-food primary commodities produced mainly in
the developed countries (e.g. primary metals) or in the developing
countries in Asia, most of which are not in crisis.7 The prices for
the main Latin American commodity exports (for sugar, wheat, beef,
coffee, cocao) continue to be deeply depressed, so that the modest
commodity price recovery has so far given little respite to the
crisis. Moreover, international interest rates have risen
significantly in 1987.
Moreover, many of the major debtor countries are in fiscal
turmoil, even after the sharp cuts in government spending in recent
years. The interest due on the foreign debt constitutes a large
proportion of budgetary expenditures (around 30 percent of government
spending in many of the debtor countries), and stands in the way of
budgetary reform.8 The voters in the new democracies in Latin America
are not content to absorb further austerity for the sake of foreign
creditors. The recent rise in world interest rates will intensify the
pressures. For several years, inflation has been at triple digit
annual rates in Argentina, Brazil, and Peru, and has recently topped
150 per cent annual rate in the spring and summer of 1987 in Mexico.
The 20,000 per cent hyperinflation in Bolivia was brought under
control only after Bolivia's complete cessation of interest payments
on the external bank debt.
One result of the internal economic disarray has been a
burgeoning of unilateral actions on the debt, particularly in the
democratic countries in Latin Anerica. Bolivia, Brazil, Costa Rica,
6

the Dominican Republic, Ecuador Honduras, and Peru have all
unilaterally suspended part or all of the interest servicing on their
foreign debt in the past two years. In the two major debtor countries
that have not suspended (Argentina and Mexico), the banks have found
it necessary in 1987 to relend almost all of the interest due in order
to forestall a unilateral suspension of payments. Mexico received
approximately $6 billion in bank credits and Argentina recently signed
an agreement for $2 billion in new bank credits.9
Three other large debtors, Chile, the Philippines, and Venezuela
have been servicing their debts recently without substantial
refinancing of interest. Chile, of course, is not so much a model
debtor country as a model authoritarian country: the government can
indeed impose the requisite domestic austerity to make it possible to
service the debt)° In the Philippines, the government was fearful of
tough negotiations because of the internal instability of the Aquino
government.11 The Aquino government therefore signed a rescheduling
agreement in 1987 with no concerted lending from the banks. There is
now a good chance that a unilateral partial suspension of debt
servicing will be declared by the Philippine Congress. In Venezuela
as well, the government is under fierce political pressure to abandon
its recent debt rescheduling agreement. Even the government's own
political party has called for a reopening of negotiations with a view
towards achieving debt relief.
In the cases where debt agreements have been reached in the past
year, the tens for the banks on aspects other than new lending have
also worsened. In the first round of reschedulings (1983), debt was
7

recontracted with an interest rate spread of about 2 percentage points
over LIBOR (the London Interbank Offered Rate). In the second round
of reschedulings (1984-85), the spreads were reduced to about 1..2
percentage points. In the recent round of reschedulings, the spreads
have fallen further, to less than one percentage point. Similarly,
commissions have declined, and the maturities and grace periods on the
rescheduled debts have also increased.12
It is thus not difficult to understand the growing discount on
LDC paper in the secondary market. The economies in most cases are
not getting better, and the countries are increasingly demanding more
concessional terms in reflection of that reality. Many are simply
taking unilateral actions in response to their deepening continuing
crisis. Moreover, the international macroeconomics environment,
particularly regarding interest rates and comnodities prices, remains
unsatisfactory. Price quotations on the secondary market have only
been available on a detailed basis for the past year (several
investment banks now circulate price sheets), but all indications
suggest that the discount has been growing, i.e. the prices falling,
over the past few years, as shown by the data in Table 4.
On a cross-country basis, the magnitude of the discount on the
LDC debt seems to be well explained by four variables: the debt-GNP
ratio, denoted D/GNP (the debt-export ratio works about as well); the
rate of real CNP growth. GNPCROt4TH; a dummy variable SUSP indicating
whether the country has unilaterally suspended debt service payments;
and a dummy variable (Ama) indicating whether 13.5. bank regulators
have mandated an allocated reserve (i.e. a writedown) for the
8

Table 4. Secondary market prices for LDC debt (per $100).
November 1985 August 1986 Apr11 1987 July 1987 October 1987
Argentina na. 66 60 47 34Brazil 75-83 76 63 55 38Mexico 78-82 56 59 53 47Peru 32-36 n.a. 17 11 5
Ecuador na. 65 56 45 30
Sources; November 1985, Economist Magazine (11/16/85);August L986, Euromoney1987, Salomon Brothers, Inc.," Indicative Prices for LessDeveloped Country Bank Loans," (6/20/87, 7/27/87, and 10/6/87),bid prices.

country's assets on the books of the U.S. banks. The following simple
regression model does well in accounting for the secondary market
prices as of July 1987:
Price — 77.2 - 9.6 ATRR - 17.2 SUS? - .15 D/GNP + 2.2 GNPGROWTH
(1.6.3) (1.2) (6.3) (2.7) (2.2)
— 0.84
28 observations
(The variable SUSP is a dummy variable equalling 1 if the country
suspended interest payments in 1987, and 2 if the country suspended
interest payments prior to 1987 and is still in suspension.)
According to the equation, a claim on a debt-free LDC with 6 percent
annual growth would command a secondary market price of $90.4 (— $77.2
+ 6 x 2.2). On the other hand, a country like Bolivia with a D/CNP
ratio of 136.8, a per capita GNP growth of -4.5 per year, a required
writeoff for U.S. banks (ATRR—1), and more than two years in debt
suspension (SUSP — 2), has a predicted price of $3.7 (— $77.2 - 9.6 -
17.2 x 2 - .15 x 136.8 - 2.2 x 4.5), compared with an actual price of
$10.
A key problem with interpreting the secondary market prices
involves the role of SUSP. Ott its face, the pricing equation suggests
that a country can manipulate the secondary market price of its debt
by suspending debt servicing. To the extent that debt service reliefis then tied to the secondary market price of debt, as in some of the
9

relief proposals discussed later, there might be the moral hazard
problem of countries unilaterally suspending debt payments as astrategic maneuver to benefit from relief. The moral hazard argument
is overdrawn, however, to the extent that SUSP is oroxyina for other
country characteristics that make debt servicing particularly
difficult for that country: political instability, adverse export
structure, financial collapse, etc. In that case, SUSP is simply
another indicator of "ability to pay' rather than an manipulable
strategic variable.
Patterns of Debt Management by the Banks and Bank Regulators
In this section1 we consider the response of the commercial banks
and banic regulators to the crisis since 1982. The key facts about
this response are well known. The banks have virtually stopped
making new loans to the problem debtor countries, with the little
lending that remains taking place in the context of specific bailout
packages. During this period of little lending, the banks increased
their primary capital base, and thereby reduced the ratio of LDC
exposure to capital.
In our summary of bank behavior, we focus on three variables:
changes in bank exposure in the LDCs, bank earnings, and changes in
the capital base of the banks.
Bank Exposure in the LDCs
The change in bank lending behavior is shown in Table 5. U.S.
bank exposure to the problem debtor countries fell in absolute dollar
10

Table 5. Growth rates of bank lending 1979 - 1986.
Percentage change in Percentage change inexposure 1979-1.982 exposure 1.982-1986
Total Public Other Total Public Other
Argentina 71 165 41 4 84 -44Bolivia -31 -8 -54 -75 -70 -84Brazil 50 78 38 10 92 -36Chile 147 17 226 6 267 -50Colombia 47 83 35 -33 19 -57Costa Rica -1.2 27 -35 -1.6 42 -81Dam. Rep. 33 10 65 -15 49 -75Ecuador 29 22 33 7 147 -77Gabon -33 -35 2 -72 -76 -30Guatemala - -47 57 -54 -60 27 75Honduras -34 30 -57 -9 17 -38Ivory Coast 46 42 63 -43 -41 -50Jamaica 11 8 19 -22 -05 -68Liberia -16 -43 -15 -67 -55 -67Malawi -20 -41 46 -54 -49 -61Mexico 113 131 102 -3 50 -38Morocco 15 -23 121 18 27 9Nicaragua -2 70 -76 -84 -84 -84Nigeria 149 54 501 -51 -39 -63Panama 31 485 24 -61 -3 -65Peru 82 27 139 -47 -2 -72Philippines 43 99 18 -11 45 -53Poland -18 13 -33 -69 -44 -89Romania -31 -28 -34 -50 -15 -79
Senegal -1 -35 251 -62 -38 -94Sudan 8 28 -56 -82 -83 -67
Uruguay 230 492 65 1 28 -59Venezuela 34 28 38 -21 15 -47Yugoslavia -71 -85 -64 -11 250 -64Zaire -39 -37 -73 -91 -94 21Zambia 25 -11 231 -60 -39 -92
Weighted Average 42 52 36 -12 53 -48
Sources: Country Exposure Lending Survey, Federal FinancialExamination Council, various issues.

amount during the period 1982-86, after rising rapidly during the
period 1979-82. The absolute decline in lending belies one of the
myths of the management of the crisis, that the banks have continued
to provide net "new money" to the debtor countries though at a reduced
rate of increase. (Remember that the widely publicized negotiated
loan agreements are termed "new money" packages).
The common perception that the banks have continued to lend to
the LDCs on a net basis can best be explained by looking at a
breakdown of the bank loans between public sector borrowers and
private sector borrowers in the LDCs. Claims on the public sector
have risen by 53 percent during 1982-1986, while claims on the private
sector have decline by 48 percent. This difference reflects the fact
that the widely publicized concerted lending agreements in recent
years have been loans to governments. But at the same time that the
banks have been providing "new money' to governments, they have been
withdrawing loans from the private sector.
Three other factors can also account for the differential growth
in claims on the public and private sectors. To some extent, private
sector debts have become public sector debts as governments have taken
over some of the foreign obligations of the private sector since the
beginning of the debt crisis. Secondly, the decline in exposures to
the private sector represents, in part, a writeoff of claims on the
private sector, rather than an amortization of loans. Third, declines
in exposure also reflect sales by the banks of their LOC claims, or
declines due to debt-equity swaps. Given the published data it is
impossible to distinguish changes in exposure due to new loans,
11

amortizations, writeoffs, sales, swaps, or public-sector assumptions
of private sector debt.
We should stress that the notion of "new money" is also
misleading when account is taken of the fact that most "new money"
packages after 1982 have involved considerably less in new loans than
is due to the same creditors in interest. Thus, even when Mexico or
Argentina gets a "new loan" after months of hair-raising negotiations,
the check is still written the debtor governments to the commercial
banks, rather than in the other direction. Technically, the net
resource transfer (equal to new lending net of amortizations and
interest payments) to the countries is negative. The fact of negative
net resource transfers points up one of the fallacies in a popular
argument as to why debtor countries should not default. It is
sometimes said that if a country defaults, it will be not be able to
attract new bank money. This is obviously not a major concern to a
debtor country if the reduction in interest payments achieved by
default systematically exceeds the amounts of new money that the
country is able to borrow by not defaulting I
The pattern of concerted lending packages among the debtor
governments also highlights Keynes' famous adage that "If you owe your
bank 100 pounds, you're in trouble, if you owe your bank 1,000,000
pounds than he's in trouble". Very systematically, it is the countries
with lar2e debts that have been able to bargain for new lending from
the banks. This is evident from the data in Table 6. For each country,
we measure the size of concerted loans in year t (CL) as a proportion
of disbursed debt at the end of year t-l, Dtl. On average, the ratio
12

Table 6. Medium-term concerted lending as a percentage of debtoutstanding and disbursed fron financial markets.
Average1983 1984 1985 1986 1983 1986
Argentina* 12 18 0 0 8Bolivia 0 0 0 0 0Brazil 1.1. 14 0 0 6
Chile 35 16 9 0 15Colombia 0 0 29 0 7
Congo 0 0 0 9 2
CostaRica 0 0 0 0 0
Dom. Rep. 0 0 0 0 0
Ecuador 20 0 0 0 5
Gabon 0 0 0 0 0Guatemala 0 0 0 0 0Honduras 0 0 0 0 0
Ivory Coast 0 0 4 0 1
Jamaica 0 0 0 0 0Liberia 0 0 0 0 0
Madagascar 0 0 0 0 0Malawi 0 0 0 0 0Mexico 11 6 0 8 4Morocco 0 0 0 0 0
Nicaragua 0 0 0 0 0
Nigeria 0 0 0 4 1Panama 0 0 3 0 1Peru 16 0 0 0 4
Philipines 0 18 0 0 5
Senegal 0 0 0 0 0
Sudan 0 0 0 0 0
Togo 0 0 0 0 0
Uruguay 18 0 0 0 5
Venezuela 0 0 0 0 0
Yugoslavia 41 0 0 0 10Zaire 0 0 0 0 0
Zambia 0 0 0 0 0
For each year, we calculate the ratio of the concerted loan CLt,to the disbursed debt at t-l, Dt-l.* In 1987 Argentina received a concerted loan amounting to 6 percent of its 1986 outstanding loans.Sources: World Debt Tables, 1986-1987 Edition, World Bank;
International Capital Markets, 1986, IMF;

CL/Di is far higher for the large debtors (Argentina, Brazil,
Chile, Mexico) than for the rest. Venezuela is a significant exception
to this rule, since the current Venezuelan administration has,
curiously, never tried to bargain for new money. To summarize the data
in Table 6, the fifteen small debtor countries in the table had 3.4
percent of the debt at the end of 1983, but have received only 0.3 per
cent of the concerted loans during 1984-1986.
Bank Earnings
Ironically, during 1982-86 the debt crisis did not have a
serious adverse effect on the reported current earnin2s of the banks,
even though it fundamentally called into question the very solvency of
the banks. While doubts grew about the long-term willingness of the
debtor countries to service their debts, and while principal
repayments were postponed for many years in the course of
reschedulings, most of the LDCs continued to service the interest due,
though sometimes only after the banks loaned the countries much of the
money needed to make the interest payments. Even when interest
payments were clearly tied to new loans, the bank regulators allowed
the banks to report the interest received in full as current income
(rather than, for example, requiring that part of the interest be
allocated to loan loss reserves, and therefore not be counted as
current income)
The reported net income for the top nine banks is shown in Table
7. We see that reported income rose for most of the major banks, with
the conspicuous exception of Bank of Arerica, which suffered major
13

Table 7. Reported net income for 10 large banks (millions).
80 81 82 83 84 85 86 87 (projected)
Citicorp 449 531 723 860 890 998 1058 -999BanicAinerica 643 445 390 391 346 337 -518 -929Chase Manhattan 354 412 308 430 406 565 585 -832Manufacturer's H. 229 252 295 337 353 408 411 -1103J.P. Morgan 342 348 394 460 538 705 873 952Chemical NY 174 205 241 301 341 390 402 -703
Security Pacific 181 206 234 264 291 323 386 112First Interstate 225 236 221 247 276 313 338 -165Bankers Trust 214 188 223 260 307 371 428 -151
First Chicago 63 119 137 184 86 169 276 -438
Sources: Company Annual Reports; Compustat; Keefe Bankscan, July 17, 1987,Keefe, Bruyette & Woods, Inc.

losses on its domestic loan portfolio. In some cases the measured
income was even enhanced by the crisis, since in 1983 and 1984 many of
the rescheduling agreements involved significant front-end fees and an
increase in the interest rate spreads built into the loan agreements.
Table 8 shows the share of DC assets that were on a nonaccrual basis
as of the end of 1986.13 Note that this ratio is only slightly higher
than the ratio of domestic loans on a nonaccruaj. basis.
In assessing the effects of the debt crisis on measured earnings,
a distinction must be drawn between the bank claims on the public
sectors and the private sectors in the LDCs. For the sovereign loans,
the vast bulk of interest due has been paid on a timely basis. Among
the major debtors prior to 1987, only Argentina fell behind on
interest payments on sovereign debt, in 1984 and early 1985. In 1987,
Brazilian sovereign debt has been in suspension since February 20. As
for private debt, all of the major debtors except for Brazil (i.e.
Argentina, Mexico and Venezuela) have had periods of fairly
significant arrearages on private debt, though by the end of 1986 most
of those arrearages had been eliminated. Also, an unknown proportion
of the private debt has been lost forever in the form of firm-level
bankruptcies, or in debt workouts with the creditors at significantly
concessionary rates.
Only in 1987 have the income statements of the banks begun to
suffer, as some of the larger debtors (especially Brazil) have
suspended interest payments, and more importantly, as significant
additions to loan loss reserves have been made. Because of loan loss
provisions, the large U.S. banks posted losses of about $10 billion in
14

Table 8. Percentage of exposure to Argentina, Chile, Mexico and Venezuelaon nonaccrual and percentage of other assets on nonaccrual
for 10 large U.S. banks, end of 1986.
percentage of percentage of otherLatin exposure on assets onnonaccrual nonaccrual
Citicorp 3.8 1.6BankAmerica 6.1 3.6Chase Manhattan 3.0 2.0Manufacturer's H. 0.8 3.0J.P. Morgan 1.8 0.8Chemical 1.3 2.3
Security Pacific 1.6 1.9First Interstate 4.4 1.7Bankers Trust 3.5 1.5
First Chicago 2.4 2.1
Unweighted Average 2.9 2.0
Source: Review of Bankperformance, 1987 Edition, Salonion Brothers.Note. This table has been corrected during revision of the paper.

the second quarter of 1987.
It is useful, here to make clear the meaning of the recent
provisioning by Citicorp and the other leading banks. Table 9 shows
the size of provisions taken, and the share of Latin American exposure
that is now 'covered" by the the loan loss reserves. This share is
calculated by taking the banks' total loan loss reserves, and
subtracting off all domestic nonperforning assets. The net reserves
are then compared with the exposure in Latin America. Citicorp's
stated goal was to cover 25 percent of its Latin American exposure.
Since the provisions are "unallocated" (i.e. not tied to
particular loans, or even to particular countries), they do not
involve a writedown in value of particular assets. (A fortiori, they
do not involve any forgiveness by the banks of any part of the debts
owed by the developing countriest). The increase in provisions
reduces reported income of the banks1 but it does not reduce taxable
income, since taxable income is not reduced by a general, unallocated
provision. On the balance sheet, the increased provisioning is a
transfer from shareholder's equity to loan loss reserves. As pointed
out below, this shift does not affect measured primary capital of the
bank.
The provisioning does not affect the cash flow of the banks. In
that sense it is a cosmetic move only. In the future, if the banks
write off some portion of their LDC exposure (e.g. by selling the
assets at a discount, or by settling with the countries at below
market terms), they will be able to charge the losses to the loan
reserves without any effect on reported income at the future date. At
15

Table 9. Loan loss reserves net of domestic non-performing assets,and as a percentage of outstandings to Argentina Brazil
Mexico and Venezuela for 9 large U.S. banks.
Loan loss Loan loss Domestic Net loan loss Net reserve as areserve reserve non- loss percentage ofend-1986 addition, performing reserve exposure(millions) 1987 assets (millions) to latin four
(millions) (millions) (4)—(1) (2) (3) (1)+(2)-(3)
Citicorp 1698 3000 2022 2676 27BankAmerica 2172 1100 3148 124 2Chase Manhattan 1065 1600 980 1685 26Manufacturer's H. 1008 1700 1761 947 143.?. Morgan 910 0 316 594 14Chemical 669 1100 1015 754 18Security Pacific 729 500 1132 97 7First Interstate 536 750 1238 48 4Bankers Trust 591 700 526 765 28
average 1042 1161 1349 854 16
Note. Data on loan loss reserves are updated through July 2, 1987,all other data are for end 1986.
Sources: New York Times, July 2, 1987; Review of Bankperformance,1987 Edition, Salomon Brothers.

that point the capital base of the bank would shrink, and the taxable
earnings of the bank would fall in line with the writeoff. Thus, by
accepting large reported losses now, the banks will be better placed
to report positive earnings in the future, even if the LDC loans go
sour.
Capital Adequacy
Even before the debt crisis hit, U.S. bank regulators had judged
that the capital-asset ratios of U.S. banks were insufficient. New
regulations promulgated in the early l980s called for a rise in the
ratio of primary capital to total assets, from the prevailing low
levels of about 4 percent to levels of 5.5 percent. Total capital
(equal to primary capital plus certain types of qualifying
subordinated debt) was required to rise to 6.0 percent of total bank
assets.
A vast literature on banking regulation has stressed the need for
such prudential limits.14 Banks are highly leveraged institutions,
giving rise to the possibility of large fluctuations in net worth, and
also to various incentive problems. A small change in the average
value of the bank's assets can dramatically reduce the net worth of
the bank, and even drive the bank into bankruptcy.'5 Moreover since
banks are operating with borrowed funds, and since most of those funds
are insured by federal deposit insurance, bank managers may have the
incentive to take excessive risks if bank capital is too low a share
of total assets. If the net worth of the bank is low relative to the
16

total assets of the bank, then the bank managers (on behalf of the
shareholders) have the incentive to take large gambles with borrowed
funds. If the gamble goes well, the shareholders enjoy an enormous
proportional return to their assets. If the gamble goes poorly, the
shareholders lose only the small, amount of the net worth, and the
deposit insurance institution must make up the difference to the
depositors.
Another aspect of prudential supervision, one that was obviously
overlooked in the 1970s and early l9BOs, is the requirement that the
bank not commit more than 15 percent of bank capital in loans to any
borrower. In fact, the loans to the Brazilian government and to the
Mexican government greatly exceeded 15 percent of capital for many of
the large U.S. banks, but the rule was not invoked since the
regulators allowed the banks to treat the various official borrowers
(e.g. parastatals, central government, development banks, etc.) in
Mexico and Brazil as distinct borrowers even though all of the
institutions were backed by the same government guarantee16. In the
event, all of the Loans to the various official borrowers in each of
the countries went bad at the same time. Moreover, repayments on
private-sector debts were generally suspended at the same time as
repayments on the debts of official borrowers, and a considerable
amount of private-sector debt was taken over by the public sector
(often on the behest of the commercial banks).
On paper, the capital adequacy rules have been enfnrrrd. and the
capital base of the U.S. banks has been strengthened. But at least
some of this is due to accounting convention rather than to an actual
17

strengthening of bank balance sheets. For bank capital to protect the
bank from bankruptcy and to forestall, adverse incentive problems, the
bank capital should consist mostly of shareholder's equity, and it
should be properly valued. In fact, the measure of primary capital
used for capital adequacy requirements includes both equity and loan
loss reserves. Thus, even when the banks make loan loss provisions
because they anticipate future losses on assets measured primary
capital is unaffected, because the loan loss provision involves a
transfer between shareholders equity and loan loss reserves, both of
which are fully counted in primary capital. Moreover, since the LDC
claims are carried in the books at full face value, and until recently
were not covered by loan loss provisions, the book values of
shareholders equity clearly overstated the market value of
shareholders equity on this account,
Thus, the pattern of U.S. banks has been one of rising
capital-asset ratios during 1982-87, as shown in Table 10, but with a
significant decline in the ratio of shareholder's eQuity to assets as
of mid-1987 (Table 11), when the banks made a substantial increase in
loan loss reserves. The conclusion seems to be that the regulators
have not succeeded in raising the ratio of shareholder's equity to
total assets by much at all in the l9BOs. Since the loan loss
reserves on the Latin American claims still cover no more than 25
percent of the Latin exposure, and since the markets are signalling a
discount on the debt of perhaps 45 to 50 percent, it seems clear that
shareholders equity is still overstated on account of the LDC debt,
even after the substantial provisions. The conclusion seems to be
18

Table 10. Primary capital as a percentage of total assets (year end).
80 81 82 83 84 85 86
Citicorp 3.8 4.1 4.2 4.9 5.9 6.2 6.8BankAmerica 4 3.9 4.3 5.1 5.8 6.1 6.9Chase Manhattan 3.8 4.2 4.8 5.4 6.4 6.9 7.0Manufacturer's H. 3.6 3.8 4.6 5 5.7 6.3 7.2
J.P. Morgan 4.7 5.1 5.6 6.9 7 8 8.3Chemical 3.7 4 5 5.5 6.3 7 7.2
Security Pacific 4.9 4.7 4.8 5.3 5.8 6.4 6.4First Interstate 5.1 5.1 5.1 5.8 6.1 6.2 6.1Bankers Trust 3.5 4.1 4.5 5.6 6.2 6.4 6.5
First Chicago 4.7 4.3 4.7 5.6 6.1 7.2 8.3
Average 4.2 4.3 4.8 5.5 6.1 6.7 7.1
Source: Review of Bankperformance, Salomon Brothers, various editions.

Table 11. Shareholders' equity as a percentage of total assets (year end).
81 82 83 84 85 86 June 87
Citicorp 3.6 3.7 4.3 4.2 4.4 4.6 2.7BankAmerica 3.4 3.7 4.2 4.3 3.8 3.8 3.0Chase Manhattan 3.9 3.9 4.3 4.5 5.0 5.1 3.2Manufacturer's H. 3.2 3.9 4.2 4.3 4.6 5.0 2.7J.P. Morgan 4.5 4.6 5.7 5.7 6.3 6.6 6.2Chemical NY 3.5 4.1 4.5 4.9 4.9 5.1 3.0Security Pacific 4.0 3.9 4.4 4.2 4.5 4.5 3.3First Interstate 4.3 4.4 4.7 4.9 5.1 4.9 3.3Bankers Trust NY 3.9 3.7 4.4 4.6 4.9 4.7 3.4First Chicago 3.7 3.9 4.8 4.8 5.3 5.9
Average 3.8 4.0 4.6 4.6 4.9 5.0 3.5
Sources: New York Times, July 2, 1987; Review of Bankperformance, variousEditions, Salomon Brothers.

that the regulators have not succeeded in raising the ratio of
shareholder's equity to total assets by much at all in the 1980s.
The regulatory laxness, i.e. "business as usual" attitude, certainly
contributed to the failure of the banks to make a greater advance in
rebuilding their equity base. It was clear from the beginning of the
debt crisis that at least some of the interest earnings on the LDC
debt should have been regarded as fictitious, particularly when
leading debtors required new involuntary loans to meet interest
payments on existing debts. Prudent regulators might have required
that the banks build up capital in part by reducing dividend payouts.
This did not in fact occur. The major banks maintained dividend
payout ratios since 1982 as if the debt crisis had not occurred, as is
evident in Table 12. Bank of Anerica was a particularly flagrant case
of this behavior. Even when earnings were falling because of bad
domestic loans, not to mention bad foreign loans, Bank of America
continued to pay significant dividends, leading to a sharp rise in the
ratio of dividends to income, Of course, Bank of Anierica is now
fighting for its survival.
Our conclusion on the slow pace at which the banks have rebuilt
capital must be tempered to the extent that other assets of the banks
are undervalued on the books relative to true market values. Indeed,
we shalt soon see evidence in the next section that the market values
of many of the large banks were at or above their book values as of
the summer of 1987, despite the clear evidence that the market values
of their LDC claims were far below their book values. This suggests
that other assets were being undervalued on the books.
19

Table 12. Dividend pay-out ratio's for ten banks with large LDC exposure.
80 81 82 83 84 85 86
Citicorp 35 37 31 29 32 32 35BankAmerica 33 50 59 70 86 -43a 0
Chase Manhattan 28 27 44 32 41 30 31Manufacturer's 37 37 38 37 45 38 37
S.F. Morgan 35 37 37 36 34 29 27Chemical NY 31 29 34 34 36 34 34Bankers Trust 20 28 33 33 32 30 28
Wells Fargo 36 36 28 29 38 29 28Marine Midland 23 26 37 36 36 32 31
Irving Bank 28 28 27 27 27 26 26
Average 31 33 37 36 41 Sib 28
a. BankAnerica paid a dividend of $1.16 per common share despite lossesof $2.68 per share.
b. Excluding BankAmerica.Source: Review of Bankperformance, Salomon Brothers, various editions.

We have attempted to create an equity-asset ratio based solely on
market values rather than book values, by calculating the market value
of overall assets of the bank as equal to the market value of overall
assets of the bank as equal to the market value of bank equity plus
the book value of bank liabilities (we assume that the bank's
liabilities, which are mostly short-term fixed-income liabilities,
have a market value equal to book value). We then take the ratio of
the market value of equity to the (constructed) market value of
assets. We found that on average for the large 10 banks, the ratio of
equity (at market value) to assets rose from 3.2 percent in 1983, and
3.6 per cent in 1984, to 5.5 percent in June 1987, suggesting some
real increase in capital adequacy. On the other hand, the sharp
decline in the stock market in October 1987, after the completion of
this analysis, has probably pushed the market-based ratio of equity to
assets back down sharply, close to the levels of 1984.
There would be one important practical implication for LDC debt
if the banks' non-LDC claims are carried on the books at below market
value. As the losses on the LDC assets are realized, e.g. by sales of
debt in the secondary market, the banks will be able to cushion the
effect on their overall capital by selling off other assets that are
undervalued on the books, and taking the capital gains. Citicorp has
begun to adopt this strategy in the Fall of 1987, by selling a part of
its real estate equity at a significant capital gain, in order to
offset the reported losses on its LDC portfolio.
Pending Regulatory Decisions
20

Two important regulatory matters are now pending. The first, and
specific matter, is the question of future accounting treatment of the
Brazilian debt. The federal bank regulators can require the banks to
make allocated provisions for loans to foreign governments under the
system of Allocated Reserve Transfer Risks (ATRRs) established in the
1983 International Lending Supervision Act. In this system, an
inter-agency committee of the Federal Reserve Board, the Federal
Deposit Insurance Corporation, and the Comptroller of the Currency,
can declare the loan to a country to be value-impaired, and c mpel a
writedown of the assets (technically, an allocated reserve is
created). Generally1 for loans to be declared value impaired they
must meet more than one of four conditions: (1) interest is more than
180 days overdue; (2) the country has no IMF program and no prospect
of negotiating one; (3) the country has not met its rescheduling terms
for a year; and (4) the country does not exhibit any definite prospect
for an orderly restoration of debt servicing in the near futurej7 The
final decision is at the discretion of the bank regulators.
Typically, the required writeoff is 10 percent in the first year, and
15 percent in the second year and each succeeding year that the loans
are deemed to be value impaired. The ATRR has so far been applied
only to a few smaller debtor countries, specifically Bolivia,
Nicaragua, Peru, Poland, Sudan, and Zaire.
In the case of Brazil, the suspension of interest payments on the
sovereign debt was announced on February 20, 1987. On April 2,
somewhat less than sixty days after the suspension, several banks
21

announced that they were placing Brazilian loans on a nonaccrual
basis. As of August 20, 1987, the loans were in suspension of
interest for 180 days. The interagency taskforce is scheduled to meet
on October 26, 1987, to decide whether the Brazilian debt should be
declared value impaired. This will be a discretionary decision. An
partial payment of interest by Brazil before October 26, for instance,
may be enough to forestall a declaration that the loan is "value
impaired".
The second, a much more general matter is the question of future
capital adequacy regulations. The Federal Reserve Board and the Bank
of England have recently agreed to attempt to harmonize their
accounting treatment for the supervision of capital adequacy. The
details of the agreement have not been fully worked out, and are in
any event not yet public. It is presumed, however, that the new
system will involve a weighting of assets by quality in order to
arrive at a more refined measure of the capital of the bank.
There are several areas in which existing accounting practices
differ markedly in the two countries. Presently, for instance, the
Bank of England requires that provisions of U.K. banks against LDC
debts must be allocated by country. The provisions are charged
against the capital base of the bank, and also may be charged against
current income for tax purposes. Recently, moreover, the Bank of
England has instituted a scoring system by which the U.K. banks must
evaluate their risks on all LDC loans, and thereby decide upon reserve
levels.
22

Latin American exposure and the market valuation of commercial banks
The regulators and accounts have so far operated on the
presumption that claims on the LDCs are worth their full face value,
despite the overwhelming evidence to the contrary. In this section we
investigate whether the stock markets have seen through the accounting
veil, and written down the value of banks with heavy exposures in the
problem debtor countries. The evidence suggests that a significant
writedown has in fact occurred, though its precise magnitude is open
to some question.
One of the problems in getting a precise estimate of the stock
market valuation of the LDC claims is that of limited data: banks are
only required to report exposures in the LDCs when total loans to a
country exceed 1 percent of total assets. Therefore, while we know
quite a bit about the exposures of individual banks in Argentina.
Brazil, Mexico, and Venezuela, (hereafter ABMV) we know very little
about the holdings by individual banks of claims on the other problem
countries (which account for about 30 percent of exposure as shown in
the data in Table 1).
An initial look at bank share prices supports the view that the
markets have reacted to the bad news of recent years. Table 13
shows a comparison of ten banks with the heaviest recorded exposure in
ABVM (relative to book value of shareholder's equity) to ten banks
with no exposure. For the heavily exposed banks, the average exposure
is 130 percent of book value. At the end of 1986, these banks had an
average ratio of their stock market value to their book value of 1.0,
23

Table 13. A Comparison of Banks with Large versusNo Exposure in Latin America.
Bank EXP/BV MV/BV P/E E/BV DIV/E
Large Exposure
Citicorp 1.2 1.1 6.6 0.12 0.38BankAinerica 1.7 0.5 5.4 -0.17 0
Chase Manhattan 1.4 0.8 5.1 0.12 0.33Manufacturer's H. 1.8 0.6 4.7 0.12 0.37
J.P Morgan 0.9 1.8 9.6 0.17 0.29Chemical NY 1.4 0.8 5.4 0.13 0.37
Wells Fargo 0.7 1.6 9.3 0.14 0.31Marine MidLand 1.1 0.8 6.8 0.11 0.28
Irving Bank Corp. 1.4 0.8 6.1 0.12 0.33
Average 1.3 1.0 6.6 0.10 0.30
No Exposure a/
Midlantic Banks Inc. 0.0 1.6 9.5 0.17 0.27
Michigan National 0.0 1.3 8.5 0.11 0.34Meridian Bancorp. 0.0 1.2 10.0 0.14 0.43
BayBanks 0.0 1.4 9.0 0.13 0.38First Security-Utah 0.0 0.9 13.0 0.01 2.68State Street Boston 0.0 2.7 15.1 0.16 0.22Commerce Bankshares 0.0 1.1 9.2 0.11 0.29Dominion Bankshares 0.0 1.5 9.3 0.15 0.36Amsouth Bankcorp. 0.0 1.6 9.2 0.16 0.37
Average 0.0 1.5 10.3 0.13 0.59
a/ No recorded exposure (banks must report LDC exposure only whenexposure exceeds one percent of total assets).
Note. EXP/BV — exposure to Argentina, Brazil, Mexico andVenezuala over bank book value for 1986.MV/By — stock price over per share book value as of mid-1987.P/E — price earnings ratio expected for 1987 prior to recentmajor additions to loan loss reserves.E/BV — per share earnings over book value for 1986DIV/E = current annual dividend rate for mid-1987 over 1986
earnings.Sources: Keefe Bruyette & Woods Inc.; A Review of Bankperformance,
1987, Salomon Brothers.

in comparison with a ratio of 1.5 for the banks with zero exposure.
Similarly, the heavily exposed banks had a price-earnings ratio of
6.6, compared with a price earnings ratio of 10.3 for the banks with
zero exposure. This shows that the difference in market value is not
a function of the difference in current earnings, but rather the price
which the market is assigning to those current earnings. Put another
way, the market is casting doubt on the future earnings of the heavily
exposed banks by capitalizing those banks at a lower price-earnings.
The last two col.umns highlight two considerations discussed
earlier. Leaving aside Bank of Mnerica, with its extremely weakdomestic portfolio, the heavily exposed banks had a rate of earnings
in 1986 relative to book value that is comparable to that of the banks
with zero exposure. Once again, through the end of 1986 (before the
loan loss reserves in 1987 and the Brazilian moratorium) the debt
crisis posed a problem of future earnings, not current earnings. The
last column highlights the fact that the dividend payout ratios of the
heavily exposed banks have not been systematically lower that the
dividend payout ratios of the lightly exposed banks (note, however,
the two outliers: Bank of Anerica, which suspended its dividend in
1986; and First-Security Utah, which paid dividends in excess of
current earnings in 1986).
More generally, bank analysts concur that the current market
discounts are in line with, or even greater than, the quoted prices on
the secondary market.18 This view also helps to explain the market's
reaction to Citicorp's unanticipated announcement of $3 billion in
increased loan loss reserves in mid-May. The markets reacted to the
24

prospect of billions of dollars of newly announced losses by raisin
Citicorp prices by more than 10 percent in the week of the
announcement I Clearly, the news from the announcement was not the bad
news of losses, but the good new of a management strategy to confront
the losses agressively. One investment analyst was quoted as
explaining "There was a huge sigh of relief that the bad news was
19out".
The remainder of this section presents regression results that
provide a somewhat more precise estimate of the market valuation of
LDC loans to the banks, as implicit in the banks' stock prices. Four
parallel approaches are taken that yield largely consistent results.
The first approach starts from the observation that the market value
of a bank's assets should equal the market value of the fin's equity
plus its liabilities. As the market value of a bank's equity is
observed in the stock market, and the market value of a bank's
liabilities can be reasonably assumed to be very close to book value,
we can get a measure of the market value of a bank's assets. Then, by
comparing the market and book values of bank assets on a cross-
sectional basis, we can estimate the market value of of LDC claims
held by the various banks.
The second and third approaches relate the banks' price- earnings
ratio's and the returns to holding bank stocks to measures of LDC
exposure. The final approach studies the movement of bank share prices
in response to important LDC exposure- related news.
(a) Valuing bank assets
25

The market values of the securities on the two sides of bank
balance sheets should be equal. Thus the market value of a bank's
assets should equal the market value of its combined shareholders'
equity and liabilities. As a bank's liabilities are primarily
short-term liabilities such as customers' bank deposits and short-ten
CDs, we can assume that the market value of a bank's liabilities are
valued close to book value. Also, we assume that the market value of a
bank's preferred equity, which for most banks is less than 10 per cent
of shareholders' equity, is equal to book value.20
Using O to denote the market value of one dollar of claim on the
LDCs (i.e. 1 - is the market discount on the LDC claim) and 82 to
denote the market value of one dollar of other assets, we use the
following relationship:
(1) MVc + BVp + BVl — B1Aldc + e2Aother
where
MVc — market value of outstanding coimnon equity
BVp — book value of preferred equity
BVl — book value of liabilities
Aldc — book value of LDC exposure
Aother — book value of other assets
Using Atotal to denote total assets, we can substitute Atotal -
26

Aldc for Aother, and divide by Atotal to get the relationship:
Nyc + Blip + BVl Aldc(2) —a+fl
Atotal Atotal
where a — 02
fi — 1 -02
The above equation is estimated for a cross section of banks for
each of the years 1982 through 1986 and for June 1987. The regression
for June 1.987 uses the end-of-1986 data for exposure and asset values,
but uses the June 1987 stock prices to compute the market value of
assets. Because the banks are required to disclose LDC exposure to
individual countries only if exposure is in excess of one percent of
assets, we can obtain comprehensive exposure data only for the major
borrower countries. In particular, Aldc is limited to include the
exposure to Argentina, Brazil, Chile, Mexico, and Venezuela. This
introduces a bias in the point estimate of p which we discuss below.
Table 14 reports the estimation results. Note that for each of
the years 1983 through June 1987 the estimated value of - has a
negative value and is statistically significant. As the coefficient -
is equal to the difference between the market values of other assets
and mc loans, it is clear that a dollar on the books to the LDCs
contributes less to bank market value than a dollar lent elsewhere.
As noted, the exposure variable only covers part (about three fourths)
of LDC exposure. The omission of other LDC loans biases the
coefficient upward in absolute value to the extent that banks that are
heavily exposed in ABVN are also heavily exposed elsewhere, and to the
27

Table 14. Asset value regression results.
Year Constant EXP/ASSETS P.2 N
87 (June) 1.026 -0.576 0.18 33(122.91) (-2.61)
86 1.020 -0.610 0.18 33(116.95) (-2.65)
85 1.008 -0.456 0.30 48(294.87) (-4.43)
84 0.994 -0.223 0.17 50(364.26) (-3.10)
83 0.992 -0.174 0.16 50(455.01) (-3.02)
82 0.980 0.049 0.01 49(432.99) (0.81)
Note. The dependent variable is the sum of the market value of commonstock plus the book values of preferred stock and liabilities.
EXP/ASSETS denotes exposure to Argentina, Brazil, Chile,Mexico and Venezuela over book value of assets. Parenthesesindicate t-statistics.

extent that other LDC assets are also selling at a discount. Thus we
should adjust the estimated coefficient downward.
If a bank's exposure to ABVM were perfectly correlated with other
LDC exposure, if the markets (unlike usi) knew about the remaining
exposure, and if the rest of the DC sold at the same discount as
ABVM, then an unbiased estimate of fi for all DC debt would be
approximately three fourths of the actual estimate, since AZVM
accounts for about three-fourths of the total bank exposure. As there
is not perfect correlation nor perfect knowledge of the rest of the
banks' DC portfolios, an adjustment factor of something greater than
three-fourths is appropriate. We choose to decrease the point
estimate by a factor of 0.8 to get our preferred point estimate of the
value of the DC debt.
Then, using the estimates of Table 13 we find the following
implicit market prices per $100 of face value of claim:
1987 (June) 57
1986 53
1985 64
1984 82
1983 85
1982 102
The series shows that the market started discounting the LDC debt
not in 1982 when Mexico first announced its inability to
service its foreign debt, but in 1983. Ever since 1983 there has been
28

a trend towards greater discounts, a finding consistent with the trend
in secondary market prices observed in Table 4.
(b) Bank excess return equations
These results are supported by the results of a set of bank stock
excess return regressions represented in Table 15. Excess returns for
a particular bank in a particular period are measured as the
difference between the holding-period yield for the bank (capital
gains plus dividend yield) and the holding-period yield of the
Standard & Poor 500 stock market index multiplied by the individual
bank's beta coefficient. The regressions relate excess return to
exposure to Argentina, Brazil, Chile Hexico, and Venezuela divided by
bank book value. The Table first reports an excess return equation
spanning the entire 1982 - June 1987 period, and also a set of yearly
regressions. The 5-year excess return regression and alternative
regressions for 1986 and January- June 1987 include a dummy variables
that is set equal to 1 for banks located in Texas. This dummy is meant
to capture the effects of the oil slump on the profitability of Texas
banks.
The 5-year regression indicates that a bank with a exposure to
book value ratio of one would have suffered a negative excess return
of 65 percent. From the yearly regressions, we find a statistically
significant effect of exposure only for 1983. However, the estimated
coefficients are negative for all years except 1986. By summing the
coefficient estimates for each of the years, we can get an alternative
29

Table 15. Bank stock excess returns.
Year Constant EXP/BV DUMMY R2 N CUM
82 - June 1987 0.156 -0.650 -1.851 0.41 27
(0.64) (-2.54) (-3.47)
82 -0.035 -0.034 0.01 38 -0.035(-0.80) (-0.69)
63 0.266 -0.180 0.23 38 -0.214(5.79) (-3.26)
84 0.387 -0.158 0.02 39 -0.372(2.91) (-0.94)
85 0.129 -0.049 0.01 38 -0.421(2.56) (-0.68)
86 -0.451 0.070 0.03 26(-6.92) (0.83)
-0.410 0.031 -0.484 0.20 26 -0.390(-6.50) (0.39) (-2.23)
87 (June) -0.165 -0.020 0.02 26(-2.37) (-0.23)
-0.111 -0.071 -0.628 0.27 26 -0.461(1.74) (-0.89) (-2.88)
Note. The dependent variable is the stock holding rate of return(computed from stock price change and dividend) minus the Standard& Poor 500 holding rate times the bank beta coefficient.EXP/BV — Exposure to Argentina, Brazil, Chile, Mexico, andVenezuela over bank book value. For the 5-year regression exposurefor 1984 was chosen.DUNN'? — dummy equal to one for a Texas bank (First City Bank).

estimate of the cumulative negative excess return (GUM) associated
with LDC exposure, as shown in the last column of Table 15. On this
basis, by June 1987 the cumulative excess return was -46 per cent for
a bank with a exposure-to-book value ratio of one.
(c) Price-earnings ratios
As a third way to test the relationship between stock prices and
LDC expbsure, we regress the banks price-earnings ratios on the ratio
of AZVM exposure to book val,ue. As the sovereign borrowers have been
current in their interest payments, with the major exception of
Argentina during 1984, earnings associated with Latin exposure have
not suffered considerably. Low expectations about future debt
servicing however, should be expected to depress the price-earnings
ratios. Table 16 shows that the estimated coefficient on the
exposure variable is indeed negative for all six years, and it is
statistically significant after 1984.
The relative value of the constant term and the coefficient on
the exposure variable provides an indication of the discount on LDC
exposure relative to other assets. A bank with no exposure has a
price-earnings ratio given by the constant term. A bank with the same
book value but with assets that are only LDC claims (with an
exposure-capital ratio of 1.0) has a price earnings ratio equal to the
constant minus the coefficient on the exposure variable. Assuming
that current earnings are proportional to book value, regardless of
the distribution between DC claims and other assets, we can divide
30

Table 16. Price earnings ratios and Latin exposure.
Year Constant EXP/BV El N
87 (June) 1.0.628 -3.771. 0.29 36
(13.74) (-3.71)
86 9.703 -3.632 0.20 36
(10.34) (-2.95)
85 10.264 -4.138 0.41. 48
(20.31) (-5.63)
84 14.674 -5.242 0.04 48
(4.62) (-1.31.)
83 7.662 -1.443 0.09 49
(13.85) (-2.10)
82 5.839 -0.210 0.02 49
(28.81) (-0.91)
Note. The dependent variable is the price earnings ratio.EXP/BV — Exposure to Argentina, Brazil, Chile, Mexico,and Venezuela

the two price- earnings ratios to get the market price of the LDC
claims relative to the price other assets (for the sane size book
value of each type of asset). Assuming that other assets have a
price of 1.0, and that the coefficient on the exposure variabLe is
overstated by a factor of (1/0.8) for reasons described earlier, we
get the following alternative estimates of the LDC prices:
1987 (June) 72
1986 70
1985 68
1984 71
1983 85
1982 97
These estimates are broadly consistent with the estimates from the
asset value approach, though the implied discounts are somewhat
smaller. Note that if the measured current earnings on the LDC assets
are smaller than the earnings on the alternative assets per dollar of
book value, then our procedures in this section would understate the
discount of on the LDC claims.
(d) Event studies
The section concludes with a series of event studies. Here we
look at the movements of bank prices over a period of a day or a few
days, following the some important news related to the value of LDC
claims. This kind of evidence can help to bolster the view that the
31

markets react sensitively to news concerning the value of the LDC
claims.
We choose four events: (1) the announcement of the Mistral plan
in Argentina; (2) the announcement of the Cruzado plan in Brazil; (3)
the announcement by Brazil of a unilateral suspension of interest
servicing in February 1987; and (4) the announcement by Citicorp of
the increase in loan loss reserves on Latin American exposure. On
Friday night of June 14, 1985 President Alfonsin of Argentina
announced an accord with the IMF on an imaginative stabilization
program and monetary reform. Simultaneously, the U.S. Treasury in
Washington announced that it had succeeded in assembling a
multilateral 480 million dollar short-term loan for Argentina to
assist it with its immediated loan obligations. Even though on the
following Monday the Wall Street Journal printed an article with the
heading Argentina's latest austerity program is greeted with
skepticism by analysts," bank stock prices did well that day. The
results of a regression of bank stock returns on Monday on the ratio
of Argentine exposure to bank book value is shown in the first
regression in Table 17. According to the equation, Argentine assets
as valued in the stock market rose in value by approximately $12.0 per
$100 of claims (the coefficient 0.097 is scaled up by the ratio of
MV/BV to get 0.12.
On Monday March 3 1986, Brazil announced a similar austerity
program that included an agreement with foreign private creditors
reached the previous Saturday. The agreement called for a reduction in
interest paymnents of $ 150 million in 1985 and 1986 on $1.5 billion
32

table 17. Event studies of the returns to bank stocks.
Announcement of Mistral Plan(June 18, 1985)
(1) Constant ARC/By R2 N
-0.018 0.097 0.31 19
(-3.08) (2.77)
Annoucement of Cruzado Plan(March 3, 1986)
(2) Constant PUBRA/BV PRBRA/BV R2 N
0.009 -0.079 -0.026 0.23 19
(0.93) (-2.02) (-0.91)
Annoucement of Brazil Suspension
(February 20, 1987)
(3) Constant BRA/By 1(2 N
0.005 -0.030 0.08 21(0.59) (-1.28)
(February 19-26, 1987)
(4) Constant BRA/By 1(2 N
-0.006 -0.114 0.27 21(-0.35) (-2.67)
Annoucement of Citicorp Reserving(May 18 - 20, 1987)
(5) Constant IA/By DUMMY R2 N
-0.022 -0.014 0.056 0.29 24
(-2.80) (-1.69) (2.61)
Note. ARG/BV — exposure to Argentina over bank book value.PUBRA/BV — exposure to public borrowers in Brazil over book value.PRBRA/BV — exposure to private borrowers in Brazil over book value.BRA/By — exposure to Brazil over book value.
LA/By — exposure to Argentina, Brazil, Chile, Mexico andVenezuela over book value.
DUMMY — dummy equal to one for Citicorp.The returns for June 18, 1985 are from Crsp and include any dividenddistributions; other returns are the stock price appreciations asreported by the Wall Street Journal. Parentheses indicate t-statistics.

of debt and a refinancing of $ 6 billion that matured in 1985. The
second regression of Table 17 shows that the combination of the
rescheduling negotations and the new program was disappointing to bank
stock investors, as bank stock returns on that day are significantly
negatively related to the banks' Brazilian claims. Each $100 of
Brazilian public claims is estimated to have declined in value by $
8.1, and each $100 of private claims by $ 2.7.
Almost a year later, on Friday, February 20, 1987, the Brazilian
Minister of Finance, Mr. Dilson Funaro, sent a telex to Brazil's 700
creditor banks announcing a moratorium of interest payments on
medium-term and long-term commercial bank debt. The Wall Street
Journal commented that international bankers had grown used to debt
alarms and that they were taking Brazil's action in stride. Indeed,the third regression in Table 17 shows that on February 20 bank stock
returns were only weakly negatively related to the ratio of exposure
to Brazil to book value. However, during the following week, bank
stocks tumbled as Brazil took further steps that indicated its
resolve. On Monday, February 23, Chase Manhattan Bank, Chemical Bank
and Citicorp each lost more than 5 per cent of their stock values. On
Wednesday, February 25 Brazil tightened its policy by telling its
banks not to repay foreign creditors seeking to recall short-term
credit. The fourth regression in Table 17, which relates the return on
bank stocks between February 20 and February 26 to the exposure to
book value ratio shows that the cumulative effect during the week of
Brazil's interest moratorium on bank stock prices is significant and
highly negative.
33

The final event relates to the announcement by Citicorp on May
19, 1987 that it would add $3 billion to its loan loss reserves in
anticipation of future write-downs of latin loans. The fifth
regression in Table 17 relates Latin exposure over book value to stock
price movements between the day before and the day after Citicorp's
announcement. The added dummy variable is for Citicorp itself. The
regression shows that Citicorp stock went up by 4 percent, while other
bank's stocks went down slightly (and without statistical
significance).
Stock Market Values and Debt Renegotiation
The evidence on the market value of LDC debt has a crucial
implication for future negotiations between debtors and creditors, as
well as for the policy options of the official community. The
commercial banks should be willing to trade their LOC debt of a given
face value for a safer asset with a lower face value (we will term
such a trade a "cjebt conversion"). In the simplest case (and for the
moment ignoring tax and accounting complications), if the stock
market values the debt at $60 per $100 of face value, then the bank's
shareholders will benefit if the bank sells each $100 of debt for
cash at any price in excess of $60. Of course, the swap need not be
with cash; any marketable security, such as a bond or an equity
claim, with a market value in excess of $60 will do. Such a debt
conversion could result from direct negotiations between creditors
and debtors, or possibly through the policy actions of the official
comimxnity as illustrated below. Several benefits are likely to result
34
from debt conversion schemes that convert the current debt, now
priced at a discount, into cash, or into new claims at a reduced face
value (but which are then priced near the new lower face value). We
shall suggest that there is a strong case for policymakers to take
positive actions to support such debt conversions.
Debt Conversions through Bilateral Debtor-creditor Arrangements
There are many ways that debt conversions may be arranged
directly between debtors and creditors. The simplest case, with a
long historical tradition, is for the debtor to enter the secondary
market for its debt, and repurchase some or all of the debt for cash
at a deep discount. As tindert and Morton, Jorgensen and Sachs, and
others have recorded, such repurchases of heavily discounted bonds
took place in the 1930s._l/ There are, however, several problems
with a widespread use of debt repurchases.
A first problem is contractual. In most of the existing debt
contracts with the commercial banks, there is a "sharing provision',
which requires that all payments by the debtor to the creditors must
be equally shared by the participating banks. Technically, a debt
repurchase violates this clause, since the bank that sells its claim
gets a lump sum payment that is not received by the other banks. The
creditors and debtor can negotiate a waiver to eliminate the sharing
provision, though such a waiver generally requires the nearly
unanimous consent of the bank creditors. A waiver has been
negotiated during 1987 in the case of Bolivia, under the restrictive
condition that Bolivia will repurchase its debt only with funds that
35

have been donated to Bolivia by foreign governments expressly for the
purpose of debt repurchases.
A second problem with direct repurchases involves the regulatory
environment facing the banks. The main problem is that when a bank
sells its claim for cash, it must record a capital loss on the
transactions, equal to the difference of the face value of the claim
and the purchase price. This capital loss reduces the book value of
bank capital, and may trigger regulatory problems by reducing the
ratio of primary capital (measured at book value) to assets. Suppose
the bank sells a $100 claim, valued in the secondary market at $60,
for $65. At market prices, it would enjoy a $5 gain. In book value,
however, it would have to record a $35 Loss. We have seen that, in
general, the stock market responds to the change in market valuation,
and not in book valuation. However, if the decline in book value is
large enough to cause the bank to come close to or fall below
regulatory limits on capital-to-asset ratios (measured at book
values), then the freedom of manuever of the bank might be
Jeopardized.
Clearly, the regulatory environment imposes a bias against debt
sales, since it now allows an asset worth $60 to be held on the books
at $100 until that asset is actually sold at its reduced value. One
possible response of the regulators could be to ease the regulations
to allow the capital loss from debt sales to be amortized over a
period of several years (such an approach was recently introduced for
some kinds of bad farm loans.) Other "tricks' are also available,
that disguise the debt repurchase in such a way that an immediate
36

writedowu is avoided.21
A related regulatory problem is that if a bank sells some of its
claim on a country at a discount, then the regulators and the bank's
own auditors might force it to write down the rest of the its claims
on the debtor. The regulatory treatment here remains murky. That
murkiness has apparently prevented many banks from selling off small
portions of their exposure in a particular country, because of the
risk that the resulting capital losses would be imposed over their
remaining claims on the country as well.
A third problem with repurchases is that the debtor country
generally does not have the cash available to make a major repurchase
of its debt. If the required large amount of cash were available,
the debt itself would likely not sell at a deep discount. To the
extent that debt conversions are desirable, it might make sense for
the official community to give or lend money to debtors in large
amounts to enable a large-scale repurchase to take place. This is
essentially the experiment now underway with Bolivia. We return to
the possible involvement of the official community to support debt
conversions in the next section.
Other forms of debt conversion have a similar effect as debt
repurchases, though they may be of a very different appearance. In a
debt-equity swap for example, a potential foreign direct investor
purchases some debt from the banks on the secondary market, and
bringing the debt to the debtor country's central bank. The central
bank purchases the debt using local currency, under the restriction
that the domestic currency then be used to make a foreign direct
37

investment. As long as the central bank repurchases the debt from
the investor at close to the secondary market price (i.e. at the
price, converted into local currency, that the investor paid to the
banks), then the transaction is essentially a cash repurchase of debt
when viewed from the perspective of the central bank. The key (and
perhaps only advantage) of such a mechanism from the debtor country's
point of view relative to a direct repurchase of debt is that it
allows the debtor to get around the sharing provision discussed
earlier22 Otherwise, debt-equity swaps have the same advantages and
disadvantages of direct debt repurchases.
A new possthle form of debt conversion that may be similar to a
repurchase, though less costly to the debtor in terms of current cash
flow, is an exit band, With an exit bond, the creditor swaps his
bank debt (say of $100) for a bond of the debtor country with the
same face value (i.e. same eventual principal repayment) but with a
below-market coupon rate. The bond therefore has a contractual
present value (i.e. a present value assuming no default) that is
below the face value of the existing bank debt.23
Why should a creditor swap a bank loan for an exit bond of the
same debtor that has a lower contractual present value? The bond is
supposed to be superior to the existing bank debt for several
reasons. First, holders of the bonds are explicitly relieved of the
obligation to make contributions to "concerted lending't packages that
may be negotiated between the banks and the country in the future,
Second, the debtor undertakes, either expliéitly or implicitly, to
give the bonds a senior status relative to the remaining bank debt
38

(i.e. to fully service the bonds before servicing any of the bank
debt). If the senior status is credible, the bond may be a very safe24
claim.
Third, as discussed in a later section1 the creditors as a group
may benefit from the introduction of exit bonds since certain
efficiency gains may arise from the fact that the exit bonds reduce
the debtor country's contractual debt service obligations. We shall
see that the debtor country's ability and willingness to service its
debts may well rise as the contractual obligations to do so fall.
Some Tax and Regulatory Aspects of Debt Conversions
There are two details that are important in understanding the
full regulatory and financial ramifications of debt conversions. The
first involves book accounting. As indicated earlier, debt
conversions may or may not require immediate writedowns of book
values of the banks' claims, depending on how the transaction is
carried out. In general, if an asset is swapped for cash (a direct
repurchase) or some non-debt claim (e.g. a debt-equity swap), the
bank must book the new asset at its current market value, and write
down any difference between the face value of the debt and the market
value of the asset received in return. Thus, if debt with face value
of $100 is priced at $60, and is traded for cash or equity worth $65,
the bank records a loss of $35.
This loss is important for two reasons. It reduces the banks
book capital, which is the measure used for regulatory purposes.
39

Second, the loss can be charged against taxes. If the bank pays the
corporate tax rate on the margin (34 percent in 1988), then the tax
savings would be worth $40 x 0.34. or $13.6. Thus, the full value to
the bank of selling a debt for $60 would be $73.6. Put differently,
if the stock market is valuing the debt at $60, the bank should be
willing to sell the debt for $39 in cash, since $39 plus the tax
saving of $21 (equal to (1- .39)x.34), equals $60.
If the bank debt is swapped for a new form of debt, however,
then the accounting and tax rules may be different. If $100 of bank
debt at market interest rates is swapped for a $100 exit bond with a
sub-market interest rate, the bank does na in general have to write
down the value of its claim unless and until the exit bond is sold on
the market, at which time the writeoff would be the difference of
$100 and the price received for the bond. This accounting rule
(biown as FASB 15), gives the banks great flexibility with respect to
exit bonds. They can choose the time to take the capital loss on the
debt even after they swap the debt for exit bonds.
Why Debt Conversions are Attractive
There are reasons to believe that debt conversions can make the
creditors (as a group) as well as the debtors better off relative to
the current situation in which the bank debt is kept on the books at
full face value, whether or not it is fully serviced.25 For most
countries, the current amount of debt significantly exceeds the
expected discounted value of net debt servicing (i.e. debt servicing
net of new concerted lending). We suggest that there may be
40

important efficiency losses from keeping on the books an amount of
debt far in excess of the amount that can reasonably be expected to
be repaid. These efficiencies losses are often ignored, but they are
a central aspect of the case for debt conversions.
The efficiency losses that we will discuss are widely recognized
in the context of corporate or personal bankruptcy, but not yet in
the context of excessive sovereign debt. There are good efficiency
reasons why a corporation or individual with greatly excessive debts
is allowed to discharge those debts in the context of bankruptcy. In
a corporate reorganization (i.e. a Chapter 11 proceeding), it is
recognized that: (I) economic efficiency may dictate that an overly
indebted firm should continue to operate; but that (2) efficient
operations require an exolicit conversion of the debt into claims
with a reduced contractual debt service obligation. (Otherwise, the
firms cannot operate except in a crisis mode: they are denied
suppliers credits; they are subjected to creditor lawsuits; they have
a hard time collecting on accounts receivable; they cannot get new
financing for investment projects; they cannot get workers to invest
in job-specific training; and so forth). Bankruptcy courts do not
tell the corporation to continue to operate with all of its debt
intact, i.e. to simply roll over the debt and to "pretend" that it
can service all of the debt in the future. It is recognized that the
overhang of debt itself prevents the smooth operation of the firm, to
the ultimate detriment of the creditors.
The same kinds of efficiency losses apply in the context of
sovereign debts. The overhang of the debt itself can hamper economic
41

performance, even if the excessive debt is being concealed by
concerted loans or by arrears. To see this, we will consider some
simple illustrations. Suppose that a country owes $10 billion of
debt. The safe market interest rate is 10 percent. To begin,
suppose that the country's debt servicing capacity (i.e. capacity to
make a net resource transfer) every year is $600 million assuming no
chanEe in policies. The country repays all that it can each period,
though its repayment capacity may depend on the kinds of policies
that it follows. The market value of the debt would simply be the
discounted value of $600 million, or $6 billion at market interest
rates. The secondary market price would therefore be $60 per $100 of
debt.
In the present debt management arrangements (assuming no
breakdown in negotiations, and without debt conversions), the country
would pay the full $1. billion of interest in the first year, and get
a concerted loan of $400 million, so that its net resource transfer
would be $600 million, which is its ability to pay. Next year, the
debt would be $10.4 billion, with interest due of $1.04 billion. The
country would again make a net resource transfer of $600 million,
requiring a new concerted loan of $440 million. Each year the
country would get a new concerted loan in order to keep the net
transfer at $600 million. The debt would eventually grow at a rate
approaching 10 percent per year, the rate of interest. Obviously,
the debtor and creditor are engaged in a simple "Ponzi scheme" to
hide the fact of partial default.
Suppose that instead of this arrangement all of the debt were
42
converted into exit bonds with 6 percent interest. The bonds would
be perfectly safe, since the country would and could pay $600 million
per year on the bonds. There would be no defaults and no concerted
lending, since the debt conversion would obviate the need for
concerted lending. It would leave the position of the debtors and
creditors unchannd with respect to net resource transfers each year.
The debt conversion would impose no losses to the creditors regarding
debt service receipts, and would offer the benefit to both debtors
and creditors of avoiding the costs of negotiating the concerted
loans each year.
Perhaps more importantly, the debt conversion would avoid the
risk of an actual breakdown in debt negotiations at some point in the
future, leading to an outright default. The risk of a negotiating
breakdown is present in most kinds of negotiations, but isparticularly acute in the bargaining between banks and debtor
countries, since both the creditors and debtors are negotiating on a
wide variety of fronts, and so have the incentive to stake out
"tough positions to avoid the appearance of weakness in other
settings. Actual breakdowns of negotiations (which have occurred with
Nigeria, Peru, and several other countries) are very costly. The
debtor's international trade can be hampered by a drying up
international trade credits, or other forms of disruption. This
disruption represents a debt- weight loss to both the debtor and the
creditors, a loss that can be avoided by the debt conversion.
Note that the market price of debt will in general reflect the
fears of such a future breakdown. In our example, therefore, In
43

which the country can service 60 percent of the debt, the market
price of the debt would generally sell at below 60 percent, say $55
per $100. Then, a switch to exit bonds would involve a capital gain
from $55 to $60 that would be shared by the creditors and debtors.
Next, suppose that by undertaking a structural reform program in
the current year, which would require the nation to forego $100
million in current consumption, the country could raise its output,
and therefore its debt servicing capacity, by $12 million this year
and every year in the future. Debt servicing capacity, and therefore
debt servicing (under the assumption that the country pays all that
it can) would rise to $618 million per year. The secondary market
value of the debt would rise to $61.8 per $100.
If this reform is carried out, the debtor would sacrifice
consumption for the sake of the foreign creditors since the returns
to the structural reforu effort would be appropriated by future debt
servicing. There would be little incentive to make such a structural
change, and indeed it might be politically suicidal, since opposition
parties would attack the government for sacrificing current
consumption for the sake of foreign creditors. The key assumption
of course is that the creditors would appropriate a large portion, if
not all, of the improvements in the economy. This is a reasonable
assumption. Concerted lending and reschedulings are granted to
countries in dire economic difficulties. Once an economy improves,
the debtor is expected to service its debts in full, and the debtor's
bargaining power to resist debt servicing is dimin1s No player,
neither the banks, the IMF and World Bank, or the creditor
44

governments, will excuse a country with a healthy economy from debt
servicing, on the grounds that it was once in trouble and chose toundertake needed reforms!
Could the reforms be financed by the foreign creditors in order
to increase the country's debt servicing capacity, rather than via a
reduction in debtor-country consumption? Probably not. Supposing
that $100 million is lent to the country in addition to the $400million of interest refinancing (the overall concerted loan would be
$500 million). There is no guarantee that the structural reforms
would actually be undertaken. The country might promise" to
undertake the reforms, receive the loan, use the money for
consumption purposes instead, and continue to pay $600 million in net
resource transfers in the future. They would benefit from this
policy choice, by raising current consumption by $100 million at no
real future cost. Since promises to reform are notoriously difficult
to regulate, (most IMF and World Bank conditionality requirements are
not net by borrowing countries), it is a good bet that such lendingwould be dangerous indeed, and thus would not be undertaken.
Now suppose that the debt conversion exercise is undertaken
instead. The contractual debt burden is reduced to the level. $600
million per year through the use of exit bonds. Now, if the country
undertakes the reform effort, it would reduce current consumption by
$100 million, but increase future consumption potential by $18
million per year. The foreign creditors would no longer appropriate
the benefit, since their claims have been reduced to a fixed $600
million by the debt conversion. As long as the consumers' rate of
45

time discount is sufficiently low, the reform will now look
attractive. The creditor's welfare is unchanged by the debt
conversion, and the debtor's is raised.
As a result of the efficiency gains, it would generally be
possible to structure the debt conversion to benefit both the debtor
and the creditors. For example, the debt worth $60 in this example
could be swapped into exit bonds worth $61 (e.g. paying 6.1 percent
interest), still leaving the debtor with enough incentive to carry
out thereforms.
The key point of this extended example is that an overhang ofdebt creates various inefficiencies. First, the debt overhang
requires continuous and costly renegotiation of the debt. Second, it
raises the spectre of a costly breakdown of negotiation, which would
disrupt the trading arrangements of the debtor, and thereby impose
costs on both the debtor and the creditors. Third, and perhaps most
important, the debt can act as a heavy tax on economic reform. Under
the current arrangements, the returns to reform are appropriated
heavily, if not entirely, by the foreign creditors. The result istwofold: (1) no individual government has an incentive to undertake
adjustments; and (2) political parties that are opposed to reform
have an attractive case to take to the electorate. This latter
concern is far from abstract. In recent legislative elections, the
reformist government of President Alfonsin in Argentina lost heavily
to the Peronists, who have been arguing against reforms to increase
foreign debt repayments, urging a debt moratorium inm'ad.
46

A Crucial Caveat on Exit Bonds
The previous discussion has highlighted the potential usefulness
of exit bonds. We have given examples in which the conversion of
all bank debt into exit bonds could reduce the contractual
obligations of the debtor country while at the same time maintaining,
or even raising, the market value of the resulting claims held by the
creditors. The example was chosen to make this point, but for this
reason it may mislead as well. In a more general setting, the
conversion of bank debt into exit bonds may result in a fall in the
value of the creditors claims rather than a rise, thereby
undercutting the case for exit bonds.
Consider an additional illustration. Suppose that a debtor
country will be able (and willing) to repay its debts fully if world
commodity prices recover (probability 0.6), and will default entirely
if commodities prices stay the same or fall further (probability0.4). $100 of debt would sell for $60 in the secondary market. Now
suppose that the debt is converted to exit bonds, carrying a coupon
interest rate at 60 percent of the market interest rate. The
contractual present value of a $100 long-term bond would be reduced
to $60. What would be the new market value of the creditors' claims?
Evidently, the new exit bonds would also have a 60 percent chance of
being fully serviced, and a 40 percent chance of being fully
defaulted. Thus, the exit bonds would sell at a 60 percent discount
relative to the contractual obligations of the bonds. In other
47

words, the market price would by 60 percent of $60, or $36.
Obviously, in this case, the creditors lose substantially by giving
up their bank claims (worth $60) for an exit bond (worth $36).
Therefore, a discount on the bank debt in the secondary market
does not mean that creditors can automatically benefit (or at least
not suffer) from a conversion of debt into exit bonds. In the
example that we just cited, there is no efficiency gain to making the
debt conversion, since payoffs depend purely on the exogenous world
commodity price, not on the policies of the debtor. There is however
a loss to the creditors, since with the conversion to exit bonds, the
banks give up the chance of receiving the full $100 repayment of
their debt in the event of favorable world corodity prices.
Technically, part of the value of the creditors' claims on the
country is the option value of sharing in high commodities prices.
When the debt is converted into exit bonds with a lower contractual
value, part of that option value is lost.
Exit bonds therefore have the following minuses and plusses when
viewed from the perspective of the creditors as a group. On the
negative side, since exit bonds reduce the contractual present value
of future debt repayments, the banks lose the option value of getting
fully or substantially repaid on their bank debt if exogenous events
are highly favorable. On the positive side, the exit bonds offer
various efficiency benefits, which can raise the market value of the
resulting claims. To reiterate, these efficiency gains include:
avoiding the costs of continuous debt negotiations, avoiding the
chance of a costly breakdown in future debt negotiations, and
48

stimulating economic reform in the debtor country. The balance of
costs and benefits depends on the relative importance of these
considerations.
We are inclined to believe that the benefits of debt conversion
considerably outweigh the possible costs, though our reasons are
necessarily impressionistic, and must be considered on a case-by-case
basis. The 50 percent discount on bank debt for most countries
reflects the fact that the debt is twice too large to be serviced
with regularity, rather than the fact that exogenous events will
result in all or no repayment with probability 0.5. In other words,
the option value of waiting for full or nearly full repayment is of
little value. Moreover, as we have pointed out, it is likely to be
seriously self-defeating, since if the creditors wait for full
repayment, the debt overhang will stifle reform and tend to bring to
power less reformist and more radical regimes, that indeed will
choose to suspend all debt repayments.
Put yet another way, if the creditors really face a probability
distribution involving complete versus no repayments on the debt, it
is a probability distribution that they themselves can influence. A
reduction in the contractual debt burden through some form of debt
conversion will bolster the political standing of those who would
repay the debt.
Debt Conversions and Public Policy
To the extent that debt conversions are desirable for improving
49

the efficiency of the debtor economies, there may be a role for
pubLic policy is facilitating such transactions. At the minimum, the
regulatory environment can be modified so that arbitrary book value
calculations do not stand in the way of desirable exchanges.
Many commentators have proposed going further, and using public
money to smooth the debt conversion operations. In one popular
proposal, the debt conversion would be intermediated by a new
international debt facility. The facility (which could be part of
the World Bank for example) would accept the exit bonds of the debtor
country, and issue its own bonds to the commercial banks in return
for the existing bank debt, which then would be extinguished. The
country would owe money to the facility in the form of exit bonds.
The facility would owe money to the banks in the form of guaranteed
bonds. The banks would get a safe claim (the bond of the debt
facility) rather than a risky exit bond of the debtor country.
This proposal is obviously nearly identical to two other
alternatives which have also been discussed. The first alternative
is that the official creditor community (e.g. the World Bank) would
provide a guarantee on the exit bonds issued by the debtor country.
The second alternative is that the official creditor community would
lend the debtor countries the money necessary to make cash
repurchases of debt in the secondary market. In all three cases, the
contractual debt burden of the debtor country is reduced in line with
the discount on its debt in the secondary market, and the claims on
the debtor country are effectively shifted to the official creditor
community and away from the commercial banks.
50

It is easy to see that the capital cost to the official
community of this operation would be the difference in value of its
own bonds (which would sell at par, since they are a safe asset) and
the exit bonds of the debtor country.26 Suppose, for
exariple, that the countrys debt now sells at $60 per $100. If the
facility issues $60 of guaranteed bonds to the banks, and accepts
exit bonds from the debtor country with a contractual value of $60,
the facility's net worth will depend on the actual market value of
the debtor country's exit bonds relative to the $60 contractual
value, We have given examples in which the $60 of exit bonds will
indeed be worth the full $60, (with costs to the facility, and
cases in which the bonds would be worth only $36 (with the facility
losing $24 in present value terms).
Why is such a facility needed at all? The main reason is that a
large-scale debt conversion poses significant collective action
problems that can best be overcome with official intervention.
Bankers' fears about regulatory problems, the legal status of exit
bonds, the problem of contagion effects (in which terms to one
country influence negotiations with other countries), and the
difficulty of collective decisiorimaking among the a large number of
banks, make it difficult to carry out a large-scale debt conversion
without considerable support of the official community. Therefore,
the significant efficiency gains that might be generated by a debt
conversion are not achieved.
Importantly, the likely costs to the official community of
intermediating a large-scale conversion would be modest. Suppose
51

that each creditor country participates in the international debt
facility in proportion to the exposure of its banks in the problem
debtor countries. As we saw in Table 1, U_s. banks hold
approximately $57 billion in claims on governments of the problem
debtor countries. The secondary market value of those claims was $32
billion in July 1987. If the debt facility gave the U.S. banks
guaranteed bonds worth $32 billion in return for the debt and
accepted exit bonds from the debtor countries with a contractual
obligation of $32 billion, the capital cost to the U.S. would be the
market discount on the $32 billion of exit bonds. At best, the
claims on the LDCs would be worth the full $32 billion: there would
be no residual cost to the U.S. At the very worst, the bonds would
sell, at the same discount as the original bank debt (i.e. at 55
percent of contractual value). The claims on the LDCs in that case
would be worth $17.60 billion, and the transaction would cost the
U.S. government $14 billion. Presumably, this capital loss could be
amortized over many years, so that U.S. taxpayers would end up paying
$1 - $2 billion each year for several years.
Even this upper limit of $14 billion seems a modest cost in
order to achieve a reduction in LDC debt to the secondary market
levels for all thirty problem debtor countries in Table 1. Consider
what is achieved from the U.S. perspective: (1) the debt is reduced
to levels deemed manageable from the point of the view of the market;
(2) the U.S. banks are taken out of the game, and out of risk,
without imposing further losses than have already been incurred; (3)
the potential is enhanced for significant efficiency gains in the
52

debtor countries by virtue of eliminating the debt overhang; (4)
relatedly, the political positions of moderates in the LDCs is
bolstered relative to political forces that are urging a suspension
of debt servicing; and (5) by the same token, new democratic regimes
in much of Latin America and the Philippines would likely be
strengthened by a reduction of their contractual debt servicing
obligations. Finally, this kind of relief is a very efficient form
of foreign aid, since the U.S. contributions would also be matched by
the other creditor governments. The Germans, Japanese, British, and
other countries, would also be contributing their ro rata share, so
that the U.S. would avoid carrying an undo part of the burden. To
look at the costs from the point of the view of the entire creditor
community, we turn to the data in Table 18. As of the end of 1985, the
world's financial institutions (almost exclusively banks), had medium
and long-term claims on the governments of the problem debtor
countries of $194 billion, with a secondary market value of $105
billion. Thus a complete swap of debts into exit bonds for the thirty
countries in Table 18 would require official guarantees of $105
billion. At best, the capital cost of these guarantees will be zero:
the debtor countries will fully service the reduced burden of the exit
bonds. At the very worst, the exit bonds would be valued at the same
discount as the current bank debt, about $54 per $100 of face value
(the discount is slightly different from the discount for the 13.5.
banks because of the composition of the global portfolio). Then, the
capital loss internationally would be on the order of (1-54) x $105,
or $48 billion for the entire creditor community, of which the U.S.
53

Table 18. Secondary Market Value of Claims of FinancialInsitutions on the Problem Debtor Nations.
debt to bid secondaryfinancial price market value
institutions
Argentina 20395.3 47 9585.8Bolivia 126.3 10 12.6Brazil 49624.7 55 27293.6Chile 12084.8 67 8096.8Colomblia 4144.2 81 3356.8Costa Rica 1530.4 33 505.0Dominican Rep. 328.4 42 137.9Ecuador 4972.5 45 2237.6Gabon 532 82 436.2Guatemala 101.1 72 72.8Honduras 164.8 38 62.6Ivory Coast 2486.6 60 1492.0Jamaica 406.5 37 150.4Liberia 41.4 5 2.1Malawi 53.7 74 39.7Mexico 58757.3 53 31141.4Morocco 2568.0 65.5 1682.0
Nicaragua 1144.9 5 57.2
Nigeria 6515.2 28 1824.3Panama 1877.6 64 1201.7Peru 3224.6 11 354.7Philippines 4206.6 67 2818.4Romania 2261.4 87 1967.4Senegal 233.5 61 142.4Sudan 553.6 2 11.1Uruguay 1300.5 68 884.3Venezuela 9968.2 67 6678.7
Yugoslavia 4510.3 70 3157.2Zaire 402.9 24.5 98.7Zambia 226.5 18 40.8
Total 194743.8 105542.3
Sources: World Bank; Indicative Prices for LessDeveloped Country Bank Loans July 27, 1987, SalomonBrothers.

share would be approximately $14 billion.
Conclusions
The major theme of this paper is that the commercial banks have
weathered the debt crisis, while many debtor countries remain in
economic paralysis or worse. There is a growing consensus that much
of the LDC debt will not be fully serviced in the future, and that
consensus is reflected in at least two ways: in the discounts observed
in the secondary market prices for LDC debt, and in the discounts in
the stock market pricing of banks with exposures in the LDCs.
The fact that the bank share prices of heavily exposed banks are
already discounted in reflection of the decline in value of the LDC
claims demonstrates that the banks could absorb a significant book
loss on their LDC exposure.
Our analysis suggests that certain debt conversion schemes now
under discussion could offer debt relief to the debtor countries
without causing a further deterioration in the market values of the
commercial banks.
54
1. See 3. Sachs, 'Managing the Developing Country Debt Crisis,Brookings Papers on Economic Activity, 1986:2, for an overview ofthe debt crisis and the management of the crisis by the creditorcountries.
2. To give an idea of the global distribution of bank claims inthe problem debtor countries, Latin America has about $200billion of bank debt outstanding, of which about $75 billion isowed to U.S. banks, $30 billion to Japanese banks (with $13 inMexico and $1.0 in Brazil). $40 billion to U.K. banks, and theremaining $55 billion or so divided among German, French,Canadian, Swiss, and other banks. The estimate for Japan is fromDoherty, "Japan's Role in the International Debt Crisis", JapanEconomic Institute, and for the U.K. from the IMP InternationalCapital Markets, 1986.
3. The term "debt forgiveness" is used to refer to anyrestructuring of the debt that reduces the expected discountedvalue of future payments. Interest capitalization refers to anyscheme by which a portion of interest due is automatically relentto the debtor for later payment. Interest capitalization isdistinguished from "involuntary lending" packages, in which loansare made on an ad hoc basis so that the country can finance someof the interest due.
4. Since completing the analysis in this paper, the secondarymarket prices have fallen further for most of the debtorcountries. As of October 6, 1987, Salomon Brothers quoted thefollowing prices for the largest countries: Argentina. 34:Brazil, 38; Mexico, 47; and the Philippines 55. Some of thereasons for the further drop between July and October 1987include: the toughening of the Brazilian negotiating position inthe fall of 1987 (including Brazil's call for a major conversionof debt to exit bonds at sub-market interest rates); the Peronist
electoral victory in Argentina in September 1987; the politicalinstability in the Philippines; and the sharp rise in U.S. -denominated interest rates.
5. An initial attempt to analyze the links of stock market pricesand LDC debt was carried out by Steven Kyle and Jeffrey Sachs,"Developing Country Debt and the Market Value of Large CommercialBanks," YBER Working Paoer No. 1470, september 1984. That study.which used data until 1983:111, also found a significant negativeeffect of LDC exposure on bank share prices.
6. Of course, many of these problems pre-dated the debt crisis,and indeed were contributing factors to the onset of crisis, apoint stressed in J. Sachs, "External Debt and EconomicPerformance in Latin America and East Asia", Brookings Papers on
55

Economic Activity, 1985:2. In most cases, the excessivebudgetary deficits reflect deep social and political divisionswithin the debtor countries that have been exacerbated by theneed to service a heavy foreign debt burden.
7. In Latin America, Chile has been the main beneficiary of therise in metals prices, since copper accounts for more than 40 percent of Chile's merchandise exports. Copper prices have risenfrom 64 cents per pound at the end of 1985, to a price of 91cents per pound in October 1987.
8. For a discussion of the budgetary burden resulting from theforeign debt, see Helmut Reisen and Axel Van Trotsenburg, "TheBudgetary and Transfer Problem of Major Debtor Countries", OECDDevelopment Centre, Paris 1987, and J. Sachs, "Trade and ExchangeRate Policies in Growth-oriented Adjustment Programs," NBERWorking Paper No. 2552, 1987.
9. Mexico received approximately $6 billion in bank credits andArgentina recently signed an agreement for $2 billion in new bankcredits. These amounts correspond to approximately one year'sinterest payments on medium and long-term sovereign debt.
10. Moreover, the banks more than fully refinanced Chile'sinterest payments during 1983-84 (i.e. the "converted lending" toChile in 1983-84 exceeded Chile's interest payments), so thatChile actually received a net resource transfer from thecommercial banks as late as 1984. Interestingly, concertedlending to Chile has been more generous on average (when the newlending is measured as a ratio to the existing debt) during 1983-86 than has concerted lending to any other problem debtorcountry.
11. In her speech upon the opening of the Philippine Congress,President Aquino declared, "We cannot help but feel our foreigncreditors took undue and unfair advantage of the internaldifferences we had with factions intent on subverting thisCovermaent and destroying our democracy." (As quoted in theFinancial Times, July 28, 1987). The first act of both houses ofthe new Philippine Congress was to call for an investigation intothe foreign debt.
12. See the IMF 'Internatinonal Capital Markets, December 1986,for details on spreads and Maturities in debt reschedulingsthrough 1986. See 'The Economist' (March 22, 1987, p. 18) for anupdate.
13. Non-accrual loans are loans in which interest servicing isbehind schedule or sufficiently sporadic so that interest iscredited to the bank only as it is received (i.e. on a cash
56

basis), rather than the more typical procedure of creditinginterest as it accrues.
14. For a good discussion of the issues, see George .1. Benston,et. at. Safe & Sound: Perspectives on Bankin2, MIT Press, 1986
15. Consider a bank that has deposits of $95, loans of $100, andprimary capital (in this case equal to shareholder's equity) of$5. A 5 percent reduction in the value of the assets wipes out100 oercent of the bank capital!
16. The exposures to the Brazilian and Mexican public sectors atthe end of 1983, as a percentage of primary capital, were ratherlarge for many of the large banks. For Brazil, the exposureratios were as follows: Bank of America, 28 percent; Chase 1;Chemical 23; Citicorp 35; and Manufacturers Hanover, 36. ForMexico, the ratios were: Bank of America, 21; Chase, 3; Chemical,27; Citicorp, 8; and Manufacturers Hanover, 46.
17. For a further discussion, see the IMF International CapitalMarkets, 1984, p. 17-18, and later issues, and the Wall StreetJournal, "U.S. Bank Regulators are Called Likely to RequireWrite-Down of Brazil Loans", September 1, 1987.
18. Thomas Hanley of Salomon Brothers is quoted in FortuneMagazine (March 30, 1987, p. 104) as declaring: "The discount [inthe stock marketJ is even greater than the price concessionsaccorded Third World debt currently trading in the secondarymarket.'
19. Michael Metz, portfolio strategist of Oppenheimer & Co.,quoted in the Washington Post, May 21, 1987.
20. This latter assumption is made to ease problems of datacollection.
21. An example is a follows. Instead of using the $60 cash torepurchase the debt, the debtor country puts the cash in acustodial account managed by the creditors to zuarantee a bondwith sub-market interest rates that has a present value equal tothe sale price (e.g. a $100 face value bone, with a coupon rate40 percent below market interest rates, that gives the bond amarket value of $60). The creditors then swap their $100 of debtfor the guaranteed ("defeased") bond, also with a face value of$100, but a safe market value of $60. Under standard accountingrules, specifically FASB 15, a swap of $100 of debt for $100 ofbonds of the same debtor, generally does not require a writedown
57

in book values of the claim.
22. Until recently, most central banks were redeeming the debtat close to oar, rather than at close to the secondary marketprice. This gave the foreign investor the spread between the
secondary market price and the face value of the debt. Inprinciple. a repurchase at par may act as an investmentincentive, though as with many incentive schemes, the largesteffect was to give a large lump-sum transfer to infra-margina).investors that would have invested in the country anyway.Recently, central banks have been finding ways to recapture mostof discount on the debt. They have done this either byrepurchasing the debt at close to the secondary market price, or
by auctioning the right to participate in a debt-equity swapamong potential foreign investors, thereby recapturing thesurplus previously accruing to the foreign investors.
23. Note that in contractual terms, the bank claim has a presentvalue equal to its face value, since it carries a market rate ofinterest.
24. Consider the the case of Brazil for example, with about $70billion of bank debt, and annual net resource transfers to thebanks in recent years of about $6 billion. If Brazil were toconvert $10 billion of its debt into exit bonds with a very longmaturity and a fixed interest rate of 6 percent, given a safemarket rate of 10 percent, the interest due on the bonds would be$600 million per year. If the $600 million is credibly senior tothe remaining bank debt, there would be little doubt aboutBrazil's capacity to service the bonds, since the $600 million isfar less than Brazil's revealed annual capacity and willingnessto pay. The bonds would therefore be a relatively safe asset,and would therefore be priced at about $60 per $100 of principal(that is, 6/10 of market interest rate x $100, assuming a longmaturity on the bond). Assuming that bank claims on Brazil arenow selling at below $60 per $100, individual banks should bewilling to swap their bank debt for the exit bonds.
25. The argument in this section, that debt conversions or debtrelief, can provide efficiency gains for both debtors andcreditors, was first argued in J. Sachs, "The Debt Overhang ofDeveloping Countries, 1 forthcoming in the Memorial Volume forCarlos Diaz Alejandro, to be published by the WIDER Insitute,Helsinki, 1988. Another recent paper that explores a similartheme is Paul Krugman, "Bootstrap Debt Relief," mimeo, MIT.
26. The facility might even sell off some or all of the exitbonds in the open market, to realize the capital loss, and reducefuture risks.
58