
NBER WORKING PAPER SERIES THE POLITICAL ECONOMY OF …
97
NBER WORKING PAPER SERIES THE POLITICAL ECONOMY OF PUBLIC SECTOR ABSENCE: EXPERIMENTAL EVIDENCE FROM PAKISTAN Michael Callen Saad Gulzar Syed Ali Hasanain Muhammad Yasir Khan Working Paper 22340 http://www.nber.org/papers/w22340 NATIONAL BUREAU OF ECONOMIC RESEARCH 1050 Massachusetts Avenue Cambridge, MA 02138 June 2016, Revised April 2018 A previous version of this paper was circulated under the title “The Political Economy of Public Sector Absence: Experimental Evidence from Pakistan.” We thank Farasat Iqbal for championing and implementing the project and Asim Fayaz and Zubair Bhatti for designing the smartphone monitoring program. Support is generously provided by the International Growth Centre (IGC) political economy program, the IGC Pakistan Country Office, and the University of California Office of the President Lab Fees Research Program Grant #235855. Callen was supported by grant #FA9550- 09-1-0314 from the Air Force Office of Scientific Research. We thank Erlend Berg, Eli Berman, Leonardo Bursztyn, Ali Cheema, Melissa Dell, Ruben Enikolopov, Barbara Geddes, Naved Hamid, Gordon Hanson, Michael Kremer, Asim Ijaz Khwaja, Craig McIntosh, Ijaz Nabi, Aprajit Mahajan, Monica Martinez-Bravo, Benjamin A. Olken, Gerard Padro -i- Miquel, Karthik Muralidharan, Rohini Pande, Daniel N. Posner, Ronald Rogowski, Jacob N. Shapiro, Christopher Woodruff, Oliver Vanden Eynde, David Yanagizawa-Drott, Ekaterina Zhuravskaya and various seminar participants for insightful comments. Excellent research assistance was provided by Muhammad Zia Mehmood and Haseeb Ali. We thank Ali Cheema and Farooq Naseer for kindly sharing their data on election outcomes. The views expressed herein are those of the authors and do not necessarily reflect the views of the National Bureau of Economic Research. NBER working papers are circulated for discussion and comment purposes. They have not been peer-reviewed or been subject to the review by the NBER Board of Directors that accompanies official NBER publications. © 2016 by Michael Callen, Saad Gulzar, Syed Ali Hasanain, and Muhammad Yasir Khan. All rights reserved. Short sections of text, not to exceed two paragraphs, may be quoted without explicit permission provided that full credit, including © notice, is given to the source.
Transcript of NBER WORKING PAPER SERIES THE POLITICAL ECONOMY OF …

NBER WORKING PAPER SERIES
THE POLITICAL ECONOMY OF PUBLIC SECTOR ABSENCE:EXPERIMENTAL EVIDENCE FROM PAKISTAN
Michael CallenSaad Gulzar
Syed Ali HasanainMuhammad Yasir Khan
Working Paper 22340http://www.nber.org/papers/w22340
NATIONAL BUREAU OF ECONOMIC RESEARCH1050 Massachusetts Avenue
Cambridge, MA 02138June 2016, Revised April 2018
A previous version of this paper was circulated under the title “The Political Economy of Public Sector Absence: Experimental Evidence from Pakistan.” We thank Farasat Iqbal for championing and implementing the project and Asim Fayaz and Zubair Bhatti for designing the smartphone monitoring program. Support is generously provided by the International Growth Centre (IGC) political economy program, the IGC Pakistan Country Office, and the University of California Office of the President Lab Fees Research Program Grant #235855. Callen was supported by grant #FA9550- 09-1-0314 from the Air Force Office of Scientific Research. We thank Erlend Berg, Eli Berman, Leonardo Bursztyn, Ali Cheema, Melissa Dell, Ruben Enikolopov, Barbara Geddes, Naved Hamid, Gordon Hanson, Michael Kremer, Asim Ijaz Khwaja, Craig McIntosh, Ijaz Nabi, Aprajit Mahajan, Monica Martinez-Bravo, Benjamin A. Olken, Gerard Padro -i-Miquel, Karthik Muralidharan, Rohini Pande, Daniel N. Posner, Ronald Rogowski, Jacob N. Shapiro, Christopher Woodruff, Oliver Vanden Eynde, David Yanagizawa-Drott, Ekaterina Zhuravskaya and various seminar participants for insightful comments. Excellent research assistance was provided by Muhammad Zia Mehmood and Haseeb Ali. We thank Ali Cheema and Farooq Naseer for kindly sharing their data on election outcomes. The views expressed herein are those of the authors and do not necessarily reflect the views of the National Bureau of Economic Research.
NBER working papers are circulated for discussion and comment purposes. They have not been peer-reviewed or been subject to the review by the NBER Board of Directors that accompanies official NBER publications.
© 2016 by Michael Callen, Saad Gulzar, Syed Ali Hasanain, and Muhammad Yasir Khan. All rights reserved. Short sections of text, not to exceed two paragraphs, may be quoted without explicit permission provided that full credit, including © notice, is given to the source.

The Political Economy of Public Sector Absence: Experimental Evidence from Pakistan Michael Callen, Saad Gulzar, Syed Ali Hasanain, and Muhammad Yasir KhanNBER Working Paper No. 22340June 2016, Revised April 2018JEL No. D02,D72,D73
ABSTRACT
Public sector absenteeism undermines service delivery in many developing countries. We report results from an at-scale randomized control evaluation in Punjab, Pakistan of a reform designed to address this problem. The reform affects healthcare for 100 million citizens across 297 political constituencies. It equips government inspectors with a smartphone monitoring system and leads to a 76% increase in inspections. However, the surge in inspections does not always translate into increased doctor attendance. The scale of the experiment permits an investigation into the mechanisms underlying this result. We find that experimentally increasing the salience of doctor absence when communicating inspection reports to senior policymakers improves subsequent doctor attendance. Next, we find that both the reform and the communication of information to senior officials are more impactful in politically competitive constituencies. Our results suggest that interactions between politicians and bureaucrats might play a critical role in shaping the success or failure of reforms.
Michael CallenRady School of ManagementUniversity of California, San DiegoWells Fargo Hall, Room 4W1049500 Gilman Drive #0553La Jolla, CA 92093-0553and [email protected]
Saad Gulzar616 Serra StreetEncina Hall West, Room 100616 Serra Street, Encina Hall WestStanford, CA [email protected]
Syed Ali HasanainLahore University of Management Sciences Sector U, DHALahore [email protected]
Muhammad Yasir KhanUC Berkeley Haas School of Business [email protected]
A randomized controlled trials registry entry is available at https://www.socialscienceregistry.org/trials/1329/history/
8624

1 Introduction
Addressing public worker absenteeism is a critical policy challenge across much of the de-
veloping world (Banerjee, Deaton, and Duflo, 2004; Kremer et al., 2005). The magnitude of
the issue is substantial: one in five health providers and one in three education providers are
absent at public clinics and schools across Bangladesh, Ecuador, India, Indonesia, Peru, and
Uganda (Chaudhury et al., 2006). Correspondingly, a substantial body of research in eco-
nomics examines the effects of initiatives aimed at reducing public sector absence,1 finding
mixed results. Banerjee and Duflo (2006) emphasize this point in a literature review, stating
“it is hard to resist the conclusion that most attempts to boost the presence of teachers and
health providers have not been particularly successful.”
Our objective in this paper is to understand what determines the success of such reforms.
We study a province-wide reform designed to reduce health worker absence in Punjab, Pak-
istan. This is a setting where reform is very much needed—at baseline doctors are absent
from rural health clinics across Punjab over two thirds of the time. Meanwhile, these clinics
are the first line of defense for tens of millions of rural Pakistanis for all preventative health
care, antenatal services, and basic outpatient services. The reform has two key elements.
First, already-existing government health inspectors are equipped with smartphones. An
application on the phones replaces paper logs and requires timestamps, GPS-stamps, and
pictures of inspectors and all staff marked present for each visit to a rural health clinic. Sec-
ond, all of the information captured by the inspector, such as the availability of medicines
and the presence of key personnel, is aggregated in a user-friendly online dashboard, which
is visible to and frequently referenced by senior health officials.
We evaluate the reform using a large-scale randomized control trial in which half of the
districts of Punjab were randomly selected for the reform while the other half continued
according to the status quo. We find that rural health clinics in treatment districts see
1See for instance: Banerjee and Duflo (2006); Banerjee, Duflo, and Glennerster (2008); Olken and Pande(2012); Dhaliwal and Hanna (2014).
1

inspection rates nearly double, but that these additional inspections and associated increase
in attendance data for senior health officials did not decrease doctor absenteeism.
Aware of the mixed results in the literature, we anticipated the reform could fail, and
so constructed a research design that would allow us to make progress on understanding
why. We focus specifically on whether elected politicians attempt to undermine the reform
by interfering with its implementation. Policymakers pointed to interference by politicians
as a key reason the reform might fail, indicating that they may have a stake in preserving
the status quo.
To this end, we begin by presenting three suggestive facts consistent with political in-
terference in the health bureaucracy prior to our reform. First, through interviews with all
senior health officials in Punjab, we find that forty-four percent of these officials report a
politician interfering in their decision to sanction an underperforming employee in the previ-
ous year. Second, we find more reports of political interference in less competitive electoral
districts. In the least-competitive tercile of Punjab’s 297 Provincial Assembly constituencies
(as measured by the Herfindahl index of vote shares in the most recent election), senior
health officials report an average of 4.06 instances of interference, while in the most compet-
itive tercile, they report 1.9 instances (p < 0.05). Third, we document a strong correlation
between political competition and absenteeism. We use the GPS coordinates of health facili-
ties and independently collected unbiased data on doctor absence to obtain spatial regression
discontinuity estimates of the relation between political competition and doctor attendance.
Moving from a constituency at the 5th percentile of the Herfindahl index to one at the 95th
percentile is associated with a reduction in attendance of 40.5 percentage points (p < 0.1).
Similarly, we find that doctors who report a direct connection to the local Member of the
Provincial Assembly are 21 percentage points less likely to be at their clinic during normal
working hours (p < 0.05). We are careful in not interpreting these claims as causal. We do
not randomize political competition or doctor connections. However, spatial controls help us
rule out several alternate explanations. Taken together, these facts are consistent with the
2

view of the policymakers who championed the project: there is much to suggest politicians
directly influence health service delivery, even when this is explicitly the responsibility of
bureaucrats.
Next, having established the existence of political interference and its correlation with
absenteeism in the cross-section, we document that the average treatment effect of the smart-
phone monitoring reform on doctor attendance masks important heterogeneity. We find that
while the program increases health inspections uniformly across constituencies, doctors only
respond to the increase in inspections in the most politically competitive tercile of con-
stituencies, where their attendance probability increases by over thirty percent. By contrast,
the reform appears to have weakly negative, though insignificant effects in the second tercile
(-8 percentage points) and in the least competitive tercile (-3 percentage points).
In general, when policy reforms designed to constrain rent-seeking span a broad set
of heterogeneous political constituencies, there is good reason to check for heterogeneity.
Often, politicians can either formally or informally exert substantial leverage over reform
implementation and, in many cases, have incentives to do so. Indeed, several recent studies
take this approach (Chandra, 2007; Robinson and Verdier, 2013; Hollibaugh, Horton, and
Lewis, 2014).
Our setting, however, allows more direct evaluation of whether politicians interfere with
reform implementation. Specifically, we manipulate the salience of doctor absence in online
data visualizations presented to senior officials who are responsible for the entire health
apparatus in their respective districts. We select an arbitrary threshold at which facilities
are flagged as suffering from exceptionally low attendance. All health reports that meet this
threshold are highlighted in red in a web portal (henceforth termed a ‘dashboard’) where
data are summarized and presented to senior officials. This allows us to compare subsequent
absence rates in flagged versus unflagged facilities. To our knowledge, this constitutes the
first experimental test of whether providing data to policy actors changes their behavior.
We find that flagging a facility increases subsequent doctor attendance by 27 percentage
3

points, supporting the idea that one channel through which the smartphone program works
is the senior bureaucracy. Next, we find that while flagging a facility increases subsequent
attendance by 32 percentage points in the most politically competitive third of constituencies,
flagging has no apparent effect in the least competitive tercile (p-value of the difference in
estimated effects is 0.062). This is consistent with results in Bertrand et al. (2015) indicating
that senior officials in Northcote-Trevelyan style bureaucracies have considerable influence.
It appears that senior health officials can respond to reports of absence by getting doctors
to go to work in competitive constituencies, but not in uncompetitive ones.
Because our initiative spans 297 constituencies which vary broadly in their local political
circumstances, our setting is well-suited to studying the determinants of reform success.
We also collect survey data from officials at all levels of the bureaucracy, allowing them to
describe whether and how politicians interfere in the process and allowing us to measure the
links between doctors and politicians. In addition, we embed a second experiment in our
broader evaluation, in which we manipulate the dashboard presentations of data on worker
absence. If political interference is a major obstacle to the healthy functioning of the reform,
then reports of absence from constituencies with powerful politicians should result in no
action, whereas if local politicians are weak then reports of absence should result in better
action. The combination of our experiment and a substantial investment in primary data
collection allow a range of tests to examine whether interference by politicians affects the
quality of the reform. Every test we can construct supports the view that local politicians
play a major role in determining the reform’s success.
This idea has antecedents in a long literature on interactions between politicians and
bureaucrats. The literature provides several reasons a politician may seek to interfere when
reforms affect public sector jobs. First, government jobs are ideal for patronage: they can be
targeted to individuals, provide a credible stream of benefits, and the terms of the job—such
as the wage, posting, and reporting requirements—can often be changed easily (Robinson
and Verdier, 2013; Hollibaugh, Horton, and Lewis, 2014). Indeed, this observation has a
4

long history in political science (Sorauf, 1956; Wilson, 1961; Johnston, 1979; Chubb, 1983;
Golden, 2003; Calvo and Murillo, 2004; Meyer-Sahling, 2006; Chandra, 2007; Kitschelt and
Wilkinson, 2007; Brusco et al., 2013). The use of public jobs as patronage is also a key
vote-buying strategy (Gans-Morse, Mazzuca, and Nichter, 2014). Interference can under-
mine reforms and negatively impact bureaucratic performance (Stokes, 2005; Brusco et al.,
2013; Lewis, 2007, 2011; Muralidharan et al., 2017). Naturally, a politicians incentives to
engage in such practices are shaped by and will carry implications for the degree of local
political competition (Lindbeck and Weibull, 1987; Besley and Burgess, 2002; Careaga and
Weingast, 2003; Rodden, 2006; Gordon and Huber, 2007; Kitschelt and Wilkinson, 2007;
Raffler, 2016; Grossman and Michelitch, 2017). More broadly, our paper adds to the litera-
ture on the benefits of political connectedness (Callen and Long, 2014; Brollo and Nannicini,
2012; Sukhtankar, 2012; Albouy, 2013; Ansolabehere and Snyder, 2006; Khwaja and Mian,
2005; Fisman, 2001; Ferguson and Voth, 2008). It also appears that these practices may be
particularly problematic in South Asia (Chandra, 2007; Mohmand, 2011, 2014), where our
study is carried out.
More broadly, a substantial recent body of empirical research examines reforms aimed
at making states more effective by reforming policies affecting selection, incentives, and
management in the public sector.2 Such reforms necessarily happen in a political context,
and politicians may be particularly interested in retaining de facto control of the incentives
public employees face. Our set of experiments provide an example where politicians appear
to shape the effectiveness of a reform designed to change the incentives of public employees.
In addition, our results also contribute to a growing literature that highlights the potential
for technological solutions to large public sector problems, especially when institutionalized
and implemented at scale (Muralidharan, Niehaus, and Sukhtankar, 2014; Banerjee et al.,
2See for instance: Ashraf, Bandiera, and Jack (2014); Ashraf, Bandiera, and Lee (2015); Muralidharanand Sundararaman (2011); de Ree et al. (2016); Muralidharan and Sundararaman (2013); Finan, Olken, andPande (2015); Bertrand et al. (2015); Khan, Khwaja, and Olken (2016); Khwaja, Andrabi, and Das (2016);Rogger and Rasul (2016); Bloom et al. (2015)
5

2014; Dhaliwal and Hanna, 2014). We show that simple automation of data collection and
aggregation through smartphones can have meaningful impacts on the way the business of
the state is carried out. Smartphone monitoring nearly doubled inspections at public clinics
across Punjab. A necessary element for success appears to be the provision of inspector-
level incentives to maintain and use the technology. This was achieved partly because the
system channeled information on usage back to relevant stakeholders. As a result, the
‘Monitoring the Monitors’ program has been rolled out to the entire province of Punjab,
and is replicated in several sectors in the province including education, vaccinations, police,
roads rehabilitation, and sanitation.
We also present, to our knowledge, the first experiment to test whether the presentation
of evidence can impact policy decisions. International donors, governments, and other policy
actors increasingly encourage the use of data and evidence in the design of policy, yet little is
known about whether providing data to policymakers will impact policy outcomes.3 Indeed,
policymakers may face a set of resource, political, or other constraints that limit their ability
to act, no matter how much evidence they are provided (Acemoglu and Robinson, 2012).
Our information salience experiment shows that presenting data in an actionable format to
senior bureaucrats can affect policy outcomes. However, this is not an unconditional result.
Decisions by the senior bureaucracy still occur in a political environment. The dashboard
only increased doctor attendance where local politics permitted senior officials to take action
against doctors.
The paper proceeds as follows. Section 2 provides essential background information
related to the reform. Section 3 introduces the smartphone reform. Section 4 presents our
primary and secondary data. Section 5 goes over the main experimental results, while Section
6 presents results on political interference in the baseline and the smartphone experiment.
Section 7 shows results from the second dashboard experiment. Section 8 concludes the
3A body of research in public administration supports performance-based management in the publicsector (Moynihan and Pandey, 2010).
6

paper.
2 Background
In Punjab province, the provision of health care services is managed by the Department
of Health, which is based at the provincial headquarters in Lahore. There are five major
types of health facilities, and we focus on the lowest tier, called Basic Health Units (BHUs),
which we refer to as ‘clinics’ hereafter. There are 2,496 such clinics in Punjab, almost all
of which exclusively operate in rural and peri-urban areas. Each Basic Health Unit serves
approximately one Union Council, which are the smallest administrative units in Pakistan.
These clinics are designed to be the first stop for patients seeking medical treatment
in government facilities. They provide several services, including outpatient treatments,
neonatal and reproductive healthcare, and vaccinations. Each clinic has a doctor, known as
the Medical Officer, who is supported by a Dispenser, a Lady Health Visitor, a School Health
and Nutrition Supervisor, a Health/Medical Technician, a Midwife, and other ancillary staff.
Officially, clinics are open and all staff are supposed to be present from 8am to 2pm, Monday
through Saturday.
We study Medical Officers who head these rural clinics. These doctors are general prac-
titioners who have completed five years of medical school, and are consequently the most
trained health professionals in rural areas. Doctors are either hired centrally as permanent
employees of the province by the Health Department of Punjab, or on a contractual basis at
the District level by a senior bureaucrat.4 While doctors receive higher income with rising
seniority, their portfolio of duties does not usually increase significantly. Very few doctors
rise through the ranks to become Deputy District Officers (described below): compared to
the 2,496 Medical Officer posts in clinics in the department, there are only about 120 such
senior positions.
4Appendix C details the hiring process.
7

Figure 1: Health Sector Administration in Punjab
Under the umbrella of the Provincial Health Department, district governments are re-
sponsible for managing public clinics. The District Health Department is headed by an
Executive District Officer (EDO), referred to as a ‘senior health official’ hereafter, who re-
ports to the Director General of Health Services and the Secretary of the Health Department
– the health leadership in Lahore. There are 36 senior health officials in Punjab, one for
each district. These officials are supported by several Deputy District Officers, typically one
for each county (along with other staff excluded for brevity). Figure 1 depicts this simplified
health administration hierarchy in Punjab.
The Deputy District Officers, hereon referred to as ‘inspectors’, occupy the lowest position
in the officer cadre of the district health administration. Inspectors have the authority to
punish absent clinic staff by issuing a show-cause notice, which requires staff to explain their
absence to the senior health official. They can also suspend and deny pay to contract staff,
including doctors. In severe cases of persistent absence, staff can also be transferred to less
desirable locations. The senior health official relies entirely on these inspectors to ensure
staff presence.
Inspectors are also required to visit every clinic at least once a month and record infor-
8

mation collected on a standard form. During the visit, they fill out a paper form at each
facility, collecting data on utilization, resource availability, and worker absence. These forms
are provided in Appendix G. Once collected, the reports are brought to a central district
facility, manually entered into a spreadsheet, and aggregated into a monthly report for senior
health officials.
This inspection system limits the ability of senior health officials to monitor their in-
spectors. It affords only limited visibility into the inspectors’ activities. Compounding this
problem, senior health officials have only two weak means of sanctioning an inspector: is-
suing a verbal reprimand or, in serious cases, sending a written request for investigation to
provincial authorities. The investigation process is long, highly bureaucratic, and prone to
interference by elected politicians.
The career concerns of senior health officials and inspectors are also fundamentally dif-
ferent. The senior health official reports directly to senior provincial authorities who face
few bureaucratic hurdles to sanctioning and holding him directly accountable for service de-
livery in his district. Performance for the senior health official is commonly rewarded with
appointment to a higher office. In contrast, inspectors are neither officially nor practically
accountable for health service delivery. Appointees to this position have to serve for several
years before they are considered for promotion to the next level in the district, and they
rarely ascend to leadership positions.
These considerations bear critically on how we should expect health officials to react to
new technologies which make monitoring easier. First, senior health officials might embrace
a smartphone monitoring system because it makes it easier for them to deliver services
effectively, and they benefit professionally from getting their inspectors to do a better job.
Correspondingly, this could explain why additional monitoring could lead to an increase in
the rate of inspections. It also provides a logic for why senior health officials might respond
to reports of absence by encouraging doctors to go to work.
9

3 The Monitoring the Monitors Program
We partner with the government to design and evaluate the “Monitoring the Monitors”
program. The policy objectives of this program were to collect actionable data and improve
inspector compliance with monitoring duties. Under this program the government replaced
the existing paper-based monitoring system with an Android-based smartphone application,
which collected the same data as the paper forms and transmitted them instantly to a central
online dashboard. Appendix H provides the training manual for the mobile application
provided to inspectors and Appendix I provides the training manual provided to senior
health officials to assist them in using the dashboard.
The dashboard provided summary statistics, charts, and graphs in a format designed
in collaboration with senior health officials. Inspections were also geotagged, timestamped,
and complemented with facility staff photos to check for reliability. The geotagging and
timestamping features were designed to increase monitoring of inspectors while the facility
staff photos were intended to increase monitoring of doctors. Figure 2, Panel A, shows one
view of the online dashboard. It presents a bar chart giving the number of inspections as
a proportion of total assigned inspections made by each of the treatment districts, allowing
the Health Secretary to compare performance across districts. Panel B provides an alternate
view available to senior officials—a summary spreadsheet where each row corresponds to
a different facility visit. In Section 3 below, we provide full details of our experimental
evaluation of the “Monitoring the Monitors” program. Our design allows us to estimate
the effect of providing phones on inspections and on doctor attendance, and, separately, the
effect of providing information to senior officials via the dashboard.
The intervention channels information about inspections to district-level health officials;
randomization at a finer level is therefore very likely to generate externalities. The Depart-
ment of Health also determined that sub-district randomization was not administratively
feasible. Cluster randomization also allays some concerns about externalities generated by
interactions between inspectors in the same district. All inspectors in a district are required
10

Panel A: Summary of Inspection Compliance by District
Panel B: Highlighting Underperforming Facilities
Figure 2: Online Dashboard Screenshots
11

to attend monthly meetings. While they typically have frequent interactions within districts,
these relations are much weaker across districts.
Our experimental sample comprises all health facilities in 35 of the 36 districts in Punjab.
We remove Khanewal from the experimental sample as that district served as the location
for our pilot. While we have administrative data for all clinics, we monitor a subsample
of 850 clinics using independent inspections. This sample is drawn to be representative of
clinics in the province. We randomly implemented the smartphone program in 18 of the
35 districts in our experimental sample. In assigning treatment, we stratified on baseline
staff attendance and the number of clinics in a district to ensure a roughly even number of
facilities in treatment and control. Figure 3 depicts control and treatment districts.
Figure 3: Treatment and Control Districts
12

4 Data
We use three sources of data: 1) interviews with the universe of senior health officials and
inspectors; 2) attendance audits and interviews of doctors in a representative sample of
clinics; and 3) data on election outcomes.
4.1 Interviews of Senior Health Officials and Inspectors
We interviewed all senior health officials in Punjab. These included 34 of the 36 Executive
District Officers in Punjab,5 as well as the 116 posted inspectors. All staff were interviewed at
their offices or the district headquarters to ensure a high response rate. The interview focused
on questions about day-to-day activities of senior health officials and inspectors, including a
time-use survey, as well as questions on political interference in the health bureaucracy.
4.2 Representative Survey of Clinics
We collected primary data on a representative sample of 850 of the 2,496 clinics in Punjab.
This sample represents 34 percent of the population. Clinics were selected randomly using an
Equal Probability of Selection (EPS) design, stratified on district and distance between the
district headquarters and the clinic. Our estimates of absence are thus self-weighting, and no
sampling corrections are used in the analysis.6 All districts in Punjab except Khanewal are
represented in our data. To our knowledge, this is the first representative survey of clinics
in Punjab. Figure 4, Panel A, provides a map of the Basic Health Units in our experimental
sample along with the different Provincial Assembly constituencies in Punjab.
Surveyors made three unannounced visits to these facilities: first in November 2011,
then in June 2012, and finally in October 2012. Our survey teams were trained by senior
5EDO Khanewal was not interviewed as Khanewal is the pilot district for our study, while EDO Faisal-abad was not available for interview.
6We sampled an equal proportion of clinics within each stratum to preserve an equal probability ofselection.
13

enumerators and our team members at four regional hubs. Following these trainings, the
teams made visits to clinics in their assigned districts and remained in regular contact with
their team leaders and our research team. Surveys took three weeks to field in each wave.
During the unannounced visits, our team collected information on doctor absenteeism.
Each enumerator was asked to fill an attendance sheet for the staff at the clinic at the end
of the interview and in private. Doctors are officially required to be present and see patients
at the clinic. An unannounced visit therefore captures the official work assigned to doctors.
This measure was whetted by our government partners.
Importantly, during our doctor interviews, we collected data on doctors’ tenure in their
post, the distance of their post from their hometown, and whether they know the local
Member of the Provincial Assembly (MPA) personally.7 To ensure sampling of doctors who
were not present at their clinics during any of our three visits, we pursued the absent doctors
until we could find them and interview them. We detail this process in Appendix A2.
4.3 Election Data
We study elections for seats in the Punjab Provincial Assembly, a legislative body comprising
371 members, including general and reserved seats.8 Punjab, a province of 100 million
citizens, follows a party-based single-member district electoral system. We make use of
election data for the 2008 Punjab Provincial Assembly elections.9 These data provide vote
totals by constituency for all candidates running in the election. In cases of by-elections, we
consider data from the election that most immediately preceded our program. Appendix B
describes the protocol for identifying the constituency corresponding to each clinic. Figure
7Connections to politicians are less likely for other staff posted at the clinic. For the empirical analysisbelow, we generate a time invariant indicator variable that equals 0 unless doctors report they know thelocal politician in all the waves where this question is answered, in which case, it is coded as 1.
8“About Assembly,” Provincial Assembly of the Punjab, Retrieved on Sep 7, 2013 fromhttp://www.pap.gov.pk/index.php/faqs/listfaqs/en/12.
9We thank Ali Cheema and Farooq Naseer for kindly sharing this data.
14

Panel A: Locations of Basic Health Units in the Experimental Sample Panel B: Electoral Competitiveness in Punjab (Herfindahl Index)
Herfindahl Index(0.37,0.52](0.32,0.37][0.04,0.32]Not in sample
Figure 4: Experimental Sample and 2008 Political Outcomes by ConstituencyNotes: Drawn borders demarcate Provincial Assembly constituencies in Punjab. The Herfindahl index in
Panel B is computed as the sum of squared candidate vote shares in each provincial assembly constituency
during 2008 elections
4, Panel B, shows the degree of political competition, as measured by the Party Herfindahl
Index, across Punjab. Higher values of the index correspond to lower political competition.
Focusing on the provincial legislature is appropriate because a lot of services, including
public health, were devolved to the provincial level under the Eighteenth Amendment to the
Constitution of Pakistan.
5 Smartphone Monitoring Experiment Results
We now present results from our experimental evaluation of the “Monitoring the Monitors”
program that randomized the smartphone treatment at the district level. While stratifying
on the share of staff present during our baseline interview achieved balance for five of the six
categories of staff that are supposed to be present at clinics, we have a statistically significant
15

imbalance for doctors.10
We estimate regressions using the following specification:
Ydit = α + βTreatmentdit + δt + εdit (1)
Ydit is official inspection or doctor attendance, and Treatmentdit is a variable equal to 1
for treated districts, where i refers to the clinic, d refers to the district, and t to the survey
wave. δ are survey wave fixed effects. We cluster all standard errors at the district level.
In some cases we also estimate a differences-in-difference specification:
Ydit = α + β1Treatmentdit + β2Postdit + β3Treatmentdit × Postdit + δt + εdit (2)
where Postdit equals 1 for post-treatment periods (waves 2 and 3), and 0 otherwise. In
this specification, the coefficient of interest is β3.
With only 35 districts in our sample, we account for potential small sample bias in
inference by making use of Fisher’s exact p-values (Fisher, 1935). The p-values generated
with this permutation test do not require an asymptotic limiting distribution for inference
(Gerber and Green, 2012). This test assumes a null of no treatment effect for any unit.
We perform this test by creating a vector of artificial treatment assignments using a random
number generator. For each treatment assignment, a corresponding artificial treatment effect
is generated. The effect, estimated using the actual treatment assignment, is then compared
against the 1,000 artificial treatment effects. The p-value is the share of artificial treatment
effects that are larger than the actual treatment effect. For the main treatment effect on
inspection rates, we can find no artificial assignment which generates a larger effect than
that created by the actual assignment.
10Figure A7 reports a long time series of administrative data on doctor attendance from paper records.We find that the difference in levels does not reflect a difference in pre-treatment trends, allaying someconcerns that our fixed effects difference-in-difference estimates are not causal.
16

5.1 Results on Inspector Performance
We begin by examining the impact of treatment on inspectors, where the program provides
the sharpest incentives. These results are presented in Table 1. Panel A reports the effect of
treatment on inspections. We find that treatment raises the share of facilities in our sample
that were inspected in the previous month from 24.2 percent to 42.6 percent. Breaking this
up into the two waves of collection, we find comparable effects, though there is some evidence
that the effect of treatment had attenuated by October 2012, a year after the introduction
of the program.11
5.2 Results on Inspector Time Use
The interpretation of the above result is dependent on whether the additional time required
to conduct these visits comes at the cost of more pressing tasks that the supervisors are
assigning to these inspectors (although they are almost exclusively tasked with performing
inspections). In such cases, the increase in shirking penalties, brought about by our program,
may drive the inspectors away from other potential functions. In the ideal scenario, the cell
phone treatment should be driving shirking inspectors to do their job.
We test for this by administering a time-use survey on the universe of health inspectors
in Punjab. Respondents were asked to list the time they spent on a variety of tasks during
the two working days prior to our survey.12 We interviewed inspectors during February and
March 2013, a period when the effects of our program were already attenuating. Therefore,
any treatment effects on time use would be understated.
11Figure A3 in the Appendix shows that inspector boundaries do not overlap in a consistent manner withpolitical constituencies. As a result it is difficult to study heterogeneous effects by inspected connectednessand political competition.
12Inspectors picked up to three out of 10 possible categories of work to account for each hour between8am and 6pm. In addition, they were asked to identify when they arrived for, and left from work. We thankAsim Ijaz Khwaja for suggesting that we track this.
17

We present our analysis in Table 1 Panel B.13 We note three results: first, inspectors in
treatment districts report working an extra 74 minutes overall. Second, treatment inspectors
report spending an additional 44 minutes on inspections. Third, there are no statistically
significant differences between treatment and control inspectors in the time they spend on
official breaks, clinic management in the headquarters, or duties unrelated to clinic manage-
ment. These results suggest that inspectors are not substituting effort away from other tasks.
Our results on greater inspections may be coming from greater effort exerted by inspectors.
Table 1: The Effect of Smartphone Monitoring
p-value p-valueTreatment Control Difference Mean Diff Exact Test
(1) (2) (3) (4) (5)
Panel A: Treatment Effects on the Rate of Inspections
Facility Inspected in the Previous Month (=1) 0.426 0.242 0.184 0.008 0.001(0.048) (0.044) (0.065)
# of Observations 759 761
Wave 2 only (June 2012) 0.519 0.253 0.266 0.002 0.003(0.063) (0.047) (0.079)
# of Observations 366 372
Wave 3 only (October 2012) 0.338 0.231 0.107 0.175 0.057(0.053) (0.056) (0.077)
# of Observations 393 389
Panel B: Treatment Effects on Time-Use of Inspectors
Breaks During Official Duty 16.189 22.500 -6.311 0.338 0.716(4.993) (4.151) (6.494)
(i) Total Time Inspecting 121.189 76.961 44.228 0.105 0.073(24.152) (10.966) (26.525)
(ii) Total Time Managing in Head Office 47.828 69.485 -21.657 0.273 0.808(9.440) (16.976) (19.424)
(iii) Duty Unrelated to Facility Management 281.803 229.975 51.828 0.258 0.121(30.167) (33.481) (45.067)
Total Minutes Working (i) + (ii) + (iii) 450.820 376.422 74.398 0.082 0.045(18.380) (37.163) (41.460)
# of Observations 122 102
Notes: This table reports average treatment effects of the ‘Monitoring the Monitors’ program on the number of inspections (Panel A) and the
time-use patterns of inspectors (Panel B). The unit of observation in Panel A is the clinic, and data come from primary unannounced surveys after
the treatment was launched (wave 2 and 3). The dependent variable is an indicator variable that equals 1 if an inspector visited a clinic within a
month prior to the survey, and 0 otherwise. The regression reports differences between treatment and control clinics. P-values reported in column
(4) are for the hypothesis test that the treatment had no impact. Column (5) reports the Fisher Exact Test p-values that places column (4) p-values
in the distribution of p-values obtained from a 1000 random draws of treatment assignment. Data for results in Panel B come from the survey of the
universe of health inspectors in Punjab. The unit of observation for Panel B are these inspectors. Column (1) shows the average, in minutes, of how
inspectors in treatment districts spent their time over the last two days on several tasks. Column (2) shows the same for control districts. Column
(3) reports the difference between the two. Standard errors clustered at the district level are reported in parentheses.
13Table A11 presents more detailed results for the timeuse data.
18

5.3 Treatment Effects on Doctors
The results above suggest that the smartphone program created a substantial increase in
the volume of inspections. If doctors were aware of this increase, it is possible that the
program may have also increased assigned doctor attendance.14 We test for this difference
in Table 2 using a differences in difference specification to account for the baseline imbalance
in doctor attendance. We find that the smartphone treatment has no impact on average
doctor attendance.
Table 2: The Effect of Smartphone Monitoring on Doctors
Difference in differences(1)
Monitoring -0.005(0.068)[0.546]
Mean in Controls 0.424# Districts 35# Clinics 670# Observations 1528R-Squared 0.009Only Clinics with Doctors Yes
Notes: This table reports average treatment effects of the ‘Mon-
itoring the Monitors’ program on the doctor attendance using a
difference-in-differences. The unit of observation is the clinic, and
data come from primary unannounced surveys after the treat-
ment was launched. The dependent variable is an indicator vari-
able that equals 1 if an assigned doctor was present at the clinic
during an announced visit, and 0 otherwise. Standard errors
clustered at the district level are in parentheses. Square brackets
report the Fisher Exact Test p-values that places the ‘true’ treat-
ment assignment p-values in the distribution of p-values obtained
from a 1000 random draws of treatment assignment.
14We recognize that doctor assignment may itself by an outcome of interest. However, this was a dimensionof outcomes that was purposefully suppressed by the government because of the Monitoring the Monitorsprogram. We confirm this by testing if our treatment had an impact on the probability of doctor assignment,and as expected do not find any evidence for this. The difference-in-differences coefficient is 0.020 with thep-value of 0.57. Results are available on request.
19
6 Political Interference and Doctor Attendance
This section examines how politicians affect doctor attendance in Punjab. First, we report
summary statistics on political interference in senior officials’ sanctions of doctors. Second,
we use a spatial regression discontinuity to test for a link between political competition and
doctor attendance. Finally, we examine whether connections between doctors and politicians
are related to doctor attendance.
6.1 Previous work on public sector jobs
Politicians across much of the developing world, and particularly in South Asia, have consid-
erable ability and willingness to channel state resources Chandra (2007); Mohmand (2011,
2014).
Political interference in the bureaucracy may exist for several reasons. First, government
jobs are ideal for patronage: they can be targeted to individuals, provide a credible stream of
benefits, and the terms of the job—such as the wage, posting, and reporting requirements—
can often be changed easily (Robinson and Verdier, 2013; Hollibaugh, Horton, and Lewis,
2014). This observation has a long history in the political science literature (Sorauf, 1956;
Wilson, 1961; Johnston, 1979; Chubb, 1983; Golden, 2003; Calvo and Murillo, 2004; Meyer-
Sahling, 2006; Chandra, 2007; Kitschelt and Wilkinson, 2007; Brusco et al., 2013; ?). Second,
government jobs represent a subset of possible vote-buying strategies available to politicians
(Gans-Morse, Mazzuca, and Nichter, 2014). The term for such positions—sinecure—has its
etymological origins in the medieval church, where it signified a position without (sine) the
care (cara) of souls, and described positions that involved little or no actual work.
Understanding the reasons for this interference is important because of political appoint-
ments can have deleterious consequences for bureaucratic performance (Stokes, 2005; Brusco
et al., 2013; Lewis, 2007, 2011; Muralidharan et al., 2017). First, a politician’s willingness
to provide patronage to public sector employees will depend on the degree to which he or
20

she faces pressure in the form of political competition (Lindbeck and Weibull, 1987; Besley
and Burgess, 2002; Careaga and Weingast, 2003; Rodden, 2006; Gordon and Huber, 2007;
Kitschelt and Wilkinson, 2007; Raffler, 2016). Greater political competition should deter
patronage. As a consequence, the impacts of policy reform to address bureaucratic perfor-
mance should be greatest where political competition is high. The second factor we consider
is whether politicians are most likely to provide patronage to bureaucrats with whom they
share connections. A broad literature points to the relevance of connections in a number
of domains. In political science, elite politicians benefit more from election fraud (Callen
and Long, 2014), higher funds during election years (Brollo and Nannicini, 2012; Sukhtankar,
2012) and more transfers to connected areas (Albouy, 2013; Ansolabehere and Snyder, 2006).
In economics, firms receive more loans (Khwaja and Mian, 2005), bailouts (?), and enjoy
higher share and stock prices (Fisman, 2001; Ferguson and Voth, 2008). Given this, we
examine whether political connections are relevant in our context.
6.2 Incidence of Political Interference
Influence over public sector positions provides politicians two means of patronage. First,
politicians help health officials obtain postings in their region of choice, which is often their
home county. Speculatively, we show in Table A5 that doctors who know politicians are
more likely to be posted closer to their hometowns. Second, once posted, health officials
also appeal to politicians for protection against suspension, transfer, and other sanctions for
underperformance.
Often, staff members at the clinics belong to politically powerful clans and families. These
staff can provide at least two types of favors to politicians. First, they can activate their
networks to mobilize votes (Wade, 1985). Although we do not measure this mobilization
directly, various experts interviewed for this project independently confirmed that this is a
relevant channel in our context. Indeed, there is evidence that doctors campaign directly for
21

the candidates while serving in their official capacity.15 Second, health staff are commonly
recruited to assist the election commission with drawing up voter lists and overseeing polling
on election day. They can therefore significantly aid or hinder a politician’s election campaign
by biasing voter lists or by turning a blind eye to vote-rigging. Consistent with this, we find
a strong positive relationship between the share of doctors in a constituency who report
knowing their politician in 2011 and whether the incumbent wins re-election in 2013. This
is true even when we control for the degree of competition during the 2008 election. Table
A3 reports these results.
Politicians may also want to provide sinecures to doctors without expectation of any
direct reciprocal benefits. In background interviews, three former senior bureaucrats with
experience in Punjab’s health sector described how candidates needed to publicly demon-
strate influence over the local state machinery to garner voters’ confidence. The local police,
courts and bureaucracy are viewed as being susceptible to elite figures’ influence. Politicians’
ability to influence state machinery, including affecting the posting and promotion of govern-
ment officials, affects voters’ perception of the candidate. In Punjab, citizens are aware that
politicians face limited executive constraints. Consequently, even if doctors do not directly
reciprocate, directing a posting to a doctor provides politicians with an important means of
indicating their power and competence.
Table 3 reports summary statistics on self-reported incidents of pressure experienced by
inspectors and senior health officials. We asked the respondents to report the number of
instances where a person of influence pressured either their colleague or themselves into a)
not taking action against doctors or other staff that were performing unsatisfactorily in their
county or district, or b) assigning doctors or other staff to their preferred posting. Forty
percent of officials report experiencing this type of interference and 32 percent of all respon-
dents report pressure coming from elected Members of Provincial Assemblies, politicians
15Figures A1 and A2 provide tweets by an election monitoring organization, the Free and Fair ElectionsNetwork (FAFEN), of doctors campaigning in their official capacity on behalf of politicians.
22

whose behavior we focus on in this paper.
More speculatively, in Appendix D we find that political interference occurs more often in
less politically competitive constituencies. Broadly, this suggests that politicians who have
carved out strongholds are more likely to try to influence health officials. There are a number
of reasons such a correlation might exist, but it suggests the possibility that politicians might
exert control over bureaucrats as part of a political strategy.
Table 3: Political Interference in Health Bureaucracy
Variable Mean SD N
Panel A: Senior Officials and InspectorsEver influenced by Any Powerful Actor 0.4 0.492 150Ever Influenced by Provincial Assembly Member 0.322 0.469 149Instances of Interference by Provincial Assembly Member 2.786 6.158 140
Panel B: Senior Officials OnlyEver influenced by Any Powerful Actor 0.441 0.504 34Ever Influenced by Provincial Assembly Member 0.441 0.504 34Instances of Interference by Provincial Assembly Member 4.000 7.141 29
Panel C: Inspectors OnlyEver influenced by Any Powerful Actor 0.388 0.489 116Ever Influenced by Provincial Assembly Member 0.287 0.454 115Instances of Interference by Provincial Assembly Member 2.468 5.87 111
Notes: This table reports the frequency of interference by politicians in decisions of senior
health bureaucrats. Data come from a survey of the universe of senior health bureaucrats and
inspectors in Punjab. For each panel, the first variable is an indicator variable for whether the
bureaucrat was influenced by any powerful actor to either (a) not take action against doctors
or other staff who were performing unsatisfactorily in their jurisdiction (county) or (b) assign
doctors to their preferred posting in the previous two years. The second variable measures
the same, but restricts attention to influence by provincial assembly politicians, the focus of
our study. The third variable is a count of the number of times that bureaucrats report that
Members of the Provincial Assembly pressured them to either (a) not take action against doctors
or other staff that were performing unsatisfactorily in their jurisdiction or (b) assign doctors to
their preferred posting in the previous two years. Of the 150 Senior Officials and Inspectors in
our sample, 149 provided responses to this question. We drop nine reports which indicate more
than 100 instances of interference (95th percentile). Table A7 presents the data without this
restriction. Panel A reports results for all bureaucrats in the sample, while Panel B disaggregates
them by Executive District Officers and Deputy District Officers. Panel C reports the results
only for Inspectors.
23

6.3 The Effect of Connections and Political Competition on At-
tendance
Next, we test whether the degree of political competition affects doctor attendance. We also
use our data on connections between doctors and politicians to examine whether connected
doctors are at work less often. For this analysis, we restrict ourselves to control districts to
avoid reporting correlations induced by our treatment.
Table A1 summarizes the data. We can see that doctor attendance in our control districts
is low. While our visits took place during normal operating hours, we were able to locate
doctors in only 22.5 percent of our visits. All clinics are supposed to have doctors posted.
However, because of a combination of shortage of doctors, a lack of interest in rural postings,
and perhaps misreporting to disguise absence, we find that only 53.1 percent of clinics have
doctors posted. Even accounting for this low rate, doctors are present at only 42.1 percent
of actual postings. Of the set of doctors we observe, 25.3 percent report knowing the MPA
personally.16
We now test whether the degree of political competition in a constituency causally affects
doctor attendance. We do so using a geographic regression discontinuity model. This model
allows us to study clinics lying on opposite sides of a constituency boundary. A smooth
function in geographic controls is assumed to absorb local level confounders. Naturally, it
is possible that some constituency-level characteristics are nearly perfectly correlated with
election outcomes, such that differences on either side of the boundary are not exclusively
attributable to differences in political competition. With this caveat in mind, we use the
following spatial regression discontinuity specification:
Presentckw = β1KnowsMPck+β2Pol Compc+β3KnowsMPck×Pol Compc+β4Xckw+f(Xk, Yk)+γw+εckw
(3)
∀ k s.t. Xk, Yk ∈ (−h, h)
16Appendix Table A4 tests whether doctors strategically misreport their connections to politicians byexamining whether the smartphone monitoring program created any changes in how doctors respond to thisquestion. We find that doctors did not change their responses, allaying concerns that these connections aremisreported.
24

where Presentckw is an indicator variable that equals 1 if an assigned doctor at clinic k in
constituency c is present during an unannounced inspection in survey wave w. Knows MPck
is a dummy variable that equals 1 if a doctor reports knowing their provincial assembly
member personally, Pol Compc is the constituency-level Herfindahl Index that proxies for
Political Competition, and Xckw is a vector of additional covariates, including distance to the
county headquarters, as well as one of county, or constituency, fixed effects, to exploit local
variation in doctor attendance. All models also include survey wave fixed effects, denoted
by γw.
The expression f(Xk, Yk) is a flexible function in two dimensions, latitudes (X) and
longitudes (Y ) for every clinic k. We follow Michalopoulos and Papaioannou (2013) and
Dell (2010) in including a smooth function in longitudes X and latitudes Y .17 Adding these
geographic controls in a flexible way helps the regression absorb spatial trends that might
bias estimates. We assign the closest constituency boundary to each clinic in our data so
that we compare clinics that provide the closest approximation to random assignment. For
each clinic in the data, h refers to the distance to the nearest constituency boundary in
kilometers. Finally, to improve precision, clinics are weighted in the regression based on
a Triangular Kernel, where weights increase as the distance to the constituency boundary
decreases. Figure A6 plots p-values of pre-treatment or time-invariant covariates across
several bandwidths. It shows that we have good balance across several covariates.
We report results from this geographic RD as simple well as OLS correlations in Table
4. Column (1) shows the correlation between political competition and doctor attendance.
Going from a perfectly competitive constituency to a perfectly captured one reduces absence
by 62.4 percentage points. This theoretical number will be lower in practice as the Herfindhal
index lies between 0.04 and 0.545 in our sample. Column (2) shows that this effect is robust
to the addition of a flexible function in latitudes and longitudes. Column (3) reports the
geographic RD results. We restrict attention to a bandwidth of 5 kilometers, and weigh
17Here, we set f(Xk, Yk) = x+ y + x2 + y2 + xy + x3 + y3 + x2y + xy2.
25

observations closer to this boundary higher with a triangular kernel. The effect of political
competition is robust.
We also report OLS correlations between doctor connections with the local Member of
the Provincial Assembly and doctor attendance. Columns (4) and (5) show that doctor
attendance is 20.7 and 19.6 percentage points higher respectively for doctors that are not
politically connected to their local MPA .18
We subject the spatial RD estimates in Table 4 column (3) to a number of robustness
checks in addition to confirming balance on pre-treatment covariates in Figure A6. First,
in Figure A4, we consider if our results are robust to changes in bandwidths. Though the
effect is not distinguishable from zero at the 95 percent level, we see that the point estimate
stabilizes in bandwidths larger than 4 kilometers. Next, we check to see if our results are
robust to other specifications. In Figure A5 we utilize linear, quadratic, cubic and quartic
control functions across several bandwidths and observe minimal fluctuations in the point
estimate in bandwidths greater than 4 kilometers.
The results on political competition and political connectedness in the first three columns
of Table 4 are broadly consistent with two separate arguments. First, it may be that in highly
competitive constituencies, politicians face stronger incentives to make sure health services
are effectively delivered. Second, it may be that politicians who can capture constituencies
are more likely to provide jobs to doctors as patronage. Doctors in patronage jobs may be
expected to work less. These are not mutually exclusive theories, and our estimates sug-
gest both may have some relevance in this context. Critically, however, the survey evidence
indicating frequent interference by politicians, coupled with the evidence that doctors con-
nected to politicians work less in columns (4) and (5) provide reason to believe that second
jobs-as-patronage theory most accurately characterizes this environment.
These results carry implications for the effectiveness of our experiment. Politically con-
18Additionally, we show in Appendix Table A5, that connected doctors are more likely to be posted closerto their hometowns.
26
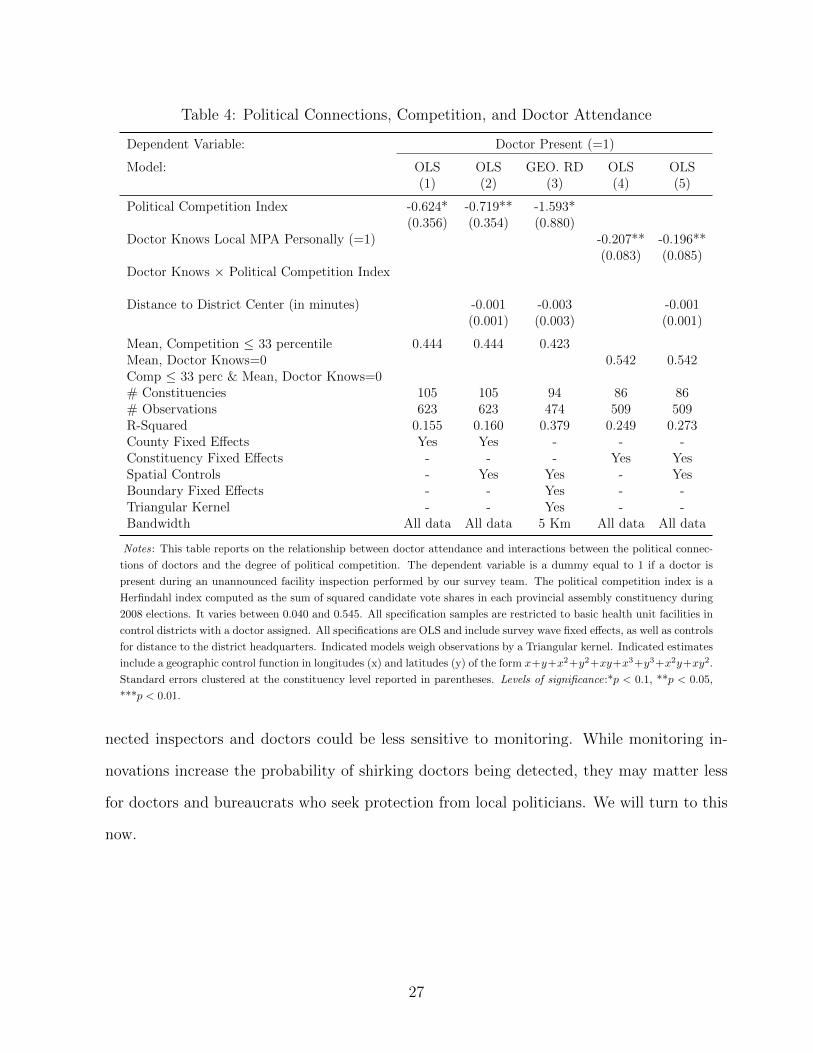
Table 4: Political Connections, Competition, and Doctor Attendance
Dependent Variable: Doctor Present (=1)
Model: OLS OLS GEO. RD OLS OLS(1) (2) (3) (4) (5)
Political Competition Index -0.624* -0.719** -1.593*(0.356) (0.354) (0.880)
Doctor Knows Local MPA Personally (=1) -0.207** -0.196**(0.083) (0.085)
Doctor Knows × Political Competition Index
Distance to District Center (in minutes) -0.001 -0.003 -0.001(0.001) (0.003) (0.001)
Mean, Competition ≤ 33 percentile 0.444 0.444 0.423Mean, Doctor Knows=0 0.542 0.542Comp ≤ 33 perc & Mean, Doctor Knows=0# Constituencies 105 105 94 86 86# Observations 623 623 474 509 509R-Squared 0.155 0.160 0.379 0.249 0.273County Fixed Effects Yes Yes - - -Constituency Fixed Effects - - - Yes YesSpatial Controls - Yes Yes - YesBoundary Fixed Effects - - Yes - -Triangular Kernel - - Yes - -Bandwidth All data All data 5 Km All data All data
Notes: This table reports on the relationship between doctor attendance and interactions between the political connec-
tions of doctors and the degree of political competition. The dependent variable is a dummy equal to 1 if a doctor is
present during an unannounced facility inspection performed by our survey team. The political competition index is a
Herfindahl index computed as the sum of squared candidate vote shares in each provincial assembly constituency during
2008 elections. It varies between 0.040 and 0.545. All specification samples are restricted to basic health unit facilities in
control districts with a doctor assigned. All specifications are OLS and include survey wave fixed effects, as well as controls
for distance to the district headquarters. Indicated models weigh observations by a Triangular kernel. Indicated estimates
include a geographic control function in longitudes (x) and latitudes (y) of the form x+y+x2+y2+xy+x3+y3+x2y+xy2.
Standard errors clustered at the constituency level reported in parentheses. Levels of significance:*p < 0.1, **p < 0.05,
***p < 0.01.
nected inspectors and doctors could be less sensitive to monitoring. While monitoring in-
novations increase the probability of shirking doctors being detected, they may matter less
for doctors and bureaucrats who seek protection from local politicians. We will turn to this
now.
27
6.4 Heterogeneous treatment effects on doctor attendance
In addition, the links between doctor attendance, relationships to politicians, and the degree
of local political competition, reported in Section 6 above, suggest potential heterogeneity in
the impact of the smartphone monitoring program. We use the large degree of variation in
competitiveness across the 240 constituencies in our sample to check for impact heterogeneity.
Table 5 reports these results. Column (1) indicates no average impact on doctor at-
tendance. However, consistent with the results in Section 6, results in columns (2) and (3)
suggest that the program increased doctor attendance in the most competitive tercile of con-
stituencies (with a p < 0.1 using Fisher’s exact test). Importantly, this result suggests that
an increase in the rate of clinic inspections can lead not only to increased doctor attendance,
but also that whether it can do so is a function of the degree of local political competition.
By contrast, while not statistically significant, the point estimates suggest that, if anything,
the program decreased attendance for doctors in constituencies with low degrees of political
competition. One way monitoring might reduce doctor attendance, measured during our
independent inspections (which are not coordinated with the smartphone inspections), is by
allowing inspectors and doctors to collude on both being present during the smartphone in-
spection. If, prior to the introduction of the smartphone monitoring system, inspectors and
doctors did not communicate regarding inspection schedules, but started doing so because
of the program, this might explain the point estimate.19
Columns (4) and (5) check for differences in impact by whether doctors are connected
to their local politician. In the above analysis, we found that connected doctors are less
likely to work. This suggests both that there is greater room for improvement for these
doctors, but also that they may be less likely to react to, and perhaps more likely to try to
undermine, the monitoring system. The estimates indicate this may be the case. The point
estimates, while not statistically significant, suggest a modest positive impact on attendance
19There are 245 clinics in treatment districts where doctors are posted and at least one visit was madeby an inspector using the smartphone system.
28
for unconnected doctors and a negative impact for connected doctors. Testing for equality
of these estimates also suggests they may indeed be different (p = 0.13). While our data do
not provide sufficient precision to be conclusive, the heterogeneity we observe here is broadly
in line with the prior observation that connected doctors appear to perform worse.
One might be concerned that political competition and doctor connectedness are two
variables chosen ex-post to explain heterogeneity. In order to assuage this concern, we apply
the machine-learning honest causal tree methodology to our data (Athey and Imbens, 2016),
explained in Appendix Section E. We find support for selecting of these two variables over
other potential covariates.
7 Dashboard Experiment - Highlighting Absence
The ‘Monitoring the Monitors’ program was designed to increase the flow of information
from doctors and inspectors to senior officials. The program therefore provides information
that is essential for senior bureaucrats to improve the performance of doctors and inspectors.
Increasing the flow of such information is viewed as holding promise for service delivery in
developing countries (Finan, Olken, and Pande, 2015; Banerjee, Duflo, and Glennerster,
2008).
Our setup allows, to our knowledge, the first direct test of whether information communi-
cated to senior officials changes their behavior as measured by performance outcomes.20 Fur-
thermore, we can check whether senior bureaucrats’ ability to correct attendance problems
is related to the degree of political competition and doctor connections in the constituency
20A large number of studies already highlight the substantial potential for monitoring to improve servicedelivery. Olken (2007) finds benefits to road construction audits. Ferraz and Finan (2008) show that auditsof municipal accounts that reveal corruption reduce politicians re-election prospects. Dhaliwal and Hanna(2014) study the impact of biometric monitoring of staff at primary health clinics in India to show animprovement in lower-cadre clinic staff attendance. Banerjee et al. (2014) study an e-governance reform inthe funds flow of a public works program in India (NREGS), and find that the the new platform reducesleakages but does not affect service delivery. Similarly, Muralidharan, Niehaus, and Sukhtankar (2014) studythe effect of a biometrically authenticated e-payments infrastructure on NREGS and show that the programreduces leakages without affecting access to beneficiaries.
29

Table 5: Treatment Effects on Doctors
Dependent Var. Doctor Present (=1)(1) (2) (3) (4) (5)
Monitoring -0.005(0.068)[0.546]
Monitoring x High Political Competition 0.102 0.142(0.063) (0.103)[0.057] [0.068]
Monitoring x Med Political Competition -0.059 -0.083(0.067) (0.085)[0.873] [0.797]
Monitoring x Low Political Competition -0.066 -0.034(0.060) (0.099)[0.900] [0.728]
Monitoring x Doctor Does Not Know Politician 0.011 0.036(0.074) (0.086)[0.494] [0.297]
Monitoring x Doctor Knows Politician -0.104 -0.216(0.150) (0.135)[0.698] [0.878]
Mean in Controls 0.424High Pol. Comp. Mean in Controls 0.202 0.441Med. Pol. Comp. Mean in Controls 0.234 0.405Low Pol. Comp. Mean in Controls 0.240 0.437
Mon. x High = Mon. x Med. (p-value) 0.079 0.070Mon. x High = Mon. x Low. (p-value) 0.027 0.160
Mon. x Does Not Know = Mon. x Knows (p-value) 0.500 0.130Does Not Know Politician Mean in Controls 0.459 0.544Knows Politician Mean in Controls 0.225 0.261
# Districts 35 35 35 35 35# Clinics 670 842 664 850 670# Observations 1528 2398 1518 2416 1528R-Squared 0.009 0.010 0.013 0.015 0.022Only Clinics with Doctors Yes No Yes No Yes
Notes: This table reports on the effects of the ’Monitoring the Monitors’ program on the attendance of doctors.
Columns (2) and (3) look at heterogeneous impacts by the degree of political competition in the constituency where the
reform is implemented and columns (4) and (5) look at heterogeneity by whether the doctor reports being connected to
their local politician. These estimates correspond to specification (2) in the paper, replacing the dependent variable with
an indicator equal to one if a doctor is found to be present during an independent inspection. All regressions include
clinic and survey wave fixed effects. Standard errors clustered at the district level reported in parentheses. Fisher
Exact Test p-values reported in brackets. This test places the ‘true’ treatment assignment p-values in the distribution
of p-values obtained from a 1000 random draws of treatment assignment.
30

in which a clinic is located. In this sense, we can evaluate how political interference in
decision-making of senior health officials may carry consequences for service delivery.
Data collected via the smartphones are aggregated and presented to senior health officials
on an online dashboard. In addition to these officials, this dashboard is visible to the Health
Secretary, and the Director General of Health for Punjab. Figure 2 Panel B provides an
example of a dashboard view visible to the senior health officials.
To test whether actions by senior health officials affect absence, we directly manipulated
data on the dashboard to make certain inspection reports salient. Specifically, we highlighted
in red inspection reports on the dashboard that reported three or more staff (of 7 generally)
to be absent during an unannounced visit to the clinic. The presence of this arbitrary
threshold was not known to anyone but the research team.
We examine whether this manipulation affected subsequent doctor absence in our primary
data with the following specification:
Present Surveyjt = α + β1Flaggedjt−1 +3∑
i=1
δt + ηjt (4)
Present Surveyjt is equal to 1 if the doctor j was absent during an unannounced visit by
our enumerator in wave t, Flaggedit−1 is a dummy variable that equals 1 if the facility was
flagged in red on the dashboard in a window of time prior to the primary survey wave t. For
our primary analysis, we define this window as 11 to 25 days before an unannounced visit by
our field enumerators. Senior health officials only looked at the web dashboard every week or
two, so we would not expect an immediate response from flagging. However, if the window
is made too long, virtually every facility will become flagged and we will lose variation.21
To minimize possible different trends in absence between facilities that were flagged and
not flagged, and thus to isolate the effect of the flagging itself, we restrict our sample to only
facility reports in which either two or three staff were absent.
21We report robustness in all of our flagging results to the choice of the time window, in Figure 5 andAppendix Figure A8.
31
Table 6 reports results from this test. Column (1) reports results without restricting
the data only to instances where either two or three staff members were absent and column
(2) provides results of the same specification with this restriction. The results indicate
that flagging underperformance at a facility has a substantial impact on subsequent doctor
attendance. Flagging improves attendance by 26.6 percent in a subsequent visit by our
enumerators. These results suggest that senior health officials reacted to data provided by
the dashboard by encouraging better doctor attendance. Below we discuss whether these
results, as well as the heterogeneous impacts that we discuss next, might merely reflect
persistence in absence around the flagging threshold by performing a set of placebo tests
around other thresholds.
Column (3) examines directly whether the impact of flagging underperformance depends
on the degree of political competition in the constituency from which the report originates.
It may be that senior health officials can more easily work to correct doctor attendance at
a clinic when that facility is in a competitive constituency. The results suggest that this is
indeed the case. Flagging a clinic on the dashboard in a highly competitive constituency
increases subsequent doctor attendance by 32.3 percentage points. By contrast, flagging a
clinic in an uncompetitive constituency reduces attendance, though the estimate is not sta-
tistically significant. The difference in estimated impacts is, however, statistically significant
at the 10 percent level. Speculatively, district health officials have reported facing pressure
and obstacles from influential persons to sanction underperforming health staff. In our sur-
vey, 44 percent of the senior health officials and 39 percent of the inspectors reported having
faced such pressure. If senior health officials face more political obstacles to sanctioning
absent doctors with stronger patrons, this would explain why the effect of highlighting a
facility as underperforming could be localized to competitive districts.
Column (4) checks to see whether flagging also has differential impacts depending on
whether doctors know their local politician. Mirroring the broader pattern of results, doctors
who do not know their politician are more likely to be at work following an instance of their
32

Table 6: Effect of Flagging Underperformance on the Dashboard
Doctor Present in Unannounced Visit (=1)
(1) (2) (3) (4)
Flagged 0.090 0.266**(0.077) (0.110)
Flagged x High Competition 0.323**(0.152)
Flagged x Med Competition 0.298(0.191)
Flagged x Low Competition -0.214(0.257)
Flagged x Doctor Does Not Know Politician 0.184(0.117)
Flagged x Doctor Knows Politician -0.427(0.303)
Constant 0.409*** 0.277*** 0.259 0.835***(0.045) (0.087) (0.211) (0.279)
Flagged x High Comp = Flagged x Med Comp (p-value) 0.917Flagged x High Comp = Flagged x Low Comp (p-value) 0.095Flagged x Doctor Does Not Know = Flagged x Doctor Knows (p-value) 0.050# Clinics 195 78 78 69# Reports 252 88 88 77R-Squared 0.129 0.340 0.405 0.412District Fixed Effects Yes Yes Yes YesSample Full Discontinuity Discontinuity Discontinuity
Notes: This table reports on the effect on subsequent doctor attendance of flagging on an online dashboard the fact that a clinic had three or more staff
absent to a senior policymaker. Clinics were flagged in red on an online dashboard if three or more of the seven staff were absent in one or more health
inspections of the clinic 11 to 25 days prior to an unannounced visit by our survey enumerators. The Discontinuity sample limits to facility reports in which
either two or three staff were absent (the threshold to trigger the underreporting red flag). In addition, the sample in all columns is limited to Monitoring
the Monitor treatment districts due to the necessity of the web dashboard for flagging clinics. All regressions include survey wave fixed effects. Standard
errors clustered at the clinic level reported in parentheses. *p < 0.1, **p < 0.05, ***p < 0.01.
facility being flagged on the dashboard, while connected doctors are less likely. The difference
between these two estimated effects is significant at the 5 percent level.
We probe the robustness of our result in column (2) of Table 6 in Figure 5 Panel A. We
do so by running the same regression 1300 times varying the window for which we define a
clinic as flagged prior to a primary unannounced visit to a clinic along two dimensions—we
vary the length of the window being used along the x-axis and the delay from when a clinic
is highlighted in red to when the window begins along the y-axis (so for example, a length
of 30 and delay of 15 corresponds to considering a clinic as flagged if it was highlighted in
red anytime 15 to 45 days prior to an unannounced visit). For each window, we report using
a colored pixel the p-value of the hypothesis test of a null effect of flagging on subsequent
doctor attendance. We observe a robust and significant treatment effect of flagging a clinic
across a wide range of windows. We repeat the same exercise for the hypothesis tests in
33

columns (3) and (4) of Table 6 in Appendix Figure A8. Panel A reports p-values for the
hypothesis test in column (3) that Flagged x High Comp = Flagged x Low Compl. Panel
B reports the p-value for the hypothesis test in column (4) that Flagged x Doctor Does
Not Know = Flagged x Doctor Knows. We see our political competition result is extremely
robust. Our differential effects by whether doctors know their local political are less robust,
which is in-line with previous results.
As an additional robustness check, in Figure 5 Panel B, we run the same 1300 hypothesis
tests as are conducted in Table 6 column (2) using a placebo threshold between one and two
absences on the dashboard. We are not able to reject the null hypothesis of no effect on this
placebo flagging in nearly all cases, as we would hope.
We also conduct the same honest causal tree analysis with our flagging results as with our
heterogeneous treatment results in Appendix Section E, to verify that political competition
and doctor connectedness are two variables that should be chosen to explain heterogeneity
in this case as well. Again, we find support for our choice of variables and thus the broad
mechanisms we discuss in this paper.
8 Discussion and Conclusion
Absenteeism among civil servants is a highly persistent problem in developing countries.
Appropriately, research in social sciences focuses on the technical aspects of this issue, seeing
its roots in an information asymmetry between principals and the agents being monitored.
If absence is a result of agency problems between senior bureaucrats and local level civil
servants, then improving monitoring should be an effective policy response. Correspondingly,
a substantial body of recent empirical research explores the potential for monitoring to
improve public service delivery. These studies provide mixed results, drawing attention to the
importance of context for whether monitoring initiatives will succeed or fail. In particular,
understanding whether the political environment can sustain such reforms is critical.
34

Panel A: True Effect (Comparing 3 vs 2 Absences on the Dashboard)
<--- p-value reported in Table 5
+0
+5
+10
+15
+20
+25
Day
s si
nce
dash
boar
d re
port
0 10 20 30 40 50
Length of analysis window (days)
.01
.05
.1
.2
.4
p-values
Panel B: Placebo (Comparing 2 vs 1 Absences on the Dashboard)
+0
+5
+10
+15
+20
+25
Day
s si
nce
dash
boar
d re
port
0 10 20 30 40 50
Length of analysis window (days)
.01
.05
.1
.2
.4
p-values
Figure 5: Average Absence after FlaggingNotes: This figure presents robustness of flagging results in Table 6 to the window of time prior to an
unannounced visit that a clinic being highlighted in red on the dashboard is considered flagged. Panel A
reports p-values from 1300 hypothesis tests analogous to that conducted in Table 6 column (3) that Flagged
x High Comp = Flagged x Low Compl., varying the window for which we define a clinic as flagged prior to
a primary unannounced visit to a clinic along two dimensions—we vary the length of the window being used
along the x-axis and the delay from when a clinic is highlighted in red to when the window begins along the
y-axis (so for example, a length of 30 and delay of 15 corresponds to considering a clinic as flagged if it was
highlighted in red anytime 15 to 45 days prior to an unannounced visit). For each window, we report using
a colored pixel the p-value of the hypothesis test of a null effect of flagging on subsequent doctor attendance.
Panel B conducts the exact same exercise, instead using a placebo threshold between one and two absences
on the dashboard to define a clinic as flagged within a given window.
35

Our results highlight the importance of political economy considerations in determining
whether monitoring initiatives will be effective. We find evidence that the effect of monitoring
follows a predictable pattern; it has impacts both in competitive constituencies and for
employees with limited political connections. This pattern of effects is precisely what would
be predicted by a substantial literature in political science on the use of jobs as patronage.
Four pieces of evidence support this interpretation. First, political interference is a rou-
tine matter in bureaucratic work. Second, a lack of political competition is associated with
more doctor absence, and doctors who have personal connections with politicians show up to
work less often. Third, we find that the introduction of a new monitoring technology nearly
doubled inspections, with more substantial effects in competitive constituencies. While the
technology had no average impacts on doctor attendance, it did increase attendance in
competitive constituencies. Fourth, to further probe the internal mechanics of the health
bureaucracy, as well as to understand how the above impacts come about, we designed
an experiment to test whether absence data affect subsequent attendance. We experimen-
tally manipulated the salience of information on absence to senior bureaucrats in an online
dashboard, and found that bureaucrats do indeed have the ability to reduce absence when
information is presented to them in an actionable format. However, their ability to make a
difference is again limited to areas of high political competition.
Understanding the political rationale for public worker absence potentially opens a broader
set of interventions to combat the problem. While naturally speculative, our findings suggest
potential for future research that pushes in this direction. First, professionalizing the civil
service, and eliminating politicians’ involvement in decisions related to bureaucratic hiring,
firing, promotion, and posting, would remove the opportunity to use these positions as pa-
tronage, if this is the mechanism underlying our results. Such policy reform, however, is hard
to implement in practice. An alternate set of solutions may provide more promise: reform
should leverage political incentives in policy design. For instance, increasing voter awareness
of public worker absence might amplify the political costs from voters not motivated by pa-
36

tronage. This may be done through public facing information portals. For example, in our
case, the dashboard could have been made available to anyone with access to the internet,
rather than just to senior health officials.
37

References
Acemoglu, Daron, and James A. Robinson. 2012. Why Nations Fail: The Origins of Power,
Prosperity, and Poverty. Crown.
Albouy, D. 2013. “Partisan representation in Congress and the geographic distribution of
Federal funds.” Review of Economics and Statistics.
Ansolabehere, Stephen, and James M. Snyder. 2006. “Party Control of State Government
and the Distribution of Public Expenditures.” Scandinavian Journal of Economics 108
(dec): 547–569.
Ashraf, Nava, Oriana Bandiera, and Kelsey Jack. 2014. “No Margin, No Mission? A Field
Experiment on Incentives for Public Services Delivery.” Journal of Public Economics 120:
1-17.
Ashraf, Nava, Oriana Bandiera, and Scott Lee. 2015. “Do-gooders and Go-getters: Career
Incentives, Selection, and Performance in Public Service Delivery.”.
Athey, Susan, and Guido Imbens. 2016. “Recursive partitioning for heterogeneous causal
effects.” Proceedings of the National Academy of Sciences 113 (27): 7353–7360.
Banerjee, Abhijit, and Esther Duflo. 2006. “Addressing Absence.” The Journal of Economic
Perspectives 20 (1): 117-132.
Banerjee, Abhijit, Esther Duflo, Clement Imbert, Santhosh Mathew, and Rohini Pande.
2014. Can E-Governance Reduce Capture of Public Programs? Experimental Evidence
from a Financial Reform of India’s Employment Guarantee. Technical report mimeo.
Banerjee, Abhijit V., Angus Deaton, and Esther Duflo. 2004. “Wealth, Health, and Health
Services in Rural Rajasthan.” American Economic Review 94 (May): 326–330.
38

Banerjee, Abhijit V., Esther Duflo, and Rachel Glennerster. 2008. “Putting a Band-Aid on
a Corpse: Incentives for Nurses in the Indian Public Health Care System.” Journal of the
European Economic Association 6 (04-05): 487-500.
Bertrand, Marianne, Robin Burgess, Arunish Chawla, and Guo Xu. 2015. “Determinants
and consequences of bureaucrat effectiveness: Evidence from the indian administrative
service.” Working Paper.
Besley, Timothy, and Robin Burgess. 2002. “The Political Economy of Government Respon-
siveness: Theory and Evidence from India.” Quarterly Journal of Economics 117 (4):
1415–1452.
Bloom, Nicholas, Carol Propper, Stephan Seiler, and John Van Reenan. 2015. “The Impact
of Competition on Management Quality: Evidence from Public Hospitals.” Quarterly
Journal of Economics 82 (2): 457-489.
Brollo, Fernanda, and Tommaso Nannicini. 2012. “Tying Your Enemy’s Hands in Close
Races: The Politics of Federal Transfers in Brazil.” American Political Science Review
106 (oct): 742–761.
Brusco, Valiera, Thad Dunning, Marcelo Nazareno, and Susan C. Stokes. 2013. Brokers,
Voters, and Clientelism: The Puzzle of Distributive Clientelism. Cambridge University
Press.
Callen, Michael, and James D Long. 2014. “Institutional corruption and election fraud: Ev-
idence from a field experiment in Afghanistan.” The American Economic Review 105 (1):
354–381.
Calvo, Ernesto, and Maria Victoria Murillo. 2004. “Who Delivers? Partisan Clients in the
Argentine Electoral Market.” American Journal of Political Science 48 (Oct): 742–757.
39

Careaga, Maite, and Barry Weingast. 2003. “Fiscal federalism, good governance, and eco-
nomic growth in Mexico.” In search of prosperity: analytical narratives on economic
growth: 399–435.
Chandra, Kanchan. 2007. Why ethnic parties succeed: Patronage and ethnic head counts in
India. Cambridge University Press.
Chaudhury, Nazmul, Jeffrey Hammer, Michael Kremer, Karthik Muralidharan, and
F. Halsey Rogers. 2006. “Missing in Action: Teacher and Health Worker Absence in De-
veloping Countries.” Journal of Economic Perspectives 20 (Winter).
Chubb, J. 1983. Patronage, Power and Poverty in Southern Italy: A Tale of Two Cities.
Cambridge Studies in Modern Political Economies Cambridge University Press.
de Ree, Joppe, Karthik Muralidharan, Menno Pradhan, and Halsey Rogers. 2016. “Double
for Nothing? Experimental Evidence on the Impact of an Unconditional Teacher Salary
Increase on Student Performance in Indonesia.”.
Dell, Melissa. 2010. “The Mining Mita: Explaining Institutional Persistence.” Econometrica
78 (6): 1863–1903.
Dhaliwal, Iqbal, and Rema Hanna. 2014. “Deal with the Devil: The Successes and Limita-
tions of Bureaucratic Reform in India.” NBER Working Paper 20482 (Sep).
Ferguson, T, and HJ Voth. 2008. “Betting on Hitler—the value of political connections in
Nazi Germany.” The Quarterly Journal of Economics (February).
Ferraz, Claudio, and Frederico Finan. 2008. “Exposing Corrupt Politicians: The Effects
of Brazil’s Publicly Released Audits on Electoral Outcomes.” The Quarterly Journal of
Economics 123 (2): 703-745.
Finan, Frederico, Benjamin A. Olken, and Rohini Pande. 2015. “The Personnel Economics
of the State.” In Handbook of Field Experiments.
40

Fisher, Ronald. 1935. The Design of Experiments. Edinburgh: Oliver and Boyd.
Fisman, Raymond. 2001. “Estimating the Value of Political Connections.” American Eco-
nomic Review 91 (4): 1095–1102.
Gans-Morse, Jordan, Sebastian Mazzuca, and Simeon Nichter. 2014. “Varieties of clientelism:
Machine politics during elections.” American Journal of Political Science 58 (2): 415–432.
Gerber, Alan S., and Donald P. Green. 2012. Field Experiments: Design, Analysis, and
Interpretation. New York, NY: Norton New York.
Golden, Miriam A. 2003. “Electoral connections: the effects of the personal vote on politi-
cal patronage, bureaucracy and legislation in postwar Italy.” British Journal of Political
Science 33 (2): 189–212.
Golosov, Grigorii V. 2009. “The Effective Number of Parties: A New Approach.” Party
Politics 16 (2): 171-192.
Gordon, Sanford C, and Gregory A Huber. 2007. “The effect of electoral competitiveness on
incumbent behavior.” Quarterly Journal of Political Science 2 (2): 107–138.
Grossman, Guy, and Kristin Michelitch. 2017. “Information Dissemination, Competitive
Pressure, and Politician Performance between Elections: A Field Experiment in Uganda.”
Working paper.
Hollibaugh, Gary E, Gabriel Horton, and David E Lewis. 2014. “Presidents and patronage.”
American Journal of Political Science 58 (4): 1024–1042.
Johnston, Michael. 1979. “Patrons and Clients, Jobs and Machines: A Case Study of the
Uses of Patronage.” The American Political Science Review 73 (2): 385-398.
Khan, Adnan, Asim Ijaz Khwaja, and Benjamin A. Olken. 2016. “Tax Farming Redux:
Experimental Evidence on Performance Pay for Tax Collectors.” Quarterly Journal of
Economics 131 (1): 219-271.
41

Khwaja, Asim I, and Atif Mian. 2005. “Do Lenders Favor Politically Connected Firms? Rent
Provision in an Emerging Financial Market.” The Quarterly Journal of Economics (April).
Khwaja, Asim Ijaz, Tahir Andrabi, and Jishnu Das. 2016. “Report Cards: The Impact of
Providing School and Child Test Scores on Educational Markets.” American Economic
Review.
Kitschelt, Herbert, and Steven Wilkinson. 2007. “Citizen-politician linkages: an introduc-
tion.” Patrons, clients, and policies: Patterns of democratic accountability and political
competition: 1–49.
Kremer, Michael, Nazmul Chaudhury, F. Halsey Rogers, Karthik Muralidharan, and Jef-
frey Hammer. 2005. “Teacher Absence in India: A Snapshop.” Journal of the European
Economic Association 3 (2-3): 658–667.
Lewis, David E. 2007. “Testing Pendleton’s Premise: Do Political Appointees Make Worse
Bureaucrats?” Journal of Politics 69 (4): 1073–1088.
Lewis, David E. 2011. “Presidential appointments and personnel.” Annual Review of Political
Science 14: 47–66.
Lindbeck, Assar, and Jorgen W. Weibull. 1987. “Balanced-budget redistribution as the out-
come of political competition.” Public Choice 52 (3): 273–297.
Meyer-Sahling, Jan-Hinrik. 2006. “The Rise of the Partisan State? Parties, Patronage and
the Ministerial Bureaucracy in Hungary.” Journal of Communist Studies and Transition
Politics 22 (Sep): 274–297.
Michalopoulos, Stelios, and Elias Papaioannou. 2013. “The long-run effects of the scramble
for Africa.” NBER Working Paper 17620.
Mohmand, Shandana Khan. 2011. “Patrons, brothers and landlords: Competing for the vote
in Rural Pakistan.” Ph.D. diss. University of Sussex.
42

Mohmand, Shandana Khan. 2014. “Losing the connection: party-voter linkages in Pakistan.”
Commonwealth & Comparative Politics 52 (1): 7–31.
Moynihan, Donald P., and Sanjay K. Pandey. 2010. “The big question for performance
management: Why do managers use performance information?” Journal of public admin-
istration research and theory.
Muralidharan, Karthik, Jishnu Das, Alaka Holla, and Aakash Mohpal. 2017. “The fiscal cost
of weak governance: Evidence from teacher absence in India.” Journal of Public Economics
145: 116–135.
Muralidharan, Karthik, Paul Niehaus, and Sandip Sukhtankar. 2014. “Building State Ca-
pacity: Evidence from Biometric Smartcards in India.” (October).
Muralidharan, Karthik, and Venkatesh Sundararaman. 2011. “Teacher Performance Pay:
Experimental Evidence from India.” Journal of Political Economy 119 (1): 39-77.
Muralidharan, Karthik, and Venkatesh Sundararaman. 2013. “Contract Teachers: Experi-
mental Evidence from India.”.
Olken, Benjamin A. 2007. “Monitoring Corruption: Evidence from a Field Experiment in
Indonesia.” Journal of Political Economy 115 (2): 200–249.
Olken, Benjamin A., and Rohini Pande. 2012. “Corruption in Developing Countries.” Annual
Review of Economics 4: 479-505.
Raffler, Pia. 2016. Does political oversight of the bureaucracy increase accountability? Field
experimental evidence from an electoral autocracy. Technical report Working paper, Yale
University.
Robinson, James A, and Thierry Verdier. 2013. “The Political Economy of Clientelism.”
Scandinavian Journal of Economics 115 (2): 260–291.
43
Rodden, Jonathan. 2006. Hamilton’s paradox: the promise and peril of fiscal federalism.
Cambridge University Press.
Rogger, Daniel, and Imran Rasul. 2016. “Management of Bureaucrats and Public Service
Delivery: Evidence from the Nigerian Civil Service.” Economic Journal.
Sorauf, Frank J. 1956. “State Patronage in a Rural County.” American Political Science
Review 50 (December): 1046-1056.
Stokes, Susan C. 2005. “Perverse Accountability: A Formal Model of Machine Politics with
Evidence from Argentina.” American Political Science Review 99 (sep): 315–325.
Sukhtankar, Sandip. 2012. “Sweetening the Deal? Political Connections and Sugar Mills in
India.” American Economic Journal: Applied Economics 4 (jul): 43–63.
Wade, Robert. 1985. “The Market for Public Office: Why the Indian State Is Not Better at
Development.” World Development 13 (4).
Wilson, James Q. 1961. “The Economy of Patronage.” Journal of Political Economy 69
(August): 369-380.
44

APPENDIX: FOR ONLINE PUBLICATION ONLY
A Additional Tables and Figures
Figure A1: Doctors as Political Workers in 2013 Elections
45

Figure A2: Selected Tweets from Free and Fair Elections Network before 2013 Elections
46
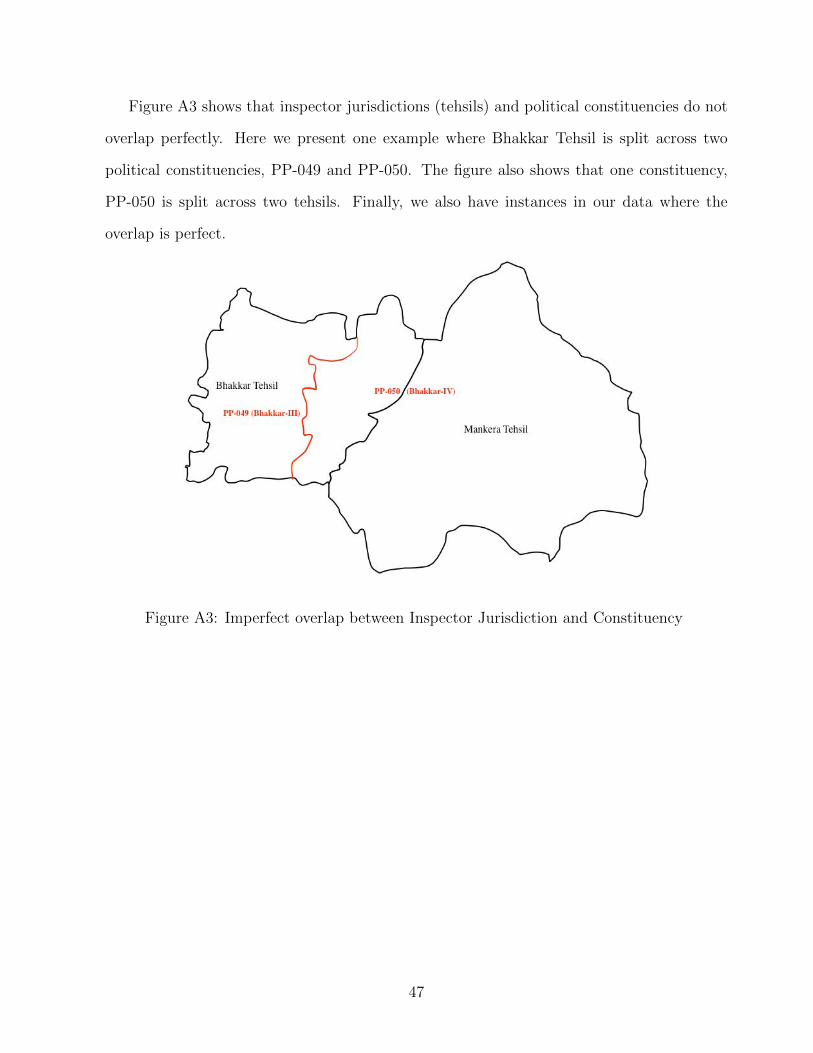
Figure A3 shows that inspector jurisdictions (tehsils) and political constituencies do not
overlap perfectly. Here we present one example where Bhakkar Tehsil is split across two
political constituencies, PP-049 and PP-050. The figure also shows that one constituency,
PP-050 is split across two tehsils. Finally, we also have instances in our data where the
overlap is perfect.
Figure A3: Imperfect overlap between Inspector Jurisdiction and Constituency
47

Table A1: Summary Statistics
Variable Mean Standard Deviation # Observations
Doctor Present (=1) 0.225 0.418 1193Doctor Assigned (=1) 0.531 0.499 1193Doctor Knows Local Politician (=1) 0.253 0.435 269Doctor Distance to Hometown (min) 123.216 286.306 269Doctor Tenure (months) 96.027 93.237 261Distance to District Headquarters (Km) 48.96 29.256 1373Clinic Catchment Population (1000s) 22.251 6.953 1371Herfindahl Index 0.348 0.082 1373Victory Margin Share 0.155 0.105 1373
Notes: Sample is limited to control district clinics, survey waves 1 - 3.
Table A2: Breakdown of Doctor Surveys
Wave 1 Wave 2 Wave 3 Wave 4 Total
Doctors Assigned in Sample 537 509 488Total Interviews 266 252 226 141 885Number of New Doctors Interviewed 266 128 60 87 541Balance 271 115 34
Notes: Doctors were frequently absent during our unannounced visits. Consequently, we had to
make a concerted effort to find all of the doctors assigned in our sample. We tracked down 541
doctors after the completion of our three unannounced field visits and an additional announced visit
that was specifically carried out to interview doctors that were absent in the previous waves. This
table describes the breakdown of our sample.
48

Table A3: Predicting Reelection of Incumbent
Dependent Variable: Reelection of Incumbent(1) (2) (3) (4) (5) (6)
Doctor Knows MPA 0.537** 0.619**(0.235) (0.240)
Doctor Present 0.053 0.122(0.184) (0.236)
Doctor Tenure -0.000 -0.001(0.001) (0.001)
Doctor Tenure at Clinic -0.000 0.000(0.001) (0.001)
Distance to Doctor Hometown 0.000 0.000(0.000) (0.000)
Distance to HQ 0.002 -0.001 0.000 0.001 0.001 0.001(0.002) (0.002) (0.002) (0.002) (0.002) (0.003)
Political Competition Index 1.461 1.779** 1.730* 1.711* 1.735* 1.555(0.929) (0.844) (0.988) (0.954) (0.969) (1.006)
Constant -0.284 -0.234 -0.227 -0.247 -0.275 -0.338(0.332) (0.325) (0.360) (0.359) (0.363) (0.364)
# Observations 83 94 81 83 83 81R-Squared 0.107 0.066 0.061 0.061 0.063 0.120
Notes: This table reports reelection probabilities for 2008 winners in the 2013 election. The outcome is
an indicator variable measuring this. The regressors are averages of doctor and clinic characteristics from
our primary data across the constituency. Each observation is weighted by the number of clinics in our
sample in the constituency. Heteroskedasticity robust standard errors reported in parentheses. Levels of
significance: *p < 0.1, **p < 0.05, ***p < 0.01.
49

Table A4: Strategic Misreporting of Connections
Knows Politician PersonallyDoctor Doctor Inspector
(1) (2) (3)
(1) (2) (3)Smartphone Monitoring -0.025 0.006 -0.184
(0.044) (0.082) (0.133)Constant 0.079** 0.154** 0.569***
(0.034) (0.060) (0.102)Wave 2 3 -# Districts 30 25 35# Clinics 188 114 103
Notes: This table reports whether the ‘Monitoring the Monitors‘
treatment induced strategic misreporting of connections by doctors
and health inspectors. Standard Errors clustered at the district
level reported in parentheses. Results are robust to clustering at
the constituency level in columns (1) and (2). Levels of significance:
*p < 0.1, **p < 0.05, ***p < 0.01.
50

Tab
leA
5:C
onnec
tion
san
dP
erks
Dep
end
ent
Var
iab
le:
Dis
tan
ceto
Doct
or’s
Hom
etow
n(m
inu
tes)
(1)
(2)
(3)
(4)
(5)
(6)
(7)
Doct
orK
now
sM
PP
erso
nal
ly(=
1)-1
00.0
19**
*-9
4.78
0**
-94.
692*
*-7
9.75
9**
-245
.656
***
-518
.787
**-6
35.4
28**
(23.
374)
(38.
983)
(39.
039)
(39.
567)
(69.
086)
(239
.558
)(2
81.2
51)
Doct
or’s
Yea
rsof
Ser
vic
e0.
085
0.02
41.
791
(0.2
64)
(0.2
01)
(1.3
06)
Cat
chm
ent
Pop
ula
tion
(1,0
00)
0.01
10.
291
-7.3
34(4
.742
)(3
.732
)(1
8.68
4)D
ista
nce
toD
istr
ict
Cen
ter
(km
)0.
875
1.87
3**
-0.4
97(0
.802
)(0
.893
)(4
.113
)C
onst
ant
157.
045*
**16
4.94
0***
122.
576
55.5
4841
3.70
0***
494.
535*
**54
9.42
2(3
7.43
8)(4
2.52
8)(1
33.6
26)
(96.
883)
(97.
633)
(138
.318
)(3
88.8
94)
Dis
tric
tF
ixed
Eff
ects
No
Yes
Yes
No
No
Yes
Yes
Cou
nty
Fix
edE
ffec
tsN
oN
oN
oY
esN
oN
oN
oS
amp
leF
ull
Fu
llF
ull
Fu
ll>
50m
ins
>50
min
s>
50m
ins
#O
bse
rvat
ion
s26
922
021
225
985
6057
R-S
qu
ared
0.02
00.
179
0.18
90.
348
0.05
00.
348
0.40
1
Note
s:T
his
tab
lep
rovid
esev
iden
ceth
at
doct
ors
wh
okn
owth
eir
MP
per
son
ally
are
less
like
lyto
be
pos
ted
fart
her
from
thei
rhom
etow
n.
Sam
ple
:
Fu
ll-
contr
old
istr
ict
clin
ics;>
50m
inu
tes
-co
ntr
olcl
inic
sw
her
ed
oct
oris
furt
her
than
50m
inu
tes
from
thei
rh
omet
own
.A
llre
gres
sion
sin
clu
de
cou
nty
and
surv
eyw
ave
fixed
effec
ts.
Sta
nd
ard
erro
rscl
ust
ered
atth
ecl
inic
leve
lar
ere
por
ted
inp
aren
thes
es.
Lev
els
of
sign
ifica
nce
:*p
<0.
1,**p<
0.05
,
***p<
0.01.
51
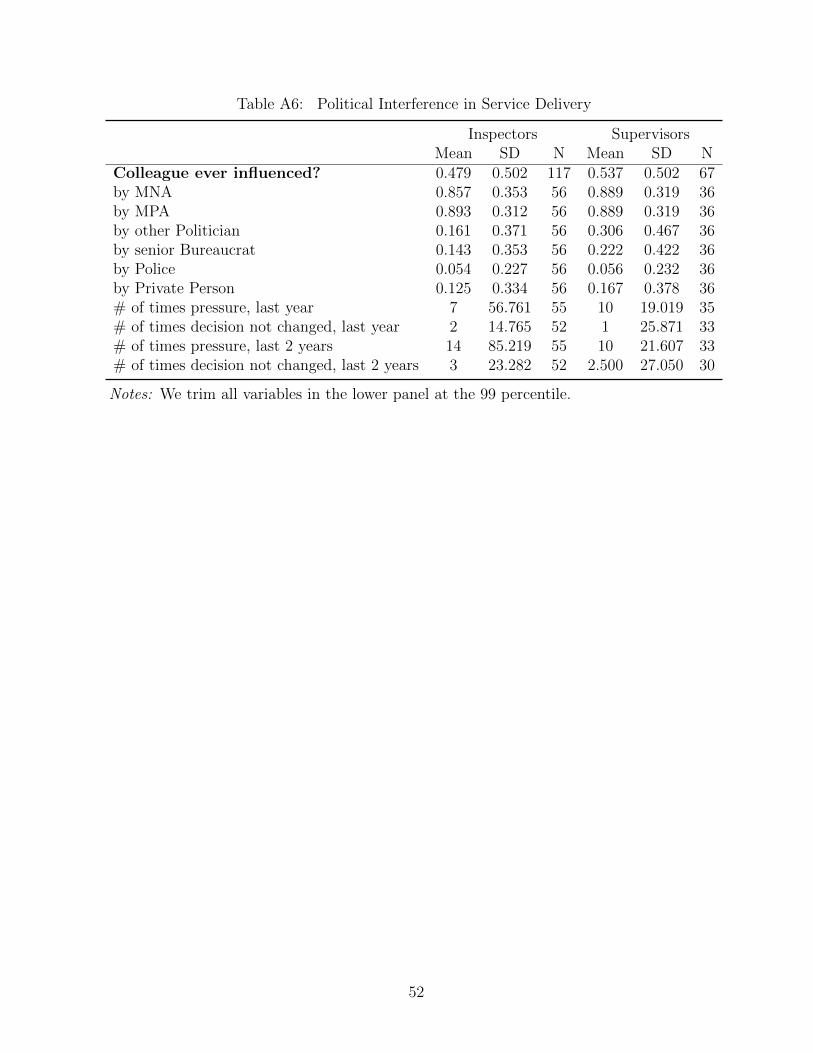
Table A6: Political Interference in Service Delivery
Inspectors SupervisorsMean SD N Mean SD N
Colleague ever influenced? 0.479 0.502 117 0.537 0.502 67by MNA 0.857 0.353 56 0.889 0.319 36by MPA 0.893 0.312 56 0.889 0.319 36by other Politician 0.161 0.371 56 0.306 0.467 36by senior Bureaucrat 0.143 0.353 56 0.222 0.422 36by Police 0.054 0.227 56 0.056 0.232 36by Private Person 0.125 0.334 56 0.167 0.378 36# of times pressure, last year 7 56.761 55 10 19.019 35# of times decision not changed, last year 2 14.765 52 1 25.871 33# of times pressure, last 2 years 14 85.219 55 10 21.607 33# of times decision not changed, last 2 years 3 23.282 52 2.500 27.050 30
Notes: We trim all variables in the lower panel at the 99 percentile.
52

Table A7: Political Interference in Health Bureaucracy
Variable Mean SD N
Panel A: Senior Officials and InspectorsEver influenced by Any Powerful Actor 0.4 0.492 150Ever Influenced by Provincial Assembly Member 0.322 0.469 149Instances of Interference by Provincial Assembly Member 13.49 48.368 149
Panel B: Senior Officials OnlyEver influenced by Any Powerful Actor 0.441 0.504 34Ever Influenced by Provincial Assembly Member 0.441 0.504 34Instances of Interference by Provincial Assembly Member 34 84.779 34
Panel C: Inspectors OnlyEver influenced by Any Powerful Actor 0.388 0.489 116Ever Influenced by Provincial Assembly Member 0.287 0.454 115Instances of Interference by Provincial Assembly Member 7.426 28.179 115
Notes: This table reports the frequency of interference by politicians in decisions of senior health
bureaucrats. Data come from a survey of the universe of senior health bureaucrats and monitors
in Punjab. For each panel, the first dependent variable is an indicator variable for whether the
bureaucrat was influenced by any powerful actor to either (a) not take action against doctors
or other staff that were performing unsatisfactorily in their jurisdiction (county) or (b) assign
doctors to their preferred posting in the previous two years. The second variable measures the
same, but restricts attention to influence by provincial assembly politicians, the focus of our
study. The third variable is a count of the number of times bureaucrats report that Members
of the Provincial Assembly pressured them. Panel A reports results for all bureaucrats in the
sample, while Panel B disaggregates them by Executive District Officers and Deputy District
Officers. Panel C reports the results only for Inspectors.
53

Table A8: Interference in Inspector Decisions and Political Competition
Dependent Variable: Instances of Political Interference(1) (2) (3) (4) (5) (6) (7)
Political Competition Index 48.533 27.025* 28.771** 31.700** 8.569 8.145 9.331(29.486) (14.354) (14.115) (15.882) (8.334) (8.373) (9.982)
Inspector knows Local MPA Personally (=1) -4.030*** -3.821** -3.219** -3.130*(1.466) (1.526) (1.456) (1.648)
Inspector Tenure 0.171 0.081(0.133) (0.144)
Time Spent Monitoring Clinics (mins) -0.005 -0.006(0.010) (0.009)
Constant -9.872 -6.535 -5.418 -9.470 -0.552 1.063 -0.308(9.248) (4.339) (3.924) (6.319) (2.849) (3.042) (5.372)
# Observations 103 100 100 86 75 75 64R-squared 0.012 0.046 0.133 0.154 0.007 0.075 0.086
Outcome - <100 <100 <100 <100 <100 <100Sample Full Non-overlapping constituencies
Notes: This table reports the frequency of interference by politicians in health inspectors decisions by the level political competition. The unit of
observation is a county-constituency. The dependent variable is a count of the number of times that inspectors report Members of the Provincial
Assembly pressuring them to either (a) not take action against doctors or other staff that were performing unsatisfactorily in their jurisdiction
(county) or (b) assign doctors to their preferred posting in the previous two years. Of the 123 inspectors covering our experimental sample, we
have responses from 103. In columns (2)-(7), we drop four reports which indicate more than 100 instances of interference (99th percentile). These
three observations are more than four standard deviations from the mean. The remaining 100 inspectors are responsible for facilities spanning
211 provincial assembly constituencies. 79 of the constituencies belong to multiple inspectors’ jurisdictions. Columns (1) through (3) report OLS
regressions of the instances of interference on indicator variables for the degree of political competition in the full sample of 211 constituencies.
Jurisdictions spanning multiple constituencies are repeated with the level of political competition in each constituency providing an observation.
Columns (4) through (6) drop constituencies spanning multiple jurisdictions. Further details about the frequency and source of political interference
is provided in Table A6. The political competition index is a Herfindahl index computed as the sum of squared candidate vote shares in each
constituency in 2008. Low competition is a dummy variable equal to 1 for constituencies in the top tercile of this index and medium competition
is a dummy variable for constituencies in the middle tercile. Standard errors clustered at the jurisdiction (county) level reported in parentheses.
Levels of significance: *p < 0.1, **p < 0.05, ***p < 0.01.
-10
-50
510
Trea
tmen
t Effe
ct
0 1 2 3 4 5 6 7 8 9 10 11 12 13 14 15Bandwidth (in Kilometers)
Doctor Present
Figure A4: Robustness across bandwidthsNotes: This figure shows robustness of geographic discontinuity estimates to several bandwidths of distance
to border. We use a bandwidth of 5 km in column 3 of Table 4. The vertical bars represent 95 percent
confidence intervals.
54

-50
510
Trea
tmen
t Effe
ct
0 1 2 3 4 5 6 7 8 9 10 11 12 13 14 15Bandwidth (in Kilometers)
Linear QuadraticCubic Quartic
Doctor Present
Figure A5: Robustess across Functional FormsNotes: This Figure reports robustness of Table 4 column 3. The dependent variable is a dummy equal
to 1 if a doctor is present during an unannounced facility inspection performed by our survey team. The
political competition index is a Herfindahl index computed as the sum of squared candidate vote shares
in each provincial assembly constituency. It varies between 0.040 and 0.545. All specification samples are
restricted to basic health unit facilities in control districts with a doctor assigned. All specifications are
OLS and include survey wave fixed effects, county fixed effects as well as controls for distance to HQ. All
observations are weighed by a Triangular kernel and estimates include a geographic control function. The
controls functions are of the following forms. Linear: x + y, Quadratic: x + y + x2 + y2 + xy, Cubic:
x + y + x2 + y2 + xy + x3 + y3 + x2y + xy2, and Quartic: x + y + x2 + y2 + xy + x3 + y3 + x2y + xy2 +
x4 + y4 + x3y + x2y2 + xy3. Cubic control function is a replication of Dell (2010) and Michalopoulos and
Papaioannou (2013)’s main specification. Level of significance:*p < 0.1, **p < 0.05, ***p < 0.01. Standard
errors clustered at the constituency level reported in parentheses. The vertical bars represent 95 percent
confidence intervals.
55

0.1
.2.3
.4.5
.6.7
.8.9
1p-
valu
es
5 10 15Bandwidth in Km
Catchment Pop. Distance to HQTurnout Total VotesNum of Candidates
Figure A6: Geographic RD BalanceNotes: This figure shows balance of pre-covariates for the geographic discontinuity analysis. We retain good
balance on all variables. We include distance to HQ in all our regressions.
56

Table A9: Randomization Verification
Conventional Smartphone Difference P-value Control TreatmentMonitoring (=1) Monitoring (=1) Observations Observations
Clinic open during visit (=1) 0.926 0.930 -0.004 0.899 417 428[0.263] [0.256] (0.033)
Inspector Has Visited in the Last Month (=1) 0.230 0.219 0.012 0.836 330 320[0.422] [0.414] (0.056)
Number of Staff Present 2.722 2.883 -0.161 0.379 330 320[1.516] [1.637] (0.181)
Number of Staff Assigned 5.115 5.285 -0.170 0.169 417 428[0.926] [0.940] (0.121)
Doctor Present (Assigned only) 0.430 0.547 -0.116 0.078 223 309[0.496] [0.499] (0.064)
Health Technician Present (=1) 0.516 0.477 0.039 0.519 312 302[0.501] [0.500] (0.060)
Dispenser Present (=1) 0.733 0.805 -0.071 0.224 390 399[0.443] [0.397] (0.057)
SHNS Present (=1) 0.347 0.341 0.006 0.921 403 413[0.477] [0.475] (0.060)
Lady Health Visitor Present (=1) 0.631 0.662 -0.031 0.548 374 396[0.483] [0.474] (0.050)
Midwife Present (=1) 0.659 0.650 0.008 0.863 328 303[0.475] [0.478] (0.048)
Political Concentration (0 - 1) 0.348 0.346 0.002 0.872 414 423[0.083] [0.078] (0.014)
High Competition Constituencies (Bottom Tercile) 0.312 0.362 -0.050 0.489 414 423[0.464] [0.481] (0.072)
Medium Competition Constituencies (Middle Tercile) 0.377 0.284 0.093 0.209 414 423[0.485] [0.451] (0.073)
Low Competition Constituencies (Top Tercile) 0.312 0.355 -0.043 0.543 414 423[0.464] [0.479] (0.070)
Notes: This table checks balance between treatment and control clinics. The unit of observation is the clinic (basic health unit). The first ten rows report data from the
baseline survey of health facilities which involved making unannounced visits to facilities in November, 2011. The last four rows report data based on the February 2008
parliamentary election. The political competition index is a Herfindahl index computed as the sum of squared candidate vote shares in each provincial assembly constituency.
Variable standard deviations are reported in brackets. Standard errors are reported in parentheses.
57
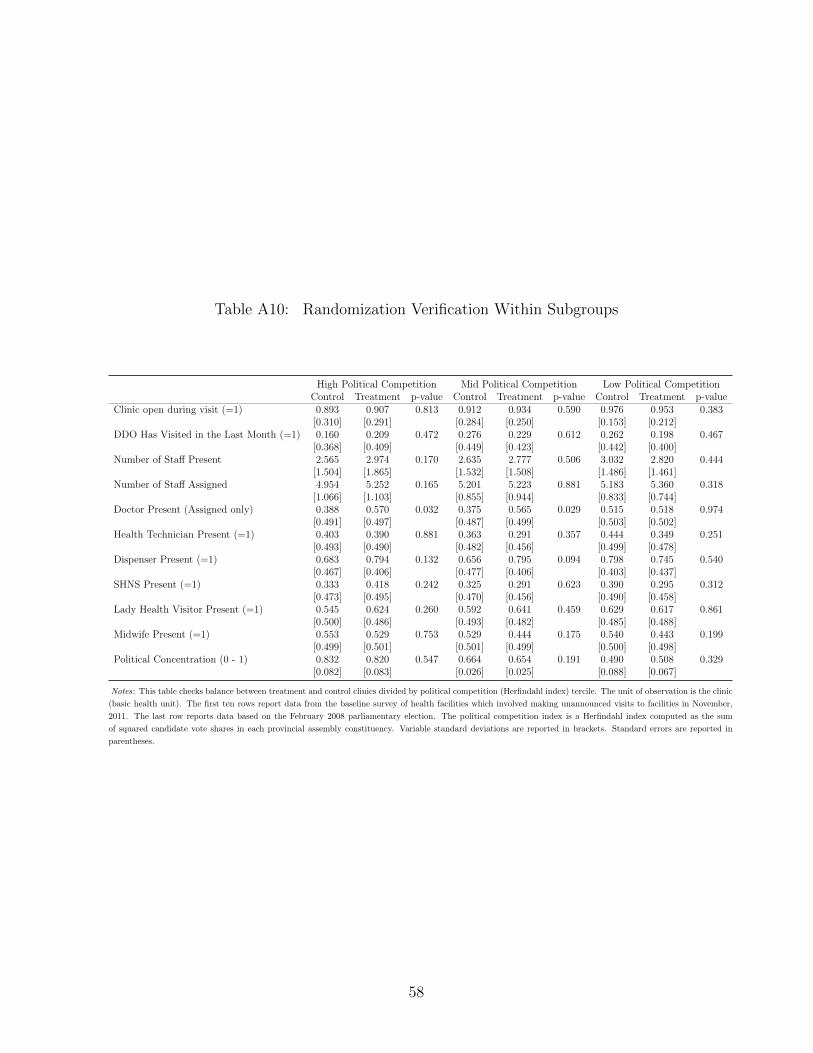
Table A10: Randomization Verification Within Subgroups
High Political Competition Mid Political Competition Low Political CompetitionControl Treatment p-value Control Treatment p-value Control Treatment p-value
Clinic open during visit (=1) 0.893 0.907 0.813 0.912 0.934 0.590 0.976 0.953 0.383[0.310] [0.291] [0.284] [0.250] [0.153] [0.212]
DDO Has Visited in the Last Month (=1) 0.160 0.209 0.472 0.276 0.229 0.612 0.262 0.198 0.467[0.368] [0.409] [0.449] [0.423] [0.442] [0.400]
Number of Staff Present 2.565 2.974 0.170 2.635 2.777 0.506 3.032 2.820 0.444[1.504] [1.865] [1.532] [1.508] [1.486] [1.461]
Number of Staff Assigned 4.954 5.252 0.165 5.201 5.223 0.881 5.183 5.360 0.318[1.066] [1.103] [0.855] [0.944] [0.833] [0.744]
Doctor Present (Assigned only) 0.388 0.570 0.032 0.375 0.565 0.029 0.515 0.518 0.974[0.491] [0.497] [0.487] [0.499] [0.503] [0.502]
Health Technician Present (=1) 0.403 0.390 0.881 0.363 0.291 0.357 0.444 0.349 0.251[0.493] [0.490] [0.482] [0.456] [0.499] [0.478]
Dispenser Present (=1) 0.683 0.794 0.132 0.656 0.795 0.094 0.798 0.745 0.540[0.467] [0.406] [0.477] [0.406] [0.403] [0.437]
SHNS Present (=1) 0.333 0.418 0.242 0.325 0.291 0.623 0.390 0.295 0.312[0.473] [0.495] [0.470] [0.456] [0.490] [0.458]
Lady Health Visitor Present (=1) 0.545 0.624 0.260 0.592 0.641 0.459 0.629 0.617 0.861[0.500] [0.486] [0.493] [0.482] [0.485] [0.488]
Midwife Present (=1) 0.553 0.529 0.753 0.529 0.444 0.175 0.540 0.443 0.199[0.499] [0.501] [0.501] [0.499] [0.500] [0.498]
Political Concentration (0 - 1) 0.832 0.820 0.547 0.664 0.654 0.191 0.490 0.508 0.329[0.082] [0.083] [0.026] [0.025] [0.088] [0.067]
Notes: This table checks balance between treatment and control clinics divided by political competition (Herfindahl index) tercile. The unit of observation is the clinic
(basic health unit). The first ten rows report data from the baseline survey of health facilities which involved making unannounced visits to facilities in November,
2011. The last row reports data based on the February 2008 parliamentary election. The political competition index is a Herfindahl index computed as the sum
of squared candidate vote shares in each provincial assembly constituency. Variable standard deviations are reported in brackets. Standard errors are reported in
parentheses.
58
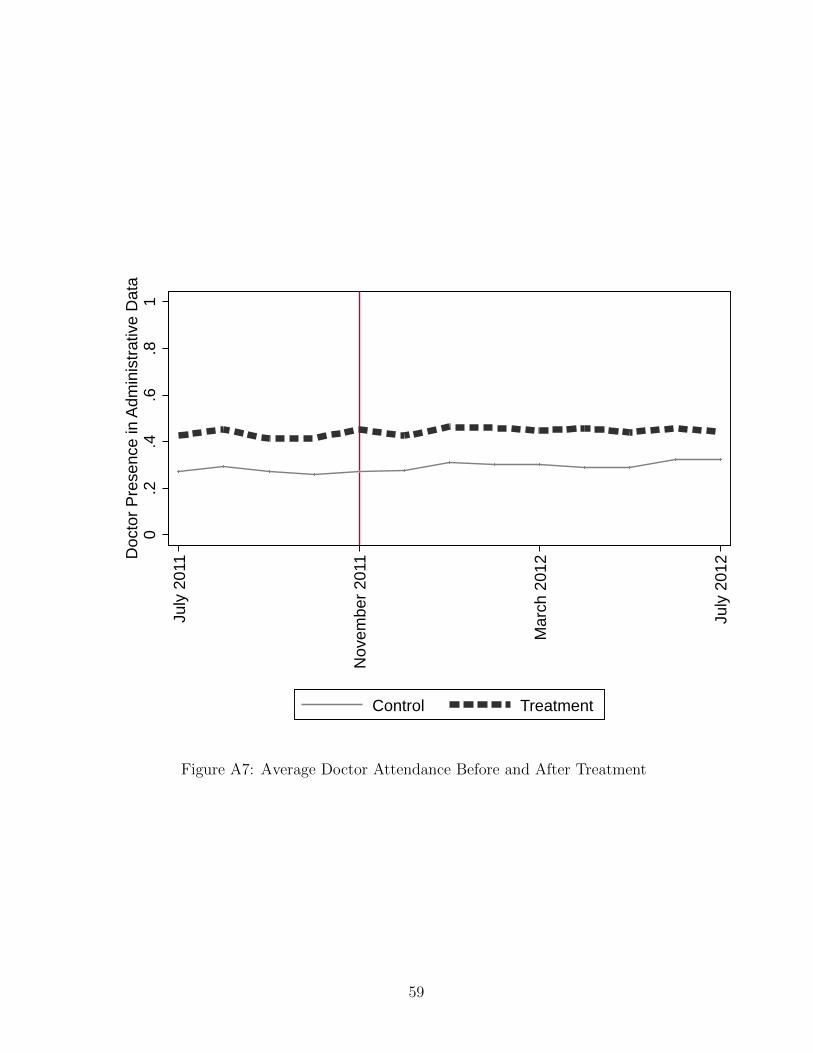
0.2
.4.6
.81
Doc
tor P
rese
nce
in A
dmin
istra
tive
Dat
a
July
201
1
Nov
embe
r 201
1
Mar
ch 2
012
July
201
2Control Treatment
Figure A7: Average Doctor Attendance Before and After Treatment
59

Table A11: Time-Use of Inspectors
p-value p-valueTreatment Control Difference Mean Diff Exact Test
(1) (2) (3) (4) (5)
Breaks During Official Duty
Lunch, Prayer, or Tea Break 16.189 22.500 -6.311 0.338 0.716(4.993) (4.151) (6.494)
Inspections of Facilities
Inspecting Clinics 68.648 46.324 22.324 0.183 0.083(14.373) (7.959) (16.430)
Inspecting Hospitals 52.541 30.637 21.904 0.217 0.186(15.457) (7.973) (17.392)
(i) Total Time Inspecting 121.189 76.961 44.228 0.105 0.073(24.152) (10.966) (26.525)
Management of Facilities
In Head Office, Managing Clinics 23.484 36.765 -13.281 0.272 0.739(7.201) (9.468) (11.895)
In Head Office, Managing Hospitals 24.344 32.721 -8.376 0.589 0.702(7.588) (13.365) (15.369)
(ii) Total Time Managing In Head Office 47.828 69.485 -21.657 0.273 0.808(9.440) (16.976) (19.424)
Official Duty Unrelated to Facility Management
Managing Immunization Drives 94.918 92.770 2.148 0.933 0.452(20.484) (15.260) (25.544)
Official Meetings Unrelated to Facility Management 112.500 55.441 57.059 0.046 0.110(21.217) (17.598) (27.565)
Other Official Duty 74.385 81.765 -7.379 0.851 0.539(29.151) (25.875) (38.978)
(iii) Duty Unrelated to Facility Management 281.803 229.975 51.828 0.258 0.121(30.167) (33.481) (45.067)
Total Official Duty
Total Minutes Working (i) + (ii) + (iii) 450.820 376.422 74.398 0.082 0.045(18.380) (37.163) (41.460)
# of Observations 122 102
Notes: This table reports average treatment effects of the ‘Monitoring the monitors‘ program on the time-use patterns of inspectors.
Data for results come from the survey of the universe of health inspectors in Punjab. The unit of observation are these inspectors.
Column (1) shows the average, in minutes, of how inspectors in treatment districts spend their time over the last two days on several
tasks. Column (2) shows the same for control districts. Column (3) reports the difference between the two. Standard errors clustered at
the district level reported in parentheses. P-values reported in column (4) are for the difference between treatment and control clinics.
Column (5) reports the Fisher Exact Test p-values that places column (4) p-values in the distribution of p-values obtained from a 1000
random draws of treatment assignment.
60

Panel A: The Effect of Flagging by Doctor Connections
<--- p-value reported in Table 5
+0
+5
+10
+15
+20
+25
Leng
th o
f ana
lysi
s w
indo
w (
days
)
0 10 20 30 40 50
Days since dashboard report
.01
.05
.1
.2
.4
p-values
Panel B: The Effect of Flagging by Political Competition
<--- p-value reported in Table 5
+0
+5
+10
+15
+20
+25
Day
s si
nce
dash
boar
d re
port
0 10 20 30 40 50
Length of analysis window (days)
.01
.05
.1
.2
.4
p-values
Figure A8: Heterogeneous Effects on Absence after FlaggingNotes: Panel A reports p-values from 1300 hypothesis tests analogous to that conducted in Table 6 column
(3) that Flagged x High Comp = Flagged x Low Compl., varying the window for which we define a clinic
as flagged prior to a primary unannounced visit to a clinic along two dimensions—we vary the length of
the window being used along the x-axis and the delay from when a clinic is highlighted in red to when the
window begins along the y-axis (so for example, a length of 30 and delay of 15 corresponds to considering
a clinic as flagged if it was highlighted in red anytime 15 to 45 days prior to an unannounced visit). For
each window, we report using a colored pixel the p-value of the hypothesis test of a null effect of flagging on
subsequent doctor attendance. Panel B conducts the same exercise for the hypothesis test in Table 6 column
(4) that Flagged x Doctor Does Not Know = Flagged x Doctor Knows.
61

B Matching Clinics to Political Constituencies
We followed a two-pronged strategy to place the clinics in their relevant electoral constituen-
cies:
First, we gathered the GPS coordinates of each clinic in our sample during field surveys.
These coordinates were compared with those provided to us by the Health Department and
then verified in cases of disagreement. This enables us to place clinics on a geo-referenced
map of constituencies.
The Election Commission of Pakistan has publicly released maps of all provincial and
national constituencies as PDFs on their website22. As these maps lack vector information
that is required for direct use with GPS coordinates, we manually converted the PDFs to
shape files so that we can place each clinic in the correct constituency polygon. The quality
of this approach however, is affected by the reliability of these base maps prepared by the
Election Commission of Pakistan.
A second approach helps ensure that the placement of clinics does not hinge solely on the
quality of these maps. During the second round of our surveys, we asked all respondents in
a clinic to identify the constituency where the clinic is located. In cases where respondents
did not know the constituency number, we asked them to name the elected representative
from the area. To corroborate this further, we asked the most senior official present at the
clinic to identify the political constituency in consultation with colleagues during the third
round of the surveys.
We manually compared the names of elected politicians provided by the clinic staff with
official lists available on the website of Punjab Assembly. We assigned a constituency number
if the name matched with information on the website. At the end of this exercise we had
constituency information from multiple respondents. We proceeded by taking the mode of
these responses to assign clinics to political constituencies. In cases with disagreements, we
22http://ecp.gov.pk/Delimitation/ConstituencyMap/PA.aspx
62

manually compared the data with official lists of district-wise constituencies and corrected
cases with obvious typos. For instance, a district with a constituency number 191 had a
reported constituency number of 91, which we corrected.
Through this procedure, we were able to match all but a few clinics to constituencies.
We used geo-spatial information and Election Commission of Pakistan’s maps to break the
tie between the remaining few clinics.
63

C Hiring Process for Doctors
There are two different hiring processes for the Medical Officers. The first is through Punjab
Provincial Service Commission (PPSC). Through this route a Medical Officer becomes part of
the bureaucracy either temporarily or permanently, depending on the nature of positions that
are being filled. PPSC is a statuary body tasked with hiring of human resources for several
arms of the provincial government. The commission floats an advertisement with details of
the hiring process. Individuals who have passed the doctor certifications (M.B.B.S.), and are
registered with Pakistan Medical and Dental Council, are eligible to apply to these positions.
The top candidates are called in for a test and further shortlisted candidates are interviewed
by a selection committee. The committee consists of senior officials from PPSC, the Health
Department, and the Director General Health Services office, and a senior medical expert.
Merit lists generated based on performance in the interview are then communicated to the
Health Department by PPSC. The department then decides on the postings based on these
lists.
The second process for hiring Medical Officers is devolved at the District Level. The EDO
health office advertises vacant positions locally, and shortlisted applicants are interviewed
by the EDO himself. The candidates might also be given a test designed by the EDO on the
same day. Recommendations of the EDO are conveyed to the Establishment Division of the
Health Department, which then issues offer letters to the successful applicants. However,
these doctors are only hired on a contractual basis. In order to become permanent employees,
long-term contractual doctors have to clear a promotion exam at PPSC. EDOs also have the
power to hire and appoint temporary MOs during times of high demand of services, such as
in the case of an outbreak of the dengue virus, or flood-prone epidemics. Some of these MOs
can be considered preferentially for filling vacancies once the demand normalizes. However,
temporary MOs also have to clear a test at PPSC in order to become permanent employees.
64

D Interference and Political Competition
This section investigates whether the incidence of political interference is related to political
competition, a measure of politician strength. We continue using the survey described, and
add information on political competition.23
As we describe in Section 4, we identified the provincial assembly constituency in which
each of our clinics are located. We placed each of these constituencies in a county, the unit at
which Monitors operate. We use party vote shares at the Provincial Assembly constituency
level for 2008 and compute a Herfindahl index as∑
i s2i where si is the vote share for party
i.24 In our sample, our Herfindahl ranges from 0.14 to 0.52. Figure 4 Panel B maps the
political concentration measure for each constituency in Punjab. The degree of political
contestation appears only weakly correlated with geography.
To explore the relation between political competition and interference, we aggregate our
data to the level of a county, which corresponds to the jurisdiction of an inspector. Figure
A9 depicts the relation between the Herfindahl index and the number of instances of political
interference in a leverage plot. The slope of the line in the leverage plot corresponds to β1
estimated from the regression:
Interferencec = β0 + β1Herfindahlc + γ′Xc + εc, (5)
where Interferencec is the number of times the inspector in charge of county c reports
being interfered with, Herfindahlc is the average Herfindahl index across constituencies in
the county, and Xc is a vector of inspector characteristics including their tenure, whether
23We perform this analysis for inspectors, as there are only 33 senior health officials in our data and theirjurisdiction spans several constituencies. Inspectors, by contrast, have administrative jurisdiction in onlyone or two constituencies.
24We drop two clinics in one constituency (number 124) from our analysis as the Herfindahl Index is0.786, which is 5.5 standard deviations from the mean and more than 3 standard deviations from the nexthighest constituency.
65

they know their local MPA, and the amount of time they report monitoring facilities.25 We
note that the degree of the correlation is reduced and statistical significance is lost if we
remove constituencies that span county boundaries. However, given that a politician may
have incentive to influence any bureaucrat in a shared jurisdiction, there is an argument for
keeping these constituencies in the data.
25This regression is weighted by the number of constituencies in a county. Constituencies are intended tohave roughly equal populations, so these estimates are comparable to population weighted estimates. A fullset of corresponding regressions are presented in Table A8.
66

-10
010
2030
Inst
ance
s of
Inte
rfere
nce
(Res
idua
l)
-.2 -.1 0 .1 .2Political Competition Index (Residual)
Figure A9: Interference and Political Competition
Notes: This figure shows the correlation between interference by politicians in health inspectors decisions and
the mean level political competition in the jurisdictions of inspectors. The unit of observation is a county-
constituency. The dependent variable is a count of the number of times that inspectors report Members of
the Provincial Assembly pressuring them to either (a) not take action against doctors or other staff that
were performing unsatisfactorily in their jurisdiction (county) or (b) assign doctors to their preferred posting
in the previous two years. Of the 123 inspectors covering our experimental sample, we have responses from
103. We drop four reports which indicate more than 100 instances of interference (99th percentile). The
political competition index is a Herfindahl index computed as the sum of squared candidate vote shares in
each constituency. The axis residuals from a regression of the variable on whether the inspector knows the
local MPA personally, the tenure of the inspector, as well as the time the inspector spends on monitoring
clinics. Regression results for this figure are presented in Table A8. Further details about the frequency and
source of political interference is provided in Table A6.
67
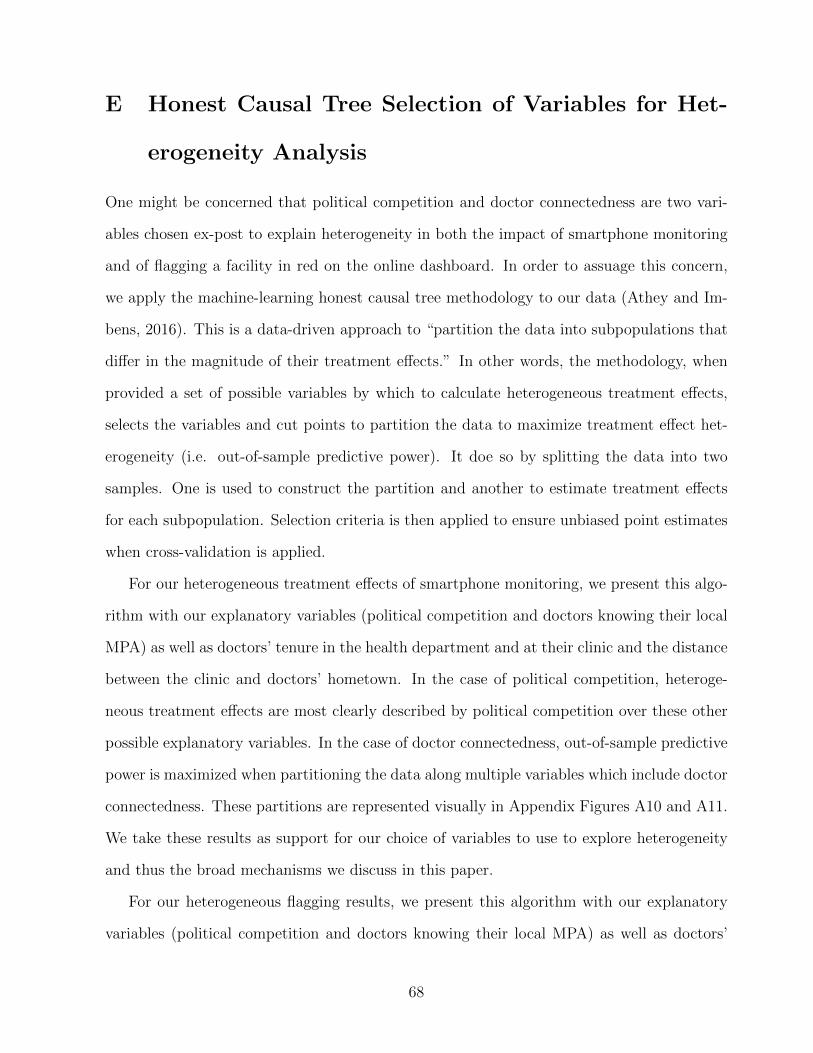
E Honest Causal Tree Selection of Variables for Het-
erogeneity Analysis
One might be concerned that political competition and doctor connectedness are two vari-
ables chosen ex-post to explain heterogeneity in both the impact of smartphone monitoring
and of flagging a facility in red on the online dashboard. In order to assuage this concern,
we apply the machine-learning honest causal tree methodology to our data (Athey and Im-
bens, 2016). This is a data-driven approach to “partition the data into subpopulations that
differ in the magnitude of their treatment effects.” In other words, the methodology, when
provided a set of possible variables by which to calculate heterogeneous treatment effects,
selects the variables and cut points to partition the data to maximize treatment effect het-
erogeneity (i.e. out-of-sample predictive power). It doe so by splitting the data into two
samples. One is used to construct the partition and another to estimate treatment effects
for each subpopulation. Selection criteria is then applied to ensure unbiased point estimates
when cross-validation is applied.
For our heterogeneous treatment effects of smartphone monitoring, we present this algo-
rithm with our explanatory variables (political competition and doctors knowing their local
MPA) as well as doctors’ tenure in the health department and at their clinic and the distance
between the clinic and doctors’ hometown. In the case of political competition, heteroge-
neous treatment effects are most clearly described by political competition over these other
possible explanatory variables. In the case of doctor connectedness, out-of-sample predictive
power is maximized when partitioning the data along multiple variables which include doctor
connectedness. These partitions are represented visually in Appendix Figures A10 and A11.
We take these results as support for our choice of variables to use to explore heterogeneity
and thus the broad mechanisms we discuss in this paper.
For our heterogeneous flagging results, we present this algorithm with our explanatory
variables (political competition and doctors knowing their local MPA) as well as doctors’
68

tenure in the health department and at their clinic and the distance between the clinic and
doctors’ hometown. In both cases, heterogeneous flagging effects are most clearly described
by political competition or doctor connectedness over these other possible explanatory vari-
ables. These partitions are represented visually in Appendix Figures A12 and A13. Again,
we take these results as support for our choice of variables to use to explore heterogeneity
and thus the broad mechanisms we discuss in this paper.
69

Figure A10: Honest causal tree partition by political competition and other doctor variablesfor heterogeneous treatment effectsNotes: This figure presents visually the outcome from presenting the honest causal tree algorithm for hetero-
geneous treatment effects with four variables—political competition, doctors’ tenure in the health department
and at their clinic, and the distince between the clinic and doctors’ hometown. Out-of-sample predictive
power is maximized when partitioning the data according to this tree.
70

Figure A11: Honest causal tree partition by political connectedness and other doctor vari-ables for heterogeneous treatment effectsNotes: This figure presents visually the outcome from presenting the honest causal tree algorithm for hetero-
geneous treatment effects with four variables—a dummy for doctors knowing their local MPA, doctors’ tenure
in the health department and at their clinic, and the distince between the clinic and doctors’ hometown.
Out-of-sample predictive power is maximized when partitioning the data according to this tree.
71

Figure A12: Honest causal tree partition by political competition and other doctor variablesfor heterogeneous flagging resultsNotes: This figure presents visually the outcome from presenting the honest causal tree algorithm for hetero-
geneous flagging results with four variables—political competition, doctors’ tenure in the health department
and at their clinic, and the distance between the clinic and doctors’ hometown. Out-of-sample predictive
power is maximized when partitioning the data according to this tree.
72

Figure A13: Honest causal tree partition by political connectedness and other doctor vari-ables for heterogeneous flagging resultsNotes: This figure presents visually the outcome from presenting the honest causal tree algorithm for hetero-
geneous flagging results with four variables—a dummy for doctors knowing their local MPA, doctors’ tenure
in the health department and at their clinic, and the distance between the clinic and doctors’ hometown.
Out-of-sample predictive power is maximized when partitioning the data according to this tree.
73

F Robustness to Alternate Measures of Competition
The primary measure of political competition used in the paper relies on the Party Herfindahl
index which is calculated for each constituency c as follows:
Hc =∑i
s2i
where si is the vote share of party i
Most measures of political competition rely on an isomorphic transformation of the
Herfindahl index. For instance, the Effective Number of Parties index is just an inverse
of the Herfindahl index:
Effective # of Partiesc =1∑i s
2i
Golosov (2009) proposes an improvement over the Effective Number of Parties Index to
better capture higher concentrated and higher fragmented party systems. This is calculated
as follows:
Gc =∑i
1
1 +s21si− si
where s1 is the share of the party with the highest number of votes. In this index, the score
of the party with then most votes is always 1, and all smaller parties are expressed in relation
to this score.
Finally, another approach to measuring political competition relies on only considering
the top two parties in a constituency. This measure calculates the margin by which the
winning party won the election. The benefit of this approach is that it focuses on the most
important players in the constituency. However, this comes at the cost of losing important
information on close thirds for instance. This measure is calculated as follows:
74

V ictory Marginc =sk − sjsk
where sk is the vote share of the winning party, while sj is the vote share of the runner-up.
We plot these three measures against the Party Herfindahl Index in Figure A14, where
each dot represents a constituency in our sample. It can be seen that the Effective Number of
Parties Index, as well as the Golosov Index are very strongly correlated with our measure of
political competition. As expected, given the different nature of competition it is measuring,
Victory Margin Share, though positively correlated, does not have as tight a relationship.
05
1015
2025
Effe
ctiv
e N
umbe
r of P
artie
s
0 .1 .2 .3 .4 .5Party Herfindahl Index
01
23
45
Gol
osov
Inde
x
0 .1 .2 .3 .4 .5Party Herfindahl Index
0.1
.2.3
.4.5
Vict
ory
Mar
gin
Shar
e
0 .1 .2 .3 .4 .5Party Herfindahl Index
Figure A14: Correlation of Party Herfindahl Index with Alternate Measures
Therefore, to robustness of our results, we focus on Victory Margin Share as an alternate
measure of political competition. Political Competition in the Tables presented in this section
refers to Victory Margin Share.
75
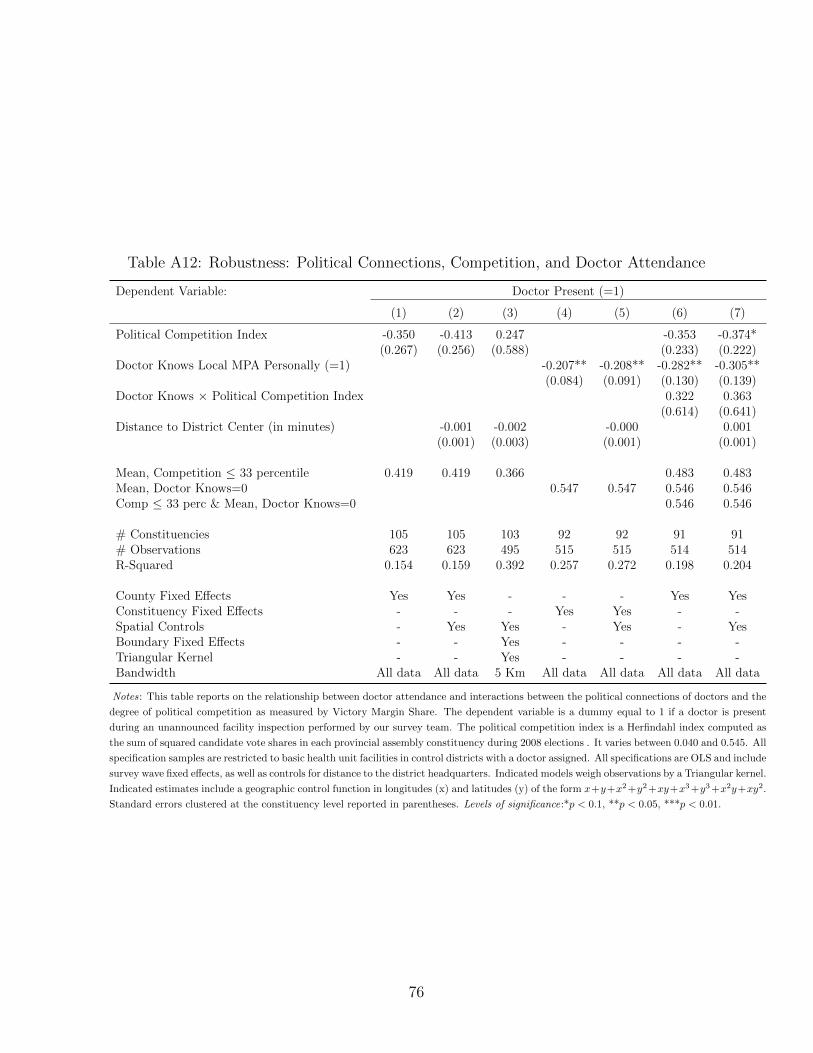
Table A12: Robustness: Political Connections, Competition, and Doctor Attendance
Dependent Variable: Doctor Present (=1)
(1) (2) (3) (4) (5) (6) (7)
Political Competition Index -0.350 -0.413 0.247 -0.353 -0.374*(0.267) (0.256) (0.588) (0.233) (0.222)
Doctor Knows Local MPA Personally (=1) -0.207** -0.208** -0.282** -0.305**(0.084) (0.091) (0.130) (0.139)
Doctor Knows × Political Competition Index 0.322 0.363(0.614) (0.641)
Distance to District Center (in minutes) -0.001 -0.002 -0.000 0.001(0.001) (0.003) (0.001) (0.001)
Mean, Competition ≤ 33 percentile 0.419 0.419 0.366 0.483 0.483Mean, Doctor Knows=0 0.547 0.547 0.546 0.546Comp ≤ 33 perc & Mean, Doctor Knows=0 0.546 0.546
# Constituencies 105 105 103 92 92 91 91# Observations 623 623 495 515 515 514 514R-Squared 0.154 0.159 0.392 0.257 0.272 0.198 0.204
County Fixed Effects Yes Yes - - - Yes YesConstituency Fixed Effects - - - Yes Yes - -Spatial Controls - Yes Yes - Yes - YesBoundary Fixed Effects - - Yes - - - -Triangular Kernel - - Yes - - - -Bandwidth All data All data 5 Km All data All data All data All data
Notes: This table reports on the relationship between doctor attendance and interactions between the political connections of doctors and the
degree of political competition as measured by Victory Margin Share. The dependent variable is a dummy equal to 1 if a doctor is present
during an unannounced facility inspection performed by our survey team. The political competition index is a Herfindahl index computed as
the sum of squared candidate vote shares in each provincial assembly constituency during 2008 elections . It varies between 0.040 and 0.545. All
specification samples are restricted to basic health unit facilities in control districts with a doctor assigned. All specifications are OLS and include
survey wave fixed effects, as well as controls for distance to the district headquarters. Indicated models weigh observations by a Triangular kernel.
Indicated estimates include a geographic control function in longitudes (x) and latitudes (y) of the form x+y+x2+y2+xy+x3+y3+x2y+xy2.
Standard errors clustered at the constituency level reported in parentheses. Levels of significance:*p < 0.1, **p < 0.05, ***p < 0.01.
76

Table A13: Robustness: Treatment Effects by Political Competition
Dependent Var. Inspected (=1) Doctor Present (=1)(1) (2) (3) (4) (5)
Monitoring 0.212*** -0.005(0.064) (0.068)[0.000] [0.546]
Monitoring x High Political Competition 0.221** 0.009 0.020(0.081) (0.065) (0.110)[0.000] [0.495] [0.449]
Monitoring x Med Political Competition 0.224** -0.042 -0.071(0.107) (0.076) (0.109)[0.038] [0.723] [0.742]
Monitoring x Low Political Competition 0.185** 0.029 0.072(0.077) (0.061) (0.096)[0.037] [0.202] [0.089]
Constant 0.217*** 0.217*** 0.518*** 0.324*** 0.516***(0.022) (0.022) (0.021) (0.014) (0.021)
Mon. x High = Mon. x Med. (p-value) 0.979 0.608 0.551Mon. x High = Mon. x Low. (p-value) 0.734 0.806 0.706Mean in Controls 0.238 0.424High Pol. Comp. Mean in Controls 0.210 0.211 0.409Med. Pol. Comp. Mean in Controls 0.290 0.213 0.406Low Pol. Comp. Mean in Control 0.218 0.251 0.454# Districts 35 35 35 35 35# Clinics 840 833 670 842 664# Observations 2171 2153 1528 2398 1518R-Squared 0.053 0.056 0.009 0.007 0.011Only Clinics with Doctors No No Yes No Yes
Notes: This table reports on the effects of the ’Monitoring the Monitors’ program on health inspections and the
attendance of doctors. Columns (2), (4), and (5) look at heterogeneous impacts by the degree of political competition
in the constituency where the reform is implemented. These estimates correspond to specification (2) in the paper.
Political Competition refers to Victory Margin Share computed for each constituency. All regressions include clinic and
survey wave fixed effects. Standard errors clustered at the district level reported in parentheses. Fisher Exact Test
p-values reported in brackets. This test places the ‘true’ treatment assignment p-values in the distribution of p-values
obtained from a 1000 random draws of treatment assignment.
77

Table A14: Robustness: Effect of Flagging Underperformance on the Dashboard
Doctor Present in Unannounced Visit (=1)(1) (2) (3) (4)
Flagged 0.090 0.266**(0.077) (0.110)
Flagged x High Competition 0.470***(0.143)
Flagged x Med Competition -0.095(0.254)
Flagged x Low Competition 0.058(0.213)
Flagged x Doctor Does Not Know Politician 0.184(0.117)
Flagged x Doctor Knows Politician -0.427(0.303)
Constant 0.409*** 0.277*** 0.191 0.835***(0.045) (0.087) (0.169) (0.279)
Flagged x High Comp = Flagged x Med Comp (p-value) 0.059Flagged x High Comp = Flagged x Low Comp (p-value) 0.109Flagged x Doctor Does Not Know = Flagged x Doctor Knows (p-value) 0.050# Clinics 195 78 78 69# Reports 252 88 88 77R-Squared 0.129 0.340 0.411 0.412District Fixed Effects Yes Yes Yes Yes
Notes: This table reports on the effect on subsequent doctor attendance of flagging on an online dashboard the fact that a clinic had three or
more staff absent to a senior policymaker. Clinics were flagged in red on an online dashboard if three or more of the seven staff were absent in
one or more health inspections of the clinic 11 to 25 days prior to an unannounced visit by our survey enumerators. The sample is limited to
facility reports in which either two or three staff were absent (the threshold to trigger the underreporting red flag). In addition, the sample in
all columns is limited to Monitoring the Monitor treatment districts due to the necessity of the web dashboard for flagging clinics. Political
Competition refers to Victory Margin Share computed for each constituency. All regressions include survey wave fixed effects. Standard errors
clustered at the clinic level reported in parentheses. *p < 0.1, **p < 0.05, ***p < 0.01.
78

79

GP
ap
er
Insp
ect
ion
Form
INSPEC
TION FORM
OF BA
SIC HEA
LTH UNIT
HEA
LTH DEP
ART
MEN
T (GOVER
NMEN
T OF TH
E PU
NJAB)
A ‐ BA
SIC HEA
LTH UNIT IN
FORM
ATION
HMIS Cod
e:
Nam
e of BHU: ______________________________________________
Managed
by: i) PRSP
ii) Dist. Govt.
(please tick on
ly one
option)
Mauza: _
_________________________ UC Nam
e: _______________________________
UC No. ___________________
NA No. _________
PP. No. _________
District: _________________________
Teh
sil: _____________________________
Nam
e of incharge
of the
facility: __________________________________
Designatio
n: _
_____________________
Mob
ile N
o.: _______________________
BHU’s P
hone
(with
cod
e): _______________________________________
Nam
e of DDOH: _
____________________________________________
Referen
ce No. ___________________________
Date & Tim
e of arrival fo
r inspectio
n: _____/_______/______ Tim
e: Hou
rs __________ Minutes _______
am / pm
B ‐ C
LEANLINESS AND GEN
ERAL
OUTLOOK OF TH
E FA
CILITY
(tick relevant colum
n)
C ‐ D
ISPLAYS
(tick relevant colum
n)
Sr. N
o Location
Goo
d Average
Poor
ITEM
S Ye
s No
1 Bo
undary W
all
Signbo
ards/Directio
n Bo
ard displayed
2 Lawns
Display in
the MO/
Incharge
office:
1) Organogram
3 Waitin
g Area
2) M
ap o
f Union
cou
ncil show
ing all
localities
4 Bu
ilding
5
Labo
ur Roo
m
3) Statistics of the
Union
Cou
ncil and
the BH
U
6 Wards
7
Toilets
4) Tou
r Programme of ‘outreach team
’
D ‐ AVAILBILITY
OF UTILITIES
(tick relevant colum
n)
E ‐D
ISPO
SAL OF HOSPITAL WASTE
(tick relevant colum
n)
Sr. No
Nam
e of Utility
Not
Available
Available
Sr. N
o Mod
e Ye
s No
Function
al
Non
Function
al
1 Hospital Waste Segregated
as pe
r guidelines
1 Electricity
2 Hospital W
aste Lying
Ope
n
2
Teleph
one
3
Burnt b
y:
(a) Incinerator
3 Water sup
ply System
(b) O
ther m
eans
4 Sui G
as
4
Buried
5
Sewerage System
5 Carried aw
ay by mun
icipality
6
Other
6 Any
other (P
lease state)
F ‐ P
URC
HI FEES (give am
ount)
Fee Deposite
d du
ring the current fin
ancial year till the
last calenda
r mon
th: (Rs.) ________________________________
Purchi fee being charged @ Rs. ____________________________ per pa
tient.
G ‐ PA
TIEN
TS TRE
ATED IN
LAST CALENDAR MONTH
(give nu
mbe
rs)
Sr. N
o Ca
ses
Num
bers
Sr. N
o.
Cases
Num
bers
1 OPD
Cases
7
Children vaccinated
outside
BHU
2
Percen
tage of pe
rvious day
OPD
Ca
ses registered
with
NIC No.
8
TB Patients un
der Treatm
ent
3 Deliveries at BHU
9
Hep
atitis “B” Va
ccination Don
e
4 No. of P
CD slides prepared
10
Anten
atal Cases Che
cked
5 No. of referrals to
other hospitals
11
Family Plann
ing Visits
6
Children vaccinated
at B
HU
12
No. of referrals by LH
W
H‐ SCH
OOL HEA
LTH PRO
GRA
M
S. No.
Indicator
Num
bers
1 Total N
umbe
r of Stude
nts referred
by SH
&NS du
ring
previou
s mon
th
2
Total N
umbe
rs of stude
nt treated at BHU referred by
SH&NS
3.
Total N
umbe
rs of Schoo
l visite
d du
ring
previou
s mon
th
4.
Tour program
app
roved and displayed in DHQ
Yes / No
I ‐ DOCT
ORS
(give nu
mbe
rs)
Sanction
ed Posts
Filled Po
sts
Presen
t
This doctor is posted in th
is BHU but is not present during the visit
Details reg
arding
absen
ce of d
octors. (Do no
t write anything if a do
ctor is present.)
Sr. N
o
Designa
tion
Nam
e of Doctors
Type
of A
bsen
ce on the mon
itoring da
y.
(tick on
ly one
box)
Days of absen
ce during last
three calend
ar m
onths
UA
SL
OD
St. L
LC
UA
Other Types
1 MO W
MO
Una
utho
rized
absence (U
A), Sanctio
ned leave (SL), O
n official duty ou
tside the BH
Y (OD), Short leave (St.L), Late Co
mer (LC).
J‐ PARA
MED
ICS (OTH
ER THAN DOCT
ORS
)
PARA
MED
ICS INCLUDES:
Med
ical Assistant, M
edical Techn
ician, Health
Techn
ician, Dispe
nser, O
ther
Sr. N
o Staff C
ategory
Sanction
ed
Filled Po
sts
Presen
t 1
Paramed
ical Staff
Details reg
arding
absen
ce of P
aram
edics. (D
o no
t write anything if staff is presen
t.)
Sr. N
o
Designa
tion
Nam
e of Param
edic
Type
of A
bsen
ce on the mon
itoring da
y.
(tick on
ly one
box)
Days of absen
ce during last
three calend
ar m
onths
UA
SL
OD
St. L
LC
UA
Other Types
1
2
3
K ‐ P
REVEN
TIVE / OUTR
EACH
STA
FF
PREV
ENTIVE / OUTR
EACH
STA
FF
INCLUDES.
LHV, RHI, Midwife
, Dai, Va
ccinator CDC Supe
rvisor, Sanitary Inspe
ctor Sanita
ry W
orker,
Scho
ol Health
& Nutritio
n Supe
rvisor
Sanction
ed Posts
Filled Po
sts
Presen
t
Details reg
arding
absen
ce of P
reventive / ou
trea
ch staff. (Do no
t write anything if staff is presen
t.)
Sr. N
o
Designa
tion
Nam
e of Staff
Type
of A
bsen
ce on the mon
itoring da
y.
(tick on
ly one
box)
Days of absen
ce during last
three calend
ar m
onths
UA
SL
OD
St. L
LC
UA
Other Types
1
2
3
L ‐ A
DMIN / SUPP
ORT
STA
FF
ADMIN / SUPP
ORT
STA
FF IN
CLUDES:
Compu
ter O
perator, Naib Qasid, C
howkidar, M
ali, Sw
eepe
r
Sanction
ed Posts
Filled Po
sts
Presen
t
Details reg
arding
absen
ce of A
dmin/Sup
port staff. (Do no
t write anything if staff is presen
t.)
Sr. N
o
Designa
tion
Nam
e of Staff
Type
of A
bsen
ce on the mon
itoring da
y.
(tick on
ly one
box)
Days of absen
ce during last
three calend
ar m
onths
UA
SL
OD
St. L
LC
UA
Other Types
1
2
3
M‐ V
ACA
NT PO
STS (please write fu
ll na
me of posts)
Sr. N
o Nam
e of Post
Num
ber of Vacan
t Po
st
Sr. N
o.
Nam
e of Post
Num
ber of Vacan
t Po
sts
80

N ‐ AVAILABILITY
OF MED
ICINES (give nu
mbe
rs of tab
lets / bottles etc.)
(Med
icines physically available on
the da
te of visit in
the stock & as pe
r Med
icines Stock Register)
Sr.
No.
Med
icines
Available
Balance as on
1st of last
mon
th (1
)
Received
Since
1st of last
mon
th (2
)
Total
3=(1+2
) Co
nsum
ed
since 1s
t of last
mon
th till
toda
y (4
)
Balance as per
register
5=(3‐4)
Yes
No
1 Ca
p. Amoxicillin
2 Syp. Amoxicillin
3 Tab. Cotrimoxazole
4 Syp. Cotrimoxazole
5 Any
Other antibiotic
Tablet
6 Tab. M
etronidazole
7 Syp. M
etronidazole
8 Inj. Ampicillin
9 Tab Diclofenac
10
Inj. Diclofenac
11
Syrup Paracetamol
12
Chloroqu
ine Tab
13
Syrup Salbutam
ol
14
Syp. Antihelminthic
15
I/V Infusion
s
16
Inj. Dexam
ethasone
17
Iron
/Folic Tab.
18
ORS
(Packets)
19
Oral Con
tracep
tive Pills
20
Anti‐H
istamine Tab.
21
Inj. Anti‐H
istamine
22
Anti‐T
uberculosis Drugs
23
Tetanu
s Toxoid Injections
24
Inj. Atrop
in
25
Inj. Adren
aline
26
Ant acid Tab.
27
Band
ages
28
Antisep
tic Solution (Bottle
s)
29
Dispo
sable Syringes
O ‐ INSPECTION OF TH
E FA
CILITY
BY DISTR
ICTGOVER
NMEN
T OFFICER
S From
Inspection
Reg
ister. (g
ive nu
mbe
r / da
tes)
Sr. N
o.
Inspecting
Officer
DDO (H
) DO (H
) ED
O (H
) DCO
or his
Represen
tative
PRSP
Re
presen
tative (in
PRSP
Dist. Only)
1 Num
ber of inspectio
ns m
ade
during
the last six m
onths as
per record of inspe
ction bo
ok
2 Date of Last Inspe
ction
P‐ PUBLIC OPINION (p
lease give num
ber of persons in
the
relevan
t colum
ns.)
Views
Num
ber of persons
contacted in th
e catchm
ent area
PUBLIC OPINION
Satisfactory
Average
Unsatisfactory
No Re
spon
se
1) Presence of Doctors
2) Attitu
de of d
octors to
wards patients
3) W
aitin
g Time
4) Free availability of m
edicines
5) Vaccinators outreach
6) Vaccinatio
n at BHU
Note: Nam
es and
Con
tact Num
bers of at least tw
o pe
rson
s interviewed
during the visit
Sr. N
o.
Nam
e Add
ress
Contact N
umbe
r
Q ‐ DEV
ELOPM
ENT SCHEM
ES / PRO
VISION OF MISSING FACILITIES (tick the column)
Sr. N
o Missing
Facilities
Fund
s provided
by
Status of W
ork
Qua
lity
Observation
s (use extra page
if requ
ired
) PH
SRP
District
Gov
t.
Not
Started
Halted
% Com
pleted
(give nu
mbe
r)
Poor
Avg.
Goo
d
1 BH
U Building
2 Re
side
nces
3 Bo
undary wall
4 Electricity
5 Drinking Water
6 Latrine/Toilet
7 Furnitu
re Sui Gas
8 Sewerage
9 Other
R (i)‐ M
EDICAL EQ
UIPMEN
T (give nu
mbe
rs)
Sr.
No.
Nam
e of Item
Available
Function
al
If Non
‐Fun
ctiona
l Re
marks
Repa
irab
le
Unserviceab
le
1 Delivery Table
2 Delivery Light
3 Hospital Bed
s
4 Sucker
5 Oxygen Cylinde
rs
6 Autoclave
7 Glucometer
8 Safe Delivery Kit
9 Em
ergency tray with
life saving med
icines
10
Ambu
Bag
11
Bulb Sucker
12
Baby
Warmer
R (ii) –
NON‐M
EDICAL EQ
UIPMEN
T (give nu
mbe
rs)
Sr. N
o.
Nam
e of Item
Available
Function
al
If Non
‐Fun
ctiona
l Re
marks
Repa
irab
le
Unserviceab
le
1 Co
mpu
ter
2 Printer
3 UPS
S – RE
SIDEN
CES (give nu
mbe
rs)
Sr. N
o.
Nam
e of Post
Reside
nce
Available
Reside
nce
Occup
ied
(Yes/N
o)
Physical Status of Residen
ce
Remarks
Reside
able
Not reside ab
le
1
2
3
T ‐ SER
VICES
Sr. N
o.
YES
NO
AIDS & HEP
ATITIS CO
NTR
OL
1 Syringe cutters available
2 Syringe cutters be
ing used
EPI
3 Co
ld Chain intact
4 All vaccines available at EPI Cen
ter
5 NATIONAL PR
OGRA
M FOR FP
& PHC
LH
W m
onthly m
eetin
g he
ld
6 LH
W m
onthly m
eetin
g repo
rt com
pleted
7
Mon
thly sup
plies / med
icines rep
lenished
8
MCH
Labo
ur Roo
m equ
ipmen
t available
9 Labo
ur Roo
m equ
ipmen
t fun
ctional
10
Family plann
ing services being
provide
d
11
LO
GISTICS
12
Gen
eral sup
plies available (Linen
s, bed
side
lockers, etc.)
81

U ‐ MONTH
LY PER
FORM
ANCE
Sr. N
o
Mon
thly Target
Performan
ce
1 No of children given full im
mun
ization coverage
2 Daily OPD
atten
dance
3 Delivery coverage at facility
V– GEN
ERAL RE
MARK
S
Time of Dep
arture from
the facility: Hou
rs ________ Minutes ________ am / pm
Certified
that th
is basic Hea
lth Unit was inspected toda
y by
the un
dersigne
d an
d the inform
ation stated
abo
ve is as
per facts an
d record.
______________
________________________________
_________________
Signature of DDOH/M
EA Signa
tures & Stamp of M
O/Incha
rge Signa
tures of DMO/EDOH
82
H Training Manual For Smartphone Application Use
Manual
for
Health Facility Information
Aggregation System
Directorate General Health Services
Supported By
Punjab Health Sector Reforms Program
Directorate General Health Services, Health Department, Government of the Punjab
CONTENTS
1. Introduction ..................................................... 1
2. About the phone .............................................. 3
3. About the application ...................................... 4
3.1. How to update forms if notified ........................ 7
3.2. How to fill a form ............................................ 10
3.2.1. How to fill a BHU form ........................... 11
3.2.2. How to fill an RHC form ......................... 20
3.2.3. How to fill a THQ form ........................... 30
3.2.4. How to fill a DHQ form ........................... 39
3.3. How to submit completed forms ..................... 48
Directorate General Health Services, Health Department, Government of the Punjab
1
1. INTRODUCTION
The Health Department of Government of the Punjab is committed to adopting state-of-the-art technology to strengthen governance and improve service delivery for all citizens. For this purpose, the Punjab Health Sector Reforms Program (PHSRP), with technical assistance from International Growth Centre (IGC) Team, is supporting DGHS and district health managers in strengthening the internal monitoring system of the Health Department. This is being done by introducing a mobile phone based information management system that is being rolled out across different districts of the province. This initiative will improve the internal information transmission within the Health Department and will ensure that timely, authentic and actionable information is sent quickly from individual facilities to district and provincial health managers on such crucially important issues as absenteeism, medicine stock outs, availability and functionality of equipment etc. Android-based smartphones have been provided to those district supervisory
officers, such as Executive District Health Officers (EDOs), District Health Officers (DOs), and Deputy District Health Officers (DDOs), who have been tasked with the collection of performance related data from Basic Health Units (BHUs), Rural Health Centers (RHCs) and Tehsil and District Headquarters (THQs and DHQs). The report submitted by these officers through the phone will be recorded on a website and automatically analyzed for use by managers at various levels. It is expected that this information will become a powerful tool for management both for district and central level officials. This is expected to bring about marked improvement in health service delivery management, particularly at primary and secondary levels of healthcare, leading to better health outcomes for the poor and disadvantaged in the province.
At Directorate General Health Services, Director, District Health Information System (DHIS), supported by the PHSRP and IGC team, is the focal person for implementation of the program at the provincial level. Overall responsibility for the program at the district level lies with EDOs, and Statistical Officers (SOs) are the designated focal persons for managing the system at the district level.
This manual contains basic information about the program and the phone, as well
Directorate General Health Services, Health Department, Government of the Punjab
2
as details of how to submit data and deal with some problems that may arise.
83

Directorate General Health Services, Health Department, Government of the Punjab
3
2. ABOUT THE
PHONE
The HTC Explorer runs on Android 2.3.5 with HTC’s latest custom interface - Sense 3.0, and is equipped with a 3.2 inch capacitive touch screen.
The phone has 4 capacitive touch buttons on the front- HOME, MENU, BACK and SEARCH.
With a 600 MHz processor based on the latest mobile technology, 512 MB of RAM and a 2 GB SD card, the phone is well equipped to deal with advanced tasks associated with smart-phones today.
The phone can be used for browsing the internet using either GPRS or WIFI. It is also equipped with a GPS device and a 3 MP camera which can capture high-resolution images and videos.
For detailed instructions regarding how to undertake different tasks on the phone and a comprehensive guide to unlocking the full potential of the device, please visit the following website:
http://www.htc.com/uk/help/htc-explorer/#overview
If you encounter any further problems while using the phone, please contact the helpline given at the end of this document.
Directorate General Health Services, Health Department, Government of the Punjab
4
3. ABOUT THE
APPLICATION
The Android application is very intuitive and simple to use. Before running the application, you must ensure that you are connected to the internet and the GPS is switched on. To confirm that you are connected to the internet, tap the ‘Internet’ icon on the home screen to launch the phone browser and try opening any webpage (e.g. yahoo.com); if the webpage opens up, it means you are connected to the internet. In this case, tap the phone’s ‘HOME’ capacitive touch button to return to the home screen. To confirm if GPRS (internet) is enabled or not, tap the phone’s ‘MENU’ capacitive touch button while on the home screen and select ‘Settings’ tab that pops on the bottom right of the screen, as shown below:
Choose ‘Wireless & networks’ from the list of settings that appear on the screen.
Then scroll down the page to check whether the option of ‘Mobile network’ is selected or not.
Directorate General Health Services, Health Department, Government of the Punjab
5
If it is selected, as shown, then the GPRS is switched on. If not, switch it on by checking this option. Confirm again by returning to the home screen by tapping “HOME” and opening any webpage using the phone’s browser. If it still does not open, report the issue on the helpline given at the bottom of this document. If the website opens, go back to the home screen.
To check if the GPS is on or off, check the power control widget on the main screen (the dark grey bar at the top with five large symbols); if the GPS symbol is highlighted, as shown below, the GPS is on. If not, tap the GPS symbol to toggle it on, before starting the application.
Once it is confirmed that the phone is connected to the internet and the GPS is switched on, tap the PHSRP icon on the home screen to start the application.
The application main screen has three buttons- ‘Start New Form’, ‘Send Finished Forms’ and ‘Manage Application’- as shown below:
Directorate General Health Services, Health Department, Government of the Punjab
6
In order to start making entries, the application needs to first download the relevant forms. There are four forms for each district; one for each type of facility- BHU, RHC, THQ and DHQ. For the case of the phones handed out, the relevant forms have already been downloaded. However, in case there are any revisions made, all concerned officials will be notified that the forms will have to be updated. Do not delete the forms unless you are formally notified to do so.
84

Directorate General Health Services, Health Department, Government of the Punjab
7
3.1. How to update
forms if notified
To update the forms on the application if you are notified to do so, tap the ‘Manage Application’ button. Considering Pakpattan as an example, the following screen will be displayed:
Select all the forms, or just the ones that you need to update as notified, by tapping on the checkboxes on the right, and tap the ‘Delete Selected’ button at the bottom right. A confirmation will be displayed as follows:
Tap ‘Delete Items’ to confirm and the selected forms will be deleted. If all the forms are deleted, the following screen will be displayed:
Now, tap ‘Get New Forms’, to retrieve the updated forms. The application will use the internet to list the updated forms of all districts for download as follows:
Directorate General Health Services, Health Department, Government of the Punjab
8
If you encounter an error at this point, it means you are not connected to the internet. Ensure that you are connected to the internet by following the instructions given previously and try again. If you encounter an error again, report the issue immediately on the helpline given at the end of this document. If there is no error and the above screen is displayed, scroll vertically to find the forms of your district and select them all by tapping the checkboxes on their right as shown:
Then, tap ‘Get Selected’ to download the updated forms of your district. Once the forms are successfully downloaded, the following screen will be displayed:
If there is some sort of error at this point, try downloading the forms again. If you are still unsuccessful, report the issue on the helpline to get an immediate solution.
Directorate General Health Services, Health Department, Government of the Punjab
9
If all forms are successfully downloaded and the above screen is displayed, tap ‘OK’ and the following screen will be displayed:
Tap the phone’s ‘BACK’ capacitive touch button at the bottom of the screen to get to the main screen of the application again. You are all set to continue to making and submitting entries now.
Directorate General Health Services, Health Department, Government of the Punjab
10
3.2. How to fill a
form
At this point, it is important to note that completing a form and submitting a form are two different tasks that are performed separately. Filling a form does not require an internet connection, so you can enter data from your inspection visits and save the completed forms regardless of whether the internet is working or not. However, submitting the forms requires an internet connection.
To start filling a form, tap the ‘Start New Form’ button from the main screen of the application.
The following screen will be displayed, prompting you to choose the type of facility:
Before moving on, it is important to note that if you want to close or discard the entry at any point before saving and exiting, tap the BACK capacitive button on the phone and choose ‘discard entry’. If you tap BACK by mistake, simply tap ‘Cancel’ on the dialogue box that pops up.
Furthermore, if you accidentally tap the phone’s ‘HOME’ capacitive touch button and end up at the home screen while filling in the form, simply tap the PHSRP application icon again to load the application again and it will return you to the screen you were previously at in the form with all previous entries made on the form intact.
85

Directorate General Health Services, Health Department, Government of the Punjab
11
3.2.1. How to fill a
BHU form
To fill a BHU form, choose the BHU form from the list shown above and the following screen will be displayed, instructing how to navigate through the form:
It is important to note here that you will be able to scroll back and forth within the form to check or change your entries before you complete the form, by scrolling laterally in one direction or the other, but whenever you scroll to a screen that requires numerical input from the keypad that pops up (as explained later), all numerical entries will be cleared and you will have to re-enter them.
Scroll laterally, as instructed, to start filling in the form. The next screen will allow you to choose the Tehsil in which the BHU is located, as shown below:
It is important to note at this time that some screens require at least one entry by the user, and you will not be able to move forward in the form unless it is made. To demonstrate, if you attempt to move forward in the form by scrolling laterally when it prompts you to enter the Tehsil in which the facility is located, the following message will appear on the screen:
Directorate General Health Services, Health Department, Government of the Punjab
12
You will have to select one of the options and then scroll laterally to move to the next screen. The next screen will require you to choose the BHU you are visiting from a list of all the BHUs present in that Tehsil. For demonstration, we select the Tehsil of Arifwala and scroll to the next screen. The following list is displayed:
Scroll vertically to find and choose the specific facility you are visiting, and scroll laterally to move to the next screen:
This screen relates to the availability status of the Medical Officer at the facility. An important thing to note here is that for all non-PRSP districts, the last option will not be shown on this screen as it does not apply to them. As Pakpattan is a PRSP district, the ‘Gone to other BHU’ option is available on the form.
Another important thing to note here is that all officers are required to make these entries from the perspective of a citizen visiting the facility- so even if the MO is on official leave or out on some official business at the time of the inspection visit, he/she would be marked absent. However, officers would also be required to take a note regarding the reason for absence of the MO in their diaries for such exceptional cases.
Directorate General Health Services, Health Department, Government of the Punjab
13
For demonstration, we choose Present and scroll laterally to the next screen:
This screen requires you to check all the people not present at the BHU. As mentioned for the case of the MO, the officer will mark people absent based on the perspective of a visiting citizen- if someone is out on official business or on official leave or even if the position is not filled etc., the position holder will be marked as absent, and a note will be made in the officer’s diary about the reason for absence for these exceptional cases.
If all the staff is present, you can scroll laterally to move to the next screen without marking any checkbox on this screen. The next screen requires you to mark tablets not available at the facility, as shown:
Scroll vertically and mark all the tablets that are out of stock at the BHU. If all tablets are present, scroll laterally to the next screen without marking any checkbox.
Repeat the same procedure for ‘Injections’, ‘Syrups’ and ‘Other Medicines’ in the subsequent screens as shown:
Directorate General Health Services, Health Department, Government of the Punjab
14
The next screen will require you to mark all equipment that is not functional. Unavailable equipment will also be marked as non-functional:
Leave the screen unmarked if all equipment is available and functional, and scroll laterally to the next screen.
86

Directorate General Health Services, Health Department, Government of the Punjab
15
The next screen will require you to tap in numerical values for the number of OPD cases last month, number of deliveries last month and number of Antenatal cases last month. A keypad will pop up at the bottom automatically so that you can enter the numbers. Tap on the entry bar of the next field to enter its number after you are done with the first one, and then move on to the third one after you are done with the second one. All three fields must be filled in order to move to the next screen. To get to the third field, you will have to scroll vertically lower down the page. While scrolling, ensure that you are avoiding the keypad, as scrolling over the keypad will not work.
Once all three entries are filled, scroll laterally to move to the next screen. Once again, ensure that you avoid the keypad as scrolling laterally over the keypad will not work.
The next screen will require you to enter the mobile numbers of any two randomly selected delivery patients from the BHU records from last month. The entry fields are designed to detect invalid numbers, and the application will not let you move to the next screen unless you enter two valid mobile numbers.
Once the two mobile numbers are entered, scroll laterally to move to the next screen.
The next screen will require you to enter mobile numbers of any two randomly selected ANC patients from last month. The entry fields on this page are also designed to detect invalid numbers, and the application will not let you move to the next screen unless you enter two valid mobile numbers.
Directorate General Health Services, Health Department, Government of the Punjab
16
Once the numbers are entered, scroll laterally to move to the next screen:
Choose the most appropriate option and scroll laterally to move to the next screen.
This screen will require you to mark which information was displayed in the BHU. Leave the screen unmarked and scroll laterally to the next screen if none of these were displayed at the facility.
Mark the options appropriately and scroll laterally to move to the next screen.
Directorate General Health Services, Health Department, Government of the Punjab
17
The next screen will require you to take a clear picture of yourself with the essential staff present at the BHU, as shown below:
Tap the ‘Take Picture’ button to load the camera. For better picture quality, it is advisable to take the picture indoors and have someone take it for you. To take the picture, have that person tap the silver button in the centre-bottom of the screen, as shown below:
When the picture is taken, you will be given the option of retaking it if you are not satisfied with it. Tap the camera icon on the right to load the camera again and take a better picture, as shown below:
Once you are satisfied with the picture, tap the ‘Done’ button on the left, and you will be taken to the following screen:
Directorate General Health Services, Health Department, Government of the Punjab
18
Scroll laterally to move forward. If, instead, you want to view the picture in full screen again, tap the picture preview box at the bottom, and you will be able to view it in full screen:
Tap the phone’s ‘BACK’ capacitive touch button at the bottom to return to the
previous screen. Once there, scroll laterally again to move to the next screen:
Tap ‘Record Location’ and the phone will record its location using GPS, network information and GPRS. It is advisable to move outdoors to record location as GPS signals are stronger outdoors. While you wait for the location to be recorded, you might see the accuracy radius values decreasing gradually:
87

Directorate General Health Services, Health Department, Government of the Punjab
19
When accuracy radius falls to 5 m, the following screen will be displayed:
GPS satellites are not always in range hence it might take some time for the phone to narrow down its location. If, even after waiting for five to ten minutes, the phone is unable to record its location, ensure that the GPS is toggled on and try
again. If, still, the phone is unable to record its location, contact the helpline immediately for quick resolution. Once the location is recorded, the above screen will be displayed. To move forward, scroll laterally again to get to the following screen:
Tap ‘Save Form and Exit’ to complete the entry. A message will be displayed notifying you that the form was saved successfully and you will be taken back to the main screen of the application.
Directorate General Health Services, Health Department, Government of the Punjab
48
3.3. How to submit
completed forms
Once you have completed the form (after pressing the ‘Save Form and Exit’ button), it needs to be submitted. After completing the form, tap the ‘Send Finished Forms’ button on the application main screen:
This will take you to a screen where all your completed and un-submitted forms are listed. Select the one you would like to submit or select all if you want to submit all, and tap the ‘Send Selected’ button on the bottom right of the screen.
If the submission was successful, a message will appear saying so, and the respective completed forms will vanish from this list. If all were selected and successfully sent, all will disappear. Tap the phone’s ‘BACK’ capacitive button to return to the application’s main screen.
If there is any error in submission, it can be because of the internet not working. In that case, confirm if the internet is working and try submitting the form/s again. If you are still unsuccessful, report your issue on the helpline given at the end of this document.
Tap the phone’s ‘HOME’ capacitive touch button to exit the application and return to the home screen of the phone once you have successfully submitted the forms.
Helpline: 0308 4091080
88

I Training Manuals For Dashboard Use
Manual
For
Health Facility Information
Management System
(Online Dashboard)
Directorate General Health Services
Supported By
Punjab Health Sector Reforms Program (PHSRP) International Growth Centre (IGC)
Lahore University of Management Sciences (LUMS)
Directorate General Health Services, Health Department, Government of the Punjab
CONTENTS
1. Introduction .......................................................................... 1
2. The Dashboard ..................................................................... 3
2.1. The District Level ...................................................... 5
2.1.1. Compliance Status ................................................. 5
2.1.2. Facility Status ........................................................ 8
2.1.3. Recent Visits ........................................................ 11
2.1.4. Indicators ............................................................. 12
2.1.5. Time Trend Charts ............................................... 14
2.1.6. Photo Verification ............................................... 16
2.1.7. Map ...................................................................... 17
2.2. The Provincial Level ............................................... 20
2.2.1. Compliance Status ............................................... 20
2.2.2. Facility Status ...................................................... 22
2.2.3. Indicators ............................................................. 23
2.2.4. Time Trend Charts ............................................... 24
Appendix ................................................................................. 26
Directorate General Health Services, Health Department, Government of the Punjab
1
1. Introduction
The Health Department of Government of the Punjab is committed to adopting state-of-the-art technology to strengthen governance and improve service delivery for all citizens. For this purpose, the Punjab Health Sector Reforms Program (PHSRP), with technical assistance from International Growth Centre (IGC) Team, is supporting DGHS and district health managers in strengthening the internal monitoring system of the Health Department. This is being done by introducing a mobile phone based, online information management system. This initiative will improve the internal information transmission within the Health Department and will ensure that timely, authentic and actionable information is sent quickly from individual facilities to district and provincial health managers on such crucially important issues as absenteeism, medicine stock outs, availability and functionality of equipment etc. Android-based smartphones have been provided to those district supervisory officers, such as Executive District Health Officers (EDOs), District Health Officers (DOs), and Deputy District Health Officers (DDOs), who have been tasked with the collection of performance related data from Basic Health Units (BHUs), Rural Health Centers (RHCs) and Tehsil and District Headquarters (THQs and DHQs). The report submitted by these officers through the phone will be recorded on a website, known as the ‘Dashboard’, and automatically analyzed for use by managers at various levels. It is expected that this information will become a powerful tool for management both for district and central level officials. This is expected to bring about marked improvement in health service delivery management, particularly at primary and secondary levels of healthcare, leading to better health outcomes for the poor and disadvantaged in the province.
Directorate General Health Services, Health Department, Government of the Punjab
2
At Directorate General Health Services, Director, District Health Information System (DHIS), supported by the PHSRP and IGC team, is the focal person for implementation of the program at the provincial level. Overall responsibility for the program at the district level lies with EDOs, and Statistical Officers (SOs) are the designated focal persons for managing the system at the district level.
This manual explains what information is available on the online dashboard and how it is displayed, to help managers at different levels to utilize this powerful tool to its full potential in order to improve health care in the province.
89

Directorate General Health Services, Health Department, Government of the Punjab
3
2. The Dashboard
The online dashboard can be accessed any time over the internet through the following link:
punjabmodel.gov.pk/phsrp/dashboard
When you open the link, the following page will be displayed, prompting you to enter your username and password, and giving you the option of saving these credentials for automatic login the next time you open the link, as shown in Figure 1.
Figure 1
To access the dashboard, you have to enter the unique username and password already communicated to you and click on ‘Login’. Once successfully logged in, you can also change your password for the dashboard by accessing the Change Password section in the blue bar. When you are done using the dashboard, you can click on ‘Logout’ to end the session.
Figure 2
Directorate General Health Services, Health Department, Government of the Punjab
4
As shown in Figure 2, the blue bar near the top of the page contains all the major sections of the dashboard, allowing you to effortlessly navigate from one part of the online tool to another.
One major feature of this tool is the ‘Print’ button/icon which is located to the right, just below the blue bar. Clicking this allows you to take a snapshot of whatever is currently being displayed on the dashboard and print it out.
It is important to note that there are two levels of access for the dashboard- the district level and the provincial level. All DCOs, EDOs, DOs and DDOs have access to the district level but not the provincial level, ergo when they log in, they are shown the district level by default. The relevant higher up senior officers, however, have access to the district level as well as the provincial level, so when they log in, their default view is the provincial level, but they can also choose to access the district level by choosing from a drop down list of districts near the top of the webpage.
Directorate General Health Services, Health Department, Government of the Punjab
5
2.1. The District Level
2.1.1. Compliance Status
The first page that is displayed when you log in the dashboard is the Compliance Status section. Officers can use this section to track their compliance performance for the current month as well the months before. They can also gauge their current standing compared to fellow health officers in the district with respect to compliance.
The most prominent characteristics of this page are the 2 bar charts and the table below them.
The first bar chart represents the percentage compliance of all the health officers in the district for the last calendar month, disaggregated by facility type. This is calculated as follows:
Percentage compliance= (total visits performed last month / visits assigned last month) x 100
The bars are color coded by facility type, as explained by the legend displayed on the page. Compliance is 100% if the officer performed 100% of the visits assigned to him or more.
The second bar chart represents the percentage coverage of all health officers in the district for the last calendar month, disaggregated by facility type. This is calculated as follows:
Percentage coverage= (1 – (no. of assigned facilities not visited by any officer last month/ facility count)) x 100
Once again, the bars are color coded by facility type, as explained by the legend displayed on the page, as shown in Figure 3.
Directorate General Health Services, Health Department, Government of the Punjab
6
Figure 3
90

Directorate General Health Services, Health Department, Government of the Punjab
7
The distinction between what the two charts convey is important and is easily explainable using an example. Suppose there are 10 facilities in an officer’s jurisdiction and he is assigned a total of 10 visits. If he visits every single facility once, his compliance as well as his coverage will be 100%. If he visits only 1 facility 10 times during the month, his compliance will still be 100% but his coverage will be 10%. Similarly, suppose if the assigned visits are 20 and the facility count is still 10; if he visits each facility once (leading to a total of 10 visits), his compliance will be 50% but his coverage will be 100%. Officers should strive for 100% compliance as well as the maximum possible coverage (which can be less than 100% only in cases where facility count exceeds the number of assigned visits).
The table below the charts gives detailed information regarding compliance figures. The ‘+’ icon before every officer’s designation in the ‘Supervisory Officer’ column can be clicked to expand the table to show information disaggregated by facility type. The information displayed in the table includes the facility count, monthly assigned visits, unique and total visits performed during the current month, unique and total visits performed last month, and the percentage compliance for last month, for every officer in the district, disaggregated by facility type as well as in total.
For cases in which compliance in the last calendar month is low, the table is highlighted red, as shown in Figure 4.
Figure 4
The last column provides hyper links, allowing you to jump directly to the relevant entries in the ‘Recent Visits’ section. The Recent Visits section will be explained in detail later on.
Directorate General Health Services, Health Department, Government of the Punjab
8
If you are interested to see compliance figures for months before the last calendar month, you can click on the ‘View Detailed Report’ hyperlinked text located near the top of the page.
Note: Should you find that a visit to a particular facility is not being displayed on the dashboard despite being successfully submitted from the Android smart phone allotted to you, please convey it immediately at the helpline given at the end of this document.
2.1.2. Facility Status
The Facility Status section gives you a list of all the facilities in the district, arranged by the date of last visit with the oldest visited at the top. It is designed to enable you to keep track of facilities that are being neglected. The facilities are color coded, according to the legend displayed on the page, as shown in Figure 5.
Figure 5
Directorate General Health Services, Health Department, Government of the Punjab
9
The page has different tabs for the different facility types. Each tab displays a table which displays the facility name, the Tehsil/Town it is located in, the designation of the officer who last visited the facility, the date of the last visit and the number of days since the last visit. The corresponding columns also have filters in-built that allow you to view selective information if you choose to.
The table also contains a column for Summary Report. Clicking the icon in this column for any row will take you to a page displaying details regarding the last visit to the facility as well as the second last visit, in addition to Tehsil variable averages (from 30 days from the last visit). Figure 6 shows a cropped screenshot of the page.
Figure 6
Directorate General Health Services, Health Department, Government of the Punjab
10
Clicking on the icon in the Recent Visits column for any facility, instead, will take you to the Recent Visits section showing you a list of all entries made for that facility, as shown in Figure 7.
Figure 7
Officers should ensure that all the facilities listed in the Facility Status section are green- some can be blue for cases in which the facility count is more than the assigned visits. Orange or red rows represent neglected facilities and they should be visited as soon as possible.
91

Directorate General Health Services, Health Department, Government of the Punjab
11
2.1.3. Recent Visits
The Recent Visits section lists all entries as they come in, with the latest submitted on top. There are different tabs for different facility types. Each facility type tab contains a date filter, which allows you to view entries submitted during a particular time period, and a table consisting of entries, as shown:
Figure 8
To view entries submitted between certain dates, choose the start and end dates from the drop down calendars displayed by clicking on the two white text boxes immediately below the facility type tabs respectively, and click the ‘Filter by Period’ button.
Directorate General Health Services, Health Department, Government of the Punjab
12
Some of the entries in the table might be highlighted red, as shown in the above screenshot. These represent facilities where significant staff absence was reported. The table also allows you to display only the highlighted entries or the non-highlighted entries separately, in addition to displaying them all together. The drop down filter for the column labeled ‘Absence’ can be used to toggle between the selections.
The table also contains information that includes the facility name, the Tehsil/Town it is located in, the visiting officer, the date of visit, the availability status of the MO and the availability status of other staff. It also provides filters for all these categories for selective searches.
The Summary Report icon at the end of every entry in the table can lead you to a page displaying details regarding the last visit to the facility as well as the second last visit, in addition to Tehsil/Town variable averages (from 30 days from the last visit) as already depicted in Figure 6.
As already mentioned, should you find that a visit to a particular facility is not being displayed on the dashboard despite being successfully submitted from the Android smart phone allotted to you, please convey it immediately at the helpline given at the end of this document.
2.1.4. Indicators
The Indicators section displays charts comparing performance of the different Tehsils/Towns based on the various indicators reported during facility visits. Once again, there are different tabs for different facility types, and different indicators, in some cases, for different tabs. The following screenshot should give you an idea of what the page looks like:
Directorate General Health Services, Health Department, Government of the Punjab
13
Figure 9
It is important to note that while there are multiple BHUs, RHCs and THQs in each district, the number of DHQs is one or zero. Hence, instead of a comparison across Tehsils/Towns as for the case of BHUs, RHCs and THQs, the DHQ section compares DHQs across districts. Furthermore, all indicator charts that display data expressed in percentages in the DHQ section have an additional red bar which reflects percentage compliance in every district. The compliance bars are intended to be a gauge of how many visits’ data is used to derive the charts- ergo, the higher the compliance, the more reflective is the value of the variable of the actual situation in the corresponding district.
For all tabs, there is a text box allowing you to choose which month you want to see the data for. The page displays charts for the last calendar month by default. If you want to access charts for some previous month, you need to click on the white text box, select the month and year from the drop down
Directorate General Health Services, Health Department, Government of the Punjab
14
menu, click ‘Done’, and then click the ‘Update’ button located to the immediate right.
Most indicators in the list have multiple charts that are displayed when you click on any one of them. All charts have descriptive labels that clearly indicate what they represent. Tables 1 through 4 in the appendix show how the charts are arranged for each facility type.
These charts can prove to be a very powerful tool for Tehsil-wise comparison based on the different performance related indicators. However, if taken in isolation, interpretations derived from them may be misleading. For example, if Tehsil ‘A’ shows 0% MO absence while Tehsil ‘B’ shows 20% MO absence, it doesn’t necessarily imply that Tehsil ‘A’ is better in MO attendance than Tehsil ‘B’. It is possible that only a single visit was performed in Tehsil ‘A’ in the entire month- during which the MO was present- while, out of the 10 visits performed in Tehsil ‘B’, the MO was absent in only 2. Ergo, the information displayed in the charts should always be interpreted while considering compliance figures.
2.1.5. Time Trend Charts
The Time Trend Charts section contains line graphs representing the change over time in all the indicators of the different facility types present in the Indicators section as shown in Tables 1, 2, 3 and 4 in the appendix. The general layout of this section is very similar to that of the Indicators section, with the same indicator tabs and option to select a different month for all facility types. However, there is one key difference; the charts contain two lines- a thin one representing the district average and a thick one representing the provincial average- allowing you to compare the average district performance on each indicator to the provincial average, over time, instead of comparing across Tehsils/Towns of the same district. Figure 10 shows how the webpage might look.
92

Directorate General Health Services, Health Department, Government of the Punjab
15
Figure 10
You can also compare the performance of any Tehsil/Town compared to the district average over time. This can be done by clicking the drop down button near the top of the page and selecting the Tehsil/Town you want to compare with the district average. In the charts that will be displayed as a result, the thick line would represent the district’s average and the thin line would represent the Tehsil/Town average.
These charts can prove to be very useful in observing and comparing trends in different indicators over time, at the provincial, district, as well as the Tehsil/Town level.
Directorate General Health Services, Health Department, Government of the Punjab
16
2.1.6. Photo Verification
To verify staff presence, the smart-phone Performa requires officers to take pictures of the essential staff present at the facility they are visiting. The Photo Verification section displays all these, sorted by the most recent visit, by officer designation. Figure 11 shows the layout of the page.
Figure 11
You can view the full size version of any picture by clicking on it. Health officers responsible for supervision of BHUs, RHCs, THQs and DHQs are advised that the pictures submitted should not be blurry or unclear in any way for the convenience and effectiveness of photo verification.
Directorate General Health Services, Health Department, Government of the Punjab
17
2.1.7. Map
When you click on the tab for the Map section, a separate window (or tab, depending on your browser) will open, displaying a map of Pakistan and its surrounding areas as shown in Figure 12.
Figure 12
For completing an entry for a facility visit, the smart-phone Performa requires the supervisory officer to record the location of the facility using the phone’s GPS. All successfully submitted entries show up on this map when you zoom down to individual district.
In order to view entries for any district, you need to click on the relevant district tab from the list on the left. Once you zoom in, all the relevant entries will show up as place-marks color-coded with respect to the facility type, as shown in Figure 13.
Directorate General Health Services, Health Department, Government of the Punjab
18
Figure 13
You can zoom further in or out using the zooming tool in the upper left corner of the map. The map also allows you to show or hide District and Tehsil boundaries, and even switch between Map and Satellite view. Furthermore, the date filter allows you to see only those entries submitted during a certain time period.
Clicking on any place-mark reveals a few details regarding the entry that include the supervisory officer’s designation, the date the entry was made, the start and end time of the visit and a link to the picture taken for the entry, as shown in Figure 14.
93
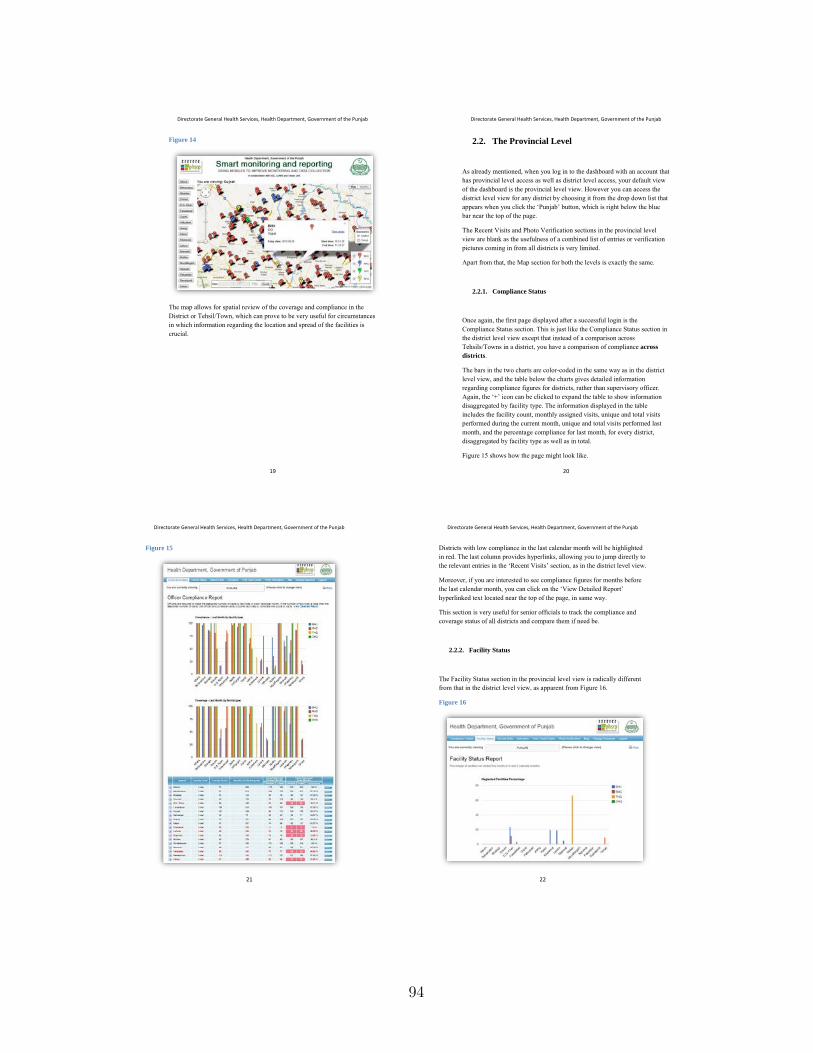
Directorate General Health Services, Health Department, Government of the Punjab
19
Figure 14
The map allows for spatial review of the coverage and compliance in the District or Tehsil/Town, which can prove to be very useful for circumstances in which information regarding the location and spread of the facilities is crucial.
Directorate General Health Services, Health Department, Government of the Punjab
20
2.2. The Provincial Level
As already mentioned, when you log in to the dashboard with an account that has provincial level access as well as district level access, your default view of the dashboard is the provincial level view. However you can access the district level view for any district by choosing it from the drop down list that appears when you click the ‘Punjab’ button, which is right below the blue bar near the top of the page.
The Recent Visits and Photo Verification sections in the provincial level view are blank as the usefulness of a combined list of entries or verification pictures coming in from all districts is very limited.
Apart from that, the Map section for both the levels is exactly the same.
2.2.1. Compliance Status
Once again, the first page displayed after a successful login is the Compliance Status section. This is just like the Compliance Status section in the district level view except that instead of a comparison across Tehsils/Towns in a district, you have a comparison of compliance across
districts.
The bars in the two charts are color-coded in the same way as in the district level view, and the table below the charts gives detailed information regarding compliance figures for districts, rather than supervisory officer. Again, the ‘+’ icon can be clicked to expand the table to show information disaggregated by facility type. The information displayed in the table includes the facility count, monthly assigned visits, unique and total visits performed during the current month, unique and total visits performed last month, and the percentage compliance for last month, for every district, disaggregated by facility type as well as in total.
Figure 15 shows how the page might look like.
Directorate General Health Services, Health Department, Government of the Punjab
21
Figure 15
Directorate General Health Services, Health Department, Government of the Punjab
22
Districts with low compliance in the last calendar month will be highlighted in red. The last column provides hyperlinks, allowing you to jump directly to the relevant entries in the ‘Recent Visits’ section, as in the district level view.
Moreover, if you are interested to see compliance figures for months before the last calendar month, you can click on the ‘View Detailed Report’ hyperlinked text located near the top of the page, in same way.
This section is very useful for senior officials to track the compliance and coverage status of all districts and compare them if need be.
2.2.2. Facility Status
The Facility Status section in the provincial level view is radically different from that in the district level view, as apparent from Figure 16.
Figure 16
94

Directorate General Health Services, Health Department, Government of the Punjab
23
The page displays a single bar chart representing the percentage of facilities that are being neglected in each district. The bars are color-coded based on the facility type.
The criterion for a facility to be considered neglected is that it is not visited by any supervisory officer in the current month as well as the last two calendar months. Senior officials can easily identify which district has the highest percentage and take appropriate measures to rectify the situation.
2.2.3. Indicators
The Indicators section in the province level view is very similar to that in the district level view in terms of layout and structure. The variables are exactly the same as those in the district level view, as detailed in Tables 1, 2, 3 and 4 in the appendix.
One major difference between the two views, however, is that instead of a comparison across Tehsils /Towns in a district, the provincial level charts compare performance across districts for all the indicators.
Also, indicator charts in the province level view contain extra red bars representing compliance for the BHUs, RHCs and THQs as well as the DHQs, whereas this is only true for DHQs in the district level view of the Indicators section. As previously explained, the compliance bars serve as a gauge of how many visits’ data is used to derive the charts- meaning that the higher the compliance, the more the value of the variable is reflective of the actual situation in the corresponding district
Figure 17 depicts a screenshot of the section.
Directorate General Health Services, Health Department, Government of the Punjab
24
Figure 17
This section can prove very useful to track performance of and across districts in terms of various indicators.
2.2.4. Time Trend Charts
The Time Trend Charts section in the province level view is exactly the same as that in the district level view, except that there isn’t an extra line for any district on any of the charts; just a thick line representing the trend of provincial averages for the same indicators over time, as depicted in Figure 18.
Directorate General Health Services, Health Department, Government of the Punjab
25
Figure 18
As already mentioned, you can move to the district level view if you want a comparison of the provincial average with a district’s average, or even to the Tehsil/Town level view if you want a comparison of the district average with a Tehsil/Town’s average, over time.
Helpline: 0321-4525808
95