NBER WORKING PAPER SERIES THE LAW AND ECONOMICS …
67
NBER WORKING PAPER SERIES THE LAW AND ECONOMICS OF SELF-DEALING Simeon Djankov Rafael La Porta Florencio Lopez-de-Silanes Andrei Shleifer Working Paper 11883 http://www.nber.org/papers/w11883 NATIONAL BUREAU OF ECONOMIC RESEARCH 1050 Massachusetts Avenue Cambridge, MA 02138 December 2005 The authors are from the World Bank, Dartmouth College, University of Amsterdam, and Harvard University, respectively. They would like to thank Eugenio de Bellard, Melissa Johns and Nikolay Naumovich for their outstanding help with collecting and analyzing the data. The vews presented in this paper do not reflect those of the World Bank or of Lex Mundi. The views expressed herein are those of the author(s) and do not necessarily reflect the views of the National Bureau of Economic Research. ©2005 by Simeon Djankov, Rafael La Porta, Florencio Lopez-de-Silanes, and Andrei Shleifer. All rights reserved. Short sections of text, not to exceed two paragraphs, may be quoted without explicit permission provided that full credit, including © notice, is given to the source.
Transcript of NBER WORKING PAPER SERIES THE LAW AND ECONOMICS …

NBER WORKING PAPER SERIES
THE LAW AND ECONOMICS OF SELF-DEALING
Simeon DjankovRafael La Porta
Florencio Lopez-de-SilanesAndrei Shleifer
Working Paper 11883http://www.nber.org/papers/w11883
NATIONAL BUREAU OF ECONOMIC RESEARCH1050 Massachusetts Avenue
Cambridge, MA 02138December 2005
The authors are from the World Bank, Dartmouth College, University of Amsterdam, and HarvardUniversity, respectively. They would like to thank Eugenio de Bellard, Melissa Johns and NikolayNaumovich for their outstanding help with collecting and analyzing the data. The vews presented in thispaper do not reflect those of the World Bank or of Lex Mundi. The views expressed herein are those of theauthor(s) and do not necessarily reflect the views of the National Bureau of Economic Research.
©2005 by Simeon Djankov, Rafael La Porta, Florencio Lopez-de-Silanes, and Andrei Shleifer. All rightsreserved. Short sections of text, not to exceed two paragraphs, may be quoted without explicit permissionprovided that full credit, including © notice, is given to the source.

The Law and Economics of Self-DealingSimeon Djankov, Rafael La Porta, Florencio Lopez-de-Silanes, and Andrei ShleiferNBER Working Paper No. 11883December 2005JEL No. G3, G38, K22
ABSTRACT
We present a new measure of legal protection of minority shareholders against expropriation by
corporate insiders: the anti-self-dealing index. Assembled with the help of Lex Mundi law firms, the
index is calculated for 72 countries based on legal rules prevailing in 2003, and focuses on private
enforcement mechanisms, such as disclosure, approval, and litigation, governing a specific self-
dealing transaction. This theoretically-grounded index predicts a variety of stock market outcomes,
and generally works better than the commonly used index of anti-director rights.
Simeon DjankovWorld [email protected]
Rafael LaPortaTuck School314 WoodburyHanover, NH 03755and [email protected]
Florencio Lopez-de-SilanesEcole Normale SuperieurParis-Jourdan Science Economiques48, Boulevard Jourdan; 75014 Parisand [email protected]
Andrei ShleiferDepartment of EconomicsHarvard UniversityLittauer Center M-9Cambridge, MA 02138and [email protected]

1
1. Introduction.
Over the last twenty years, both academic and practical approaches to corporate
governance have increasingly focused on the problem of investor expropriation, sometimes also
referred to as self-dealing or tunneling. Specifically, those who control a corporation, whether
they are managers, controlling shareholders, or both, can use their power to divert corporate
wealth to themselves, without sharing it with the other investors. Various forms of such self-
dealing include executive perquisites to excessive compensation, transfer pricing, taking of
corporate opportunities, self-serving financial transactions such as directed equity issuance or
personal loans to insiders, and outright theft of corporate assets.
The new emphasis on self-dealing is reflected in both theoretical and empirical work.
Earlier research on corporate governance has focused on such problems as managerial
consumption of perquisites (Jensen and Meckling 1976), managerial effort (Holmstrom 1979),
and over-investment in pursuit of growth (e.g., Baumol 1959, Jensen 1986). Modern theory of
corporate finance instead focuses on the ability of corporate insiders to divert corporate wealth to
themselves, reflected in the diplomatically named “private benefits of control” (Grossman and
Hart 1988, Hart 1995, Zingales 1994). Empirically, such diversion of resources from firms to
their controllers has been investigated in several contexts, including the U.S. savings and loans
crisis (Akerlof and Romer 1993), the Mexican and Asian financial crises (La Porta, Lopez-de-
Silanes, and Zamarripa 2003, Johnson et al. 2000a), legal disputes over tunneling (Johnson et al.
2000b), and corporate governance during the transition from socialism (e.g., Glaeser, Johnson,
and Shleifer 2001). The extent of diversion has also been measured by estimating the private
benefits of control from the market pricing of shares with superior voting rights and from the
treatment of controlling shareholders in takeovers (e.g., Nenova 2003, Dyck and Zingales 2004).

2
Parallel to this recognition of the importance of corporate self-dealing, economists have
followed legal scholars (e.g., Clark 1986) in recognizing the crucial role played by the law in its
control. Initial research in this area argues theoretically and shows empirically that differences
in legal investor protection across countries shape the ability of insiders to expropriate outsiders,
and thus determine investor confidence in markets and consequently their development (Shleifer
and Vishny 1997, La Porta et al. 1997, 1998, Shleifer and Wolfenzon 2002). Yet while this
research presents several empirical measures of investor protection that predict financial
outcomes, it does not focus on self-dealing explicitly. In this paper, we rectify this omission.
So what should be the role of the law in addressing corporate self-dealing? One approach
is to do nothing, and to count on market forces to sort out the problem. Virtually no society uses
this approach: the temptation to “take the money and run” in an unregulated environment is just
too great. At the other extreme, a society can prohibit conflicted transactions altogether: all
dealings between a corporation and its controllers – or any other entity these controllers also
control – could be banned by law. Yet no society finds it practical to use this approach either,
perhaps because in many instances related-party transactions actually make economic sense. So
what do societies actually do?
In this paper, we explore this question empirically. To this end, we describe a
hypothetical self-dealing transaction between two firms controlled by the same person, which
can in principle be used to improperly enrich this person. We then ask attorneys from Lex
Mundi law firms in 102 countries to describe in detail how each country’s legal system regulates
this transaction. In principle, several approaches can be used. One approach is to facilitate
private enforcement of good behavior. This approach emphasizes extensive disclosure (sunshine
as the best disinfectant), approval procedures for transactions, and facilitation of private litigation

3
when self-dealing is suspected. Another approach is to rely on public enforcement, including
fines and prison terms for self-dealing, as the United States has been increasingly doing through
the Sarbanes-Oxley Act. From the detailed answers supplied by Lex Mundi attorneys, we
construct numerical measures of the intensity of regulation of self-dealing along a variety of
dimensions, covering both public and private enforcement. The anti-self-dealing indices are
constructed for 72 countries. These data enable us to address three broad sets of questions
concerning the regulation of corporate self-dealing in different societies.
First, we ask what factors determine the structure of the regulation of self-dealing in
different countries. In previous work, we have argued that the country’s legal origin, including
the common law, French civil law, German civil law, Scandinavian law, and Socialist law, is an
important determinant of the country’s strategy for protecting investors. We found systematic
differences among legal origins in the protection of both minority shareholders and creditors
through corporate and bankruptcy laws (La Porta et al. 1997, 1998) and in the intensity of
regulation of security issuance through security laws (La Porta, Lopez-de-Silanes, and Shleifer
2006). In this paper, we develop measures of investor protection much more directly linked to
the control of self-dealing, and examine the variation of these measures across legal origins.
Second, we examine whether the anti-self-dealing measures we construct are related to
the development of financial markets, and if so which aspects of social regulation of self-dealing
are related to which financial outcomes. This enables us to evaluate alternative strategies of
regulation of self-dealing from both the scientific and the policy perspectives.
Third, we compare the performance of alternative measures of shareholder protection as
predictors of financial development. To this end, we first present revised estimates of the anti-
director rights index of La Porta et al. (1997, 1998) for our larger sample of countries. Several

4
authors have criticized this index for both its ad hoc nature (which the creation of our anti-self-
dealing index is supposed to address), and for several conceptual ambiguities and outright
mistakes in coding (Pagano and Volpin 2005, Spamann 2005). Here we address these concerns,
and then examine the predictive powers of the revised anti-director rights index, the anti-self-
dealing index, and two measures of investor protection derived from securities laws (La Porta,
Lopez-de-Silanes, and Shleifer 2006). The results reveal some important similarities between
these very different measures of investor protection, but also some key differences.
As a last note, we emphasize that we consider garden-variety self-dealing transactions, in
which the controllers of companies make choices that may benefit them at the expense of other
investors, but follow the law regarding disclosure and approval procedures. We are not dealing
with cases of corporate crime such as Enron or Parmalat. To stop such cases, every country uses
harsh criminal punishments. We are interested in a very different situation: if a controlling
shareholder wants to enrich himself but also to follow the law, how difficult is it for minority
shareholders to thwart the deal before it goes through and to recover damages if it is carried out?
2. Methodology.
Our data are based on answers to a questionnaire completed by attorneys from Lex
Mundi law firms. Lex Mundi is an association of international law firms with members in 108
countries. We invited Lex Mundi firms to participate in the project and received complete
answers from 102 of them. After processing the authors’ answers, we conducted follow-up
conference calls to seek clarifications and asked respondents to confirm our coding of the data.
The sample we use in this paper is based on the answers of 72 authors who have confirmed the
validity of our data. The countries included in the sample represent 99.3% of total world market

5
capitalization in 2003. Among the countries that are not included in the sample, Saudi Arabia
has the largest stock market (ranked 24th in the world), followed by Iran (ranked 41st in the
world), and West Bank and Gaza (ranked 55th in the world).
A key contribution of this paper is to construct an index of the strength of minority
shareholder protection against self-dealing by the controlling shareholder (anti-self-dealing
index). Our earlier index of anti-director rights (La Porta et al. 1997, 1998) was based on an ad-
hoc collection of variables meant to capture the stance of corporate law toward shareholder
protection. The present index addresses the ways in which the law deals with corporate self-
dealing in a more theoretically grounded way. Specifically, we start with a fixed self-dealing
transaction, and then measure the hurdles that the controlling shareholder must jump in order to
get away with this transaction. The higher the hurdles, the higher the anti-self-dealing index is.
As a first step, we describe to the Lex Mundi law firms the stylized transaction between
two companies (“Buyer” and “Seller”) illustrated in Figure I. We assume that Mr. James owns
90% of Seller and 60% of Buyer, and that the latter is a publicly-traded firm. Mr. James is a
director of Buyer and his son is its CEO. Seller operates a chain of retail hardware stores and has
recently shut down many stores. As a result, some trucks in Seller’s fleet are not being used.
Mr. James proposes that Buyer purchases Seller’s idle trucks for a cash payment equivalent to
10% of Buyer’s assets (the transaction). He argues that Buyer could use additional trucks to
expand its sales. Mr. James is on both sides of the transaction and could benefit if Buyer
overpays for Seller’s trucks. In fact, under our case facts, a $100 wealth transfer from Buyer to
Seller would reduce the value of Mr. James’ equity in Buyer by $60 but increase the value of his
equity in Seller by $90. Although the proposed transaction has a possible business purpose, it
involves an obvious conflict of interest.

6
To gather data on the regulation of self-dealing, we designed an extensive questionnaire
and tested it on nine Lex Mundi firms. A revised questionnaire was sent to all Lex Mundi firms.
The lawyers received the case study and were asked to describe the minimum legal requirements
in force in May 2003 regarding: (1) who approves the transactions; (2) what needs to be
disclosed to the board of directors or supervisory board, the shareholders, the stock exchange,
and the regulators; (3) what are the duties of officers, directors, and controlling shareholders; (4)
how the transaction’s validity could be challenged; (5) what causes of action are available if
Buyer suffers damages; (6) what needs to be proved under each cause of action; (7) who has
standing to sue under each available cause of action; (8) availability of direct and derivative
suits; (9) access to information and discovery rights; and (10) fines and criminal sanctions.
The lawyers based their answers on all binding (i.e., not voluntary guidelines) laws and
regulations applicable under our case facts and substantiated their answers with references to all
relevant legal provisions. In addition, they provided the text of laws, statutes, judicial precedent,
and regulatory opinions used to answer our questionnaire. Sources of law typically incuded: (1)
company act; (2) civil and commercial code; (3) case law and judicial precedent; (4) stock
market act and regulations; (5) stock exchange listing rules; (6) civil procedure code; and (7)
criminal code. We read the relevant laws and coded the respondents’ answers. Finally, we
emailed our coding of the data to the respondents and held conference calls with every country to
confirm our interpretation of their answers and to make sure that our coding of the data is
comparable across countries.

7
The Regulation of Self-Dealing
In theory, the law can regulate a transaction involving conflicts of interest so that it
replicates the terms and conditions that would exist in an arm’s-length transaction. The law can
also empower minority shareholders to seek remedy for expropriation through the courts or to
provide fines and criminal sanctions to those who expropriate. Below we describe our approach
to organizing the data. The exact definitions of the variables are contained in Table I.
We examine several areas of law relevant to the transaction and summarize them with
one index of investor protection against self-dealing and one of public enforcement. To measure
the role of private enforcement, we keep track of disclosure and approval requirements imposed
by law before Buyer may legally acquire Seller’s trucks and of immediate disclosures after the
decision to enter into the transaction has been made. Since even a duly approved and disclosed
transaction may damage Buyer, litigation may be necessary to obtain restitution. Accordingly,
we also keep track of how easy it is for minority shareholders to obtain redress through the
courts when the transaction damages Buyer if all disclosure and approval requirements are met.
The last assumption is crucial since the laws of most countries provide harsh penalties for
breaking disclosure and approval requirements. Factors that affect the odds that the plaintiff
prevails in court include liability standards and the right to compel evidence.
In addition to looking at measuring private enforcement, we capture the strength of public
enforcement by keeping track of the fines and sanctions that may be applicable to Mr. James and
those in charge of approving the transaction.
To be more specific, begin with private enforcement. The first area that the law may seek
to regulate is the approval process. The basic choice is whether the transaction requires approval
by disinterested shareholders or alternatively may be approved by the CEO, the board of

8
directors (a majority of whose members were by case assumptions appointed by the controlling
shareholder who is on both sides of the transaction), or the shareholder meeting where the
controlling shareholder votes. An important assumption in our case facts is that all parties (i.e.,
controlling shareholder, CEO, and directors) vote in favor of the transaction whenever legally
possible even when doing so may expose them to greater litigation risk. Thus where the
interested party – or people under his control – can act to influence the outcome of the decision,
we assume that they do. For this reason, we separate out disinterested shareholder approval as
the purest case of arms-length endorsement of the transaction.
Another critical way in which the law may seek to regulate the approval process is by
mandating extensive disclosures by the company and the related party on the view that "sunshine
is the best disinfectant" (Brandeis 1914). We keep track of the extent of disclosures by Buyer
and the controlling shareholder before the transaction goes through.1 Finally, before the
transaction is approved, the law may require a review by independent third parties (e.g., financial
experts) who make available a report on the transaction and may act as a check on the
opportunism of the insiders. We summarize our data on approval requirements and immediate
disclosures through an index of ex-ante private control of self-dealing by investors.
The second area that the law may seek to regulate is the ease with which minority
shareholders can prove wrongdoing. First, disclosure requirements in annual reports and
periodic filings may facilitate the scrutiny of related-party transactions by outside shareholders.
The extent of such disclosure varies across jurisdictions.
1 Empirical studies of disclosure center on the effect of disclosure requirements imposed by securities laws on stock market outcomes. The early empirical literature was inconclusive (Stigler 1964, Benston 1973). Recent studies find that mandatory disclosure rules are associated with larger stock markets in a cross-section of countries (La Porta et al. 2006) and higher market valuations in the US (Greenstone et al. 2006).

9
Second, in most jurisdictions, any damage that the transaction causes is assigned to Buyer
rather than to any individual shareholders. Since Buyer is unlikely to pursue legal action that
would harm its controlling shareholder, we measure the obstacles (e.g., high ownership
requirements) faced by minority shareholders to gain standing to sue on behalf of Buyer. The
cost of private enforcement increases with the obstacles faced by minority shareholders to sue
derivatively.
Third, courts may void the transaction in cases of negligent approval or approval in bad
faith, or alternatively when the transaction is merely unfair or involves a conflict of interest and
damages the company. Similarly, Mr. James and Buyer’s directors may be liable for damages if
it can be proved that: (1) they acted in bad faith; or (2) they acted with negligence; or (3) that the
transaction was unfair or involved a conflict of interest. Naturally, private enforcement is more
costly when plaintiffs need to prove bad faith on the part of Mr. James or directors than when
they are merely required to show that the transaction involved a conflict of interest.
Fourth, plaintiffs are more likely to prevail if access to evidence is extensive. We
consider three aspects of access to evidence: 1) whether plaintiffs can request the court to
appoint an inspector to examine the affairs of the company; 2) whether plaintiffs must identify
(e.g., by providing title and author) the specific documents that they seek to review; and 3)
whether plaintiffs can directly question defendants and non-parties in court. We combine our
proxies for ex-post disclosure and the ease of proving wrongdoing into an index of ex-post
private control of self-dealing.
Finally, we create an anti-self-dealing index by averaging the indices of ex-ante and ex-
post private control of self-dealing.

10
We next consider public enforcement. The law may deter wrongdoing by sanctioning the
controlling shareholder and those who approved the transaction with fines and criminal
sanctions. As a practical matter, most countries impose severe criminal sanctions when the
transaction has been approved in violation of the law. For this reason, we only measure the
sanctions that apply to Mr. James and those who approved the transaction if all disclosure and
approval requirements have been met. To be sure, this is not the principal focus of criminal law.
Even under our case facts, fines and criminal sanctions apply to behavior ranging from
criminal intent to obtain unlawful profit to breaches of duties of care and loyalty. To illustrate
the scope of such sanctions, consider an example. Under our case facts, Mr. James abstains from
a board vote on the proposed transaction if legally required to do so. However, while abstaining
from voting, Mr. James can still influence other members of the board to approve the transaction
so that he can obtain a personal benefit at the expense of the company. In Belgium, the directors
who approved the transaction – but not Mr. James – will face criminal sanctions for misuse of
company assets. Mr. James does face criminal sanctions in Sweden if he intentionally caused
damage to the company. The scope of criminal sanctions is wider in Germany where members of
the management board can be criminally liable for breach of trust if they violate their duty to
care for the assets of the company and the company suffers damages. We keep track of
maximum fines and prison terms applicable for such violations of the law.
3. Regulation of Self-Dealing Across Countries.
Table II presents our data on approval and immediate disclosure requirements. Countries
are arranged by legal origin, and we report the means for each legal origin and the tests of the
differences in these means.

11
Two examples, Italy and the UK, illustrate our data and empirical approach. Italy ranks
42nd on our anti-self-dealing index, and is representative of civil law countries. The UK ranks
5th, and most common law countries (but not the US) model their regulation of self-dealing on
the UK. Briefly, related party transactions in Italy are approved by disinterested directors, not
shareholders. Most of the disclosure regarding related party transactions takes place in periodic
filings. When related-party transactions cause damage to the firm, the cost of private litigation is
very high. In contrast, related-party transactions in the UK are reviewed by independent
financial experts and approved by disinterested shareholders. Extensive disclosure takes place
both before and after the transaction is approved. However, as in Italy, litigation in the UK is
costly. To substantiate these claims, we next discuss these two countries in further detail.
In Italy, Mr. James, as an interested director of Buyer, has to notify the other directors as
well as the internal auditor of his interest in the transaction (i.e., his relation to and ownership in
Seller), and abstain from participating in the decision. Moreover, because Mr. James is a
director of Buyer, the transaction must be approved by Buyer’s disintereseted directors – but not
disinterested shareholders. In addition, Buyer’s internal auditor is required to attend the meeting
of the board of directors and review the transaction.
Once the board of directors approves the transaction, Buyer has fifteen days to make
public a document describing it. This document must include: (1) a description of the assets
purchased by Buyer; (2) the nature and amount of consideration paid by Buyer to Seller; (3) an
explanation or justification for the price paid by Buyer for Seller’s assets; (4) the fact that Mr.
James owns 60% of Buyer; (5) the fact that Mr. James owns 90% of Seller; and (6) all facts
about the transaction that a reasonable person would believe to be material.

12
Gaining standing to sue is straigthforward in Italy. Any shareholder or group of
shareholders owning 5% of the shares in the company may sue the directors on behalf of Buyer.
However, shareholders would rarely exercise their right to sue as their odds of prevailing in court
are slim. First, the transaction cannot generally be voided or rescinded provided that it was
approved by disinterested directors and all required disclosures were made. Second, holding
disinterested directors liable for damages requires proving that they acted negligently and that
their actions caused damages to Buyer. Italian courts have stated that, generally, directors cannot
be held liable on the merit of their actions, provided that they acted with care, diligence and in a
professional manner. Third, and most importantly, Mr. James cannot be held liable if he has
abstained from voting.
Shareholders in Italy may have a hard time gaining access to the information required to
prove that Buyer’s disinterested directors acted negligently. First, in case of a well-founded
suspicion of serious irregularities in directors’ conduct, shareholders holding 5% of the shares
can report the facts to the court. The court can then order an investigation of the Company’s
management at the expense of the claiming shareholders. Second, the plaintiff’s request for
documents must specifically identify the document(s) sought (e.g., indicate title, author, date,
and contents). Third, the Judge – not the plaintiff -- is in charge of questioning non-party
witnesses. Fourth, normally parties (e.g., plaintiffs) are not permitted to give evidence in the
case. When they are allowed to testify, the questioning of parties follows the same procedures as
that of non-parties.
To wrap up the review of Italy, criminal sanctions and fines generally apply in case of
fraud but are unavailable under our case facts. As a result, the regulation of self-dealing in Italy
is solely based on trusting disclosure after the fact and on disinterested directors doing the “right

13
thing”. In this regard, disinterested directors are unlikely to be found negligent if they lend their
support to a transaction which, while favoring Mr. James, has a plausible business purpose. At
the same time, disinterested directors owe their position on Buyer’s board to Mr. James.
In the U.K., modern regulation of self-dealing evolved from the common law equitable
rule that directors, being subject to fiduciary duties, could not enter into engagements with their
company when they had or could have had a conflicting personal interest or a conflict with the
interests of those they were bound to protect. This “no conflict” rule was subject to an important
exception: conflicted contracting was permitted provided that the conflict of interest was
disclosed in advance to the shareholders, who then approved the transaction. The scope of this
rule was enormous. The requirement of shareholder approval did not require showing an actual
conflict of interest between the company and the director (a potential for conflict was enough).
Nor was it necessary to show that the conflict had an impact on the terms of the transaction. All
self-dealing transactions required shareholder approval even if they appeared fair.
As discussed in Davies (2002), during the nineteenth century the rule of equity lost its
bite as courts came to accept that shareholder approval for self-interested transactions could be
granted in general, rather than for specific transactions, in the articles of association. Provisions
began to appear in these articles permitting the board to contract on behalf of its members. But
legislators stepped in to put constraints on self-dealing. Statues and regulations currently in
force require that our hypothetical transaction be approved by both Buyer’s board of directors
and its shareholders for two reasons (1) because it is a substantial property transaction (i.e.,
exceeds £100,000 or 10 per cent of the company’s asset value) involving directors, and (2)
because it is a transaction with a related party2. Moreover, under stock exchange listing rules,
Mr. James must abstain from voting at the shareholder meeting. Extensive mandatory 2 Section 320 of the Companies Act of 1985 and 11.4 of the Listing Rules.

14
disclosures ensure that disinterested shareholders are knowledgeable about the transaction before
they vote to approve it. Specifically, Buyer must send a circular to shareholders containing not
only all material information regarding the nature and extent of any interests of its directors in
the transaction, but also a statement by the disinterested directors that the transaction is fair and
reasonable and that the directors have been so advised by an independent adviser acceptable to
the UK Listing Authority. Finally, Mr. James and any director who is in any way directly or
indirectly interested in the proposed contract must make “full and frank” disclosure of the
existence and nature of that interest at a board meeting.
Once the transaction is approved by shareholders, the next annual report must contain the
particulars of its principal terms (including the director’s name and the nature of his interest and
the value of the transaction).
If the transaction is properly approved with full disclosure, disgruntled shareholders will
not find it easy to challenge it in court. Shareholders must first gain standing to sue. In
principle, any shareholder may sue Mr. James and the directors on behalf of Buyer if there has
been a fraud on the minority (i.e., the majority of the shareholders succeeded in expropriating at
the expense of the minority the money, property or advantages of the company) and the
wrongdoers are in control of the company. However, shareholders may have trouble persuading
the courts that Mr. James is “in control” if a majority of disinterested shareholders have
embraced the transaction. If shareholders are allowed to sue, a contract in which a director is
interested may be voided if it is not made bona fide in the company's interest or for proper
purposes even if all required disclosures were made. Shareholders may also recover profits and
damages from directors who failed to exercise adequate care and skill or had a conflict of interest
and failed to act in the best interest of the company. However, the general principle is that

15
English courts will not correct a "bad bargain".3 In practice, this means that, absent a failure to
disclose material information, it is difficult to hold directors liable when the transaction was
reviewed by independent financial experts and approved by disinterested shareholders.
Aggrieved shareholders in the UK have extensive access to information both before and
during proceedings. First, shareholders may request that the Secretary of State appoint an
inspector if the company’s affairs are being or have been, inter alia, conducted in a manner
which is unfairly prejudicial to some shareholders. Second, once in court, the plaintiff does not
have to specifically identify the document sought (e.g., by indicating the title, author, date, etc)
but can rather request categories of documents pertinent to the case. Third, the claimant can
cross-examine both a defendant and a non-party witness on the contents of his witness statement
or on any other evidence he has given in direct examination without prior approval by the court
of the questions posed.
Under our case facts, public enforcement is toothless in the UK. Absent criminal
behavior or breach of the law, no criminal sanctions or fines apply to Buyer’s directors.
In summary, the strength of the regulation of self-dealing in the UK lies in the heightened
scrutiny of transactions involving related parties before they may be approved rather than in
favoring litigation by minority shareholders. This has led legal scholars to remark that
“…judicial assessment of the fairness of self-dealing transactions has not been a significant part
of British law” (Davies, 2002, page 171). In fact, minority shareholders face a high burden of
proof in challenging the transaction because it was approved by disinterested shareholders with
both the advice of independent financial experts and full disclosure of all material information.
3 Naturally, courts would take a different view in the event of fraud (e.g., if a material fact regarding the transaction was not disclosed).

16
The difference between Italy and the UK is representative of broader patterns. Turning to
the data on Table II, the most pronounced differences are between civil and common law
countries. Differences among civil law systems are seldom statistically significant and we do not
focus on them. Disinterested shareholders must approve the transaction in forty-eight percent of
common law countries but only eighteen percent of civil law countries. In contrast, the CEO
may single-handedly approve the transaction in twenty percent of civil law countries but never in
common law countries.
Turning to disclosure, we keep track of the disclosures that need to be made by Buyer as
well as by Mr. James before the transaction is approved. The disclosure indices range from 0 (no
disclosure) to a perfect score of 1 (full disclosure). Buyer is required to make full disclosure in
57% of common law countries, but in only 24% of civil law countries. This pattern is reflected
in the index of disclosure requirements by Buyer, which takes value of 0.62 in common law
countries and 0.38 in civil law ones. Similarly, Mr. James also faces more extensive disclosure
requirements in common law countries than in civil law ones (0.95 vs. 0.55). Consistent with
this pattern, an independent review of the transaction is required in 48% of common law
countries but only 27 % of civil law ones. We summarize these results with the index of ex-ante
disclosure requirements. This index ranges from 0 in the Ukraine to 1 in countries such as Chile
and the UK and averages 0.68 in common law countries but only 0.40 in civil law ones.
The index of ex-ante private control of self-dealing summarizes the approval and
disclosure requirements for our hypothetical transaction. Common law countries typically
require both extensive disclosures and the approval of the transaction by disinterested
shareholders (the ex-ante private control of self-dealing index equals 0.58). In contrast, civil law

17
countries typically have fewer disclosure requirements and entrust the approval of self-dealing
transactions to the CEO or the board of directors (the ex-ante index equals 0.29).
Table III presents our data on the ease with which minority shareholders may prove
wrongdoing by Mr. James and the approving body. The index of disclosure in periodic filings
ranges from 0 (no disclosure) to a perfect score of 1 (full disclosure). Buyer is required to make
full disclosure in 43% of common law countries, but in only 12% of civil law ones.
Shareholders controlling 10% of the stock can sue Mr. James and the other directors in 95% of
common law countries and in roughly 80% of Scandinavian and German legal origin countries.
In contrast, shareholders have standing to sue in only 53% of French civil law countries. Legal
families also differ in the burden of proof for rescinding the transaction as well as for holding
liable controlling shareholders and directors. Interestingly, France is the only civil law country
where rescission is available when the transaction causes damages to Buyer. Rescinding the
transaction is impossible in 71% of civil law countries and requires proving fraud in the
remaining 27%. In contrast, Kenya and Zimbabwe are the only common law countries where
rescission is unavailable. In addition, four common law countries (Australia, Thailand, Uganda,
and the UK) limit rescission to cases of fraud. In the remaining fifteen common law countries,
plaintiffs face a lower hurdle than fraud to rescind the transaction.
Consistent with our findings regarding the burden for rescinding a transaction, it is
typically easier to hold Mr. James and members of the approving body liable in common law
countries than in civil law ones. For example, Mr. James may only be held liable for fraud – the
most demanding standard – in 37% of civil law countries and 24% of common law ones. Here
Scandinavian legal origin countries are an exception among civil law countries: it is significantly
easier to hold Mr. James liable in Scandinavian civil law countries than in French and German

18
civil law ones. Access to evidence is also sharply higher in common law countries than in civil
law ones (0.73 vs. 0.46). Once again, Scandinavian legal origin countries are an exception
among civil law countries: access to evidence in Scandinavian legal origin countries is
comparable to that in common law countries. The index of ease of proving wrongdoing
summarizes the litigation variables. It ranges from 0.06 in Luxembourg to 1.0 in New Zealand
and Singapore. Based on the index of ease of proving wrongdoing, litigation is significantly
easier in common law countries than in civil law ones (index of 0.74 vs. 0.39).
The index of ex-post private control of self-dealing encapsulates the disclosure
requirements after the transaction is approved and the ease of proving wrongdoing. It shows that
disclosures requirements are more stringent and it is easier for plaintiffs to prove wrongdoing in
court in common law countries than in civil legal origin ones (score of 0.76 vs. 0.43).
Finally, we average the ex-ante and ex-post indices of private control of self-dealing and
create an “anti-self-dealing” index. The index is sharply higher in common law countries (0.67)
than in civil law ones (0.36). Consistent with this pattern, the anti-self-dealing index is lowest in
Bolivia (0.08) and highest in Singapore (1.00).
Interestingly, the regulation of self-dealing in the US and France depart in important
ways from the patterns of their respective legal families. The US does not have shareholder
approval for related-party transactions and instead emphasizes litigation to protect minority
shareholders against self-dealing. France allows related party transactions to be carried out
without shareholder approval if they take place on “normal” terms. However, it is easy to
challenge related-party transactions that take place without shareholder approval.
To be more specific, under Delaware law, the transaction may be approved by the board
of directors. In fact, Mr. James may even participate in the decision. However, challenging the

19
transaction in court is very easy if, as we assume, interested directors participate in the decision.
In view of the fact that Mr. James controls both sides of the transaction, a shareholder would
start off with a case in which Buyer’s board would have the difficult task of proving fair dealing
and fair price (i.e., the “entire fairness” of the transaction).4 Fair dealing covers such questions
as when the transaction was timed, how it was initiated, structured, negotiated, disclosed to the
directors, and how the approval of the directors was obtained. Fair price relates to the economic
and financial considerations of the proposed transaction, including all relevant factors. Directors
must then show “entire fairness,” where all aspects of the issue are examined. Here, unlike in the
UK, the image of a “smell test” is a fitting metaphor for describing the work done by the judge in
examining whether the transaction is entirely fair.
In France, agreements between Buyer and, among others, 10% shareholders must first be
approved by the board of directors and then by disinterested shareholders. However, no special
approval requirements are necessary for agreements “… entered into subject to normal
conditions”. In our empirical work, we assume that the transaction is approved by Buyer’s CEO
as if its terms were “normal” (i.e. the transaction is approved in accordance with minimum legal
requirements). In practice, bypassing the approval requirements legally prescribed for
transactions between Buyer and Mr. James may not be wise since such agreements may be
cancelled if they have prejudicial consequences for the company. In sum, the requirement to
obtain shareholder approval for related party transactions is easy to avoid in France. However,
related-party transactions are easy to challenge if they are not approved by shareholders. In
practice, shareholder approval is almost always sought.
4 We assume that the transaction is approved in accordance with minimum legal requirements. The Buyer’s board of directors could seek shareholder approval of the transaction. Approval by either disinterested shareholders or a special committee of disinterested directors would shift the burden of the proof to the plaintiff, but the standard of review would remain entire fairness. See Weinberger v. UOP, Inc., 457 A.2d 701, 711-12 (Del. 1983).

20
Turning to public enforcement, Table IV shows our data on fines and criminal sanctions
applicable when all approval and disclosure requirements are met, but Mr. James or the
approving parties breach their duties to the company. Those who approved the transaction are
subject to fines in 43% of the sample countries. In addition, on average, they may be imprisoned
for about two years. Interestingly, criminal sanctions for those who approve the transaction are
most severe in German civil law countries and least severe in common law countries. There are
no other significant differences among legal families. Sanctions on Mr. James are even less
severe than on the approving body and show no variation across legal origin. Perhaps it is not
surprising that Mr. James faces minimal criminal sanctions (1.8 years). The more surprising
result is that Mr. James is seldom subject to fines (33% of the sample). The index of public
enforcement summarizes our data on sanctions. It shows no variation across legal origins.
Our discussion of the results has so far emphasized the role of legal origin as a
determinant of the regulation of self-dealing. One may also wonder whether differences in the
regulation of self-dealing can be explained by differences in income levels. For example, rich
countries may optimally choose to regulate self-dealing whereas poor countries may not be able
to afford to do so. Table V sorts countries by per capita income and reports the means of our
summary indices for the bottom quartile, middle fifty percent, and top quartile. There is little
evidence that the anti-self-dealing index varies by income level. In fact, the correlation between
anti-self-dealing and (log) GDP per capita is only 0.11 and statistically insignificant (see the
appendix). However, the index of ex-post private control of self-dealing is highest in rich
countries (0.65 vs. world average of 0.53). Access to evidence is more extensive and Mr. James
is more likely to be held liable in rich countries than in middle- and low-income ones (results not
reported). At the same time, the index of public control of self-dealing is the lowest in the poor

21
countries, though not very different between the rich and the middle income countries. At least
with respect to private control of self-dealing, this evidence should alleviate the concern that
cross-country differences are explained by differences in income.
4. Regulation of Self-Dealing and Stock Market Development
We are interested in linking the regulation of self-dealing to measures of the development
of stock markets. Table VI presents five indicators of stock market development. The first
variable is the ratio of stock market capitalization to GDP. The second is the number of
domestic publicly-traded firms in each country relative to its population. The third is the value
of initial public offerings in each country relative to its GDP. All three variables are five-year
averages of yearly data (the first two for the period 1999-2003 and the last one for 1996-2000).
Theoretically, the first of these three measures is the most attractive, since in theory better
investor protection is associated with both a higher number of listed firms and higher valuation
of capital (Shleifer and Wolfenzon 2002). Except for some differences in scaling and timing,
these three variables were used in La Porta et al. (1997, 2006) to study the consequences of
investor protection on stock market development.
The fourth variable is the (median) premium paid for control in corporate control
transactions. In several theoretical models, this variable has been interpreted as a measure of
private benefits of control, which are higher in countries with weaker investor protection
(Grossman and Hart 1988, Nenova 2003, Dyck and Zingales 2004). The fifth and final variable
is a proxy for ownership concentration among the largest firms in the country. Both theory
(Shleifer and Wolfenzon 2002) and prior evidence (La Porta, Lopez-de-Silanes, and Shleifer

22
1999, Claessens, Djankov, and Lang 2000, Faccio and Lang 2002) suggest that ownership
concentration is lower in countries with better investor protection.
Consistent with our previous work, Table VI shows pronounced differences in financial
development across legal families. The most striking differences are between common law and
French civil law countries. Common law countries have sharply more valuable stock markets
relative to their GDPs (85.5% vs. 42.0%), more listed firms per million people (32.6 vs. 19.6,
although statistically insignificant), more IPOs relative to their GDPs (3.7% vs. 1.7%), a lower
value of control (4% vs. 16%), and less concentrated ownership (44% vs. 55%). Stock markets
in German and Scandinavian law countries are also generally less developed than in common
law countries but this pattern is less systematic than for French civil law countries. In particular,
German and Scandinavian law countries have levels of ownership concentration and IPO activity
comparable to those of common law countries. In addition, the number of listed firms per
million people is higher in Scandinavian legal origin countries than in common law countries
(69.4 vs. 32.6). In sum, for most indicators, stock markets are best developed in common law
countries. The development of stock markets in civil law, particularly French civil law,
countries lags behind that of common law countries.
To assess regulation of self-dealing, we first consider the effect on market capitalization –
the most commonly used measure of stock market development -- of each of the following six
aspects of the regulation of self-dealing transactions: (1) approval by disinterested shareholders;
(2) disclosure requirements before the transaction may be approved; (3) index of ex-ante private
control of self-dealing; (4) disclosure requirements in periodic filings; (5) ease of proving
wrongdoing; and (6) index of ex-post private control of self-dealing. All specifications include

23
logarithm of per capita income5 and the efficiency of the judiciary as measured by the number of
days to resolve a commercial dispute (Djankov et al. 2003a). Table VII shows that both higher
per capita income and the efficiency of the judiciary is associated with larger stock markets.
The key result on Table VII is that all six measures of the regulation of self-dealing are
both statistically and economically significant. Figures II and III illustrate the relationship
between stock market capitalization and ex-ante and ex-post private control of self-dealing,
respectively. The estimated coefficients imply that a two-standard deviation increase in the
indices of ex-ante and ex-post private control of self-dealing is associated with an increase in
stock market capitalization of 30 and 34 percentage points, respectively. These effects are
economically large: the sample average stock-market-capitalization-to-GDP ratio is 59%. In
Figures II and III, Switzerland and Hong Kong are major outliers. One may wonder whether our
results are driven by extreme observations. However, we obtain qualitatively similar results
when either excluding those two observations or using median regressions.
Switzerland plays a key role in making the results weaker than they would be otherwise.
Switzerland’s legal environment, from the perspective of disclosure, approval, and the burden of
litigation is extremely friendly to insiders and hostile to outside shareholders. Yet Switzerland
has an extremely valuable stock market. We might have missed some important legal protection
of shareholders in Switzerland, or it might have developed mechanisms for protecting minority
shareholders separate from the law. Alternatively, the enormous investment resources of the
Swiss banks might have artificially inflated the value of its stock market.
Table VIII shows the effect of the indices of ex-ante private control of self-dealing (Panel
A), ex-post private control of self-dealing (Panel B), and anti-self-dealing (Panel C) on our five
indicators of the development of stock markets (Table VIII also includes the results on stock 5 Results are qualitatively similar with the log of GDP per capita in constant purchasing power parity dollars.

24
market capitalization reported in Table VII). All three measures of the regulation of self-dealing
are statistically significant for both stock-market-capitalization-to-GDP and block premium. In
contrast, the ex-post private control of self-dealing index and the overall anti-self-dealing index
are significant for both (log) firms per million inhabitants and IPOs-to-GDP. Finally, only the
ex-post private control of self-dealing matters for ownership concentration. Below we discuss
the economic significance of these results.
All three measures of the regulation of self-dealing have a large impact on the stock-
market-capitalization-to-GDP ratio. We have already noted that improving the index of ex-ante
(ex-post) private control of self-dealing by two standard deviations increases the stock-market-
capitalization-to-GDP ratio by 30 (34) percentage points. In addition, the predicted effect of
improving the anti-self-dealing index by two standard deviations (roughly the distance between
Singapore and Belgium or India) is to increase the stock-market-capitalization-to-GDP ratio by
38 percentage points. To assess the magnitude of these effects, recall that the average stock-
market-capitalization-to-GPD ratio in our sample is 59%.
Both the ex-post control and the anti-self-dealing indices have a significant effect on the
(logarithm of the) number of domestic firms per million inhabitants. A two-standard deviation in
the ex-post private control of self-dealing is associated with a 62% increase in the number of
domestic firms. Similarly, as illustrated by Figure IV, a two-standard deviation increase in the
anti-self-dealing index is associated with a 44% increase in the number of domestic firms.
The ex-post private control and the anti-self dealing indices also have a significant effect
on the IPOs-to-GDP ratio. The estimated coefficient implies that increasing ex-post private
control of self-dealing by two-standard deviations is associated with an increase in the IPOs-to-
GDP ratio of 1.9%. This effect is very large since the sample mean of IPOs-to-GDP is only

25
3.0%. Finally, as illustrated by Figure V, the predicted effect of improving the anti-self-dealing
index by two standard deviations is an additional 1.8% in the IPOs-to-GDP ratio. Note that
Figure V raises concerns about the role of outliers. However, we obtain qualitatively similar
results when either dropping the UK from the sample or running median regressions.
The regulation of self-dealing also has a large impact on the block premium. Increasing
the ex-ante private control of self-dealing by two-standard deviations is associated with a
reduction of 9% points in the median block premium -- a large effect since the block premium
averages 11% in our sample. Similarly, the estimated coefficients on ex-post private control and
anti-self-dealing indices imply that increasing either measure by two-standard deviations is
associated with an additional reduction of 10% in the median block premium. Figure VI shows
that the block premium is very high in Brazil and Mexico (49% and 47%, respectively), two
countries for which the anti-self-dealing index is low (0.29 and 0.18, respectively). Excluding
both countries does not alter the statistical significance of the results. However, the anti-self-
dealing index loses statistical significance (t-stat of 1.5) if we run median regressions.
Finally, only the index of ex-post private control of self-dealing has an effect on
ownership concentration. The left (right) graph on Figure VII illustrates the relationship between
the index of ex-ante (ex-post) control of self-dealing and ownership concentration. Ex-ante
control of self-dealing simply does not lower ownership concentration (this result does not seem
to be driven by a few outliers). In contrast, increasing the ex-post self-dealing index by two
standard deviations is associated with a reduction of 9% in ownership concentration. To
interpret this magnitude, note that the average ownership concentration in our sample is 47%.
One concern with our findings on the effect of private enforcement on the development
of stocks markets is endogeneity. To address this concern, Table IX presents two-stage least

26
square regressions using common law as an instrument for the anti-self-dealing index.
Consistent with our OLS results on Table VIII, the anti-self-dealing index is significant in the
regressions for stock-market-capitalization-to-GDP, (logarithm) firms per million inhabitants,
IPOs-to-GDPs, and block premium (Panel A). In addition, legal origin is a strong predictor of
the regulation of self-dealing. Note also that income per capita predicts the regulation of self-
dealing when legal origin is included in the regressions but not in univariate regressions. These
results should alleviate endogeneity concerns although they do not address the possibility that
legal origin has an effect on stock market development through other channels.
Public enforcement is the last area of law we examine. Table X shows that public
enforcement is not associated with more developed stock markets. In fact, public enforcement is
significant, but with the wrong sign, in only one regression (block premium). Figure VIII
illustrates the relationship between stock-market-capitalization-to-GDP and public enforcement.
It shows that there is no relationship between public enforcement and stock market capitalization
and that this absence cannot be blamed on outliers. Advocates of public enforcement may
dismiss our findings by arguing that what deters self-dealing is the probability that criminal
sanctions will actually be imposed (rather than their mere existence). Unfortunately, we lack
data on actual enforcement practices to test this view. 6 However, we conjecture that a proxy for
actual enforcement would have a hard time fitting the data since criminal sanctions are simply 6 Using data from Bhattacharya and Daouk (2002) on the enforcement of insider trading laws, we find no evidence that our index of public enforcement contributes to the development of stock markets in the sub-sample of 24 countries where insider trading laws where first enforced before 1996. Moreover, controlling for the anti-self-dealing index, a dummy equal one if insider trading laws were first enforced before 1996 is significant only in the regression for ownership concentration. As another way of capturing the actual enforcement of fines and criminal sanctions, we run separate regressions for rich (above median GDP per capita) versus poor countries (below median GDP per capita). However, we find that ownership concentration in poor countries is the only measure of financial development that is predicted by public enforcement. In contrast, there is little evidence that the anti-self-dealing index works differently in rich versus poor countries. Specifically, we generally cannot reject the hypothesis that the estimated coefficient for anti-self-dealing is the same in the samples of rich and poor countries. The anti-self-dealing coefficient is different in the two sub-samples only in the regression using (log) firms per capita as the dependent variable. In this case, the coefficient is larger in rich countries than in poor ones and the difference is (marginally) significant at the 10% level.

27
unavailable in roughly half the sample (32 countries) and this group exhibits enormous variation
in the size of stock markets (e.g. Hong Kong vs. Venezuela, both with a public enforcement
index of zero). Perhaps a better reason to be cautious about our findings on public enforcement is
that the criminal sanctions most relevant to the development of stock markets may be those
applicable under different case facts (e.g., failure to disclose) than ours.
In sum, our evidence shows that a high anti-self-dealing index is associated with valuable
stock markets, more domestic firms, more initial public offerings, and lower benefits of control.
In contrast, the anti-self-dealing index is not reliably associated with ownership concentration
(although the index of ex-post control is). Finally, public enforcement does not predict more
developed stock markets.
5. Other Measures of Investor Protection.
In previous work, we have constructed three other measures of investor protection: anti-
director rights, disclosure in the prospectus, and prospectus liability. In this section, we examine
the robustness of our findings on the effect of anti-self-dealing on the development of stock
markets when including these three alternative measures of investor protection. In particular, we
are interested in understanding whether the theoretically-grounded anti-self-dealing index works
better than the original index of anti-director rights in explaining financial development.
We begin with the anti-director index. The original anti-director rights index, reported in
La Porta et al. (1997, 1998), is available for 49 countries and is based on laws in force circa
1993. This index has been criticized by a number of scholars for its ad-hoc nature, for mistakes
in its coding, and most recently for conceptual ambiguity in the definitions of some of its
components (Pagano and Volpin 2005, Spamann 2005). Our first step is then to describe and

28
present a revised index of anti-director rights for 72 countries based on laws and regulations
applicable to publicly-traded firms in May 2003. The revised index relies on the same basic
dimensions of corporate law, but defines them with more precision.
Both the original and the revised anti-director rights indices summarize the protection of
minority shareholders in the corporate decision-making process, including the right to vote. The
index covers the following six areas: (1) vote by mail; (2) obstacles to the actual exercise of the
right to vote (i.e., the requirement that shares be deposited before the shareholders’ meeting); (3)
minority representation on the Board of Directors through cumulative voting or proportional
representation; (4) an oppressed minority mechanism to seek redress in case of expropriation; (5)
pre-emptive rights to subscribe to new securities issued by the company; and (6) right to call a
special shareholder meeting. The general principle behind the construction of the revised anti-
director rights index is to associate better investor protection with laws that explicitly mandate,
or set as a default rule, provisions that are favorable to minority shareholders. We recognize that
firms may, in their charters, opt out of the default rules set in the law. Firms may also enhance
investor protection by including in their charters provisions favorable to shareholders. However,
it has been shown theoretically (Bergman and Nicolaievsky 2006) and established empirically –
including in this paper – that the actual rules do matter for financial development.
Methodologically, the key difference between the original and revised indices of anti-
director rights lies in the treatment of enabling provisions. To illustrate, consider the example of
cumulative voting in the US. The Delaware code contains a provision that explicitly allows the
certificate of incorporation of any corporation to provide that directors be elected through
cumulative voting. In our earlier work, we did not draw a distinction between enabling
provisions and mandatory and default rules. Accordingly, our original index of anti-director

29
rights treats the US as having cumulative voting. Arguably, an enabling provision may lower the
cost of private contracting. However, we ignore enabling provisions when coding the revised
anti-director rights index and now treat the US as not having cumulative voting. We do so
because enabling provisions are more prevalent in common than in civil law countries and we
want to bias the results against the hypothesis that common law better protects investors.
The revised anti-director rights index is based on six proxies defined on Table XI. First,
to make voting easier, shareholders may appoint a proxy to take their place at the shareholders’
meeting and vote on their behalf. In many countries, the solicitation of proxies is unregulated
and shareholders lack sufficient information to provide specific instructions to the proxy on how
to vote on the items on the agenda. In other countries, in contrast, shareholders may vote by mail
on each of the items on the agenda through a ballot or proxy form. The regulation of the proxy
solicitation process makes it easier for shareholders to both cast informed votes and oppose
proposals put forward by directors. Thus our first sub-index reflects the difficulty of making
informed votes by mail.
Second, in some countries, the law requires, or permits companies to require, that
shareholders who intend to vote at the shareholders’ meeting deposit their shares with the
company or a financial intermediary. The requirement that shares be deposited is closely related
to the existence of bearer shares and is intended to force shareholders to prove their right to vote.
This requirement imposes a cost on shareholders as they must obtain a certificate proving their
ownership or are unable to sell their shares (i.e., shares are “blocked”) or both. Moreover, when
the identity of shareholders is unknown, dissenting shareholders face great difficulties forming
coalitions with like-minded shareholders before the meeting.

30
Third, some countries mandate or set as a default rule that shareholders cast all their votes
for one candidate for the board of directors or supervisory board (cumulative voting) or provide a
mechanism of proportional representation in the board of directors or supervisory board. The
effect of cumulative voting and proportional representation is to limit the power of controlling
shareholders to dominate the board of directors or supervisory board.
Fourth, some countries provide legal mechanisms that protect minority shareholders
against oppressive actions by controlling shareholders. These mechanisms include the right to
rescind transactions that are prejudicial to the company or to recover damages suffered by the
company in case of prejudicial resolutions of the shareholders’ meeting, or decisions of the board
of directors, or both. In contrast, in other countries transactions may only be rescinded in case of
fraud and shareholders may only seek to recover damages suffered by the company if they can
prove that directors acted with negligence, gross negligence, or fraud.7
Fifth, in some countries shareholders have a preemptive right to buy new issues of stock,
which can only be waived by a shareholder vote. In the absence of preemptive rights, insiders
may expropriate minority shareholders by offering shares to related parties, or even to
themselves, at below-market prices.
Finally, we consider the minimum fraction of capital or votes that entitles a shareholder
to call a shareholders' meeting. Shareholders owning at least 3% of the capital are entitled to call
a meeting in Japan, Korea, and Taiwan. In contrast, shareholders must own at least 20% of the
capital to call a meeting in Belgium, Venezuela, and Uruguay. Shareholders in firms
incorporated in Delaware may not call an extraordinary shareholders’ meeting at all unless
7 This fourth component of the anti-directors index is closely related to the sub-index of ease of proving wrongdoing in the anti-self-dealing index.

31
authorized by the certificate of incorporation or bylaws. Insiders have greater control over the
firm where it is more difficult for minority shareholders to call a shareholders’ meeting.
Table XII presents the revised index of anti-director rights. Note first that the correlation
between the revised anti-director rights index and one presented by La Porta et al. (1997, 1998)
is 0.69. As in the case of the original index, differences between English and French legal origin
countries are extremely pronounced and we discuss them first. English legal origin countries are
more likely than French legal origin ones to provide voting by mail (81% vs. 19%), avoid the
requirement that shares be deposited (100% vs. 44%), and provide an oppression remedy (95%
vs. 23%). Moreover, English legal origin countries require less capital to call a shareholders
meeting than do French legal origin ones (9% vs. 12%). In contrast, French legal origin
countries are more likely than English legal origin ones to require cumulative voting (34% vs.
10%) and to offer shareholders preemptive rights (91% vs. 52%). The index of anti-director
rights aggregates the information contained in these six proxies for investor protection.
Consistent with our earlier findings, the index of anti-director rights is sharply higher in English
legal origin countries than in French legal origin ones (4.29 vs. 2.77).
Also consistent with our earlier work, there are several differences among civil law
families. Specifically, Scandinavian legal origin countries are more likely than French and
German legal origin ones to avoid the requirement that shares be deposited ahead of a
shareholders’ meeting (100% for Scandinavian countries vs. 44% and 36% for French and
German countries, respectively) as well as to provide an oppressed minority mechanism (60%
for Scandinavian countries vs. 23% and 32% for French and German countries, respectively).
Capital requirements to call a shareholder’s meeting in Scandinavian and German legal origin
countries (9% and 6%, respectively) are lower than in French (12%) legal origin countries and

32
comparable to those in English legal origin ones (9%). As a result of these differences among
civil law families, the index of anti-director rights is lowest in French legal origin countries
(2.77) and highest in Scandinavian ones (3.80). In fact, the anti-director index in Scandinavian
legal origin countries (3.80) is not statistically different than in English legal origin ones (4.29).8
Table XIII shows the relationship between our five proxies for the development of stock
markets and both the original anti-directors variable (Panel A) and the revised one (Panel B).
The original anti-director rights index is associated with a higher stock-market-capitalization-to-
GDP ratio, more domestic firms and IPOs-to-GDP, a smaller block premium, and less ownership
concentration. The revised one, however, is insignificant in the regressions for block premium
and ownership concentration. The revised index has a large effect on the development of stock
markets. For example, a two-standard deviations increase in the anti-director index is associated
with an increase in stock-market-capitalization-to-GDP of 23 percentage points (sample mean of
59%), a 91% increase in the number of domestic firms per million inhabitants, an increase of 1.1
percentage points in the IPOs-to-GDP ratio (sample mean of 3%), and a reduction of 7
percentage points in ownership concentration (sample mean of 47%).
Table XIV presents horse races between the anti-self-dealing index, (revised) anti-
director rights (Panel A), and the two variables from the La Porta et al. (2006) study of securities
laws: prospectus disclosure (Panel B), and prospectus liability (Panel C). Before presenting the
horse-race results, note that the correlations of anti-self-dealing with anti-director rights,
disclosure requirements, and prospectus liability are 0.54, 0.67 and 0.40, respectively (see
correlation table in the appendix). This suggests that it is going to be difficult to disentangle the
8 Scandinavian countries have significantly higher income per capita than the rest of the sample ($29,374 vs. $9,295). This raises the question of whether the strength of investor protection in Scandinavian countries may simply reflect the fact that they are rich. However, the index of anti-director rights is uncorrelated (-0.05) with (log) GDP per capita (see the correlation table in the appendix).

33
effects of the anti-self-dealing index and the disclosure in the prospectus, which is not surprising
in light of the fact that both measures heavily focus on disclosure (albeit in different spheres).
When controlling for anti-director rights (see Panel A), the anti-self-dealing index loses
significance for firms per capita and remains significant for stock-market-capitalization-to-GDP,
IPOs-to-GDP, and block premium. In the same regressions (i.e., controlling for the anti-self-
dealing index), the anti-director rights index loses significance for stock-market-capitalization-
to-GDP and IPOs-to-GDP and remains significant only for (log) firms per capita. With the
caveat that the two indices are highly correlated, we conclude that anti-self-dealing is a more
robust predictor of the development of stock markets than anti-director index.
Controlling for disclosure in the prospectus (Panel B), the anti-self-dealing index is never
significant. Disclosure in the prospectus, however, is significant in all regressions except for the
block premium. The high correlation between the two measures invites caution in interpreting
this evidence.
Controlling for prospectus liability (Panel C), the anti-self-dealing index remains
significant for (log) firms per population, IPOs-to-GDP, and block premium and loses
significance for market-capitalization-to-GDP. Prospectus liability is significant in all
regressions. These results are broadly consistent with the view that both the anti-self-dealing
index and prospectus liability matter for the development of stock markets.
In sum, we find that the anti-self-dealing index remains significant in three regressions
when combined with either the anti-director rights index or prospectus liability. However, the
anti-self-dealing index is never significant when combined with disclosure in the prospectus. In
contrast, prospectus liability is significant in all five regressions and prospectus disclosure in four
of them. Finally, the revised anti-director rights index is significant in one regression. These

34
results are consistent with the view that both disclosure and the power to enforce contracts
through private litigation are important for the development of stock markets. Multicollinearity
makes it hard to disentangle the relative contributions to the development of stock markets of
disclosure in the prospectus and the regulation of self-dealing.
6. Summary and Implications.
We have constructed a new index of shareholder protection for 72 countries. The index
addresses specifically the protection of minority shareholders against self-dealing transactions
benefiting controlling shareholders. As such, it is better grounded in theory than the index of
anti-director rights constructed by La Porta et al. (1997, 1998) and revised for this paper. We
have found that the anti-self-dealing index exhibits some of the same properties as both the anti-
director rights index, and the indices of shareholder protection through securities laws presented
in La Porta et al. (2006). Specifically, the index is sharply higher in common law countries than
in French civil law countries. The index is also a statistically significant and economically
strong predictor of a variety of measures of stock market development across countries. These
results support the findings of the earlier work, but also show that theoretically-grounded
measures of investor protection are closely tied to financial development. In conclusion, we
would like to delineate the implications of these findings in three areas: the measurement of
shareholder protection, the interpretation of legal origin, and desirable regulatory strategies.
Implications for the Measurement of Shareholder Protection
The availability of four measures of shareholder protection, each collected with a
different methodology and addressing a somewhat different situation, raises an obvious question:

35
what is “the best” measure for researchers to use? Unfortunately, there is no clear answer to this
question, largely because the measures are highly correlated with each other. There are,
however, some noteworthy differences. The measures of shareholder protection from securities
laws appear to “work” best in terms of predicting stock market outcomes, but they are only
available for 49 countries. These measures are particularly appropriate for studies of protection
of investors buying securities, as opposed to corporate governance per se. The revised anti-
director rights index and the anti-self-dealing index are available for a larger sample of 72
countries. The former has the advantage of continuity with many previous studies; the latter has
the benefits of greater conceptual clarity in general, and relevance to the pervasive problem of
corporate self-dealing (or tunneling) in particular. Indeed, this last benefit seems to us to be
crucial. To the extent that self-dealing is the central problem of corporate governance in most
countries, the law’s effectiveness in regulating this problem is the fundamental element of
shareholder protection. Having said all this, our intent in future work is to test the robustness of
findings to the use of alternative measures of shareholder protection, unless there is a compelling
theoretical case to use one or another.
Implications for the Interpretation of Legal Origin
For all the measures of shareholder protection we have considered, there is a pronounced
difference between common and French civil law countries. The examination of specific legal
rules permits some further insight as to what explains these differences among legal origins.
Johnson et al. (2000b) conjecture that common law is more suspicious of conflicted
transactions than civil law, and subjects them to closer regulation and legal scrutiny. The results
of this paper are broadly consistent with that conjecture. Specifically, common law countries

36
subject related-party transactions to greater disclosure requirements as well as to more arms-
length approval, than do French civil law countries in particular. These different approaches to
the regulation of self-dealing appear to derive from long-standing legal principles, such as
fiduciary duty, which over time are incorporated into the statutes that we actually observe.
Compared to our previous research, we still find greater emphasis on ex post litigation in
common law than in civil law countries, although it appears that ex post – once the disclosure
and the approval requirements are met – it is quite difficult for shareholders to recover damages
even in common law countries. The US seems to be exceptional, with its greater emphasis on ex
post litigation rather than ex ante disclosure and approval. The ex ante transparency in self-
dealing transactions appears to be the central difference between common and civil law.
At a broader level, the results are consistent with the view of Djankov et al. (2003b) that
common law is distinguished from civil law by its encouragement of private solutions to
problems of “disorder.” Statutory law aims to reduce the costs of these private solutions, but not
replace them by public ones. Mandatory disclosure and arms-length approval are very clear
examples of this broader strategy of social control of business associated with common law.
Implications for Regulatory Strategies
If we take the evidence in this paper at face value, several ideas for the improvement of
regulation of corporate governance, particularly in the area of self-dealing transactions, emerge.
Perhaps the most basic conclusion from the data is that laissez-faire – the strategy of no public
involvement at all – does not lead to developed financial markets. The public sector clearly has a
central role to play, but principally as the designer of the rules of the game, which are then
enforced by private action. Specifically, our findings reinforce those in La Porta et al. (2006) on

37
securities laws, who also identify the key role of private contracting and enforcement for
financial development, and deemphasize that of public enforcers. Countries with successful
stock markets mandate that shareholders receive the information they need and the power to act
– including both voting and litigation – on this information. There is no evidence that these
countries rely heavily on fines and criminal sanctions. This, perhaps, is the crucial message. But
there are specific conclusions as well.
First, the results suggest that an effective strategy of regulating large self-dealing
transactions is to combine full disclosure of such transactions (including the potential conflicts)
with the requirement of approval by disinterested shareholders. Our study does not address the
question of just how large a transaction needs to be for disinterested shareholder approval to be
desirable, and we are not suggesting that all conflicted transactions, no matter how small, should
be brought to shareholders. Still, we do not see why this approach is incompatible with any legal
system, and why it would not be appropriate for countries at any level of economic development.
Sunshine indeed seems to be the best disinfectant. We note that the benefits of full disclosure for
stock market development were also extremely large in our study of securities laws (La Porta et
al. 2006), where we focused on disclosure by firms issuing securities to the public.
Second, the evidence suggests that on-going disclosure of self-dealing transactions,
combined with the relatively easy burden of litigation placed on the aggrieved shareholders, also
benefits stock market development. Here reforms may be more difficult, as their success would
depend on the more general structure and efficiency of legal systems in different countries.
Nonetheless, the results suggest that giving aggrieved shareholders the standing to sue, access to
information to identify self-dealing, and a low burden of proof would deter self-dealing and
promote stock market development.

38
Finally, the evidence suggests that the government’s power to impose fine and prison
terms for self-dealing transactions that meet disclosure and approval requirements does not
benefit stock market development. We stress that this is a narrow conclusion, since it does not
address the importance of public enforcement in situations where self-dealing transactions are
concealed, as in the cases of Enron or Parmalat. To avoid self-dealing, however, it appears best
to rely on extensive disclosure, approval by disinterested shareholders and private enforcement.

39
References
Akerlof, George, and Paul Romer, 1993, Looting: the economic underworld of bankruptcy for profit, Brookings Papers on Economic Activity: Microeconomics, 1-73. Baumol, William, 1959, Business Behavior, Value, and Growth, New York: Macmillan. Brandeis, Louis, 1914, Other People's Money, New York: Stokes. Benston, George, 1973, Required disclosure and the stock market: An evaluation of the Securities Market Act of 1934, American Economic Review 63, 132-55. Bergman, Nittai, and Daniel Nicolaievsky, 2006, Investor protection and the Coasian view, Journal of Financial Economics, forthcoming. Bhattacharya, Utpal and Hazem Daouk, 2002, The world price of insider trading, Journal of Finance 57, 75-108. Claessens, Stijn, Simeon Djankov, and Larry Lang, 2000, The separation of ownership and control in East Asian corporations,” Journal of Financial Economics 58, 81-112. Clark, Robert, 1986, Corporate Law, New York: Aspen Publishers. Davies, Paul, 2002, Introduction to Corporate Law, Clarendon Law Series, Oxford Press, UK. Djankov, Simeon, Rafael La Porta, Florencio Lopez-de-Silanes, and Andrei Shleifer, 2003a, Courts, Quarterly Journal of Economics 118, 453-518. Djankov, Simeon, Edward Glaeser, Rafael La Porta, Florencio Lopez-de-Silanes, and Andrei Shleifer, 2003b, The new comparative economics, Journal of Comparative Economics 31, 1-37. Dyck, Alexander and Luigi Zingales, 2004, Private benefits of control: An international comparison, Journal of Finance 59, 537-600. Faccio, Mara, and Larry Lang, 2002, The ultimate ownership of West European Corporations, Journal of Financial Economics 65, 365-396. Greenstone, Michael, Paul Oyer and Annette Vissing-Jorgensen, 2006, Mandated disclosure, stock returns, and the 1964 Securities Act, Quarterly Journal of Economics, forthcoming. Grossman, Sanford, and Oliver Hart, 1988, One-share-one-vote and the market for corporate control, Journal of Financial Economics 20, 175-202. Hart, Oliver, 1995, Firms, Contracts, and Financial Structure, Oxford, U.K.: Oxford University Press.

40
Holmstrom, Bengt, 1979, Moral hazard and observability, Bell Journal of Economics 10, 4-29 Jensen, Michael, 1986, Agency costs of free cash flow, corporate finance, and takeovers, American Economic Review Papers and Proceedings 76, 323-329. Jensen, Michael, and William Meckling, 1976, Theory of the firm: managerial behavior, agency costs, and ownership structure, Journal of Financial Economics 3, 305-360. Johnson, Simon, Peter Boone, Alex Breach, and Eric Friedman, 2000a, Corporate governance in the Asian financial crisis, Journal of Financial Economics 58, 141-186. Johnson, Simon, Rafael La Porta, Florencio Lopez-de-Silanes, and Andrei Shleifer, 2000b, Tunneling, American Economic Review Papers and Proceedings 90, 22-27. La Porta, Rafael, Florencio Lopez-de-Silanes, and Andrei Shleifer, 2006, What works in securities laws?, Journal of Finance 61, 1-33. La Porta, Rafael, Florencio Lopez-de-Silanes, Andrei Shleifer, and Robert Vishny, 1997, Legal determinants of external finance, Journal of Finance 52, 1131-1150. La Porta, Rafael, Florencio Lopez-de-Silanes, Andrei Shleifer, and Robert Vishny, 1998, Law and finance, Journal of Political Economy 106, 1113-1155. La Porta, Rafael, Florencio Lopez-de-Silanes, and Guillermo Zamarripa, 2003, Related lending, Quarterly Journal of Economics 118, 231-268. Nenova, Tatiana, 2003, The value of corporate voting rights and control: A cross-country analysis, Journal of Financial Economics 68, 325-352. Pagano, Marco, and Paolo Volpin, 2005, The political economy of corporate governance, American Economic Review 95, 1005-1030. Shleifer, Andrei, and Robert Vishny, 1997, A survey of corporate governance, Journal of Finance 52, 737-783. Shleifer, Andrei, and Daniel Wolfenzon, 2002, Investor protection and equity markets, Journal of Financial Economics 66, 3-27. Spamann, Holger, 2005, Recoding LLSV’s Law and Finance, Mimeo, Harvard Law School. Stigler, George, 1964, Public regulation of the securities market, Journal of Business 37, 117 - 142. Zingales, Luigi, 1994, The value of the voting right: a study of the Milan Stock Exchange, Review of Financial Studies 7, 125-148.

Figure I. Case facts. Buyer Co. (“Buyer”) is a food manufacturer company. It is a publicly traded firm that is listed on the country’s largest stock exchange. Buyer manufactures and distributes all of its products itself. Mr. James is Buyer’s controlling shareholder and a member of Buyer’s board of directors. He owns 60% of Buyer, and elected 2 directors to Buyer’s 5-member board of directors. Junior is Mr. James’ son and CEO of Buyer. Mr. James also owns 90% of Seller Company, which operates a chain of retail hardware stores. Seller recently shut a large number of its stores. As a result, its fleet of trucks is not being utilized. Mr. James proposes to Buyer that Buyer purchase Seller’s unused fleet of trucks to expand Buyer’s distribution of its food products. Buyer agrees. The final terms of the transaction require Buyer to pay to Seller in cash an amount equal to 10% of Buyer’s assets in exchange for the trucks. The transaction is part of Buyer’s ordinary course of business and is not ultra vires.
Buyer enters into the transaction. All required approvals are obtained and all the required disclosures made. The transaction might be unfair to Buyer. Shareholders sue the interested parties and the approving body.
Seller Co. Buyer Co. buys equipment from Seller Co.
Mr. James owns 60% of Buyer Co. shares
Mr. James owns 90% of Seller Co. shares
Mr. James
Buyer Co.

Figure II: Partial-regression leverage plot of stock market capitalization and ex-ante control of self-dealing in regressions that control for (log) income per capita and efficiency of the judiciary.
Tunisia
NetherlandsUkraine
Philippines
EcuadorHungary
BoliviaFrance
AustriaJapan
Jordan
Switzerland
Uganda
Germany
GreeceSri LankaNigeria
VenezuelaKorea (Rep.)UruguayLithuania
KenyaJamaica
PanamaSlovak Rep.
Denmark
Finland
Sweden
Iceland
Pakistan
Czech Rep.
Spain
Luxembourg
Brazil
United States
Croatia
India
ItalyMexicoTurkeyRomania
Latvia
Zimbabwe
PortugalPeru
Norway
Belgium
Poland
TaiwanCanadaChile
GhanaArgentinaEgypt
IsraelKazahkstanEl Salvador
Morocco
Ireland
IndonesiaRussia
Singapore
New Zealand
Hong Kong
South Africa
Bulgaria
Malaysia
Colombia
United Kingdom
AustraliaChinaThailand
-100
010
020
030
0R
esid
ual s
tock
-mar
ket-c
apita
lizat
ion-
to-G
DP
ratio
-1 -.5 0 .5Residual ex-ante private control of self-dealing index
coef = 46.310458, (robust) se = 22.986547, t = 2.01

Russia
VenezuelaPanama
Jordan
Tunisia
Mexico
Netherlands
El Salvador
Luxembourg
EcuadorBolivia
UruguayIceland
UkraineKazahkstan
Norway
Germany
Greece
BrazilCroatia
Switzerland
Argentina
Kenya
AustriaLatvia
ColombiaSwedenMoroccoEgyptHungaryPolandSpain
Philippines
TurkeyCzech Rep.
Jamaica
LithuaniaDenmark
Korea (Rep.)
BulgariaSlovak Rep.
Japan
South Africa
RomaniaBelgium
France
China
Zimbabwe
IndonesiaPeruUganda
AustraliaTaiwan
ItalyIreland
Finland
ThailandChileUnited Kingdom
Portugal
Pakistan
New Zealand
Hong Kong
United StatesIndiaSri Lanka
Singapore
Malaysia
Ghana
Israel
CanadaNigeria
-100
010
020
030
0R
esid
ual S
tock
-mar
ket-c
apita
lizat
ion-
to-G
DP
ratio
-.4 -.2 0 .2 .4Residual Ex-post private control of self-dealing index
coef = 71.932836, (robust) se = 25.85237, t = 2.78
Figure III: Partial-regression leverage plot of stock market capitalization and ex-post control of self-dealing in regressions that control for (log) income per capita and efficiency of the judiciary.

Tunisia
Netherlands
Venezuela
Ukraine
Jordan
Ecuador
PanamaBolivia
Mexico
Uruguay
Luxembourg
Iceland
Germany
PhilippinesSwitzerland
Greece
AustriaHungary
Kenya
Brazil
CroatiaSweden
Spain
Norway
Latvia
JapanFrance
JamaicaLithuania
Czech Rep.
Korea (Rep.)Denmark
Turkey
Slovak Rep.
Uganda
Romania
PolandKazahkstan
Finland
Zimbabwe
ItalyRussiaArgentina
El Salvador
Belgium
Peru
PakistanSri LankaEgypt
United States
India
Portugal
TaiwanNigeria
Morocco
Chile
Colombia
Canada
GhanaIndonesiaIreland
Israel
Bulgaria
South Africa
China
AustraliaNew Zealand
Hong Kong
United Kingdom
Singapore
Thailand
Malaysia
-4-2
02
4R
esid
ual L
n(Fi
rms-
to-p
opul
atio
n)
-.6 -.4 -.2 0 .2 .4Residual Anti-self-dealing index
coef = 1.0563179, (robust) se = .48415397, t = 2.18
Figure IV: Partial-regression leverage plot of (log) listed firms per million population in regressions that control for (log) income per capita and efficiency of the judiciary.

Netherlands
Jordan
Ecuador
VenezuelaMexico
Philippines
GermanyUruguaySwitzerland
Greece
Brazil
Kenya
Austria
Japan
NorwaySweden
SpainKorea (Rep.)Denmark
Turkey
FranceUnited StatesBelgium
ZimbabweFinland
India
Argentina
Egypt
Pakistan
PeruItaly
Sri Lanka
Taiwan
Nigeria
PortugalChileSouth AfricaIreland
ColombiaIndonesia
Canada
Israel
New Zealand
Hong Kong
Singapore
United Kingdom
Australia
Malaysia
Thailand
-20
24
6R
esid
ual I
PO
s pe
r mill
ion
popu
latio
n
-.6 -.4 -.2 0 .2 .4Residual Anti-self-dealing index
coef = 2.8438251, (robust) se = 1.1770917, t = 2.42
Figure V: Partial-regression leverage plot of IPOs-to-GDP against the index of anti-self-dealing in regressions that control for (log) income per capita and efficiency of the judiciary.

Netherlands
Venezuela
Philippines
Mexico
Brazil
Germany
Switzerland
Turkey
Austria
Spain
Korea (Rep.)
SwedenNorwayJapan
Czech Rep.
Denmark
FranceEgypt
Peru
Poland
Argentina
Finland
United StatesItaly
Taiwan
PortugalChile
Indonesia
ColombiaSouth Africa
Canada
Israel
New Zealand
Thailand
MalaysiaHong KongSingapore
United Kingdom
Australia
-.20
.2.4
Res
idua
l Blo
ck p
rem
ium
-.4 -.2 0 .2 .4Residual Anti-self-dealing index
coef = -.20738814, (robust) se = .07973244, t = -2.6
Figure VI: Partial-regression leverage plot of block premium against the index of anti-self-dealing in regressions that control for (log) income per capita and efficiency of the judiciary.

NetherlandsPhilippines
Japan
Ecuador
France
Korea (Rep.)
Jordan
GermanyDenmark
Switzerland
United States
Austria
Nigeria
Greece
Sweden
KenyaSpain
Venezuela
Uruguay
Finland
India
Sri Lanka
Brazil
Turkey
Pakistan
Mexico
Norway
Italy
Zimbabwe
Belgium
PortugalPeru
Taiwan
Canada
Chile
Egypt
ArgentinaIsrael
Ireland
Singapore
New Zealand
Indonesia
Hong Kong
South AfricaMalaysia
United KingdomAustralia
Colombia
Thailand
-.4-.2
0.2
.4R
esid
ual O
wne
rshi
p co
ncen
tratio
n
-.5 0 .5Residual Ex-ante control of self-dealing index
coef = .01502084, (robust) se = .05688132, t = .26
VenezuelaJordanNetherlands
Mexico
Ecuador
Uruguay
Norway
GermanyBrazil
Greece
Kenya
Switzerland
Argentina
Egypt
Colombia
Austria
Philippines
Sweden
Spain
Turkey
Denmark
Korea (Rep.)
South Africa
Japan
Belgium
Zimbabwe
France
IndonesiaPeru
Taiwan
Australia
IrelandThailand
United Kingdom
Finland
Chile
ItalyNew Zealand
Hong Kong
India
Pakistan
United States
Portugal
Singapore
Malaysia
Sri LankaIsrael
Nigeria
Canada
-.4-.2
0.2
.4R
esid
ual O
wne
rshi
p co
ncen
tratio
n-.4 -.2 0 .2 .4Residual Ex-post control of self-dealing index
coef = -.18976674, (robust) se = .06652104, t = -2.85
Figure VII: Partial-regression leverage plot of ownership concentration against ex-ante control of self-dealing (left graph) and ex-post control of self dealing (right graph) in regressions that control for (log) income per capita and efficiency of the judiciary.

Iceland
Finland
IrelandJapan
United States
United Kingdom
Taiwan
Hong Kong
ArgentinaNetherlands
New ZealandVenezuelaSlovak Rep.HungaryPanama
ColombiaJamaica
Lithuania
BulgariaTurkey
Thailand
South Africa
Egypt
Jordan
Sri Lanka
El Salvador
ItalyKazahkstan
PhilippinesChinaIndonesia
KenyaNigeriaGhanaPeru
Bolivia
Switzerland
Australia
France
Belgium
Greece
UruguayMexicoKorea (Rep.)Croatia
Brazil
Denmark
Spain
IndiaLuxembourg
Austria
CanadaSweden
Norway
Israel
Pakistan
Germany
PortugalPoland
Singapore
Czech Rep.
Chile
Latvia
Malaysia
RomaniaEcuadorRussia
Morocco
Tunisia
-100
010
020
030
0R
esid
ual S
tock
-mar
ket-c
apita
lizat
ion-
to-G
DP
ratio
-.5 0 .5 1Residual Public enforcement index
coef = -19.555688, (robust) se = 15.530115, t = -1.26
Figure VIII: Partial-regression leverage plot of stock market capitalization and the index of public enforcement in regressions that control for (log) income per capita and efficiency of the judiciary.

Table I Description of the Variables
Variable Description
1.1) Private Enforcement: Ex-Ante Private Control of Self-Dealing
Approval by disinterested Shareholders
Equals 1 if the transaction must be approved by disinterested shareholders, and zero otherwise.
Disclosures by Buyer Index of disclosures that are required before the transaction may be approved. Ranges from 0 to 1. One-third point if each of the following items must be disclosed by Buyer to the public or its shareholders before the transaction is approved: (1) Mr. James owns 60% of Buyer; (2) Mr. James owns 90% of Seller; and either (3) all material facts or the following three items: (a) description of the assets; (b) nature and amount of consideration; and (c) explanation for the price.
Disclosures by Mr. James Index of disclosures that Mr. James must make before the transaction may be approved. Ranges from 0 to 1. Equals 0 if no disclosure is required. Equals 1/2 if only the existence of a conflict of interest must be disclosed, without details. Equals 1 if all material facts must be disclosed.
Independent review Equals 1 if a positive review required before the transaction may be approved (e.g., by a financial expert), and zero otherwise.
Ex-ante disclosure Average of the preceding three variables.
Ex-ante private control of self-dealing
Index of ex-ante control of self-dealing transactions. Average of approval by disinterested shareholders and ex-ante disclosure.
1.2) Private Enforcement: Ex-Post Private Control of Self-Dealing
Disclosure in periodic filings Index of disclosures required in periodic disclosures (e.g., annual reports). Ranges from 0 to 1. One fifth-point for each of the following items: (1) Mr. James owns 60% of stake in Buyer; (2) Mr. James owns 90% of Seller; (3) shares held beneficially by Mr. James (i.e., shares held and/or managed via a nominee account, trust, brokerage firm or bank); (4) shares held indirectly by Mr. James (e.g., via a subsidiary company or holding); and either (5) all material facts about the transaction or the following three items: (a) description of the assets; (b) nature and amount of consideration; and (c) explanation for the price.
Standing to sue Equals 1 if a 10% shareholder may sue (derivatively or directly) Mr. James or the approving bodies or both for damages that the firm suffered as a result of the transaction, and zero otherwise.
Rescission Index of the ease in rescinding the transaction. Ranges from 0 to 1. Equals 0 when rescission is unavailable. Equals 1/3 when rescission is only available in case of bad faith. Equals 2/3 when rescission is available when the transaction is oppressive or prejudicial. Equals 1 when rescission is available when the transaction is unfair or entails a conflict of interest.
Ease of holding Mr. James liable Index of the ease in holding Mr. James liable for civil damages. Ranges from 0 to 1. Equals 0 when the interested director is either not liable or liable in

Variable Description
case of bad faith. Equals 1/2 when the interested director is liable if he either influenced the approval or was negligent. Equals 1 if the interested director is liable if the transaction is unfair, oppressive, or prejudicial.
Ease of holding the approving body liable
Index of the ease in holding members of the approving body liable for civil damages. Ranges from 0 to 1. Equals 0 when members of the approving body are either not liable or liable in case of bad faith. Equals 1/2 when members of the approving body are liable if they acted negligently. Equals 1 if members of the approving body are liable if the transaction is unfair, oppressive, or prejudicial.
Access to evidence Index of access to evidence. Ranges from 0 to 1. One quarter point for each of the following four rights: (1) a shareholder owning at least 10% of the shares can request that the Court appoint an inspector to investigate Buyer’s affairs; (2) the plaintiff can request any documents relevant to the case from the defendant (without specifying which ones); (3) the plaintiff may examine the defendant without the Court approving the questions in advance; and (4) the plaintiff may examine non-parties without the court approving the questions in advance. One-eight point for each of the following two rights: (1) the plaintiff may examine the defendant but questions require prior court approval; and (2) the plaintiff may examine directly the non-parties but questions require prior court approval.
Ease in proving wrongdoing Average of the preceding five variables.
Ex-post private control of self-dealing
Index of ex-post control over self-dealing transactions. Average of disclosure in periodic filings and ease of proving wrongdoing. Ranges from zero to one.
1.3) Private Enforcement: Anti-self-dealing index
Anti-self-dealing index Average of ex-ante and ex-post private control of self-dealing.
2) Public Enforcement
Fines for approving body Equals one if, under our case facts, fines may be applied to members of the approving body, and zero otherwise.
Prison term for approving body Maximum length of prison term for members of the approving body under our case facts.
Fines for Mr. James Equals one if, under our case facts, fines may be applied to Mr. James, and zero otherwise.
Prison term for Mr. James Maximum length of prison term for Mr. James under our case facts.
Public enforcement index Index of public enforcement. Ranges from 0 to 1. One quarter point when each of the following sanctions is available: (1) fines for the approving body; (2) jail sentences for the approving body; (3) fines for Mr. James; and (4) jail sentence for Mr. James.
3) Stock Market Development
Stock market capitalization to GDP
Average of the ratio of stock market capitalization to gross domestic product for the period 1999-2003.

Variable Description
Listed firms per million population
Average ratio of the number of domestic firms listed in a given country to its population (in millions) for the period 1999-2003. Source: World Development Indicators.
IPOs-to-GDP The average ratio of the equity issued by newly listed firms in a given country (in thousands) to its GDP (in millions) over the period 1996-2000. Source: Securities Data Corporation, World Bank (2001)
Block premium “The block premia is computed taking the difference between the price per share paid for the control block and the exchange price two days after the announcement of the control transaction, dividing by the exchange price and multiplying by the ratio of the proportion of cash flow rights represented in the controlling block.” We use the country’s sample media. Source: Dyck and Zingales (2004).
Ownership concentration Average percentage of common shares owned by the top three shareholders in the ten largest non-financial, privately-owned domestic firms in a given country. A firm is considered privately-owned if the State is not a known shareholder in it. Source: La Porta et al. (1999), Hartland- Peel (1996) for Kenya, Bloomberg and various annual reports for Ecuador, Jordan, and Uruguay.
4) Control Variables
Ln GDP/POP Logarithmic of per capita Gross Domestic Product (in US dollars) in 2003. Source: World Development Indicators.
Time to collect on a bounced check
Logarithm of the length (in calendar days) of the judicial procedure to collect on a bounced check. Source: Djankov et al. (2003a).

Country Approval by disinterested shareholders Disclosure by Buyer Disclosure by James Independent review Ex-ante disclosure Ex-ante private control of self-
dealingAustralia 1 0.33 1.00 1.00 0.78 0.89Canada 0 1.00 1.00 0.00 0.67 0.33Ghana 1 0.00 1.00 0.00 0.33 0.67Hong Kong 1 1.00 1.00 1.00 1.00 1.00India 0 0.00 1.00 1.00 0.67 0.33Ireland 1 0.67 1.00 0.00 0.56 0.78Israel 0 1.00 1.00 1.00 1.00 0.50Jamaica 0 0.00 1.00 0.00 0.33 0.17Kenya 0 0.00 1.00 0.00 0.33 0.17Malaysia 1 1.00 1.00 1.00 1.00 1.00New Zealand 1 1.00 1.00 1.00 1.00 1.00Nigeria 0 0.00 1.00 0.00 0.33 0.17Pakistan 0 0.00 1.00 0.00 0.33 0.17Singapore 1 1.00 1.00 1.00 1.00 1.00South Africa 1 1.00 1.00 1.00 1.00 1.00Sri Lanka 0 0.00 0.50 0.00 0.17 0.08Thailand 1 1.00 1.00 1.00 1.00 1.00Uganda 0 1.00 0.50 0.00 0.50 0.25United Kingdom 1 1.00 1.00 1.00 1.00 1.00United States 0 1.00 1.00 0.00 0.67 0.33Zimbabwe 0 1.00 1.00 0.00 0.67 0.33Average English origin 0.48 0.62 0.95 0.48 0.68 0.58
Argentina 0 1.00 1.00 1.00 1.00 0.50Belgium 0 0.33 1.00 1.00 0.78 0.39Bolivia 0 0.00 0.00 0.00 0.00 0.00Brazil 0 0.33 1.00 0.00 0.44 0.22Chile 0 1.00 1.00 1.00 1.00 0.50Colombia 1 1.00 1.00 0.00 0.67 0.83Ecuador 0 0.00 0.00 0.00 0.00 0.00Egypt 1 0.00 0.50 0.00 0.17 0.58El Salvador 1 0.67 0.50 1.00 0.72 0.86France 0 0.00 0.50 0.00 0.17 0.08Greece 0 0.00 0.50 0.00 0.17 0.08Indonesia 1 0.33 0.50 1.00 0.61 0.81Italy 0 0.00 0.50 0.00 0.17 0.08Jordan 0 0.00 1.00 0.00 0.33 0.17Kazahkstan 1 0.00 1.00 0.00 0.33 0.67Lithuania 0 0.67 0.50 0.00 0.39 0.19Luxembourg 0 0.00 1.00 0.00 0.33 0.17Mexico 0 0.67 0.50 0.00 0.39 0.19Morocco 1 0.00 0.50 1.00 0.50 0.75Netherlands 0 0.33 0.00 0.00 0.11 0.06Panama 0 0.00 1.00 0.00 0.33 0.17Peru 0 1.00 0.50 0.00 0.50 0.25Philippines 0 0.33 0.00 0.00 0.11 0.06Portugal 0 0.33 1.00 0.00 0.44 0.22Romania 0 0.67 1.00 0.00 0.56 0.28Russia 1 0.33 1.00 1.00 0.78 0.89Spain 0 0.33 1.00 0.00 0.44 0.22Tunisia 0 0.00 0.00 0.00 0.00 0.00Turkey 0 1.00 1.00 0.00 0.67 0.33Ukraine 0 0.00 0.00 0.00 0.00 0.00Uruguay 0 0.00 0.50 0.00 0.17 0.08Venezuela 0 0.00 0.50 0.00 0.17 0.08Average French origin 0.22 0.32 0.63 0.22 0.39 0.30
Austria 0 0.00 0.00 0.00 0.00 0.00Bulgaria 1 0.00 1.00 1.00 0.67 0.83China 1 1.00 1.00 1.00 1.00 1.00Croatia 0 0.00 0.00 1.00 0.33 0.17Czech Rep. 0 0.00 0.00 1.00 0.33 0.17Germany 0 0.33 0.50 0.00 0.28 0.14Hungary 0 0.00 0.00 0.00 0.00 0.00Japan 0 0.33 1.00 0.00 0.44 0.22Korea (Rep.) 0 1.00 0.50 0.00 0.50 0.25Latvia 0 0.33 0.50 1.00 0.61 0.31Poland 0 1.00 0.50 0.00 0.50 0.25Slovak Rep. 0 0.33 0.00 0.00 0.11 0.06Switzerland 0 0.00 0.50 0.00 0.17 0.08Taiwan 0 1.00 0.50 1.00 0.83 0.42Average German origin 0.14 0.38 0.43 0.43 0.41 0.28
Denmark 0 1.00 0.50 0.00 0.50 0.25Finland 0 0.33 0.50 0.00 0.28 0.14Iceland 0 0.33 0.50 0.00 0.28 0.14Norway 0 1.00 0.50 1.00 0.83 0.42Sweden 0 1.00 0.00 0.00 0.33 0.17Average Scandinavian origin 0.00 0.73 0.40 0.20 0.44 0.22
Average Civil Law 0.18 0.38 0.55 0.27 0.40 0.29World Average 0.26 0.45 0.67 0.33 0.48 0.37
Common vs. Civil 2.72 2.19 4.73 1.66 3.83 3.70French vs Common 2.00 2.53 3.74 2.00 3.63 3.08French vs German 0.59 0.46 1.60 1.46 0.26 0.28French vs Scandinavian 1.15 2.29 1.28 0.09 0.41 0.63
Common vs. Civil 1% 3% 0% 10% 0% 0%French vs Common 5% 1% 0% 5% 0% 0%French vs German 56% 65% 12% 15% 80% 78%French vs Scandinavian 26% 3% 21% 93% 68% 54%
T-Stat -- Significance level
Table IIEx-ante control of self-dealing
T-Stat

Country Disclosure in periodic filings Standing to sue Rescission Ease of holding Mr.
James liableEase of holding
approving body liableAccess to evidence
Ease of proving wrongdoing
Ex-post private control of self-dealing Anti-self-dealing index
Australia 0.80 1.00 0.33 0.00 0.50 0.75 0.58 0.69 0.79Canada 1.00 1.00 1.00 0.50 1.00 1.00 0.94 0.97 0.65Ghana 0.80 1.00 0.67 1.00 0.50 0.75 0.79 0.80 0.73Hong Kong 1.00 1.00 0.67 1.00 1.00 0.75 0.85 0.93 0.96India 0.80 1.00 0.67 0.00 1.00 0.75 0.73 0.76 0.55Ireland 0.80 1.00 0.67 1.00 0.00 1.00 0.79 0.80 0.79Israel 1.00 1.00 0.67 1.00 0.50 1.00 0.85 0.93 0.71Jamaica 0.20 1.00 0.67 1.00 1.00 0.75 0.85 0.53 0.35Kenya 0.00 1.00 0.00 0.00 0.50 1.00 0.56 0.28 0.22Malaysia 1.00 1.00 0.67 1.00 1.00 0.50 0.79 0.90 0.95New Zealand 0.80 1.00 1.00 1.00 1.00 1.00 1.00 0.90 0.95Nigeria 1.00 1.00 0.67 1.00 0.50 0.50 0.73 0.86 0.52Pakistan 0.80 0.00 1.00 0.50 0.50 0.50 0.50 0.65 0.41Singapore 1.00 1.00 1.00 1.00 1.00 1.00 1.00 1.00 1.00South Africa 0.40 1.00 0.67 1.00 1.00 0.75 0.85 0.63 0.81Sri Lanka 0.80 1.00 0.67 0.50 0.50 0.50 0.67 0.73 0.41Thailand 1.00 1.00 0.33 0.00 0.00 0.25 0.40 0.70 0.85Uganda 0.60 1.00 0.33 0.50 0.50 0.38 0.55 0.58 0.41United Kingdom 1.00 1.00 0.33 0.50 0.50 1.00 0.71 0.85 0.93United States 1.00 1.00 1.00 1.00 1.00 0.75 0.94 0.97 0.65Zimbabwe 0.60 1.00 0.00 0.00 2.00 0.50 0.50 0.55 0.44Average English origin 0.78 0.95 0.62 0.64 0.74 0.73 0.74 0.76 0.67
Argentina 0.40 1.00 0.00 0.00 0.00 0.50 0.38 0.39 0.44Belgium 0.80 1.00 0.33 0.50 0.50 0.50 0.58 0.69 0.54Bolivia 0.00 0.00 0.00 0.50 0.50 0.75 0.31 0.16 0.08Brazil 0.20 1.00 0.33 0.50 0.50 0.25 0.52 0.36 0.29Chile 1.00 1.00 0.00 0.50 0.50 0.50 0.50 0.75 0.63Colombia 0.20 1.00 0.00 0.00 0.50 0.50 0.44 0.32 0.58Ecuador 0.00 0.00 0.33 0.50 0.50 0.50 0.33 0.17 0.08Egypt 0.40 1.00 0.33 0.00 0.00 0.25 0.40 0.40 0.49El Salvador 0.40 0.00 0.33 0.00 0.00 0.25 0.15 0.27 0.57France 0.80 1.00 1.00 0.00 0.50 0.00 0.56 0.68 0.38Greece 0.40 0.00 0.33 0.50 0.50 0.50 0.33 0.37 0.23Indonesia 0.60 1.00 0.33 0.50 0.00 0.50 0.52 0.56 0.68Italy 1.00 1.00 0.00 0.00 0.50 0.25 0.38 0.69 0.39Jordan 0.20 0.00 0.00 0.00 0.50 0.13 0.09 0.15 0.16Kazahkstan 0.40 0.00 0.00 0.00 0.50 0.50 0.19 0.29 0.48Lithuania 0.80 0.00 0.00 0.50 0.50 0.75 0.31 0.56 0.38Luxembourg 0.60 0.00 0.00 0.00 0.50 0.00 0.06 0.33 0.25Mexico 0.20 0.00 0.00 0.00 0.00 0.50 0.13 0.16 0.18Morocco 0.40 1.00 0.00 0.00 0.50 0.25 0.38 0.39 0.57Netherlands 0.60 0.00 0.00 0.00 0.00 0.50 0.13 0.36 0.21Panama 0.00 0.00 0.00 0.50 0.50 0.50 0.25 0.13 0.15Peru 0.80 0.00 0.33 1.00 0.50 0.25 0.33 0.57 0.41Philippines 0.40 1.00 0.00 0.00 0.00 0.75 0.44 0.42 0.24Portugal 1.00 1.00 0.00 0.50 0.50 0.50 0.50 0.75 0.49Romania 0.60 1.00 0.00 0.50 0.50 0.50 0.50 0.55 0.41Russia 0.00 0.00 0.00 0.00 0.50 0.25 0.13 0.06 0.48Spain 0.60 1.00 0.00 0.50 0.50 0.25 0.44 0.52 0.37Tunisia 0.40 0.00 0.33 0.50 0.00 0.50 0.27 0.34 0.17Turkey 0.60 1.00 0.00 0.50 0.50 0.25 0.44 0.52 0.43Ukraine 0.00 1.00 0.33 0.50 0.00 0.13 0.43 0.21 0.11Uruguay 0.00 1.00 0.00 0.50 0.00 0.75 0.50 0.25 0.17Venezuela 0.00 0.00 0.00 0.00 0.50 0.50 0.19 0.09 0.09Average French origin 0.43 0.53 0.14 0.28 0.34 0.41 0.35 0.39 0.35
Austria 0.40 1.00 0.00 0.50 0.50 0.25 0.44 0.42 0.21Bulgaria 0.80 0.00 0.00 0.00 0.50 0.50 0.19 0.49 0.66China 0.80 1.00 0.00 0.00 0.00 0.25 0.31 0.56 0.78Croatia 0.40 0.00 0.33 0.50 0.50 0.25 0.27 0.34 0.25Czech Rep. 0.40 1.00 0.00 0.50 0.50 1.00 0.63 0.51 0.34Germany 0.40 1.00 0.00 0.50 0.50 0.25 0.44 0.42 0.28Hungary 0.20 1.00 0.33 0.50 0.50 0.63 0.61 0.41 0.20Japan 0.80 1.00 0.00 1.00 1.00 0.75 0.69 0.74 0.48Korea (Rep.) 1.00 1.00 0.00 0.00 0.50 0.13 0.34 0.67 0.46Latvia 0.40 0.00 0.00 0.50 0.50 1.00 0.38 0.39 0.35Poland 0.20 1.00 0.00 0.00 0.50 0.75 0.50 0.35 0.30Slovak Rep. 0.60 1.00 0.00 0.50 0.50 0.25 0.44 0.52 0.29Switzerland 0.40 1.00 0.00 0.50 0.50 0.50 0.50 0.45 0.27Taiwan 1.00 1.00 0.00 0.50 0.50 0.13 0.41 0.70 0.56Average German origin 0.56 0.79 0.05 0.39 0.50 0.47 0.44 0.50 0.39
Denmark 0.80 1.00 0.00 0.50 0.50 0.75 0.56 0.68 0.47Finland 1.00 1.00 0.00 0.50 0.50 0.75 0.56 0.78 0.46Iceland 0.40 0.00 0.33 0.50 0.00 0.50 0.27 0.34 0.24Norway 0.20 1.00 0.33 1.00 0.50 0.75 0.71 0.45 0.44Sweden 0.40 1.00 0.00 0.50 0.50 1.00 0.63 0.51 0.34Average Scandinavian origin 0.56 0.80 0.13 0.60 0.40 0.75 0.55 0.55 0.39
Average Civil law 0.48 0.63 0.11 0.34 0.39 0.46 0.39 0.43 0.36World average 0.57 0.72 0.26 0.43 0.49 0.54 0.49 0.53 0.45
Common vs Civil 3.86 2.92 8.44 3.46 4.35 4.26 8.25 6.75 6.25French vs Common 4.06 3.59 6.70 3.74 4.26 5.30 8.81 6.88 5.72French vs German 1.27 1.64 1.39 1.23 2.17 0.87 1.94 1.87 0.73French vs Scandinavian 0.83 1.12 0.02 2.40 0.50 3.53 2.72 1.73 0.50
Common vs Civil 0% 0% 0% 0% 0% 0% 0% 0% 0%French vs Common 0% 0% 0% 0% 0% 0% 0% 0% 0%French vs German 21% 11% 17% 23% 4% 39% 6% 7% 47%French vs Scandinavian 41% 27% 98% 2% 62% 0% 1% 9% 62%
T-Stat
T-Stat -- Significance level
Table IIIEx-post private control of self-dealing and anti-self-dealing index
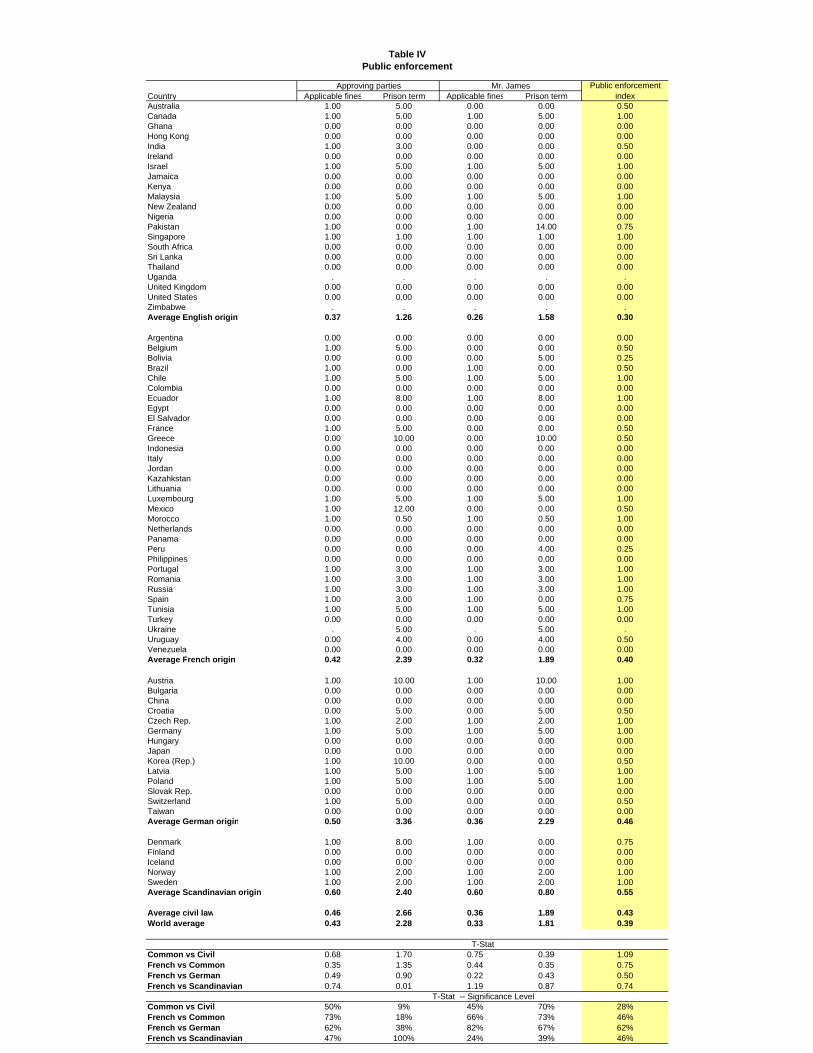
Country Applicable fines Prison term Applicable fines Prison termAustralia 1.00 5.00 0.00 0.00 0.50Canada 1.00 5.00 1.00 5.00 1.00Ghana 0.00 0.00 0.00 0.00 0.00Hong Kong 0.00 0.00 0.00 0.00 0.00India 1.00 3.00 0.00 0.00 0.50Ireland 0.00 0.00 0.00 0.00 0.00Israel 1.00 5.00 1.00 5.00 1.00Jamaica 0.00 0.00 0.00 0.00 0.00Kenya 0.00 0.00 0.00 0.00 0.00Malaysia 1.00 5.00 1.00 5.00 1.00New Zealand 0.00 0.00 0.00 0.00 0.00Nigeria 0.00 0.00 0.00 0.00 0.00Pakistan 1.00 0.00 1.00 14.00 0.75Singapore 1.00 1.00 1.00 1.00 1.00South Africa 0.00 0.00 0.00 0.00 0.00Sri Lanka 0.00 0.00 0.00 0.00 0.00Thailand 0.00 0.00 0.00 0.00 0.00Uganda . . . . .United Kingdom 0.00 0.00 0.00 0.00 0.00United States 0.00 0.00 0.00 0.00 0.00Zimbabwe . . . . .Average English origin 0.37 1.26 0.26 1.58 0.30
Argentina 0.00 0.00 0.00 0.00 0.00Belgium 1.00 5.00 0.00 0.00 0.50Bolivia 0.00 0.00 0.00 5.00 0.25Brazil 1.00 0.00 1.00 0.00 0.50Chile 1.00 5.00 1.00 5.00 1.00Colombia 0.00 0.00 0.00 0.00 0.00Ecuador 1.00 8.00 1.00 8.00 1.00Egypt 0.00 0.00 0.00 0.00 0.00El Salvador 0.00 0.00 0.00 0.00 0.00France 1.00 5.00 0.00 0.00 0.50Greece 0.00 10.00 0.00 10.00 0.50Indonesia 0.00 0.00 0.00 0.00 0.00Italy 0.00 0.00 0.00 0.00 0.00Jordan 0.00 0.00 0.00 0.00 0.00Kazahkstan 0.00 0.00 0.00 0.00 0.00Lithuania 0.00 0.00 0.00 0.00 0.00Luxembourg 1.00 5.00 1.00 5.00 1.00Mexico 1.00 12.00 0.00 0.00 0.50Morocco 1.00 0.50 1.00 0.50 1.00Netherlands 0.00 0.00 0.00 0.00 0.00Panama 0.00 0.00 0.00 0.00 0.00Peru 0.00 0.00 0.00 4.00 0.25Philippines 0.00 0.00 0.00 0.00 0.00Portugal 1.00 3.00 1.00 3.00 1.00Romania 1.00 3.00 1.00 3.00 1.00Russia 1.00 3.00 1.00 3.00 1.00Spain 1.00 3.00 1.00 0.00 0.75Tunisia 1.00 5.00 1.00 5.00 1.00Turkey 0.00 0.00 0.00 0.00 0.00Ukraine . 5.00 . 5.00 .Uruguay 0.00 4.00 0.00 4.00 0.50Venezuela 0.00 0.00 0.00 0.00 0.00Average French origin 0.42 2.39 0.32 1.89 0.40
Austria 1.00 10.00 1.00 10.00 1.00Bulgaria 0.00 0.00 0.00 0.00 0.00China 0.00 0.00 0.00 0.00 0.00Croatia 0.00 5.00 0.00 5.00 0.50Czech Rep. 1.00 2.00 1.00 2.00 1.00Germany 1.00 5.00 1.00 5.00 1.00Hungary 0.00 0.00 0.00 0.00 0.00Japan 0.00 0.00 0.00 0.00 0.00Korea (Rep.) 1.00 10.00 0.00 0.00 0.50Latvia 1.00 5.00 1.00 5.00 1.00Poland 1.00 5.00 1.00 5.00 1.00Slovak Rep. 0.00 0.00 0.00 0.00 0.00Switzerland 1.00 5.00 0.00 0.00 0.50Taiwan 0.00 0.00 0.00 0.00 0.00Average German origin 0.50 3.36 0.36 2.29 0.46
Denmark 1.00 8.00 1.00 0.00 0.75Finland 0.00 0.00 0.00 0.00 0.00Iceland 0.00 0.00 0.00 0.00 0.00Norway 1.00 2.00 1.00 2.00 1.00Sweden 1.00 2.00 1.00 2.00 1.00Average Scandinavian origin 0.60 2.40 0.60 0.80 0.55
Average civil law 0.46 2.66 0.36 1.89 0.43World average 0.43 2.28 0.33 1.81 0.39
Common vs Civil 0.68 1.70 0.75 0.39 1.09French vs Common 0.35 1.35 0.44 0.35 0.75French vs German 0.49 0.90 0.22 0.43 0.50French vs Scandinavian 0.74 0.01 1.19 0.87 0.74
Common vs Civil 50% 9% 45% 70% 28%French vs Common 73% 18% 66% 73% 46%French vs German 62% 38% 82% 67% 62%French vs Scandinavian 47% 100% 24% 39% 46%
Table IV
T-Stat
T-Stat -- Significance Level
Approving parties Mr. James Public enforcement index
Public enforcement

Country GDP per capita Ex-ante private control of self-dealing
Ex-post private control of self-dealing Anti-self-dealing index Public enforcement
IndexUganda $253 0.25 0.58 0.41 .Ghana $254 0.67 0.80 0.73 0.00Nigeria $332 0.17 0.86 0.52 0.00Kenya $347 0.17 0.28 0.22 0.00Pakistan $441 0.17 0.65 0.41 0.75India $450 0.33 0.76 0.55 0.50Zimbabwe $570 0.33 0.55 0.44 .Ukraine $632 0.00 0.21 0.11 .Indonesia $728 0.81 0.56 0.68 0.00China $856 1.00 0.56 0.78 0.00Sri Lanka $884 0.08 0.73 0.41 0.00Philippines $991 0.06 0.42 0.24 0.00Bolivia $1,009 0.00 0.16 0.08 0.25Morocco $1,161 0.75 0.39 0.57 1.00Kazahkstan $1,215 0.67 0.29 0.48 0.00Ecuador $1,284 0.00 0.17 0.08 1.00Egypt $1,554 0.58 0.40 0.49 0.00Bulgaria $1,564 0.83 0.49 0.66 0.00Romania $1,651 0.28 0.55 0.41 1.00Jordan $1,732 0.17 0.15 0.16 0.00Russia $1,784 0.89 0.06 0.48 1.00Colombia $1,980 0.83 0.32 0.58 0.00Thailand $2,021 1.00 0.70 0.85 0.00Tunisia $2,036 0.00 0.34 0.17 1.00Peru $2,045 0.25 0.57 0.41 0.25El Salvador $2,115 0.86 0.27 0.57 0.00Jamaica $2,874 0.17 0.53 0.35 0.00South Africa $2,910 1.00 0.63 0.81 0.00Turkey $2,956 0.33 0.52 0.43 0.00Latvia $3,025 0.31 0.39 0.35 1.00Lithuania $3,247 0.19 0.56 0.38 0.00Brazil $3,538 0.22 0.36 0.29 0.50Slovak Rep. $3,750 0.06 0.52 0.29 0.00Malaysia $3,875 1.00 0.90 0.95 1.00Panama $4,183 0.17 0.13 0.15 0.00Croatia $4,207 0.17 0.34 0.25 0.50Poland $4,309 0.25 0.35 0.30 1.00Hungary $4,657 0.00 0.41 0.20 0.00Chile $4,965 0.50 0.75 0.63 1.00Venezuela $4,988 0.08 0.09 0.09 0.00Czech Rep. $5,007 0.17 0.51 0.34 1.00Mexico $5,934 0.19 0.16 0.18 0.50Uruguay $6,046 0.08 0.25 0.17 0.50Argentina $7,927 0.50 0.39 0.44 0.00Greece $10,265 0.08 0.37 0.23 0.50Portugal $10,405 0.22 0.75 0.49 1.00Korea (Rep.) $10,890 0.25 0.67 0.46 0.50New Zealand $13,399 1.00 0.90 0.95 0.00Spain $13,861 0.22 0.52 0.37 0.75Taiwan $13,953 0.42 0.70 0.56 0.00Israel $18,257 0.50 0.93 0.71 1.00Italy $18,631 0.08 0.69 0.39 0.25Australia $20,229 0.89 0.69 0.79 0.50France $22,217 0.08 0.68 0.38 0.50Belgium $22,240 0.39 0.69 0.54 0.50Germany $22,750 0.14 0.42 0.28 1.00Singapore $22,767 1.00 1.00 1.00 1.00Canada $22,966 0.33 0.97 0.65 1.00Finland $23,200 0.14 0.78 0.46 0.00Netherlands $23,300 0.06 0.36 0.21 0.00Austria $23,808 0.00 0.42 0.21 1.00United Kingdom $24,423 1.00 0.85 0.93 0.00Hong Kong $24,810 1.00 0.93 0.96 0.00Ireland $24,864 0.78 0.80 0.79 0.00Sweden $27,033 0.17 0.51 0.34 1.00Denmark $29,672 0.25 0.68 0.47 0.75Iceland $29,797 0.14 0.34 0.24 0.00Switzerland $33,443 0.08 0.45 0.27 0.50United States $34,590 0.33 0.97 0.65 0.00Norway $37,165 0.42 0.45 0.44 1.00Japan $37,549 0.22 0.74 0.48 0.00Luxembourg $44,831 0.17 0.33 0.25 1.00
Average bottom income quartile $807 0.38 0.49 0.44 0.23Average middle 50% of income $6,830 0.37 0.49 0.43 0.42Average top income quartile $28,289 0.37 0.65 0.51 0.49World average $10,689 0.37 0.53 0.45 0.40
Top vs middle 50% 12.14 0.06 2.36 1.10 0.49Top vs bottom quartile 17.56 0.12 2.06 0.88 1.66Middle vs bottom quartile 4.33 0.09 0.04 0.09 1.51
Top vs middle 50% 0% 96% 2% 27% 62%Top vs bottom quartile 0% 90% 5% 38% 11%Middle vs bottom quartile 0% 93% 96% 93% 14%
T-Stat
T-Stat -- Significance Level
Table V Regulation of self-dealing and GDP per capita

Country Stock market capitalization to GDP
Listed firms per million population IPOs to GDP Block premium Ownership
concentrationAustralia 102.0 68.3 8.71 1% 28%Canada 106.2 73.8 8.57 1% 40%Ghana 12.5 1.2 . . .Hong Kong 361.0 129.2 9.12 2% 54%India 33.8 5.6 0.60 . 40%Ireland 67.6 17.9 6.09 . 39%Israel 53.0 97.7 0.39 21% 51%Jamaica 65.0 16.3 . . .Kenya 15.3 1.8 0.71 . 67%Malaysia 148.4 34.6 6.18 5% 54%New Zealand 40.1 36.9 0.06 4% 48%Nigeria 12.4 1.5 0.00 . 40%Pakistan 14.3 5.2 0.40 . 37%Singapore 164.8 100.6 5.94 3% 49%South Africa 155.8 12.0 0.65 0% 52%Sri Lanka 10.0 12.8 0.50 . 60%Thailand 44.8 6.6 0.82 7% 47%Uganda 0.6 0.1 . . .United Kingdom 157.7 33.1 11.27 0% 19%United States 142.1 22.8 5.47 2% 20%Zimbabwe 88.8 5.7 1.29 . 55%Average English origin 85.5 32.6 3.7 4% 44%
Argentina 58.1 3.1 0.56 12% 53%Belgium 67.2 15.5 2.35 . 54%Bolivia 15.6 3.2 . . .Brazil 38.4 2.5 0.05 49% 57%Chile 89.7 16.7 0.51 15% 45%Colombia 14.3 2.9 0.01 15% 63%Ecuador 5.8 2.4 0.00 . 54%Egypt 30.4 16.4 2.22 4% 62%El Salvador 17.3 5.6 . . .France 89.5 13.7 2.31 1% 34%Greece 91.4 29.7 8.78 . 67%Indonesia 24.7 1.5 1.67 7% 58%Italy 52.8 4.9 5.94 16% 58%Jordan 77.6 31.6 0.00 . 52%Kazahkstan 7.9 2.2 . . .Lithuania 12.8 14.5 . . .Luxembourg 144.6 113.3 . . .Mexico 21.9 1.7 0.22 47% 64%Morocco 30.4 1.9 . . .Netherlands 131.7 12.3 2.63 3% 39%Panama 25.2 9.7 . . .Peru 22.8 8.2 0.04 17% 56%Philippines 48.0 2.9 2.22 8% 57%Portugal 46.2 8.8 2.27 20% 52%Romania 5.5 234.3 . . .Russia 33.2 1.5 . . .Spain 79.9 45.9 2.41 2% 51%Tunisia 11.9 4.7 . . .Turkey 35.3 4.3 1.48 11% 59%Ukraine 5.9 3.6 . . .Uruguay 1.2 4.4 0.00 . 78%Venezuela 5.5 2.8 0.68 28% 51%Average French origin 42.0 19.6 1.7 16% 55%
Austria 16.4 12.1 1.16 38% 58%Bulgaria 5.5 61.0 . . .China 43.3 0.9 . . .Croatia 16.5 14.2 . . .Czech Rep. 20.2 10.4 . 35% .Germany 54.7 10.5 2.78 11% 48%Hungary 24.0 5.5 . . .Japan 69.2 21.5 2.39 -1% 18%Korea (Rep.) 54.1 29.4 5.32 17% 23%Latvia 8.5 26.7 . . .Poland 16.7 5.7 . 12% .Slovak Rep. 5.3 79.4 . . .Switzerland 249.0 35.9 7.11 7% 41%Taiwan 101.9 25.8 10.07 0% 18%Average German origin 48.9 24.2 4.8 15% 34%
Denmark 58.6 39.4 1.20 4% 45%Finland 177.1 28.6 3.78 1% 37%Iceland 64.2 207.5 . . .Norway 39.7 40.2 2.20 1% 36%Sweden 112.3 31.4 6.33 3% 28%Average Scandinavian origin 90.4 69.4 3.4 2% 37%
Average Civil law 48.6 25.7 2.54 14% 49%World average 59.4 27.7 2.97 11% 47%
Common vs Civil 2.33 0.61 1.25 10.32 7.39French vs Common 2.58 1.10 2.00 2.54 3.07French vs German 0.47 0.37 2.71 0.17 4.03French vs Scandinavian 2.53 2.10 1.38 1.85 3.83
Common vs Civil 2% 55% 22% 0% 0%French vs Common 1% 28% 5% 2% 0%French vs German 64% 71% 1% 87% 0%French vs Scandinav 2% 4% 18% 8% 0%
T-Stat
T-Stat -- Significance Level
Table VIStock Market Development

[1] [2] [3] [4] [5] [6]
Approval by disinterested shareholders 27.35c
[15.54]Ex-ante disclosure 43.37c
[22.45]Ex-ante private control of self-dealing 43.64b
[21.89]Disclosure in periodic filings 42.42a
[16.15]Difficulty proving wrongdoing 62.50b
[29.99]Ex-post private control of self-dealing 73.09a
[26.31]Ln GDP/POP 23.73a 21.26a 22.82a 20.20a 20.85a 19.50a
[4.61] [4.35] [4.36] [4.17] [4.08] [4.09]Time to collect on a bounced check -15.11c -15.02c -13.95c -15.80c -16.14c -14.66c
[8.50] [7.94] [7.63] [9.32] [8.70] [8.45]Constant -70.01 -63.44 -77.61 -53.15 -63.19 -67.67
[57.90] [49.14] [51.07] [58.34] [54.85] [53.83]Observations 72 72 72 72 72 72R-squared 0.397 0.404 0.411 0.406 0.408 0.428
Robust standard errors in bracketsa Significant at 1% level.b Significant at 5% level.c Significant at 10% level.
Dependent Variable: Stock-market-capitalization-to-GDP ratio
Table VIIStock Market Capitalization and Control of Self-Dealing

Stock market capitalization to GDP Ln Firms / Pop IPOs / GDP Block premium Ownership
concentrationLn GDP/POP 22.824a 0.671a 1.163a -0.030 -0.032b
[4.359] [0.094] [0.231] [0.019] [0.013]Time to collect on a bounced check -13.952c 0.069 0.260 0.039c 0.059b
[7.632] [0.150] [0.577] [0.021] [0.026]Ex-ante control of private self-dealing 43.641b 0.301 1.953 -0.140a -0.004
[21.892] [0.375] [1.311] [0.048] [0.053]Constant -77.614 -3.739a -9.380b 0.245 0.444b
[51.068] [1.320] [4.329] [0.270] [0.204]Observations 72 72 49 39 49R-squared 0.41 0.45 0.33 0.33 0.27
Stock market capitalization to GDP Ln Firms / Pop IPOs / GDP Block premium Ownership
concentrationLn GDP/POP 19.503a 0.614a 1.039a -0.006 -0.026b
[4.093] [0.105] [0.217] [0.015] [0.011]Time to collect on a bounced check -14.656c 0.110 0.306 0.044b 0.042c
[8.447] [0.143] [0.551] [0.021] [0.024]Ex-post private control of self-dealing 73.086a 1.306a 3.952a -0.215b -0.190a
[26.309] [0.512] [1.495] [0.094] [0.066]Constant -67.674 -4.043a -10.085b 0.064 0.591a
[53.834] [1.296] [4.158] [0.225] [0.161]Observations 72 72 49 39 49R-squared 0.43 0.48 0.37 0.32 0.36
Stock market capitalization to GDP Ln Firms / Pop IPOs / GDP Block premium Ownership
concentrationLn GDP/POP 21.122a 0.652a 1.104a -0.021 -0.030b
[4.168] [0.096] [0.220] [0.016] [0.012]Time to collect on a bounced check -12.176c 0.114 0.417 0.035 0.048c
[6.935] [0.147] [0.557] [0.021] [0.025]Anti self-dealing index 78.95b 0.928c 3.712b -0.216a -0.092
[31.879] [0.490] [1.741] [0.077] [0.070]Constant -91.746c -4.119a -10.739b 0.233 0.534a
[47.588] [1.302] [4.291] [0.258] [0.180]Observations 72 72 49 39 49R-squared 0.44 0.46 0.36 0.36 0.29
Robust standard errors in bracketsa Significant at 1% level.b Significant at 5% level.c Significant at 10% level.
Panel C: Anti-self-dealing index
Table VIIIStock market development and the regulation of self-Dealing
Panel A: Ex-ante private control of self-dealing
Panel B: Ex-post private control of self-dealing

Stock market capitalization to GDP Ln Firms / Pop IPOs / GDP Block premium Ownership
concentration
Ln GDP/POP 20.74a 0.65a 1.10a -0.02 -0.03b
[4.39] [0.10] [0.22] [0.02] [0.01]Time to collect on a bounced check -6.13 0.18 0.77 0.04c 0.04
[6.30] [0.15] [0.64] [0.02] [0.03]Anti-self-dealing index 146.92a 1.73b 6.23b -0.14c -0.16
[48.95] [0.81] [2.58] [0.07] [0.11]Constant -150.26a -4.81a -13.73a 0.14 0.61a
[53.28] [1.41] [5.03] [0.27] [0.19]Observations 72 72 49 39 49R-squared 0.39 0.46 0.36 0.32 0.27
Ln GDP/POP 0.03c
[0.02]Time to collect on a bounced check -0.05
[0.04]English legal origin 0.31a
[0.05]Constant 0.36
[0.26]Observations 72R-squared 0.43Robust standard error values in bracketsa Significant at 1% level.b Significant at 5% level.c Significant at 10% level.
Table IX
Panel B: First-stage regression results for anti-self-dealing index
Panel A: Second-stage regression results
Instrumental variables regressions

Stock market capitalization to GDP Ln Firms / Pop IPOs / Pop Block premium Ownership
concentrationLn GDP/POP 25.12a 0.60a 1.29a -0.03c -0.03b
[5.03] [0.09] [0.28] [0.02] [0.02]Time to collect on a bounced check -17.92c -0.03 0.08 0.05b 0.06b
[9.63] [0.15] [0.63] [0.02] [0.03]Public enforcement -19.56 0.20 -0.95 0.07b 0.02
[15.53] [0.35] [1.09] [0.04] [0.04]Constant -52.96 -2.55b -8.45c 0.10 0.47b
[62.46] [1.14] [4.62] [0.24] [0.21]Observations 69 69 48 39 48R-squared 0.38 0.41 0.30 0.26 0.27
Robust standard error values in bracketsa Significant at 1% level.b Significant at 5% level.c Significant at 10% level.
Table XRegression results for public enforcement

Table XI Description of the revised anti-director rights index
Variable Description
Vote by mail Equals one if the law explicitly mandates or sets as a default rule that: (a) proxy solicitations paid by the company include a proxy form allowing shareholders to vote on the items on the agenda; (b) a proxy form to vote on the items on the agenda accompanies notice to the meeting; or (c) shareholders vote by mail on the items on the agenda (i.e. postal ballot); and zero otherwise.
Shares not deposited Equals 1 if the law does not require, nor explicitly permits companies to require, shareholders to deposit with the company or another firm any of their shares prior to a general shareholders meeting.
Cumulative voting Equals one if the law explicitly mandates or sets as a default rule that shareholders owning 10% or less of the capital may cast all their votes for one board of directors or supervisory board candidate (cumulative voting) or if the law explicitly mandates or sets as a default rule a mechanism of proportional representation in the board of directors or supervisory board by which shareholders owning 10% or less of the capital stock may name a proportional number of directors to the board, and zero otherwise.
Oppressed minority Index of the difficulty faced by (minority) shareholders owning 10% or less of the capital stock in challenging (i.e. by either seeking damages or having the transaction rescinded) resolutions that benefit controlling shareholders and damage the company. Equals one if minority shareholders may challenge a resolution of both the shareholders and the board (of directors or, if available, of supervisors) if it is unfair, prejudicial, oppressive, or abusive; equals one-half if shareholders are able to challenge either a resolution of the shareholders or of the board (of directors or, if available, of supervisors) if it is unfair, prejudicial, or oppressive; equals zero otherwise.
Pre-emptive rights Equals one when the law or listing rules explicitly mandate or set as a default rule that shareholders hold the first opportunity to buy new issues of stock; equals zero otherwise.
Capital to call a meeting The minimum percentage of share capital [or voting power] that the law mandates or sets as a default rule as entitling a single shareholder to call a shareholders' meeting (directly or through the court). Define capital to equal one when capital to call a meeting is less than or equal to 10 percent and zero otherwise.
Anti-director rights index Aggregate index of shareholder rights. The index is formed by summing: (1) vote by mail; (2) shares not blocked or deposited; (3) cumulative voting; (4) oppressed minority; (5) pre-emptive rights; and (6) capital.

Country Vote by mail Shares not deposited Cumulative voting Oppressed minority Preemptive rights Capital to call
meeting Anti-director Index
Australia 1 1 0 1.0 0 5% 4.0Canada 1 1 0 1.0 0 5% 4.0Ghana 1 1 0 1.0 1 5% 5.0Hong Kong 1 1 0 1.0 1 10% 5.0India 1 1 0 1.0 1 10% 5.0Ireland 0 1 0 1.0 1 10% 4.0Israel 1 1 0 1.0 0 5% 4.0Jamaica 1 1 0 1.0 0 10% 4.0Kenya 1 1 0 1.0 0 10% 4.0Malaysia 1 1 0 1.0 1 10% 5.0New Zealand 0 1 0 1.0 1 5% 4.0Nigeria 1 1 0 1.0 0 10% 4.0Pakistan 0 1 1 0.0 1 10% 4.0Singapore 1 1 0 1.0 1 10% 5.0South Africa 1 1 0 1.0 1 5% 5.0Sri Lanka 1 1 0 1.0 0 10% 4.0Thailand 0 1 1 1.0 1 20% 4.0Uganda 1 1 0 1.0 0 10% 4.0United Kingdom 1 1 0 1.0 1 10% 5.0United States 1 1 0 1.0 0 . 3.0Zimbabwe 1 1 0 1.0 0 5% 4.0Average English origin 0.81 1.00 0.10 0.95 0.52 9% 4.29
Argentina 0 0 1 0.0 1 5% 3.0Belgium 1 0 0 0.0 1 20% 2.0Bolivia 0 0 0 0.0 1 20% 1.0Brazil 1 0 1 1.0 1 5% 5.0Chile 0 1 1 0.0 1 10% 4.0Colombia 0 1 1 0.0 1 20% 3.0Ecuador 0 1 0 0.0 1 25% 2.0Egypt 0 0 0 1.0 0 10% 2.0El Salvador 0 0 0 0.0 1 5% 2.0France 1 0 0 0.0 1 10% 3.0Greece 0 0 0 0.0 1 5% 2.0Indonesia 0 1 0 1.0 1 10% 4.0Italy 0 0 0 0.5 1 10% 2.5Jordan 0 1 0 0.0 0 25% 1.0Kazahkstan 1 1 1 0.0 1 5% 5.0Lithuania 0 1 1 0.0 1 10% 4.0Luxembourg 0 0 0 0.0 1 20% 1.0Mexico 0 1 0 0.0 1 10% 3.0Morocco 0 0 0 0.0 1 10% 2.0Netherlands 0 0 0 1.0 1 10% 3.0Panama 0 0 0 0.0 1 5% 2.0Peru 0 1 1 0.5 1 20% 3.5Philippines 0 1 1 0.0 1 . 3.0Portugal 0 0 0 0.5 1 5% 2.5Romania 0 1 1 1.0 1 10% 5.0Russia 0 1 1 0.0 1 10% 4.0Spain 1 0 1 1.0 1 5% 5.0Tunisia 1 1 0 0.0 1 15% 3.0Turkey 0 0 0 0.0 1 5% 2.0Ukraine 0 1 0 0.0 1 10% 3.0Uruguay 0 0 0 0.0 1 20% 1.0Venezuela 0 0 0 0.0 0 20% 0.0Average French origin 0.19 0.44 0.34 0.23 0.91 12% 2.77
Austria 0 0 0 0.5 1 5% 2.5Bulgaria 1 1 0 0.0 1 10% 4.0China 0 0 0 0.0 0 10% 1.0Croatia 0 0 0 0.5 1 5% 2.5Czech Rep. 0 1 0 1.0 1 3% 4.0Germany 0 0 0 0.5 1 5% 2.5Hungary 0 1 0 0.0 0 10% 2.0Japan 0 1 1 0.5 0 3% 3.5Korea (Rep.) 1 0 1 0.5 0 3% 3.5Latvia 0 0 1 0.0 1 5% 3.0Poland 0 0 0 0.0 1 10% 2.0Slovak Rep. 0 1 0 0.0 1 5% 3.0Switzerland 0 0 0 1.0 1 10% 3.0Taiwan 0 0 1 0.0 1 3% 3.0Average German origin 0.14 0.36 0.29 0.32 0.71 6% 2.82
Denmark 0 1 0 1.0 1 10% 4.0Finland 0 1 0 0.5 1 10% 3.5Iceland 0 1 1 0.5 1 10% 4.5Norway 0 1 0 0.5 1 5% 3.5Sweden 0 1 0 0.5 1 10% 3.5Average Scandinavian origin 0.00 1.00 0.20 0.60 1.00 9% 3.80
Average Civil law 0.16 0.47 0.31 0.29 0.86 10% 2.88World average 0.35 0.63 0.25 0.49 0.76 10% 3.29
Common vs. Civil 6.67 4.79 -1.97 7.27 -3.26 -0.90 5.32French vs Common -5.55 -5.10 2.10 -7.49 3.45 1.99 -5.06French vs German -0.36 0.50 0.38 -0.69 1.68 3.11 -0.15French vs Scandinavian 1.04 -2.47 0.62 -1.97 -0.70 0.98 -1.75
Common vs. Civil 0% 0% 5% 0% 0% 37% 0%French vs Common 0% 0% 4% 0% 0% 5% 0%French vs German 72% 62% 71% 49% 10% 0% 88%French vs Scandinavian 30% 2% 54% 6% 49% 33% 9%
T-Stat
T-Stat -- Significance Level
Table XII -- (Revised) Anti-director rights

Stock market capitalization to GDP Ln Firms / Pop IPOs to GDP Block premium Ownership
concentrationLn GDP/POP 18.08a 0.52a 1.20a -0.01 -0.03a
[5.19] [0.08] [0.22] [0.02] [0.01]Time to collect on a bounced check -24.88b -0.24 0.27 0.05a 0.04c
[10.69] [0.19] [0.57] [0.02] [0.02]Anti-director rights index-- LLSV 98 14.38a 0.26a 0.60b -0.03a -0.04a
[5.58] [0.10] [0.27] [0.01] [0.01]Constant 2.49 -1.54 -10.76b 0.07 0.67a
[69.15] [1.64] [4.34] [0.22] [0.17]Observations 49 49 49 37 49R-squared 0.40 0.57 0.35 0.32 0.37
Stock market capitalization to GDP Ln Firms / Pop IPOs to GDP Block premium Ownership
concentrationLn GDP/POP 23.38a 0.69a 1.25a -0.02 -0.03a
[4.46] [0.09] [0.23] [0.02] [0.01]Time to collect on a bounced check -13.86 0.18 0.37 0.06a 0.04b
[8.62] [0.15] [0.57] [0.02] [0.02]Anti-director rights index -- Revised 11.25b 0.33a 0.68b -0.01 -0.02
[5.32] [0.12] [0.32] [0.02] [0.02]Constant -102.97 -5.48a -12.21a 0.01 0.63a
[63.34] [1.44] [4.68] [0.23] [0.19]Observations 72 72 49 39 49R-squared 0.40 0.51 0.34 0.21 0.30
Robust standard error values in bracketsa Significant at 1% level.b Significant at 5% level.c Significant at 10% level.
Table XIII
Panel B: Revised anti-director rights index
Panel A: Anti-director rights index from LLSV
Regression results for anti-director rights index

Stock market capitalization to GDP Ln Firms / Pop IPOs / GDP Block premium Ownership
concentrationLn GDP/POP 22.00a 0.69a 1.15a -0.02 -0.03a
[4.28] [0.09] [0.23] [0.02] [0.01]Time to collect on a bounced check -10.83 0.19 0.55 0.05b 0.04c
[6.79] [0.15] [0.57] [0.02] [0.02]Anti-self-dealing index 71.03b 0.27 3.71c -0.29b -0.01
[32.49] [0.58] [2.08] [0.13] [0.09]Anti-directors index (revised) 4.20 0.31b 0.19 0.03 -0.02
[3.92] [0.15] [0.32] [0.03] [0.02]Constant -115.94b -5.53a -12.46a 0.13 0.63a
[53.27] [1.47] [4.60] [0.24] [0.19]Observations 72 72 49 39 49R-squared 0.45 0.51 0.39 0.38 0.30
Stock market capitalization to GDP Ln Firms / Pop IPOs / GDP Block premium Ownership
concentration
Ln GDP/POP 17.06a 0.49a 1.16a -0.01 -0.03a
[5.14] [0.08] [0.20] [0.01] [0.01]Time to collect on a bounced check -15.27 -0.05 0.95c 0.03 0.03
[11.07] [0.20] [0.52] [0.02] [0.02]Anti-self-dealing index 29.83 0.99 1.32 -0.09 0.08
[51.29] [0.73] [2.03] [0.10] [0.09]Disclosure in the prospectus 85.42b 1.21c 5.29a -0.21 -0.29a
[38.05] [0.69] [1.62] [0.13] [0.09]Constant -60.92 -2.70c -15.93a 0.25 0.76a
[81.16] [1.61] [4.08] [0.23] [0.19]Observations 49 49 49 37 49R-squared 0.44 0.62 0.46 0.40 0.40
Stock market capitalization to GDP Ln Firms / Pop IPOs / GDP Block premium Ownership
concentration
Ln GDP/POP 16.14a 0.48a 1.10a -0.02 -0.03b
[5.07] [0.08] [0.20] [0.02] [0.01]Time to collect on a bounced check -16.74 -0.06 0.92 0.03 0.03
[10.89] [0.20] [0.61] [0.02] [0.02]Anti-self-dealing index 61.16 1.40a 3.08c -0.17b -0.04
[41.37] [0.52] [1.69] [0.07] [0.07]Prospectus liability 55.80a 0.91c 4.09a -0.12b -0.15b
[20.73] [0.47] [1.26] [0.06] [0.06]Constant -35.71 -2.44 -14.88a 0.26 0.64a
[74.28] [1.63] [4.56] [0.25] [0.18]Observations 49 49 49 37 49R-squared 0.43 0.62 0.46 0.40 0.34
Robust standard errors in bracketsa Significant at 1% level.b Significant at 5% level.c Significant at 10% level.
Table XIV
Panel A: Controlling for the revised anti-directors index
Panel B: Controlling for disclosure in the prospectus
Panel C: Controlling for prospectus liability
Horse race between anti-self-dealing and other proxies for investor protection

Ex-
ante
priv
ate
cont
rol
self-
deal
ing
Ex-
post
priv
ate
cont
rol
self-
deal
ing
Ant
i-sel
f-dea
ling
inde
x
Ant
idire
ctor
s in
dex
(rev
ised
)
Dis
clos
ure
in p
rosp
ectu
s
Pro
spec
tus
liabi
lity
Mar
ket c
apita
lizat
ion
to
GD
P
Ln(F
irms/
PO
P)
IPO
s/G
DP
Blo
ck p
rem
ium
Ow
ners
hip
conc
entra
tion
Tim
e to
col
lect
on
boun
ced
chec
k
Ex-post private control self-dealing 0.37Anti-self-dealing index 0.88a 0.76a
Antidirectors index (revised) 0.38c 0.54a 0.54a
Disclosure in prospectus 0.49b 0.71a 0.67a 0.58a
Prospectus liability 0.19 0.56a 0.40 0.46c 0.55a
Market capitalization to GDP 0.27 0.44a 0.41b 0.24 0.49b 0.43Ln(Firms / POP) 0.06 0.36 0.22 0.21 0.47c 0.42 0.49a
IPOs / GDP 0.27 0.41 0.38 0.19 0.44 0.42 0.65a 0.59a
Block premium -0.36 -0.50c -0.48 -0.22 -0.58b -0.45 -0.48 -0.53b -0.46Ownership concentration -0.10 -0.48b -0.30 -0.27 -0.50b -0.42 -0.31 -0.43 -0.47b 0.50Time to collect on bounced check -0.26 -0.23 -0.30 -0.28 -0.47c -0.41 -0.30 -0.06 -0.18 0.42 0.41Ln(GDP/POP) -0.03 0.27 0.11 -0.05 0.14 0.17 0.55a 0.66a 0.54a -0.27 0.43 -0.12
a Significant at 1% level.b Significant at 5% level.c Significant at 10% level.
Appendix -- Correlation Table