NBER WORKING PAPER SERIES SHAPE UP OR … · NBER WORKING PAPER SERIES SHAPE UP OR SHIP OUT: THE...
46
NBER WORKING PAPER SERIES SHAPE UP OR SHIP OUT: THE EFFECTS OF REMEDIATION ON STUDENTS AT FOUR-YEAR COLLEGES Eric Bettinger Bridget Terry Long Working Paper 10369 http://www.nber.org/papers/w10369 NATIONAL BUREAU OF ECONOMIC RESEARCH 1050 Massachusetts Avenue Cambridge, MA 02138 March 2004 The authors are grateful for helpful suggestions from seminar participants at the NBER Education Program Meeting, Cornell Higher Education Research Institute (CHERI), University of Michigan, Case Western Reserve University, and the University of Virginia. The authors thank the Ohio Board of Regents for their support during this research project. Rod Chu, Darrell Glenn, Robert Sheehan, and Andy Lechler provided invaluable help with the data. In addition, the Lumina Foundation provided crucial funding to aid in this research. Erin Riley, Cathy Wegmann, and Karen Singer Smith provided excellent research assistance. The views expressed herein are those of the authors and not necessarily those of the National Bureau of Economic Research. ©2004 by Eric Bettinger and Bridget Terry Long. All rights reserved. Short sections of text, not to exceed two paragraphs, may be quoted without explicit permission provided that full credit, including © notice, is given to the source.
Transcript of NBER WORKING PAPER SERIES SHAPE UP OR … · NBER WORKING PAPER SERIES SHAPE UP OR SHIP OUT: THE...
NBER WORKING PAPER SERIES
SHAPE UP OR SHIP OUT:THE EFFECTS OF REMEDIATION ON STUDENTS AT FOUR-YEAR COLLEGES
Eric BettingerBridget Terry Long
Working Paper 10369http://www.nber.org/papers/w10369
NATIONAL BUREAU OF ECONOMIC RESEARCH1050 Massachusetts Avenue
Cambridge, MA 02138March 2004
The authors are grateful for helpful suggestions from seminar participants at the NBEREducation Program Meeting, Cornell Higher Education Research Institute (CHERI), Universityof Michigan, Case Western Reserve University, and the University of Virginia. The authorsthank the Ohio Board of Regents for their support during this research project. Rod Chu, DarrellGlenn, Robert Sheehan, and Andy Lechler provided invaluable help with the data. In addition,the Lumina Foundation provided crucial funding to aid in this research. Erin Riley, CathyWegmann, and Karen Singer Smith provided excellent research assistance. The views expressedherein are those of the authors and not necessarily those of the National Bureau of EconomicResearch.
©2004 by Eric Bettinger and Bridget Terry Long. All rights reserved. Short sections of text, notto exceed two paragraphs, may be quoted without explicit permission provided that full credit,including © notice, is given to the source.

Shape Up or Ship Out: The Effects of Remediation on Students at Four-Year CollegesEric Bettinger and Bridget Terry LongNBER Working Paper No. 10369March 2004JEL No. I2, H4, C2
ABSTRACT
Remediation is an important part of American higher education with approximately one-third
of students requiring remedial or developmental courses. However, at an annual cost of over $1billion for public colleges alone, policymakers have become critical of the practice. Despite thegrowing debate and the thousands of under prepared students who enter college each year, there isalmost no research on the impact of remediation on student outcomes. This project addresses thiscritical issue by examining the effect of math remediation using a unique dataset of approximately8,600 students at nonselective, four-year colleges. To account for selection issues, the paper usesvariation in remediation placement policies across institutions and the importance of proximity incollege choice. The results suggest that placement (the "intention to treat") increases the likelihoodthat students drop out or transfer to a lower-level college in comparison to similar, non-remediatedstudents. The early timing of these outcomes implies that remediation may serve as a mechanismto re-sort students across schools. The results are mixed among students who actually complete thecourses (the "treatment on the treated" effect). After accounting for selection, remediated studentsare less likely to dropout suggesting that the courses may increase persistence. However, they takelonger to complete their degrees and are slightly more likely to transfer to lower-level colleges.
Eric Bettinger 266 Peter B. Lewis Building Dept of Economics Case Western Reserve University 11119 Bellflower Rd. Cleveland, OH 44106-7235 [email protected]
Bridget Terry Long Harvard Graduate School of Education Gutman Library 465 Appian Way Cambridge, MA 02138 [email protected]

1
I. Introduction
Remediation has become an important part of American higher education.1 Nearly one-third
of first-year college students require remedial education in reading, writing, or mathematics and the
length of time students need to complete these courses appears to be increasing (NCES, 2003).
While many of these students are older, nontraditional students trying to improve their basic skills,
most are underprepared, recent high school graduates. Few students leave high school ready for
college-level material (Greene and Foster, 2003), and remediation rates are high even among students
who have completed a college preparatory curriculum in high school (LOEO, 1995). The bulk of
remediation is provided by non-selective public institutions, the point of entry for 80 percent of four-
year students and virtually all two-year students. In Ohio, for example, 28 percent of first-time
students at nonselective, four-year colleges and 61 percent at community colleges were enrolled in
remedial math during fall 1998. Because students who attend nonselective institutions are almost
assured admission into these schools, the remediation placement exam taken once arriving on
campus is the key academic gate-keeper to postsecondary study. However, despite the proliferation
of remediation, little is known about its effects on student outcomes.
While proponents argue that the courses provide the opportunity to gain the competencies
necessary for college-level work and gainful employment, critics suggest that the courses remove the
incentive to adequately prepare for postsecondary study and that higher education is fundamentally
not an appropriate place for courses below college-level. With an estimated annual cost of over $1
billion at public colleges alone (Breneman and Haarlow 1997), the debate about the merits of
investing in remediation has intensified in recent years. Many states question whether remediation
should be offered, and if so, by whom. At one extreme, remedial education is “not allowed” at
public institutions in Connecticut and Arizona (Breneman and Haarlow, 1998). Additionally, at least
eight states, including Florida and Illinois, restrict remediation to two-year institutions. In 1999, with

2
70 percent of entering freshman failing at least one of three placement exams, the CUNY system
phased out most remediation at its four-year colleges (Hebel, 1999a). Other states, including Texas,
Tennessee, and Utah, have imposed or are considering limits on the government funding of remedial
coursework (ESC, 2003). The California State University system, for example, imposes a one-year
limit on remedial work. During the fall of 2001, the system “kicked out more than 2,200 students –
nearly 7 percent of the freshman class – for failing to master basic English and math skills”
(Trounson, 2002).
While there have been several initiatives to pass on the costs of remediation on to students,
many blame the increasing role of remediation on the K-12 system. During the CUNY controversy,
Rudolph Giuliani voiced the sentiment of numerous government officials when he said that the
“university system currently devotes far too much money and effort to teaching skills that students
should have learned in high school” (Schmidt, 1998). Therefore, some officials have targeted the
secondary school system for funding. For a short time, Minnesota allowed colleges to bill secondary
schools for the cost of their graduates’ remedial classes, and several secondary school districts in
Virginia “guarantee” their diplomas by paying the remedial expenses of its former students (Wheat,
1998). However, this type of action would not fully address the problem of remediation as only 64
percent of students earn a standard high school diploma, and many argue that high school graduation
standards do not coincide with the competencies needed in college (McCabe, 2001).
Despite the growing debate on remediation and the thousands of underprepared students who
enter the nation’s higher education institutions each year, little is known about the effects of
remediation on student outcomes. First, most states and colleges do not have exit standards for
remedial courses and do not perform systematic evaluation of their programs (Crowe, 1998;
Weissman, Bulakowski, and Jumisko, 1997). After assessing the literature on remediation, the Ohio
Board of Regents (2001) concluded that there were no benchmarks by which to judge the success of
1 The literature defines “remediation” as coursework that is being retaken while classes that focus on new material are termed “developmental.” In this paper, we will refer to both types of below-college-level courses as remedial.

3
higher education's remediation efforts. Likewise, two reviews of the literature on remedial and
developmental education found the bulk of studies to be seriously flawed methodologically (O’Hear
and MacDonald, 1995; Boylan and Saxon, 1999). A simple comparison of students placed in
remediation to those who are not is inherently flawed due to differences between the students. For
example, NCES (1996) suggests that freshmen enrolled in remedial classes are less likely to persist
into their second year, but this evidence does not control for student ability or possible movement
across colleges. As noted by Phipps (1998), “conjecture and criticism have filled the void created by
the lack of basic information.”
The lack of analysis on the effects of remediation is partly due to a lack of data. To
adequately address the topic, one needs extensive information on students' background, including
high school preparation and performance, as well as information about progress through college
including experiences with remediation and transfer behavior between schools. Furthermore,
detailed knowledge about institutional remediation policies is necessary to understand how
individuals are placed into the courses. This paper meets these requirements using a unique,
longitudinal dataset from the Ohio Board of Regents (OBR). Utilizing information from
applications, standardized test scores and questionnaires, and college transcripts, the paper examines
the experiences of approximately 8,000 first-time, full-time freshman of traditional age (those who
enrolled at age 18, 19, or 20) at Ohio nonselective, four-year colleges from Fall 1998 to Spring
2002.2 The paper explores the characteristics of math remediation, examines participation within
remedial courses, and analyzes the impact of remediation on student outcomes. We also explore
several hypotheses that may help explain the estimated effects. In this way, this paper addresses a
hole in the literature and discusses how higher education attempts to assimilate under prepared
students and train them for future college-level work and labor market success. Additionally, given
the system-wide nature of the data, we are able to distinguish between students who withdraw from
This also includes “basic-skills training” and “nontraditional coursework,” other names for developmental courses.

4
school altogether and those who transfer to any other Ohio public colleges, an improvement over the
information available in most studies.
As noted above, measuring the effects of remediation on student outcomes is difficult
because students placed into remediation differ systematically from other students. Moreover, to
the extent that institutional choice affects the likelihood of remediation, it may be troublesome to
compare students across schools. To avoid such selection biases, this study exploits two sources
of exogenous variation. First, as shown in the literature, proximity matters in college enrollment
and choice, and so we use distance as a predictor of which college the students attends. Second,
we use variation in remediation policies across colleges to predict the likelihood of remediation
at any given institution. Our combined instrument provides exogenous variation in college
choice and the likelihood of remediation. In essence, we are comparing two observationally-
alike students who attend different colleges due to proximity and therefore face different
probabilities of remediation due to institutional policies.
We estimate two effects. The first is the "intention to treat," or the impact of being placed
into remediation. These results suggest that students in remedial courses are much more likely to
dropout of college or transfer to a lower-level school than observationally-alike students not in
remediation. On the other hand, remediation did not appear to harm the likelihood of transferring to
a more selective institution or completing a four-year degree. One plausible explanation for the
negative effects is that remediation could serve as a mechanism for re-sorting students. When
students first enroll, they may overestimate their ability level and choose to attend a school that is too
rigorous for them thereby mis-sorting in the college matching process. Placement into remediation
serves as an early signal of this mistake and therefore may encourage students to reevaluate their
college choice decisions early in their careers. Additionally, we find evidence that the impact of
2 The six colleges in the sample are the University of Akron, Central State University, Cleveland State University, University of Toledo, Shawnee State University, and Wright State University.
5
remediation on degree completion differs according to whether the student intended to major in a
mathematical field or not suggesting that the role of remediation differs by plan of study.
However, many students placed into remediation do not finish the courses. Therefore, while
the college “intends” to remediate them, they do not receive the full “treatment” (i.e. remediation).
We also present evidence on the effect of completing remediation, or the effect of the "treatment on
the treated." To deal with the fact that the completion of remediation differs by background, we
compare students with similar likelihoods of success using a matching estimator. The results suggest
that successful remediation reduces dropout rates. However, remediated students take longer to
complete their degrees perhaps due to the fact that placement delays their ability to take college-level
courses, and similar to the "intention to treat" estimates, remediation increases the likelihood that
students transfer to lower-level colleges.
II. The Supply and Demand of Remediation
The Data
This study focuses on traditional-age college undergraduates who entered public,
nonselective, four-year colleges in Ohio as first-time freshman during the fall of 1998. The data
were provided by the Ohio Board of Regents (OBR), which through its agreements with all of the in-
state public postsecondary institutions collects a variety of information including student applications
and transcripts. Collaborative arrangements with other agencies also link the data to ACT and SAT
scores along with the accompanying student surveys.3 To be included in the sample, students must
have had valid zip code information, and colleges needed to have clear records of which courses
were considered remedial and which were not during the sample period.4
3 A majority of students in Ohio take the ACT exam. The records include the highest score of the student and his or her most recent responses to the ACT survey, which includes information on high school preparation and performance as well as the intended plan of study in college. 4 The sample excludes two schools due to the inability to identify which courses were remedial in 1998-99 (University of Cincinnati and Kent State University).
6
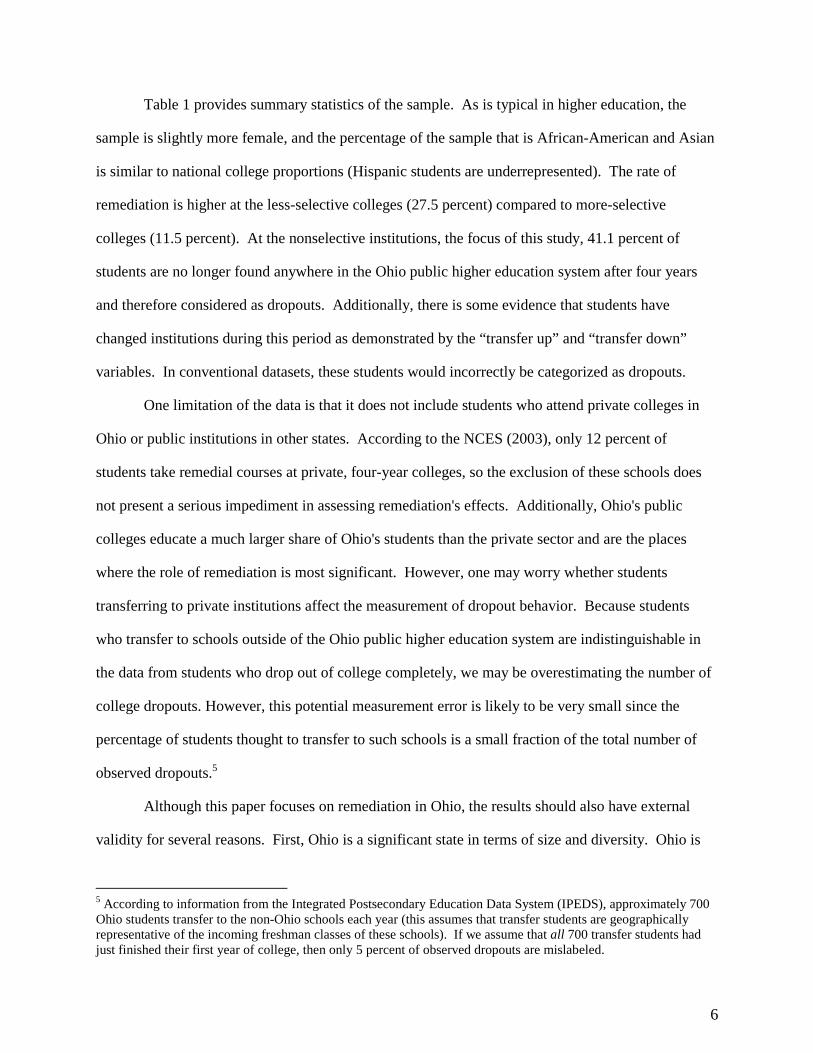
Table 1 provides summary statistics of the sample. As is typical in higher education, the
sample is slightly more female, and the percentage of the sample that is African-American and Asian
is similar to national college proportions (Hispanic students are underrepresented). The rate of
remediation is higher at the less-selective colleges (27.5 percent) compared to more-selective
colleges (11.5 percent). At the nonselective institutions, the focus of this study, 41.1 percent of
students are no longer found anywhere in the Ohio public higher education system after four years
and therefore considered as dropouts. Additionally, there is some evidence that students have
changed institutions during this period as demonstrated by the “transfer up” and “transfer down”
variables. In conventional datasets, these students would incorrectly be categorized as dropouts.
One limitation of the data is that it does not include students who attend private colleges in
Ohio or public institutions in other states. According to the NCES (2003), only 12 percent of
students take remedial courses at private, four-year colleges, so the exclusion of these schools does
not present a serious impediment in assessing remediation's effects. Additionally, Ohio's public
colleges educate a much larger share of Ohio's students than the private sector and are the places
where the role of remediation is most significant. However, one may worry whether students
transferring to private institutions affect the measurement of dropout behavior. Because students
who transfer to schools outside of the Ohio public higher education system are indistinguishable in
the data from students who drop out of college completely, we may be overestimating the number of
college dropouts. However, this potential measurement error is likely to be very small since the
percentage of students thought to transfer to such schools is a small fraction of the total number of
observed dropouts.5
Although this paper focuses on remediation in Ohio, the results should also have external
validity for several reasons. First, Ohio is a significant state in terms of size and diversity. Ohio is
5 According to information from the Integrated Postsecondary Education Data System (IPEDS), approximately 700 Ohio students transfer to the non-Ohio schools each year (this assumes that transfer students are geographically representative of the incoming freshman classes of these schools). If we assume that all 700 transfer students had just finished their first year of college, then only 5 percent of observed dropouts are mislabeled.

7
the sixth largest state in terms of college enrollment and seventh in terms of population. The only
states with greater numbers of students in public colleges are California, Texas, New York, and
Illinois (NCES, 2000). Moreover, Ohio reflects the complete spectrum of urban to rural communities
and labor markets that exist across the nation. Second, the array of public choices in Ohio reflects
the options students face in many other states. Ohio has a mixture of selective and nonselective four-
year institutions as well as two-year community and technical colleges spread geographically across
the state. Another compelling reason to study Ohio is that its college enrollment and remediation
rates are similar to national patterns. The percentage of Ohio public school students who graduate
from high school and enter higher education the following fall are near the national averages
(Mortenson, 2002). Furthermore, 27 percent of first-time freshmen enrolled in remedial math
nationally in 1995 (NCES, 1996), and 29 percent did so in the state. Finally, Ohio is an exemplary
case because it is confronting many of the concerns highlighted above in the debate about
remediation. The magnitude of the number of students involved and the costs of remediation have
parents, students, and policymakers in Ohio concerned about the value of the programs (Sternberg
and Thomas, 2002).
The Organization and Delivery of Remediation
The purpose of remedial education in most college systems is to provide underprepared
students the skills necessary to complete and succeed in college. As early as the 17th century,
Harvard College assigned tutors to underprepared students studying Latin (IHEP, 1998). In addition,
remediation may serve several institutional needs. First, it gives colleges the ability to generate
enrollment, particularly in English and Math departments. Moreover, by separating weaker students
into remedial courses, remediation allows colleges to protect institutional selectivity, regulate entry
to upper level courses, and maintain the research functions of the college. Finally, remediation may
serve as a tool to integrate students into the school population (Soliday, 2002). By 2000, 80 percent
of public four-year colleges and 98 percent of two-year colleges offered remediation (NCES, 2003).

8
In Ohio, all but one of the public colleges offer remedial courses to entering freshmen, and
approximately half of traditional-age, degree-seeking students take their remedial courses at four-
year institutions. 6 According to estimates by the OBR, in 2000, Ohio public colleges spent $15
million teaching 260,000 credit hours of high school-level courses to freshman; another $8.4 million
was spent on older students. However, this includes only the state subsidy, and items such as tuition
expenditures, financial aid resources, and lost wages are not included in this estimate.7 Remediation
costs the 20,000 freshmen in the courses an additional $15 million in tuition. Although expensive in
the aggregate, several studies have found remedial courses to be less costly than core academic
programs (Arkansas Department of Higher Education 1998; CUNY 1999). Much of this is likely due
to differences in class size and faculty compensation. Remedial courses are more likely to be taught
by adjuncts who are far less expensive than full professors.
Colleges differ significantly in how they place students into the courses and the requirements
that govern their completion. In Ohio, public colleges are independent and autonomous and
therefore free to set their own admissions, placement, and remediation policies (LOEO, 1995).8
Similar to national trends, most prohibit students from taking college-level courses in the same
subject area until remediation is complete. Some go even farther by barring students from taking any
college-level work while enrolled in remediation (LOEO, 1995).9 These requirements may restrict
students’ class schedules and impede the ability to major in certain areas. For example, engineering
requires a significant number of credit hours and gives students little leeway to enroll in non-required
classes. By restricting the kinds of majors students can take, remediation may negatively impact
6 The exception is Central State University. Miami University also sends students to satellite campuses for remediation. 7 Courses offered for credit receive instructional subsidy funding. In FY 1992, study skills courses also became subsidy eligible, but other support services such as tutoring and counseling receive no state funding (LOEO, 1995). 8 Ohio public institutions are subject to the state’s “open admissions” law that requires high school graduates to be admitted to the public school of their choice with certain exceptions. Students who have completed a college prep curriculum are generally accepted unconditionally. 9 Nationally, about 10 percent of higher educational institutions do not offer academic credit for remedial courses while others often offer general institutional credit but not subject credit for a degree. Over four-fifths of campuses nationally restrict enrollment in some college-level classes until remediation is complete, and most require those in need of remediation to participate in the courses (NCES, 2003).

9
labor market outcomes. All public colleges in Ohio offer credit for remedial courses, though at most
schools, this credit does not count toward degree completion and only becomes a part of the student’s
record (LOEO, 1995). At some colleges, remedial courses are offered institution-wide while others
have the courses housed in individual departments.
There is also a great deal of variation across universities as to what constitutes a remedial
course and how students are selected into remediation. While there are statewide standards in Ohio
to distinguish between remedial and college-level work, given the autonomy of public colleges in
Ohio, institutions differ in how they interpret these standards at the campus level. All schools require
entering freshman to take placement exams, but the instruments vary by institution with colleges
using different combinations of ACT and SAT scores, the Computerized Adaptive Placement
Assessment and Support Systems (COMPASS) exam, the Assessment of Skills for Successful Entry
and Transfer (ASSET) exam, and institutional-developed subject-area tests.10 In addition to
placement tests, some schools also use high school transcripts to make assignments. At most
schools, the placement exam is taken at the beginning of students’ freshman years. After taking the
exam, the college assigns students to a specific math course based on their scores.
Also reflecting the different interpretation of what comprises college-level coursework, the
cut-off scores used to determine placement differs among institutions. A survey performed by
Raymond Walters College on placement mechanisms and cut-off scores in Ohio found significant
differences in the level of performance required by different colleges for placement into their
college-level writing courses. For example, cut-off scores for placement into writing remediation
vary from 17 to 20 for the ACT, 410 to 580 for the SAT, and 26 to 44 for the ASSET test (SHERAC,
1997). Therefore, a student who might be placed into college-level courses at some Ohio colleges
would be put in remediation at others. This variation across institutions is central to our estimation
strategy.

10
Remediation policies could vary across colleges for a number of reasons. The first source,
which our identification strategy does not exploit, is due to differences in student bodies. For
example, four-year colleges typically have students with higher test scores and more college
preparation than community colleges, and so the proportion of their students in remediation is lower.
However, even among schools with similar student bodies, variation may exist for a myriad of
reasons. First, the preferences of the administration are likely to influence the role of remediation at
a school. For example, one four-year university decided to eliminate remediation after a change in
college leadership. Students requiring remediation are now referred to a local community college
(Sheehan, 2002). The preferences of the departments responsible for remedial courses are also likely
to be important and could impact which exam is used or the relative weight given to high school
preparation in determining placement. Finally, cost could affect remediation policies. If the cost of
remediation differs across schools, then they may cause policies to vary. Particularly over time, as
college budgets become more or less stringent, institutions may be more or less willing to spend
money on remediation. While the political economy and secondary schools of the surrounding area
might also be important in determining the role of remediation at a college, as shown below, the
characteristics of the local community are not related to the cutoffs for placement into remediation.
Participation in Remedial Education
The first major group of students in remedial education is underprepared recent high school
graduates, many of whom exit secondary school without grade-level competency or the proper
preparation for college-level material. In our sample, 37 percent of first-year students under the age
of 19 fit into this category having graduated from high school without a college-prep curriculum
(OBR, 2002). Studies have found that students who complete an academic core curriculum in high
school are half as likely to need remediation in college in comparison to other students (OBR, 2002;
10 The COMPASS and ASSET exams are published by ACT, Inc. and consist of a variety of tests to measure students’ skill level. For example, the ASSET exam is a written exam with as many as 12 subsections, including in depth assessment of students’ writing, numerical, and reading skills.
11
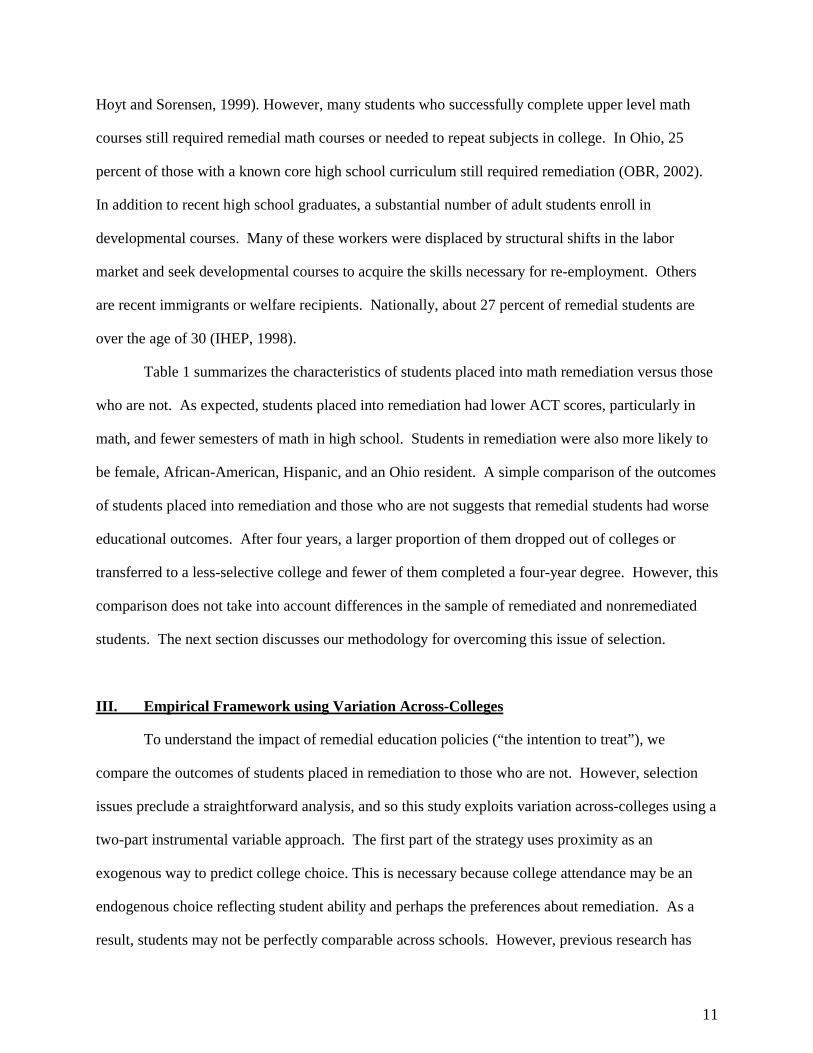
Hoyt and Sorensen, 1999). However, many students who successfully complete upper level math
courses still required remedial math courses or needed to repeat subjects in college. In Ohio, 25
percent of those with a known core high school curriculum still required remediation (OBR, 2002).
In addition to recent high school graduates, a substantial number of adult students enroll in
developmental courses. Many of these workers were displaced by structural shifts in the labor
market and seek developmental courses to acquire the skills necessary for re-employment. Others
are recent immigrants or welfare recipients. Nationally, about 27 percent of remedial students are
over the age of 30 (IHEP, 1998).
Table 1 summarizes the characteristics of students placed into math remediation versus those
who are not. As expected, students placed into remediation had lower ACT scores, particularly in
math, and fewer semesters of math in high school. Students in remediation were also more likely to
be female, African-American, Hispanic, and an Ohio resident. A simple comparison of the outcomes
of students placed into remediation and those who are not suggests that remedial students had worse
educational outcomes. After four years, a larger proportion of them dropped out of colleges or
transferred to a less-selective college and fewer of them completed a four-year degree. However, this
comparison does not take into account differences in the sample of remediated and nonremediated
students. The next section discusses our methodology for overcoming this issue of selection.
III. Empirical Framework using Variation Across-Colleges
To understand the impact of remedial education policies (“the intention to treat”), we
compare the outcomes of students placed in remediation to those who are not. However, selection
issues preclude a straightforward analysis, and so this study exploits variation across-colleges using a
two-part instrumental variable approach. The first part of the strategy uses proximity as an
exogenous way to predict college choice. This is necessary because college attendance may be an
endogenous choice reflecting student ability and perhaps the preferences about remediation. As a
result, students may not be perfectly comparable across schools. However, previous research has
12
shown that students are more likely to attend one school over another depending on how close the
colleges are to their homes (Rouse, 1995; Card, 1995). In fact, by state design most residents in Ohio
are within thirty miles of a college campus in order to facilitate access (OBR, 2001 Performance
Report).
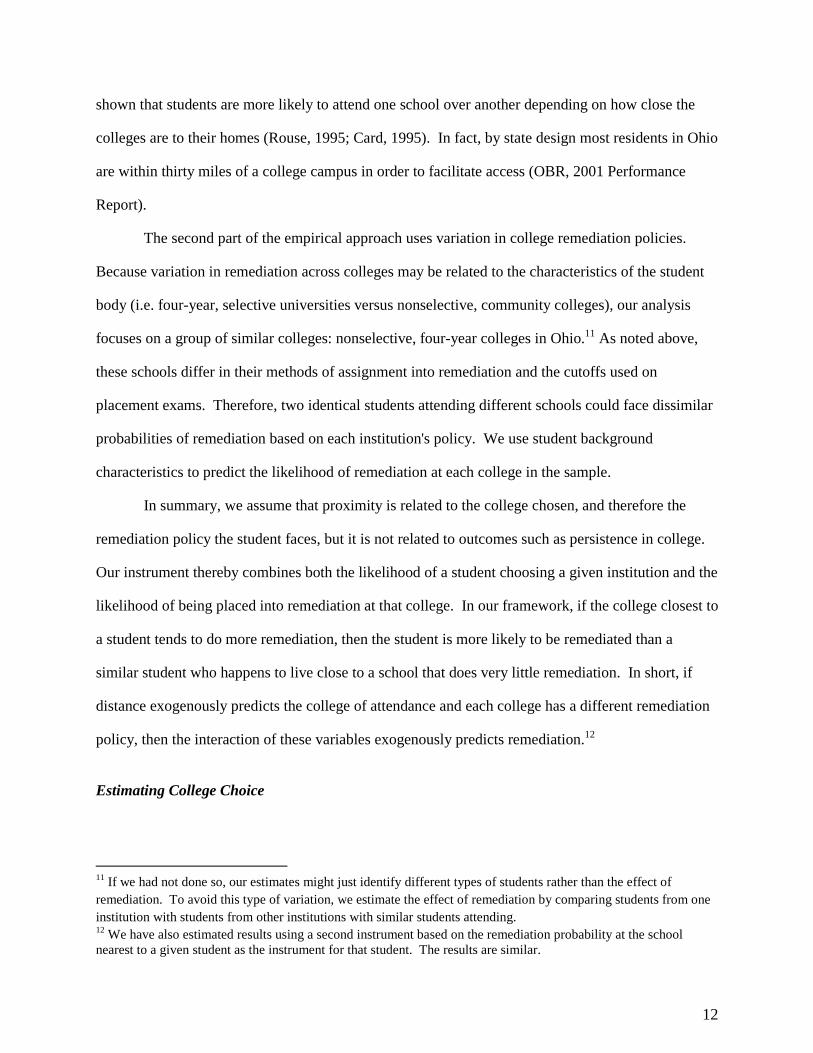
The second part of the empirical approach uses variation in college remediation policies.
Because variation in remediation across colleges may be related to the characteristics of the student
body (i.e. four-year, selective universities versus nonselective, community colleges), our analysis
focuses on a group of similar colleges: nonselective, four-year colleges in Ohio.11 As noted above,
these schools differ in their methods of assignment into remediation and the cutoffs used on
placement exams. Therefore, two identical students attending different schools could face dissimilar
probabilities of remediation based on each institution's policy. We use student background
characteristics to predict the likelihood of remediation at each college in the sample.
In summary, we assume that proximity is related to the college chosen, and therefore the
remediation policy the student faces, but it is not related to outcomes such as persistence in college.
Our instrument thereby combines both the likelihood of a student choosing a given institution and the
likelihood of being placed into remediation at that college. In our framework, if the college closest to
a student tends to do more remediation, then the student is more likely to be remediated than a
similar student who happens to live close to a school that does very little remediation. In short, if
distance exogenously predicts the college of attendance and each college has a different remediation
policy, then the interaction of these variables exogenously predicts remediation.12
Estimating College Choice
11 If we had not done so, our estimates might just identify different types of students rather than the effect of remediation. To avoid this type of variation, we estimate the effect of remediation by comparing students from one institution with students from other institutions with similar students attending. 12 We have also estimated results using a second instrument based on the remediation probability at the school nearest to a given student as the instrument for that student. The results are similar.

13
To approximate the likelihood that an individual will attend a specific college, we estimate
the probability of attendance conditional on that individual attending a similar type of school. For
example, a student who attended the University of Akron would be assigned the probability of
attendance based on proximity for all six nonselective, public, four-year colleges in Ohio. The
conditional logistic regression model is well-suited for this framework since it both allows for
multiple alternatives and can be used to exploit match-specific information such as distance. Also
known as McFadden’s choice model (1973), the conditional logit has been used to study college
choice as well as other topics such as the selection between travel modes and occupations.13 While
the form of the likelihood function is similar to that of the multinomial logistic regression, the
variables are choice-specific attributes rather than individual-specific characteristics. If the
independent variables were instead attributes of the individuals rather than alternatives, then the
models would be the same.
For this model, the data are organized as pair-wise combinations of each student i with each
school j so that there are a total of i × j observations. These observations are stratified by individual
into groups of j with each stratum constituting all possible college matches with one individual.
Using these combinations, the conditional logit model is made up of j equations for each individual i,
with each equation describing one of the alternatives. The conditional logit model then calculates the
probability of enrollment at each of the colleges in the stratum (i.e. it considers the probability of a
person attending any one of the available schools). It does this by computing the likelihood of
enrollment at each school relative to all alternatives so that the probabilities sum to one for each
individual (or within one stratum).
The format of the conditional logit allows for a variable that describes the distance to each
college for each individual (indexed by ij to denote individual i and school j).14 The dependent
variable, signifying the choice of the individual, equals one for the alternative that was chosen.
13 See Long (forthcoming) for an example of the conditional logit being applied to college choice. 14 Distance is calculated using the zip code used on the college application and the zip code of the institution.

14
Under the assumption that the εij’s are independent and identically distributed with the extreme value
distribution, we get the conditional logit functional form:
ijijjij
j
XB
XB
i
DSXB
e
ejY
ij
ij
εγβα +++=
==∑
'
)Pr('
'
where Sj is a series of fixed effects for each school, and Dij is the distance that student i lives from
university j. The format allows for maximum likelihood estimates of the coefficients, and the
probability of any particular choice can be calculated using the conditional logit specification.
Since the likelihood of attendance at each college is calculated relative to the alternatives
within each stratum, there must be variation within the strata for estimation purposes. For this
reason, student characteristics cannot be included independently in the estimation.15 The estimation
does not identify the causal effect of a student’s attributes on enrollment. Instead, the estimates
indicate how school characteristics affect the likelihood of a particular individual to enroll at the
school. If the Independence of Irrelevant Alternatives (IIA) condition is met, the estimates will be
consistent even if the decision to attend college at all is endogenous.16
In our model, the conditional logit estimates that the 8,604 students who enrolled as freshman
in Fall 1998 at any of Ohio's six non-selective, four-year public universities were much less likely to
choose a college the farther away it was from their residence with a coefficient of -.0314 (the results
are not marginal probabilities) and a Z-statistic of 65.57. In fact, over 87 percent of students at the
nonselective public, four-year colleges in Ohio lived within 100 miles when submitting their
application with a median of only 10.6 miles. Once we estimate the conditional logit determined
15 The j equations within a stratum are not independent, and a person’s gender, for example, would difference out of all the equations within one stratum since each contains data on only one individual. Therefore, unlike the multinomial regression model, non-college alternatives such as local labor market conditions cannot be included within the model since they are individual-specific. 16 Possible endogeneity in the choice set develops from the fact that colleges available to a student will depend upon the previous decision of where to apply. This application decision is based upon a student’s ranking of the colleges, and therefore, the opportunity set that a student will ultimately face is partly endogenous. However, as long as

15
solely on the basis of the distance, we save the predicted probabilities of attendance for each of the
colleges in the subsample conditional on the student attending one of the schools in the subsample.
These predicted probabilities are then used with the probability of remediation as described in the
next section.
The Probability of Remediation
While distance is used as a predictor of college choice, variation in remediation policies
across colleges is used to predict the likelihood of remediation. The first-best solution would be to
observe the placement exam scores that colleges use to assign remediation; unfortunately, we do not
have these data. However, we do have information on a substantial number of measures that help to
predict the cutoff test score. Our data reveal the number and types of high school mathematics
classes taken as well as the ACT scores of students placed in and out of remediation at each college.
We use this information to predict the probability of remediation.
Figure 1 displays the results using ACT score as a predictor of placement into remediation.
Each row corresponds to a different group of colleges. Within each row, the left-hand graph shows
the distribution of ACT scores at each of these universities. The right-hand graph shows the
likelihood functions for the ACT remediation cutoffs. To determine the likelihood functions, we
estimated the likely cutoff points using a series of probit models. For each possible ACT score, we
estimated:
Pr (Remediation) = f (a + b * I(ACT>J) + e)
where I(ACT>J) is an indicator for whether the ACT score of student i is greater than J, and J varies
over the possible range of the ACT math score (1-36). After estimating this model for each possible
cutoff point within each college, we compare the likelihood functions generated by these regressions.
The right-hand graphs show these likelihood functions over for the various subsamples in our data.17
students apply to schools that they determine to be most preferred, estimation will retain good statistical properties due to the IIA property. See Manski and Wise (1983), Luce (1959), and McFadden (1979). 17 A similar methodology is used in Kane (2003).

16
To the extent that college use the ACT score to assign remediation, these likelihood plots should
show a spike next to the most likely cutoff value used by an individual school.
The first row shows the test score distributions for selective four-year, public institutions in
Ohio. There is substantial variation across selective universities in the student populations as
evidenced by the distribution of test scores, and not surprisingly, even more heterogeneity in the
likely ACT remediation cutoffs. Since the variation in student body characteristics may be the
underlying cause of variation in remediation policies, we exclude these schools from additional
analysis. Instead, we focus our discussion on the non-selective four-year colleges shown in the
second row. The ACT distributions of non-selective four-year colleges look more homogeneous
while the remediation cutoffs in the right-hand column show much greater heterogeneity. The ACT
cutoffs vary across these institutions between 14 and 20.
To exploit the differences across each institution, we follow a two-step procedure. First, we
estimate the "Remediation Rule" for each college. We model the likelihood of taking remediation at
university Z as a probit.18 We control for each student's composite and math ACT scores as well as
race, gender, age, high school GPA, family financial background, high school math grades and
number of classes taken, the type of high school attended, postsecondary degree goal as stated when
they took the ACT exam, and similar variables for SAT score. To control for non-linearities, we
saturate the model with dummy variables for student characteristics, high school experiences, and
other explanatory variables. Students' test scores enter the model linearly. We run this model for
each university in our sample using data for students attending each institution. The probit models
generate six sets of coefficients or remediation "rules," one for each school. For each college, we
then generate a predicted probability of remediation for each student in the overall sample. In this
way, we obtain estimates of the likelihood that each student would have taken remediation at each
college.
18 We have also estimated the model using a linear probability model. We did this because we wanted to make sure that our identification strategy did not rely on the non-linearity in the model.

17
Within our sample of schools, there is substantial variation across these probabilities. To
demonstrate this, we calculated the average range of remediation probabilities for individuals in the
sample. To do so, we took each individual's maximum predicted remediation probability and
subtracted his or her minimum predicted probability within the sample of schools. We then
computed the average of these ranges across individuals. For our sample, the average range of
remediation probabilities was 39.4 percentage points with a standard deviation of 19.0. This suggests
that attending a different university would dramatically change the likelihood that an individual
student would be placed into remediation. A likelihood ratio test rejects the hypothesis that the
coefficients across colleges are the same and so institutional remediation rules do not appear to be
equal. Clearly, there is substantial variation.
This analysis, however, assumes that the ACT math score is a strong predictor of the
likelihood of remediation. Figure 2 provides further evidence that this is true. Figure 2 plots the
distribution of ACT math scores for four-year colleges in Ohio.19 In almost every case, the
distribution of ACT math scores for remedial students is well below the distribution of ACT math
scores for non-remedial students, and therefore, ACT math scores appear to do a good job predicting
the likelihood of math remediation.
One remaining concern with endogeneity relates to the role of local high schools and
communities. As discussed above, colleges may set their remediation policies in response to the skill
level of local graduates or feeder schools. If so, our empirical strategy using proximity is in fact
endogenous. Table 2 displays analyses of whether there is indeed a relationship between the
estimated ACT cutoff for remediation and the characteristics of the college and its area high schools.
However, as shown almost none of the variables are statistically significant. The characteristics of
high schools within 10 and 30 miles do not seem to influence the remediation cutoff. When limiting
the sample to the low-performing high schools whose graduates are very likely to need remediation
(specifications 3 and 4), the results do not change. Therefore, local communities do not appear to

18
influence remediation policies, and proximity remains an exogenous predictor of the likelihood of
remediation.
Building the Instrument
We combine the probabilities of attendance and of remediation to build our instrument for
remediation. From the conditional logit results, we have an estimate of the probability of attendance
at any school in the sample conditional on attending one of them. From the remediation
probabilities, we know the probability of remediation at an individual institution conditional on
attending that college. We combine these estimates to get our instrument:
Since we created the probabilities of remediation conditional on students' backgrounds, we include
these variables as covariates in our models. As a result, in our first stage regressions the instrument
picks up the portion of the remediation probability that varies according to distance and differences
in universities' remediation policies.20
Table 3 provides an example of how we constructed the instrument for an actual student.
Column 1 shows the predicted probabilities of attendance at each of the campuses that were
calculated using distance in the conditional logistic model. Column 2 uses the individual’s test
scores and background characteristics to predict the probability of taking remedial courses at each
campus. This is based on the profile of students in and out of remediation at that particular school.
Finally, column 3 is the product of those two probabilities, the probability of attending each school
weighted by the probability of remediation at that school. The instrument is constructed by summing
all the values in column 3. The final instrument suggests that the student has a 36 percent chance of
19 As part of our agreement with the OBR, we cannot identify which graph corresponds to which college. 20 Another way to view our instrument is as a correction in the probability of remediation based on distance to schools with different policies. If we were to estimate a regression of the likelihood of remediation on all covariates, we could generate predicted values for each person. If we ran similar regressions including our instrument, we
∑ ∈∈=
∈=
Jj i
i
] universityany Attends| university s]Pr[Attend university Attends|RemedPr[
] where universityany Attends|RemedPr[
Jjjj
JjjZ
19
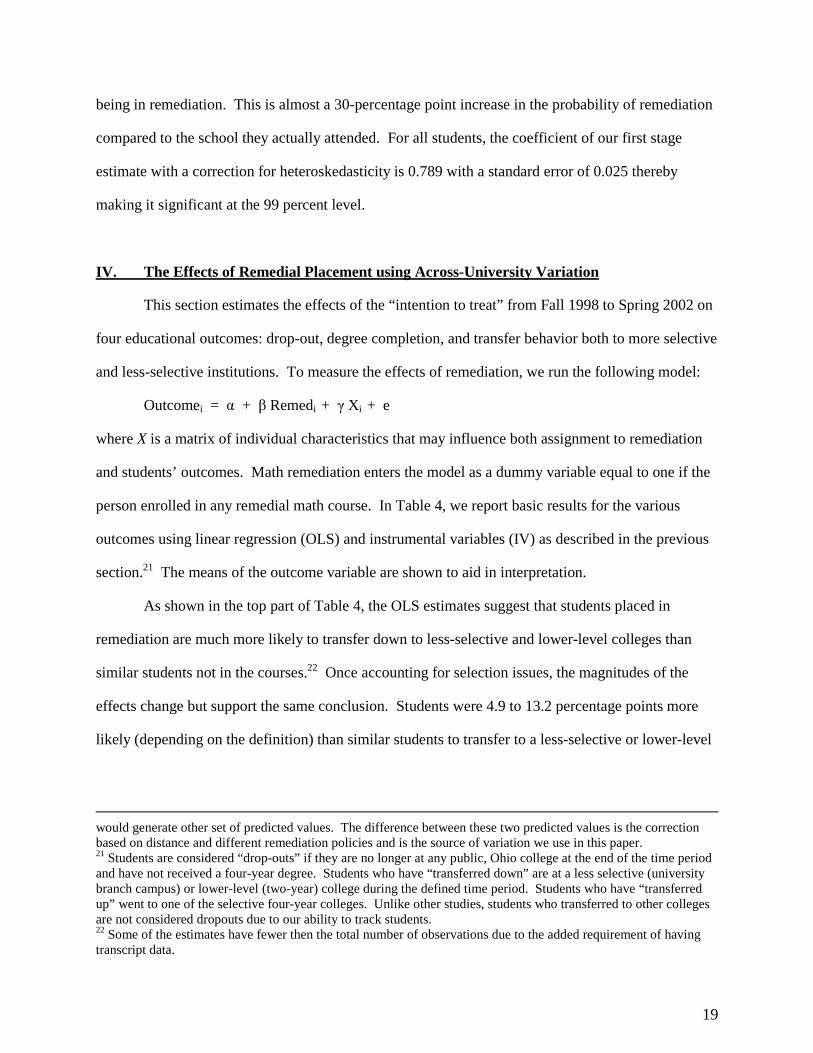
being in remediation. This is almost a 30-percentage point increase in the probability of remediation
compared to the school they actually attended. For all students, the coefficient of our first stage
estimate with a correction for heteroskedasticity is 0.789 with a standard error of 0.025 thereby
making it significant at the 99 percent level.
IV. The Effects of Remedial Placement using Across-University Variation
This section estimates the effects of the “intention to treat” from Fall 1998 to Spring 2002 on
four educational outcomes: drop-out, degree completion, and transfer behavior both to more selective
and less-selective institutions. To measure the effects of remediation, we run the following model:
Outcomei = � + � Remedi + � Xi + e
where X is a matrix of individual characteristics that may influence both assignment to remediation
and students’ outcomes. Math remediation enters the model as a dummy variable equal to one if the
person enrolled in any remedial math course. In Table 4, we report basic results for the various
outcomes using linear regression (OLS) and instrumental variables (IV) as described in the previous
section.21 The means of the outcome variable are shown to aid in interpretation.
As shown in the top part of Table 4, the OLS estimates suggest that students placed in
remediation are much more likely to transfer down to less-selective and lower-level colleges than
similar students not in the courses.22 Once accounting for selection issues, the magnitudes of the
effects change but support the same conclusion. Students were 4.9 to 13.2 percentage points more
likely (depending on the definition) than similar students to transfer to a less-selective or lower-level
would generate other set of predicted values. The difference between these two predicted values is the correction based on distance and different remediation policies and is the source of variation we use in this paper. 21 Students are considered “drop-outs” if they are no longer at any public, Ohio college at the end of the time period and have not received a four-year degree. Students who have “transferred down” are at a less selective (university branch campus) or lower-level (two-year) college during the defined time period. Students who have “transferred up” went to one of the selective four-year colleges. Unlike other studies, students who transferred to other colleges are not considered dropouts due to our ability to track students. 22 Some of the estimates have fewer then the total number of observations due to the added requirement of having transcript data.

20
college.23 Students in remediation are also found to be 7 percentage points more likely to dropout
than similar students.
The bottom part of Table 4 investigates the impact on positive educational outcomes.
Remediation is not estimated to affect the likelihood of students transferring to a selective campus.
Furthermore, although the OLS estimate suggests that remediation reduces the likelihood of
completing a four-year degree, once accounting for the selection issues, this effect disappears. It is
important to note, however, that after four years only 10.6 percent of students at the nonselective
college have completed a bachelor's degree.
In summary, remediation appears to increase the likelihood of transferring down or dropping
out for individuals. On the other hand, remediation does not appear to harm the likelihood of
students transferring to more selective institutions or completing a college degree. There are several
possible interpretations of the overall negative effect. While it may be the case that the content or
inputs of remedial courses (large class size and/or unqualified instructors) cause the estimated
negative outcomes, we discuss some alternative theories and provide evidence on these possible
explanations.
Interpreting the Results: The Sorting Hypothesis
One possible explanation for the results is that remediation highlights mistakes in the college
matching process. Students may mis-sort into colleges for several reasons. First, they may
overestimate their ability level or likelihood of succeeding at a competitive school (Avery and Kane,
2004; Rosenbaum, 2001). Therefore, students may choose a higher-level college than is appropriate
23 Interestingly, for many of the models, the OLS estimates are smaller in magnitude than the IV estimates suggesting that the selection bias may in fact be positive. There are several possible reasons for this. First, there may be compositional issues related to the size of colleges and the strength of their remediation policies that may lead OLS to be smaller than the IV estimates. For example, large colleges that unnecessarily remediate a large number of students may in part drive the OLS estimate. The difference may also be the result of IV comparisons across geographical areas. If unobserved student heterogeneity across geographical areas is larger than differences within geographical areas, then the IV estimates could be larger than OLS estimates. Finally, it may be the case that students who make it to college and are placed into remediation are more motivated than students with similar observable backgrounds (i.e. test scores) who avoid placement. In this obstacles model, the unobservable differences between the students could have biased the OLS estimates upward while the IV approach corrects this.

21
for their skill level. Furthermore, many students have imperfect information when choosing a
college; they may unknowingly attend a college that is too rigorous for them. Finally, students may
be uncertain about their likelihood of success in college. Therefore, the first year may be an
“experiment” so that the student can get more information. For all of these reasons, students may
sort into a college of the wrong selectivity or level, and remediation may serve as a signal of the
mismatch between the student and college.
The initial signal created by being placed into remediation may give a student the indication
that he or she will not succeed in subsequent coursework. This would be particularly true for
students who are unsuccessful in their remedial classes. As a result, a student's experiences with
remediation may cause him or her to transfer down or drop out of college. The patterns found in the
previous tables already provide support for this hypothesis. Students in remediation at four-year
colleges are more likely to transfer down to less selective institutions or stop-out.
In addition to sending a general signal, remediation may do a good job providing an early
signal. Placement into remediation occurs when the student initially enters a college, and he or she is
required to take any needed remedial courses during the first semesters of their college career.
Students who would have dropped out of college later in their tenure may do so earlier if they are in
remediation due to the timeliness of the signal. In essence, part of the sorting explanation is about
timing. Remediation could provide a very early signal that non-remediated students do not receive.
Hence, if remedial students dropout earlier in comparison to their non-remediated counterparts, this
is additional support that remediation affects sorting.
Table 5 examines the timing of dropout and transfer behavior to test this hypothesis. We
examine outcomes during different intervals of the four-year time span as well as the total number of
semesters and credit hours completed. In the first panel, students in remediation are found to be
much more likely to dropout during the first year rather than the other years. For example, the IV
estimates suggest that students in remediation are 5.8 percentage points more likely to dropout of
college during the first year while no statistically significant difference is found between the groups

22
during the following years. Likewise, the second panel shows that students in remediation attend
college for fewer semesters and attempt fewer credit hours than similar students not in remediation.
The last panel estimates the impact of remediation on the likelihood of transferring down
early during the college career. Overall, we find that students enrolled in remediation are more likely
to ever transfer down and attend a lower-level full-time school than similar students who are not
enrolled in remediation. When focusing on the first couple of years, we still find this effect.
Students in remediation are 1.7 percentage points more likely to transfer down to a lower-level
college and attend full-time during the freshman year. When looking at transfer behavior through the
sophomore year, the likelihood more than doubles (3.9 percentage points). In comparison to the
upper panels, it appears that the signal created by placement into remediation encourages students to
dropout much more often than transfer to a lower-level school. If this is the case, then the signal
created by remediation may be overly negative. Assuming that students make appropriate decisions
about whether to enter higher education, one might be concerned that low-ability students do not
transfer down to two-year institutions rather than dropping out of college altogether. In this case, the
efficacy (in terms of persistence and transfer rates) of using remediation as a sorting mechanism
needs to be addressed.
As shown in the last row, the effect of remediation on transfer behavior is also strong during
the later years. Therefore, while some students respond to the signal early in college and mostly
dropout, other students in remediation respond later by re-sorting into lower-level colleges. This
provides additional support for the idea that remediation provides a general signal of mismatch.
However, due to the gap in time between placement into remediation and transfer behavior during
the later years, it may also be the case that the impact of remediation is not completely explained by
the sorting hypothesis. Below we explore additional hypotheses that may explain the results.
23
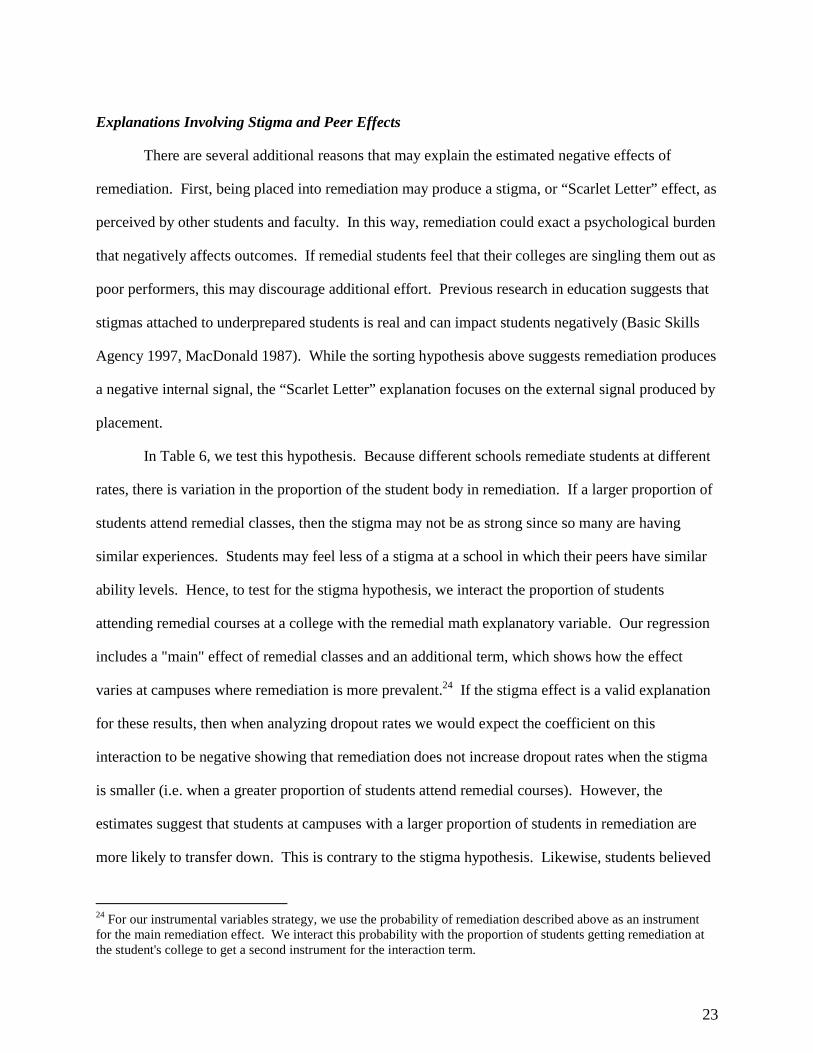
Explanations Involving Stigma and Peer Effects
There are several additional reasons that may explain the estimated negative effects of
remediation. First, being placed into remediation may produce a stigma, or “Scarlet Letter” effect, as
perceived by other students and faculty. In this way, remediation could exact a psychological burden
that negatively affects outcomes. If remedial students feel that their colleges are singling them out as
poor performers, this may discourage additional effort. Previous research in education suggests that
stigmas attached to underprepared students is real and can impact students negatively (Basic Skills
Agency 1997, MacDonald 1987). While the sorting hypothesis above suggests remediation produces
a negative internal signal, the “Scarlet Letter” explanation focuses on the external signal produced by
placement.
In Table 6, we test this hypothesis. Because different schools remediate students at different
rates, there is variation in the proportion of the student body in remediation. If a larger proportion of
students attend remedial classes, then the stigma may not be as strong since so many are having
similar experiences. Students may feel less of a stigma at a school in which their peers have similar
ability levels. Hence, to test for the stigma hypothesis, we interact the proportion of students
attending remedial courses at a college with the remedial math explanatory variable. Our regression
includes a "main" effect of remedial classes and an additional term, which shows how the effect
varies at campuses where remediation is more prevalent.24 If the stigma effect is a valid explanation
for these results, then when analyzing dropout rates we would expect the coefficient on this
interaction to be negative showing that remediation does not increase dropout rates when the stigma
is smaller (i.e. when a greater proportion of students attend remedial courses). However, the
estimates suggest that students at campuses with a larger proportion of students in remediation are
more likely to transfer down. This is contrary to the stigma hypothesis. Likewise, students believed
24 For our instrumental variables strategy, we use the probability of remediation described above as an instrument for the main remediation effect. We interact this probability with the proportion of students getting remediation at the student's college to get a second instrument for the interaction term.

24
to have less of a stigma effect are also less likely to complete a four-year degree. Therefore, we find
no evidence of the stigma hypothesis.
Another potential explanation for finding that remediation had a negative impact is peer
effects. Recent work in economics (e.g. Sacerdote, 2000; Zimmerman, 2003; Hoxby, 2000) suggests
that students whose peers are higher achievers than themselves tend to improve. For example,
Sacerdote (2000) found that having a roommate with higher standardized test scores appears to
positively effect a student's college achievement. Similar to the dorm rooms, remediation generates
the grouping of certain types of students together. By grouping lower-ability students in remedial
courses, colleges may be producing negative peer effects amongst those students. In contrast, similar
students not placed into remediation could benefit from positive peers effects by interacting with
higher-ability students in non-remedial classes.
To test this explanation, we include an interaction term between remediation and the
percentage difference between an individual's ACT score and that of other students in remediation.
If remediation exerts peer effects, the literature suggests that the farther a student's ACT score is
below the class average, the more they may benefit from other students. Conversely, if a student is a
high achiever relative to their peers, the peer effects may lower his or her achievement. In terms of
the regression models, as before we include a direct effect for remediation and the interaction term
for peer effects. If the peer effects hypothesis is correct, in our analysis of dropout rates, we would
expect that the coefficient on the interaction term is positive. The better a student is relative to their
peers, the more likely the student will experience a negative peer effect and the more likely student
will dropout. However, as shown in the right panel of Table 6, contrary to the peer effects
hypothesis, the coefficient on dropout is negative. Similarly, the estimated effect is positive on
degree completion. Remedial students whose test scores are higher than their peers appear less likely
to dropout and more likely to complete their degree. This suggests that remedial courses do not
exude negative peer effects, and students with high test scores are not "dragged down" by their peers.

25
The Role of Plan of Study: Math-types versus Non-Math-types
If the effects of remediation vary across students, this may also affect interpretation of the
results. For instance, the impact of remedial courses may differ depending on whether the student
intended to major in a math-type subject or not.25 On one hand, it may send an especially influential
signal to students intending to major in math-type courses that they will not succeed and should
change to something different or dropout altogether. On the other hand, students intending to do
math-type majors may view it as a necessary step and be especially motivated to succeed in the
courses; therefore, they may be less likely to be impacted negatively by the policy.
To test these hypotheses, we augment our models to include a dummy variable for whether
the student indicated on the ACT exam survey that they wanted to major in a math-type subject
(sciences and engineering versus humanities and social studies majors). Additionally, beyond
including the direct remediation effect, we include an interaction between the remediation effect and
this indicator for intended math-type majors. If the coefficient on this interaction is insignificant,
then remediation is estimated to have the same effect across students. However, when evaluating
dropout behavior, a positive coefficient would suggest that students intending to take math intensive
majors are more likely to withdraw from college if in remediation.
Table 7 displays the results. For the most part, students intending to major in math-type
subjects do not experience differential effects from remediation in terms of dropout and transfer
behavior. However, as show in the bottom section of the table, these students are much more likely
to complete a four-year degree. The IV estimate with campus fixed effects suggests that these
students are 12.1 percentage points more likely to do so than students in majors not connected to
math. As stated above, this may say something about how math remediation is viewed by students
for whom the subject is more or less connected to their intended majors. Additionally, the results
suggest that the purpose of math remediation should be carefully considered for students in fields
25 We include the following majors as math intensive: astronomy, biology, chemistry, geology, physics, math, statistics, computer science, engineering, and architecture.
26
focused more on verbal or written proficiencies, as remediation may serve as a negative hurdle rather
than a course providing skills necessary to excel in the labor market.
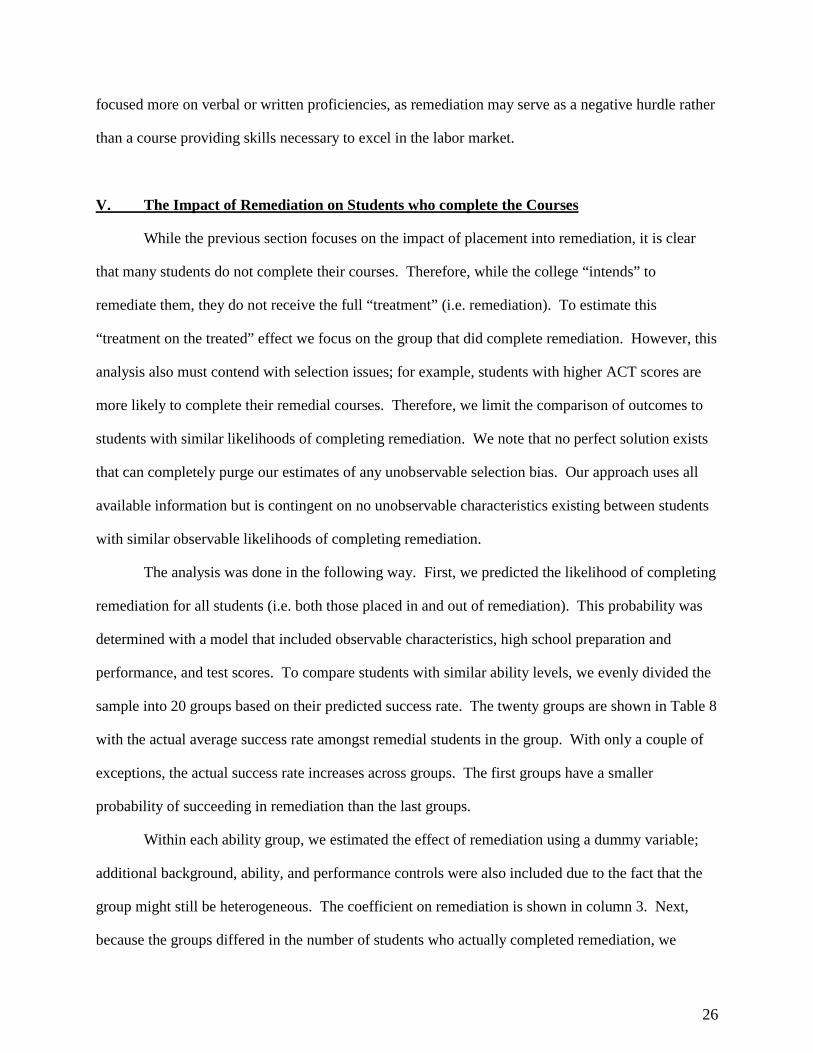
V. The Impact of Remediation on Students who complete the Courses
While the previous section focuses on the impact of placement into remediation, it is clear
that many students do not complete their courses. Therefore, while the college “intends” to
remediate them, they do not receive the full “treatment” (i.e. remediation). To estimate this
“treatment on the treated” effect we focus on the group that did complete remediation. However, this
analysis also must contend with selection issues; for example, students with higher ACT scores are
more likely to complete their remedial courses. Therefore, we limit the comparison of outcomes to
students with similar likelihoods of completing remediation. We note that no perfect solution exists
that can completely purge our estimates of any unobservable selection bias. Our approach uses all
available information but is contingent on no unobservable characteristics existing between students
with similar observable likelihoods of completing remediation.
The analysis was done in the following way. First, we predicted the likelihood of completing
remediation for all students (i.e. both those placed in and out of remediation). This probability was
determined with a model that included observable characteristics, high school preparation and
performance, and test scores. To compare students with similar ability levels, we evenly divided the
sample into 20 groups based on their predicted success rate. The twenty groups are shown in Table 8
with the actual average success rate amongst remedial students in the group. With only a couple of
exceptions, the actual success rate increases across groups. The first groups have a smaller
probability of succeeding in remediation than the last groups.
Within each ability group, we estimated the effect of remediation using a dummy variable;
additional background, ability, and performance controls were also included due to the fact that the
group might still be heterogeneous. The coefficient on remediation is shown in column 3. Next,
because the groups differed in the number of students who actually completed remediation, we

27
weighted each group by its proportion of the total successful completers. This proportion is given in
the last column. In this way, the cells with more successfully-remediated students were given more
weight in the final coefficient.
The resulting number is the estimate of the “treatment on the treated” effect based on
comparing similar students. As shown in Table 8, the estimate once controlling for selection
suggests that students are 4.4 percentage points less likely to complete a degree in four years. In
contrast, when these selection issues are not addressed, the estimated effect is a positive 1.9. The
OLS coefficient compares students who passed remediation to students who did not. The matching
estimator compares successful-completers to similar students not placed in remediation. In essence,
when one does not account for selection, the effect of remediation is biased upward.
Table 9 summarizes the results using this methodology on all of the student outcomes studied
in this paper. The biased estimates suggest that students who complete remediation are extremely
less likely to drop out of college (19.2 percentage points); however, once they are compared to
students with similar likelihoods of completing remediation, this estimate becomes positive and
statistically insignificant. When we estimate the effect of successful remediation completion on
dropout rates in the first year, we find significant effects. Remediation, at least in the first years,
appears to increase persistence among underprepared students that complete the coursework in
comparison to similar students who do not get the instruction. In terms of transfer behavior,
remediated students are slightly more likely to transfer to a lower-level school. The estimate is
positive and statistically significant within the first year adding support to the sorting hypothesis. It
is also much smaller than the intention to treat effect reported in Table 5. Finally, as shown in Table
8, remediation appears to reduce the likelihood that a student completes a degree within four-years.
This is likely due to the fact that taking remedial courses delays when a student can begin their
degree requirements, and therefore, this is more of a bureaucratic effect rather than one that is
negative.

28
VI. Conclusions and the Costs and Benefits of Remediation
In summary, using exogenous variation in remediation across institutions, we estimate that
students in remedial courses have more negative outcomes in comparison to similar students not in
remediation. Placement into math remediation appears to increase the likelihood of students
dropping out or transferring down to less-selective or lower-level colleges. In addition, remediation
is estimated to have a negative effect on degree completion within four years. While it may be the
case that the content of remedial courses actually causes these negative outcomes, we find support
for the notion that remediation serves as a re-sorting mechanism for college students. Students
placed into remediation are much more likely to dropout or transfer down during the early part of
their college careers in comparison to similar students not in the courses. In this way, remediation
may send a signal that encourages the student to re-evaluate the college decision sooner than other
underprepared students. We find no support that stigma or negative peer effects might explain the
results.
Once focusing on students who get the full “treatment” by completing their remedial courses,
we find that the impact of remediation is not entirely negative nor are the negative effects large.
To deal with the fact that the completion of remediation differs by background, we compare students
with similar likelihoods of completing remediation using a matching methodology. After accounting
for selection, students are found to be less likely to dropout suggesting a possible positive effect on
persistence. However, they take longer to complete their degrees perhaps due to the delay in being
able to take college-level courses caused by remediation. In addition, they are slightly more likely to
transfer down to less selective college adding support for the sorting hypothesis.
If the sorting hypothesis is correct, the observed negative effects of remediation may be
welfare-improving by helping students to more appropriately sort into schools. A simple "back-of-
the-envelope" calculation illustrates this. In Table 5, we find that remediation increases dropout rates
during the first year. Rather than paying for an additional year of tuition, these students will likely
enter the workforce during what would have been their second year of college. If remediation has no

29
effect other than signaling mismatch, it would be welfare improving if the savings to society (the
elimination of tuition expenditures and foregone earnings during the second year) exceeded the cost
of remediating the student plus the increase in discounted lifetime earnings that might have resulted
from an additional year of college. Remediation would be welfare-improving if:
(Discounted Earnings in Yr 2) + (Discounted Tuition Savings Yr 2)
> (Discounted Lifetime Earnings for Additional Yr) + (Cost of Remediation for all students)
To simplify the expression, assume the return to one year of college is similar to the return to
two years so that there would be no change in lifetime earnings for staying in a college an additional
year and then dropping out. This may be true given that we are comparing remediated and
nonremediated students with similar ability and that sheepskin effects may exist. Under this
assumption, to determine if remediation is welfare-improving, one must determine how large student
earnings in the second year would have to be to justify the costs of remediation net of the savings in
the second year. Table 5 shows that the “intention to remediate” increases dropout rates in the first
year by about 5.8 percentage points. Moreover, according to the OBR, the total cost of remediating a
single student is about $900 (about 10 percent of the total expenditure at Ohio four-year colleges in
1999). Finally, during the 2000-01 school year, tuition was slightly over $9,000 per student. Using a
six percent discount rate, this back of the envelope calculation would imply that an early dropout
would have to earn more than $7,448 in a year – about 19 weeks at $10 per hour – for remediation to
be cost-effective as a signaling tool. According to the census, the average wage of students age 16-
24 with one to three years of college in Ohio is slightly over $12,000 suggesting this condition would
be easily met.
Of course, this calculation of the costs and benefits of the sorting function of remediation
clearly oversimplifies the analysis. Contrary to the assumption above, the second year of college
may increase lifetime earnings. Furthermore, while the current signaling function of remediation
may be cost effective, it may better to have students transfer to a two-year college rather than

30
withdraw from college altogether. However, on the benefits side of the equation, the gains from
remediation may also be underestimated in the above calculation. As shown in Table 7, students in
remediation who intended to major in math-intensive fields had an increased likelihood of
completing a bachelor's degree within four years. Furthermore, as shown in Table 9, students who
complete remediation are less likely to dropout of college than similar, non-remediated students
suggesting that getting basic skills increases persistence. Therefore, despite the oversimplification of
the cost-benefit comparison, the observed negative effects may represent a cost-effective way to re-
sort students across schools and are likely to be less than the estimated positive effects and other
potential benefits.
From an institutional perspective, the evidence supports the notion that colleges can (and do)
use remediation to regulate entry to upper level courses and maintain their research functions. One
caveat, however, is in order. Because many students dropout of college altogether rather than
transferring to a different school, remediation's signals may have an overly negative effect. Many of
these dropouts may have benefited from transferring to a community college. Furthermore, society
would benefit from additional improvements in the college match process.
Regardless, the costs of not offering remediation and rejecting students in need of the skills
are also likely to be quite high including the expenses associated with unemployment, welfare, and
incarceration. Moreover, the increasing demands of the economy in terms of skill encourage the
nation to find an effective way to train its workers. As noted in a Time magazine article, eliminating
remediation in higher education could “effectively end the American experiment with mass
postsecondary education" (Cloud, October 15, 2002).
Finally, in terms of how it affects students with different interests, we do find one major
difference in the outcomes of students intending to major in mathematical disciplines versus those
who do not. Students for whom math remediation is likely important to their goals are much more
likely to complete a bachelor's degree in four years. Students in fields focused more on verbal or

31
written proficiencies may face potentially greater costs both monetarily and in terms of college
persistence.

32
References
ACT (2002). http://ww.act.org/research/services/crsplace/index.html. Accessed on 2 Oct 2002.
Arkansas Department of Higher Education (1998) Arkansas Academic Cost Accounting. Little Rock: Arkansas Department of Higher Education.
Avery, Chris and Thomas Kane (forthcoming 2004) “Student Perceptions of College Opportunities: The Boston COACH Program.” In Caroline Hoxby, ed. College Decisions: The New Economics of Choosing, Attending, and Completing College.
Basic Skills Agency. (1997) Staying the Course. The Relationship between Basic Skills Support, Dropout, Retention and Achievement in Further Education Colleges.
Breneman, David W. and William N. Haarlow (1997) “Remedial Education: Costs and Consequences.” Remediation in Higher Education. Washington, D.C.: Thomas B. Fordham Foundation.
Card, David (1995) "Using Geographic Variation in College Proximity to Estimate the Return to Schooling". In L.N.Christofides, E.K. Grant, and R. Swidinsky, editors, Aspects of Labor Market Behaviour: Essays in Honour of John Vanderkamp. Toronto: University of Toronto Press, 1995.
City University of New York (1999) Report I: Financial Analysis of Remedial Education at the City University of New York. New York: City of New York, Mayor’s Advisory Task Force on the City University of New York.
Coperhaven, Carol, Zoe Irvin, and Ginny Novak (1996) Howard Community College: Developmental Math Study. Columbia, MD: Howard Community College, October.
Crowe, Edward (1998) “Statewide Remedial Education Policies—State Strategies that Support Successful Student Transitions from Secondary to Postsecondary Education.” Denver: SHEEO and ACT, Inc., September.
Greene, Jay P. (2000) “The Cost of Remedial Education: How much Michigan Pays when Students fail to learn basic skills.” Mackinac: Mackinac Center for Public Policy, September.
Greene, Jay and Greg Foster (2003) “Public High School Graduation and College Readiness Rates in the United States.” Manhattan Institute, Center for Civic Information, Education Working Paper, no. 3, September.
Healy, Patrick. “CUNY Board Finds Itself Unable to Reach a Decision on Remedial Education.” The Chronicle of Higher Education 44:35 (8 May 1998): A37.
Healy, Patrick. “CUNY’s four-year Colleges Ordered to Phase Out Remedial Education.” The Chronicle of Higher Education 44:39 (5 June 1998): A26-A27.
33
Healy, Patrick and Sara Hebel. “Debate over CUNY’s Future Intensifies.” The Chronicle of Higher Education 45:40 (11 June 1999): A34.
Hebel, Sara (1999a) “N.Y. Board of Regents Approves CUNY Plan to Limit Remedial Education.” The Chronicle of Higher Education 46:15 (3 Dec. 1999): A33.
Hebel, Sara (1999b) “In CUNY Remediation Debate, the Numbers—and the Strategy—are in Dispute.” The Chronicle of Higher Education, vol. 46, no. 16, December 10, pp. A36-A37.
Higbee, Jeanne L. (1996) “Defining Developmental Education: A Commentary.” Chicago: National Association for Developmental Education.
Higbee, Jeanne L. and Patricia L. Dwinell (1997) “Do Developmental Education Programs Enhance Retention? A Commentary.” Chicago: National Association for Developmental Education.
Hoxby, Caroline (2000) “Peer Effects in the Classroom: Learning from Gender and Race Variation.” National Bureau of Economic Research Working Paper No. 7867.
Hoyt, Jeff E. and Colleen T. Sorensen (1999) “Promoting Academic Standards?: The Link between Remedial Education in College and Student Preparation in High School.” Department of Institutional Research & Management Studies, May.
Hoyt, Jeff E. (1999) “Remedial Education and Student Attrition.” Community College Review, vol. 27, no. 2.
Ignash, Jay (1997) “Who Should Provide Postsecondary Remedial/Developmental Education?” In J. Ignash, ed. Implementing Effective Policies for Remedial and Developmental Education. New Directions for Community Colleges No. 100. San Francisco: Jossey-Bass Publishers.
Kane, Thomas (2003) “A Quasi-Experimental Estimate of the Impact of Financial Aid on College-Going.” National Bureau of Economic Research Working Paper No. 9703.
Koski, William S. and Henry Levin (1998) “Replacing Remediation with Acceleration in Higher Education: Preliminary Report on Literature Review and Initial Interviews.” Washington, D.C.: National Center for Postsecondary Improvement.
Legislative Office of Education Oversight (1995) Remedial and Developmental Programs in Ohio’s Public Colleges and Universities. Columbus: Ohio General Assembly.
Lewis, Laurie, Elizabeth Farris, and Westat, Inc. (1996) Remedial Education at Higher Education Institutions in Fall 1995. Washington, D.C.: U.S. Department of Education, Office of Educational Research and Improvement.
Long, Bridget Terry (forthcoming) “Does the Format of an Aid Program Matter? The Effect of In-Kind Tuition Subsidies.” Review of Economics and Statistics.
MacDonald, Ross B. (1987) "Evaluation of an Alternative Solution for the Assessment and Retention of High-Risk College Students." Presentation at the American Educational Research Association.

34
McCabe, Robert H. (2000) No One to Waste: A Report to Public Decision-Makers and Community College Leaders. Washington, DC: Community College Press.
McCabe, Robert H. (2001) “Developmental Education: A Policy Primer.” League for Innovation in the Community College, vol. 14, no. 1, February.
Mortenson, Tom (2002) “Chance for College by Age 19 by State in 2000.” Oskaloosa, IA: Postsecondary Education OPPORTUNITY, no. 123, September.
National Center for Education Statistics (1995) Statistics in Brief: Making the Cut: Who Meets Highly Selective College Entrance Criteria? NCES Publication 95732. Washington DC: Department of Education.
National Center for Education Statistics (2000) Digest of Education Statistics. Washington DC: Department of Education.
National Center for Education Statistics (2003) Remedial Education at Degree-Granting Postsecondary Institutions in Fall 2000. Washington DC: Department of Education.
Ohio Board of Regents (2001) Ohio Colleges and Universities 2001: Profile of Student Outcomes, Experiences and Campus Measures. Columbus, O.H.: Ohio Board of Regents.
Ohio Board of Regents (2002) Making the Transition from High School to College in Ohio 2002. Columbus, O.H.: Ohio Board of Regents.
Phipps, Ronald (1998) College Remediation – What it is, What it costs, What’s at Stake. Washington, D.C.: Institute for Higher Education Policy.
Rosenbaum, James (2001) Beyond College for All. New York: Russell Sage Foundation.
Rouse, Cecilia (1995) "Democratization or Diversion? The Effect of Community Colleges on Educational Achievement." Journal of Business and Economic Statistics, vol. 13, no. 2, April, pp. 217-24.
Sacerdote, Bruce (2000) “Peer Effects with Random Assignment: Results for Dartmouth Roommates.” National Bureau of Economic Research Working Paper No. 7469.
Schmidt, Peter (1998) “A Clash of Values at CUNY over Remedial Education.” The Chronicle of Higher Education, vol. 44, no.28, March 20, pp. A33-A34.
Secondary and Higher Education Remediation Advisory Commission (1997) A Total Approach: Improving College Preparation in Ohio. Columbus: Ohio Board of Regents, June.
Sheehan, Robert (2002). Personal Communication, 18 Sep 2002.
Soliday, Mary (2002) The Politics of Remediation. Pittsburgh: The University of Pittsburgh Press.
Sternberg, Ruth E. and Alice Thomas (2002) “Ohio’s Remedial College Courses costs Millions.” The Columbus Dispatch, August 12, pg. 01A.

35
Trounson, Rebecca (2002) “Cal State Ouster Rate Rises Slightly.” The Los Angeles Times, Jan 31.
Weissman, Julie, Carol Rulakowski, and Marci Jumisko (1997) “Using Research to Evaluate Developmental Education Programs and Policies.” In Juan M. Ignash, ed. Implementing Effective Policies for Remedial and Developmental Education. New Directions for Community Colleges No. 100. San Francisco: Jossey-Bass Publishers.
Wheat, I. David (1998) "Deficient Diplomas: Is it time for a Graduate Warranty Program?" Working Paper Thomas Jefferson Institute for Public Policy.
Zimmerman, David (2003) “Peer Effects in Academic Outcomes: Evidence from a Natural Experiment.” Review of Economics & Statistics, 85 (1): pp. 9-23.
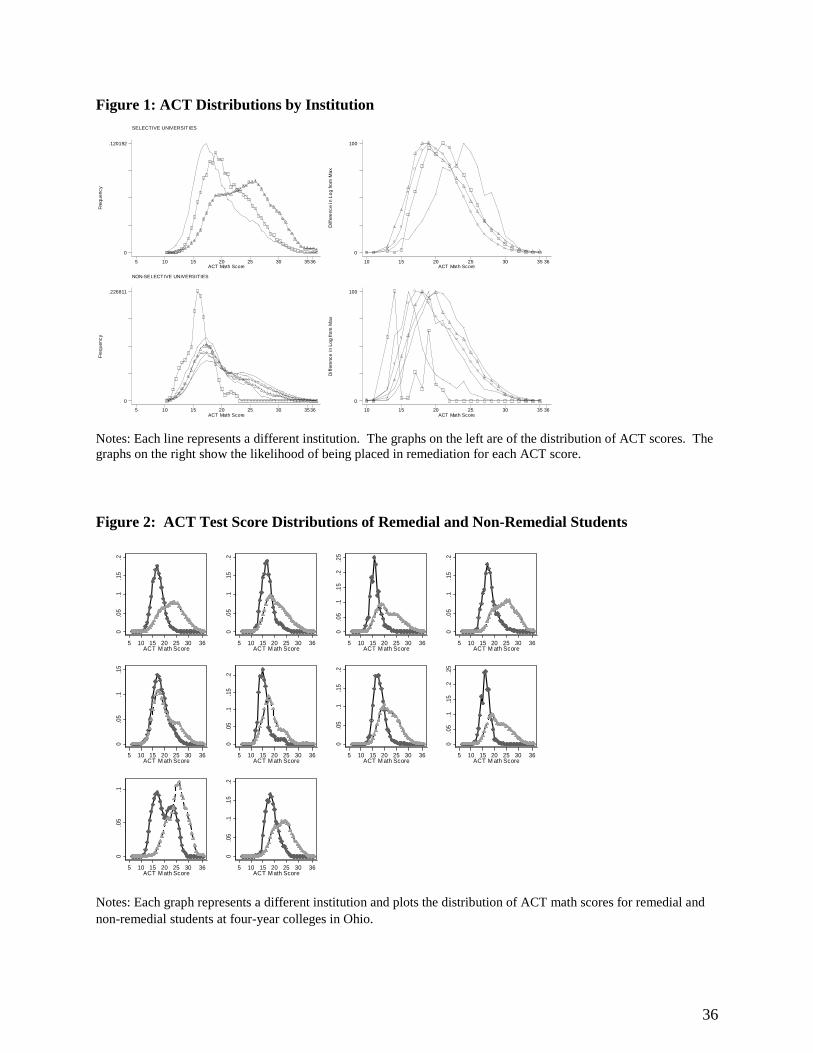
36
Figure 1: ACT Distributions by Institution
SELECTIVE UNIVERSITIES
Fre
qu
enc
y
ACT Math Score5 10 15 20 25 30 3536
0
.120192
Diff
ere
nce
in L
og
from
Ma
x
ACT Math Score10 15 20 25 30 35 36
0
100
NON-SELECTIVE UNIVERSITIES
Fre
que
nc
y
ACT Math Score5 10 15 20 25 30 3536
0
.226811
Dif
fere
nce
in
Log
fro
m M
ax
ACT Math Score10 15 20 25 30 35 36
0
100
Notes: Each line represents a different institution. The graphs on the left are of the distribution of ACT scores. The graphs on the right show the likelihood of being placed in remediation for each ACT score. Figure 2: ACT Test Score Distributions of Remedial and Non-Remedial Students
0.0
5.1
.15
.2
5 10 15 20 25 30 36ACT M ath Score
0.0
5.1
.15
.2
5 10 15 20 25 30 36ACT M ath Score
0.0
5.1
.15
.2.2
5
5 10 15 20 25 30 36ACT M ath Score
0.0
5.1
.15
.2
5 10 15 20 25 30 36ACT M ath Score
0.0
5.1
.15
5 10 15 20 25 30 36ACT M ath Score
0.0
5.1
.15
.2
5 10 15 20 25 30 36ACT M ath Score
0.0
5.1
.15
.2
5 10 15 20 25 30 36ACT M ath Score
0.0
5.1
.15
.2.2
5
5 10 15 20 25 30 36ACT M ath Score
0.0
5.1
5 10 15 20 25 30 36ACT M ath Score
0.0
5.1
.15
.2
5 10 15 20 25 30 36ACT M ath Score
Notes: Each graph represents a different institution and plots the distribution of ACT math scores for remedial and non-remedial students at four-year colleges in Ohio.

37
Table 1: First-time, Full-time Students in Ohio Public, Four-Year Colleges, Fall 1998
Selective
Four-year Colleges
Non-selective Four-year Colleges
Full
Sample
Full Sample
Not in Remediation
In Remediation
In Remedial Math 0.115 0.275 0.00 1.00
Age in 1998 18.36
(0.508)
18.49 (0.62)
18.48 (0.611)
18.53 (0.63)
Female 0.549 0.526 0.500 0.596
Black 0.063 0.156 0.113 0.269
Hispanic 0.019 0.018 0.015 0.028
Asian 0.025 0.016 0.018 0.010
Ohio Resident 0.849 0.943 0.938 0.957
Took ACT 0.793 0.808 0.829 0.754
ACT Math Score (36 maximum)
23.00 (4.58)
[13,862]
20.44 (4.71)
[6,956]
21.76 (4.61)
[5,172]
16.61 (2.29)
[1,784]
ACT Overall Score (36 maximum)
23.15 (3.99)
[13,862]
20.64 (4.29)
[6,956]
21.74 (4.16)
[5,172]
17.47 (2.84)
[1,784]
Average HS Math GPA
3.22
(0.67) [13,363]
2.88 (0.81)
[6,518]
3.06 (0.75)
[4,902]
2.34 (0.76)
[1,616]
No. of Semesters of Math in HS
7.59
(0.93) [13,331]
7.28 (1.20)
[6,637]
7.44 (1.09)
[4,948]
6.81 (1.39)
[1,689]
College GPA 2.83
(0.78) [17,336]
2.40 (1.01)
[8,395]
2.55 (0.973) [6,125]
1.99 (0.98)
[2,770] Total Credit Hours (Fall98 – Spring02)
117.10 (60.43)
76.60 (56.75)
85.36 (57.91)
53.51 (46.22)
Dropped Out before Spring 2002
.2214 .4117 .3756 .5067
Transferred Down as of last enrollment
.0656 .1048 .0935 .1348
Transferred Up as of Spring 2002
-- .0274 .0284 .0249
Completed a Four-year degree
.3050 .1063 .1361 .0279
Observations 17,490 8,604 6,238 2,366
Notes: Standard deviations are shown in the parentheses. The number of observations for variables with less than the total observations is shown in brackets. Sample is restricted to traditional-aged (18-20), first-time students who entered and attended full-time in Fall 1998. They must have also had valid zip code information on their applications. Students are considered to have "Dropped Out" if they are nowhere in the Ohio public higher education system in Spring 2002. “Transfer Up” is defined for nonselective, four-year colleges as a transfer to a selective university. "Transfer Down" denotes the student moved to a less-selective or lower-level (two-year) college.

38
Table 2: Local High School and Community Characteristics and College Remediation Cutoffs Dependent Variable: Percentile of the Estimated ACT Cutoff for Remediation (OLS estimates)
All Nearby High Schools Nearby HS with fewer than 50%
Pass 12th Grade Math Exam Radius of Sample 10 Miles 30 Miles 10 Miles 30 Miles (1) (2) (3) (4) University Characteristics
University Branch 3.01
(10.45) -3.55 (9.91)
-6.86 (12.61)
-1.03 (9.19)
State Community College
7.55 (10.47)
8.28 (10.95)
7.04 (12.86)
12.37 (10.00)
Local Community College
8.42 (11.66)
6.52 (12.34)
4.67 (14.98)
6.65 (11.55)
Technical College 2.67
(10.81) -2.60
(12.40) 1.94
(14.15) 1.61
(11.45)
Selective Admissions 13.89
(11.10) 18.21* (10.24)
21.36 (12.54)
19.24* (9.69)
Degree of Urbanization -0.88 (2.60)
-1.15 (2.50)
-0.30 (3.13)
-0.73 (2.52)
College Percent African-American
0.65 (1.32)
1.03 (0.90)
1.47 (1.39)
1.21 (0.85)
College Percent Hispanic
-7.25 (5.69)
-1.00 (3.68)
-3.51 (6.30)
-1.95 (3.62)
Local High School and District Characteristics Percent Free Lunch at the HS
-19.52 (90.69)
29.50 (216.2)
-16.06 (87.43)
225.11 (169.31)
1995 Median District Income (000s)
1.04 (2.32)
0.20 (3.48)
2.67 (2.84)
4.04 (3.53)
HS Percent African-American
20.85 (79.96)
-14.27 (138.9)
-7.77 (55.38)
-18.42 (77.66)
HS Percent Hispanic 492.0
(338.3) 154.8
(331.6) 231.9
(334.7) -117.5 (206.6)
Mean HS Math Pass percentage
0.52 (0.93)
0.52 (1.10)
-0.44 (1.28)
-0.31 (1.61)
HS Dropout Rate (3-year average)
-0.21 (0.84)
-0.91 (1.44)
-0.37 (0.73)
-1.99 (1.36)
HS 1997 Instructional Expend/Stud (000s)
-8.35 (9.64)
-3.41 (19.93)
0.37 (10.80)
-14.32 (19.64)
Number of Local HS 1.82
(1.97) -0.87 (0.73)
0.37 (2.93)
-2.31 (1.70)
Number of Local HS Students (000s)
-19.52 (90.69)
29.50 (216.2)
-16.06 (87.43)
225.11 (169.31)
Observations 42 42 38 42 R-squared 0.4201 0.3221 0.3191 0.4025 ** Significant at the 5% level * Significant at the 10% level Sample: Public and private high schools and school districts within 10 or 30 miles of a public Ohio college. Notes: Standard errors shown in parentheses. Variable means are weighted by the enrollment of the school or district. The percentile is the 1999 percentile among ACT test-takers nationally. The results do not change in statistical significance if the act cutoff score or the natural log of the score is used.

39
Table 3. Example of the Construction of the Instrument using a Sample Student Predicted Probability of
Enrollment given Distance
Predicted Probability of Remediation if Student Had
Attended Column 1 * Column 2 University Campuses
(1) (2) (3)
A .333 .256 0.07040
B (Actually Attended) .258 .067 0.01554
C .001 .672 0.00067
D .002 .001 0.00000
E .399 .554 0.26703
F .008 .178 0.00142
Instrument = Weighted Average of Remediation Probabilities = Sum of Column 3 0.35507 Tables 4: Estimates of Effect of Math Remediation on Educational Outcomes
Coefficient on Remediation Variable Dependent Variable
Dependent Variable
Mean
OLS IV
A. Negative Educational Outcomes Dropped Out by Spring 2002 (four years later)
N=8,604 .4117
.0084 (.0129)
.0742* (.0398)
Transferred Down as of Last enrollment record
N=8,405 .1597
.0856** (.0101)
.0738** (.0284)
At a Lower College as of Spring 2002
N=8,405 .0686
.0297** (.0070)
.0490** (.0198)
Transferred Down and attended lower-college Full-Time
N=7,903 .0900
.0708** (.0082)
.1319** (.0244)
B. Positive Educational Outcomes Transferred Up as of Last enrollment record
N= 8,353 .0357
.0088* (.0051)
-.0107 (.0145)
At a Higher-Ranked College as of Spring 2002
N= 8,353 .0283
.0072 (.0046)
-.0048 (.0130)
Completed a Four-year Degree N= 8,604 .1063
-.0480** (.0080)
-.0168 (.0227)
** Significant at the 5% level * Significant at the 10% level Notes: Standard errors are shown in the parentheses. Sample is restricted to Ohio traditional-aged (18-20), degree-seeking first-time students in Fall 1998 who had valid zip code information on their applications. Students are considered “dropouts” if they are no longer at any public, Ohio college at the end of the time period and have not received a four-year degree. Students who have “transferred down” went to a less selective (university branch campus) or lower-level (two-year) college during the defined time period. Students who have “transferred up” went to one of the selective four-year colleges.

40
Table 5: The Sorting Hypothesis Coefficient on Remediation Variable
Dependent Variable Dependent Variable
Mean
OLS IV
A. Timing of Dropout Behavior (N= 8,099)
Dropped Out during 1st Year .1393 -.0243** (.0096)
.0579** (.0289)
Dropped Out after 1st Year .2608 .0440** (.0123)
.0163
(.0368)
Dropped Out anytime during four years
.4000 .0197
(.0133)
.0742* (.0398)
B. Persistence (N= 8,099)
Total Semesters Attended 10.21 (5.06)
-.1146 (.1350)
-1.620** (.4078)
Total Credits Attempted 84.48
(41.39)
-2.657** (1.078)
-13.730**
(3.254)
C. Timing of Full-Time Transfer Down Behavior (N= 7,903)
Transferred Down during freshman year
.0099 .0115** (.0029)
.0166** (.0085)
Transferred Down by sophomore year
.0356 .0311** (.0053)
.0388** (.0158)
Transferred Down in sophomore year or later
.0544 .0396** (.0065)
.0931** (.0195)
** Significant at the 5% level * Significant at the 10% level Notes: Standard errors are shown in the parentheses. Sample is restricted to Ohio traditional-aged (18-20), degree-seeking first-time students in Fall 1998 who had valid zip code information on their applications. Students are considered “dropouts” if they are no longer at any public, Ohio college at the end of the time period and have not received a four-year degree. Students who have transferred down went full-time to a less selective (university branch campus) or lower-level (two-year) college during the defined time period.

41
Table 6: The Stigma and Peer Effects Hypotheses
Percent in Remediation (Stigma Hypothesis)
Peer ACT Scores (Peer Effects Hypothesis)
Coefficient on Remediation
(Remediation) * (Pct Remed.)
Coefficient on Remediation
(Remediation) * (Pct Diff in ACT)
A. Negative Educational Outcomes Dropped Out by Spring 2002 (four years later)
N=8,604
-.2489 (.1813)
1.045** (.5768)
-.1861** (.0581)
-1.011** (.1418)
Transferred Down as of Last enrollment record
N=8,405
-.1208 (.1427)
.7349 (.4541)
.0558
(.0408) -.1517 (.0977)
At a Lower College as of Spring 2002
N=8,405
-.1872* (.0996)
.8094** (.3170)
.0517** (.0285)
-.0564 (.0681)
Ever Transferred Down Full-Time
N=7,903
-.0180 (.1396)
.3999 (.4359)
.1548** (.0601)
-.0065 (.1427)
B. Positive Educational Outcomes Transferred Up as of Last enrollment record
N= 8,353
-.0146 (.0730)
-.1315 (.2323)
-.0207 (.0208)
-.0150 (.0501)
At a Higher-Ranked College as of Spring 2002
N= 8,353
-.0074 (.0652)
-.0278 (.2073)
-.0182 (.0187)
-.0545 (.0449)
Completed a Four-year Degree
N= 8,604
-.0198 (.1129)
-.0770** (.3594)
.0037
(.0331) .1660** (.0807)
** Significant at the 5% level * Significant at the 10% level Notes: Standard errors are shown in the parentheses. Sample is restricted to Ohio traditional-aged (18-20), degree-seeking first-time students in Fall 1998 who had valid zip code information on their applications. Students are considered “dropouts” if they are no longer at any public, Ohio college at the end of the time period and have not received a four-year degree. Students who have “transferred down” went to a less selective (university branch campus) or lower-level (two-year) college during the defined time period. Students who have “transferred up” went to one of the selective four-year colleges.

42
Table 7: The Effects of Remediation by Plan of Study
Controlling for Math-Type Pre-College Major
Coefficient on Remediation
(Remediation) * (Math-type Major)
A. Negative Educational Outcomes
Dropped Out by Spring 2002 (four years later)
N=8,604
-.0127 (.0379)
.0054 (.0468)
Transferred Down as of Last enrollment record
N=8,405
.0800** (.0294)
-.0302 (.0365)
At a Lower College as of Spring 2002
N=8,405
.0485** (.0206)
.0039 (.0255)
Ever Transferred Down Full-Time
N=7,903
.1372** (.0253)
-.0289 (.0286)
B. Positive Educational Outcomes
Transferred Up as of Last enrollment record
N= 8,353
-.0112 (.0151)
.0028 (.0187)
At a Higher-Ranked College as of Spring 2002
N= 8,353
-.0053 (.0135)
.0027 (.0167)
Completed a Four-year Degree
N= 8,604
-.0397* (.0235)
.1213** (.0297)
** Significant at the 5% level * Significant at the 10% level Notes: Standard errors are shown in the parentheses. Sample is restricted to Ohio traditional-aged (18-20), degree-seeking first-time students in Fall 1998 who had valid zip code information on their applications. Students are considered “dropouts” if they are no longer at any public, Ohio college at the end of the time period and have not received a four-year degree. Students who have “transferred down” went to a less selective (university branch campus) or lower-level (two-year) college during the defined time period. Students who have “transferred up” went to one of the selective four-year colleges.

43
Table 8: Estimating the Treatment on the Treated Dependent Variable: Degree Completion within four years
Mean Actual Success Rate
Remediation Coefficient
Standard Error
T-stat Weight
Simple OLS Estimate (biased due to selection in who completes remediation) Estimate --- .0186 .0091 2.0443 ---
Estimate based on Comparisons of Students with Similar Predicted Success Rates Group 1 .2788 -.0227 .0375 -.6067 .0367 2 .2619 -.0240 .0507 -.4727 .0320 3 .2589 -.0832 .0317 -2.6228 .0573 4 .3758 -.0779 .0310 -2.5132 .0693 5 .4031 -.1378 .0439 -3.1366 .0467 6 .4602 -.0118 .0407 -.2890 .0587 7 .5377 -.0613 .0425 -1.4403 .0600 8 .6244 -.0598 .0451 -1.3268 .0647 9 .6064 -.0608 .0397 -1.5317 .0653 10 .6928 .0521 .0405 1.2859 .0653 11 .6905 -.0332 .0285 -1.1662 .0733 12 .7580 -.0750 .0439 -1.7102 .0707 13 .7686 -.0818 .0433 -1.8886 .0540 14 .8043 -.0358 .0416 -.8618 .0540 15 .8151 .0070 .0477 .1464 .0567 16 .8726 -.0813 .0553 -1.4706 .0367 17 .9412 -.0190 .0420 -.4515 .0433 18 .9796 .0109 .0707 .1542 .0320 19 .9655 .0310 .1048 .2953 .0187 20 1.0000 -.1061 .1981 -.5358 .0047
Revised Estimate .5663 -.0441 .0100 -4.4035 1.00

44
Table 9: The Impact of Remediation on Successful Completers
Simple OLS Estimate
(Biased) Revised Estimate within
Ability Groups
A. Negative Educational Outcomes Dropped Out during first year
N=7,903
-.1511** (.0190)
-.0274** (.0122)
Dropped Out by Spring 2002 (four years later)
N=8,604
-.1924** (.0250)
.0240 (.0158)
Transferred Down by end of Freshman year
N=7,903
-.0156 (.0125)
.0214** (.0067)
Transferred Down by end of Sophomore year
N=7,903
-.0224 (.0158)
.0320** (.0090)
Transferred Down as of Last enrollment Record
N=8,405
-.0887** (.0021)
.0871** (.0129)
At a Lower College as of Spring 2002
N=8,405
-.0196 (.0152)
.0234** (.0088)
Ever Transferred Down Full-Time
N=7,903
-.0312* (.0188)
.0492** (.0106)
B. Positive Educational Outcomes Transferred Up as of Last enrollment record
N= 8,353
.0090 (.0096)
.0076 (.0066)
At a Higher-Ranked College as of Spring 2002
N= 8,353
.0076 (.0084)
.0042 (.0059)
Completed a Four-year Degree
N= 8,604
.0186** (.0091)
-.0441** (.0100)
** Significant at the 5% level * Significant at the 10% level Notes: Standard errors are shown in the parentheses. Sample is restricted to Ohio traditional-aged (18-20), degree-seeking first-time students in Fall 1998 who had valid zip code information on their applications. Students are considered “dropouts” if they are no longer at any public, Ohio college at the end of the time period and have not received a four-year degree. Students who have “transferred down” went to a less selective (university branch campus) or lower-level (two-year) college during the defined time period. Students who have “transferred up” went to one of the selective four-year colleges.