
NBER WORKING PAPER SERIES PRODUCT QUALITY AND … · Dixit-Stiglitz models are useful for...
38
NBER WORKING PAPER SERIES PRODUCT QUALITY AND MARKET SIZE Steven Berry Joel Waldfogel Working Paper 9675 http://www.nber.org/papers/w9675 NATIONAL BUREAU OF ECONOMIC RESEARCH 1050 Massachusetts Avenue Cambridge, MA 02138 May 2003 We thank seminar participants at Carnegie Mellon, MIT, the NBER, Virginia and Yale for useful comments. The views expressed herein are those of the authors and not necessarily those of the National Bureau of Economic Research. ©2003 by Steven Berry and Joel Waldfogel. All rights reserved. Short sections of text not to exceed two paragraphs, may be quoted without explicit permission provided that full credit including ©notice, is given to the source.
Transcript of NBER WORKING PAPER SERIES PRODUCT QUALITY AND … · Dixit-Stiglitz models are useful for...

NBER WORKING PAPER SERIES
PRODUCT QUALITY AND MARKET SIZE
Steven BerryJoel Waldfogel
Working Paper 9675http://www.nber.org/papers/w9675
NATIONAL BUREAU OF ECONOMIC RESEARCH1050 Massachusetts Avenue
Cambridge, MA 02138May 2003
We thank seminar participants at Carnegie Mellon, MIT, the NBER, Virginia and Yale for useful comments.The views expressed herein are those of the authors and not necessarily those of the National Bureau ofEconomic Research.
©2003 by Steven Berry and Joel Waldfogel. All rights reserved. Short sections of text not to exceed twoparagraphs, may be quoted without explicit permission provided that full credit including ©notice, is givento the source.

Product Quality and Market SizeSteven Berry and Joel WaldfogelNBER Working Paper No. 9675May 2003JEL No. L1, R3, L8
ABSTRACT
Recent literature notes that when quality is produced with fixed costs, a high quality firm can
undercut its rival's prices and may find it profitable to invest more in quality as market size grows
large. As a result, a market can remain concentrated even as it grows large. When quality is
produced with variable costs, by contrast, a wide range of product qualities can coexist in the market
because they are offered at different prices. Larger markets will fragment and offer products with
a wider range of qualities. Using US urban areas as markets, we examine the relationships between
market size and product quality - and between market size and product concentration - for two
industries that differ in their quality production process. We document that in the restaurants
industry, where quality is produced largely with variable costs, the range of qualities on offer
increases in market size, with each product maintaining a small market share. In daily newspapers,
where quality is produced with fixed costs, the average quality of products increases with market
size, and the market does not fragment as it grows large.
Steven Berry Joel WaldfogelDepartment of Economics Public Policy and Management Yale University University of Pennsylvania, Wharton SchoolBox 208264 3100 Steinberg-Dietrich Hall37 Hillhouse Avenue Philadelphia, PA 19104-6372New Haven, CT 06520-8264 and NBERand NBER [email protected]@yale.edu

1 Introduction
Is it true, as casual empiricism suggests, that larger markets offer not only morebut better products? Urban economists traditionally understand cities to balancenegative externalities of congestion against the positive effects of agglomerationon productivity and consumers (Henderson, 1969). It is commonly assumed thatthat agglomeration promotes product variety.1 Here we explore a related but dis-tinct effect on consumers, the effect of agglomeration (or city size) on productquality. This question is interesting in itself and also because high quality prod-ucts may provide a source of attraction to productive residents (Jacobs (1961),Glaeser, Kolko, and Saez (2001).)
Recent theoretical developments in industrial organization provide an invalu-able framework for thinking about the relationship between product quality andmarket size. In a series of important books and articles, Shaked and Sutton (e.g.Shaked and Sutton (1987) and Sutton (1991)) have sought to explain the circum-stances in which markets remain concentrated as they grow large. In particular,Shaked and Sutton show that , then as markets grow large in industries wherequality is produced mainly through outlays on fixed costs, at least one firm willhave an incentive to invest in quality. Because quality is produced with fixedrather than marginal costs, a higher quality firm can undercut its rivals’ prices andattain substantial market share. As a result, product quality in some industrieswill increase in market size, even as product variety need not increase (becausemarkets remain concentrated at the product level.) Just as the Dixit and Stiglitz(1977) model of monopolistic competition has been useful for understanding ben-efits of product variety in economic geography, application of Sutton (1991) canhelp guide insight into the relationship between product quality and market size.
While the outcome of the relationship between product quality and market sizeis of interest to urban economists, the process of quality competition is also of in-terest to industrial organization economists for what it reveals about how marketsfunction when firms compete in quality (i.e. via vertical differentiation.) The re-lationship between product quality and market size may also be of interest as apurely descriptive matter, adding to previous studies that look at the relationshipbetween market size and the number and size of establishments. In this paperwe will examine descriptive data on the relationship between product quality andmarket size, where the observations are a cross-section of U.S. metropolitan areas.
1For some theory, see Krugman (1991) and Fujita, Krugman, and Venables (1999); for somerecent empirical work see Holmes (2002) and Campbell and Hopenhayn (2002).
1

2 Background on Cities and Product Differentiation
In the revival of spatial economics following on the suggestions of Krugman(1991), it is traditional to emphasize three reasons for the creation of cities. First,there may be locally abundant factors that attract production; these could be partlyexogenous (ports) or else partly resulting from other endogenous factors (abun-dant high-quality labor.) Second, there may be direct production externalities, asin knowledge spillovers. Finally, there may be indirect, market-mediated exter-nalities, as in those modeled by Krugman that come from the interaction of fixedcosts, imperfect competition and transportation costs. For example, if fixed costsdictate one production location, then minimizing transportation costs suggests lo-cating near the largest aggregation of consumers.
Krugman employs a Dixit-Stiglitz model with economies of scale via exoge-nous fixed costs and symmetric, horizontally differentiated products demanded bya representative consumer. This set-up allows for a welfare benefit to consumersin larger cities, which comes only from additional symmetrically differentiatedproducts.
Dixit-Stiglitz models are useful for presenting a simple equilibrium analysisof optimal city sizes or a simple welfare analysis of optimal numbers of products.However, Dixit-Stiglitz models are not used much in the empirical study of actualindustries because of their very restrictive assumptions. The product space of anactual industry is rarely symmetric, and it is typically not helpful to think of de-mand as being generated by a representative consumer, as much of the rationalefor differentiated products comes from the heterogeneous tastes of consumers.Further, Dixit-Stiglitz models abstract from questions of product quality, as op-posed to product variety. In the Dixit-Stiglitz framework, a larger city can havemore products, but not fundamentally different products.
When the demand for different products comes from heterogeneous consumers,firms face the choice of not just whether to enter with a symmetric product, butthey also face the choice of where to locate in vertical and/or horizontal productspace. Larger markets may support better products, not just more products. Thisreinforces a view that cities may be driven by consumption externalities (Glaeser,Kolko, and Saez (2001)) and not just the more commonly-cited production exter-nalities.
Our current paper might be thought of as part of a larger research agenda whichfollows on Krugman’s introduction of models of product differentiation and fixedcosts into trade and urban economies, but looks to introduce richer and more morerealistic forms of differentiation and competition. Here, we specifically want to
2

introduce models of endogenous product quality, where product quality is poten-tially produced via an increase in fixed costs.
Our paper builds, and in some ways, improves upon some existing empiri-cal research on product quality and market size. First, although the theoreticalrelationship between product quality and market size has been well explicated,it has been difficult to document empirically in a fully satisfactory way. Sut-ton (1991), for example, uses cross-country case studies to document that manyconsumer goods industries remain concentrated in large markets. While highlysuggestive, cross-country comparisons suffer from the problem that much morethan market size is changing (and indeed Sutton’s case studies emphasize this, butthe problem is complicated enough to perhaps defy traditional econometric anal-ysis.) For empirical work, cross-city comparisons within a single country may beeasier to interpret. Ellickson (2001) does consider markets of varying size withinthe United States (his markets are supermarket distribution regions, not cities.)Ellickson’s focus, following Sutton’s theory, is on concentration market structure.We will add a focus on direct measures of product quality and we will juxtaposetwo contrasting industries.
Our paper also contributes to the literature that documents the relationshipbetween market size, entry and product variety; e.g. Bresnahan and Reiss (1991),Berry and Waldfogel (1999) and Campbell and Hopenhayn (2002).
3 Review of the Theory of Product Quality
There is a well-developed literature in IO on product quality in market equilibriumthat we can draw on to motivate the empirical illustrations in this paper. We infor-mally review and illustrate that theory here; these arguments are also summarizedin a slightly different fashion in Sutton (1991) and related works.
To address the issues in this paper, we begin with a simple vertical qualitymodel. Suppose that the utility to consumeri of productj is
uij = θiδj − pj, (1)
whereδj is product quality andpj is price. Note that we have assumed awayincome effects, and utility is measured in dollars, so thatθi is the consumer’swillingness-to-pay for quality. We assume thatθi is distributed on the interval(0,∞) so that there are some consumers with arbitrary highθ’s who will pay foran increase in quality to any level. We also assume that there is a “outside” good
3

of quality zero, available at a price of zero (which is the marginal cost of a zeroquality good.)
Turning to the cost side, Shaked and Sutton emphasize that increases in qualitycan involve increases in fixed and/or marginal cost. The relationship betweenmarket size and the distribution of quality depends on whether quality is producedprimarily through fixed or variable (with respect to output) costs. In particular,if marginal cost increases only slowly in quality (so that the cost of quality isborne largely by fixed cost), then high quality products can use price to undercutlower quality products, potentially driving them out of the market and leading toa situation where there are a limited set of product qualities on offer, including atleast one high quality good.
Assume for simplicity that marginal cost,mc, is constant in quantity (qj) andis (weakly) increasing in quality, so that variable cost is
C(qj, δj) = qjmc(δj). (2)
Fixed costs also depend on quality:
FC = F (δj), (3)
but by definition do not depend onqj. We assume that fixed costs are strictlypositive (so there are always economies of scale) and that fixed costs are weaklyincreasing in quality.
Let market size beM and assume some model of price-competition (as inNash pricing for single-product firms), so that a quality vectorδ leads to some per-capita variable profit functionV (δj, δ−j). Assuming single-product firms, firmj’sprofit function is then
MV (δj, δ−j)− F (δj) (4)
Product Proliferation when Quality increases MC
In discussing the possible proliferation of products, one crucial point is the possi-bility that a high quality product could undercut a lower quality product and driveits sales to zero. If marginal cost is convex in quality (as opposed to utility whichis assumed linear in quality), then such undercutting is not profitable when thelower-quality firm is pricing very near marginal cost. In very large markets, evenprices near marginal cost can generate enough variable profit to cover fixed costsand so this allows products of many quality levels to survive in equilibrium.
4

Given marginal costs that are increasing and convex in quality, the appendixreviews the formal argument that the space of product qualities will fill in and themaximum quality offered in the market will increase as market size increases. Theintuition is that the vertical model with increasing convex marginal costs is verymuch like a horizontal model. Given marginal cost pricing, different consumersprefer different goods. Assuming marginal cost pricing, the utility function be-comes:
uij = θiδj −mc(δj) (5)
and the first-order condition for consumeri’s optimal quality is
θi −∂mc
∂δj
= 0 (6)
with second-order condition∂2mc
∂δ2j
> 0. (7)
The second-order condition is satisfied if marginal cost is convex in quality and itis easy to state regularity conditions under which there is a unique solution to thefirst-order condition for everyθ, with higherθ’s demanding higher qualities.
In considering different real world markets, it will not be obvious whethermarginal cost is convex in some abstract measure of quality. However, the keyempirical idea is that marginal cost rises sufficiently fast in quality so that higher-quality firms cannot undercut low quality firms in price. In this case, we expectthat as market size increases, products will proliferate so that every segment ofthe quality line will eventually be offered by some product. In particular, largermarkets can support more high-quality goods and (if the support ofθ is unboundedat the top) there is a upper bound on the maximum quality level that increases inmarket size.
The product proliferation result also guarantees that product-concentrationwill go to zero as market size increases. Sutton (1991) emphasizes that firm-levelconcentration indexes may not go to zero even in this case, because multi-productfirms are common in differentiated products industries. However, we will con-sider simple product-level measures in this paper, which to some degree obviatesuse of the “bounds” approach of Sutton’s case studies made necessary by Sutton’suse of firm, rather than product-level data.
5
Quality and Concentration when Quality increases Fixed Costs
If higher-quality firms can undercut low-quality firms (even when the lower qual-ity firms are pricing near marginal cost), then product proliferation becomes un-likely. This case occurs when marginal cost is constant in quality and can alsooccur when marginal cost is increasing but concave in quality. When increasedquality does not greatly increase marginal cost, it seems empirically reasonable tothink that the cost of quality may be born in part by fixed costs. Such “endogenoussunk cost” models are reviewed in Shaked and Sutton (1987) and related works.
In the appendix, we review Shaked and Sutton’s argument that when the bur-den of quality improvements falls on fixed costs, product proliferation will notoccur. Instead, the concentration of products within the market will not go to zeroas market size increases, but will have some lower bound. In particular, there is alower bound (independent of market size) to the market share of largest product,and there will be at least one high-quality product in the market (which may ormay not also be the largest product in the market.) The maximum quality leveloffered in the market is constrained by market size, but will go off to infinity asmarket size increases.
Thus, the direct empirical implications of the Shaked and Sutton model arefor the market share of the largest product (which should have a lower bound inmarket size) and for the maximum quality level in the market. More generally, wemight expect to see high levels of product concentration even in larger cities andwe might also expect to see higher quality products in larger cities.
Extensions and Caveats
The literature shows that the flavor of these results does not depend on the extremeassumptions. For example, one could add a horizontal dimension of quality as inthe utility function
uij = θiδ − αipj − γ(νi − xj)2, (8)
whereνi is the preferred horizontal location of consumeri andxj is the horizontallocation of productj. In this case, demand is a mixture of pure vertical models,with each small interval of the horizontal line giving rise to a “nearly” verticalmodel. Given the horizontal dimension, there will be more entry and more productvariety than in the pure vertical model. Especially if there is a correlation betweenνi andθi, there may be very popular low quality products even in the endogenousfixed cost case. However, the Shaked and Sutton result can still go through so thatthere is a lower bound to the one-firm concentration ratio.
6

One might also consider economies or diseconomies of scale in the variableproduction function. Diseconomies of scale will strengthen the product prolifer-ation result, while further economies of scale will strengthen the Shaked-Suttonconcentration result.
4 Industry Background and Data Sources
The basic data for this study are cross sections of product quality measures andmeasures of entry and product consumption - and therefore market share and con-centration - for local markets in the daily newspaper and restaurant industries.The data are drawn from a variety of sources, and different sorts of measures areavailable for different industries.
4.1 Newspapers
Across markets, daily newspapers offer strikingly different product characteris-tics. Some newspapers offer only a dozen or so pages of news, together witha limited number of specialized sections (such as sports) and a limited numberof advertisements. Other newspapers offer hundreds of pages of news, adver-tisements and specialized content. Many newspapers produce a large number oforiginal news and feature articles, whereas other papers rely largely on outsidenews services and syndicated content. Clearly, the quality of a newspaper is anendogenous choice of the publisher.
Furthermore, much of the cost of quality is fixed with respect to output. In par-ticular, the marginal cost of more and better content is limited to the cost of paper,printing and distribution, whereas the salaries of more (or better) reporters andeditors are fixed with respect to output. These facts, together with the existence,in the US, of [i] a large number of separated metropolitan newspaper markets ofvarying sizes and [ii] a number of good direct measures of product quality, seemto make newspapers the ideal empirical embodiment of the Shaked and Suttonendogenous fixed cost theory.
In the newspaper industry, there may also be some economies of scale inthe variable production function (that is, in printing and distribution.) This willtend to reinforce the Shaked and Sutton effect. However, note that daily newspa-pers survive in very small markets without charging unusually high prices, so theeconomies of scale in printing and distribution cannot be overwhelmingly large.
7

We recognize that newspapers derive revenue from both readers and adver-tisers. In this paper we analyze product quality and market share from the per-spective of readers. Implicitly we are treating advertising revenue as a per-readerproportional subsidy.
Intuitively (and from a casual examination of newspaper pricing) it seems atleast plausible that the increase in marginal cost from high quality is sufficientlylow that high quality newspapers can undercut lower quality papers and thereforedrive low quality competitors from the market. However, this competitive effectwill be offset by some degree of product differentiation. For example, when thereare two competing major metropolitan dailies within one market, they often dif-fer in format (tabloid versus broadsheet) and in politics (with editorials leaningsomewhat more to the left or right.)
Also, within a broad metropolitan area there can be a large number of dailynewspapers with a tight (typically suburban) geographic focus. For example, Ta-ble 1 shows a list of daily newspapers in the general New York city metropolitanregion as of late 2001. In our data, only New York City has three major metropoli-tan dailies and all the other daily newspapers in the metropolitan region have atight regional (or ethnic) specialization, almost always specializing in a particularcounty. Indeed, web sites for some of the suburban papers boast of their regionalmonopoly status (“Ocean County’s only daily newspaper”).
This raises an important issue of the market definition. We will in some caseslook just at the major metropolitan dailies, but we will typically err on the sideof caution and include all the daily newspapers in the MSA. One should keep inmind, then, that our results will hold despite a purposeful introduction of a largedegree of horizontal (geographic) differentiation.
Much of our data on daily newspapers comes fromBurrelle’s Media Direc-tory which provides information on each daily newspaper published in the US.We have the name of the newspaper, the language of publication, the “target au-dience” (e.g. general interest), and the circulation. From the circulation figures,we can compute measures such as the market share of the largest firm (the 1-firmconcentration ratio) as well as traditional measures like the product-level HHI orits reciprocal, the number of “newspaper equivalents”. We exclude non-Englishnewspapers, as well as daily newspapers with a specialized business audience (e.g.Platt’s Oil Gram or Daily Variety.)
Turning to the level of geographic aggregation, our data are at the level of theCensus Metropolitan Statistical Area (MSA) for urban areas greater than 50,000.An MSA consists of a city, plus its surrounding county, plus any adjacent counties
8

Table 1: Example of New York City MSA Daily Newspapers
MSA CityPMSA (County) Name Share Share∗∗
New York, NY (New York) The New York Times .2588 .4794New York, NY (New York) The New York Daily News .1835 .3399New York, NY (New York) New York Post .0975 .1806New York, NY (New York) New York Daily Challenge∗ .0185New York, NY (Westchester) The Journal News .0356New York, NY (Richmond) Staten Island Advance .0181New York, NY (Kings) The Brooklyn Daily Eagle .0011Nassau-Suffolk, NY Newsday .1332Newark, NJ (Essex) The Star-Ledger .0949Newark, NJ (Morris) Daily Record .0138Newark, NJ (Sussex) The New Jersey Herald .0040Bergen-Passaic, NJ (Bergen) The Record .0401Bergen-Passiac, NJ (Passiac) North Jersey Herald News .0163Jersey City, NJ (Hudson) The Jersey Journal .0139Middlesex-Somerset, NJ (Middlesex) Home News Tribune .0177Middlesex-Somerset, NJ (Somerset) Courier News .0104Monmouth-Ocean, NJ (Monmouth) Asbury Park Press .0373Monmouth-Ocean, NJ (Ocean) Ocean County Observer .0043
∗TheDaily Challengeis targeted at an African-American audience.∗∗City Share is MSA circulation as a share of the central city newspapers (“major
metropolitan dailies”) without a geographic or ethnic specialization.
9

that are considered to be part of the same urban agglomeration.2
Turning to newspaper quality, we have three measures. The first is the size(number of pages) of the paper. More content is presumably preferred to lessand therefore the size of the paper is a natural vertical quality attribute.3 Our sec-ond measure is the is number of reporters on staff (fromBurrelle’s), which may bethought of a measure of locally produced (as opposed to syndicated) content. Thisis a measure of inputs rather than output and is therefore similar to Sutton’s mea-surement of, for example, R&D expenditure. We aggregate pages and reporters tothe market level weighting by circulation.
Our third measure is a direct output measure of how good the reporters are,the number of Pulitzer Prizes awarded, 1980-1999. We aggregate across 20 yearsto reduce the lumpiness of the measure. We exclude the breaking news categoryfrom the tally because they appear to be awarded to the paper in the locale of theyear’s calamity.4 The are some possible biases in the Pulitzer prize process (suchas a bias toward New York City), that we consider in the empirical analysis below.
Table 2 shows that our broad MSA newspaper dataset has data on 283 metropoli-tan areas with an average of about 3 newspapers (including suburban dailies.)As expected, the distribution of market shares is quite skewed, with the aver-age product-level Herfindahl index being larger than the Herfindahl of a two-firmduopoly market (0.69 versus 0.50).
4.2 Restaurants
Product quality is also endogenously chosen by restaurants. However, increasedrestaurant quality arguably raises marginal cost at a fairly rapid rate. It seemsplausible that if a high quality French restaurant priced its meals at marginal cost,there would still be a market for McDonald’s. The French restaurant’s qualitycomes in part from expensive ingredients, expensive labor of the kitchen staffand intensive and customized table service. This does not rule out an increase in
2This can be contrasted with “Primary” MSA’s (PMSA’s), which aggregate less and which cancontain only parts of counties. On the other side, “Consolidated” MSA’s aggregate larger areas.Our restaurant data contain some PMSA (and some similar “New England County MetropolitanAreas”.
3Number of pages of the paper might be alternatively thought of as a measure of one input intothe content of the newspaper.
4In the last seven years, four of the breaking or spot awards for journalism have gone a pa-per local to: the Columbine High School shooting, the crash of TWA flight 800, the Northridgeearthquake, and the bombing of the World Trade Center. See www.pulitzer.org.
10

Table 2: Sample Characteristics
Newspapers RestaurantsN=283 N=316
Number 3.23 472.5Number equivalent 1.81 164.6Log Number 0.83 5.48Log Number Equivalent 0.46 4.52Product HHI 6922 161.8
Largest Newspapers Staff 31Average Newspaper Staff (Circ.-weighted) 24.2Longest Newspapers Length (Pages) 47.7Avg. Newspaper Pages 41.1Pulitzer Prizes/100 staff, 1980-1999 0.51
4 or 5 Star Restaurants (N=284) 0.46
Population (mil) 0.681 0.679
restaurant fixed cost as well, but the theory does not require exogenous fixed cost,just a marginal cost function that allows for product proliferation.5 Restaurantsseem to be a good industry to illustrate product proliferation.
Even more than in newspapers, the restaurant industry is also marked by hor-izontal differentiation, in type of cuisine, in the quality of the service and decor,and in geography. The geographic dispersion of restaurants is particularly trickyand raises the issue of whether all restaurants in an MSA are properly thoughtof as being in the same market. We can imagine two extreme scenarios. In onescenario, everyone eats in restaurants in their own neighborhood. The growth ofcities, in this scenario, just adds new neighborhoods. If the number of restaurantsper neighborhood is constant, then the number of restaurants will have a linearrelationship to city size, but there is no clear utility gain to consumers. In this sce-nario (with consumption of only “local” restaurants), a welfare gain would come
5The compensation of the head chef, for example, may be a fixed cost that increases in productquality.
11

only from an increase in restaurantsper capita(meaning more restaurants perneighborhood.). However, in another extreme scenario (perhaps more applicableto high quality establishments), every restaurant serves all consumer in the metroarea equally. In this case, any increase in the number of restaurants is a welfaregain, even if the per-capita number of restaurants does not increase. As the truthis probably between the two scenarios (even for high-quality restaurants), we willpresent information on both per-capita and total numbers of restaurants.
For restaurant quality we have two sources of data. First, we have the numberof restaurants given four or five Mobil stars, fromAmerica’s Best Hotels andRestaurants(Connolly 1998). Mobil employs the same quality criteria throughoutthe country, so the number of restaurants earning 4 or 5 stars provides a measureof the number of restaurants in the locale with quality above some absolute level.6
Table 2 shows that there are a total of 131 4 or 5-star restaurants in our 316MSA sample of restaurant data. Most markets (87 percent) have no 4 or 5-starrestaurants.
Zagat’slocal surveys of restaurants provide our second source of quality data.Zagat’s provides ratings of restaurants within each of 43 US markets. These rat-ings are based on surveys of residents of the respective cities. Hence, the ratingsare not comparable across markets. In addition to the basic Zagat ratings (basedon price, food quality, service, and decor), in 1999 Zagat’s also provided “popu-larity” rankings of the top 20 restaurants, among three age groups, in each of 20US markets at their website (www.zagat.com). The age groups are 20-29, 30-39,and 40-49.
Chain restaurants - with more than one location - frequently appear amongZagat’s most popular top 20 restaurants in a locale. Of the 460 restaurants inthe sample, 30 correspond to restaurants that appear in more than one samplemarket. For example, California Pizza Kitchen is present in 12 of the 20 coveredmarkets and appears in 26 of 60 Zagat’s age-group-specific top 20 rankings for the20 covered markets. Assuming that restaurants within a chain offer equal qualitywherever they are located, we can use the Zagat’s data to determine whether largermarkets have more restaurants above some quality threshold by asking whether,for example, California Pizza Kitchen is lower-ranked in larger markets.
The US County Business Patterns databased provides data on the number of
6According to the Mobil guide, restaurants receive stars “after an extensive review of inspectionreports from experienced field representatives, the written evaluations of experts who stay and dineanonymously... A Five-Star lodging or restaurant is one of the best in the country, while a Four-Star property is outstanding and worth a special trip.” (Connolly 1998)
12

eating and drinking establishments by MSA.7 In addition to the total number ofestablishments, the retail census also reports the size distribution of restaurantsaccording to employment. We use these data to calculate numbers of restaurantsand measures of concentration. Using employment figures to calculate concentra-tion assumes that output is roughly proportional to employment, which (while notperfectly correct) doesn’t seem too bad for this industry.
5 Empirical Results on Market Size, Variety and Con-centration
To review, theoretical considerations, together with our beliefs about the coststructure of the industries, lead us to expect the following: 1) larger markets willhave more restaurants of all types, including higher quality restaurants, 2) thequality of the best newspapers in a market will improve in market size, 3) thereshould be lower bound to the market share of the largest newspaper in a marketand 4) the number of establishments will increase in market size for both indus-tries, but presumably much less rapidly for newspapers than for restaurants.
5.1 Market Size, Maximum Share, Concentration and Num-bers
As expected, across the two industries there is a strikingly different relationshipbetween market size, the number of products and the distribution of market shares.Figure 1 plots the number of products in the MSA by the population of the MSA.The upper-left plot graphs both relationships on the same graph – there are obvi-ously many more restaurants than newspapers. Graphing restaurants alone (upperright) shows a nearly perfectly linear relationship, consistent with the finding (onnearly the same data) of Campbell and Hopenhayn (2002). The number of news-papers also increases, although not in nearly as systematic a fashion (lower left).
Sutton (1991) emphasizes the prediction for the maximum share. Figure 2agraphs the maximum market share of the newspapers in the MSA. There appearsto be a lower bound to this share, of about 0.2, even as the cities become verylarge.
7Eating and drinking establishments are NAICS code 722 , and the data are available as of thiswriting at the census web site, www.census.gov.
13

Mar
ket S
ize a
nd N
umbe
r of P
rodu
cts
Mar
kets
with
Dat
a on
Bot
h
Popu
latio
n.0
5673
54.
2234
8
0
3328
Rest
aura
nts
Restaurants
Popu
latio
n0
10
0
6500
News
pape
rs
Dailies
Popu
latio
n0
20
125
Figure 114

(max
) sh
are
Max Share of Papers1990 MSA Pop. (mil.)
0 20
0
1
Figure 2a
15

If we take the suburban dailies out of the data, the results on numbers andmarket shares for newspaper become more dramatic. Figure 2b considers dataon the major metropolitan dailies for the 25 largest US cities (as classified byindustry sources.) The market share on the vertical axis is the share of the largestmetropolitan daily as a fraction of all the metropolitan dailies. The symbols on thefigure indicate the total number of such dailies; only in New York is the numberas large as 3. Strikingly, the lower bound on the largest share seems to be about50%.8
(max
) sh
are
Max Share of Major Dailies, by City Pop, Top 25 Cities(numbers indicate number of papers)
0 2 4 6 8
0
.25
.5
.75
1 1
22
11 1
2
1 111
2
1111
3
2
11 111
2
2
Figure 2b
We could try to graph the maximum share of restaurants by market size, us-ing the employment classes in the CBP data to approximate size. However, the
8This is another way of saying the number of products almost never drops below 2; however, inthe one 3 paper town (New York), the maximum share is still nearly half. The result of apparentlybounded maximum share also holds up, again at a different level, to graphing maximum productshare as fraction of population instead of as a fraction of total output.
16

maximum share of a restaurant is always very small and gets even smaller in largecities. There is no clear lower bound to the maximum share, other than zero.
The maximum market share is a traditional “one-product concentration ra-tio.” As a descriptive matter, we can also measure concentration by a traditionalproduct-level HHI, showing how it varies by market size in restaurants and news-papers. Figure 3 illustrates the distribution of HHI’s by market size; in this figurethe HHI’s are the sum of squared percentage shares, so they vary from zero to10,000. The HHI figures are hard to graph on a scatterplot, because of a build-upof points on perfect concentration (in newspapers) and virtually zero concentra-tion (for restaurants). Instead of a scatterplot, we use a STATA-generated box-and-whisker plot, where the x-axis plots deciles of the population distributions and thebox-and-whisker figures summarize the distribution of HHIs on the y-axis. Thethree lines in each box are, from the top, the 75th 50th, and 25th percentiles of thedistribution. The lines outside the box are the 90th and 10th percentiles, and the in-dividual circles (not always shown) give outliers. The box partly collapses when,for example, the median and 25th percentile are equal, completely collapses whenthe 75th and 25th percentiles are equal and even the whiskers disappear when the10th percentile equals the 90th.
In Figure 3, we see that concentration is, of course, much lower in restau-rants than in newspapers. The juxtaposition of figures 3b and 3c, however, showsthat concentration falls in market size in restaurants while it is relatively constanteven as market size increases in newspapers. Even though the largest marketshave roughly 20 dailies (including suburban papers, etc.), the median newspaperHHI even across markets in the top decile is roughly 5000, the same level as in asymmetric duopoly.
So far, we have been considering only plots of the data with no tests of signif-icance or controls. Table 3 reports regressions of the numbers of newspapers (andrestaurants) on market size. In addition to the log of the raw number, the tablegives results using as the dependent variable the log of the “numbers equivalents”(the inverse HHI.) The coefficient on market size (log population) is much smallerfor newspapers than for restaurants. While the restaurant coefficient in theln(N)regression without controls (column two) is roughly one (indicating proportion-ality), the newspaper coefficient onln(N) is 0.5 and on the numbers equivalentis less than 0.23. The numbers of both newspapers and restaurants increase inmarket size, but the increase is much slower for newspapers.
The fourth and last columns give results using a limited number of demo-graphic controls. The percentage of the population with some college has a sta-tistically significant positive association with the restaurant log numbers equiva-
17

HHI a
nd M
arke
t Size
Both
HHI
Popu
latio
n De
cile
0
1000
0
Res
taur
ant H
HI N
ewsp
aper
HHI
12
34
56
78
910
Rest
aura
nts
HHI
Popu
latio
n De
cile
0
1000
Res
taur
ant H
HI
12
34
56
78
910
News
pape
rs
HHI
Popu
latio
n De
cile
0
1000
0
New
spap
er H
HI
12
34
56
78
910
Figure 318

lent. The “% Young” (those under 35) is associated with a decline in the numbersequilavent for newspapers and the “% Old” (those over 65) has a smaller and pos-sibility insignificant effect (note that those “middle-aged”, the omitted category,seem to be the newspaper readers.) The bottom line is that the contrast betweenthe two markets remains in the presence of demographic controls. Further, thatconstrast is robust across regressions (not reported here) that vary the definitionof the dependent variable (levels vs. logs), the list included demographics and theset of markets in the sample.
Table 3: Market Size and Fragmentation Newspapers and Restaurants
Restaurants Newspapers
Log Log Log Log Log LogVariable N N-Equiv N-Equiv N N-Equiv N-Equiv
Log Pop. 0.99 0.91 0.876 0.521 0.226 0.206(0.014) (0.016) (0.022) (0.029) (0.023) (0.025)
Med. Income 0.016 0.013($1,000s) (0.005) (0.006)
% College 1.878 -0.495(0.329) (0.475)
% Young -1.400 -5.702(0.953) (1.368)
% Old 0.779 -2.483(0.986) (1.365)
Intercept 6.613 5.564 -7.007 1.455 0.733 2.663(0.023) (0.026) (0.499) (0.046) (0.036) (0.674)
# obs 316 316 241 283 283 283R2 0.94 0.91 0.91 0.54 0.26 0.34
Notes: Standard errors in parentheses. The unit of observation for newspaper data is msa/cmsa.For restaurants, data are available by necma/msa/pmsa. Consequently , sample sizes differ. Also,
our demographic data match the msa/cmsa and in Column 4 (restaurants with demographiccontrols) we simply drop the restaurant markets that do not match the msa/cmsa data.
To conclude this section, then, we have illustrated dramatic differences, acrossmarket size, in the share distribution of the two industries. We have argued thatquality is endogenously choosen in each industry, but the fact that newspaper
19

quality is largely fixed with respect to output means that the maximum share of anewspaper should have a lower bound. Figure 2b provides the most dramatic il-lustration of this, showing that the number of major metropolitan dailies hardly in-creases, constrasting greatly with the linear increase in the number of restaurants.The qualitative nature of this result is robust to alternative market definitions andmeasures of concentration.
5.2 Product Quality
We expect to find that the quality of the best newspaper in a market increasesdramatically, while restaurants should be filling out the entire quality distribution(including at the top).
Newspapers and Quality
While the number of newspapers changes relatively little (especially aside fromthe horizontally differentiated suburban dailies), the nature and quality of news-papers change very dramatically across market size. Figure 4 shows box-and-whisker plots of various maximum quality measures across market size. Thesebox-and-whisper plots give a simple descriptive and “non-parametric” feel for thedistribution of the maximum quality levels across the market sizes.
Figure 4 demonstrates the large changes in the nature of newspapers acrossmarkets. The physical page size of the papers increases (see the upper left panel),which is associated with both more news and more advertising, both of whichare valued by some consumers. The local journalistic staff increases (upper rightpanel), indicating that more news is produced with a local angle (as opposed torelying on wire reports.) (The staff size variable is especially obvious as a com-ponent of fixed but not marginal cost.)
The staff may be of higher quality in larger cities, as well. The larger citiesappear to win more Pulitzers per staff member (lower panels of Figure 4). This isobserved not just in the largest cities, as the pattern clearly remains when the topdecile of the distribution is removed (in the lower right panel.)
While we have only imperfect measures of quality, the same pattern showsup using each measure. It is clear that the nature of the papers is changing muchmore than the number of papers.
In our (biased) opinion, the across-metro area U.S. newspaper data is thecleanest empirical example of Sutton’s endogenous sunk cost argument, because[i] the market size “experiment” is (relatively) clean, [ii] there is clear prior reason
20

to believe that the cost of quality is largely fixed with respect to output, [iii] thetotal number of products increases fairly slowly in market size, [iv] there is a clearlower bound to the maximum share and [v] we have direct measures of quality,which increase very rapidly in market size.
The descriptive results on newspaper quality are robust with respect to theintroduction of controls in a regression analysis, as shown in Table 4.
Table 4: Newspaper Quality and Market Size
Ave Log Ave Log Max Log Max LogVariable Pages Staff Pages Staff
ln(pop) 0.208 0.475 0.287 0.560(0.021) (0.025) (0.015) (0.025)
Median -0.001 0.009 0.005 0.012Income (0.005) (0.006) (0.004) (0.006)
% College 1.106 0.900 1.025 0.961(0.388) (0.479) (0.275) (0.477)
% Young 2.387 1.173 1.119 0.428(1.115) (1.380) (0.790) (1.375)
% Old 2.480 0.183 1.982 0.006(1.113) (1.377) (0.789) (1.371)
Intercept 2.591 2.611 3.165 3.010(0.549) (0.680) (0.389) (0.677)
Notes: Standard errors in parentheses; Averages are circulation weighted averages; Qualitativeresults are robust to different measures of population and functional form (logs vs. levels).
Restaurants and Quality
In restaurants, we predict that the full distribution of quality levels will fill in. Wewould like data on the quality of each restaurant in the market. Our actual data fallshort of the ideal but still allow us to test for these effects. Rather than observingthe full distribution of qualities, in theMobil restaurant data we instead observethe number of restaurants in each market above a (high) absolute quality threshold.Furthermore, using theZagat’sdata we can examine whether the distribution fills
21

News
pape
r Qua
lity a
nd M
arke
t Size
Maximum Pages
Popu
latio
n De
cile
0
250
Max
imum
Pag
e Le
ngth
in M
SA
12
34
56
78
910
Maximum Staff
Popu
latio
n De
cile
0
350
Max
imum
Sta
ff in
MSA
12
34
56
78
910
Pulitzers
Popu
latio
n De
cile
058
# P
ulitz
ers,
’80-
’99
12
34
56
78
910
Pulitzers
Popu
latio
n De
cile
03
# P
ulitz
ers,
’80-
’99
12
34
56
78
9
Figure 422

out in larger market above the (somewhat lower) thresholds defined by variousmulti-city chain restaurants. Finally, since the number of “lower quality” restau-rants is the total number minus the number of “higher quality” establishments, wealso have information on the lower end of the quality distribution.
Figure 5 characterizes the relationship between top restaurant availability andmarket size. The box-and-whisker plots are again very useful here, as it is hardto plot the very large number of zeros in the data. The figure shows a clear posi-tive relationship: there are more top restaurants in larger markets. New York Cityalone has 31 such restaurants. The relationship does not depend on the inclusionof New York, however. The upper right panel excludes the top decile, and the pos-itive relationship remains clear. The lower panels reproduce the upper panels, butusing top restaurantsper capitainstead of the total number of restaurants. Theselast figures are consistent with the number of high quality restaurants increasingfaster than population, which suggests that the “neighborhood replication” (geo-graphic dispersion) argument discussed above does not entirely explain the marketsize / top restaurant relationship.
Figure 5 cannot control for other observable variables, or for the implicit cen-soring problem that many cities have zero top restaurants. Table 5 reports re-gressions of the top restaurant count on population and controls, and the positiverelationships evident in Figure 5 appear here as well and are statistically signifi-cant. We estimate both OLS and tobit models.
We take the evidence in Figure 5 and Table 5 as a clear indication that the num-ber of high quality restaurants increases in market size and that even the numberof high quality restaurantsper-capitais higher is larger cities.
What about the remainder of the restaurant quality distribution? We have twoways to address this. First, consider figure 2 showing the relationship betweenmarket size and the total numbers of restaurants (and newspapers). Clearly, thenumber of “non-top” restaurants is increasing in market size as well. This re-lationship is nearly linear, which does not rule out the neighborhood replicationargument for lower-quality restaurants (as would make sense if consumers willnot travel very far for lower quality restaurants.)
The Zagat’s data allow us to examine the filling out hypothesis for other cut-offs. To use the Zagat’s chain restaurant data, we have to assume that the “true”quality of chain restaurants is the same in even city in which they operate. (Chainmanagement is typically designed to ensure that this is so.) Each chain then de-fines a quality level that is constant across cities and we can check for the numberof restaurants above each quality ranking. In fact, we don’t observe the total num-ber of restaurants above a quality threshold, but we do have the data on the Most
23

Top
Rest
aura
nts
and
Mar
ket S
ize
All M
arke
ts
Restaurants
Popu
latio
n De
cile
0102031
Mob
il 4&5
Sta
r Res
taur
ants
’98
12
34
56
78
910
Exclu
ding
Top
Dec
ile
Restaurants
Popu
latio
n De
cile
012345
Mob
il 4&5
Sta
r Res
taur
ants
’98
12
34
56
78
9
All M
arke
ts
Restaurants per cap
Popu
latio
n De
cile
0369
Mob
il 4&5
Sta
rs P
er C
apita
12
34
56
78
910
Exclu
ding
Top
Dec
ile
Restaurants per cap
Popu
latio
n De
cile
0369
Mob
il 4&5
Sta
rs P
er C
apita
12
34
56
78
9
Figure 524

Table 5: Restaurant Quality and Market Size
OLS Tobits
Variable Mobil 4&5 Star 5 Star 4&5 Star 5 Star
Population 1.149 0.155 1.588 0.385(1,000,000s) (0.047) (0.007) (0.155) (0.089)
% College 1.784 0.010 15.482 1.565(1.450) (0.225) (7.434) (5.569)
Med. Income -2.964 -0.595 12.529 3.927($100,000s) (1.851) (0.288) (9.322) (5.879)
% Young -2.258 -0.379 3.779 -1.064(4.148) (0.645) (23.485) (17.836)
% Old 0.576 -0.412 9.350 -13.892(4.162) (0.647) (21.156) (21.844)
Intercept 0.850 0.284 -14.560 -2.607(2.010) (0.313) (11.250) (9.241)
σ 3.348 1.291(Tobit se) (0.402) (0.358)
Observations 284 284 284 284R-squared 0.72 0.65
Notes: Standard errors in parentheses.
Popular Top 20 restaurants (by age group). Thus, we know the [censored at 20]number of restaurants considered by each age group of Zagat respondents to be“better” than a given chain, censored at 20 and above.
Figure 6 shows the tendency for the most widespread chains to appear in the“Popular Top 20” when operating in smaller and larger markets. First, the data isdivided into large and small markets (the dark and light bars). Each panel repre-sents a different age group: the decades of the 20s, 30s and 40s. Each restaurantchain has a bar of dark/light bars representing the % of (large or small) marketsfeaturing that chain in the top 20. Long bars are indications of low market quality(in the sense of a low number of restaurants above the assumed threshold). Inall cases but one, the dark (small markets) bars are longer than the large market
25
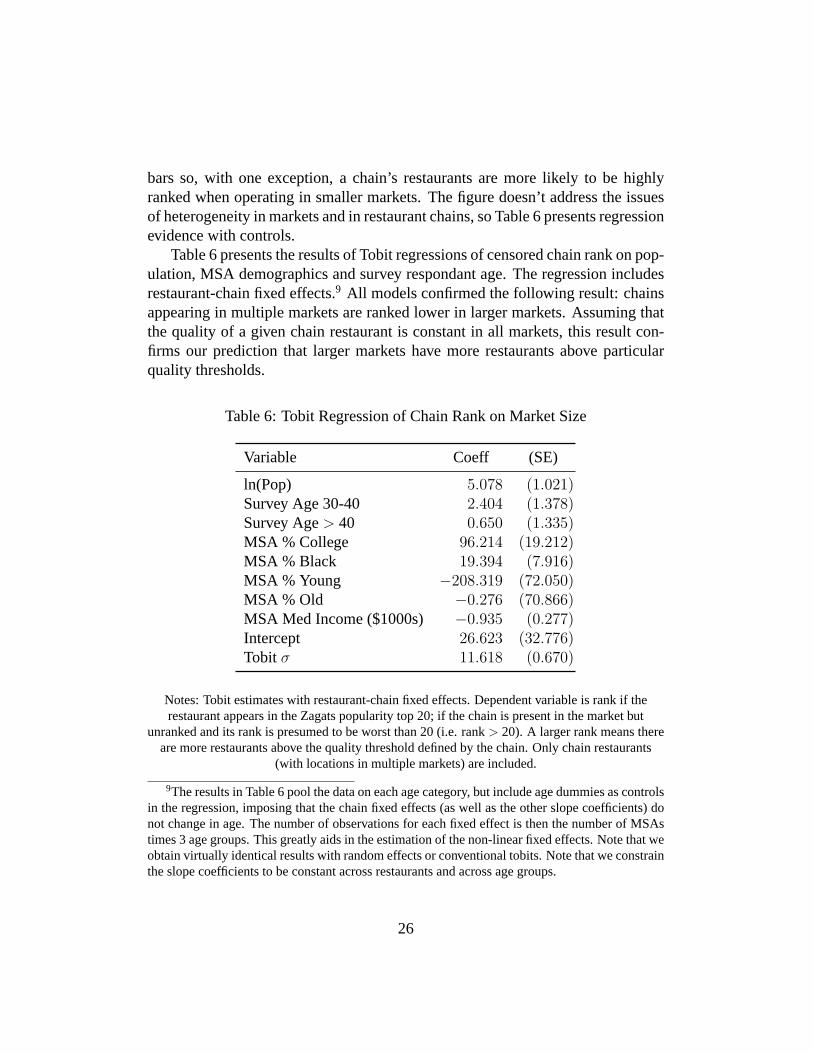
bars so, with one exception, a chain’s restaurants are more likely to be highlyranked when operating in smaller markets. The figure doesn’t address the issuesof heterogeneity in markets and in restaurant chains, so Table 6 presents regressionevidence with controls.
Table 6 presents the results of Tobit regressions of censored chain rank on pop-ulation, MSA demographics and survey respondant age. The regression includesrestaurant-chain fixed effects.9 All models confirmed the following result: chainsappearing in multiple markets are ranked lower in larger markets. Assuming thatthe quality of a given chain restaurant is constant in all markets, this result con-firms our prediction that larger markets have more restaurants above particularquality thresholds.
Table 6: Tobit Regression of Chain Rank on Market Size
Variable Coeff (SE)
ln(Pop) 5.078 (1.021)Survey Age 30-40 2.404 (1.378)Survey Age> 40 0.650 (1.335)MSA % College 96.214 (19.212)MSA % Black 19.394 (7.916)MSA % Young −208.319 (72.050)MSA % Old −0.276 (70.866)MSA Med Income ($1000s) −0.935 (0.277)Intercept 26.623 (32.776)Tobit σ 11.618 (0.670)
Notes: Tobit estimates with restaurant-chain fixed effects. Dependent variable is rank if therestaurant appears in the Zagats popularity top 20; if the chain is present in the market but
unranked and its rank is presumed to be worst than 20 (i.e. rank> 20). A larger rank means thereare more restaurants above the quality threshold defined by the chain. Only chain restaurants
(with locations in multiple markets) are included.
9The results in Table 6 pool the data on each age category, but include age dummies as controlsin the regression, imposing that the chain fixed effects (as well as the other slope coefficients) donot change in age. The number of observations for each fixed effect is then the number of MSAstimes 3 age groups. This greatly aids in the estimation of the non-linear fixed effects. Note that weobtain virtually identical results with random effects or conventional tobits. Note that we constrainthe slope coefficients to be constant across restaurants and across age groups.
26

% C
hain
Ran
ked
when
Ope
ratin
g in
Lar
ge a
nd S
mal
ler M
arke
ts
0
.375
am
ong
20’s
in s
m. m
kts
am
ong
20’s
in lg
. mkt
s
Appl
ebee
sCh
evy’s
Chili’
sCh
ina
Bist
roO
utba
ckRu
th’s
Chris
TGIF
0.5
am
ong
30’s
in s
m. m
kts
am
ong
30’s
in lg
. mkt
s
Appl
ebee
sCh
evy’s
Chili’
sCh
ina
Bist
roO
utba
ckRu
th’s
Chris
TGIF
0
.375
am
ong
40’s
in s
m. m
kts
am
ong
40’s
in lg
. mkt
s
Appl
ebee
sCh
evy’s
Chili’
sCh
ina
Bist
roO
utba
ckRu
th’s
Chris
TGIF
Figure 627

The positive relationship between market size and the number of restaurantsabove various quality thresholds has two potential “horizontal” explanations, inaddition to the “vertical” explanation of filling in the range of available qualities.First, it may reflect “neighborhood replication” in market size; this involves horiz-tonal differentiation in geography. Second, it may reflect growth in the types offood (cuisine) that is offered in each location. In practice, there may be some pro-liferation in horizontal dimensions together with some proliferation in a verticaldimension and the distinction may matter very little in most policy applications.However, for the purpose of comparing Sutton-like predictions across city-sizes,it may be of interest to know if the proliferation in restaurants is largely verticalor else appears to be largely horizontal.
As for the neighborhood replication argument, the chain restaurants actuallydo appear in multiple locations. One might think this would give them a specialadvantage in large cities, but they are not more popular in larger cities.
On balance then, we doubt that the neighborhood replication argument ex-plains the relationship between market size and high quality restaurants. First,on a priori grounds we suspect that high quality restaurants, unlike neighborhoodpizza joints, serve entire metropolitan areas. Second, our results show that marketsize is positively related to not only the number of high quality restaurants butalso the per capita number. Finally, under the neighborhood replication argument,restaurants with multiple locations within a market would tend to achieve higherpopularity rankings than standalone neighborhood restaurants, contrary to the re-sults in Table 6. However, for lower quality restaurants, the “neighborhood repli-cation” argument (under which city neighborhoods would offer about the samechoices in small and large cities) is difficult to rule out with our present data.The number of lower-quality restaurants does appear to increase approximatelyproportionately to market size.
What about horizontal proliferation through the proliferation of types of cuisines?Data available at the Yellow Pages web site10 give the number of restaurants ineach city in each of 49 different cuisine categories. We obtained these for the top25 cities (not metropolitan areas). The number of restaurants in these cities rangesfrom 758 in El Paso to 5574 in New York. The number of distinct cuisines avail-able ranges from 27 in Detroit to 46 in Chicago. A regression of the log numberof restaurants on log population yields a coefficient of 0.72 (s.e.=0.095). Since thenumber of restaurants is the product of the number of cuisines available (NC) andthe number of restaurants per cuisine (N/NC), we can decompose the log poop-
10See http://www.yellowpages.com/, accessed October 18, 2002.
28

ulation coefficient of 0.72. A regression of log(NC) on log population gives acoefficient of 0.098 (s.e.=0.029), while a regression of log (N/NC) on log popula-tion yields a coefficient of 0.624 (s.e.=0.75). This is consistent with a belief thatonly small fraction of restaurant growth in market size is cuisine differentiation asmeasured by Yellow Pages data. Of course, we can not rule out more subtle formsof horizontal differentiation.
To summarize the restaurant quality evidence, then, we find that the entiredistribution of restaurants fills out in larger markets, giving rise (among otherthings) to more high quality restaurants, evenper capita. However, the increasein the number of products is at least as dramatic as any changes in the quality ofthe products and we can present no evidence that average quality increases at all.
6 Concluding Discussion
In this paper, we have presented evidence, consistent with Shaked and Sutton(1987), that the distribution of product quality bears different relationships withmarket size depending on the process for producing quality. In one market (restau-rants) where quality is created largely through variable costs, markets fragment asthey grow large, and the number of varieties – including levels of quality – in-creases. Consequently, the number of high-quality products increases in marketsize as well. In another market (newspapers) where the cost of creating quality islargely fixed with respect to output, markets do not fragment as they grow largeand average product quality increases in market size.
Our empirical evidence is descriptive and does not provide parameter esti-mates of an underlying model. Nonetheless, our evidence may improve on ex-isting cases studies (e.g. Sutton (1991)) by focusing on a cross-section of U.S.metropolitan areas (instead of relying on cross-country regressions) and by em-phasizing direct measures of quality in addition to evidence on market structure.In newspapers, we show that the number of metropolitan dailies hardly changesat all, while the quality of the product increases greatly in market size. We thinkthis provides the best descriptive example to date of the Shaked and Sutton the-ory of endogenous fixed costs. The contrast to an industry like restaurants (wheremaximum quality increases but the market fragments as size increases) is vivid.
The evidence in this paper has implications for a number of areas of eco-nomics, including entry, trade and rationales for urban agglomeration. Much ofthe empirical entry literature is driven off the assumption that different sized mar-kets can accommodate different numbers of firms. For example, some authors
29

seek to draw inferences about how prices fall with entry from the relationship be-tween market size and the number of firms operating. This literature would begreatly complicated by quality competition, which implies that both fixed costsand product characteristics change in market size. Future structural work mightprofitably explore the endogeneity of quality and sunk costs.11
As noted, there is a large economic literature on rationales for cities. Thevast majority of this literature focuses on various production-side rationales forcities. However, the empirical literature in industrial organization has already doc-umented the consumption-side benefit of increased product variety: recent workdocuments the relationship between market size and the number of local optionsin retail, radio, television, newspapers, and the Internet.12 This work, predicatedexplicitly on the presence of exogenous fixed costs, implies that consumers facemore options and therefore achieve more satisfaction in larger markets.13 Thepresent paper shows that the welfare benefits of larger markets are driven not onlyby the number of products but also by the kinds of products available in larger mar-kets. The presence of higher quality goods in larger markets presumably heightensthe consumption-side benefits of agglomeration.
A separate literature examines urban quality of life, explaining land values ascapitalized amenities, where the fundamental amenities include weather, pollutionand local tax and spending mixes (for example, see Gyourko and Tracy (1991)).To our knowledge this literature ignores effects of endogenous product quality andavailability on consumer welfare. Given the rather substantial differences in thenature of products in local service industries like media, restaurants and retail thisomission may be important.
As noted by Krugman, there is a good deal of overlap between the study ofgeography and the study of trade. In Krugman style trade models, one major ben-efit of trade is an increase in product variety. In media markets like newspapers,trade may do more to change the quality of the product than to change the vari-ety of products available, as higher quality products (spreading the cost of quality
11Some preliminary structural results are in the Berry and Waldfogel (1999) study of entry inlocal radio broadcasting markets, which finds a strong relationship between station fixed costs andmarket size. That study, however, does not take the further step of endogenizing product quality.
12Studies include Bresnahan and Reiss (1991), Berry and Waldfogel (1999), , Waldfogel (forth-coming), Waldfogel (2001), George and Waldfogel (forthcoming), Sinai and Waldfogel (2001)and Campbell and Hopenhayn (2002).
13Of course, these consumption benefits might be offset by congestion, crime and other urbandisamenities. In the traditional model of production externalities, it is these disamenities that limitthe size of cities.
30

across a world market) drive local alternatives out of business. As in newspapers,horizontal differentiation will keep some local alternatives alive.
In light of arguments in this paper, the market for content on the Internet pro-vides an interesting possible case study. The Internet, and attendant informationtechnologies, have simultaneously reduced exogenous fixed product costs and,by wiring geographically dispersed consumers together, increased market size.Under conventional understandings of entry, this would be expected to lead to aproliferation of firms and products. Some observers herald a new retail and medialandscape where a great diversity of sellers and voices will be available and heard.Yet if fixed costs are determined endogenously by a quality competition process,then the new information and retail economy may remain as concentrated as theold.
A Appendix
In this appendix, we lay out some of the mathematics behind the review of theory in thetext.
A.1 Pricing in the The Vertical Model
Consider the utility function of consumeri for productj of
uij = θiδ − pj , (9)
whereθi is willingness-to-pay for quality. If an ordered set of productsδ1 < δ2 <δ3 < . . . < δJ are all purchased by some consumer, then it is easy to show that eachproduct substitutes only with the next-highest and next-lowest product in quality. The setof consumers who prefer productj to the lower quality productj − 1 is then defined byθi’s that satisfy:
θiδj − pj > θiδj−j − pj−1 ⇒ (10)
θi >pj − pj−1
δj − δj−1. (11)
Similarly, j is preferred to the next higher quality product if
θi <pj+1 − pj
δj+1 − δj. (12)
The last two conditions are jointly satisfied only if
pj+1 − pj
δj+1 − δj>
pj − pj−1
δj − δj−1. (13)
31

This in turn places a restriction on the price of goodj – if pj is too high then no onewill buy productj. In particular, there is a kind of convexity restriction – withδ on thehorizontal axis andp on the vertical axis, the the slope of the line between(δj−1, pj−1)and(δj , pj) has to be less than the slope of the line between(δj , pj) and(δj+1, pj+1).Formally, we can re-write (13) as:
pj < λpj−1 + (1− λ)pj+1 (14)
whereλ = (δj − δj−1)/(δj+1 − δj−1) so thatδj = λδj−1 + (1− λ)δj+1. Thus, we findthat prices as a function ofδ must be convex inδ if every product is to be purchased.
This result on the convexity of prices relates to the shape of marginal cost in quality.If marginal cost is concave in quality, then a higher price good can price above its ownmarginal cost and yet drive a lower price good out of the market. This is not true in thecase of convex marginal cost. The potential ability to price lower-quality products out ofthe market in turn has large effects on the incentive to product both high and low qualitygoods.
Product Proliferation and Convex Marginal Costs
Here we show that the product-quality line will fill in as market size increases if: marginalcosts are increasing and convex in quality (and constant in quantity), demand is generatedby the vertical model andθ has positive density on(0,∞) That is, under these assump-tions, as as market size goes to infinity, there will be a product on every quality segmentof positive length on(δ,∞), whereδ is some lower bound on quality.
We consider simultaneous move equilibria in prices and qualities. There are an infinitenumber of potential firms, each of whom can offer any combination of products with anyprice and quality combinations. As is typical in this literature, we don’t try to establishthe existence or uniqueness of equilibria (which is very difficult), but we instead consideroutcomes that necessarily occur in any equilibria.
In this paper, we are not much concerned with what happens on the lower regionsof the quality, because we don’t have good data on low quality products. Suppose thenas market size increases, at some point there are two goods,δ1 andδ2 (this is easy toestablish given some conditions on the outside good.) We will then show that the qualitylevels aboveδ1 will eventually fill in.14
First suppose that there is no product on a segment(δ1, δ2) and consider the profits ofa potential entrant into that segment. The worst-case scenario for the potential entrant intothe segment is that the products atδ1 and atδ2 are pricing at marginal cost. In this worst-case scenario, the potential entrant will make positive sales by entering atδ ∈ (δ1, δ2)(and a price ofp) if the condition in (14) holds:
p < λmc(δj−1) + (1− λ)mc(δj+1), (15)
14Of course, new products belowδ1 may also be introduced.
32

with λ = (δ − δ1)/(δ2 − δ1).15
The new entrant can set such a low price, and yet still price above marginal cost, ifmarginal cost is convex in quality. Since sales are then a positive fraction of the marketand price is above marginal cost, per-capita variable profitsV are positive and no matterwhat is the (finite) level of fixed costsF (δ), eventually asM grows largeMV (δ)−F (δ)will be positive and so a product must be offered in that segment in any equilibrium. Notethat since a product is offered in every segment above some minimum level, “productconcentration” declines – the maximum share of any product goes to zero.
Now consider a high-quality segment,(δ2,∞), that does not have a product (for anyfinite δ2). At any pricep, there are someθ’s that will prefer a higher quality good, withquality δ > delta2. Specifically, the set of consumers that will buy the good satisfyθ > (δ − δ2)/(p− p2). By choosingp > mc(δ), once again the per-capita variable profitfor this product is positive and so asM increases the product is eventually offered.16
So, in this sub-section we have established that when marginal cost is increasing andconvex in quality, then as the market size increases products proliferate, filling in theproduct space (so that product-concentration declines) and also the maximum quality inthe market increases.
A.2 Sutton’s “Endogenous Fixed Cost Models”
Shaked and Sutton (1987) consider models where products do not proliferate as marketsize increases, but rather where some high-quality products maintain some fixed minimumfraction of the market even as market size increases. In the vertical model where marginalcost is not convex is quality, higher quality products can possibly undercut lower-qualityproducts and drive them from the market, thus taking a significant fraction of the market.Shaked and Sutton show conditions under which this action can lead to concentration inthe limit. We also emphasize that once again the maximum quality in the market increasesand indeed the mechanism for maintaining share in the face of increased market size is tocontinue to increase quality.
Shaked and Sutton consider a general class of vertical models in which a high qualityproduct can capture a fixed level of per-capital products via a sufficiently high increasein quality. Specifically, suppose that ifδj is k times higher then any otherδ, a firm canin equilibrium capture some fraction,α, of total income,MY as variable profit. That is,if δj is k times higher than any otherδ, then the firm producingj has profits of at leastMαY . This is certainly true in the vertical model if marginal cost does not increase inquality and if some (possibly small) fraction of consumers will pay for increased quality.
15As long as the sales ofδ1 andδ2 are positive in the absence of the new good good, then wedon’t have to worry about competition with the other goods of even lower and even higher quality– as long as the condition is met then the sales of the new good are positive.
16Note that this last result does not depend on the convexity of marginal cost.
33

For example, consider the vertical model where marginal cost,mc, is constant inquality and where currently purchased products are(δj , pj ; j = 1, . . . , J). Now considera new product with qualityδj = kδJ , whereJ indexes the highest quality existing product.Let the new product have pricepJ+1 = pJ + DδJ , whereD is any constant. SincepJ
exceeds marginal cost, the markup on the new product is at leastDδJ . The new productis preferred to the old highest quality product for consumers whose tastesθ satisfy:
θ >(pJ+1 − pJ)(kδJ − δj)
=D
k − 1(16)
The last inequality does not depend onδj – one can always get a fixed positive share ofsales by increasing qualityk times and setting price as described. Further, given constantmarginal cost in quality (or marginal costs that do not increase too fast in quality) the priceincrease is sufficient to generate a positive markup per sale (and the markup increases inthe quality of the best rival and so has some lower bound as long as equilibrium qualityhas some lower bound). This is just one example of how the Shaked-Sutton conditionson the variable profit function can be satisfied when marginal costs do not increase at aconvex rate.
As for fixed costs, Sutton assumes that∂ln(F )∂ln(δ) < β. That is, increasingδ by k times
drives up fixed costs by less thankβ times. This insures that fixed costs are not increasingat some unbounded rate in quality.
Define market share as the revenue of productj as a fraction of the total marketincome. Shaked and Sutton then show a lower bound to the maximum market share. Inparticular, they prove that there is anε so small that if the largest firm’s market share fellbelowε, then that firm would increaseδ enough to get a share above that level. Further,ε ≡ 1
1+kβ .To establish this result, again following Shaked and Sutton, let us suppose to the con-
trary that the maximum market share is below the alleged lower bound. In this supposedequilibrium, variable profits are no more thanεMY and fixed costs are also no larger(because profits are positive). Now suppose that a firm deviates from the proposed equi-librium and chooses a quality levelk times higher than the maximum quality. In the newequilibrium, the deviating firm gets variable profits of at leastαMY and has fixed costsof no more thankβεMY and so the deviating firm has profits of at least
αMY − kβεMY . (17)
This deviation is certainly profitable if
αMY − kβεMY > εMY ⇒ (18)
ε <α
1 + kβ, (19)
which completes the proof.
34

References
BERRY, S., AND J. WALDFOGEL (1999): “Social Inefficiency in Radio Broad-casting,”RAND Journal of Economics.
BRESNAHAN, T., AND P. REISS(1991): “Entry and Competition in ConcentratedMarkets,”Journal of Political Economy, 99, 977–1009.
CAMPBELL , J. R., AND H. A. HOPENHAYN (2002): “Market Size Matters,”Working Paper 9113, NBER.
CONNOLLY, D. E. (1998): Mobil Travel Guide: America’s Best Hotels andRestaurants. Fodor’s Travel Publications, New York.
DIXIT , A., AND J. E. STIGLITZ (1977): “Monopolistic Competition and Opti-mum Product Diversity,”American Economic Review, 67, 297–308.
ELLICKSON, P. (2001): “Competition in the Supermarket Industry: Sunk Costsand Market Structure,” working paper, University of Rochester.
FUJITA, M., P. KRUGMAN, AND A. J. VENABLES (1999):The Spatial Economy:Cities, Regions and International Trade. MIT Press, Cambridge, MA.
GEORGE, L., AND J. WALDFOGEL (forthcoming): “Who Benefits Whom in DailyNewspaper Markets?,”Journal of Political Economy.
GLAESER, E., J. KOLKO, AND A. SAEZ (2001): “Consumer City,”Journal ofEconomic Geography, 81(1), 27–50.
GYOURKO, J., AND J. TRACY (1991): “The Structure of Local Public Financeand the Quality of Life,”Journal of Political Economy, 99(4), 774–806.
HOLMES, T. J. (2002): “The Role of Cities: Evidence from the Placement ofSales Offices,” Staff Report 298, Federal Reserve Bank of Minneapolis.
JACOBS, J. (1961):The Death and Life of Great American Cities. Random House,New York.
KRUGMAN, P. R. (1991): “Increasing Returns and Economic Geography,”Jour-nal of Political Economy, 99, 483–499.
35

SHAKED , A., AND J. SUTTON (1987): “Product Differentiation and IndustrialStructure,”Journal of Industrial Economics, 36(2), 131–146.
SINAI , T., AND J. WALDFOGEL (2001): “Geography and the Internet: Is theInternet a Substitute or a Complement for Cities?,” mimeo, Wharton School.
SUTTON, J. (1991):Sunk Costs and Market Structure. MIT.
WALDFOGEL, J. (2001): “Who Benefits Whom in Local Television Markets?,”mimeo 7391, Wharton School.
(forthcoming): “Preference Externalities: An Empirical Study of WhoBenefits Whom in Differentiated Product Markets,”RAND Journal of Eco-nomics.
36


![[halshs-00574957, v1] Expectational coordination in simple ... · 2 Not all, since the fashionable modelling of competitiona la Dixit and Stiglitz concile market power and smallness](https://static.fdocuments.net/doc/165x107/5e8889b3e4e92f02d82b28e2/halshs-00574957-v1-expectational-coordination-in-simple-2-not-all-since.jpg)