NBER WORKING PAPER SERIES BUSINESS ENVIRONMENT AND FIRM ... · NBER WORKING PAPER SERIES BUSINESS...
61
NBER WORKING PAPER SERIES BUSINESS ENVIRONMENT AND FIRM ENTRY: EVIDENCE FROM INTERNATIONAL DATA Leora Klapper Luc Laeven Raghuram Rajan Working Paper 10380 http://www.nber.org/papers/w10380 NATIONAL BUREAU OF ECONOMIC RESEARCH 1050 Massachusetts Avenue Cambridge, MA 02138 March 2004 We thank Simeon Djankov, Robert Hauswald, Simon Johnson, Vojislav Maksimovic, Atif Mian, Michel Robe, and seminar participants at the Fifth International Conference on Financial Market Development in Emerging and Transition Economies in Hyderabad, American University, and University of Maryland for valuable comments, Ying Lin and Victor Sulla for outstanding research assistance, Sebastian Roels at Bureau Van Dijk for help with the Amadeus data, and Brian Williams and Ryan Paul at Dun & Bradstreet for help with the Dun & Bradstreet data. Rajan thanks the National Science Foundation, the Center for the Study of the State and the Economy at the Graduate School of Business, University of Chicago for research support. We also thank the World Bank for financial support. This paper’s findings, interpretations, and conclusions are entirely those of the authors and do not necessarily represent the views of the World Bank, the IMF, the NBER, their Executive Directors, or the countries they represent. ©2004 by Leora Klapper, Luc Laeven, and Raghuram Rajan. All rights reserved. Short sections of text, not to exceed two paragraphs, may be quoted without explicit permission provided that full credit, including © notice, is given to the source.
Transcript of NBER WORKING PAPER SERIES BUSINESS ENVIRONMENT AND FIRM ... · NBER WORKING PAPER SERIES BUSINESS...
NBER WORKING PAPER SERIES
BUSINESS ENVIRONMENT AND FIRM ENTRY:EVIDENCE FROM INTERNATIONAL DATA
Leora KlapperLuc Laeven
Raghuram Rajan
Working Paper 10380http://www.nber.org/papers/w10380
NATIONAL BUREAU OF ECONOMIC RESEARCH1050 Massachusetts Avenue
Cambridge, MA 02138March 2004
We thank Simeon Djankov, Robert Hauswald, Simon Johnson, Vojislav Maksimovic, Atif Mian,Michel Robe, and seminar participants at the Fifth International Conference on Financial MarketDevelopment in Emerging and Transition Economies in Hyderabad, American University, andUniversity of Maryland for valuable comments, Ying Lin and Victor Sulla for outstanding researchassistance, Sebastian Roels at Bureau Van Dijk for help with the Amadeus data, and Brian Williamsand Ryan Paul at Dun & Bradstreet for help with the Dun & Bradstreet data. Rajan thanks theNational Science Foundation, the Center for the Study of the State and the Economy at the GraduateSchool of Business, University of Chicago for research support. We also thank the World Bank forfinancial support. This paper’s findings, interpretations, and conclusions are entirely those of theauthors and do not necessarily represent the views of the World Bank, the IMF, the NBER, theirExecutive Directors, or the countries they represent.
©2004 by Leora Klapper, Luc Laeven, and Raghuram Rajan. All rights reserved. Short sections oftext, not to exceed two paragraphs, may be quoted without explicit permission provided that fullcredit, including © notice, is given to the source.
Business Environment and Firm Entry: Evidence from International DataLeora Klapper, Luc Laeven, and Raghuram RajanNBER Working Paper No. 10380March 2004JEL No. L1, G3, O0
ABSTRACT
Using a comprehensive database of firms in Western and Eastern Europe, we study how the business
environment in a country drives the creation of new firms. Our focus is on regulations governing
entry. We find entry regulations hamper entry, especially in industries that naturally should have
high entry. Also, value added per employee in naturally “high entry” industries grows more slowly
in countries with onerous regulations on entry. Interestingly, regulatory entry barriers have no
adverse effect on entry in corrupt countries, only in less corrupt ones. Taken together, the evidence
suggests bureaucratic entry regulations are neither benign nor welfare improving. However, not all
regulations inhibit entry. In particular, regulations that enhance the enforcement of intellectual
property rights or those that lead to a better developed financial sector do lead to greater entry in
industries that do more R&D or industries that need more external finance.
Leora Klapper Luc LaevenWorld Bank World Bank1818 H Street, N.W. 1818 H Street, N.W.Washington, DC 20433 Washington, DC [email protected] and CEPR
Raghuram RajanIMFResearch Department, Rm 10-700700 19th Street, N.W.Washington, DC 20431and [email protected]
1
Introduction
New firm entry is a critical part of the process of creative destruction that Joseph
Schumpeter (1911) argued is so important for the continued dynamism of the modern economy.
That it affects economic growth has been documented in previous work.1 However, much less is
known about the business environments that promote new firm creation. This is an important
concern for policymakers, who in country after country are trying to implement policies that will
foster entry – witness, for example, the debate in Continental Europe on the lack of home-grown
venture capital in promoting new firm creation in high tech industries.2
A first step is to understand what the cross-country picture really looks like. We use a
comprehensive, recently available database of firms across a number of developed and transition
countries in Europe to address this question. Some facts are striking. For instance, one might
believe that Italy, with so many small firms, should have tremendous entry. Actually, entry in
Italy (the number of firms less than two years of age to the total number of firms) is only 3.8
percent compared to 13.5 percent on average for other European countries in the G-7.
What is especially little understood is the role of regulations, especially bureaucratic
regulations on setting up limited liability companies, in explaining variations in patterns of entry.
The early debate on such corporations emphasized the possibility that crooks might register with
little capital and dupe unsuspecting investors or consumers. For instance, the Times of London
thundered against the principle of free incorporation through limited liability thus in 1824:
“Nothing can be so unjust as for a few persons abounding in wealth to offer a portion of their excess for the information of a company, to play with that excess for the information of a company – to lend the importance of their whole name and credit to the society, and then should the funds prove insufficient to answer all demands, to retire into the security of their unhazarded fortune, and leave the bait to devoured by the poor deceived fish.” 3
According to this view, entry regulations serves the public interest by preventing fraud.
1 For example, Hause and Du Rietz (1984), Asplund and Nocke (2003), Black and Strahan (2002). 2 “Europeans Now Seek to Revive Start-Up Spirit”, Wall Street Journal, February 6, 2002. 3 As quoted in Paul Halpern, Michael Trebilcock and Stuart Turnbull, 1980, “An Economic Analysis of Limited Liability in Corporate Law”, University of Toronto Law Review 117: 30.
2
By contrast, a long literature describes regulations as devices to protect the private
interests of industry incumbents (see Smith 1776, Olsen 1965, or Stigler 1971) or the regulators
(Bhagwati 1979, Krueger 1974, McChesney 1997, Shleifer and Vishny 1997). For example,
Smith (1776) 4:
“To widen the market and to narrow the competition is always the interest of the dealers…The proposal of any new law or regulation of commerce which comes from this order, ought always to be listened to with great precaution, and ought never to be adopted, till after having been long and carefully examined, not only with the most scrupulous, but with the most suspicious attention. It comes from an order of men, whose interest is never exactly the same with that of the public, who generally have an interest to deceive and even oppress the public, and who accordingly have, upon many occasions, both deceived and oppressed it.”
The evidence in Djankov et al. (2002) that countries with heavier regulation of entry have
higher corruption and larger unofficial economies certainly is consistent with the private interest
view of regulation. But it does not rule out other possibilities – for instance, regulations could be
less burdensome in corrupt countries because officials can be bribed to ignore them (we do find
evidence for this) so there is no strong demand to streamline them, or regulations may be
promulgated in corrupt countries precisely because it is more important for an even more
untrustworthy corrupt private sector to be screened.
This suggests a number of steps. First, one has to show that these regulations do affect
entry. One cannot, however, ascertain this simply from a cross-country regression of actual firm
entry against the size of regulations. If the coefficient estimate on regulations is negative, the
skeptic could argue that causality could go the other way – that in countries with generally low
entry, people are not sufficiently motivated to press for the repeal of archaic regulations that
impede entry. Thus even though the regulations themselves may have no direct effect on entry,
there could be a negative correlation between regulatory restrictions and entry.
To address this sort of problem, we focus on cross-industry, cross-country interaction
effects (that is, we ask if entry is more likely in an industry with a particular need when the
4 Adam Smith 1776 ed. Edwin Canan 1976. The Wealth of Nations Chicago: University of Chicago Press, Book 1, Chapter XI, p. 278.

3
country scores strongly on a characteristic that facilitates meeting the need) rather than on direct
industry or country effects. In particular, if we can somehow proxy for the “natural” rate of entry
in an industry, we test whether entry is relatively lower in “naturally high entry” industries when
they are in countries with high bureaucratic restrictions on entry.
This methodology, following Rajan and Zingales (1998), enables us to address a number
of other issues as well – for instance the problem that a healthy economy scores well on a number
of cross-country variables, so it is hard to estimate the direct effect of each variable in a cross-
country regression (and equally hard to correct for all possible country variables that might
matter). By focusing on interactions, we can absorb country level variables and instead examine
the differential effects of country level variables across industries that might respond most to
them. Also, some industries may be technologically more predisposed to entry. By correcting for
industry effects, we also correct for the fact that average entry rates depend on the industries
present in a country.
The downside of this methodology is, of course, that while it can tell us whether the
country characteristics work in predicted economic ways, it cannot tell us the overall magnitude
of the effect of the characteristics, only the relative magnitude.5 But since our primary interest is
to examine the validity of theories that suggest bureaucratic entry regulations should affect entry,
this is not a major concern.
We find that “naturally high-entry” industries have relatively lower entry in countries that
have more onerous bureaucratic entry regulations. This also suggests an explanation for the low
level of entry in Italy: the average direct cost associated with fulfilling the bureaucratic
regulations for setting up a new business in Italy is 20 percent of per capita GNP compared to 10
percent of per capita GNP on average for other G-7 European countries.
5 Of course, we could revert to cross-country regressions for that, but we cannot tell how much of the estimated effect is likely to be because of causal relationships and how much is simple correlation. See, however, Desai, Gompers, and Lerner (2003).

4
This does indicate that these bureaucratic regulations on entry work as intended but it
does not help us distinguish between the views that these entry barriers are socially harmful and
that they are socially beneficial. If these entry barriers screen appropriately as in the view that
they are framed in the public interest, we should find that incumbent older firms in naturally high
entry industries should grow relatively faster (than similar firms in similar industries in countries
with low entry barriers) because efficient ex ante bureaucratic screening takes the place of
growth-retarding wasteful competitive destruction.
By contrast, the private interest view would be more ambiguous in its predictions. By
setting up protectionist entry barriers, incumbent firms might ensure themselves more growth, but
the lack of competition may make them inefficient. Also, inefficient incumbent firms would have
a greater incentive to leave entry barriers in place.6 A finding that incumbent firms in naturally
high-entry industries grow relatively less fast in high entry barrier countries would be consistent
with the private interest view rather than the public interest view. Particularly telling would be if
these industries also accounted for a relatively lower share of the economy.
The evidence is more consistent with the view that entry regulations are framed with
private interests in mind rather than for the public interest. Growth in value added is relatively
lower in naturally high entry industries and the share of the industry in the economy is relatively
lower (though this result is weak), when the industry is in a country with higher bureaucratic
barriers to entry.
Finally, it may be that countries with untrustworthy populations erect higher bureaucratic
barriers so as to screen their fellowmen (though why the bureaucrats should be deemed more
trustworthy is a relevant question). If this were true, bureaucratic barriers might affect entry, and
might cause incumbents to become fat and lazy, but this is necessary because the alternative of
unrestricted entry by charlatans would be much worse. This is a harder proposition to refute but
6 See Acemoglu (2003), Perotti and Volpin (2003), and Rajan and Zingales (2003) for recent interest group theories of entry regulation.

5
our analysis offers some evidence that is inconsistent with it. More developed countries have
better developed information systems, better product inspections and quality control, better
contract and law enforcement, and consequently, an entrepreneurial population less subject to
misbehavior.7 If bureaucratic rules were meant to screen entry efficiently, we should expect them
to be particularly effective in low-income countries relative to high-income countries. Similarly,
we should find them particularly effective in corrupt countries. It turns out that entry barriers are
more effective in preventing firm creation in high income countries, suggesting their purpose is
not to screen out the untrustworthy (or that low income countries have other natural barriers that
prevent firm creation).
More interesting, entry barriers are effective in retarding entry only in the least corrupt
countries. On the one hand, this suggests that bureaucratic entry barriers in corrupt countries may
be ineffective roadblocks, meant solely for extracting bribes (see, for example, Shleifer and
Vishny (1997) and Djankov et al. (2002)). However, their existence and effectiveness in less
blatantly corrupt countries suggests that their purpose may well be to protect incumbents and
their rents (see, for example, Acemoglu (2003), Perotti and Volpin (2003), and Rajan and
Zingales (2003a)).
While our focus is on bureaucratic regulations on entry, we also examine the effects of
other regulations. Interestingly, not all regulations inhibit entry. In particular, regulations that go
in the direction of protecting investors – such as the accounting standards in a country – tend to
improve access to credit and hence enhance entry. We find entry is relatively higher in industries
that depend heavily on external finance in countries with better accounting standards. Similarly,
entry is higher in R&D intensive industries in countries with better protection of intellectual
7 The underlying population in richer countries may also be socialized to be more honest (fewer rogues) but all that is relevant is that the richer infrastructure gives them more incentive to behave, so there is less need for screening.

6
property. Finally, we also examine other environmental variables, such as the presence of an
educated labor force.
Taken together, our results suggest that while bureaucratic entry requirements seem to be
motivated by private interests, it is by no means obvious that the best way to encourage entry and
competition is to eliminate all regulation. The absence of some regulations can also be an
effective entry barrier (see Rajan and Zingales (2003, a, b)). Regulations that expand access to
finance and human resources seem to help entry even while those that directly screen entrants
hurt entry.
In a related paper, Desai, Gompers, and Lerner (2003) use a cross-country approach and
also find that entry regulations have a negative impact on firm entry. The cross-country approach
has a number of limitations including variations in coverage in the database across countries,
which is why we have chosen a within country, cross industry approach. Nevertheless, their
findings are complementary to ours. Another paper that is closer in methodology to ours is Di
Patti and Dell’Ariccia (forthcoming). They examine whether entry is higher in informationally
opaque industries in Italian regions that have a more concentrated banking sector (they find it is).
Their use of the Rajan and Zingales methodology is similar to ours, but the environmental
variables they focus on, as well as the data they use, are very different. In another related paper,
Bertrand and Kamarz (2002) examine the expansion decisions of French retailers following new
zoning regulations introduced in France. They find a strong relation between increases in entry
deterrence (such as rejection of expansion or entry decisions) and decreases in employment
growth. A cross-country study related to ours is Scarpetta et al. (2002), who use firm-level survey
data from OECD countries to analyze firm entry and exit. They find that higher product market
and labor regulations are negatively correlated with the entry of small- and medium-sized firms in
OECD countries. Unlike us, however, they do not focus on country and industry interaction
effects.

7
There is also work related to other aspects of our study than entry regulation. Kumar,
Rajan and Zingales (2000) find that the average size of firms in human capital intensive industries
(and in R&D intensive industries) is larger in countries that protect property rights (patents).
Using survey data from five transition countries on the reinvestment of profits by entrepreneurs,
Johnson et. al. (2002) examine the importance of property rights. They find lower investment by
entrepreneurs in countries with weak property rights. Claessens and Laeven (2003) find that
growth of industries that rely on intangible assets is disproportionally lower in countries with
weak intellectual property rights. Our finding that there is less entry in R&D intensive industries
when intellectual property is weakly enforced echoes their findings. Finally, others have also
found that financial development seems to foster entry (see Black and Strahan (2002) or Rajan
and Zingales (1998)).
There is a substantial literature on entry into an industry (possibly by a firm from another
industry) as distinguished from firm creation. It is the latter sense in which we use the term
“entry”. It would take us too much out of our way to describe the literature on industry entry, so
we refer the reader to Gilbert (1989) for a comprehensive survey. Note that there are
technological determinants of entry into an industry such as minimum scale, etc., which also
affect firm creation. We assume these determinants carry over countries so they are absorbed by
industry indicators. Our focus then is on environmental determinants of firm creation.
The paper proceeds as follows. In Section I we describe the data and in Section II we
present the empirical methodology. We present the empirical results in Section III. We conclude
in Section IV.
I. Data
1.1 Amadeus database
Central to our analysis is the firm-level Amadeus database. Amadeus is a commercial
database provided by Bureau van Dijk. It contains financial information on over 5 million private
8
and publicly owned firms across 34 Western and Eastern European countries. The database
includes up to 10 years of information per company, although coverage varies by country.
Amadeus is especially useful because it covers a large fraction of new and small- and medium-
sized companies (SMEs) across all industries. The Amadeus database is created by collecting
standardized data received from 50 vendors across Europe. The local source for this data is
generally the office of the Registrar of Companies.
The Amadeus database includes firm-level accounting data in standardized financial
format for 22 balance sheet items, 22 income statement items and 21 financial ratios.8 The
accounts are transformed into a universal format to enhance comparison across countries.
Although EU harmonization in accounting standards and practices has improved the
comparability of accounting formats across countries in Europe, differences in accounting
practices remain and these transformed accounts should therefore be interpreted with the
necessary caution. We use IMF-IFS period average exchange rates to convert all accounting data
into U.S. dollars.
In addition to financial information, Amadeus also provides other firm-level information.
First, we use information on the year of incorporation to calculate the age of the firm. Second, we
use firm-level employment to calculate the contribution of new and small firms to employment
creation. Third, Amadeus includes the national industry code and assigns companies a 3-digit
NACE code – the European standard of industry classification – which we use to classify firms
and construct industry dummy variables.9 In our analysis, we use NACE codes at a 2-digit level
so that we have a sufficient number of firms per industry.
1.2 Sample selection
8 The coverage of these specific items varies across countries. For example, many firms in Latvia and Russia have turnover variables missing and most firms in Slovenia and Croatia only report total liabilities and do not include a breakdown of their debt structures. 9 The NACE codes follow the NACE Revision 1 classification.

9
We use the 2001 edition of Amadeus and limit our sample to the years 1998 and 1999.10
There are two reasons to limit our analysis thus. First, there is the potential problem of
survivorship: As companies exit or stop reporting their financial statements, Amadeus puts a "not
available/missing" for 4 years following the last included filing. Firms are not removed from the
database unless there is no reporting for at least 5 years (i.e. 1997 or earlier). So the data for firms
from 1997 as reported in the 2001 database will not include firms that exited in 1997 or before.
To avoid this potential survivorship bias, we restrict our attention to 1998 and 1999. A second
reason is that efforts were made in 1998 to expand the coverage for Central and Eastern European
countries allowing us to include more countries, but making the prior data less comparable.11
As shown in Table 1, Column 1, we start with a sample in Amadeus of about 3 million
annual observations over the years 1998-1999. We then impose a number of restrictions on the
data. First, we require reporting firms to have some basic accounting information in their
accounts over the years (i.e., data on total assets, sales, profit before tax, or employment). The
reason for dropping those that do not report is that there may be country differences in the criteria
for including firms with no information on their accounts. In addition, this criterion excludes any
“phantom” firms established for tax or other purposes.
Next we delete from our sample firms that report only consolidated statements. For most
firms in Amadeus, unconsolidated statements are reported and consolidated statements are
provided when available.12 We use unconsolidated financial statements to avoid double-counting
firms and subsidiaries. Using unconsolidated statements has the additional advantage that we can
focus on the local operations of firms and not overestimate local employment figures. For
example, the consolidated statements of a European multinational include operations abroad and
10 Due to lags in data collection, the coverage for the year 2000 is incomplete. 11 For example, the coverage of Central and Eastern European firms increased by 16% from 1997 to 1998, but less than 5%, on average, for the following 2 years. 12 Although the small number of deleted firms does not creates a significant bias in entry rates based on total number of corporations, this may create some bias in the total employment figures, since consolidated firms tend to be larger. However, some employment may already be included by other group firms in the sample with unconsolidated statements.
10
the employment figures refer to worldwide employment. Our use of unconsolidated statements
also helps comparability because not all European countries require consolidation of accounts for
all firms.
We also exclude certain industries. First, we drop several primary industries where the
activity is country-specific (e.g., not all countries have uranium mines). These industries include
Agriculture (NACE code 1), Forestry (NACE code 2), Fishing (NACE code 5), and Mining
(NACE codes 10-14). We also exclude utilities (NACE codes 40-41) that tend to be regulated and
largely state-owned industries in Europe.13 We also drop the financial services industries (NACE
codes 65 and 66) because financial ratios for financial companies are not comparable to those of
non-financial companies. In addition, financial institutions tend to be subject to specific entry
restrictions, (e.g. initial capital requirements) that do not apply to nonfinancial firms.14 Finally,
we drop the government/public sector, education (mainly public sector in Europe), health and
social sector, activities of organizations, private households, extra-territorial organizations, and
firms that cannot be classified (NACE codes 75, 80, 85, 91, 92, 95, and 99).15 We also exclude,
by country, any industries with less then three firms (although we check whether such an
exclusion affects our results qualitatively). We are left with 47 NACE industries, which is the
maximum number of observations per country.
Finally, we exclude all legal forms other than the equivalent of public and private limited
liability corporations.16 In particular, we exclude proprietorships and partnerships. Two
arguments prompt this. First, a big and common carrot behind registration as corporations is
limited liability, which allows entrepreneurs and investors to take risks. By contrast, the benefits
13 We also drop the recycling industry (NACE code 37), which is difficult to match with a comparable SIC code(s). 14 See Caprio, Barth, and Levine (2004) for a discussion of financial sector regulations across countries. 15 For robustness, we exclude additional industries that may be state-controlled, such as all mining activities. 16 We include Plc and Ltd in the UK, AG and GmbH in Germany, and SA and SARL in France and exclude the GmbH & Co KG, which is a hybrid legal form (a combination of a partnership and a private limited company) used in Austria and Germany.

11
of registration as other forms may vary considerably across countries, which will make the
analysis less easy to interpret.17 Second, the coverage of proprietorships and other unincorporated
firms in Amadeus is poor and uneven: in most European countries only limited liability
companies are required to file statements. However, most European countries require all
corporations to file financial statements, therefore, the coverage for corporations is extensive and
the best available. We use the information on legal form in Amadeus – which is country-specific
– to identify public and private limited companies (see Annex 4 for legal definitions, by country).
We exclude from our sample several European countries where the coverage is
incomplete or the data quality is poor. In Annex 2, we summarize the cross-country differences in
the collection of company accounts in Amadeus. First, we exclude Switzerland, since small firms
are not required to file. Second, we exclude the countries of the former Republic of Yugoslavia
(Bosnia-Herzegovina, Croatia, Former Yugoslav Republic of Macedonia, and Federal Republic
of Yugoslavia), which were at war during our sample period and where data coverage is limited.
Third, we exclude Slovakia, Slovenia, Russia and the Ukraine, which have only a very small
number of total filings (i.e. less than 1,000 firms annually).
As shown in Table 1, Column 2, after applying these exclusion criteria, we have a
smaller, comprehensive sample of incorporated firms in a large number of European countries,
which enhances comparability across countries.18 Our sample now has over 3 million annual
firms and 57 million employees.
We are not done yet. We have national statistics from Eurostat (2003) on numbers of, and
employment in, firms of different sizes. In Table 2, we compare the ratio of firms and
employment in Amadeus and in published national statistics in Eurostat (2003).19 Columns 1 and
2 show the coverage in Amadeus of large firms (the ratio of firms and employment at firms with
17 For example, Fan and White (2003) use data on small businesses in the United States to show that personal liability negatively affects the level of entrepreneurial activity and the decision to incorporate. 18 These restrictions exclude 342,216 firms over 2 years (9.8% of total firms). 19 Data, by firm size, is unavailable for non-EU countries. This data will be updated to compare EU corporations when the data becomes available in 2004.

12
more than 250 employees in Amadeus versus that in national statistics) and Columns 3 and 4
show the coverage of small firms (the ratio of firms and employment at firms with 10-50
employees in Amadeus versus that in national statistics). Column 5 shows the absolute value of
the difference between the ratio of employment in small firms to the ratio of employment in large
firms in Amadeus less the ratio of employment at small and large firms in national statistics. This
ratio is used to test whether our Amadeus sample is biased towards larger firms.20
We exclude a country from our dataset if two conditions are met: (1) if the ratio of
employment in firms with more than 250 employees in Amadeus to that in national statistics
(Column 2) is less than 50%, and (2) if the absolute difference between the ratios in Amadeus and
national statistics of employment in firms with 10-50 employees to employment in firms with
greater than 250 employees (Column 5) is more than 25%. Four countries do not meet the
criteria: Iceland, Ireland, Luxembourg and Portugal. Since these cutoffs may be considered
somewhat arbitrary, we also test if the qualitative results hold if we do not apply these criteria.
We believe that our inclusion criteria create the most comparable sample of firms across
countries, but we should be cautious about deriving strong conclusions from direct cross-country
comparisons. However, even if we have not eliminated all biases between countries, our basic test
examines within-country differences across countries, and will not be affected unless there are
systematic biases in reporting industries within a country. Our final sample includes 3,371,073
firms in 21 countries: Austria, Belgium, Bulgaria, the Czech Republic, Denmark, Estonia,
Finland, France, Germany, Greece, Hungary, Italy, Latvia, Lithuania, the Netherlands, Norway,
Poland, Romania, Spain, Sweden, and the United Kingdom.
1.3 Industry-level entry variables
We measure entry in a variety of different ways, both for all new firms and by size
groups. We define a new firm as a firm that has age 1 or 2 and an old firm as a firm that has age
20 The discrepancy between Amadeus and national figures may also be explained by: (1) that for a significant number of firms in Amadeus, we do not have data on employment and (2) that for the purpose of cross-country comparisons, our Amadeus dataset excludes only proprietorships and partnerships.
13
greater than 2. 21 Our analysis focuses on the contribution of new firms to the total number of
firms and to employment creation, measured as (1) the percentage of new firms and (2) the
percentage of employment at new firms. Our employment ratio should be used cautiously,
however, since 38% of total firms do not report employment.22 We calculate entry rates at the 2-
digit NACE industry level averaged over the years 1998 and 1999.23 We refer to this variable as
Entry.24
We require firms to survive at least one year and exclude firms in year 0. We exclude
firms less than 1 year to avoid frivolous filings and because of the difference in initial filing
requirements across countries.25 In particular, in some countries firms in their first year do not
have to file accounting information until after the end of their first year of operation, while in
others they have up to 1 year to file. We check that the results are not qualitatively affected by
including firms of age less than 1 as new firms.
In Table 3, we describe the country averages of the entry variables that we use in our
analysis. We calculate entry and new firm employment rates for (1) all firms and (2) firms with
more than 10 employees. Our data for firms with greater than 10 employees are less
comprehensive since employment (which we need to classify firms) is missing for about 38% of
observations in our sample. As shown in Column 1, the average entry rate across industries and
countries is about 13.3% (or 9.2% when excluding small firms). Since we define new firms as 2
years or younger, this is calculated over two years, on average, and corresponds to an average
annual entry rate of about 6.6% (or 4.6% when excluding small firms). We find large variations
in the share of new firms across countries, varying from a high entry rate of 19.2% in Lithuania to
a low entry rate of 3.5% in Italy. Overall, we find an average of about 15.7% of new firms in
21 Our empirical results are robust to defining new firms as age equal to one. 22 However, employment data in the UK is missing for over 85% of firms. For this reason we check that all econometric tests that use employment cut-offs are robust to the exclusion of UK data. 23 Our empirical results are robust to using entry rates calculated for one year (1998 or 1999) only. 24 For a complete list of variable names and definitions, see Appendix 1. 25 However, this does not affect our results. The median share of firms with age 0 over the period 1998-99 is 2.5 percent.
14
Eastern European countries, as compared to 11.9% for Western European countries. This
difference reflects the recent emergence of a large number of private firms in the transition
economies.
Djankov et al. (2002) have data on the procedures that are officially required for an
entrepreneur to obtain all necessary permits, and to notify and file with all requisite authorities, in
order to legally operate a business. These data refer to 1999. These procedures include (i)
obtaining all the necessary permits and licenses, and (ii) completing all the required inscriptions,
verifications and notifications to enable the company to start operation. To make the procedures
and companies comparable across countries, the survey assumes that the company is a limited
liability company, i.e., a corporation, and the founders complete all procedures themselves
(without intermediaries). This means the entry barriers are likely to be more onerous for small
firms where this is likely to be true. We report in Table 3 column 5 the direct costs of setting up a
new business expressed as a percentage of per capita GNP in US dollars. We find large variations
in the cost of entry, varying from a high cost of 86 percent of GNP per capita in Hungary to a low
cost of 1 percent of GNP per capita in Finland and the UK.
In Table 4, we present entry rates by country and a selection of industries based on
groupings of 2-digit NACE codes. The highest entry rates are in communications (telephone,
wireless, etc.), computer services, and services, and the lowest entry into the manufacturing of
chemicals, construction, and transportation. The industries with high entry rates are generally
those related to the high-tech sector, which experienced global growth over the late 1990s.
Industries with lower entry rates are those that similarly faced a global decline in the late 1990s
(construction) as well as traditionally more concentrated industries (such as transportation).
As a comparison, we calculate 1-year entry rates in the United States from the Dun and
Bradstreet (D&B) database of over 7 million corporations. We consider D&B statistics over
1998-99 for corporations and U.S. employment only (instead of total employees internationally),
for better comparison to the Amadeus data. We refer to this variable as EntryUS. Table 4 presents
15
U.S. entry rates (EntryUS) for broad groupings of NACE codes.26 Annex 3 shows U.S. entry rates
for all 2-digit NACE codes. In comparing the Dun and Bradstreet data to our 1-year European
entry rates, we find in the U.S. similar high entry rates in the computer and communications
industries and low entry rates in industries such as mining, and water utilities. In general, we see
higher entry rates in high-tech sector and lower entry rates in infrastructure related sectors.
In Table 5, we examine the size (measured by number of employees) distribution of
entering firms, averaged over 1998 and 1999. The data confirm that most of the entry occurs in
small firms. Interestingly, we find a greater fraction of new, larger firms in the Eastern European
transition countries. This suggests that new, private firms are emerging across all size groups,
rather than only small firms that require time to grow. This may also reflect a number of larger,
state-owned firms that continue to be privatized and reincorporated following the transition.27 On
average, we find that about 63% of new firms have less than 10 employees, 23% have 10-50
employees, 12% have 50-250 employees and 2% have more than 250 employees. Since new
firms in this largest category are likely to be existing firms that reincorporate following a merger
or acquisition, we check that our qualitative results hold when we exclude new firms with more
than 250 employees.
II. Methodology
We explore the differential effects of certain country characteristics on entry across
industries with different natural demands for that characteristic. In other words, we are interested
in the interaction between country and industry-specific variables. We use industry indicators to
control for level differences across industries and country indicators to control for level
differences across countries. The model is as follows:
26 We use the International Concordance between the U.S. 1987 SIC and the NACE Rev. 1 industrial classifications to match the 4-digit level SIC codes used by D&B with the 2-digit level NACE codes used in Amadeus. 27 An exception to the transition countries is Romania, which includes over 200,000 firms with less than 10 employees.
16
kj,
kj
kj,
k
jkj
sticcharacteri CountrysticcharacteriIndustry
hareIndustry s dummiesCountry
dummiesIndustry ConstantEntry
εφφ
+
⋅⋅+
⋅+⋅Φ+
⋅Φ+=
)(4
3
2
1,
(1)
where a subscript j indicates industry j, a subscript k indicates country k, and uppercase
coefficients indicate vectors. The dependent variable is the ratio of new firms to total firms of
industry j in country k. We will explore several alternative definitions of what constitutes new
firms. The industry indicators correct for industry-specific effects. Similarly, the country
indicators correct for country-specific variables.28 The industry j share of total sales in country k
captures an industry-specific convergence effect: we correct for the possibility that sectors that
are large relative to the rest of the economy experience lower entry rates.29 Finally, kj ,ε is an
error term with the usual distributional assumptions. The focus is on the interaction term and its
coefficient 4φ .
The critical aspect, of course, is the country characteristic and the industry characteristic.
The country characteristic we focus on is the cost of fulfilling the bureaucratic requirements to
register a company. Costly entry regulations will make it more difficult for new firms to enter.
Djankov et al. (2002) calculate the direct costs associated with starting-up a business as a
percentage of per capita GNP in 1999. Following their work, we term the log of this variable
EntCost.30
28 One of the omitted variables that may explain cross-country variation in incorporation rates is differences in the tax regimes and tax treatments of corporations. In many countries, limited companies are set up for tax purposes rather than entrepreneurial activities. If this taxation difference varies across countries, this would create a hard to quantify bias. The country indicators, however, control for such differences across countries. 29 We get similar results when we use value added rather than sales as a measure of relative industry size, but prefer to use sales as a measure of size because value added figures are missing for several industries in a number of countries. 30 We use the log of the entry cost variable (which takes values of between zero and 1 because it is expressed in percentage terms of per capita GNP) so that in absolute terms higher costs are associated with lower values.

17
The industry characteristic we use stems from the methodology used by Rajan and
Zingales (1998). We would expect industries that naturally have low entry barriers to be most
affected by regulations on entry. We therefore need to know what entry would look like if there
were few artificial or infrastructural barriers to entry – not just bureaucratic barriers but also other
potential barriers like rigid labor regulation or poor access to financing. Under the assumption
that these barriers are low in the United States (for instance, entry costs in the U.S. are 0.5 percent
of per capita GNP relative to an average of 20 percent of per capita GNP in our sample of
European countries), we would expect the rate of entry in an industry in the United States to be a
good proxy for the “natural” propensity for entry in that industry – reflecting technological
barriers in that industry like economies of scale or incumbent organizational efficiencies obtained
from experience. Of course, there is a degree of heroism in assuming that entry in the United
States does not suffer from artificial barriers (or even in assuming that there is a clear distinction
between natural and artificial barriers). Nevertheless, all that is important for us is that the rank
ordering of entry in the United States corresponds to the rank ordering of natural barriers across
industries, and this rank ordering carries over to other countries.
As a measure of industry share, we use the Amadeus database to construct the fraction of
the industry’s sales in total sales of firms in the country. We refer to this variable as Industry
Share. We use the average of this variable for the years 1998-1999. We calculate this country-
industry level variable for 2-digit NACE industries using data in Amadeus. These industry shares
in total sales are expected to capture a potential convergence effect.
In the basic regression then, EntCost is our country characteristic and EntryUS is the
industry characteristic indicating whether the industry has “naturally high entry”. If as
hypothesized, bureaucratic entry requirements do have effect, they should particularly impede
entry in industries that are naturally prone to entry (or seen another way, entry into an industry
18
that is a natural monopoly should be little affected by the existence of bureaucratic entry barriers).
So we expect coefficient 4φ to be negative.
III. Results
3.1 The Basic Regression and Permutations
In Table 6A, column (i) we present the basic regression, estimated using a Tobit
regression with censoring at 0 and 1. The coefficient of the interaction term is negative and
significant at the 1 percent level. Since we take the log of entry cost, which takes values between
zero and one, lower entry costs result in a more negative value for our entry cost variable.
Together with the negative coefficient on the interaction term, this means that we find that
relative entry into industries with high entry in the U.S. is disproportionally higher in countries
with low entry costs.
Since this is a difference in difference estimate, it is worth pointing out what the
coefficient means. Take an industry like retail trade (NACE code 52) that is at the 75th percentile
of EntryUS and an industry like manufacturing of pulp, paper, and paper products (NACE code
21) that is at the 25th percentile of EntryUS. The coefficient estimate suggests that the difference in
entry rates between retail and pulp in the Czech Republic (that is at the 25th percentile in terms of
EntCost with entry costs equal to 8 percent of per capita GNP) is 0.5 percentage points higher
than the difference in entry rates between the same industries in Italy (that is at the 75th percentile
in terms of EntCost with entry costs equal to 20 percent of per capita GNP). In other words,
moving from Italy to the Czech Republic benefits the high entry retail sector relatively more. As
a comparison, the mean difference in entry rates between the retail and pulp industries across
countries is 5.0 percent. This suggests that the effect of regulatory entry barriers accounts for
about 10 percent of the mean difference.

19
In column (ii) we use as an alternative entry regulation variable the logarithm of the
number of procedures required to set up a business from Djankov et al. (2002).31 Our results are
robust. We find higher entry rates into industries with high entry in the U.S. in countries with
fewer entry procedures. The coefficient estimate suggests that the difference in entry rates
between retail and pulp in Sweden (that is at the 25th percentile in terms of the number of entry
procedures) is 0.8 percentage points higher than the difference in entry rates between the same
industries in Spain (that is at the 75th percentile in terms of the number of entry procedures). In
column (iii) we include the monetized value of the entrepreneur’s time to set up a business in the
cost of entry. We obtain this variable from Djankov et al. (2002). The results are robust to using
this alternative measure of the cost of entry regulation.
Next, we estimate using different samples. In column (iv), we exclude transition
countries. Privatization has resulted in the emergence of a large number of private firms in these
economies, and we want to make sure our results are not driven by this. Our results are robust to
the exclusion of these countries. Our results are also robust to adding back those countries that
failed to meet our inclusion criteria (i.e., Iceland, Ireland, Luxembourg and Portugal), and to
dropping one country at a time (not reported).
In column (v) we present estimates restricting the sample to firms with over 10
employees. Since many firms that include information on age and sector are missing
employment (and financial data), we exclude industries where more than 50% of firms have
missing employment data (about 13% of observations). With the caution that employment
coverage is limited, we find that the coefficient for the interaction term is negative and
statistically significant
Next, we try different methods of estimating. In column (vi), we estimate an OLS
regression rather than Tobit. In column (vii) we estimate our regression using weighted least
squares (WLS) with the logarithm of the number of corporations, by industry and country, as our 31 The maximum value of number of entry procedures in the sample is 16, for Italy and Romania.

20
weights. We expect our entry rates to be more precisely estimated for industries with a larger
number of firms. In both estimations the size of the interaction coefficient remains significant.
Finally, we consider different measures of entry. In column (viii) the dependent variable
is the fraction of employment in new firms rather than the ratio of the number of new firms to the
total. This is calculated as the number of employees at new firms divided by total employment.
We exclude industries where more than 50% of firms have missing employment data and large
new firms (with more than 250 employees), which are likely to be mergers or spin-offs of
existing firms. We find a negative, but insignificant, coefficient estimate on the interaction term.32
Since entry barriers are more likely to bind for small firms, we should expect a weakening of the
basic result here.
3.2. Robustness to outliers
Our estimation strategy can be thought of as a difference-in-difference estimation, where
we divide the countries into two groups: High entry regulation (HR) and low entry regulation
(LR), and the industries into two groups: High entry (HE) and Low entry (LE). If we abstract
away from any control variables, our estimate is: [HE(HR) – LE(HR)] – [HE(LR) – LE(LR)].
This estimate captures the average effect only. For robustness, we employ a similar non-
parametric difference-in-difference estimation strategy to investigate whether the effect is
generally present in all countries and industries.33
We first divide the countries into HR and LR, and then rank the industries from the
lowest natural entry to the highest. Next, we pick the lowest natural entry industry (LWE) as our
reference industry, and repeat the difference-in-difference estimation above for each remaining
industry J, i.e., we compute: [J(HR) – LWE(HR)] – [(J(LR) – LWE(LR)], for each industry J. In
Figure 1 we plot the result against the ordered industries.
32 We also find an insignificant and negative coefficient if we include firms with more than 250 employees. 33 We thank Atif Mian for this suggestion.
21
The effect is strongest for the computer and related activities (NACE 72) and post and
telecommunications (NACE 64) industries. We also find that, on average, the effect is larger (i.e.,
DD is more negative) for industries with higher natural entry (as indicated by the plotted
regression line in Figure 1), but the effect is not linear across countries (not all observations are
on the regression line).
Next, we repeat the exercise for countries, i.e., we divide industries into low entry (LE)
and high entry (HE), and order countries from Lowest to Highest entry regulation. In figure 2, we
plot the result against the ordered countries. Again, we find that the average effect is consistent
with our main results, although the effect is not present in all countries. The effect is strongest for
Norway and the United Kingdom. What is reassuring is that no industry or country appear to be
driving the results.
3.3. Alternative Measures
In Table 6B we examine alternatives to U.S. entry rates as measures of the natural
propensity to enter. In columns (i-ii) we use other measures of mobility. We calculate ExitUS,
which is the share of firms that exit in the U.S. Dun and Bradstreet data. It is calculated as the
number of firms that exited in year t (because of closure or acquisition) as a percentage of all
firms in year t-1. This measure is averaged for the industry over the period 1998-99. Prior
literature (Dunne et al. 1988) finds that exit rates and entry rates are strongly correlated – the
more there is creation through young firms, the more destruction there also is. So ExitUS should
serve as a proxy for “natural entry” and when we replace EntryUS with it in the regression, the
interaction has the appropriate negative sign and is significant.
In column (ii) we also use the Dunn and Bradstreet data to calculate SME, the ratio of
Small and Medium Enterprises (SMEs), which we define as businesses with less than 250
employees. Since new firms are generally also small, we expect greater entry into industries with
larger shares of smaller firms. Indeed, we find a significantly negative coefficient, suggesting
that higher entry costs discourage entry to industries with larger shares of SMEs.

22
In columns (iii-iv) we use measures of market size, by 2-digit NACE industry and
country. We use the Compustat data of U.S. listed firms to calculate SCALE as the log of
median total assets and SIZE as the log of median total sales. Total assets and sales take values
less than 1 (they are divided by 10 billion US dollars) so that the log is a negative number, and
more negative values denote smaller sized industries. Since entry costs are more negative when
low, the positive coefficient indicates smaller scale/size industries have relatively more entry in
low entry cost countries.
Columns (v-vi) use Compustat data on U.S. firms to calculate measures of concentration.
In column (v) we calculate the share of total sales in the largest 4 firms (as measured by total
sales) by 2-digit NACE code and country, and in column (vi) we calculate the Herfindahl-
Hirschman measure of industry concentration. We test the null hypothesis that since entry should
be higher in less concentrated industries, a positive coefficient suggests that if entry costs are
high, entry should be lower in industries with less concentration. For both measures of
concentration, we find positive but statistically insignificant coefficients. One explanation is that
industries dominated by a few large firms may have substantial entry. For example, although the
car manufacturing sector is dominated by a few international firms, there are many small and new
firms that provide intermediate goods.
3.4 The Consequences of Preventing Free Entry
Thus far, we have focused on how bureaucratic entry regulations differentially affect
entry. This does indicate that these bureaucratic rules work as intended but it does not help us
distinguish between the views that these entry barriers are socially harmful and that they are
socially beneficial. If these entry barriers screen appropriately as in the view that they are framed
in the public interest, we should find that incumbent older firms in naturally high entry industries
should grow relatively faster (than similar industries in countries with low entry barriers) because
efficient ex ante bureaucratic screening takes the place of growth-retarding wasteful competitive
23
destruction. These industries should account for a relatively larger share of the economy. An
opposite finding would be more consistent with the private interest view.
In Table 7, we examine the effect of entry regulation on the relative performance and
share of incumbent or established firms, defined as all firms with age more than 2 (i.e., we
exclude new firms though we get similar results if we include them). We use the growth in value
added per employee as a measure of firm performance and the industry’s share in value added as
our measure of industry size. To reduce the influence of outliers, the dependent variable in the
regressions in this table are censored.
In columns (i-iv), we show Tobit estimations where the dependent variable is the Real
Growth in Value Added per employee over the period 1998-99 averaged over all incumbent firms
in the industry in a country. Value added is computed as Earnings before interest, taxes,
depreciation and amortization, plus labor costs. In column (i), the negative significant coefficient
estimate on the interaction variable indicates that incumbent firms in naturally high entry
industries have relatively less growth in value added when they are in a country with high entry
regulations.
Again, it is worth pointing out what the coefficient means by comparing the retail trade
industry that is at the 75th percentile of EntryUS and the pulp and paper manufacturing industry
that is at the 25th percentile of EntryUS. The coefficient estimate suggests that the difference in real
growth rates between retail and pulp in the Czech Republic (that is at the 25th percentile in terms
of EntCost) is 0.7 percentage points higher than the difference in real growth rates between the
same industries in Italy (that is at the 75th percentile in terms of EntCost). In other words, moving
from Italy to the Czech Republic benefits the growth rate of the high entry retail sector relatively
more. Since the average real growth rate is 1.0 percent, this is a sizeable magnitude.
We also include other measures of firm entry. Column (ii) shows that our results are
robust to the substitution of entry rates with the percentage of SMEs, defined as firms with less
than 250 employees. Columns (iii-iv) show a significant effect of the interaction of market size

24
and entry costs. Columns (v-viii) show that our results are robust to including legal origins in La
Porta, et al. (1998) as an instrument for entry regulation.
Finally, in column (ix), the dependent variable is the share of incumbent firms in the
industry in overall value added for the country in 1999. We find a negative coefficient estimate,
but the effect is not statistically significant. One possible explanation is that entry barriers persist
in countries where high-entry industries are large and thus have the political power to lobby for
the barriers. When this is set against the fact that the barriers retard growth in these industries, we
may find an insignificant coefficient of the interaction on average industry share.
Taken together, these results suggest that entry regulations seem to adversely affect the
growth (and to a lesser extent the size) of those industries that might be presumed to most benefit
by the added selectivity that such regulation might bring. This strongly suggests that such
regulations are not intended in the public interest.
3.5 Selection Issues
The last findings, however, suggest potential selection problems. One way to test the
direction of causality is to use instruments. It has been generally found that the origin of a
country’s legal system seems to be strongly associated with the regulatory system in place today
(see, for example, La Porta et al. (1999)). While there has been some debate about the precise
mechanism by which this association exists, a country’s legal origin offers a proxy for
predetermined components of regulation. When we instrument entry regulation with legal origin,
we find that the coefficient estimate for the interaction term is highly significant, the same sign
and approximately the same magnitude as shown earlier in Tables 6 and 6A (see Table 8 column
(i-v)).34
A second concern is that countries with more untrustworthy populations may erect higher
bureaucratic barriers so as to screen would be entrepreneurs more carefully. If this were true,
34 The legal origin variables explain 59 percent of the variation in the entry cost variable. Entry costs tend to be lowest in countries with Anglo-Saxon and Scandinavian legal origin and highest in countries with French legal origin.
25
bureaucratic barriers might affect entry, and might cause incumbents to become fat and lazy, but
this is necessary because the alternative of unrestricted entry by charlatans would be much worse.
This question is partly addressed by the instrumental variable regression above. Another
way to address it is to check if indeed the underlying population results in differential selection.
More developed countries have better developed information systems, better product inspections
and quality control, better contract and law enforcement, and consequently, an entrepreneurial
population less subject to misbehavior.35 If bureaucratic rules were meant to screen entry
efficiently, we should expect them to be particularly effective in low-income countries relative to
high-income countries. In Table 8 column (vii) we estimate different slopes for the interaction
variable for whether the industry is in an above-sample-median per capita income country or
below sample-median per capita income country. If, in fact, entry regulations screened more
effectively in low income countries where there is less alternative infrastructure to assure
compliance, we should find the coefficient estimate for the interaction in below-sample-median
income countries to be significantly more negative. It is not.36
Similarly we find that entry barriers work most effectively in preventing entry in low
corruption countries rather than in high corruption countries (Table 8, column (viii)), suggesting
their purpose cannot be to select amongst an untrustworthy population. This finding is interesting
in its own right for it suggests that while the purpose of entry barriers in corrupt countries may
well be to extract bribes and not so much to prevent entry, their purpose in less corrupt countries
may indeed be to protect incumbents.
Taken together, these results suggest that the regulation of entry cannot be attributed to
benign neglect or to the prevailing untrustworthiness of the private sector in a country – it seems
purposeful and probably intended to protect inefficient incumbent firms.
35 The underlying population in richer countries may also be socialized to be more honest (less adverse selection) but all we need is that the richer infrastructure gives them more incentive to behave, so there is less need for screening. 36 When allowing for different slopes for transition versus non-transition countries, we find a stronger effect for non-transition countries, i.e., for countries where we expect a stronger legal system etc. (not shown).
26
3.6 Other Regulations and the Business Environment
We have focused on the regulation of entry. There are, however, other regulations and
aspects of the business environment that might affect entry. Let us consider some in this sub
section.
3.6.1. Labor regulation
First consider labor market regulation, specifically laws that prevent a firm from firing
employees. This could cut both ways. One could argue that strict labor regulations protect
employees and give them the confidence to join small, untested firms (much in the way that good
corporate governance offers investors confidence), thus reducing start up costs. There may be
other forces at work in the same direction. Regulations may hamper the growth of large
incumbent firms, whose adherence to regulations is more easily monitored, thus creating the
space for new firms to enter. However, one could argue for the opposite effect of labor
regulations on entry: the cost of compliance with regulations may have fixed components, which
make them particularly costly for small businesses to meet, and could inhibit entry. Small firms
may not be able to afford to keep their employees through downturns, and thus might under hire
in the face of strict labor regulations.
We use a measure of firing costs obtained from Nicoletta et al. (2000) that captures the
costs of individual dismissals of employees with regular contracts. The measure is calculated
using factor analysis of original data collected by the OECD (1999) and ranges from 0 to 6, with
a higher score indicating a higher cost. The data refer to 1998. We refer to this index as the cost
of dismissals, or LabCost. Unfortunately we do not have this measure for all firms in our sample,
so we also use a more general index from Botero et al. (2003), which indicates the strictness of
labor regulations in the country in 1997. This index, the Employment laws index, was constructed
by examining the detailed provisions in the labor laws regarding alternative employment
contracts, conditions of employment, and job security. The index takes values between 0 and 3,

27
with higher values implying that regulation is more protective of a worker. We refer to this index
as EmpLaw.
Following our methodology, we need to find an industry characteristic that would make
an industry most susceptible to labor regulation. We would expect labor regulations to impinge
the most on industries that are most labor intensive. We calculate Labor Intensity, LabInt, from
US data. It is the industry median over all Compustat firms in that industry of the number of
employees divided by the amount of fixed assets (in millions of dollars), and is calculated over all
firm-years in the 1998-99.37 A higher score indicates higher labor intensity.38
We report summary statistics and correlations for industry and country level variables in
Table 9 and regression estimates in Table 10. In Table 10, column (i) the country variable is the
OECD measure of the cost of dismissal. The interaction coefficient is negative and significant. In
column (ii), it is the more widely available but more general index from Botero et al. (2003). The
coefficient estimate remains negative and significant. Note that the Botero et al. index is a more
general measure of labor protection that in addition to the ability to dismiss workers (job security)
includes other aspects of labor protection, such as alternative employment contracts and
conditions of employment. We conclude that there is strong evidence that labor protection
hampers entry in labor intensive industries.
3.6.2 Regulations Protecting Property
Lest the reader believe that we are on our way to advocating some sort of anarchical
environment as being best for entry, consider regulations protecting property rights and protecting
investors (another form of property protection). First, consider intellectual property.
Strong patent protection could dissuade entry because it protects incumbents and forces
new entrants to carve a wide path around existing intellectual property. On the other hand, new
entrants do not have the organizational structure, finance, or intellectual capital to create a
37 The number of employees (in thousands) is measured using Compustat item 29. 38 We have explored the use of other measures of labor intensity such as employees over total assets and get similar results.

28
significant first mover advantage and thus dissuade potential imitators. As a result, they might
have a greater incentive to do research if they know their research will be protected legally.
Following the now familiar method, our country level variable is Intellectual Property
Rights, IntProp, which is a measure of the protection of intellectual property in a country. This
variable is estimated by the World Economic Forum (2002) and was used previously by
Claessens and Laeven (2003).
The industry variable measured from U.S. data, R&D, is a measure of dependence on
research and development and equals the industry-level median of the ratio of research and
development expenses to sales for Compustat firms in the same industry over the period 1990-
99.39 The numerator and denominator are summed over all years for each firm before dividing.
In Table 10 column (iii), we report regression estimates. The interaction variable is
positive and significant suggesting there is more entry in R&D intensive industries in countries
that protect intellectual property better. We find similar results when using a more general index
of property rights from the Economic Freedom Index constructed by the Heritage Foundation (not
shown).
3.6.3 Access to Finance
Let us turn next to access to finance. Evans and Jovanovic (1989) show theoretically that
wealth constraints affect entrepreneurship, e.g., liquidity constraints hinder people from starting
businesses. This suggests that entry rates should be lower in countries with less developed
financial systems.40 In fact, Rajan and Zingales (2003a) suggest the absence of regulations
protecting investors could be a very effective barrier to new firm creation.
As our country measure, we use FinDev, which proxies for the depth of financial
markets, and indirectly captures the regulations that promote financial development. We use the
sum of two measures: First, as a measure of banking development we include the ratio of
39 We measure R&D using Compustat item 46, and sales using Compustat item 12. 40 Rajan and Zingales (1998) find that there are more new establishments in industrial sectors with greater external financing needs in more developed financial systems.

29
domestic credit to the private sector to GDP from the International Monetary Fund’s International
Financial Statistics (IMF-IFS). Second, as a proxy for capital market development we use the
ratio of stock market capitalization to GDP from the World Bank Development Indicators (WDI).
Since the stock of credit and market capitalization only indirectly captures the effect of investor
protection, as an alternative direct measure we use the Accounting Standards, AccStan, in a
country. This is available for only a subset of countries in our data set and measures the number
of items disclosed by the largest corporations in a country (see La Porta et al. (1998) for details).
For the industry variable, External Financial Dependence, ExtFin, is a measure of
dependence on external finance and equals the industry-level median of the ratio of capital
expenditures minus cash flow over capital expenditures. The numerator and denominator are
summed over all years for each firm before dividing. This variable measures the portion of
capital expenditures not financed by internally generated cash. Cash flow is defined as the sum
of funds from operations, decreases in inventories, decreases in receivables, and increases in
payables. Capital expenditures include net acquisitions of fixed assets.41
In Table 10 columns (iv) and (v) we find as predicted that entry is higher in more
financially intensive industries in countries that have higher financial development. We find
similar results when using private credit to GDP or stock market development individually as
measure of financial development (not shown).42
3.6.4 Human Capital
Next, while we have just examined the effects of access to capital, one might also
consider access to specialized human capital. In industries that need skilled human capital, there 41 Cash flow is calculated using Compustat item 110, if available, and otherwise by the sum of Compustat items 123, 125, 126, 106, 213, and 217, plus the change in working capital (the sum of Compustat items 302, 303, and 304). Capital expenditure is calculated as the sum of Compustat items 128 (capital expenditure) and 129 (net acquisitions). 42 For robustness, we replace FinDev with Trade Credit, the average ratio of accounts payable to total assets. We find that industries with higher dependence on trade credit financing exhibit higher entry rates in countries with relatively weak financial institutions. This finding is similar to Fisman and Love (2003) who use a similar methodology, but a different dataset for a larger number of countries, and find that industries with higher dependence on trade credit financing exhibit higher growth rates in countries with relatively weak financial institutions.

30
may be two ways of creating it. The first could be to train unskilled personnel in house. The
second is to give them better general education so that they can be trained up quickly. Incumbent
firms may have an advantage if much of the training has to be done in-house, while new entrants
are better off if there is a wide pool of well-educated labor that can be brought up to speed
quickly without prolonged on-the-job training. This implies that entry should be higher in
industries that require high skills in countries with a better-educated work force.
As our country variable, we use Edu, which measures the average schooling years in the
total population of age 25 and above, and captures the regulations that promote education. We
use data for the year 1995 from Barro and Lee (2000), which is an update of the data and
methodology developed in Barro and Lee (1996).
As our industry variable, we include a measure of hourly US wage rates as a proxy for
the required skill level in the industry. Wage is obtained from the Occupational Employment
Statistics (OES) Survey, Bureau of Labor Statistics, U.S. Department of Labor. This survey
covers over 130 million employees in the U.S., and therefore includes employees at both small
and large firms. The wage rates are collected at the 3-digit SIC level and we convert them at the
2-digit NACE code level. In Table 10 column (vi), we find that entry is indeed higher in high
wage industries in countries that have a better educated work force, although the effect is not
statistically significant.
Finally, we have presented interactions one at a time thus far. Some of the interaction
variables are strongly correlated (see Table 9) so it is hard to estimate their effect independently.
Nevertheless, in Table 10 column (vii), we present a regression with all the interactions included
(when we have used two proxies for an effect, we include the one that has the most data for this
regression). We find that all variables retain their predicted effect and statistical significance
except the financial sector interaction.
3.6.5 Eurostat

31
Finally, we analyze “official” data from Eurostat, which is calculated by the European
Union (EU) using confidential census data for a sample of 9 EU countries, by “EU-industries”,
which are broader than 2-digit NACE codes. We do not have data from this sample for non-EU,
transition countries or for certain industries. For example, whereas we calculate using the
Amadeus database about 600 observations by country and 2-digit NACE industry codes, Eurostat
only includes about 250 observations. Eurostat provides entry rates, calculated as the one-year
change in the number of firms, and exit rates, calculated as the number of firms exiting the
industry, excluding mergers and acquisitions.
Table 11, Panel A shows that our entry rates across countries and industries using the
Amadeus database and Eurostat data are significantly correlated at about 67%. In addition, both
Amadeus and Eurostat entry rates are highly correlated with Eurostat exit rates. This is consistent
with Dunne, Roberts, and Samuelson (1988), who find a strong positive relationship between
entry and exit rates across U.S. industries. Panel B shows correlations by 2-digit industry code,
averaged across countries. We find that Eurostat entry rates are strongly significantly correlated
at the industry-level with Amadeus entry rates and D&B U.S. entry rates at 90% and 60%,
respectively. This suggests that (i) our calculations using the Amadeus data are in line with
official figures and (ii) industry-level entry rates are broadly similar in both Europe and the U.S.
Table 12 shows that our main regression results are robust to the substitution of entry rates from
Eurostat.
IV. Conclusion
This paper uses cross-country data to identify the impact of regulations on entry with a
view to determining what motives might prompt such regulation. We also examine other potential
environmental factors that could affect entry. We use the Amadeus database, which includes
financial data on over 3 million firms in Western and Eastern Europe. This data improves upon
previously used datasets in that it includes (1) a large number of private, unlisted and publicly
traded corporations and (2) all sectors (it is not limited to manufacturing). This database offers a

32
unique opportunity for us to construct entry rates across sectors and test the effect of diverse
industry- and country-level characteristics on new firm creation.
To summarize our results, we find that entry regulations hamper entry, especially in
industries that naturally should have high entry. The value added by naturally “high-entry”
industries grows more slowly in countries with high entry barriers. Entry regulations have these
adverse effects primarily in countries that are less corrupt. Taken together, all this suggests entry
regulations are neither benign nor welfare improving. We do not imply all regulations inhibit
entry. In particular, regulations that enhance the enforcement of intellectual property rights or
those that lead to a better developed financial sector do lead to greater entry in industries that do
more R&D or industries that need more external finance.
The plausible point is that one cannot make a blanket assertion that government
intervention has a unidirectional effect on entry and growth. Regulations that protect intellectual
property, promote schooling, and develop financial markets tend to have favorable effects while
excessive bureaucratic regulation of entry tends to have adverse effects. Identifying the optimal
degree of government intervention in regulating the environment in which firms operate,
however, is a matter for further research.

33
References
Acemoglu, Daron, 2003, The form of property rights: Oligarchic vs. democratic societies, Mimeo, Department of Economics, Massachusetts Institute of Technology. Asplund, Marcus, and Volker Nocke, 2003, Firm turnover in imperfectly competitive markets, Penn Institute for Economic Research working paper 03-010. Bain, Joe S., 1956, Barriers to new competition. Cambridge, Mass: Harvard University Press. Barro, Robert J., and Jong-Wha Lee, 1996, International measures of schooling years and schooling quality, American Economic Review, Papers and Proceedings 86, 218-223. Barro, Robert J., and Jong-Wha Lee, 2000, International data on educational attainment: Updates and implications, CID Working Paper no. 42, Harvard University. Barth, James R., Gerard Caprio, Jr., and Ross Levine, 2004, Bank supervision and regulation: What works best?, Journal of Financial Intermediation, Forthcoming. Bertrand, Marianne, and Francis Kramarz, 2002, Does entry regulation hinder job creation? Evidence from the French retail industry, Quarterly Journal of Economics 117, 1369-1413. Bhagwati, Jagdish N., 1979, Revenue-seeking and rent-seeking: the theory of commercial policy, Mimeo, Massachusetts Institute of Technology, Cambridge, MA, May 1979. Black, Sandra E. and Philip E. Strahan, 2002, Entrepreneurship and bank credit availability, Journal of Finance, 57, 2807-2833. Blanchard, Olivier, and Franceso Giavazzi, 2001, Macroeconomic effects of regulation and deregulation in goods and labor markets, National Bureau of Economic Research Working Paper No. 8120. Botero, Juan, Simeon Djankov, Rafael La Porta, Florencio Lopez-de-Silanes, and Andrei Shleifer, 2003, The regulation of labor, mimeo, Harvard University, March 2003. Claessens, Stijn, and Luc Laeven, 2003, Financial development, property rights, and growth, Journal of Finance 58(6), 2401-2436. De Soto, Hernando, The other path (New York: NY, Harper and Row, 1990). Desai, Mihir, Paul Gompers, Josh Lerner, 2003, Institutions, capital constraints and entrepreneurial firm dynamics: Evidence from Europe, NBER Working Paper No. w10165, December 2003. Djankov, Simeon, Rafael La Porta, Florencio Lopez-de-Silanes, and Andrei Shleifer, 2002, The Regulation of entry, Quarterly Journal of Economics 117, 1-35. Djankov, Simeon, Rafael La Porta, Florencio Lopez-de-Silanes, and Andrei Shleifer, 2003, Courts, Quarterly Journal of Economics 118, 453-517.

34
Dunne, Timothy, Mark J. Roberts, and Larry Samuelson, 1988, Patterns of firm entry and exit in U.S. manufacturing industries, RAND Journal of Economics 19, 495-515. European Commission (1998), Enterprises in Europe, Fifth Report, Eurostat, Luxembourg: Office for Official Publications of the European Communities. European Commission (2001), Enterprises in Europe, Sixth Report, Eurostat, Luxembourg: Office for Official Publications of the European Communities. Evans, David S., 1987, Tests of alternative theories of firm growth, Journal of Political Economy 95, 657-674. Evans, David S., and Boyan Jovanovic, 1989, An estimated model of entrepreneurial choice under liquidity constraints, Journal of Political Economy 97, 808-827. Evans, David S., and Linda S. Leighton, 1989, Some empirical aspects of entrepreneurship, American Economic Review 79, 519-535. Evans, John and John Fingleton, 2002, Entry regulation and influence of an incumbent as special interest group, CESifo working paper no. 787. Fan, Wei, and Michelle J. White, 2003, Personal bankruptcy and the level of entrepreneurial activity, Journal of Law & Economics 46(2), 543-568. Fisman, Raymond and Inessa Love, 2003, Trade Credit, Financial Intermediary Development and Industry Growth, Journal of Finance 58, 353-374. Geroski, Paul A., 1995, What do we know about entry, International Journal of Industrial Organization 13, 421-440. Gilbert, Richard J., 1989, Mobility Barriers and the Value of Incumbency, In: Richard L. Schmalensee and Robert D. Willig (Eds.), Handbook of Industrial Organization Volume 1, Chapter 8, Elsevier, North-Holland. Gibrat, Robert, 1931, Les inégalités économiques; applications : aux inégalités des richesses, à la concentration des entreprises, aux populations des villes, aux statistiques des familles, etc., d’une loi nouvelle, la loi de l’effet proportionnel. Paris : Libraire du Recueil Sirey. Hause, John C., and Gunnar du Rietz, 1984, Entry, industry growth, and the microdynamics of industry supply, Journal of Political Economy 92, 733-757. Johnson, Simon, John McMillan and Christopher Woodruff, 2002, Property rights and finance, American Economic Review 92, 1335-1356. Jovanovic, Boyan, 1982, Selection and the evolution of industry, Econometrica 50, 649-670. Krueger, Anne O., 1974, The political economy of the rent-seeking society, American Economic Review 64, No. 3., 291-303. Kumar, Krishna, Raghu Rajan, and Luigi Zingales, 2002, What Determines Firm Size?, mimeo, University of Chicago.

35
La Porta, Rafael, Florencio Lopez-de-Silanes, Andrei Shleifer, and Robert W. Vishny, 1998, Law and Finance, Journal of Political Economy 106, 1113-1155. La Porta, Rafael, Florencio Lopez-de-Silanes, Andrei Shleifer, and Robert W. Vishny, 1999, The quality of government, Journal of Law, Economics, and Organization 15, 222-279. Lel, Ugur, and Gregory Udell, 2002, Financial constraints, start-up firms and personal commitments, University of Indiana working paper. Lucas, Robert E., Jr., 1978, On the size distribution of business firms, Bell Journal of Economics 9, 508-523. Mansfield, Edwin, 1962, Entry, Gibrat’s law, innovation, and the growth of firms, American Economic Review 52, 1023-1051. McMillan, John, and Christopher Woodruff, 2002, The central role of entrepreneurs in transition economics, Journal of Economic Perspectives 16, 153-170. Perotti, Enrico and Paolo Volpin, 2003, The political economy of entry: Lobbying, inequality and financial development, mimeo, University of Amsterdam. Petersen, Mitchell, and Raghuram Rajan, 1994, The benefits of firm-creditor relationships: Evidence from small business data, Journal of Finance 49, 3-37. Petersen, Mitchell, and Raghuram Rajan, 2002, Does distance still matter? The information revolution in small business lending, Journal of Finance 57, 2533-2570. Pigou, Arthur G., The economics of welfare, 4th edition (London: MacMillan and Co. 1938). Rajan, Raghuram, and Luigi Zingales, 1998, Financial Dependence and Growth, American Economic Review 88, 559-586. Rajan, Raghuram and Luigi Zingales, 2003a, The great reversal: The politics of financial development in the 20th century, Journal of Financial Economics 69(1), 5-50. Rajan, Raghuram and Luigi Zingales, 2003b, Saving capitalism from the capitalists, Crown Publishing, Random House, New York. Scarpetta, Stefano, Phillip Hemmings, Thierry Tressel and Jaejoon Woo, 2002, The role of policy and institutions for productivity and firm dynamics: evidence from micro and industry data, Working paper No. 329, Economics department, OECD. Simon, Herbert A., and Charles P. Bonini, 1958, The size distribution of business firms, American Economic Review 48, 607-617. Stigler, George G., 1971, The theory of economic regulation, Bell Journal of Economics and Management Science II, 3-21. Sutton, John, 1997, Gibrat’s legacy, Journal of Economic Literature 35, 40-59.

36
Appendix 1: Definition of Variables
Variable Description
Amadeus industry-level variables
Entry Share of new firms in the total number of firms. We define new firms as firms with age 1-2. Average for the years 1998-99. We calculate this country-industry level variable for 2-digit NACE industries. Source: Amadeus.
Entry > 10 employees only Share of new firms in the total number of firms. We define new firms as firms with age 1. Average for the years 1998-99. We calculate this country-industry level variable for 2-digit NACE industries. Source: Amadeus.
Employment Creation Share of employment of new firms in the employment of all firms. We define new firms as firms with age 1-2. Average for the years 1998-99. We calculate this country-industry level variable for 2-digit NACE industries. Source: Amadeus.
Industry Share Fraction of the industry’s sales in total sales. Average for the years 1999-99. We calculate this country-industry level variable for 2-digit NACE industries. Source: Amadeus.
Growth in value added per employee
Growth in value added per employee over the period 1998-99 averaged over all incumbent firms in the industry in a country. Incumbent firms are defined as firms with age greater than 2. Value added is computed as Earnings before interest, taxes, depreciation and amortization, plus labor costs. We calculate this country-industry level variable for 2-digit NACE industries. Source: Amadeus.
Share in value added Share of incumbent firms in the industry in overall value added for the country in 1999. Incumbent firms are defined as firms with age greater than 2. We calculate this country-industry level variable for 2-digit NACE industries. Source: Amadeus.
Eurostat industry-level variables
Eurostat Entry Entry rate for the year 1999 by Eurostat industry (based on 2-digit NACE industries). Source: Eurostat.
Eurostat Exit Exit rate for the year 1999 by Eurostat industry (based on 2-digit NACE industries). Source: Eurostat.
U.S. Benchmark variables
Total Assets (Scale) Industry-level median of total assets. We compute this measure for all U.S. firms for the year 1995. Calculated for 2-digit NACE industries (original data on a 4-digit SIC level). Source: Compustat.
Total Revenues (Size) Industry-level median of total revenues. We compute this measure for all U.S. firms for the year 1995. Calculated for 2-digit NACE industries (original data on a 4-digit SIC level). Source: Compustat.
4-firm concentration ratio (Conc) Industry-level 4-firm concentration ratio, based on firm-level total revenues. We compute this measure for all U.S. firms for the year 1995. Calculated for 2-digit NACE industries (original data on a 4-digit SIC level). Source: Compustat.
Herfindahl-Hirschman index (HH) Industry-level Herfindahl-Hirschman index, based on firm-level total revenues. We compute this measure for all U.S. firms for the year 1995. Calculated for 2-digit NACE industries (original data on a 4-digit SIC level). Source: Compustat.
External financial dependence (ExtFin)
Measure of dependence on external finance, equal to the industry-level median of the ratio of capital expenditures minus cash flow over capital expenditures. The numerator and denominator are summed over all years for each firm before dividing. Cash flow is defined as the sum of funds from operations, decreases in inventories, decreases in receivables, and

37
increases in payables. Capital expenditures include net acquisitions of fixed assets. This definition follows Rajan and Zingales (1998). We compute this measure for all U.S. firms for the period 1990-99. Calculated for 2-digit NACE industries (original data on a 4-digit SIC level). Source: Compustat.
R & D intensity (R&D) Measure of dependence on research and development, equal to the industry-level median of the ratio of research and development expenses to sales. The numerator and denominator are summed over all years for each firm before dividing. We compute this measure for all U.S. firms for the period 1990-99. Calculated for 2-digit NACE industries (original data on a 4-digit SIC level). Source: Compustat.
Labor intensity (LabInt) Measure of labor intensity, equal to the amount of employees per value added, industry medians of ratios over all firm-years in the relevant time period. We compute this measure for all U.S. firms for the period 1990-99. A higher score indicates higher labor intensity. Calculated for 2-digit NACE industries (original data on a 4-digit SIC level). Source: Compustat.
Hourly wage rate (Wage) Hourly wage rate, industry medians. We compute this measure for all U.S. firms for the period 1999. Calculated for 2-digit NACE industries (original data on a 3-digit SIC level). Source: Occupational Employment Statistics Survey, Bureau of Labor Statistics, U.S. Department of Labor. Survey covers most firms and employees in the U.S.
Entry U.S. (EntryUS) Entry rates for U.S. corporations. Calculated for 2-digit NACE industries (original data on a 4-digit SIC level). Average for the years 1998-99. Source: Dun & Bradstreet.
Exit U.S. (Exit) Exit rates for U.S. corporations. Calculated for 2-digit NACE industries (original data on a 4-digit SIC level). Average for the years 1998-99. Source: Dun & Bradstreet.
Country-Level Variables
Entry cost (EntCost) Cost of business registration, expressed as a percentage of per capita GNP. Data for the year 1999. Source: Djankov et al. (2002).
Entry cost and time (EntTime) Cost of business registration, including the monetized value of the entrepreneurs time. Source: Djankov et al. (2002).
Entry procedures (EntProc) Number of procedures to register a business. Data for the year 1999. Source: Djankov et al. (2002).
Intellectual property rights (IntProp)
Index of intellectual property rights for the year 2001. Source: World Economic Forum.
Cost of dismissals (LabCost) Sub-index of labor regulations capturing the costs of individual dismissals from Nicoletta et al. (2000) based on factor analysis of data in OECD (1999). Ranges from 0 to 6. A higher score indicates higher costs. Data refer to 1998.
Employment laws (EmpLaw) Index of labor regulations from Botero et al. (2003). Ranges from 0 to 3. A higher score indicates that regulation is more protective of a worker. Data refer to 1997.
Private credit to GDP (Priv) Ratio of domestic credit to the private sector scaled by GDP. Source: International Monetary Fund’s International Financial Statistics (IMF-IFS).
Stock market capitalization (MCap)
Ratio of stock market capitalization to GDP. Source: World Bank World Development Indicators (WDI).
Financial Development (FinDev) The sum of the private credit and market capitalization ratios. Source: IMF-IFS and WDI.
Accounting standards (AccStan) Measure of accounting standards. Score from 0 (low) to high (100). Source: LLSV (1998). Original source: International Accounting and Auditing Trends, Center for International Financial Analysis & Research, Inc.
Human capital (Edu) Measure of education attainment defined as the average years of schooling of population age over 25. Source: Barro and Lee (1996, 2000).
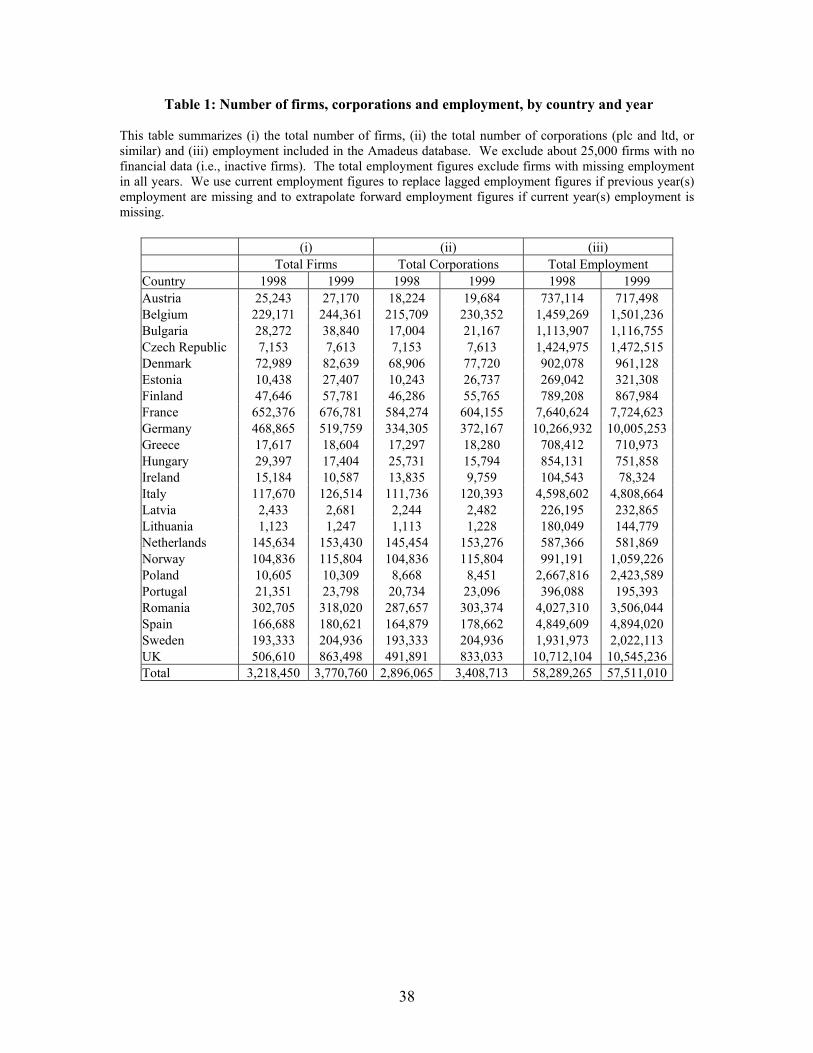
38
Table 1: Number of firms, corporations and employment, by country and year This table summarizes (i) the total number of firms, (ii) the total number of corporations (plc and ltd, or similar) and (iii) employment included in the Amadeus database. We exclude about 25,000 firms with no financial data (i.e., inactive firms). The total employment figures exclude firms with missing employment in all years. We use current employment figures to replace lagged employment figures if previous year(s) employment are missing and to extrapolate forward employment figures if current year(s) employment is missing.
(i) (ii) (iii) Total Firms Total Corporations Total Employment Country 1998 1999 1998 1999 1998 1999 Austria 25,243 27,170 18,224 19,684 737,114 717,498 Belgium 229,171 244,361 215,709 230,352 1,459,269 1,501,236 Bulgaria 28,272 38,840 17,004 21,167 1,113,907 1,116,755 Czech Republic 7,153 7,613 7,153 7,613 1,424,975 1,472,515 Denmark 72,989 82,639 68,906 77,720 902,078 961,128 Estonia 10,438 27,407 10,243 26,737 269,042 321,308 Finland 47,646 57,781 46,286 55,765 789,208 867,984 France 652,376 676,781 584,274 604,155 7,640,624 7,724,623 Germany 468,865 519,759 334,305 372,167 10,266,932 10,005,253Greece 17,617 18,604 17,297 18,280 708,412 710,973 Hungary 29,397 17,404 25,731 15,794 854,131 751,858 Ireland 15,184 10,587 13,835 9,759 104,543 78,324 Italy 117,670 126,514 111,736 120,393 4,598,602 4,808,664 Latvia 2,433 2,681 2,244 2,482 226,195 232,865 Lithuania 1,123 1,247 1,113 1,228 180,049 144,779 Netherlands 145,634 153,430 145,454 153,276 587,366 581,869 Norway 104,836 115,804 104,836 115,804 991,191 1,059,226 Poland 10,605 10,309 8,668 8,451 2,667,816 2,423,589 Portugal 21,351 23,798 20,734 23,096 396,088 195,393 Romania 302,705 318,020 287,657 303,374 4,027,310 3,506,044 Spain 166,688 180,621 164,879 178,662 4,849,609 4,894,020 Sweden 193,333 204,936 193,333 204,936 1,931,973 2,022,113 UK 506,610 863,498 491,891 833,033 10,712,104 10,545,236Total 3,218,450 3,770,760 2,896,065 3,408,713 58,289,265 57,511,010
39
Table 2: Comparison with National Statistics This table compares the number of corporations in Amadeus in 1999 with the total number of firms according to 1996 data from Enterprises in Europe: 6th report (Eurostat, 2003). The Amadeus ratios are calculated using our extrapolated employment data and the number of corporations (PLCs and LTDs). The national data includes all enterprises, including proprietorships. Enterprises with 0 employees are excluded from both samples. Enterprises in Europe only includes EU-countries, which excludes Eastern European countries, Norway, and Switzerland. Columns (i-ii) indicate the coverage in Amadeus of large firms. Column (i) is equal to the ratio of total firms with more than 250 employees in Amadeus to total firms with more than 250 employees in national statistics. Column (ii) is equal to the ratio of total employment of firms with more than 250 employees in Amadeus to total employment at firms with more than 250 employees in national statistics. Columns (iii-iv) indicate the coverage in Amadeus of small firms. Column (i) is equal to the ratio of total firms with more than 10-50 employees in Amadeus to total firms with 10-50 employees in national statistics. Column (ii) is equal to the ratio of total employment of firms with 10-50 employees in Amadeus to total employment at firms with more than 10-50 employees in national statistics. Column (v) indicates whether there is a bias in the relative coverage of large (versus small) firms in Amadeus. Column (v) is equal to the absolute value of the difference between the ratio of employment in firms with 10-50 employees to employment in firms with more than 250 employees in Amadeus and the ratio of employment in firms with 10-50 employees to employment in firms with more than 250 employees in national statistics. All data is shown as percentages. Because of reported data availability, statistics for large firms in Iceland is measured as firms with more than 100 (rather than 250) employees.
(i) (ii) (iii) (iv) (v)
Coverage of large firms by
number of:
Coverage of Small Firms by number of:
Country Firms Employees Firms Employees
Relative coverage of small firms
Austria 44.4% 38.7% 54.6% 65.2% 10.6% Belgium 70.0% 57.4% 65.9% 50.6% 15.3% Denmark 100.0% 77.2% 63.3% 73.1% 9.8% Finland 125.0% 90.2% 39.0% 42.4% 3.4% France 65.2% 54.2% 66.8% 57.8% 9.0% Germany 34.3% 39.0% 47.4% 49.5% 2.1% Greece 200.0% 84.4% 58.0% 97.7% 39.7% Iceland 30.0% 39.3% 6.2% 37.9% 31.7% Ireland 33.3% 14.8% 23.1% 67.9% 44.8% Italy 57.9% 78.5% 45.3% 100.0% 54.7% Luxembourg 40.0% 38.3% 2.9% 82.2% 79.3% Netherlands 14.3% 11.9% 31.5% 46.4% 14.9% Portugal 33.3% 20.5% 12.8% 117.5% 104.7% Spain 83.3% 98.6% 53.2% 99.0% 45.8% Sweden 114.3% 105.6% 43.7% 47.8% 4.1% UK 85.1% 79.4% 8.6% 31.0% 22.4%
40
Table 3: Entry rates, by country, average 1998-99 This table shows entry rates of new firms in Amadeus, averaged by country across industries for the period 1998-99. Columns (i-ii) include all firms and Columns (iii-iv) exclude firms with less than 10 employees. We report both the percentage of new firms and employment at new firms. Note that the sample sizes differ because some firms are missing employment data, i.e. Columns (i-ii) include all firms that include age, even if employment is missing. We exclude the agricultural, mining, utility, finance, and public sectors. We exclude country-industry observations based on less than 3 firm observations. New firms are defined as corporations of age 1 and 2. Columns (v-vi) shows the number of entry procedures and entry costs as a percentage of per capita GNP, respectively (Djankov, et al. 2002). All data are shown as percentages.
(i) (ii) (iii) (iv) (v) (vi) All firms: Firms with more than 10 employees:
Country % of new firms
% of employment at new firms
% of new firms
% of employment at new firms
Number of entry procedures
Entry cost (% of per capita GNP)
Austria 13.00 11.78 12.20 12.55 9 27.28 Belgium 11.58 4.08 5.37 3.40 8 9.98 Bulgaria 8.60 2.05 5.34 2.49 10 14.41 Czech Republic 11.55 7.15 10.05 7.71 10 8.22 Denmark 13.66 5.36 8.26 4.60 3 10.00 Estonia 20.41 11.95 14.17 11.00 n.a. n.a. Finland 11.13 6.78 6.15 6.41 5 1.16 France 14.68 5.55 7.20 4.39 15 14.30 Germany 12.34 7.88 7.78 7.65 10 15.69 Greece 15.44 8.17 11.45 8.06 15 58.60 Hungary 17.38 5.41 13.20 5.57 8 85.87 Italy 3.46 2.59 2.10 2.61 16 20.02 Latvia 18.16 10.53 16.20 10.57 7 42.34 Lithuania 19.23 9.16 18.30 10.18 10 5.46 Netherlands 8.48 5.90 6.04 7.29 8 18.41 Norway 16.87 14.13 12.39 13.90 4 4.72 Poland 12.04 6.28 10.69 6.22 11 25.46 Romania 17.97 13.51 11.76 13.25 16 15.31 Spain 11.41 6.03 7.49 5.56 11 17.30 Sweden 7.90 3.49 5.32 3.05 6 2.56 UK 15.01 5.17 6.28 5.05 5 1.43 Averages: Western Europe 11.92 6.69 7.54 6.50 8.85 15.50 Transition countries 15.67 8.26 12.46 8.37 10.29 28.15 All countries 13.35 7.28 9.42 7.21 9.35 19.93
41
Table 4: Entry rates across Europe and the U.S., by 2-digit NACE code
This table shows entry rates of new firms across Europe and the U.S. by 2-digit NACE code groups. In columns (ii-vi), European data are from Amadeus, averaged across countries, and averaged for the years 1998-99. Columns (ii-v) define new firms as corporations of age 1 and 2 and column (vi) defines new firms as corporations age 1, to compare to the U.S. data. In column (vii), data on U.S. entry rates are from Dunn & Bradstreet, averaged for the years 1998-99, and new firms are defined as corporations of age 1. Data are shown as percentages. We exclude the agricultural, mining, utility, finance, and public sectors (NACE codes 5-7, 10-14, 50-51, 65-67, 85, and 91-92). We also exclude country-industry observations based on less than 3 firm observations. “Total” is the average of all non-excluded 2-digit NACE codes.
(i) (ii) (iii) (iv) (v) (vi) (vii)
Europe U.S.
Age 1 and 2 Age 1
All Firms: Firms with more than 10 employees: All Firms:
Industry
2-Digit NACE
Industry Code
New Firms
New Empl.
New Firms
New Empl.
New Firms
New Firms
Manufacturing 15 – 36 11.07 6.24 8.26 6.37 6.00 6.31 - Manufacture of chemicals 24 9.53 3.60 6.34 3.49 4.64 6.08
- Manufacture of office machinery and computers 30 15.53 8.49 11.06 8.24 9.33 8.67
- Manufacture of radio, television, and communication equipment
32 14.35 8.65 11.41 8.37 7.14 8.45
Construction 45 13.56 7.18 7.88 6.30 6.51 8.14
Trade 50 – 52 14.27 8.24 8.69 7.43 6.92 5.86
Hotels and Restaurants 55 14.73 8.15 10.93 7.40 7.42 5.95
Transportation 60 – 63 13.90 6.21 9.19 6.26 7.58 6.74
Communications 64 26.71 15.34 21.11 16.03 14.00 10.09
Services 70 – 74, 93 18.01 10.15 11.18 9.36 9.77 7.51
- Computer services 72 22.19 10.99 13.23 9.80 12.49 10.73
Total 15 – 93 13.27 7.33 9.22 7.19 7.09 6.65
42
Table 5: Size Distribution of New firms in Europe, by country and firm size, average of 1998 and 1999
This table shows the average shares of new firms in Amadeus, by firm size and country, averaged over the period 1998-99. New firms are defined as corporations with age 1 or 2. Data are shown as percentages of total new corporations. (i) (ii) (iii) (iv)
Percentage of new corporations with employment:
Country < 10 10-50 50-250 > 250 Austria 61.32 29.89 7.04 1.76 Belgium 91.18 7.44 1.17 0.20 Bulgaria 54.51 24.10 16.64 4.75 Czech Republic 28.18 34.83 29.39 7.60 Denmark 82.57 15.42 1.74 0.27 Estonia 77.39 19.36 2.72 0.53 Finland 87.37 9.70 2.30 0.63 France 90.91 8.00 0.93 0.16 Germany 80.50 16.05 2.71 0.74 Greece 54.54 40.42 4.49 0.54 Hungary 43.03 38.90 14.83 3.24 Ireland 7.89 34.54 52.30 0.00 Italy 66.18 23.21 8.35 2.25 Latvia 50.02 31.37 14.80 3.81 Lithuania 36.38 47.04 12.79 3.78 Netherlands 57.67 23.15 16.33 2.85 Norway 86.42 11.68 1.55 0.36 Poland 19.50 28.42 41.87 10.20 Portugal 50.87 28.35 16.50 4.28 Romania 92.07 6.02 1.44 0.46 Spain 68.06 27.54 3.82 0.58 Sweden 91.32 7.54 0.98 0.17 United Kingdom 70.14 17.18 9.83 2.85 Averages: Western Europe 69.80 20.01 8.67 1.18 Transition countries 50.14 28.76 16.81 4.30 All countries 62.96 23.05 11.50 2.26
43
Table 6A: Determinants of Entry Rates This table shows Tobit regressions with censoring at 0 and 1, an OLS regression, and a weighted least squares regression. The dependent variable in columns (i-vii) is the ratio of new firms (defined as age 1- 2) to total firms, averaged over the period 1998-99, by 2-digit NACE industry code and country (Amadeus). Industry Share is the industry share in sales (Amadeus). EntryUS is the ratio of new firms to total firms in the U.S., by 2-digit NACE industry code (Dunn & Bradstreet). Columns (i) shows a Tobit regression that interacts EntryUS with country-level entry costs (Djankov, et al, 2002). Column (ii-iii) shows a Tobit regression that interacts EntryUS with the number of entry procedures and the monetized value of the entrepreneur’s time in the entry cost variable, respectively (Djankov, et al, 2002). Column (iv) shows a Tobit regression that excludes transition countries. Column (v) includes shows a Tobit regression that only firms with more than 10 employees, excluding industries with less than 50% of firm coverage for employment. Column (vi) shows OLS regression results and Column (vii) reports weighted least squares (WLS) estimates with weights based on the logarithm of the number of firms in that industry with nonmissing age data. The dependent variable in column (viii) is the ratio of employment at new firms (defined as age 1- 2), averaged over the period 1998-99, by 2-digit NACE industry code and country. This ratio is calculated excluding large new firms (defined as employment greater than 250). We also exclude industries with less than 50% of firm coverage for employment. All regressions include a constant, country dummies and 2-digit industry dummies, not shown. Standard errors are reported in parentheses. *, **, and *** denote significant at 10%, 5%, and 1%, respectively. See Appendix 1 for complete variable definitions and sources.
(i) (ii) (iii) (iv) (v) (vi) (vii) (viii) Fraction of new firms Fraction of employment
at new firms Tobit Regressions
Entry Costs
Entry procedures
EntCost & Time
Excl. Transition
>10 employees only
OLS Weighted least squares Tobit
Industry Share -0.092 -0.093 -0.095 0.157 -0.224* -0.092 -0.041 -0.131 (0.108) (0.109) (0.108) (0.123) (0.122) (0.091) (0.076) (0.101) EntryUS * EntCost -0.175*** -0.110*** -0.237** -0.175*** -0.201*** -0.089 (0.047) (0.041) (0.110) (0.066) (0.063) (0.089) EntryUS * EntProc -0.656*** (0.177) EntryUS * EntCost&Time -0.211*** (0.055)
Observations 708 708 708 484 591 708 708 602 R-squared - - - - - 0.59 0.65 -
44
Table 6B: Determinants of Entry Rates: Alternative Proxies for Natural Propensity to Enter
This table shows Tobit regressions with censoring at 0 and 1. The dependent variable in all columns is the ratio of new firms (defined as age 1- 2) to total firms, averaged over the period 1998-99, by 2-digit NACE industry code and country (Amadeus). Industry Share is the industry share in sales (Amadeus). EntCost is country-level entry costs (Djankov, et al, 2002). Columns (i-ii) interacts EntCost with the percentage of U.S. firms that exited and the percentage of U.S. firms defined as SMEs (with less than 250 employees), respectively, averaged over the period 1998-99, by 2-digit NACE industry code (Dunn & Bradstreet). Columns (iii-iv) examines market size and interact EntCost with medium assets and sales, respectively, of U.S. firms, averaged over the period 1998-99, by 2-digit NACE industry code (Compustat). Columns (v-vi) examine market concentration and interact EntCost with the concentration ratio of sales at the largest 4 firms (measured by total sales) and by the Herfindahl-Hirschman index, averaged over the period 1998-99, by 2-digit NACE industry code (Compustat). All regressions include a constant, country dummies and 2-digit industry dummies, not shown. Standard errors are reported in parentheses. *, **, and *** denote significant at 10%, 5%, and 1%, respectively. See Appendix 1 for complete variable definitions and sources.
(i) (ii) (iii) (iv) (v) (vi)
Exit SME Scale Size Conc4 HH
Industry Share -0.081 -0.083 -0.087 -0.088 -0.085 -0.085 (0.109) (0.109) (0.109) (0.109) (0.109) (0.109) Exit * EntCost -0.032** (0.015) SME * EntCost -0.007* (0.004) Scale * EntCost 0.002*** (0.001) Size * EntCost 0.002*** (0.001) Conc * EntCost 0.004 (0.003) HH * EntCost 0.002 (0.001)
Observations 708 708 708 708 708 708
45
Table 7: Determinants of industry performance and size
This table shows Tobit regressions with censoring at 0 and 1. The dependent variable in columns (i) to (viii) is the industry-level growth in value added per employee at firms with age >2 (i.e. excluding new firms). Columns (i-iv) estimate a Tobit regression, columns (v-viii) show IV estimations, and column (ix) shows a Tobit estimation. We use the legal origin variable in LSSV (1998) as instrument for entry regulation. The dependent variable in column (ix) is the industry-level share in value added. All dependent variables are calculated using data for the year 1999, by 2-digit NACE industry code and country, and excluding observations based on less than 3 firms. Growth observations are left-censored at -50% and right-censored at >100%. Share in value added observations are left-censored at 0% and right-censored at 100%. Industry Share is the industry share in sales (Amadeus). EntCost is country-level entry costs (Djankov, et al, 2002). Columns (i-ii) and (v-vi) interact EntCost with the percentage of U.S. firms that entered and the percentage of U.S. firms defined as SMEs (with less than 250 employees), respectively, averaged over the period 1998-99, by 2-digit NACE industry code (Dunn & Bradstreet). Columns (iii-iv) and (vii-viii) interact EntCost with medium assets and sales, respectively, of U.S. firms, averaged over the period 1998-99, by 2-digit NACE industry code (Compustat). All regressions include a constant, country dummies and 2-digit industry dummies, not shown. Standard errors are reported in parentheses. *, **, and *** denote significant at 10%, 5%, and 1%, respectively. See Appendix 1 for complete variable definitions and sources.
(i) (ii) (iii) (iv) (v) (vi) (vii) (viii) (ix) Growth in value added per employee Share in value added Tobit Estimation: IV Estimation: Industry Share -0.050 -0.030 -0.048 -0.040 -0.178 -0.165 -0.173 -0.166 (0.530) (0.529) (0.530) (0.530) (0.378) (0.378) (0.376) (0.378) Entry * EntCost -0.426** -0.211* -0.006 (0.202) (0.113) (0.018) SME * EntCost -0.039** -0.026*** (0.015) (0.001) Scale * EntCost 0.006** 0.006*** (0.003) (0.001) Size * EntCost 0.007** 0.006*** (0.003) (0.001) Observations 572 572 572 572 558 558 558 558 596 R-squared - - - - 0.18 0.18 0.18 0.18 -
46
Table 8: Selection issues This table shows instrumental variable regressions with robust errors and Tobit regressions with censoring at 0 and 1. The dependent variable is the ratio of new firms (defined as age 1- 2) to total firms, averaged over the period 1998-99, by 2-digit NACE industry code and country. Columns (i-v) show instrumental variable regressions. We use the legal origin variable in LSSV (1998) as instrument for entry regulations. We use clustering to correct the standard errors for the fact that the country level variables are instrumented. Columns (vi-vii) show Tobit results when we estimate different slopes for the interaction variables for whether the industry is in a country below or above the sample-median per capita income (low GDP per capita and high GDP per capita, respectively), or above or below sample-median level of corruption (high corruption and low corruption, respectively). All regressions include a constant, country dummies and 2-digit industry dummies, not shown. See Table 6 and Appendix 1 for complete variable definitions and sources. Standard errors are reported in parentheses. *, **, and *** denote significant at 10%, 5%, and 1%, respectively.
(i) (ii) (iii) (iv) (v) (vi) (vii) Instrumental variables Different slopes Industry Share -0.092 -0.087 -0.088 -0.085 -0.085 -0.110 -0.117 (0.090) (0.093) (0.092) (0.094) (0.093) (0.108) (0.108) EntryUS * EntCost -0.175*** (0.055) Scale * EntCost 0.002*** (0.000) Size * EntCost 0.002*** (0.001) Conc * EntCost 0.004* (0.002) HH * EntCost 0.002*** (0.000) Low GDP per capita * EntryUS * EntryCost 0.087 (0.127) High GDP per capita * EntryUS * EntryCost -0.170*** (0.047) High corruption * EntryUS * EntryCost 0.186 (0.128) Low Corruption * EntryUS * EntryCost -0.168*** (0.047) Observations 708 708 708 708 708 708 708 R-squared 0.59 0.59 0.59 0.58 0.58 - -
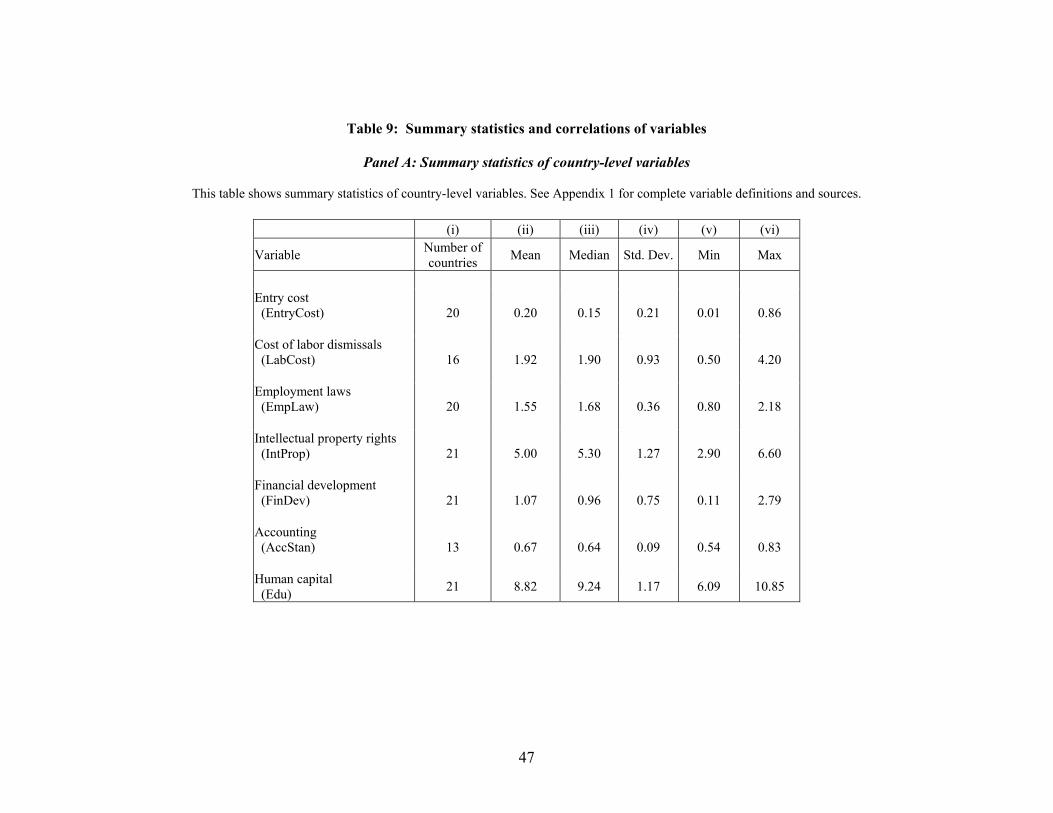
47
Table 9: Summary statistics and correlations of variables
Panel A: Summary statistics of country-level variables
This table shows summary statistics of country-level variables. See Appendix 1 for complete variable definitions and sources.
(i) (ii) (iii) (iv) (v) (vi)
Variable Number of countries Mean Median Std. Dev. Min Max
Entry cost (EntryCost)
20 0.20 0.15 0.21 0.01 0.86
Cost of labor dismissals (LabCost)
16 1.92 1.90 0.93 0.50 4.20
Employment laws (EmpLaw)
20 1.55 1.68 0.36 0.80 2.18
Intellectual property rights (IntProp)
21 5.00 5.30 1.27 2.90 6.60
Financial development (FinDev)
21 1.07 0.96 0.75 0.11 2.79
Accounting (AccStan)
13 0.67 0.64 0.09 0.54 0.83
Human capital (Edu) 21 8.82 9.24 1.17 6.09 10.85
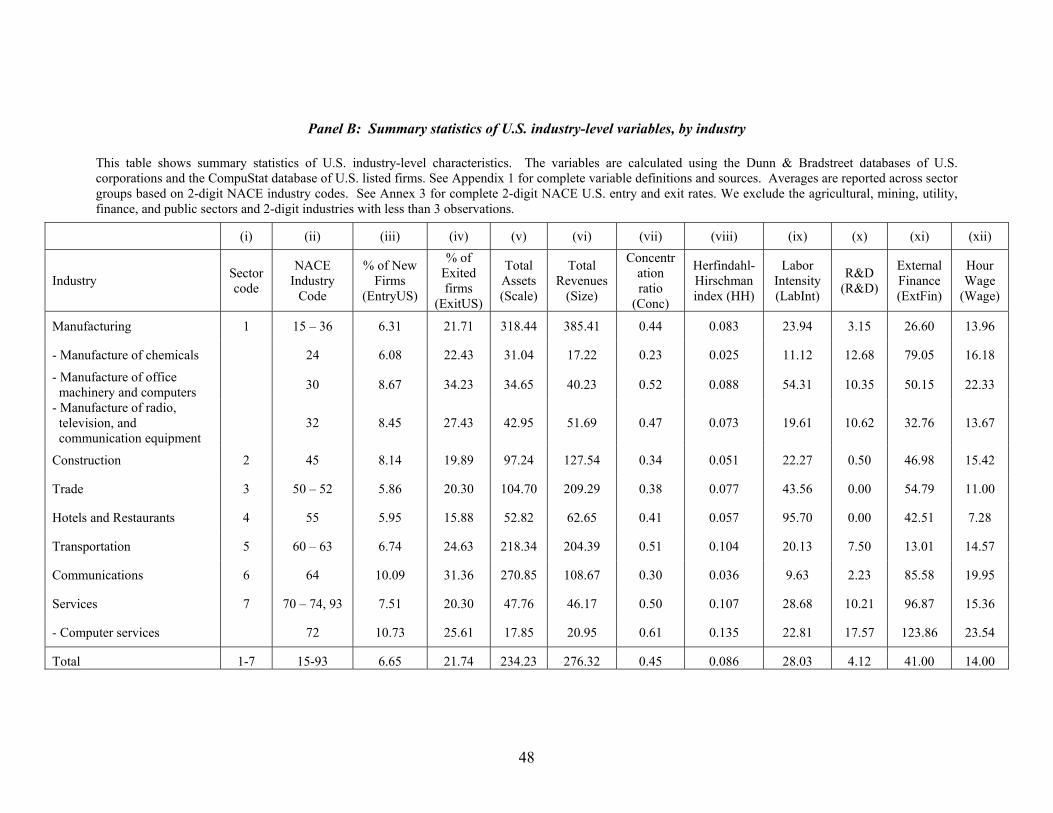
48
Panel B: Summary statistics of U.S. industry-level variables, by industry
This table shows summary statistics of U.S. industry-level characteristics. The variables are calculated using the Dunn & Bradstreet databases of U.S. corporations and the CompuStat database of U.S. listed firms. See Appendix 1 for complete variable definitions and sources. Averages are reported across sector groups based on 2-digit NACE industry codes. See Annex 3 for complete 2-digit NACE U.S. entry and exit rates. We exclude the agricultural, mining, utility, finance, and public sectors and 2-digit industries with less than 3 observations.
(i) (ii) (iii) (iv) (v) (vi) (vii) (viii) (ix) (x) (xi) (xii)
Industry Sector code
NACE Industry
Code
% of New Firms
(EntryUS)
% of Exited firms
(ExitUS)
Total Assets (Scale)
Total Revenues
(Size)
Concentration ratio
(Conc)
Herfindahl-Hirschman index (HH)
Labor Intensity (LabInt)
R&D (R&D)
External Finance (ExtFin)
Hour Wage
(Wage)
Manufacturing 1 15 – 36 6.31 21.71 318.44 385.41 0.44 0.083 23.94 3.15 26.60 13.96
- Manufacture of chemicals 24 6.08 22.43 31.04 17.22 0.23 0.025 11.12 12.68 79.05 16.18
- Manufacture of office machinery and computers 30 8.67 34.23 34.65 40.23 0.52 0.088 54.31 10.35 50.15 22.33
- Manufacture of radio, television, and communication equipment
32 8.45 27.43 42.95 51.69 0.47 0.073 19.61 10.62 32.76 13.67
Construction 2 45 8.14 19.89 97.24 127.54 0.34 0.051 22.27 0.50 46.98 15.42
Trade 3 50 – 52 5.86 20.30 104.70 209.29 0.38 0.077 43.56 0.00 54.79 11.00
Hotels and Restaurants 4 55 5.95 15.88 52.82 62.65 0.41 0.057 95.70 0.00 42.51 7.28
Transportation 5 60 – 63 6.74 24.63 218.34 204.39 0.51 0.104 20.13 7.50 13.01 14.57
Communications 6 64 10.09 31.36 270.85 108.67 0.30 0.036 9.63 2.23 85.58 19.95
Services 7 70 – 74, 93 7.51 20.30 47.76 46.17 0.50 0.107 28.68 10.21 96.87 15.36
- Computer services 72 10.73 25.61 17.85 20.95 0.61 0.135 22.81 17.57 123.86 23.54
Total 1-7 15-93 6.65 21.74 234.23 276.32 0.45 0.086 28.03 4.12 41.00 14.00
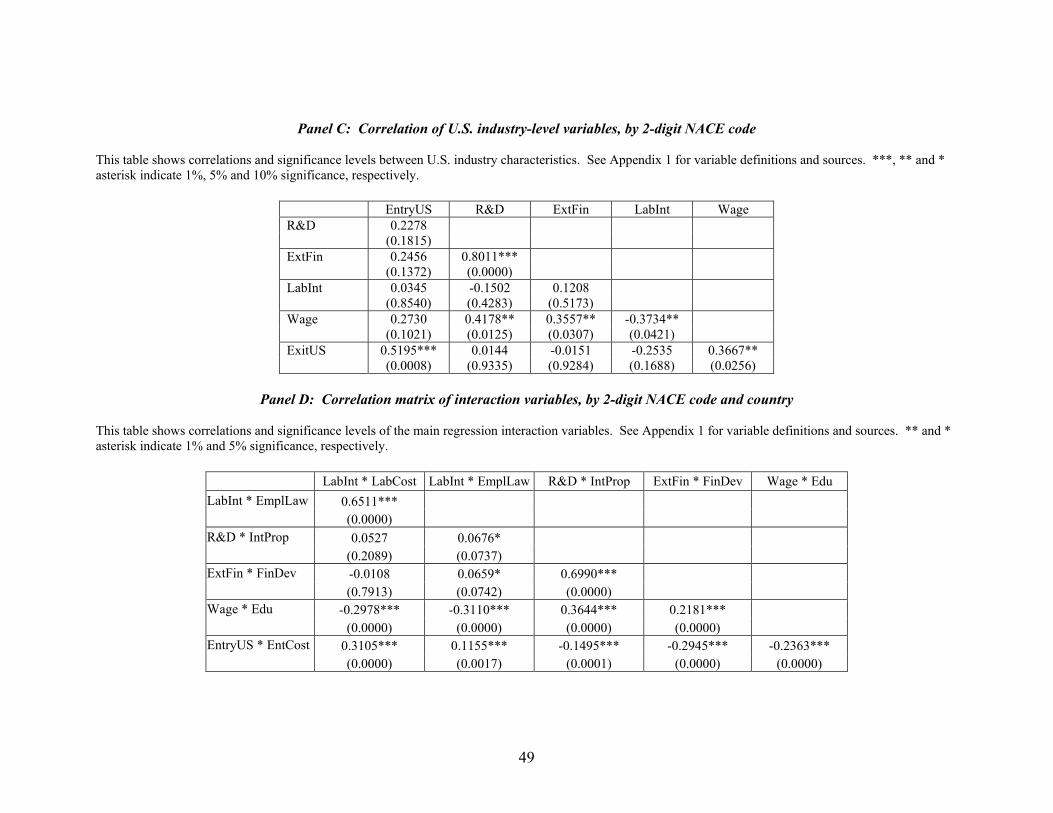
49
Panel C: Correlation of U.S. industry-level variables, by 2-digit NACE code This table shows correlations and significance levels between U.S. industry characteristics. See Appendix 1 for variable definitions and sources. ***, ** and * asterisk indicate 1%, 5% and 10% significance, respectively.
EntryUS R&D ExtFin LabInt Wage R&D 0.2278 (0.1815) ExtFin 0.2456 0.8011*** (0.1372) (0.0000) LabInt 0.0345 -0.1502 0.1208 (0.8540) (0.4283) (0.5173) Wage 0.2730 0.4178** 0.3557** -0.3734** (0.1021) (0.0125) (0.0307) (0.0421) ExitUS 0.5195*** 0.0144 -0.0151 -0.2535 0.3667** (0.0008) (0.9335) (0.9284) (0.1688) (0.0256)
Panel D: Correlation matrix of interaction variables, by 2-digit NACE code and country
This table shows correlations and significance levels of the main regression interaction variables. See Appendix 1 for variable definitions and sources. ** and * asterisk indicate 1% and 5% significance, respectively.
LabInt * LabCost LabInt * EmplLaw R&D * IntProp ExtFin * FinDev Wage * Edu LabInt * EmplLaw 0.6511*** (0.0000) R&D * IntProp 0.0527 0.0676* (0.2089) (0.0737) ExtFin * FinDev -0.0108 0.0659* 0.6990*** (0.7913) (0.0742) (0.0000) Wage * Edu -0.2978*** -0.3110*** 0.3644*** 0.2181*** (0.0000) (0.0000) (0.0000) (0.0000) EntryUS * EntCost 0.3105*** 0.1155*** -0.1495*** -0.2945*** -0.2363*** (0.0000) (0.0017) (0.0001) (0.0000) (0.0000)
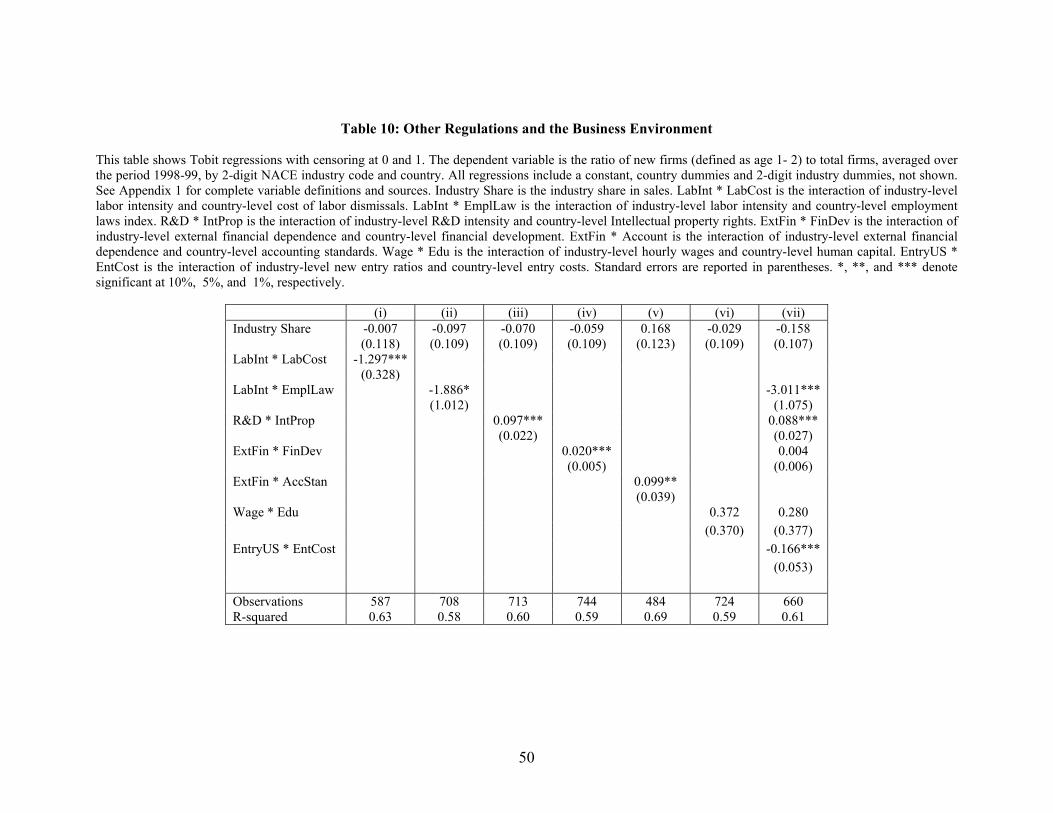
50
Table 10: Other Regulations and the Business Environment This table shows Tobit regressions with censoring at 0 and 1. The dependent variable is the ratio of new firms (defined as age 1- 2) to total firms, averaged over the period 1998-99, by 2-digit NACE industry code and country. All regressions include a constant, country dummies and 2-digit industry dummies, not shown. See Appendix 1 for complete variable definitions and sources. Industry Share is the industry share in sales. LabInt * LabCost is the interaction of industry-level labor intensity and country-level cost of labor dismissals. LabInt * EmplLaw is the interaction of industry-level labor intensity and country-level employment laws index. R&D * IntProp is the interaction of industry-level R&D intensity and country-level Intellectual property rights. ExtFin * FinDev is the interaction of industry-level external financial dependence and country-level financial development. ExtFin * Account is the interaction of industry-level external financial dependence and country-level accounting standards. Wage * Edu is the interaction of industry-level hourly wages and country-level human capital. EntryUS * EntCost is the interaction of industry-level new entry ratios and country-level entry costs. Standard errors are reported in parentheses. *, **, and *** denote significant at 10%, 5%, and 1%, respectively.
(i) (ii) (iii) (iv) (v) (vi) (vii) Industry Share -0.007 -0.097 -0.070 -0.059 0.168 -0.029 -0.158 (0.118) (0.109) (0.109) (0.109) (0.123) (0.109) (0.107) LabInt * LabCost -1.297*** (0.328) LabInt * EmplLaw -1.886* -3.011*** (1.012) (1.075) R&D * IntProp 0.097*** 0.088*** (0.022) (0.027) ExtFin * FinDev 0.020*** 0.004 (0.005) (0.006) ExtFin * AccStan 0.099** (0.039) Wage * Edu 0.372 0.280 (0.370) (0.377) EntryUS * EntCost -0.166*** (0.053) Observations 587 708 713 744 484 724 660 R-squared 0.63 0.58 0.60 0.59 0.69 0.59 0.61
51
Table 11: Comparison between Amadeus data and Eurostat data
Amadeus Entry is the ratio of new firms defined as age 1-2 to total firms, averaged over the period 1998-99, by Eurostat industry code and country, computed using Amadeus data. Eurostat Entry is the ratio of new firms to total firms for the year 1999, computed by Eurostat industry code and country. EuroStat Exit is the exit rate for the year 1999 by Eurostat industry code and country, defined as the number of exited firms, correcting for mergers and acquisitions. D&B Entry is the entry rate in the U.S. in 1999 and D&B Exit is the ratio of exited firms in the U.S. in 1999. Panel A uses 220 observations and Panel B uses 30 observations. Robust standard errors are reported in parentheses. *, **, and *** denote significant at 10%, 5%, and 1%, respectively.
Panel A: Correlations at country-industry level
Amadeus Eurostat Eurostat Entry Entry Exit
1 Amadeus Entry Eurostat ***0.6716 1 Entry (0.0000) Eurostat ***0.5311 ***0.6373 1 Exit (0.0000) (0.0000)
Panel B: Correlations at 2-digit Eurostat industry-level
Amadeus Eurostat Eurostat D&B D&B Entry Entry Exit EntryUS ExitUS Amadeus 1 Entry Eurostat ***0.8991 1 Entry (0.0000) Eurostat ***0.7048 ***0.8332 1 Exit (0.0000) (0.0000) D&B ***0.6035 ***0.6767 ***0.6431 1 EntryUS (0.0004) (0.0000) (0.0000) D&B 0.2812 **0.3903 ***0.5013 ***0.5133 1 ExitUS (0.1323) (0.0330) (0.0048) (0.0037)
52
Table 12: Determinants of Entry Rates: Eurostat data This table shows Tobit regressions with censoring at 0 and 1. The dependent variable in columns (i-iii) is the entry rate for the year 1999 by Eurostat industry code and country, defined as the number of new firms divided by the total number of firms. EntryUS* EntCost is the interaction of industry-level new entry ratios and the logarithm of country-level entry costs. Scale * EntCost is the interaction of the logarithm of the median industry total assets and the logarithm of country-level entry costs. Conc * EntCost is the interaction of the logarithm of the industry-level 4-firm concentration ratio (in terms of total revenues) times the logarithm of country-level entry costs. The dependent variable in column (iv) is the exit rate for the year 1999 by Eurostat industry code and country, defined as the number of exited firms, correcting for mergers and acquisitions. Column (v) reports instrumental variables regressions with the dependent variable equal to Entry rates calculated by Eurostat and using legal origins as the instrument for entry cost. Standard errors are reported in parentheses. All regressions include a constant, country dummies and industry dummies, not shown. See Appendix 1 for complete variable definitions and sources. *, **, and *** denote significant at 10%, 5%, and 1%, respectively.
(i) (ii) (iii) (iv) (v) Tobit Regressions: Instrumental variables: EntryEuro EntryEuro EntryEuro ExitEuro EntryEuro EntryUS * EntCost -0.198*** -0.128*** -0.235*** (0.043) (0.027) (0.065) Scale * EntCost 0.002*** (0.001) Conc * EntCost 0.003 (0.002) Observations 259 259 259 234 259
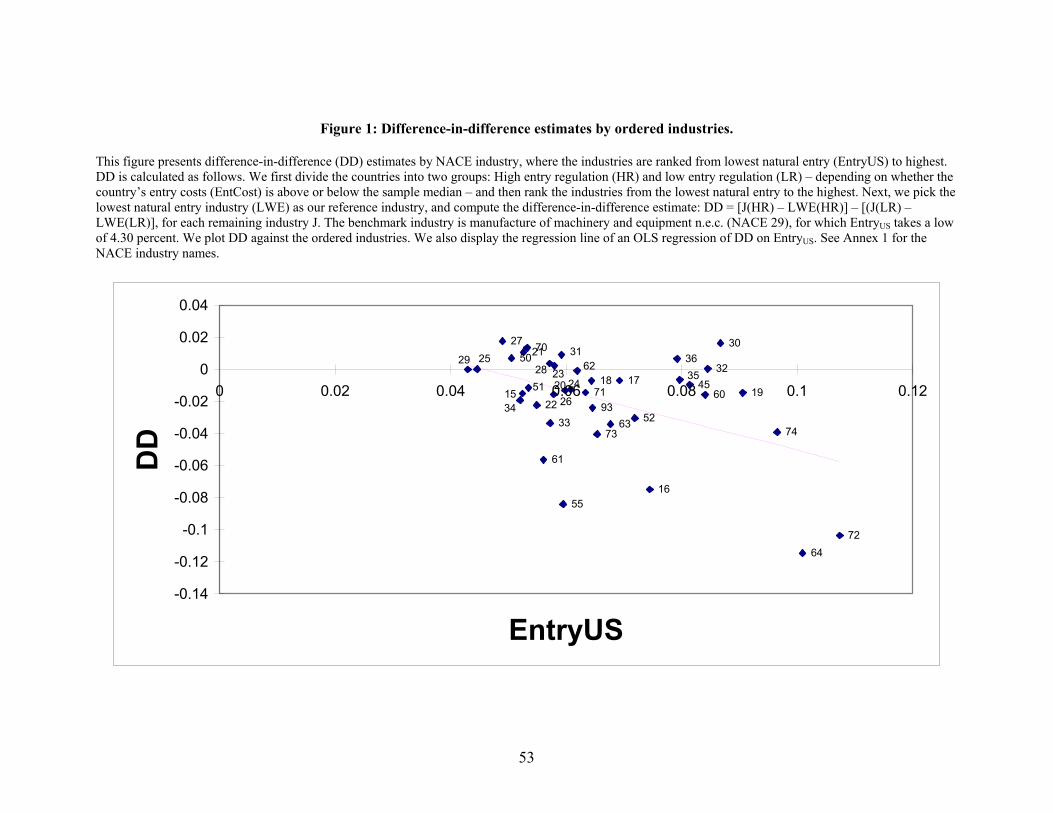
53
Figure 1: Difference-in-difference estimates by ordered industries. This figure presents difference-in-difference (DD) estimates by NACE industry, where the industries are ranked from lowest natural entry (EntryUS) to highest. DD is calculated as follows. We first divide the countries into two groups: High entry regulation (HR) and low entry regulation (LR) – depending on whether the country’s entry costs (EntCost) is above or below the sample median – and then rank the industries from the lowest natural entry to the highest. Next, we pick the lowest natural entry industry (LWE) as our reference industry, and compute the difference-in-difference estimate: DD = [J(HR) – LWE(HR)] – [(J(LR) – LWE(LR)], for each remaining industry J. The benchmark industry is manufacture of machinery and equipment n.e.c. (NACE 29), for which EntryUS takes a low of 4.30 percent. We plot DD against the ordered industries. We also display the regression line of an OLS regression of DD on EntryUS. See Annex 1 for the NACE industry names.
2026
7124 1718
28 2362
31502170
511534 22
4535
27
60 1993
63 523373
3236
30
61
5516
29 25
74
6472
-0.14
-0.12
-0.1
-0.08
-0.06
-0.04
-0.02
0
0.02
0.04
0 0.02 0.04 0.06 0.08 0.1 0.12
EntryUS
DD
54
Figure 2: Difference-in-difference estimates by ordered countries. This figure presents difference-in-difference (DD) estimates by country, where the countries are ranked from lowest entry regulation (EntCost) to highest. DD is calculated as follows. We first divide the industries into two groups: Low entry (LE) and High entry (HE) – depending on whether the industry’s U.S. entry rates (EntryUS) is below or above the sample median – and then order the countries from the highest entry regulation to the lowest. Next, we pick the country with highest entry regulation (HER) as our reference country, and compute the difference-in-difference estimate: DD = [J(LE) – HER(LE)] – [(J(HE) – HER(HE)], for each remaining country J. The benchmark country is Hungary, for which EntCost takes a high of –0.15. We plot DD against the ordered countries. We also display the regression line of an OLS regression of DD on EntCost.
Finland
United Kingdom
Norway
Sweden
Lithuania
Czech Republic
DenmarkFrance Greece
Hungary
LatviaPoland
Italy
AustriaBelgium
GermanyBulgaria
Netherlands
SpainRomania
-0.08
-0.07
-0.06
-0.05
-0.04
-0.03
-0.02
-0.01
0
0.01
0.02
-5 -4 -3 -2 -1 0
EntCost
DD
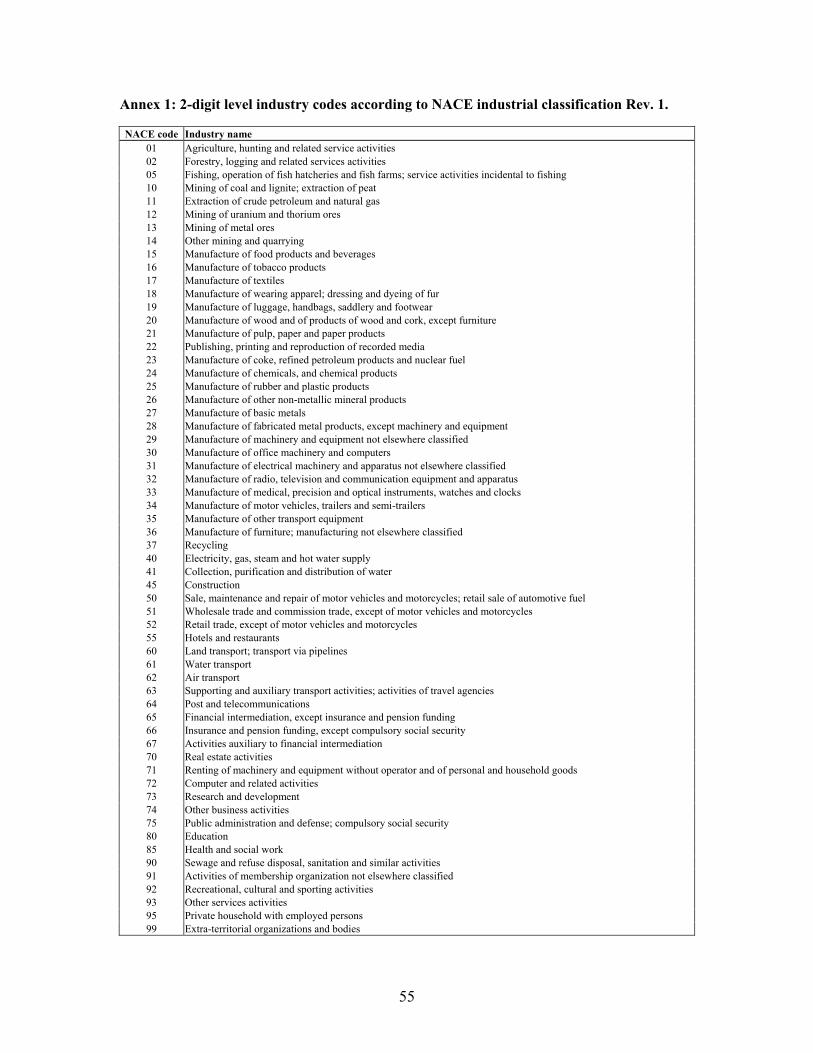
55
Annex 1: 2-digit level industry codes according to NACE industrial classification Rev. 1.
NACE code Industry name 01 Agriculture, hunting and related service activities 02 Forestry, logging and related services activities 05 Fishing, operation of fish hatcheries and fish farms; service activities incidental to fishing 10 Mining of coal and lignite; extraction of peat 11 Extraction of crude petroleum and natural gas 12 Mining of uranium and thorium ores 13 Mining of metal ores 14 Other mining and quarrying 15 Manufacture of food products and beverages 16 Manufacture of tobacco products 17 Manufacture of textiles 18 Manufacture of wearing apparel; dressing and dyeing of fur 19 Manufacture of luggage, handbags, saddlery and footwear 20 Manufacture of wood and of products of wood and cork, except furniture 21 Manufacture of pulp, paper and paper products 22 Publishing, printing and reproduction of recorded media 23 Manufacture of coke, refined petroleum products and nuclear fuel 24 Manufacture of chemicals, and chemical products 25 Manufacture of rubber and plastic products 26 Manufacture of other non-metallic mineral products 27 Manufacture of basic metals 28 Manufacture of fabricated metal products, except machinery and equipment 29 Manufacture of machinery and equipment not elsewhere classified 30 Manufacture of office machinery and computers 31 Manufacture of electrical machinery and apparatus not elsewhere classified 32 Manufacture of radio, television and communication equipment and apparatus 33 Manufacture of medical, precision and optical instruments, watches and clocks 34 Manufacture of motor vehicles, trailers and semi-trailers 35 Manufacture of other transport equipment 36 Manufacture of furniture; manufacturing not elsewhere classified 37 Recycling 40 Electricity, gas, steam and hot water supply 41 Collection, purification and distribution of water 45 Construction 50 Sale, maintenance and repair of motor vehicles and motorcycles; retail sale of automotive fuel 51 Wholesale trade and commission trade, except of motor vehicles and motorcycles 52 Retail trade, except of motor vehicles and motorcycles 55 Hotels and restaurants 60 Land transport; transport via pipelines 61 Water transport 62 Air transport 63 Supporting and auxiliary transport activities; activities of travel agencies 64 Post and telecommunications 65 Financial intermediation, except insurance and pension funding 66 Insurance and pension funding, except compulsory social security 67 Activities auxiliary to financial intermediation 70 Real estate activities 71 Renting of machinery and equipment without operator and of personal and household goods 72 Computer and related activities 73 Research and development 74 Other business activities 75 Public administration and defense; compulsory social security 80 Education 85 Health and social work 90 Sewage and refuse disposal, sanitation and similar activities 91 Activities of membership organization not elsewhere classified 92 Recreational, cultural and sporting activities 93 Other services activities 95 Private household with employed persons 99 Extra-territorial organizations and bodies
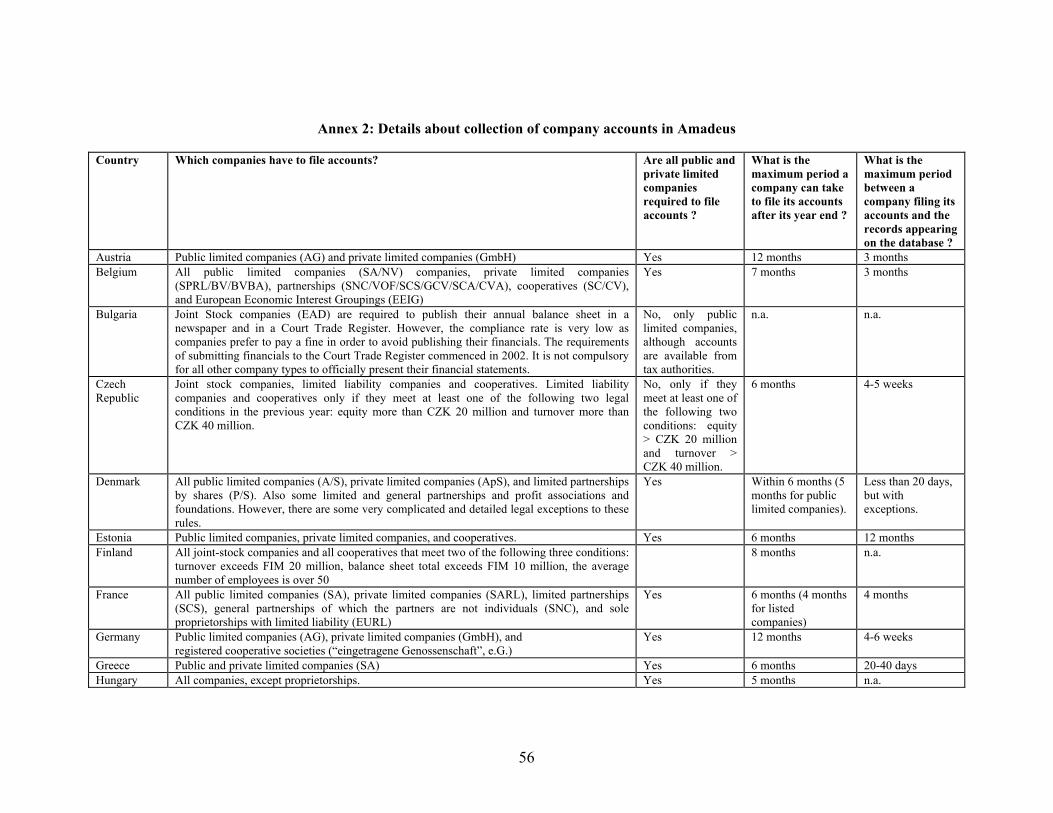
56
Annex 2: Details about collection of company accounts in Amadeus Country Which companies have to file accounts? Are all public and
private limited companies required to file accounts ?
What is the maximum period a company can take to file its accounts after its year end ?
What is the maximum period between a company filing its accounts and the records appearing on the database ?
Austria Public limited companies (AG) and private limited companies (GmbH) Yes 12 months 3 months Belgium All public limited companies (SA/NV) companies, private limited companies
(SPRL/BV/BVBA), partnerships (SNC/VOF/SCS/GCV/SCA/CVA), cooperatives (SC/CV), and European Economic Interest Groupings (EEIG)
Yes 7 months 3 months
Bulgaria Joint Stock companies (EAD) are required to publish their annual balance sheet in a newspaper and in a Court Trade Register. However, the compliance rate is very low as companies prefer to pay a fine in order to avoid publishing their financials. The requirements of submitting financials to the Court Trade Register commenced in 2002. It is not compulsory for all other company types to officially present their financial statements.
No, only public limited companies, although accounts are available from tax authorities.
n.a. n.a.
Czech Republic
Joint stock companies, limited liability companies and cooperatives. Limited liability companies and cooperatives only if they meet at least one of the following two legal conditions in the previous year: equity more than CZK 20 million and turnover more than CZK 40 million.
No, only if they meet at least one of the following two conditions: equity > CZK 20 million and turnover > CZK 40 million.
6 months 4-5 weeks
Denmark All public limited companies (A/S), private limited companies (ApS), and limited partnerships by shares (P/S). Also some limited and general partnerships and profit associations and foundations. However, there are some very complicated and detailed legal exceptions to these rules.
Yes Within 6 months (5 months for public limited companies).
Less than 20 days, but with exceptions.
Estonia Public limited companies, private limited companies, and cooperatives. Yes 6 months 12 months Finland All joint-stock companies and all cooperatives that meet two of the following three conditions:
turnover exceeds FIM 20 million, balance sheet total exceeds FIM 10 million, the average number of employees is over 50
8 months n.a.
France All public limited companies (SA), private limited companies (SARL), limited partnerships (SCS), general partnerships of which the partners are not individuals (SNC), and sole proprietorships with limited liability (EURL)
Yes 6 months (4 months for listed companies)
4 months
Germany Public limited companies (AG), private limited companies (GmbH), and registered cooperative societies (“eingetragene Genossenschaft”, e.G.)
Yes 12 months 4-6 weeks
Greece Public and private limited companies (SA) Yes 6 months 20-40 days Hungary All companies, except proprietorships. Yes 5 months n.a.
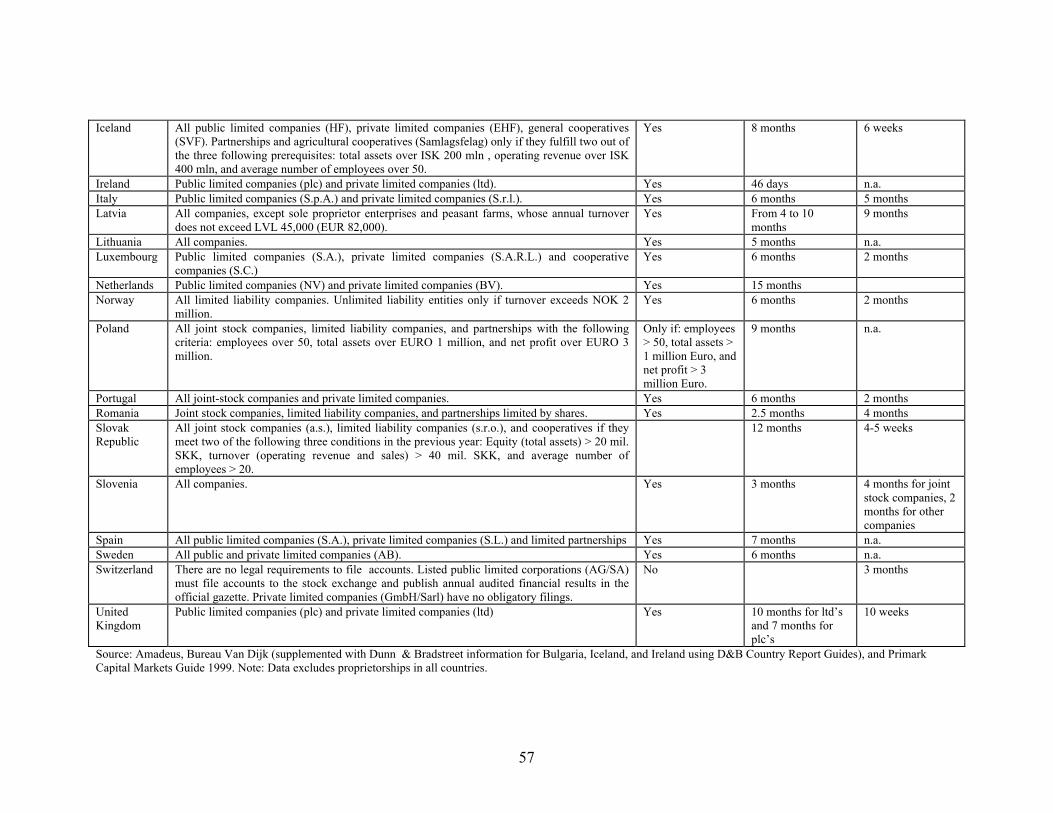
57
Iceland All public limited companies (HF), private limited companies (EHF), general cooperatives (SVF). Partnerships and agricultural cooperatives (Samlagsfelag) only if they fulfill two out of the three following prerequisites: total assets over ISK 200 mln , operating revenue over ISK 400 mln, and average number of employees over 50.
Yes 8 months 6 weeks
Ireland Public limited companies (plc) and private limited companies (ltd). Yes 46 days n.a. Italy Public limited companies (S.p.A.) and private limited companies (S.r.l.). Yes 6 months 5 months Latvia All companies, except sole proprietor enterprises and peasant farms, whose annual turnover
does not exceed LVL 45,000 (EUR 82,000). Yes From 4 to 10
months 9 months
Lithuania All companies. Yes 5 months n.a. Luxembourg
Public limited companies (S.A.), private limited companies (S.A.R.L.) and cooperative companies (S.C.)
Yes 6 months 2 months
Netherlands Public limited companies (NV) and private limited companies (BV). Yes 15 months Norway All limited liability companies. Unlimited liability entities only if turnover exceeds NOK 2
million. Yes 6 months 2 months
Poland All joint stock companies, limited liability companies, and partnerships with the following criteria: employees over 50, total assets over EURO 1 million, and net profit over EURO 3 million.
Only if: employees > 50, total assets > 1 million Euro, and net profit > 3 million Euro.
9 months n.a.
Portugal All joint-stock companies and private limited companies. Yes 6 months 2 months Romania Joint stock companies, limited liability companies, and partnerships limited by shares. Yes 2.5 months 4 months Slovak Republic
All joint stock companies (a.s.), limited liability companies (s.r.o.), and cooperatives if they meet two of the following three conditions in the previous year: Equity (total assets) > 20 mil. SKK, turnover (operating revenue and sales) > 40 mil. SKK, and average number of employees > 20.
12 months 4-5 weeks
Slovenia All companies. Yes 3 months 4 months for joint stock companies, 2 months for other companies
Spain All public limited companies (S.A.), private limited companies (S.L.) and limited partnerships Yes 7 months n.a. Sweden All public and private limited companies (AB). Yes 6 months n.a. Switzerland There are no legal requirements to file accounts. Listed public limited corporations (AG/SA)
must file accounts to the stock exchange and publish annual audited financial results in the official gazette. Private limited companies (GmbH/Sarl) have no obligatory filings.
No 3 months
United Kingdom
Public limited companies (plc) and private limited companies (ltd) Yes 10 months for ltd’s and 7 months for plc’s
10 weeks
Source: Amadeus, Bureau Van Dijk (supplemented with Dunn & Bradstreet information for Bulgaria, Iceland, and Ireland using D&B Country Report Guides), and Primark Capital Markets Guide 1999. Note: Data excludes proprietorships in all countries.
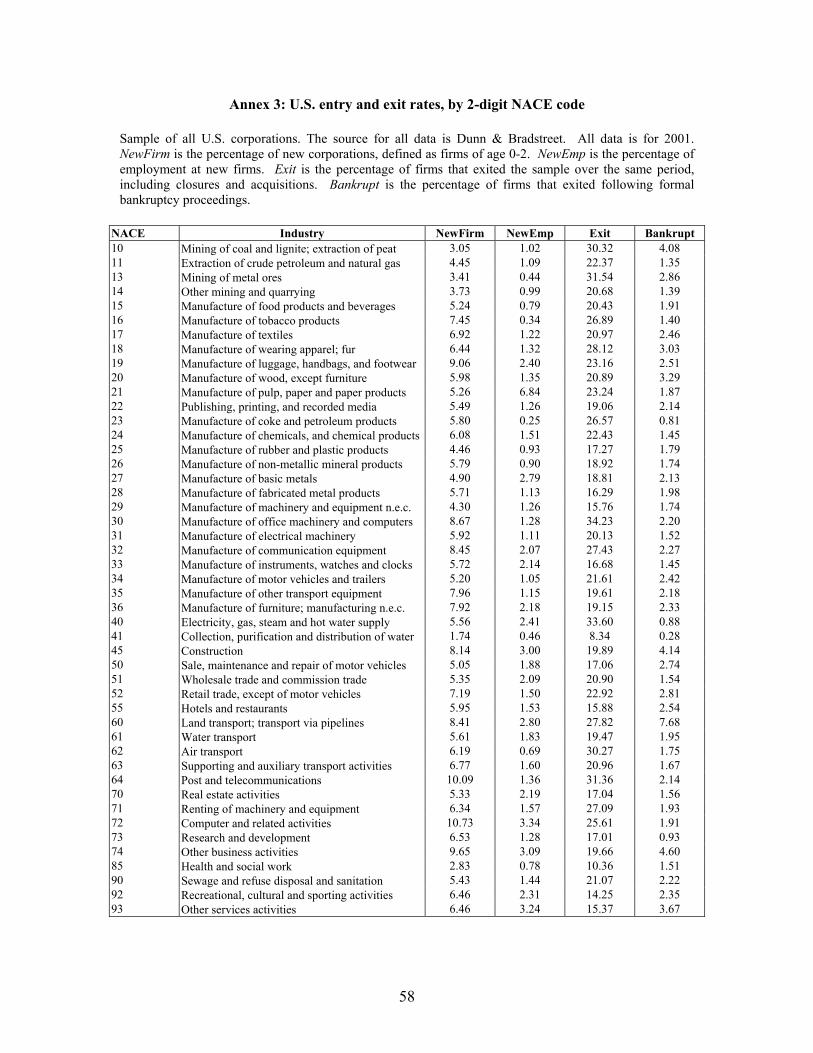
58
Annex 3: U.S. entry and exit rates, by 2-digit NACE code Sample of all U.S. corporations. The source for all data is Dunn & Bradstreet. All data is for 2001. NewFirm is the percentage of new corporations, defined as firms of age 0-2. NewEmp is the percentage of employment at new firms. Exit is the percentage of firms that exited the sample over the same period, including closures and acquisitions. Bankrupt is the percentage of firms that exited following formal bankruptcy proceedings.
NACE Industry NewFirm NewEmp Exit Bankrupt 10 Mining of coal and lignite; extraction of peat 3.05 1.02 30.32 4.08 11 Extraction of crude petroleum and natural gas 4.45 1.09 22.37 1.35 13 Mining of metal ores 3.41 0.44 31.54 2.86 14 Other mining and quarrying 3.73 0.99 20.68 1.39 15 Manufacture of food products and beverages 5.24 0.79 20.43 1.91 16 Manufacture of tobacco products 7.45 0.34 26.89 1.40 17 Manufacture of textiles 6.92 1.22 20.97 2.46 18 Manufacture of wearing apparel; fur 6.44 1.32 28.12 3.03 19 Manufacture of luggage, handbags, and footwear 9.06 2.40 23.16 2.51 20 Manufacture of wood, except furniture 5.98 1.35 20.89 3.29 21 Manufacture of pulp, paper and paper products 5.26 6.84 23.24 1.87 22 Publishing, printing, and recorded media 5.49 1.26 19.06 2.14 23 Manufacture of coke and petroleum products 5.80 0.25 26.57 0.81 24 Manufacture of chemicals, and chemical products 6.08 1.51 22.43 1.45 25 Manufacture of rubber and plastic products 4.46 0.93 17.27 1.79 26 Manufacture of non-metallic mineral products 5.79 0.90 18.92 1.74 27 Manufacture of basic metals 4.90 2.79 18.81 2.13 28 Manufacture of fabricated metal products 5.71 1.13 16.29 1.98 29 Manufacture of machinery and equipment n.e.c. 4.30 1.26 15.76 1.74 30 Manufacture of office machinery and computers 8.67 1.28 34.23 2.20 31 Manufacture of electrical machinery 5.92 1.11 20.13 1.52 32 Manufacture of communication equipment 8.45 2.07 27.43 2.27 33 Manufacture of instruments, watches and clocks 5.72 2.14 16.68 1.45 34 Manufacture of motor vehicles and trailers 5.20 1.05 21.61 2.42 35 Manufacture of other transport equipment 7.96 1.15 19.61 2.18 36 Manufacture of furniture; manufacturing n.e.c. 7.92 2.18 19.15 2.33 40 Electricity, gas, steam and hot water supply 5.56 2.41 33.60 0.88 41 Collection, purification and distribution of water 1.74 0.46 8.34 0.28 45 Construction 8.14 3.00 19.89 4.14 50 Sale, maintenance and repair of motor vehicles 5.05 1.88 17.06 2.74 51 Wholesale trade and commission trade 5.35 2.09 20.90 1.54 52 Retail trade, except of motor vehicles 7.19 1.50 22.92 2.81 55 Hotels and restaurants 5.95 1.53 15.88 2.54 60 Land transport; transport via pipelines 8.41 2.80 27.82 7.68 61 Water transport 5.61 1.83 19.47 1.95 62 Air transport 6.19 0.69 30.27 1.75 63 Supporting and auxiliary transport activities 6.77 1.60 20.96 1.67 64 Post and telecommunications 10.09 1.36 31.36 2.14 70 Real estate activities 5.33 2.19 17.04 1.56 71 Renting of machinery and equipment 6.34 1.57 27.09 1.93 72 Computer and related activities 10.73 3.34 25.61 1.91 73 Research and development 6.53 1.28 17.01 0.93 74 Other business activities 9.65 3.09 19.66 4.60 85 Health and social work 2.83 0.78 10.36 1.51 90 Sewage and refuse disposal and sanitation 5.43 1.44 21.07 2.22 92 Recreational, cultural and sporting activities 6.46 2.31 14.25 2.35 93 Other services activities 6.46 3.24 15.37 3.67
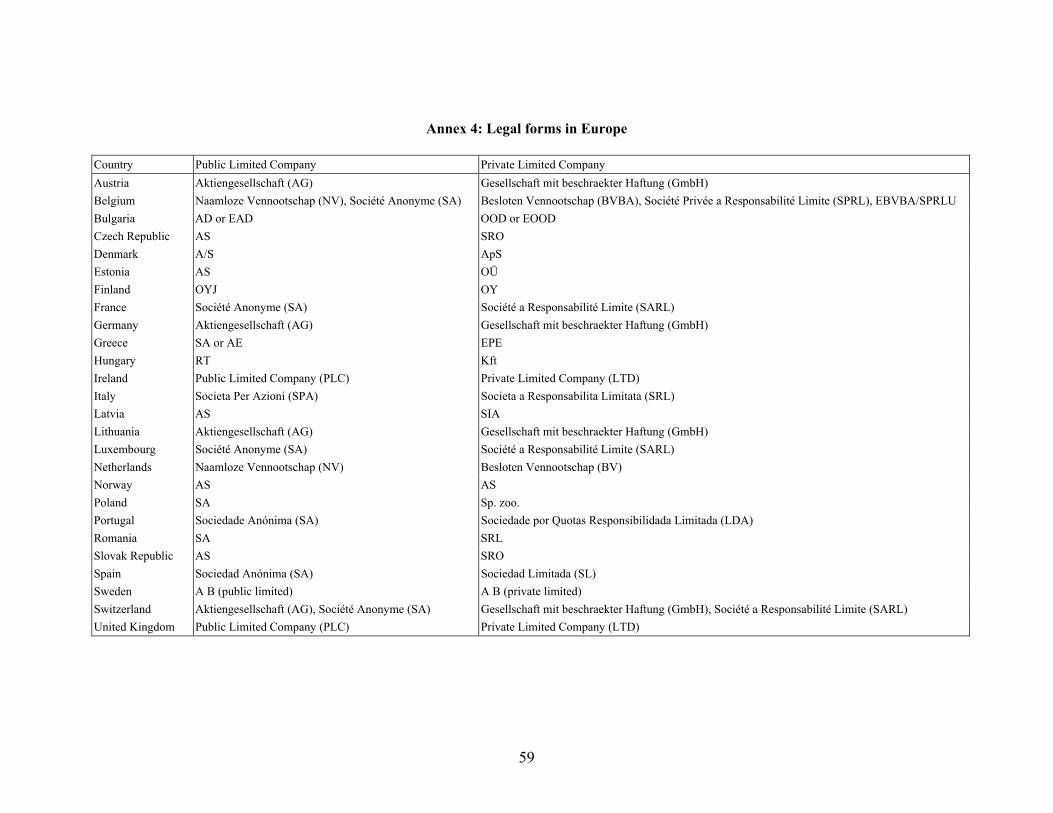
59
Annex 4: Legal forms in Europe
Country Public Limited Company Private Limited Company Austria Aktiengesellschaft (AG) Gesellschaft mit beschraekter Haftung (GmbH) Belgium Naamloze Vennootschap (NV), Société Anonyme (SA) Besloten Vennootschap (BVBA), Société Privée a Responsabilité Limite (SPRL), EBVBA/SPRLU Bulgaria AD or EAD OOD or EOOD Czech Republic AS SRO Denmark A/S ApS Estonia AS OÜ Finland OYJ OY France Société Anonyme (SA) Société a Responsabilité Limite (SARL) Germany Aktiengesellschaft (AG) Gesellschaft mit beschraekter Haftung (GmbH) Greece SA or AE EPE Hungary RT Kft Ireland Public Limited Company (PLC) Private Limited Company (LTD) Italy Societa Per Azioni (SPA) Societa a Responsabilita Limitata (SRL) Latvia AS SIA Lithuania Aktiengesellschaft (AG) Gesellschaft mit beschraekter Haftung (GmbH) Luxembourg Société Anonyme (SA) Société a Responsabilité Limite (SARL) Netherlands Naamloze Vennootschap (NV) Besloten Vennootschap (BV) Norway AS AS Poland SA Sp. zoo. Portugal Sociedade Anónima (SA) Sociedade por Quotas Responsibilidada Limitada (LDA) Romania SA SRL Slovak Republic AS SRO Spain Sociedad Anónima (SA) Sociedad Limitada (SL) Sweden A B (public limited) A B (private limited) Switzerland Aktiengesellschaft (AG), Société Anonyme (SA) Gesellschaft mit beschraekter Haftung (GmbH), Société a Responsabilité Limite (SARL) United Kingdom Public Limited Company (PLC) Private Limited Company (LTD)