An Introduction to Assessment and Navigating the (Online ...

NAVIGATING PRELOAD ASSESSMENT
CHOOSING THE RIGHT PATHWAYCecilia Baylon & Sarah Neville
LEARNING OBJECTIVES
• Explain the relationship between preload and fluid responsiveness (FR)
• Review the different methods of assessing preload and FR
• Analyze the current research in regard to their use in the critical care setting
RespiratoryMuscle
Function
LungCompliance
Work ofBreathing
RespiratoryRate
Tidal VolumeVital CapacityFunctionalResid. Capac
Ventilation
ARTERIAL OXYGENSATURATION
Sa02
pH, PC022,3 DPG
CARDIACOUTPUT
Alveoli Perfused?
AlveoliVentilated?
Thickness ofAlveolar-Capillary
Membraneetc
V/QMatching Diffusion
ALVEOLARGAS EXCHANGE
OxygenHgb
Affinity
HgbLevel
Oxygentransported
in blood
ARTERIALOXYGEN
CONTENT
OXYGENSUPPLY
CARDIAC OUTPUT
STROKEVOLUME
HEARTRATE
Contractility Preload Afterload
VenousReturn
TotalCirculating
Volume
Vessel Diameter(PeripheralVascular
Resistance) Blood Viscosity
AorticImpedence
OXYGENDEMAND
METABOLICDEMANDS
Temperature
PhysicalActivity
EmotionalStressie: pain
End organ perfusionBALANCE
Pa02
PaCO2
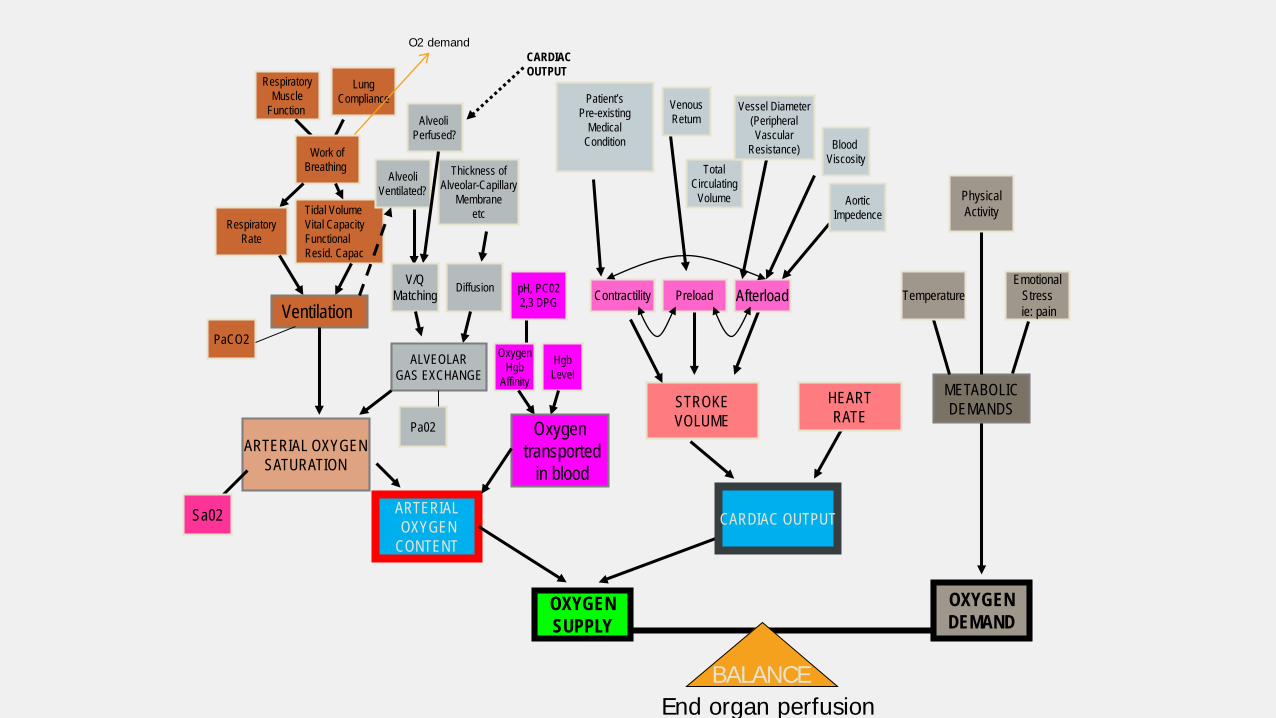
O2 demand
Patient’sPre-existing
MedicalCondition
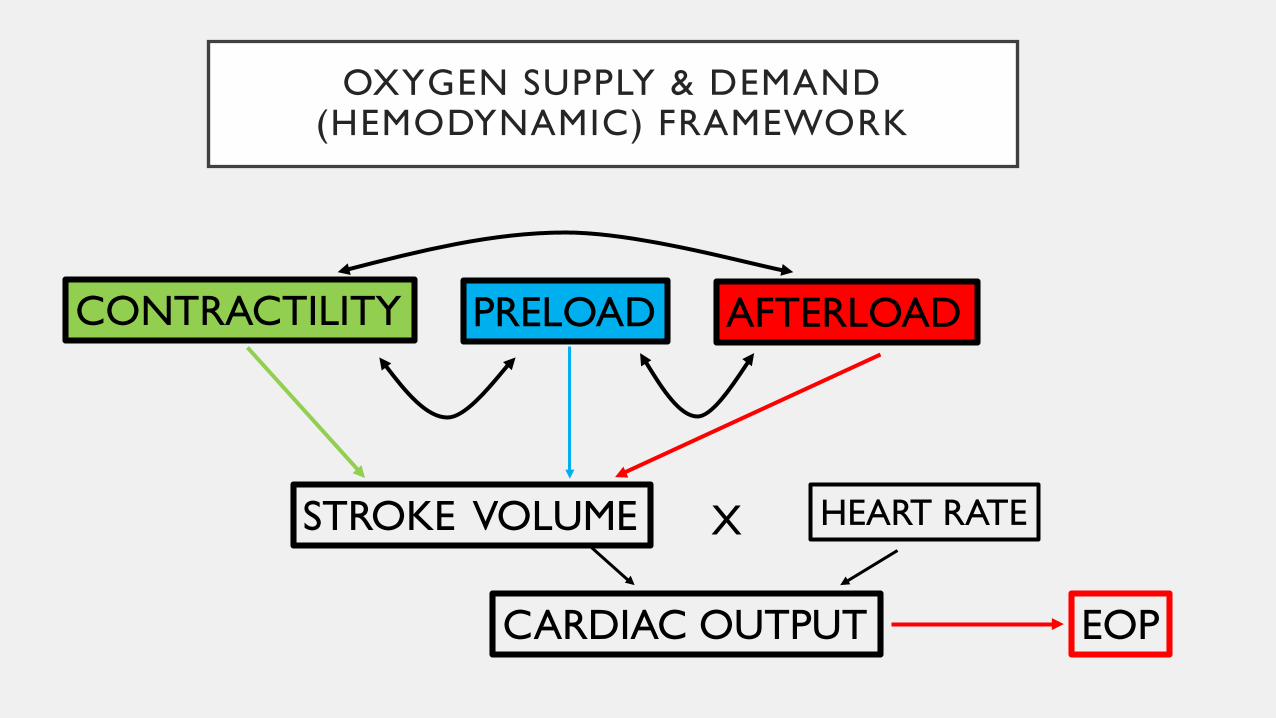
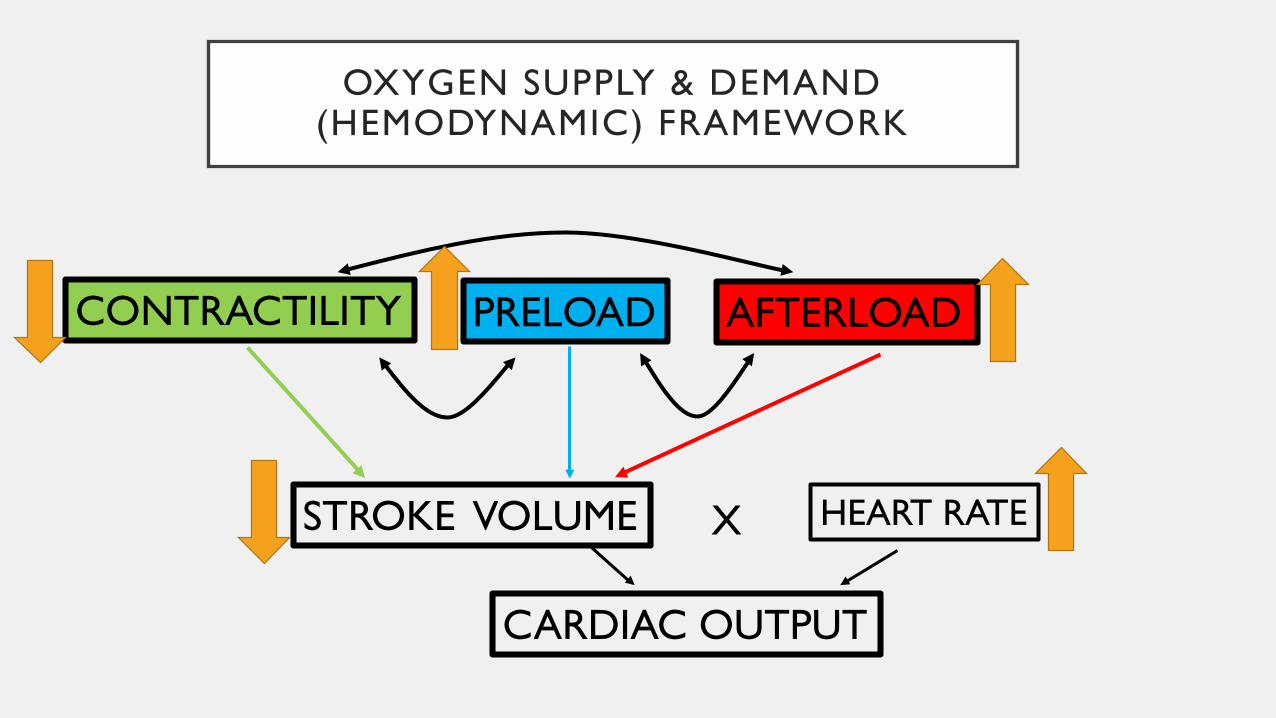
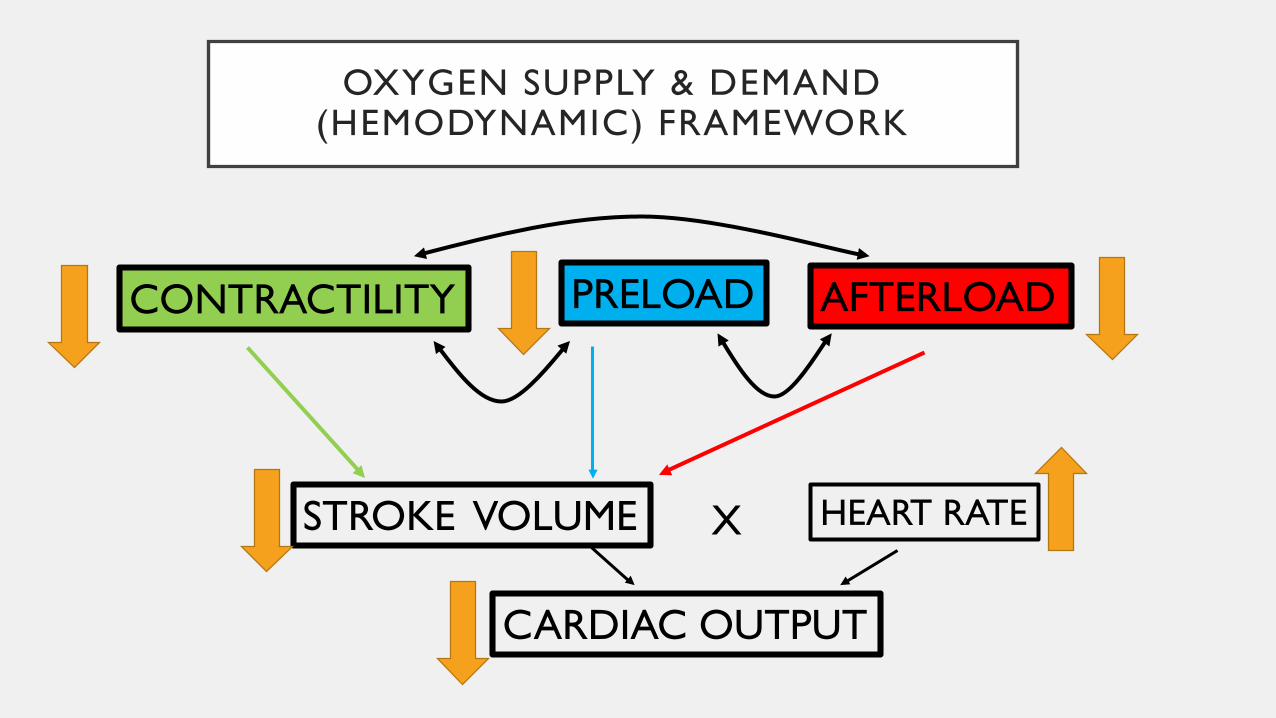
OXYGEN SUPPLY & DEMAND (HEMODYNAMIC) FRAMEWORK
PRELOADCONTRACTILITY AFTERLOAD
STROKE VOLUME HEART RATE
CARDIAC OUTPUT
X
EOP
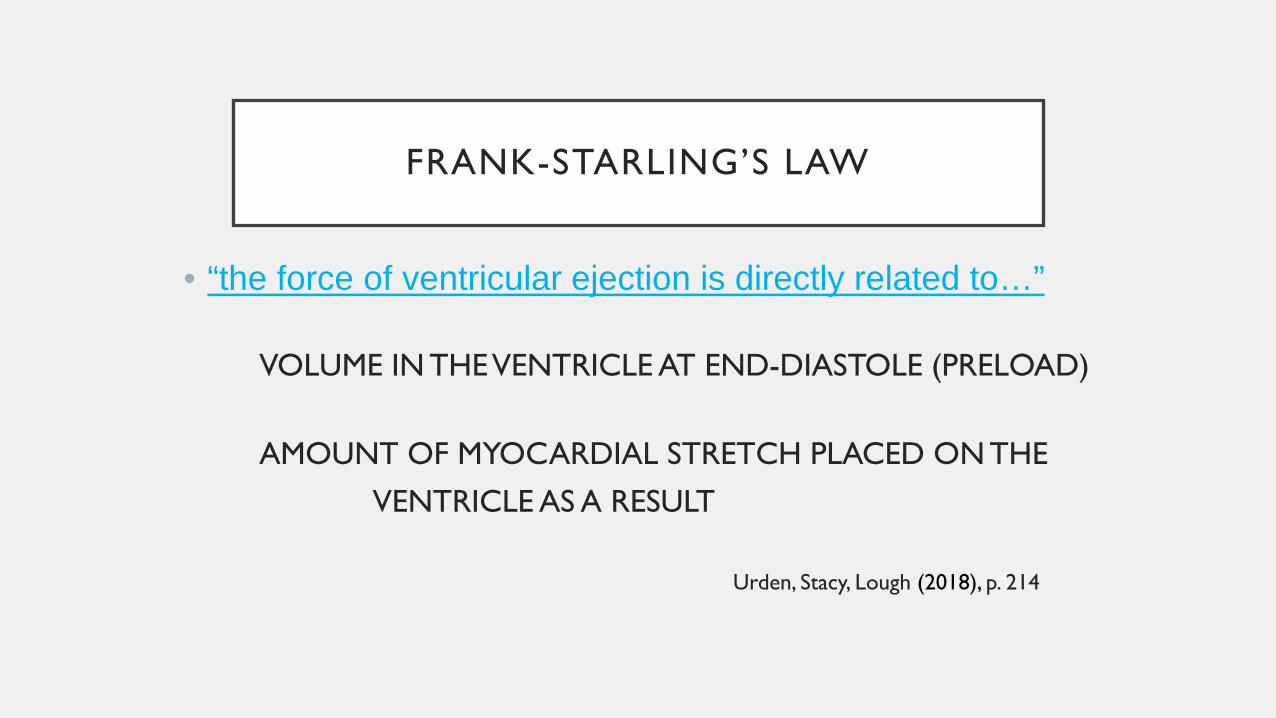
FRANK-STARLING’S LAW
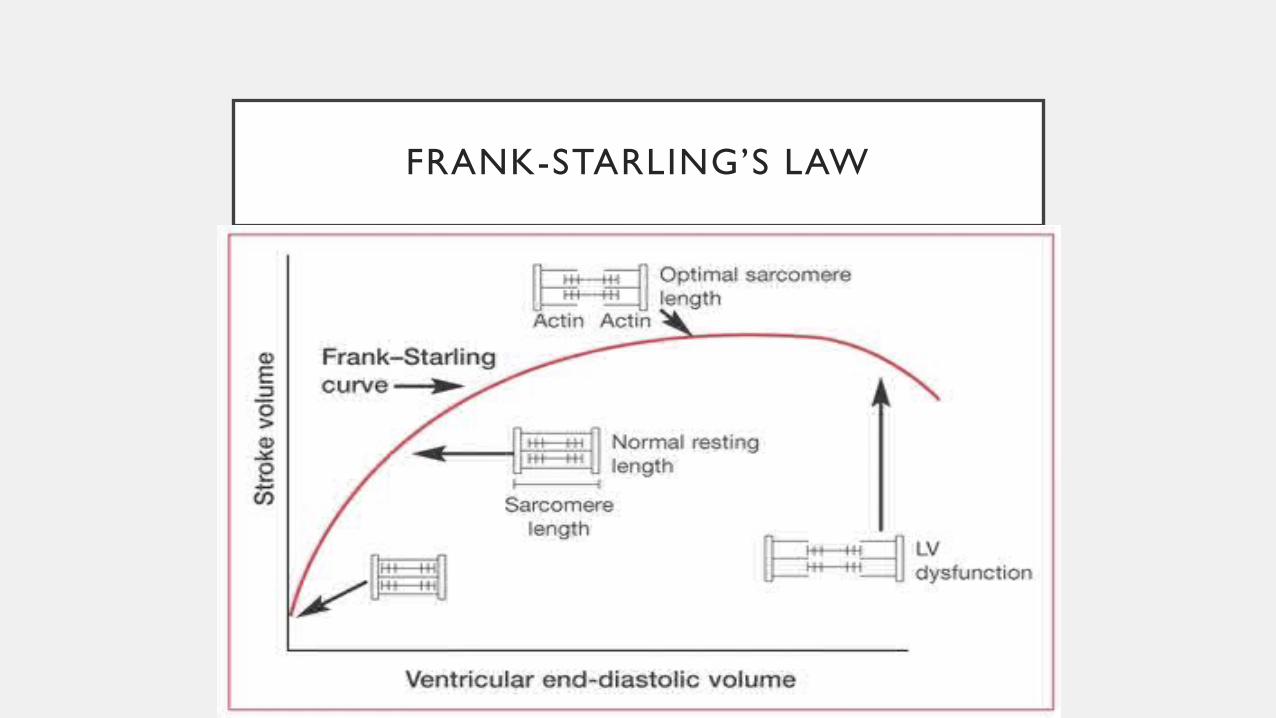
FRANK-STARLING’S LAW
• “the force of ventricular ejection is directly related to…”
VOLUME IN THE VENTRICLE AT END-DIASTOLE (PRELOAD)
AMOUNT OF MYOCARDIAL STRETCH PLACED ON THE VENTRICLE AS A RESULT
Urden, Stacy, Lough (2018), p. 214
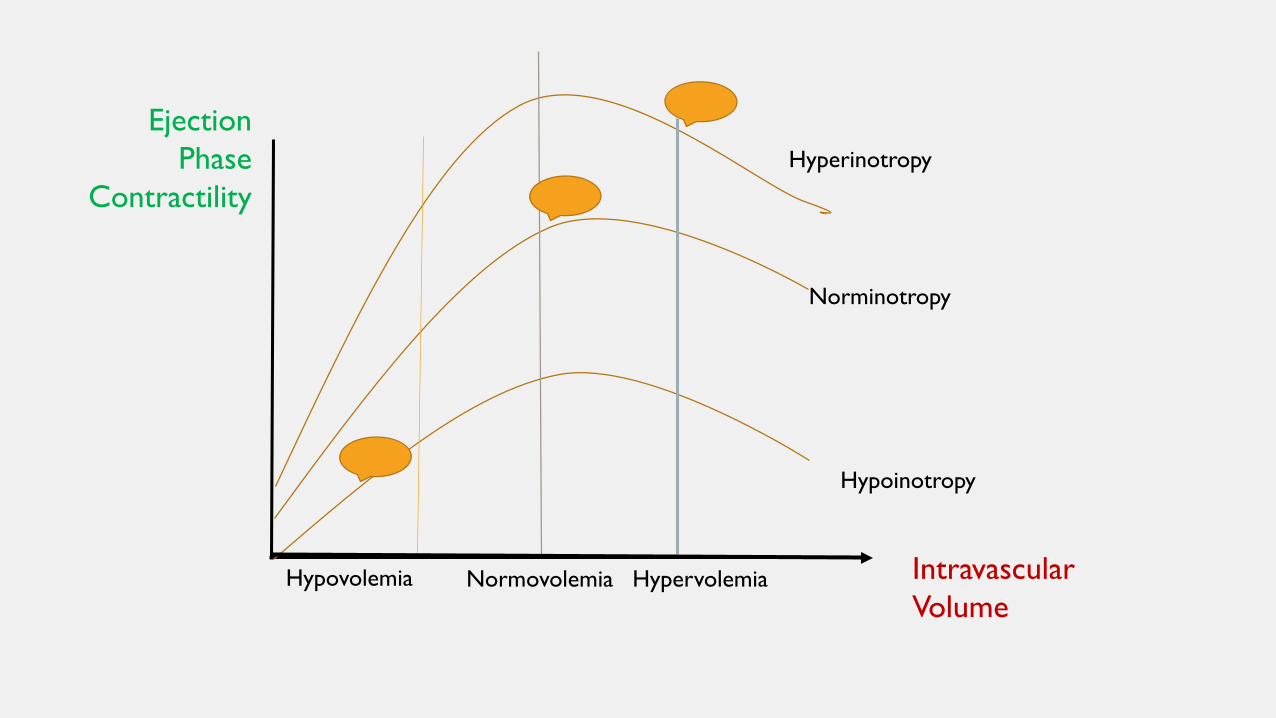
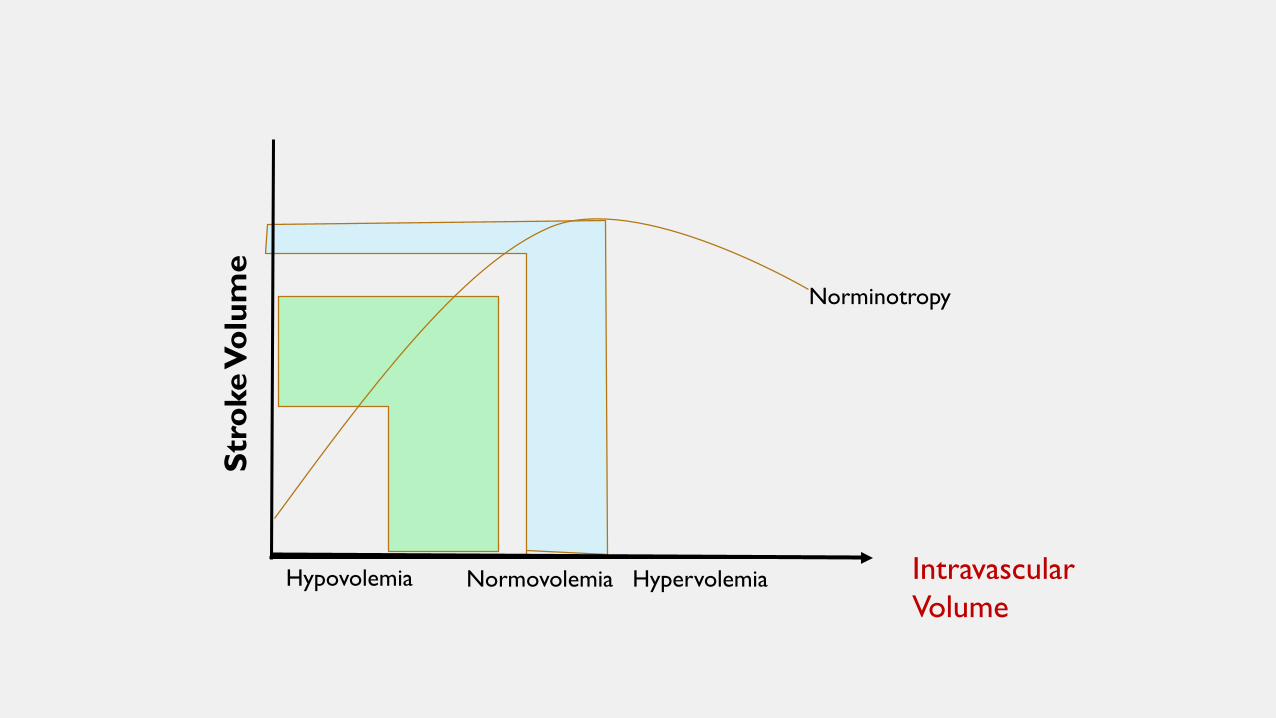
Hypovolemia Normovolemia Hypervolemia
Hyperinotropy
Norminotropy
Hypoinotropy
Intravascular Volume
EjectionPhase
Contractility
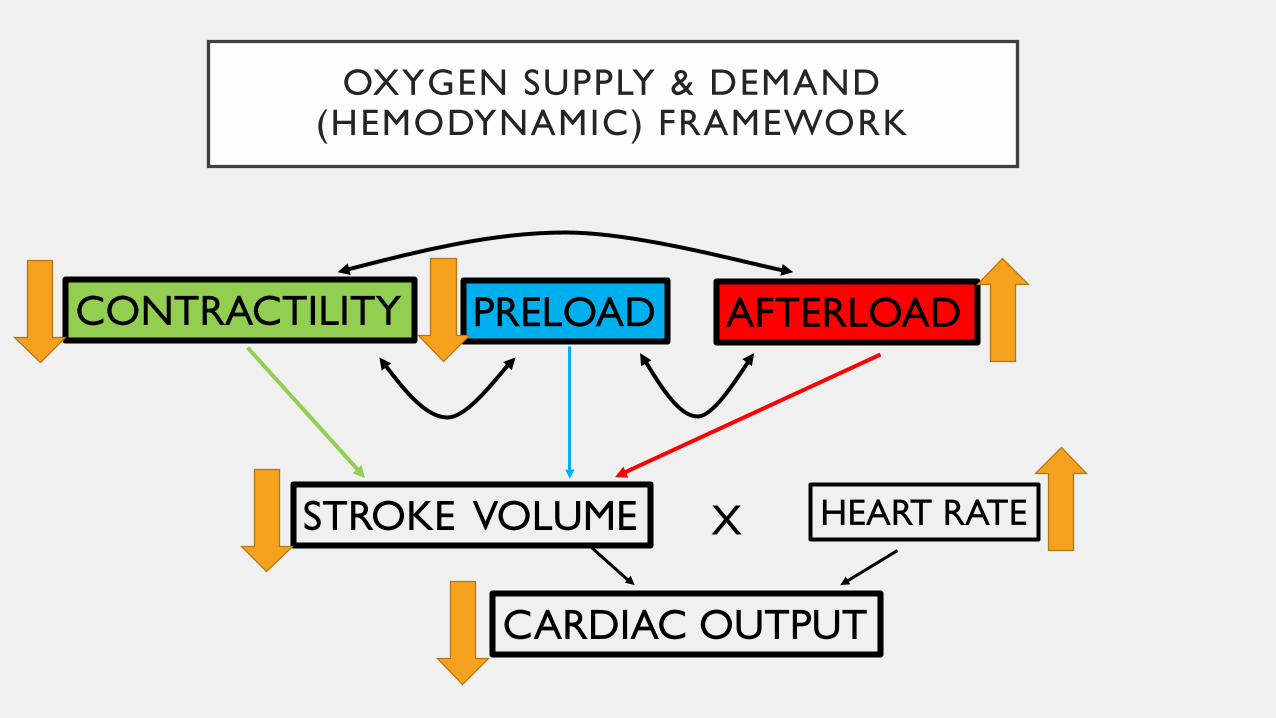
OXYGEN SUPPLY & DEMAND (HEMODYNAMIC) FRAMEWORK
PRELOADCONTRACTILITY AFTERLOAD
STROKE VOLUME HEART RATE
CARDIAC OUTPUT
X
OXYGEN SUPPLY & DEMAND (HEMODYNAMIC) FRAMEWORK
PRELOADCONTRACTILITY AFTERLOAD
STROKE VOLUME HEART RATE
CARDIAC OUTPUT
X
OXYGEN SUPPLY & DEMAND (HEMODYNAMIC) FRAMEWORK
PRELOADCONTRACTILITY AFTERLOAD
STROKE VOLUME HEART RATE
CARDIAC OUTPUT
X
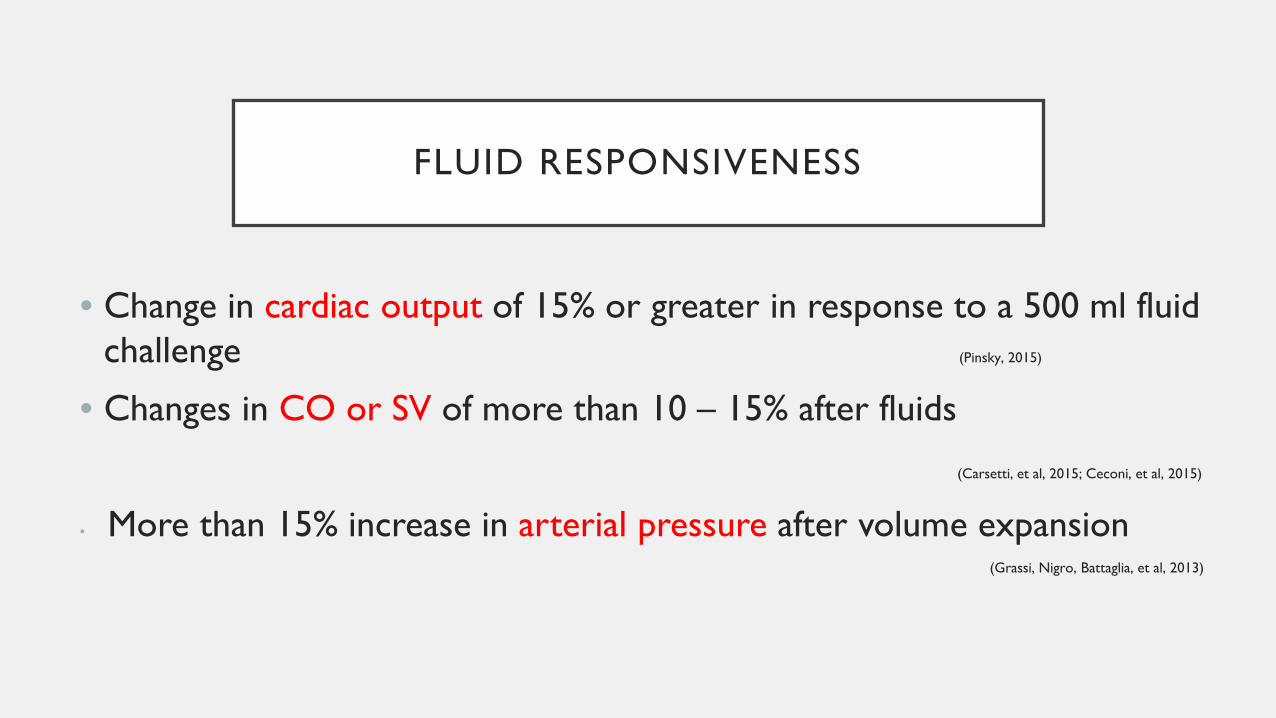
FLUID RESPONSIVENESS
• Change in cardiac output of 15% or greater in response to a 500 ml fluid challenge (Pinsky, 2015)
• Changes in CO or SV of more than 10 – 15% after fluids
(Carsetti, et al, 2015; Ceconi, et al, 2015)
• More than 15% increase in arterial pressure after volume expansion (Grassi, Nigro, Battaglia, et al, 2013)
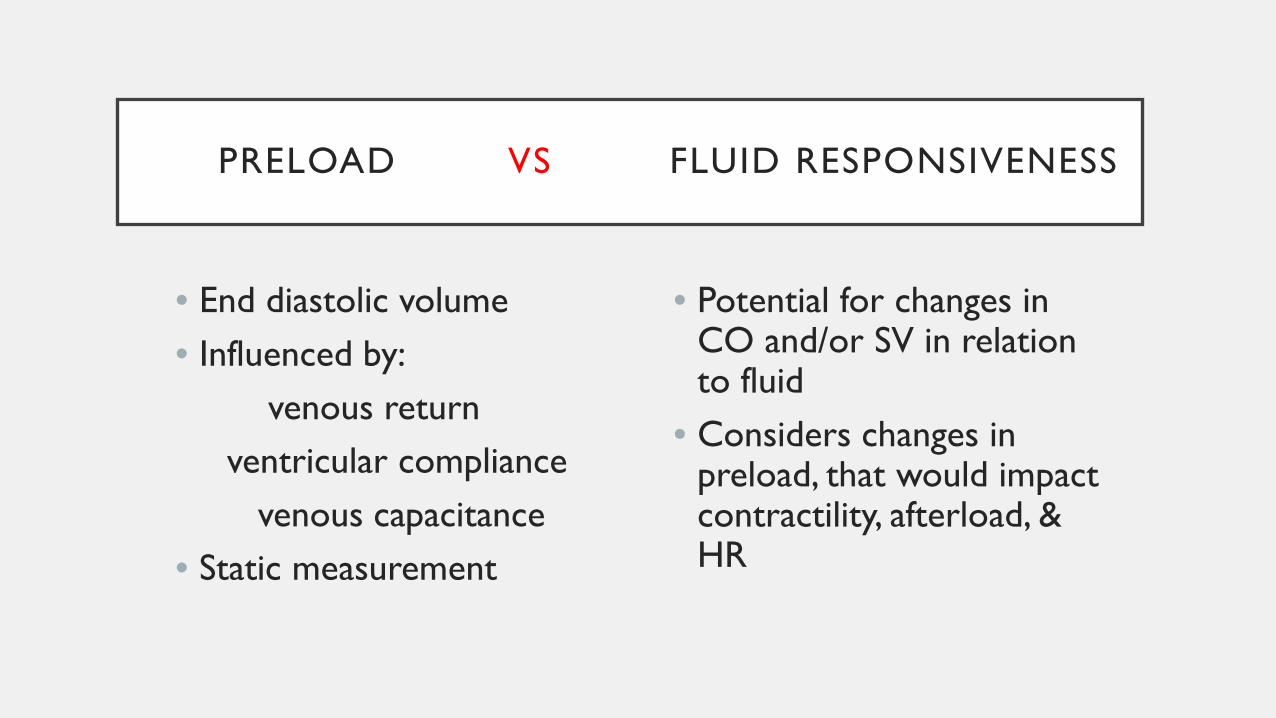
PRELOAD VS FLUID RESPONSIVENESS
• End diastolic volume• Influenced by:
venous returnventricular compliance
venous capacitance• Static measurement
• Potential for changes in CO and/or SV in relation to fluid
• Considers changes in preload, that would impact contractility, afterload, & HR
Hypovolemia Normovolemia Hypervolemia
Norminotropy
Intravascular Volume
Stro
ke V
olum
e
PRELOAD VS FLUID RESPONSIVENESS
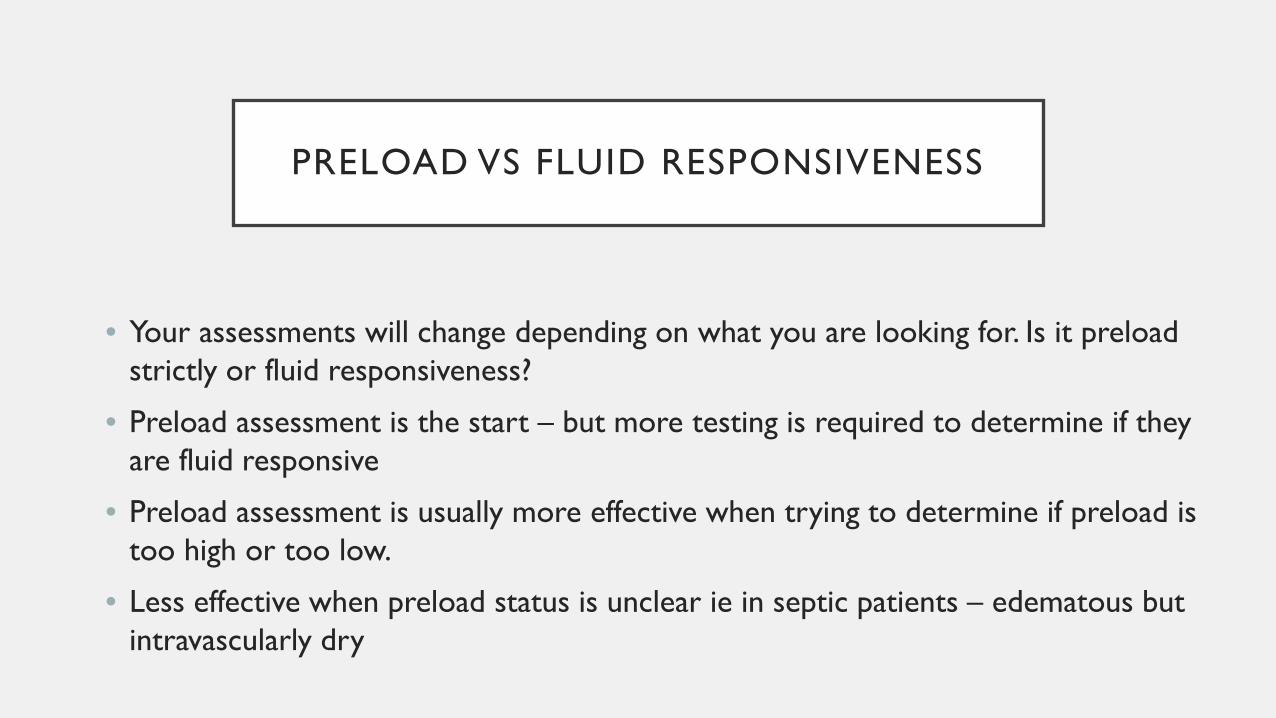
• Your assessments will change depending on what you are looking for. Is it preload strictly or fluid responsiveness?
• Preload assessment is the start – but more testing is required to determine if they are fluid responsive
• Preload assessment is usually more effective when trying to determine if preload is too high or too low.
• Less effective when preload status is unclear ie in septic patients – edematous but intravascularly dry
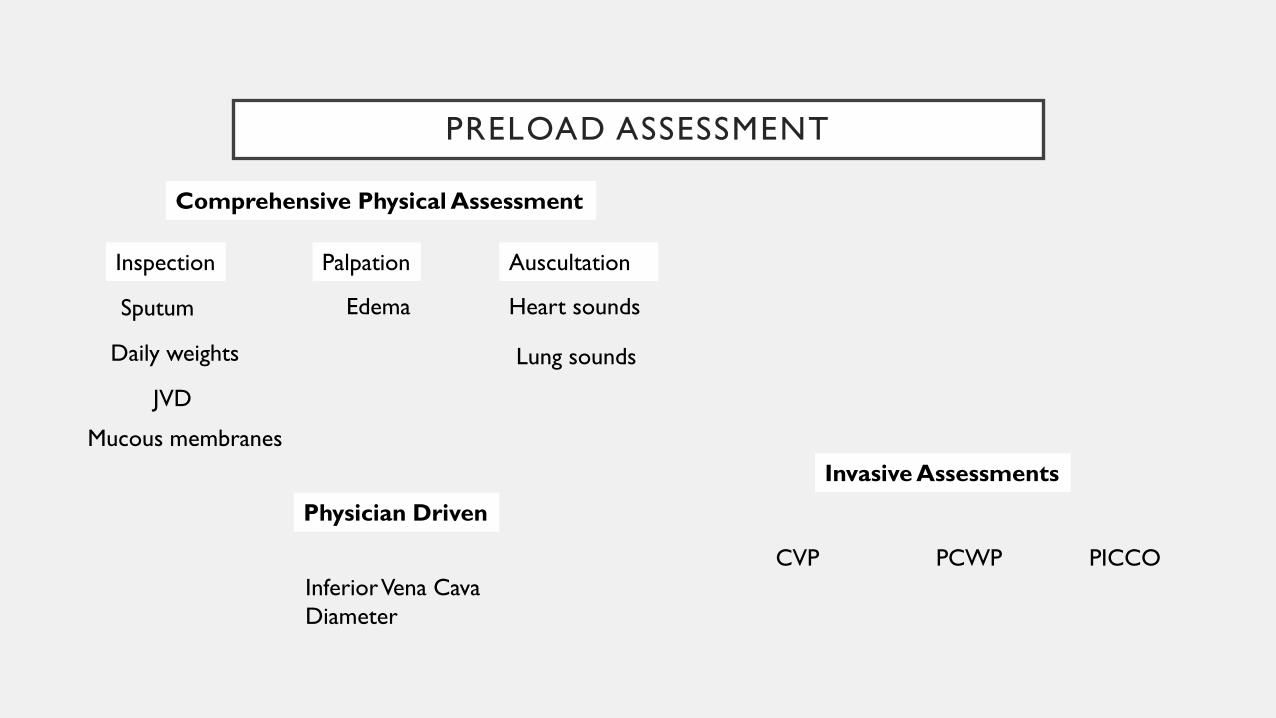
PRELOAD ASSESSMENT
Comprehensive Physical Assessment
Inspection
JVD
Daily weights
Mucous membranes
Sputum
Palpation
Edema
Auscultation
Heart sounds
Lung sounds
Invasive Assessments
CVP PCWP PICCOInferior Vena Cava Diameter
Physician Driven
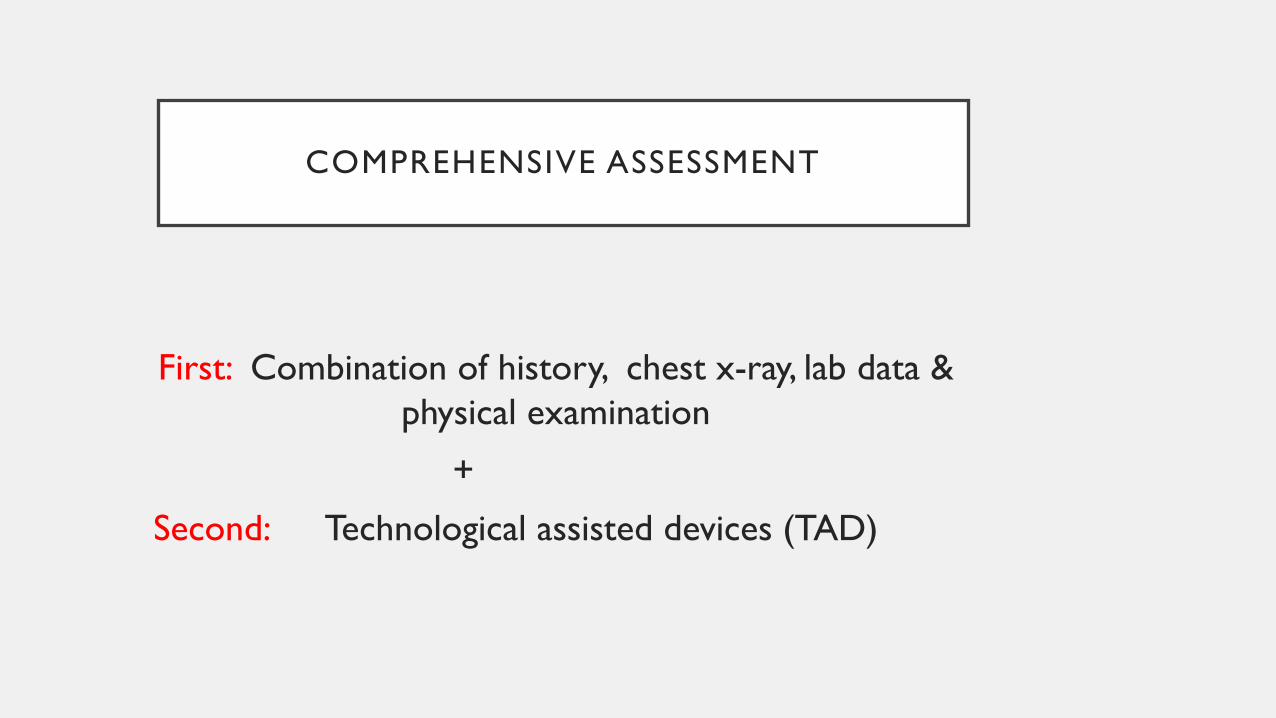
COMPREHENSIVE ASSESSMENT
First: Combination of history, chest x-ray, lab data & physical examination
+
Second: Technological assisted devices (TAD)
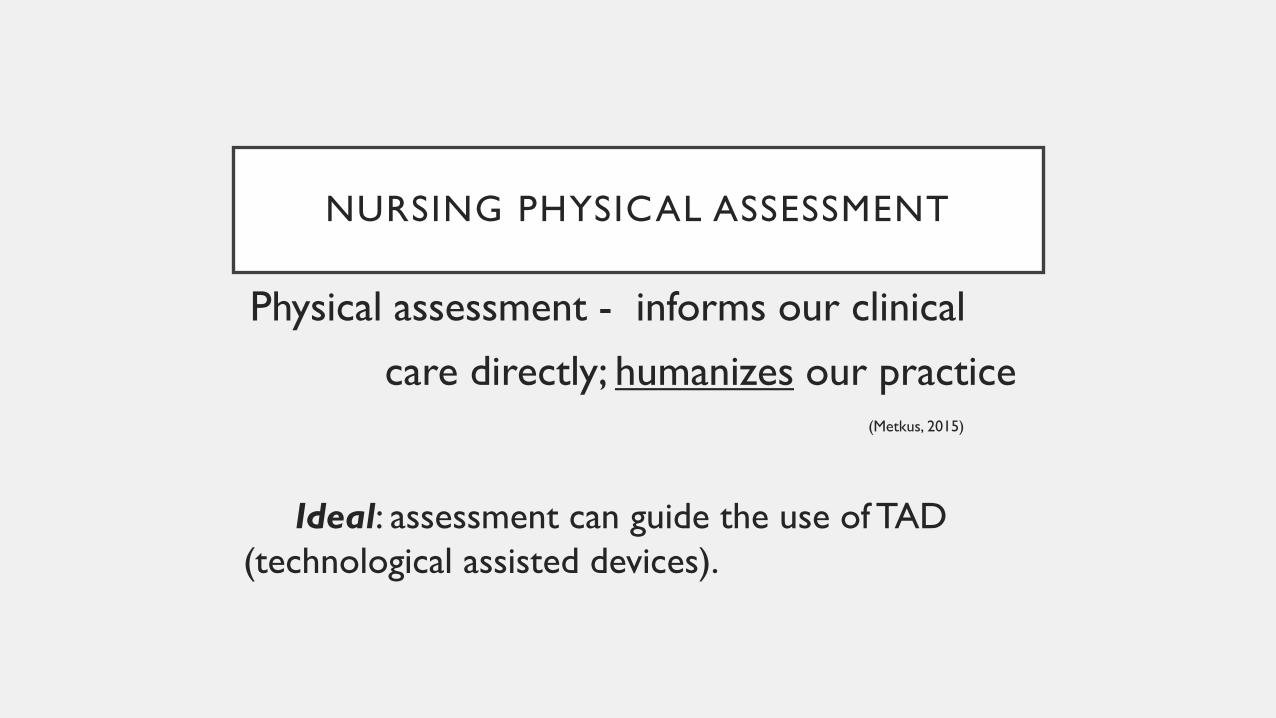
NURSING PHYSICAL ASSESSMENT
Physical assessment - informs our clinical
care directly; humanizes our practice(Metkus, 2015)
Ideal: assessment can guide the use of TAD (technological assisted devices).

NURSING PHYSICAL ASSESSMENT
Physical assessment - “immediately available, rapid and repeatable, relatively inexpensive, safe, and non-invasive.”
(Elder, et al, 2016, p. 11)
NURSING COMPREHENSIVE ASSESSMENTSTARTS WITH…
• Patient history
- Admitting diagnosis (decompensated HF, sepsis or hypovolemic shock)
- History of fluid loss or gains (N&V, diarrhea. bleeding, excessive fluid intake)
- History of heart failure or kidney failure
- Diabetes (new or uncontrolled)
- Liver failure
NURSING ASSESSMENTP R E L OA D
Do a systems review or head to toe assessment.Then…Categorize data together…
PHYSICAL ASSESSMENTP R E L OA D
Inspection
• Jugular venous distention
• Daily weights
• Mucous membranes
• Sputum type – thin pink frothy
NURSING ASSESSMENT
PALPATION• EDEMA
- FLUID ACCUMULATION IN THE EXTRAVASCULAR SPACES OF THE BODY
dependentunilateral or bilateralpitting or non-pitting
- Not the most reliable indicator of preload especiallyin critically ill patients
• SKIN TURGOR
URDEN, STACEY & LOUGH (2018)
NURSING ASSESSMENTP R E L OA D
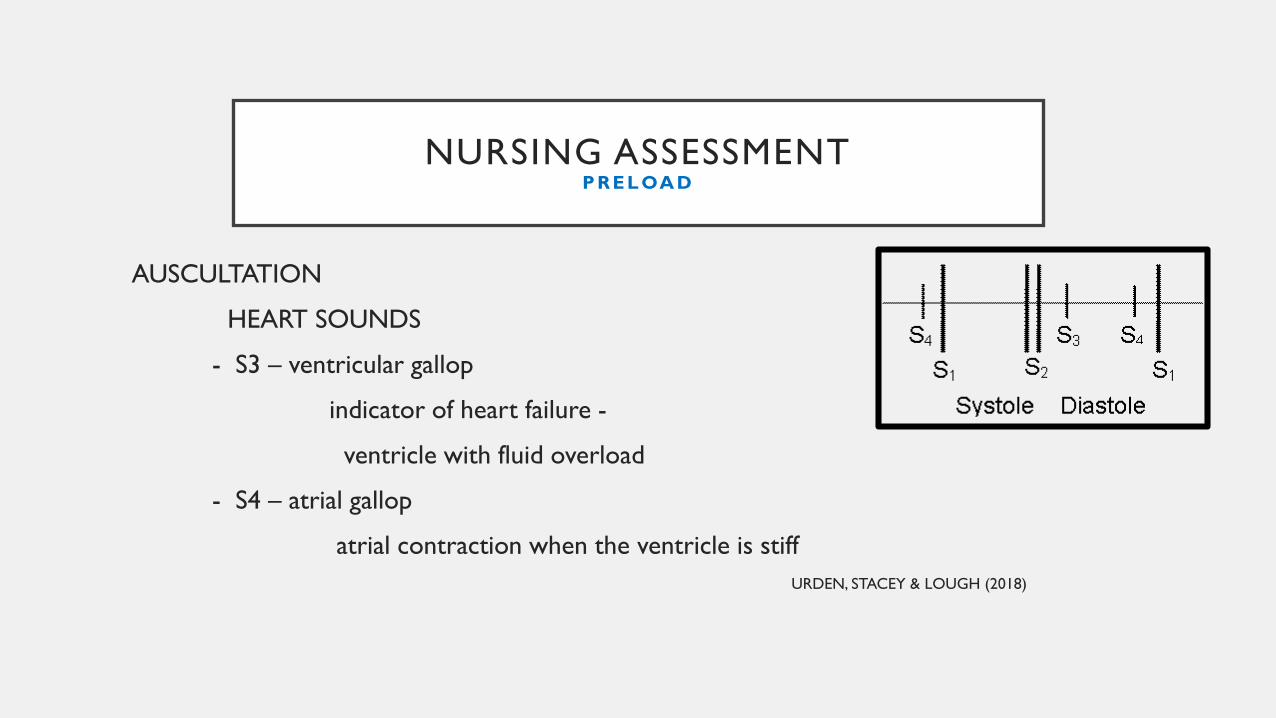
AUSCULTATION
HEART SOUNDS
- S3 – ventricular gallop
indicator of heart failure -
ventricle with fluid overload
- S4 – atrial gallop
atrial contraction when the ventricle is stiff URDEN, STACEY & LOUGH (2018)
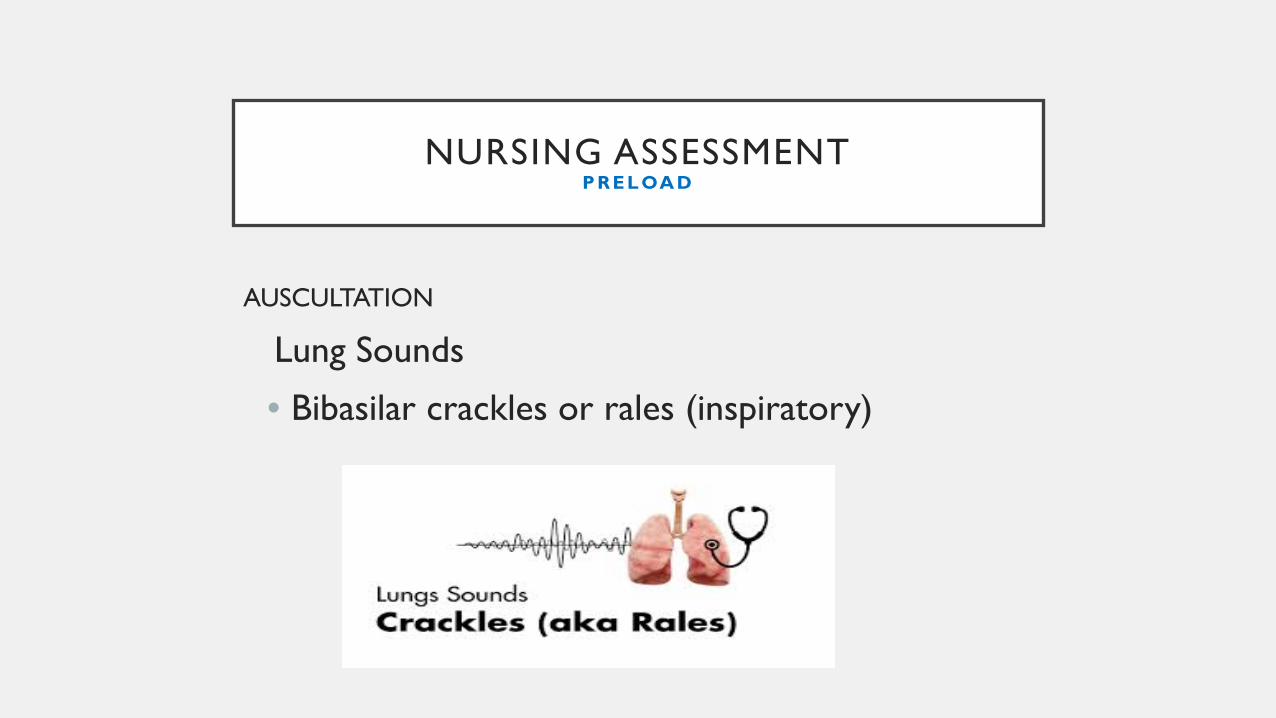
AUSCULTATION
Lung Sounds
• Bibasilar crackles or rales (inspiratory)
NURSING ASSESSMENTP R E L OA D
NURSING PHYSICAL ASSESSMENT
Integration
• It is important to look at the whole picture as noted with the framework concepts, so we will also look at assessment parameters for afterload and contractility.
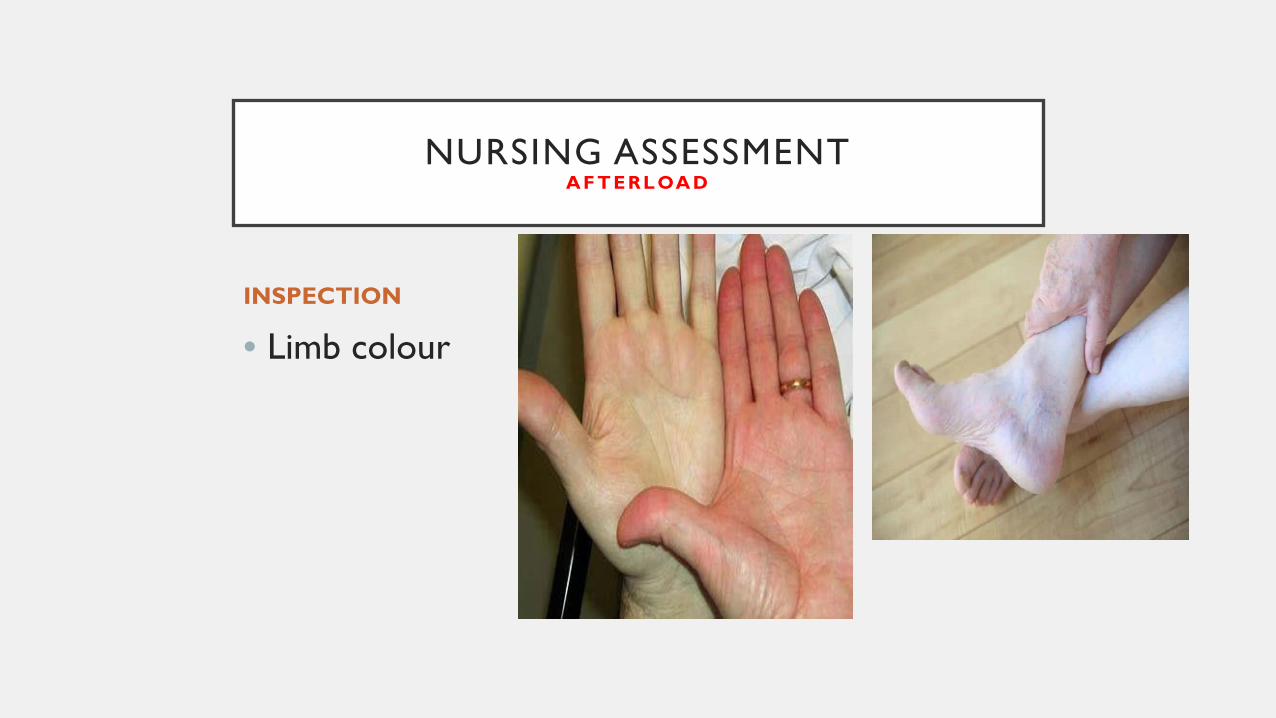
INSPECTION
• Limb colour
NURSING ASSESSMENTA F T E R L OA D
NURSING ASSESSMENTA F T E R L OA D
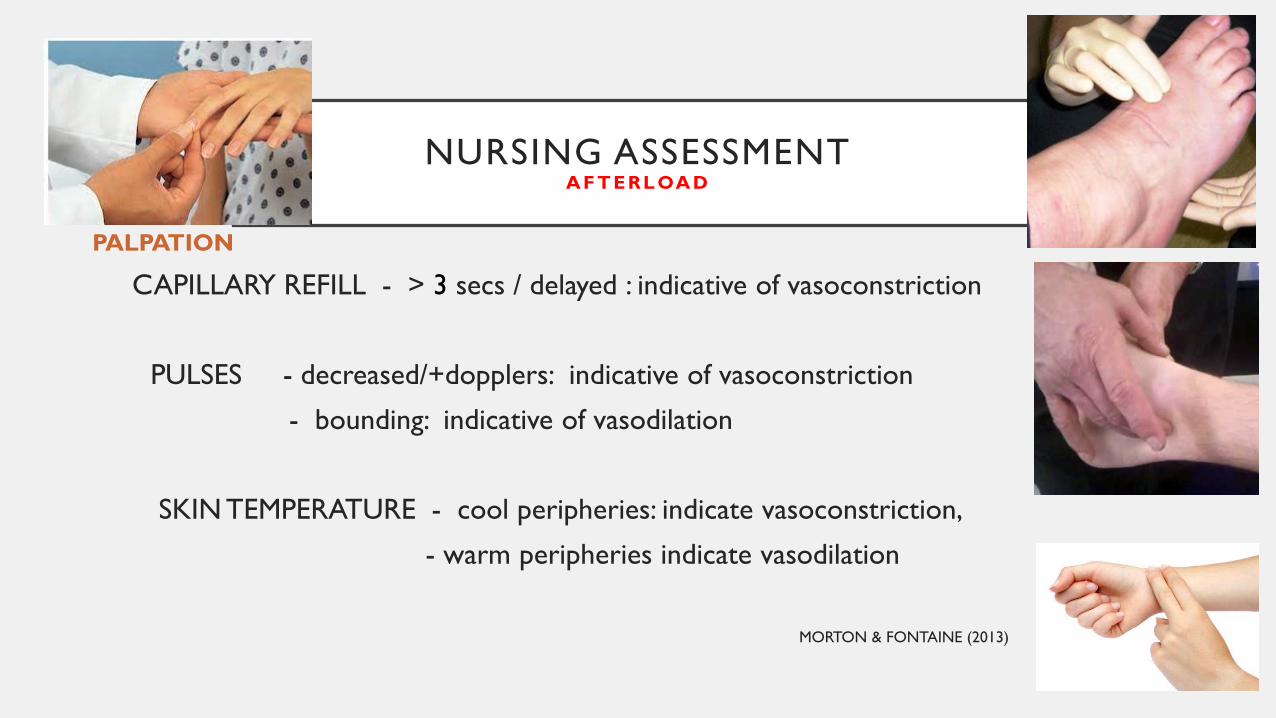
PALPATION
CAPILLARY REFILL - > 3 secs / delayed : indicative of vasoconstriction
PULSES - decreased/+dopplers: indicative of vasoconstriction
- bounding: indicative of vasodilation
SKIN TEMPERATURE - cool peripheries: indicate vasoconstriction,
- warm peripheries indicate vasodilation
MORTON & FONTAINE (2013)
NURSING ASSESSMENTA F T E R L OA D
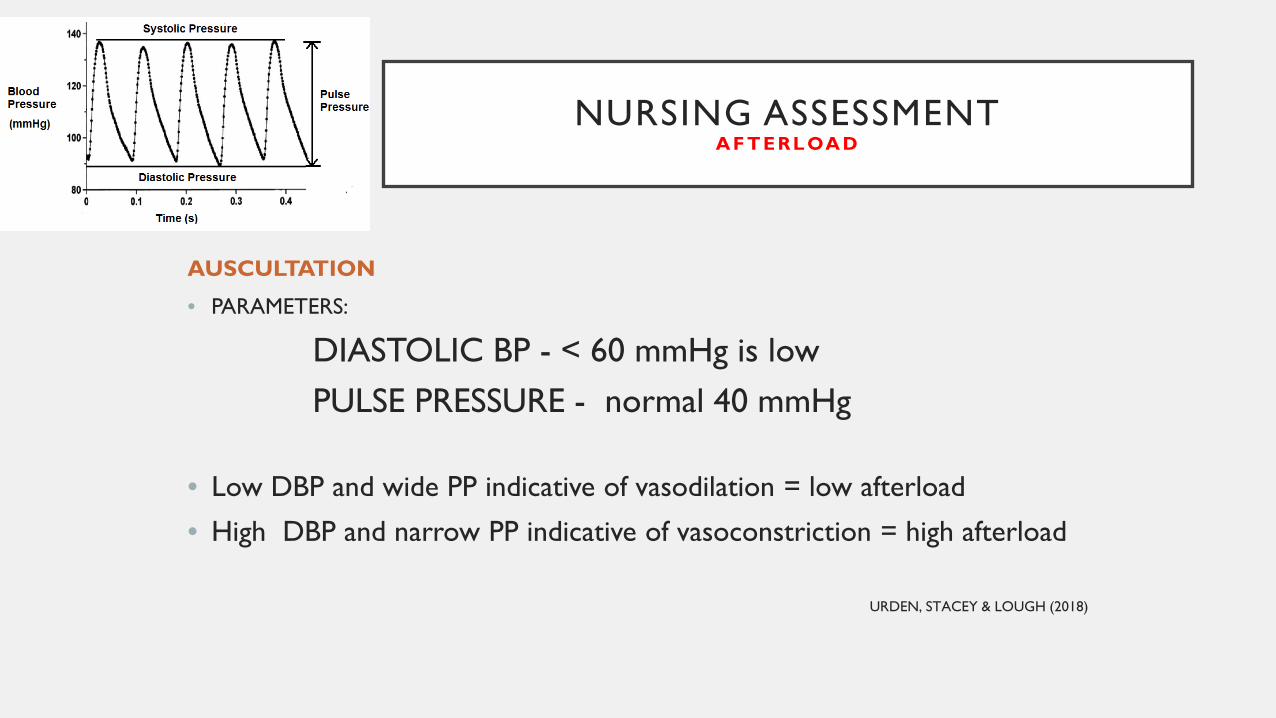
AUSCULTATION
• PARAMETERS:
DIASTOLIC BP - < 60 mmHg is lowPULSE PRESSURE - normal 40 mmHg
• Low DBP and wide PP indicative of vasodilation = low afterload
• High DBP and narrow PP indicative of vasoconstriction = high afterload
URDEN, STACEY & LOUGH (2018)
NURSING ASSESSMENTC O N T R AC T I L IT Y
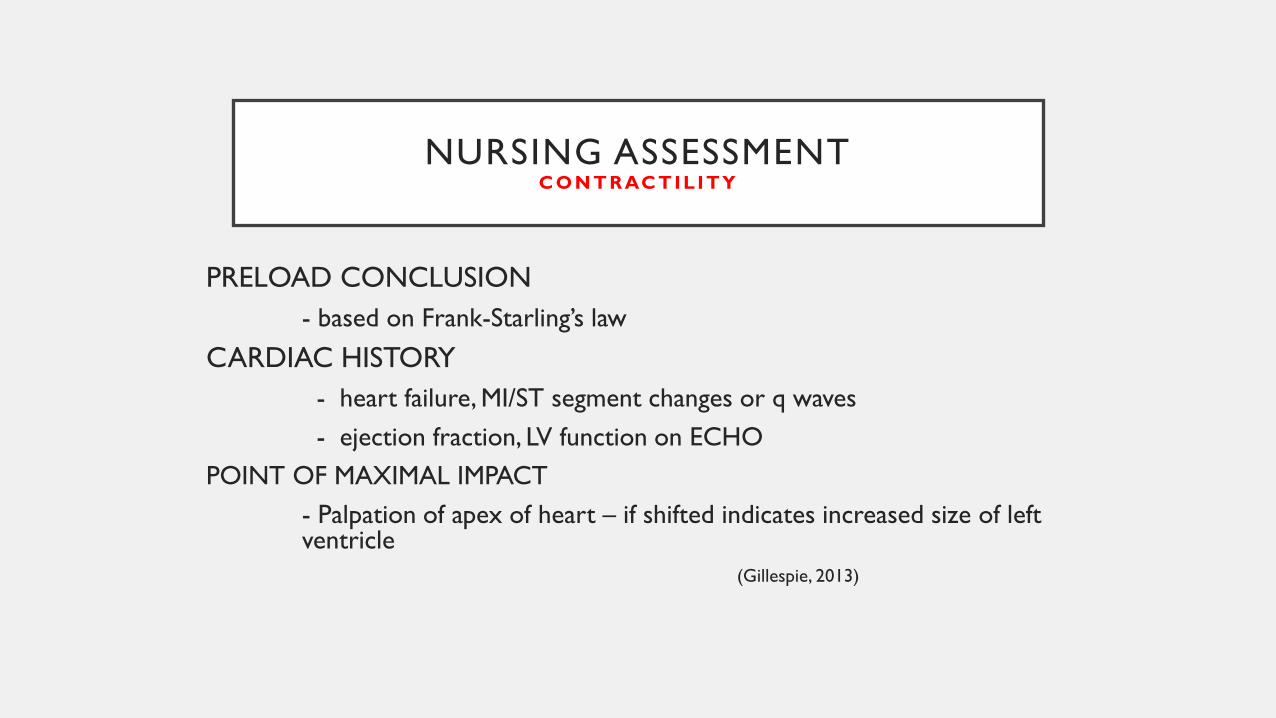
PRELOAD CONCLUSION- based on Frank-Starling’s law
CARDIAC HISTORY- heart failure, MI/ST segment changes or q waves- ejection fraction, LV function on ECHO
POINT OF MAXIMAL IMPACT- Palpation of apex of heart – if shifted indicates increased size of left ventricle
(Gillespie, 2013)
NURSING ASSESSMENTE N D O R G A N P E R F U S IO N
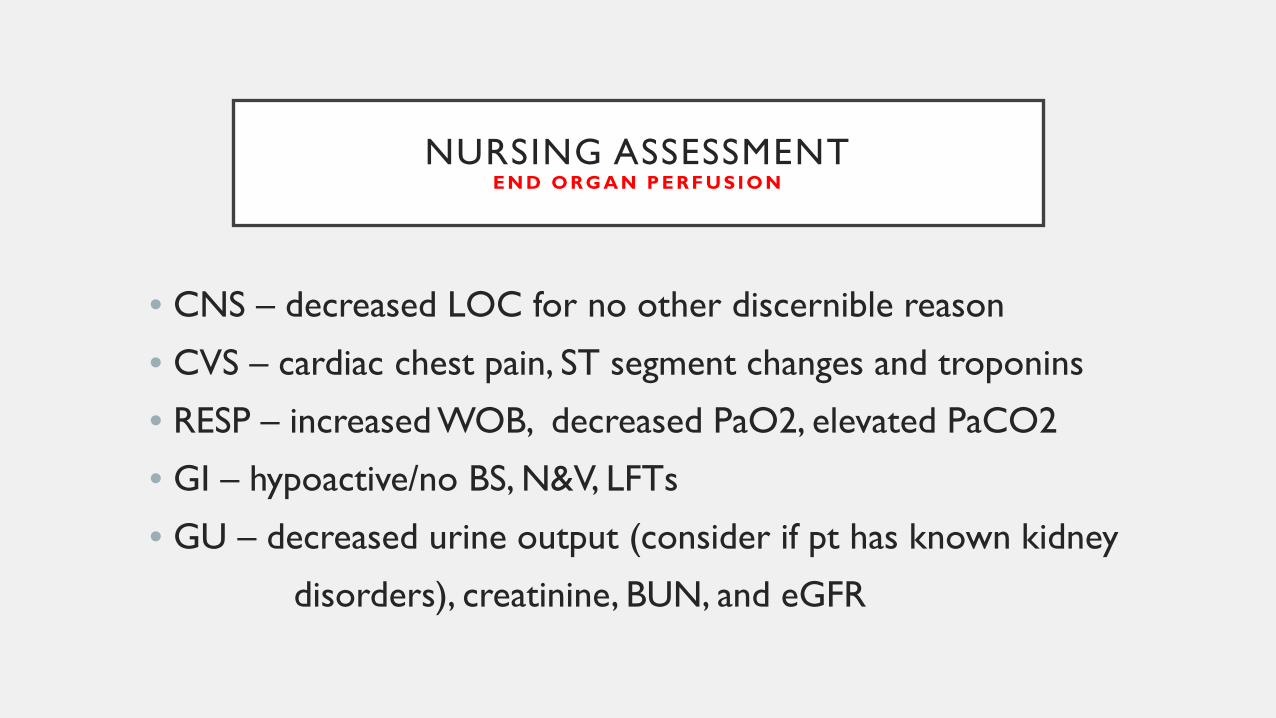
• CNS – decreased LOC for no other discernible reason
• CVS – cardiac chest pain, ST segment changes and troponins
• RESP – increased WOB, decreased PaO2, elevated PaCO2
• GI – hypoactive/no BS, N&V, LFTs
• GU – decreased urine output (consider if pt has known kidney
disorders), creatinine, BUN, and eGFR
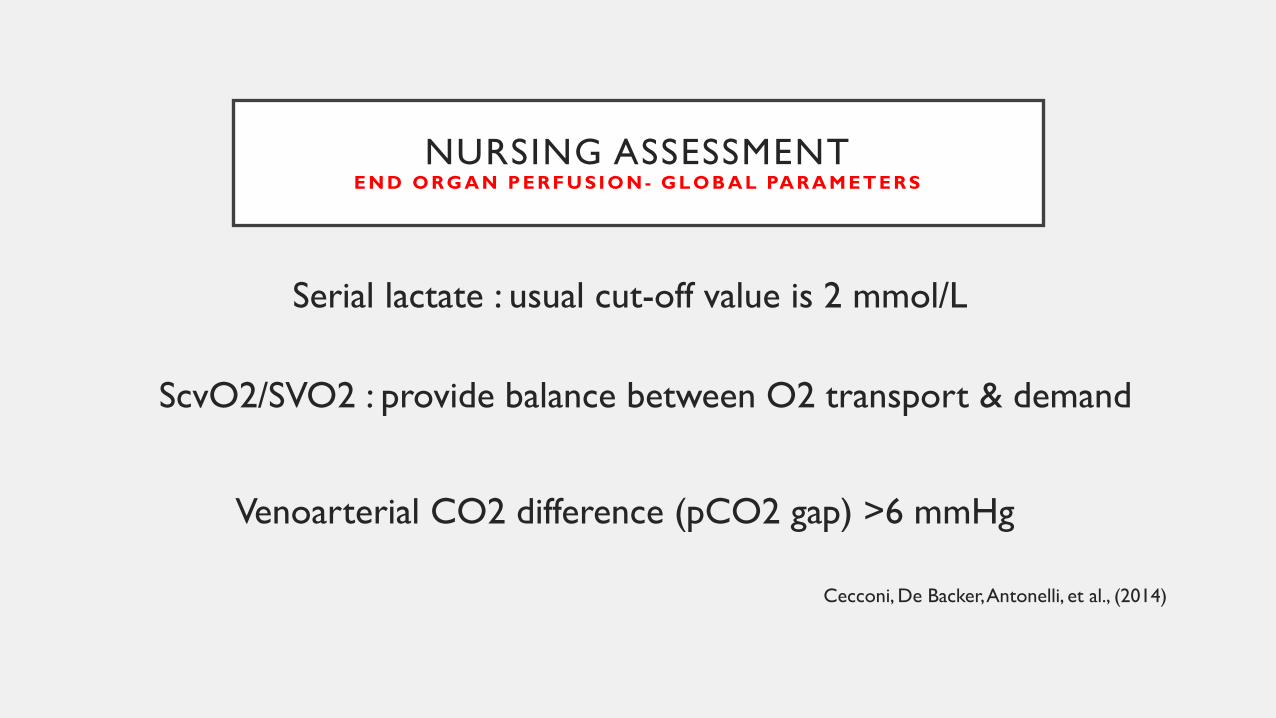
NURSING ASSESSMENTE N D O R G A N P E R F U S IO N - G L O B A L PA R A M ET E R S
Serial lactate : usual cut-off value is 2 mmol/L
ScvO2/SVO2 : provide balance between O2 transport & demand
Venoarterial CO2 difference (pCO2 gap) >6 mmHg
Cecconi, De Backer, Antonelli, et al., (2014)

PROCEDURES/DIAGNOSTICS
Static measures
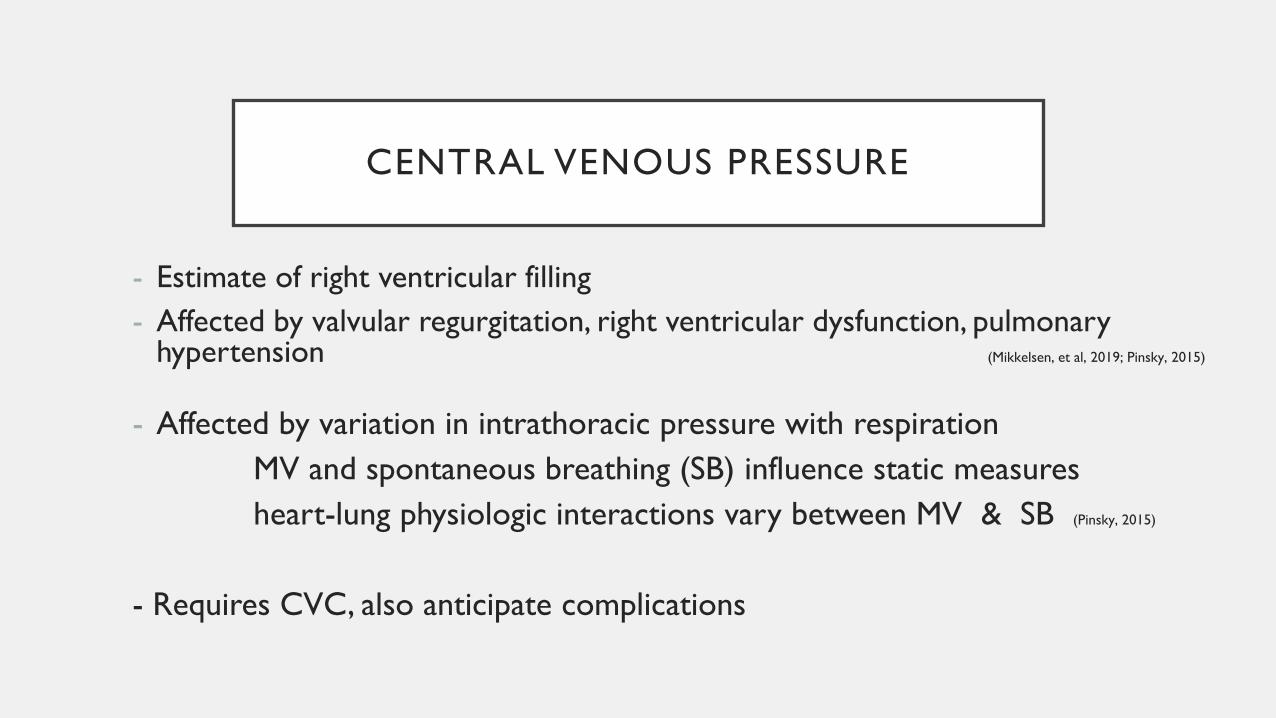
CENTRAL VENOUS PRESSURE
- Estimate of right ventricular filling - Affected by valvular regurgitation, right ventricular dysfunction, pulmonary
hypertension (Mikkelsen, et al, 2019; Pinsky, 2015)
- Affected by variation in intrathoracic pressure with respirationMV and spontaneous breathing (SB) influence static measures heart-lung physiologic interactions vary between MV & SB (Pinsky, 2015)
- Requires CVC, also anticipate complications
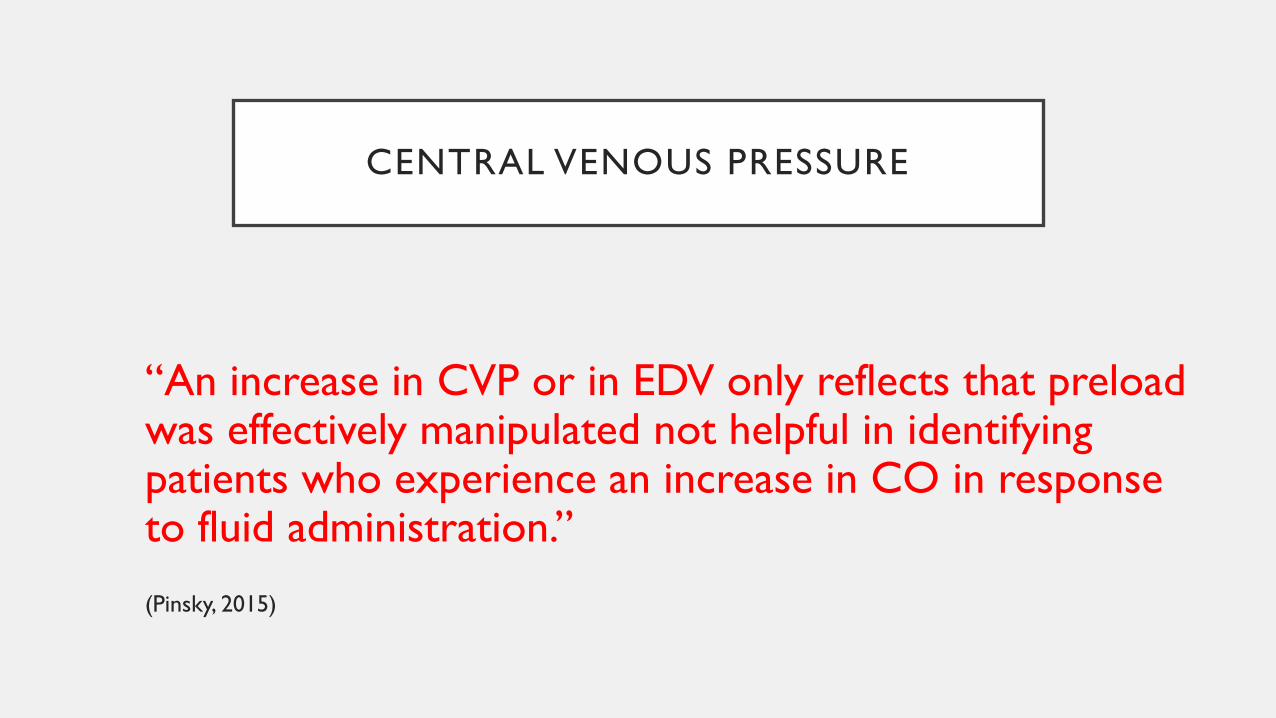
CENTRAL VENOUS PRESSURE
“An increase in CVP or in EDV only reflects that preload was effectively manipulated not helpful in identifying patients who experience an increase in CO in response to fluid administration.”
(Pinsky, 2015)
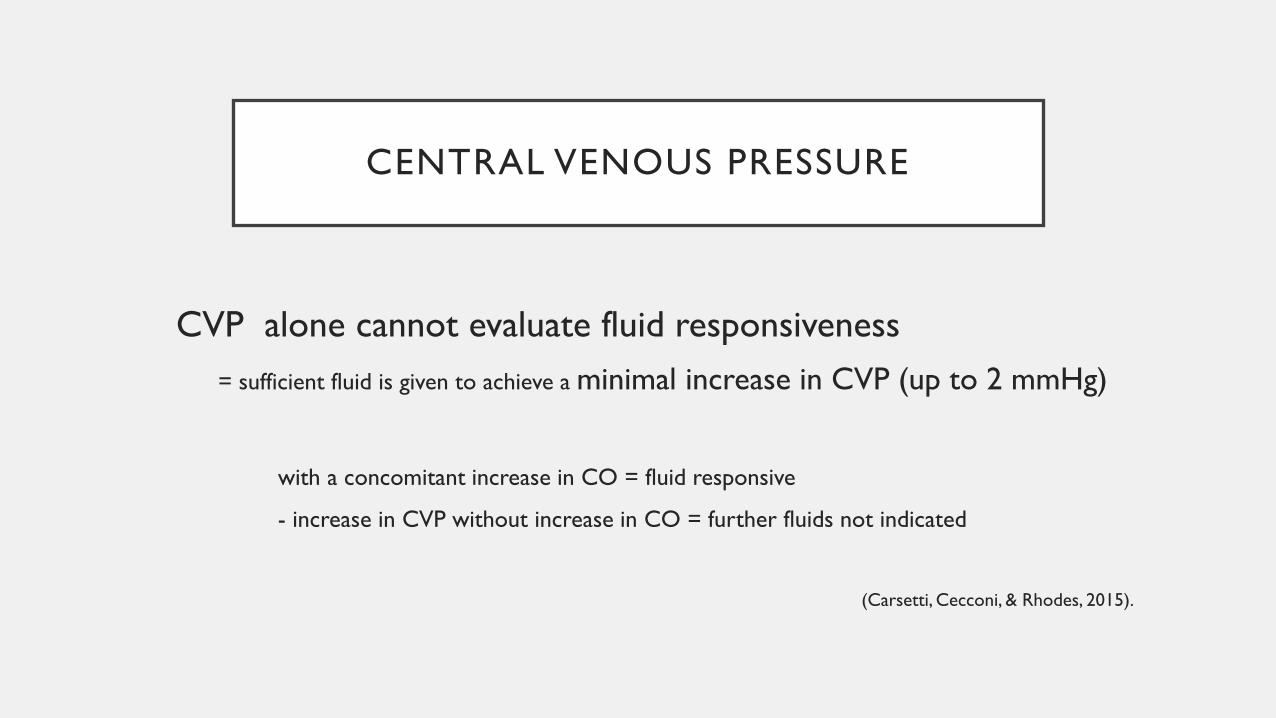
CENTRAL VENOUS PRESSURE
CVP alone cannot evaluate fluid responsiveness = sufficient fluid is given to achieve a minimal increase in CVP (up to 2 mmHg)
with a concomitant increase in CO = fluid responsive
- increase in CVP without increase in CO = further fluids not indicated
(Carsetti, Cecconi, & Rhodes, 2015).
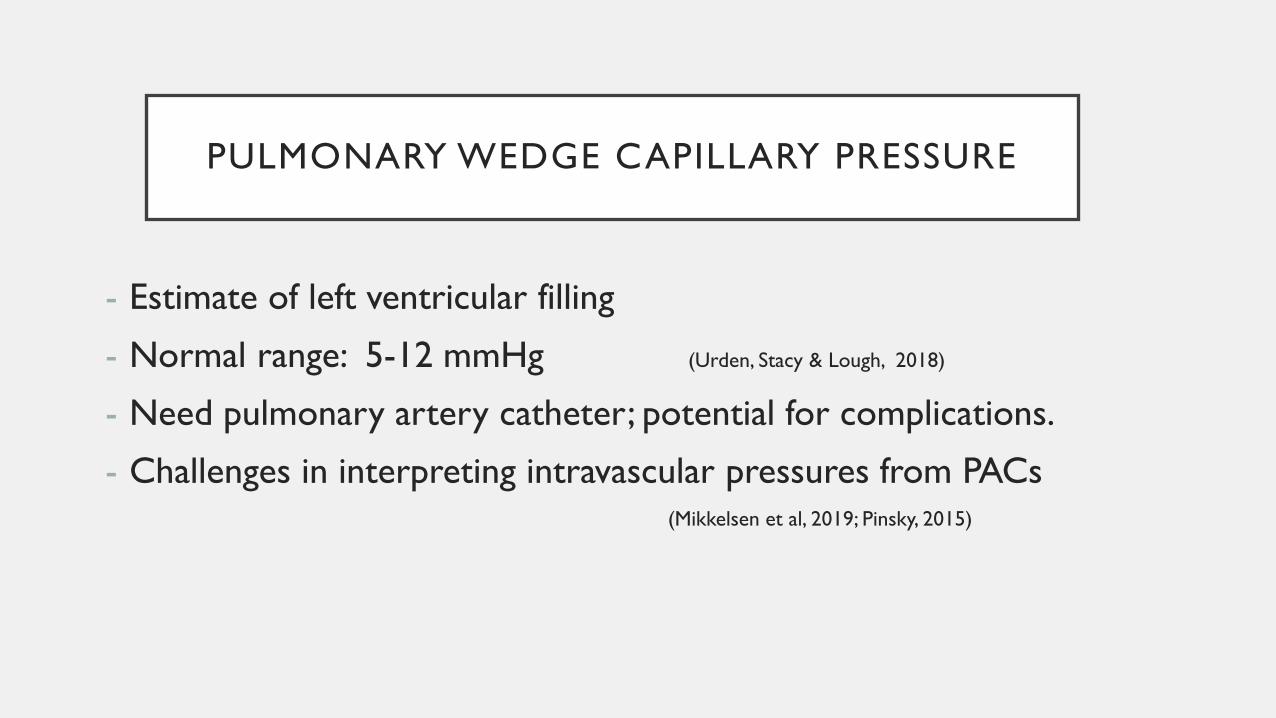
PULMONARY WEDGE CAPILLARY PRESSURE
- Estimate of left ventricular filling
- Normal range: 5-12 mmHg (Urden, Stacy & Lough, 2018)
- Need pulmonary artery catheter; potential for complications.
- Challenges in interpreting intravascular pressures from PACs(Mikkelsen et al, 2019; Pinsky, 2015)
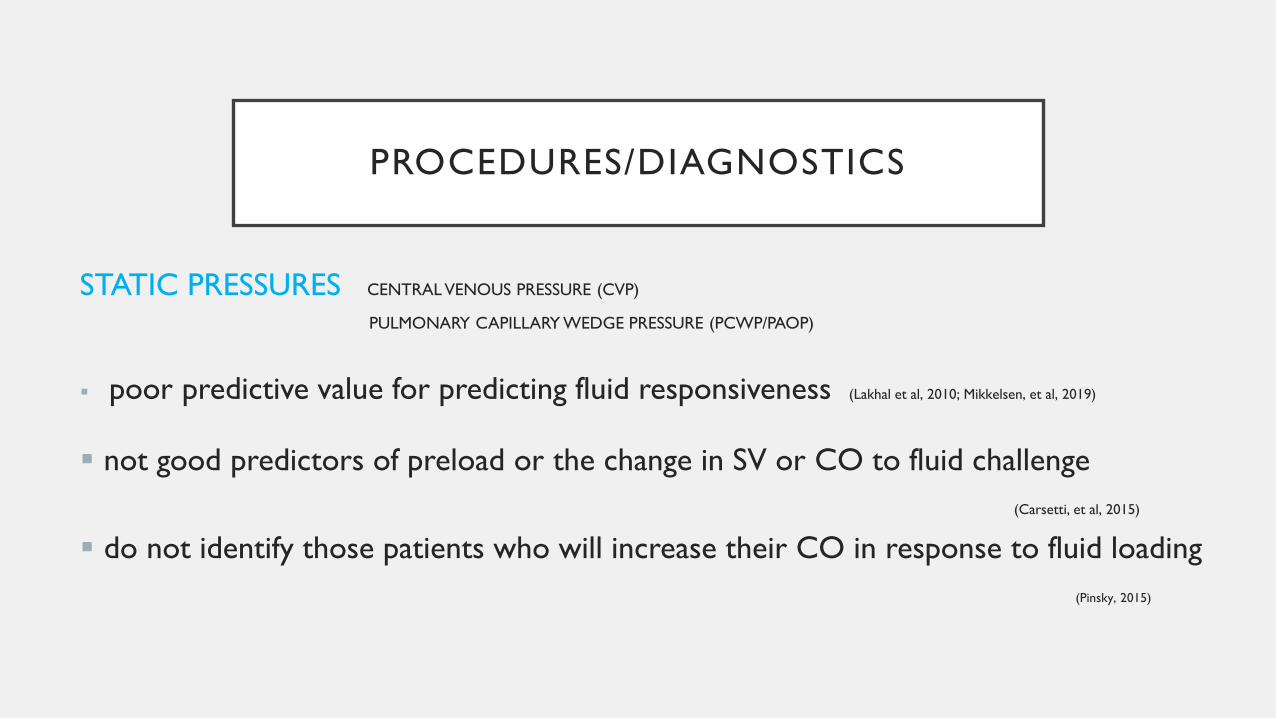
PROCEDURES/DIAGNOSTICS
STATIC PRESSURES CENTRAL VENOUS PRESSURE (CVP)
PULMONARY CAPILLARY WEDGE PRESSURE (PCWP/PAOP)
poor predictive value for predicting fluid responsiveness (Lakhal et al, 2010; Mikkelsen, et al, 2019)
not good predictors of preload or the change in SV or CO to fluid challenge(Carsetti, et al, 2015)
do not identify those patients who will increase their CO in response to fluid loading(Pinsky, 2015)
OTHER STATIC MEASURES OF PRELOAD
• Global end-diastolic volume –using a PICCO or EV1000 system
• Inferior vena cava diameter
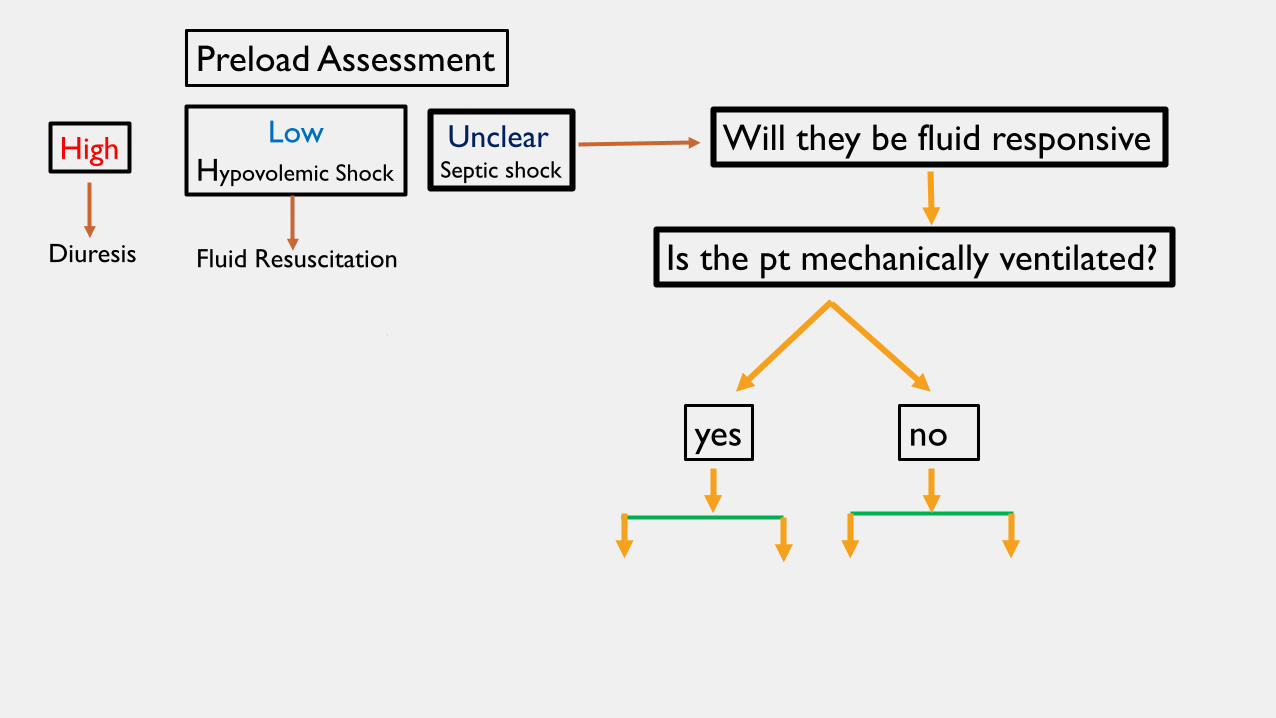
Is the pt mechanically ventilated?
yes no
Preload Assessment
Will they be fluid responsiveHigh
Diuresis
LowHypovolemic Shock
Fluid Resuscitation
UnclearSeptic shock
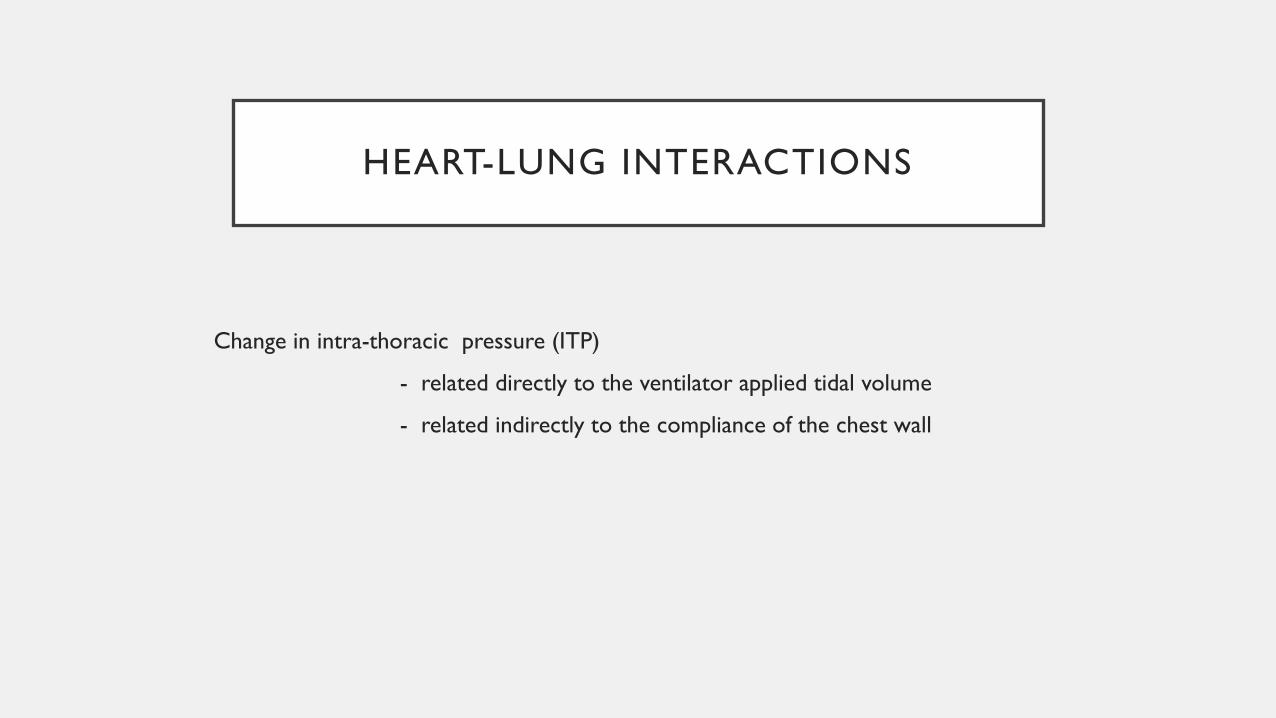
HEART-LUNG INTERACTIONS
Change in intra-thoracic pressure (ITP)
- related directly to the ventilator applied tidal volume
- related indirectly to the compliance of the chest wall
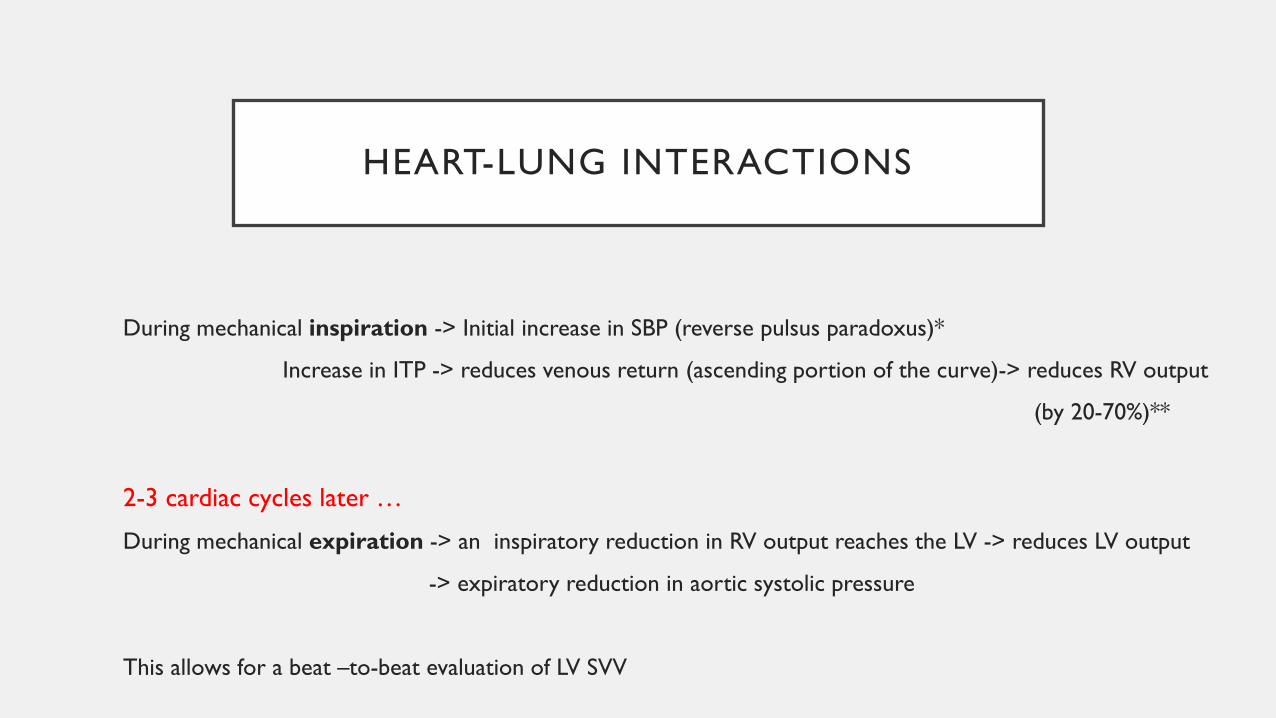
HEART-LUNG INTERACTIONS
During mechanical inspiration -> Initial increase in SBP (reverse pulsus paradoxus)*
Increase in ITP -> reduces venous return (ascending portion of the curve)-> reduces RV output
(by 20-70%)**
2-3 cardiac cycles later …
During mechanical expiration -> an inspiratory reduction in RV output reaches the LV -> reduces LV output
-> expiratory reduction in aortic systolic pressure
This allows for a beat –to-beat evaluation of LV SVV
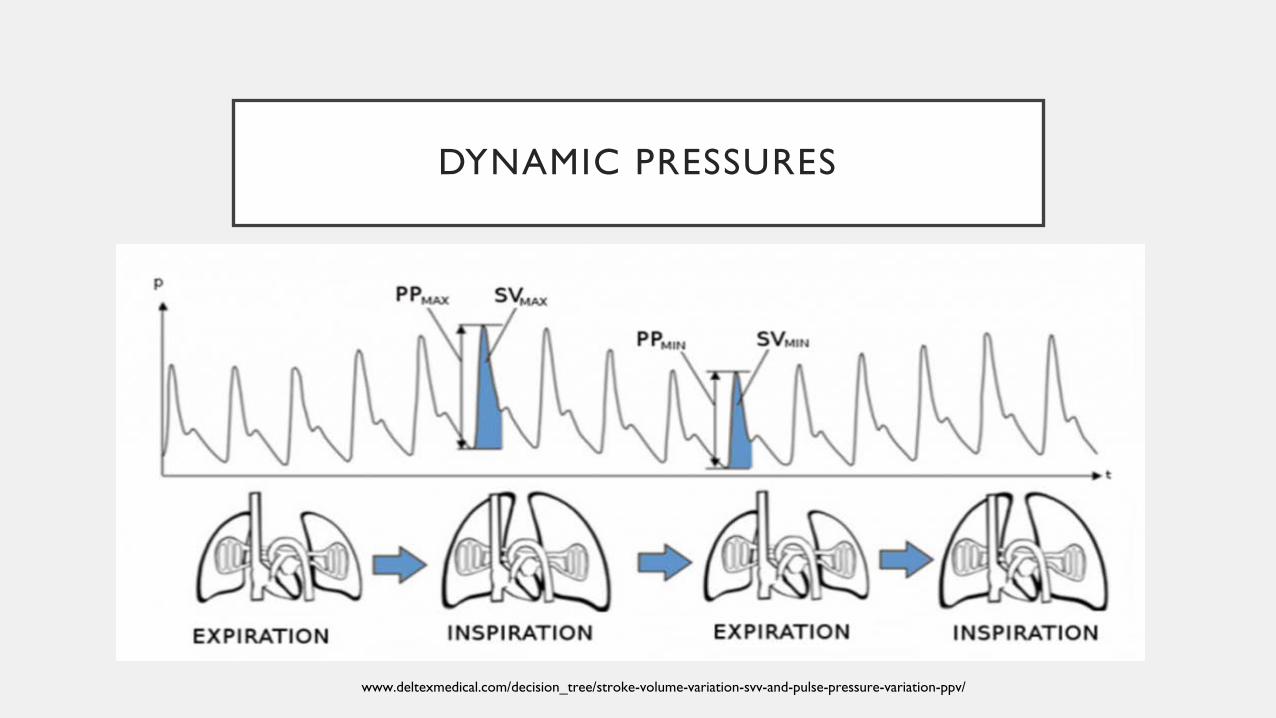
DYNAMIC PRESSURES
Result of interactions between the CV and respiratory systems
www.deltexmedical.com/decision_tree/stroke-volume-variation-svv-and-pulse-pressure-variation-ppv/
FLUID RESPONSIVENESS ASSESSMENT
Dynamic assessments
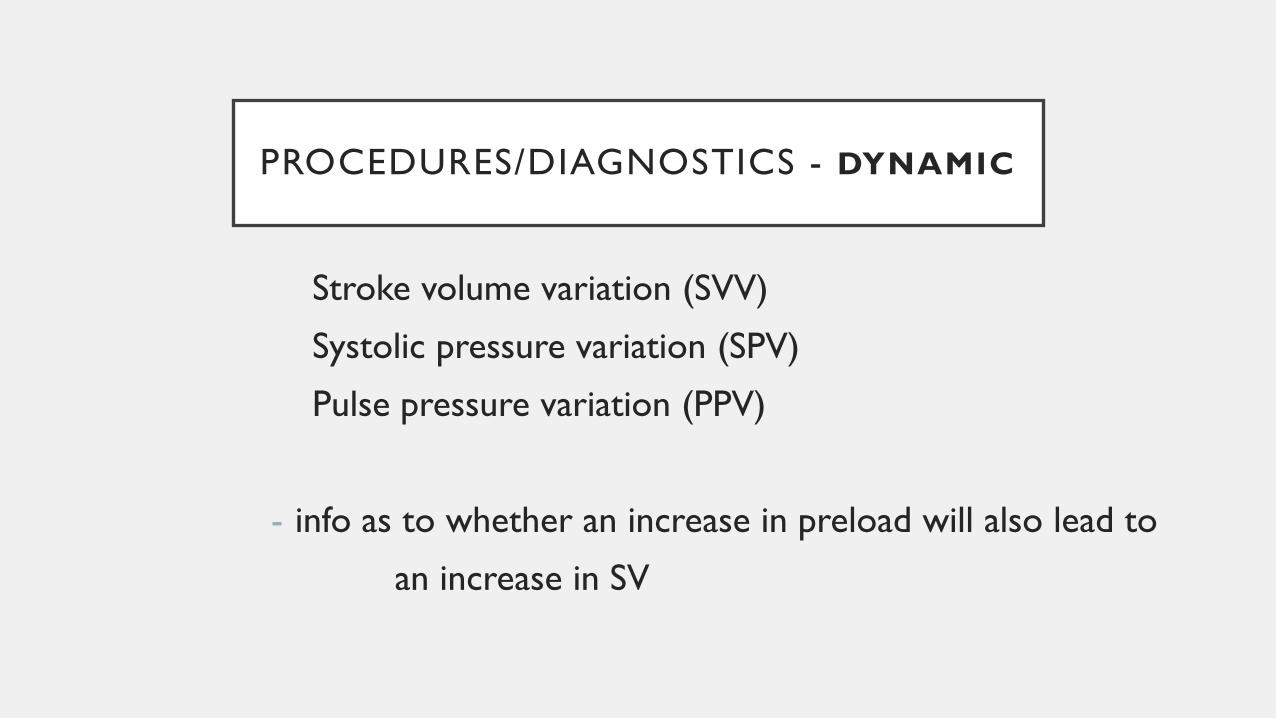
PROCEDURES/DIAGNOSTICS - DYNAMIC
Stroke volume variation (SVV)
Systolic pressure variation (SPV)
Pulse pressure variation (PPV)
- info as to whether an increase in preload will also lead to
an increase in SV
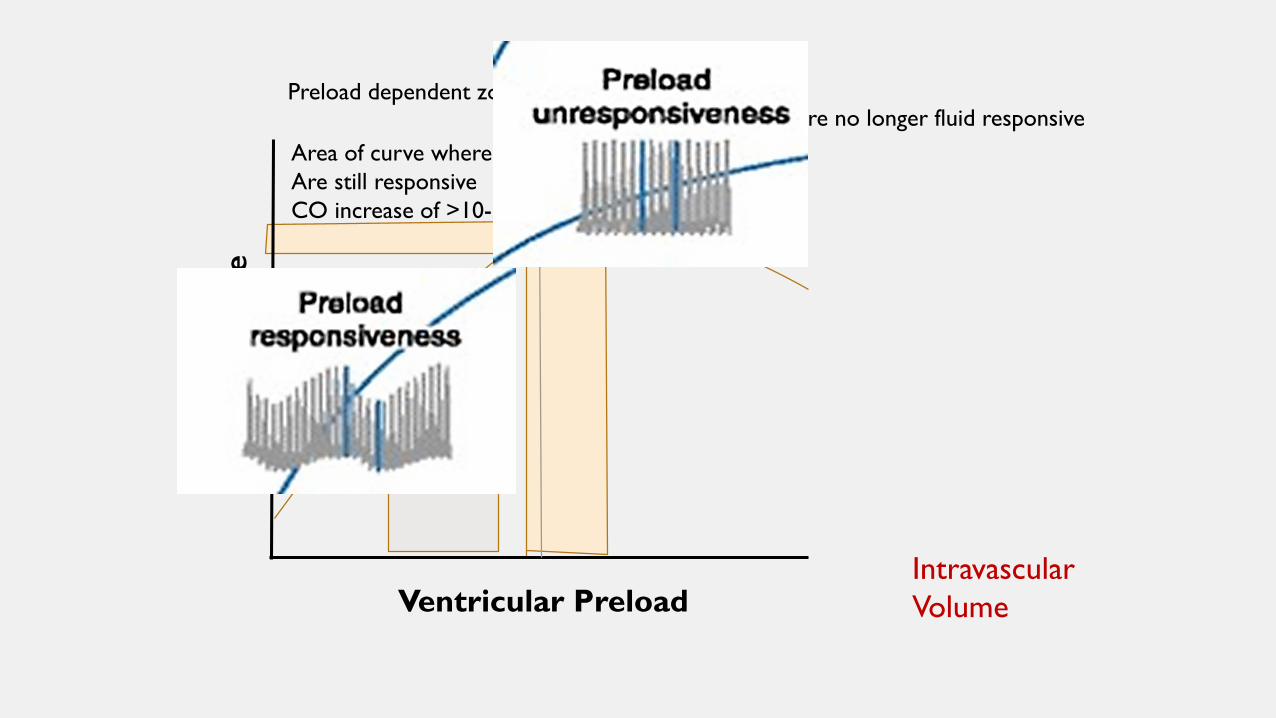
Intravascular Volume
Stro
ke V
olum
e
Preload dependent zone
Ventricular Preload
Area of curve where pts Are still responsive CO increase of >10-15%
Zone where patients are no longer fluid responsiveCO increase of<10%
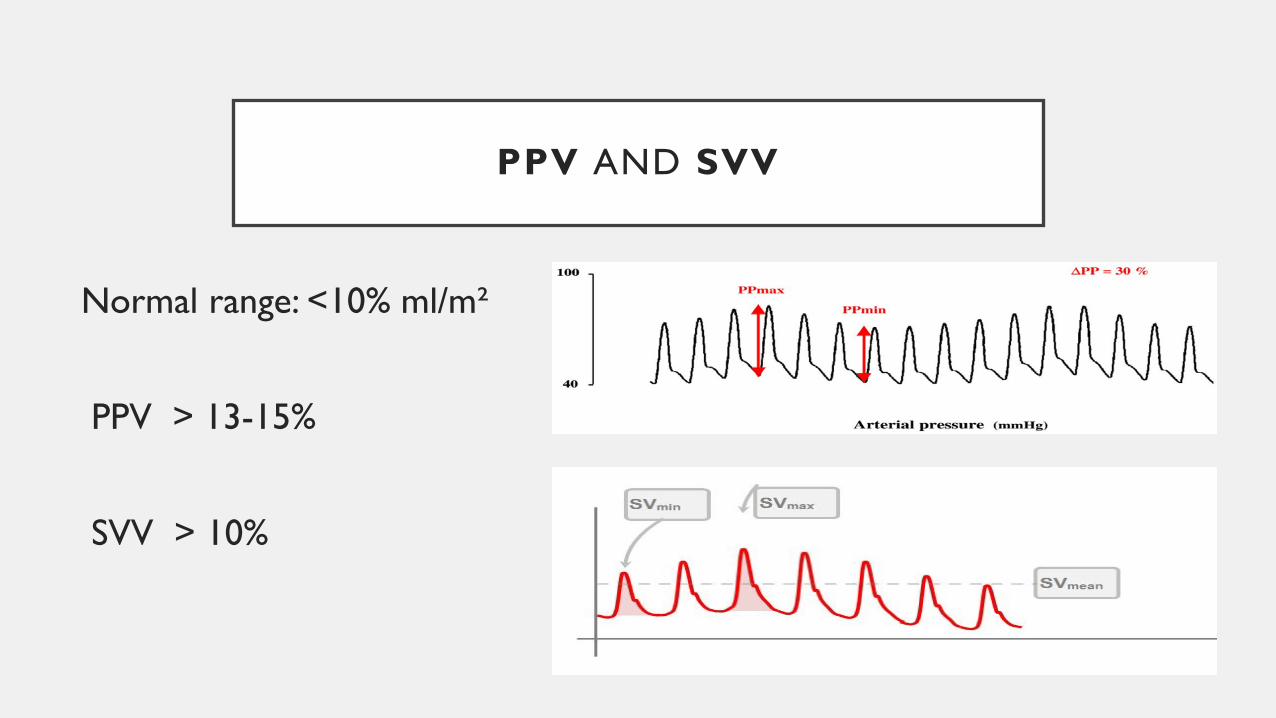
PPV AND SVV
Normal range: <10% ml/m²
PPV > 13-15%
SVV > 10%
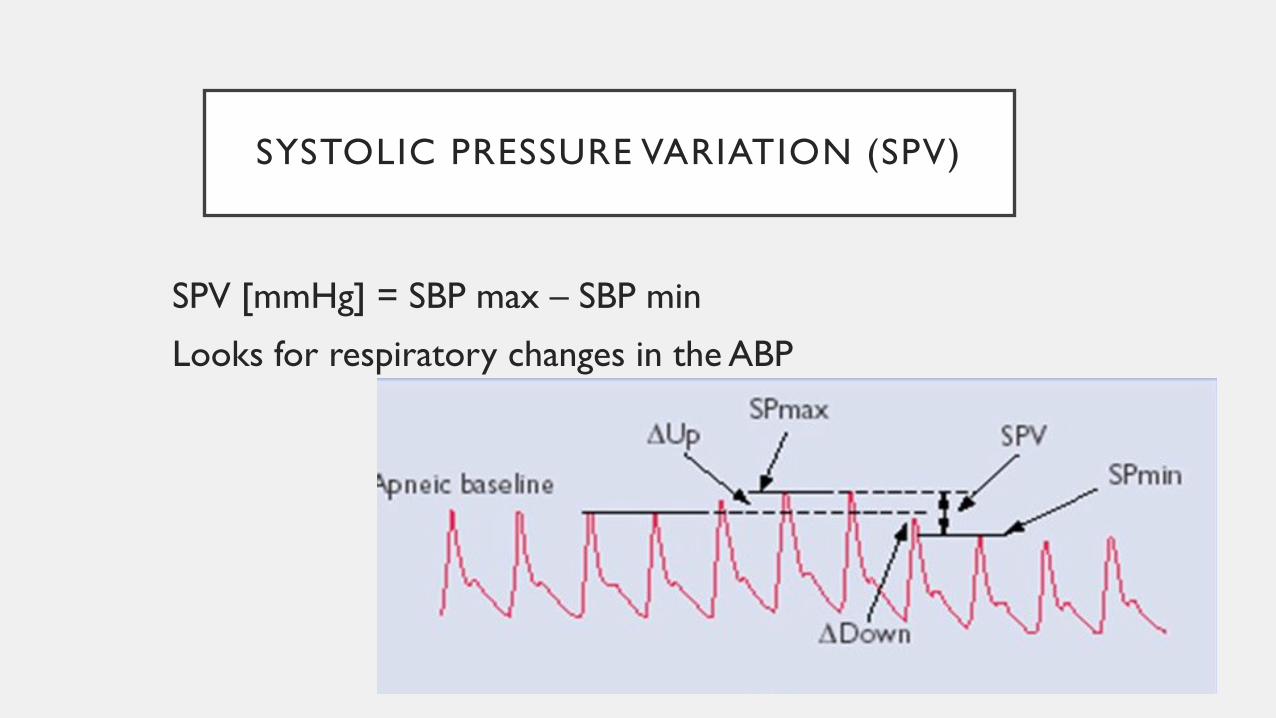
SYSTOLIC PRESSURE VARIATION (SPV)
SPV [mmHg] = SBP max – SBP min
Looks for respiratory changes in the ABP
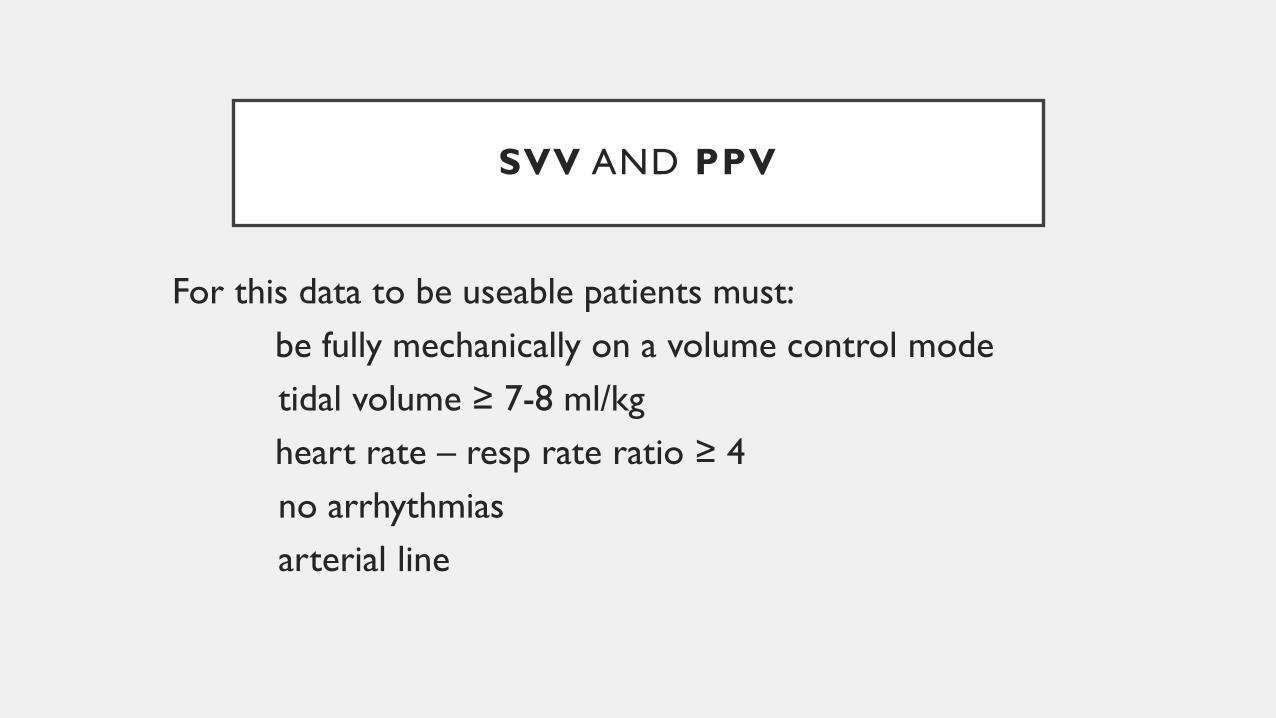
SVV AND PPV
For this data to be useable patients must:be fully mechanically on a volume control modetidal volume ≥ 7-8 ml/kgheart rate – resp rate ratio ≥ 4no arrhythmiasarterial line
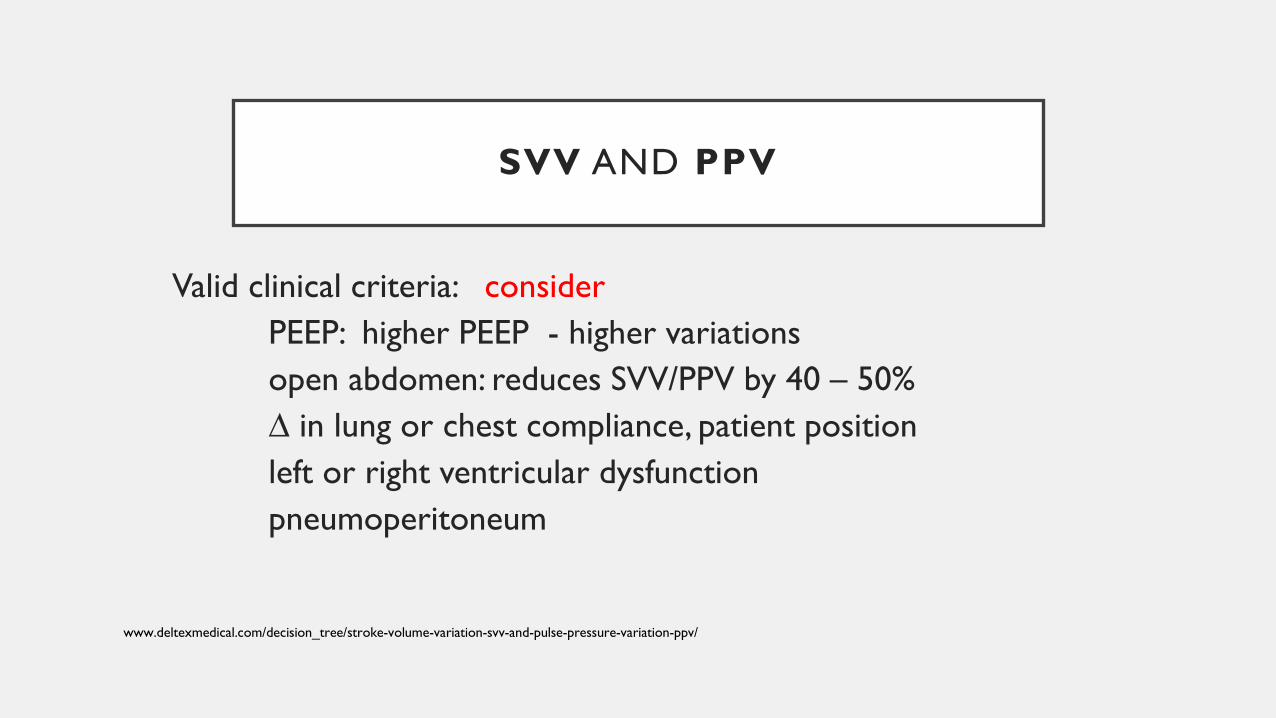
SVV AND PPV
Valid clinical criteria: considerPEEP: higher PEEP - higher variationsopen abdomen: reduces SVV/PPV by 40 – 50%∆ in lung or chest compliance, patient positionleft or right ventricular dysfunctionpneumoperitoneum
www.deltexmedical.com/decision_tree/stroke-volume-variation-svv-and-pulse-pressure-variation-ppv/
PPV AS A PREDICTOR OF FLUID RESPONSIVENESS
(AN OBSERVATIONAL STUDY)
Grassi, Nigro, Battaglia, Barone, Testa & Berlot, (2013)
- Good accuracy even in MV pts who actively trigger the ventilator
- Used SPV (instead of flow-based indices CO or SV)
- Set inspiratory & expiratory triggers
PULSE PRESSURE VARIATION (PPV)
Tidal volume challenge (TVC)
Temporarily increasing TV from 6 ml/kg to 8 ml/kg for 1 min and noting changes in measurements
∆PPV > 3.5% predicts FR with high accuracy (Jalil & Cavallazi, 2018)
PROCEDURES/DIAGNOSTICS DYNAMIC
HEMODYNAMIC MANEUVERS
Fluid challengePassive leg raiseEnd expiratory occlusion test
FLUID CHALLENGE
A dynamic test of the CVS that assesses the preload reserve of the patient ( Carsetti, Cecconi & Rhodes, 2015)
• Usually 250 ml or 3 ml/kg of crystalloids
• OR 500 ml
OR 100 ml over 1 min (mini-challenge)
• Infused over a short period of time (5-10 min)
FLUID CHALLENGE
• Fluid responsive if SV or CO increases more than 10-15 %• Need to remember that:
X blood pressure alone is not a good indicator (BP dependent on CO & elastance)
(Carsetti, Cecconi & Rhodes, 2015)
X MAP & CVP alone are not accurate (Chen, 2018)
X CVP & urine output (Ahrens, 2010)
FLUID CHALLENGE
“defining [fluid] responsiveness by giving small volumes of fluidis not the same as fluid resuscitation”
Fluid challenges merely document [fluid] responsiveness.
Aggressive fluid resuscitation in shock is evaluated by the reversal of organ and tissue hypoperfusion. (Pinsky, 2015)
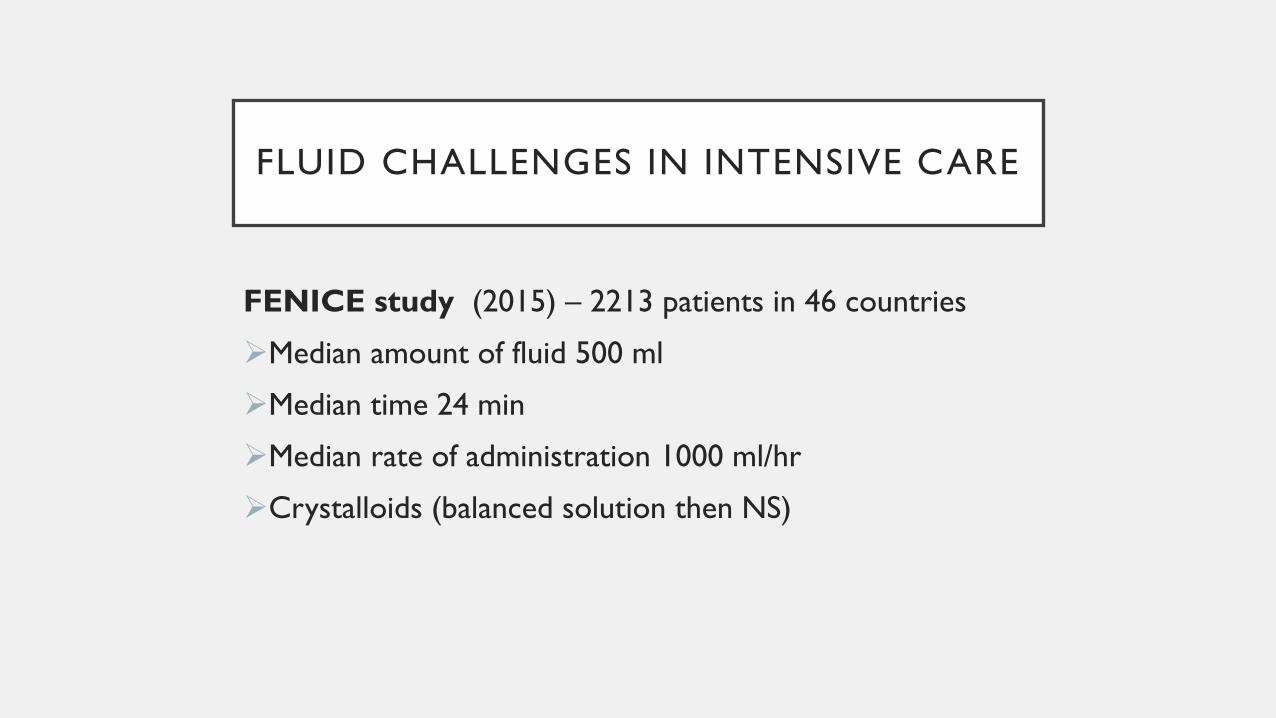
FLUID CHALLENGES IN INTENSIVE CARE
FENICE study (2015) – 2213 patients in 46 countries
Median amount of fluid 500 ml
Median time 24 min
Median rate of administration 1000 ml/hr
Crystalloids (balanced solution then NS)

FLUID CHALLENGES IN INTENSIVE CARE
FENICE study – 2213 patients in 46 countries
Indications: hypotension (56-60%), oliguria, weaning vasopressor, lactate
Hemo variable used to predict FR:
no variable 40 – 44%
static (33-37%) vs dynamic (20 – 23%)
CVP (25%) PPV (4%), SVV (4%)
PAOP ( 1.4%) PLR (10%)
• markers of EOP <8%
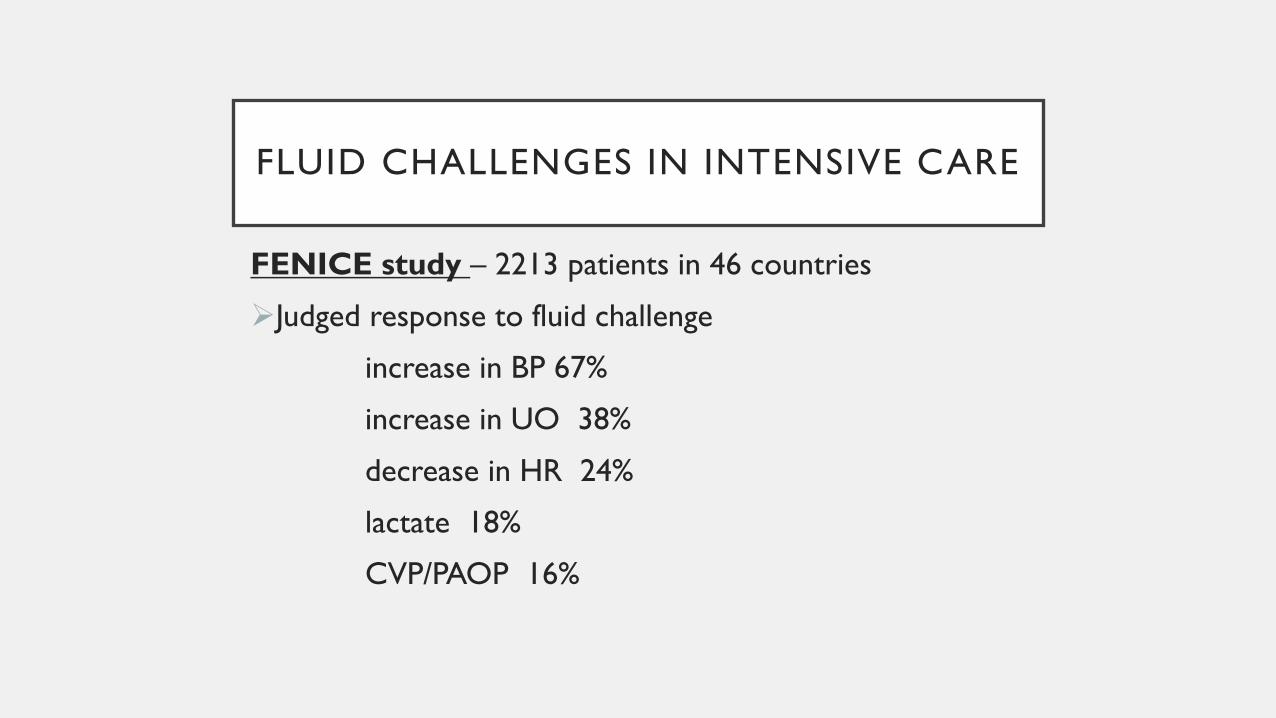
FLUID CHALLENGES IN INTENSIVE CARE
FENICE study – 2213 patients in 46 countries
Judged response to fluid challenge
increase in BP 67%
increase in UO 38%
decrease in HR 24%
lactate 18%
CVP/PAOP 16%
PASSIVE LEG RAISE (PLR)
• Significance/implication
• Studies
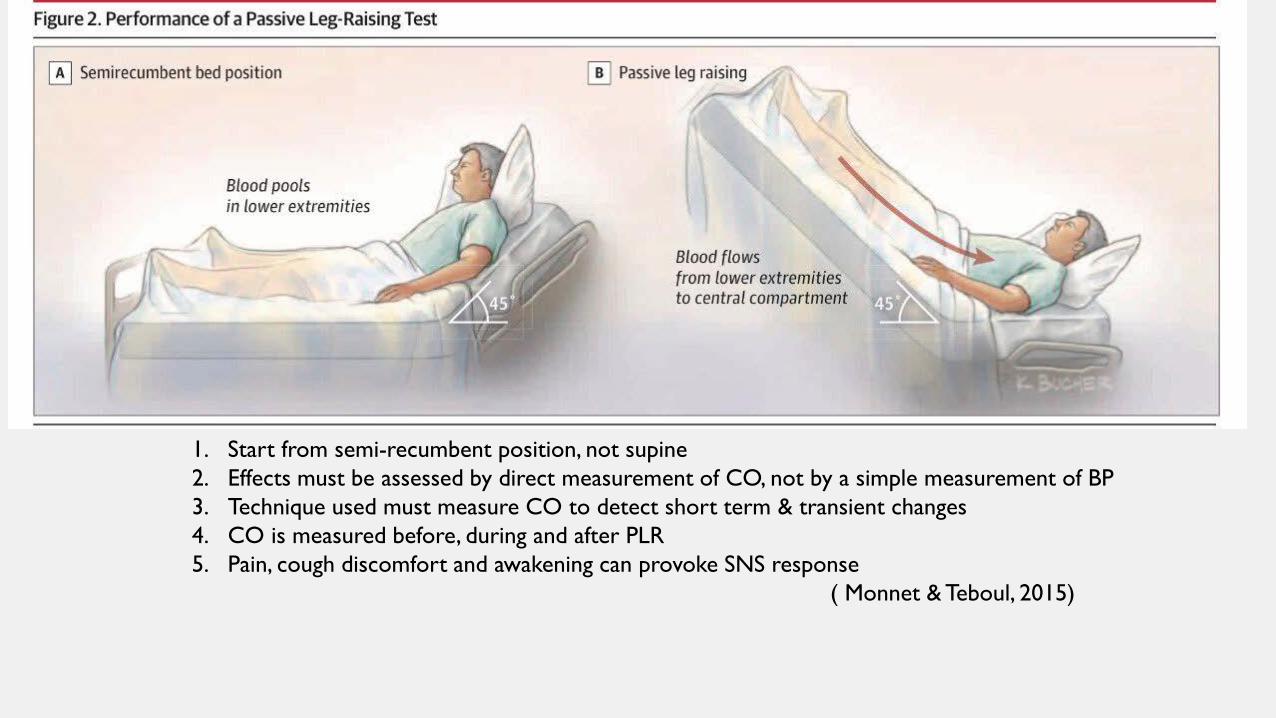
1. Start from semi-recumbent position, not supine2. Effects must be assessed by direct measurement of CO, not by a simple measurement of BP3. Technique used must measure CO to detect short term & transient changes4. CO is measured before, during and after PLR5. Pain, cough discomfort and awakening can provoke SNS response
( Monnet & Teboul, 2015)
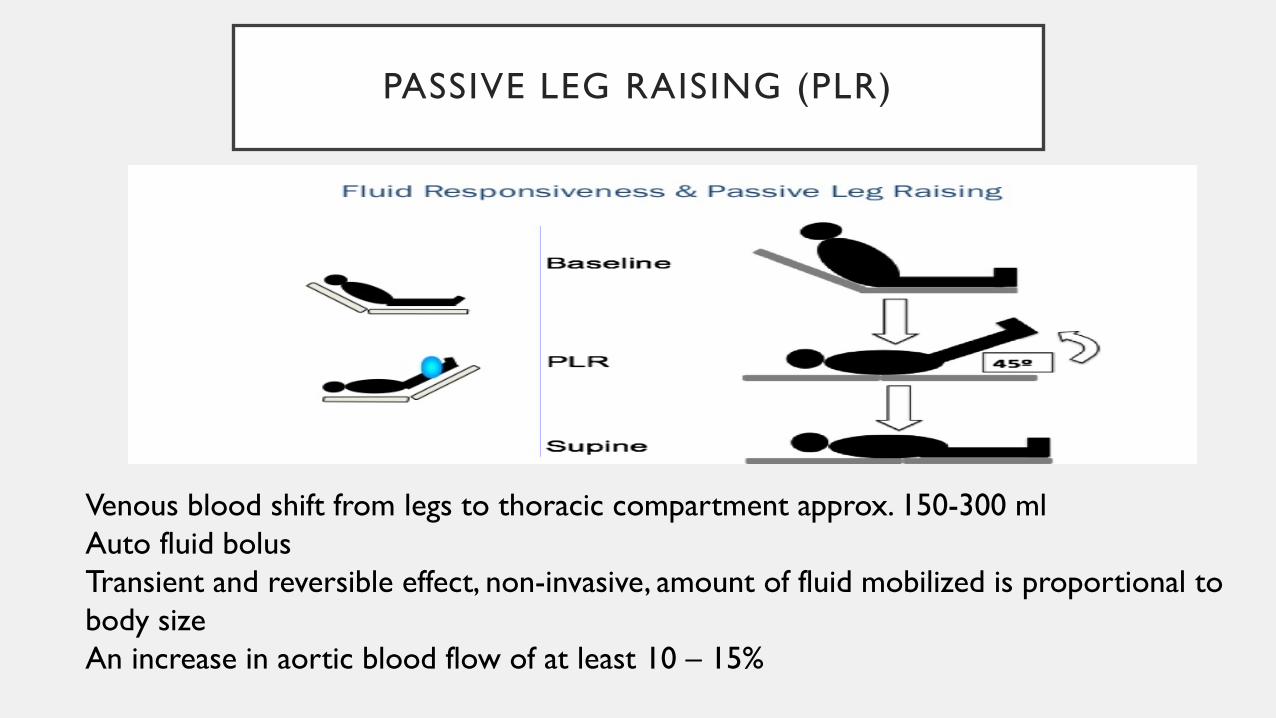
PASSIVE LEG RAISING (PLR)
Venous blood shift from legs to thoracic compartment approx. 150-300 ml Auto fluid bolusTransient and reversible effect, non-invasive, amount of fluid mobilized is proportional to body size An increase in aortic blood flow of at least 10 – 15%
PASSIVE LEG RAISING (PLR)
ADVANTAGES / BENEFITS
• Remains reliable when parameters based on heart-lung interactions cannot be used (Carsetti et al, 2015)
• Works better with low- respiratory system compliance (e.g. ARDS)
• Accurate in patients with arrhythmias & spontaneously breathing
• Can be used regardless of vent mode & cardiac rhythm (Cavallaro, 2010)
• Can avoid the risk of fluid overload (Carsetti et al, 2015)
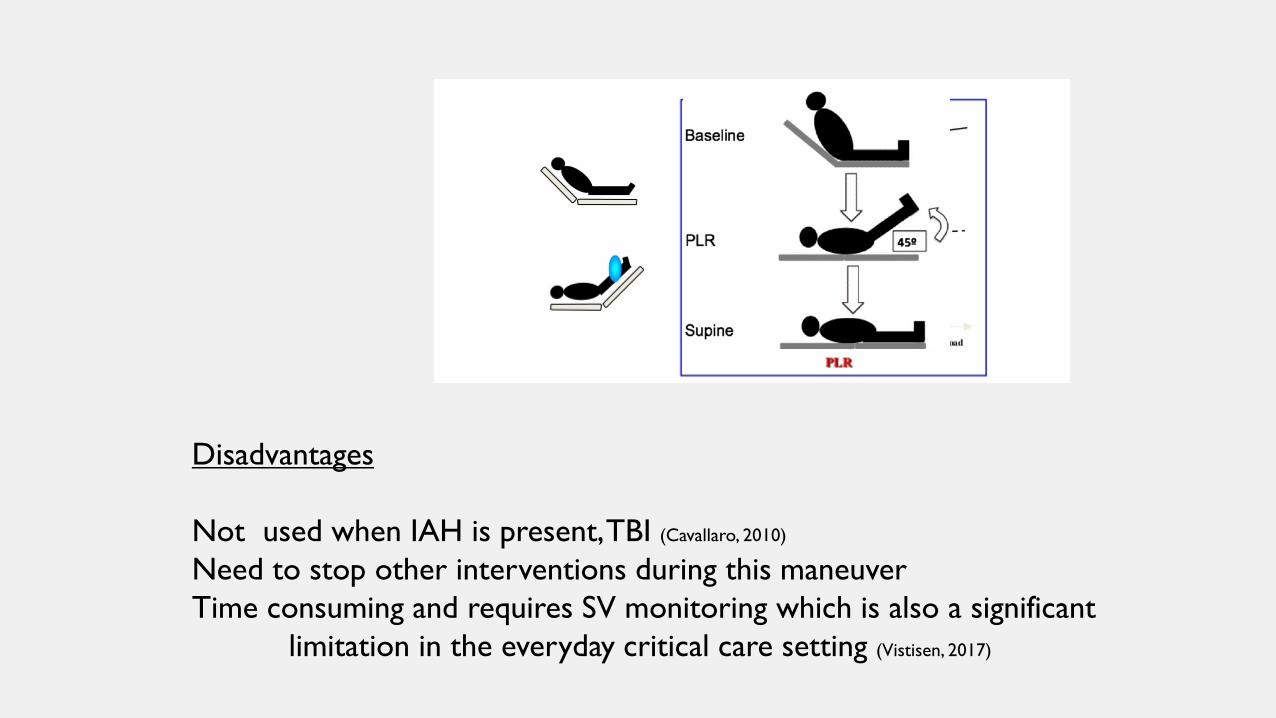
Disadvantages
Not used when IAH is present, TBI (Cavallaro, 2010)
Need to stop other interventions during this maneuver Time consuming and requires SV monitoring which is also a significant
limitation in the everyday critical care setting (Vistisen, 2017)
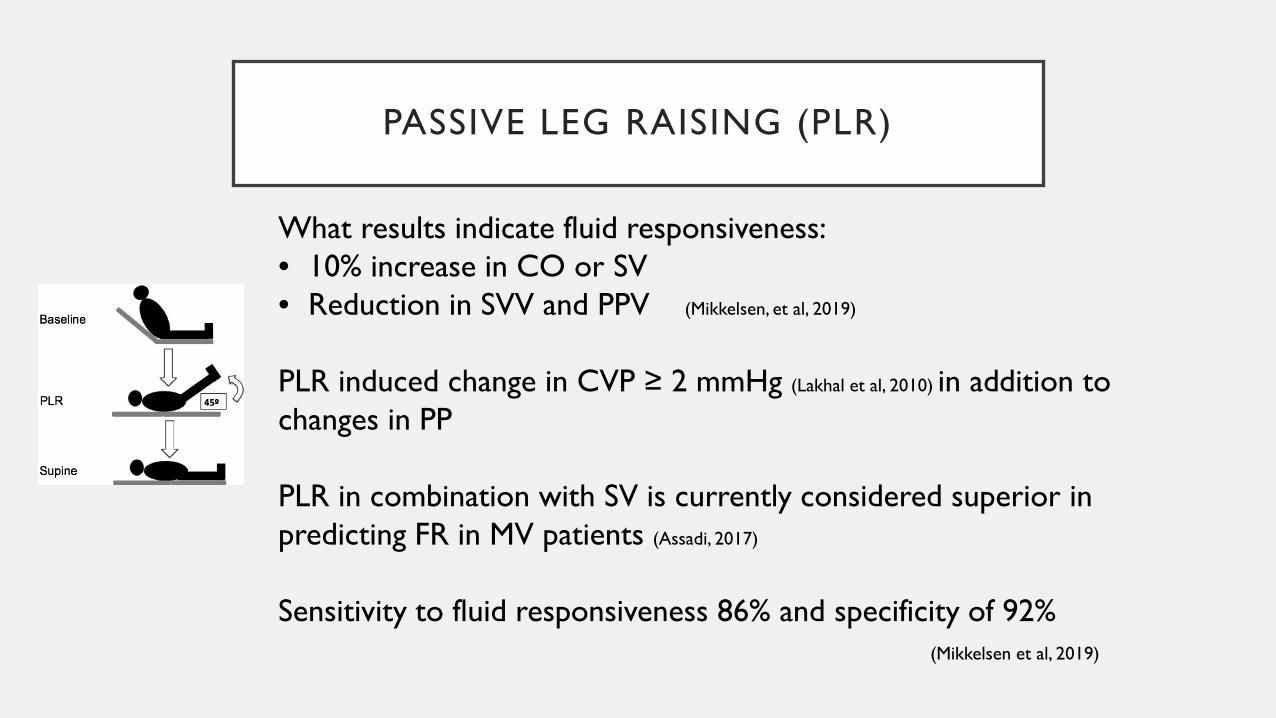
PASSIVE LEG RAISING (PLR)
What results indicate fluid responsiveness:• 10% increase in CO or SV• Reduction in SVV and PPV (Mikkelsen, et al, 2019)
PLR induced change in CVP ≥ 2 mmHg (Lakhal et al, 2010) in addition to changes in PP
PLR in combination with SV is currently considered superior in predicting FR in MV patients (Assadi, 2017)
Sensitivity to fluid responsiveness 86% and specificity of 92% (Mikkelsen et al, 2019)

OTHER DYNAMIC PARAMETERS
End tidal CO2 variation - ∆EtCO2 = before – after ETCO2
during PLR [≥2 mmHg or ≥5%] – small studies
OTHER DYNAMIC PARAMETERS
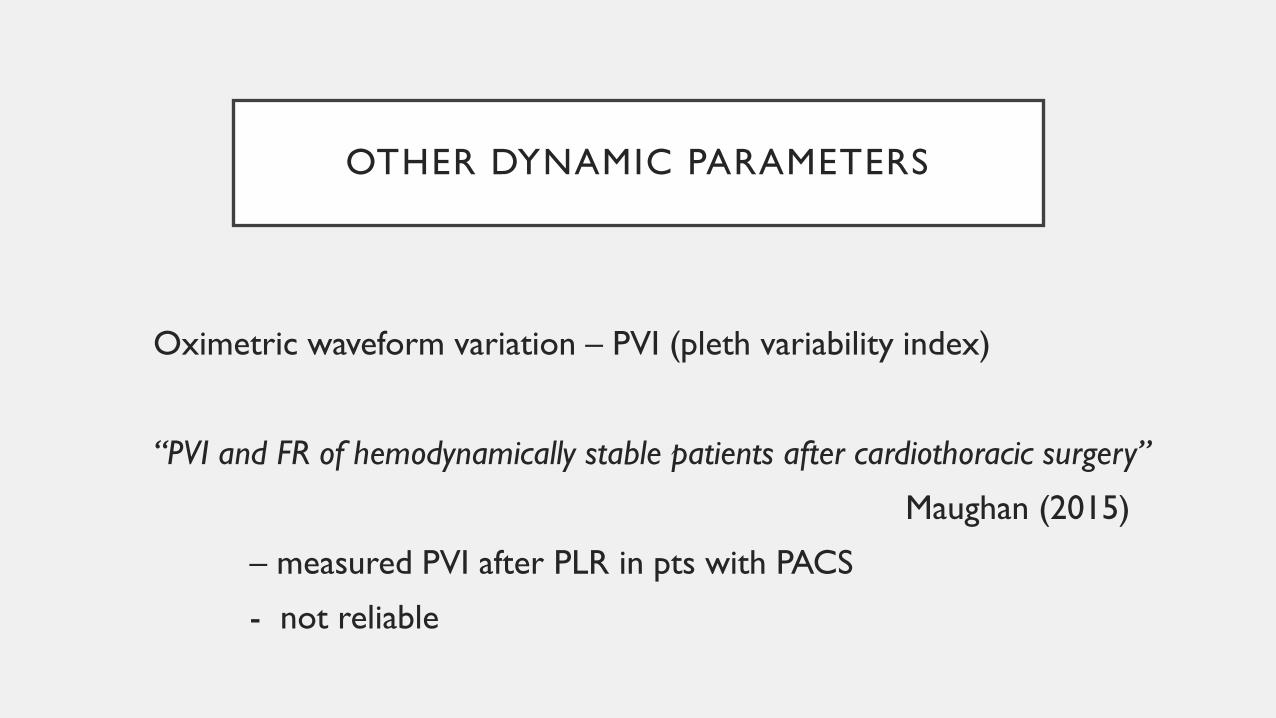
Oximetric waveform variation – PVI (pleth variability index)
“PVI and FR of hemodynamically stable patients after cardiothoracic surgery”
Maughan (2015)
– measured PVI after PLR in pts with PACS
- not reliable
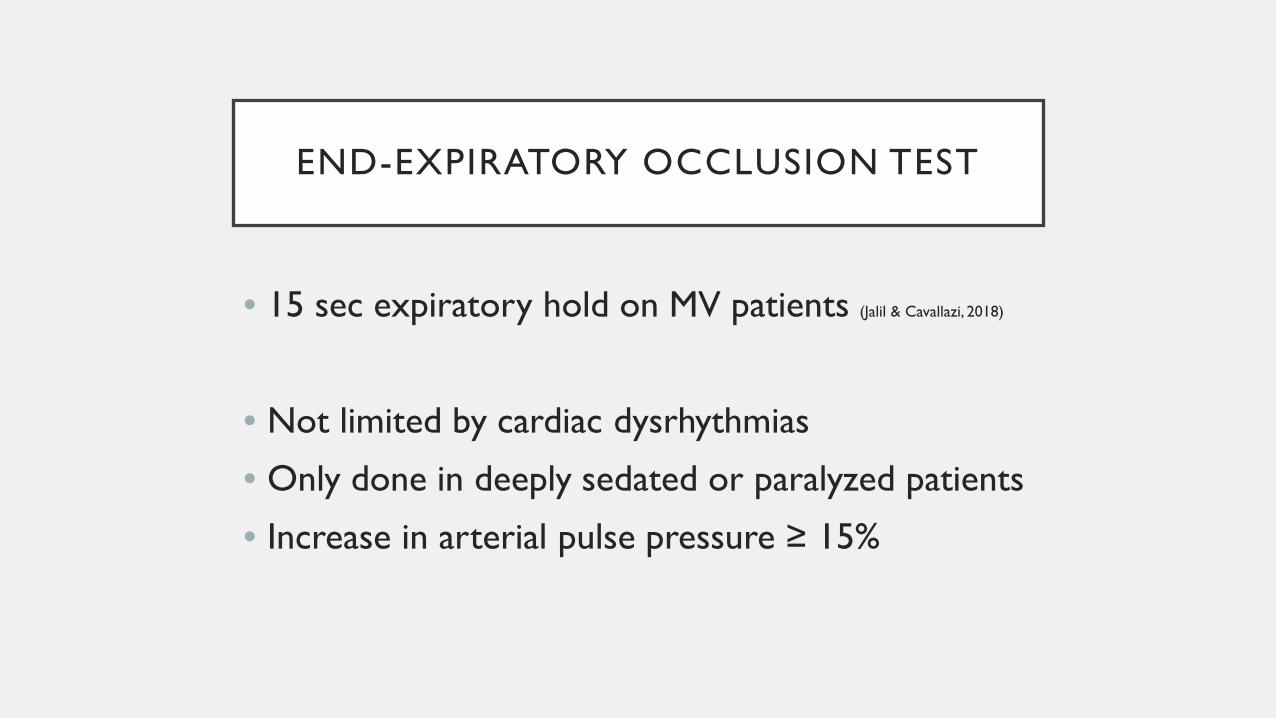
END-EXPIRATORY OCCLUSION TEST
• 15 sec expiratory hold on MV patients (Jalil & Cavallazi, 2018)
• Not limited by cardiac dysrhythmias
• Only done in deeply sedated or paralyzed patients
• Increase in arterial pulse pressure ≥ 15%

PHYSICIAN-DIRECTED PRELOAD ASSESSMENT
Static and dynamic measures
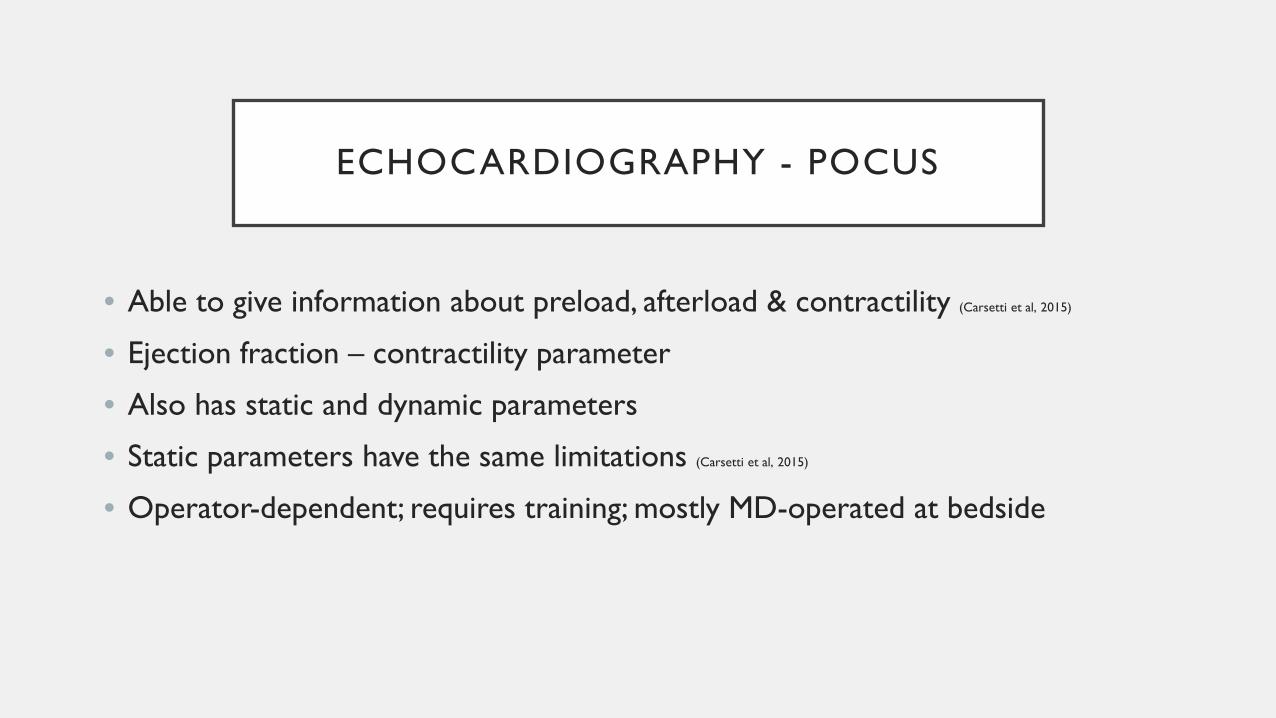
ECHOCARDIOGRAPHY - POCUS
• Able to give information about preload, afterload & contractility (Carsetti et al, 2015)
• Ejection fraction – contractility parameter
• Also has static and dynamic parameters
• Static parameters have the same limitations (Carsetti et al, 2015)
• Operator-dependent; requires training; mostly MD-operated at bedside
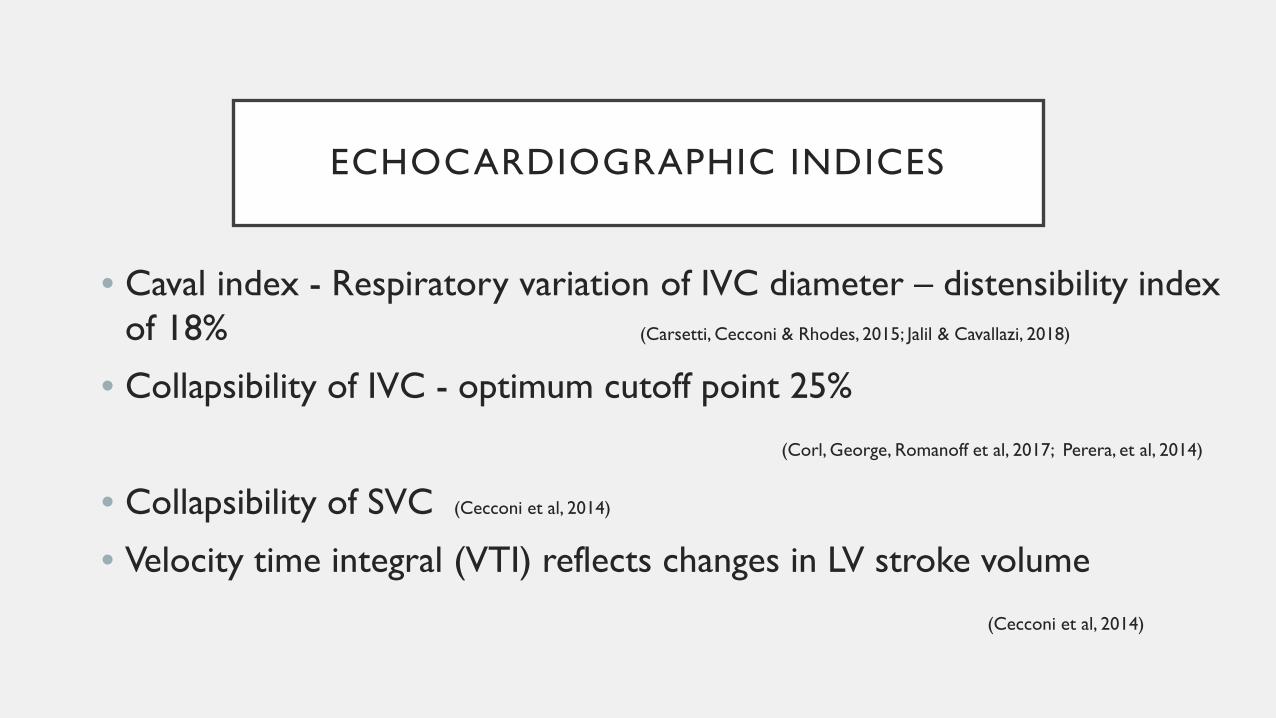
ECHOCARDIOGRAPHIC INDICES
• Caval index - Respiratory variation of IVC diameter – distensibility index of 18% (Carsetti, Cecconi & Rhodes, 2015; Jalil & Cavallazi, 2018)
• Collapsibility of IVC - optimum cutoff point 25%
(Corl, George, Romanoff et al, 2017; Perera, et al, 2014)
• Collapsibility of SVC (Cecconi et al, 2014)
• Velocity time integral (VTI) reflects changes in LV stroke volume
(Cecconi et al, 2014)
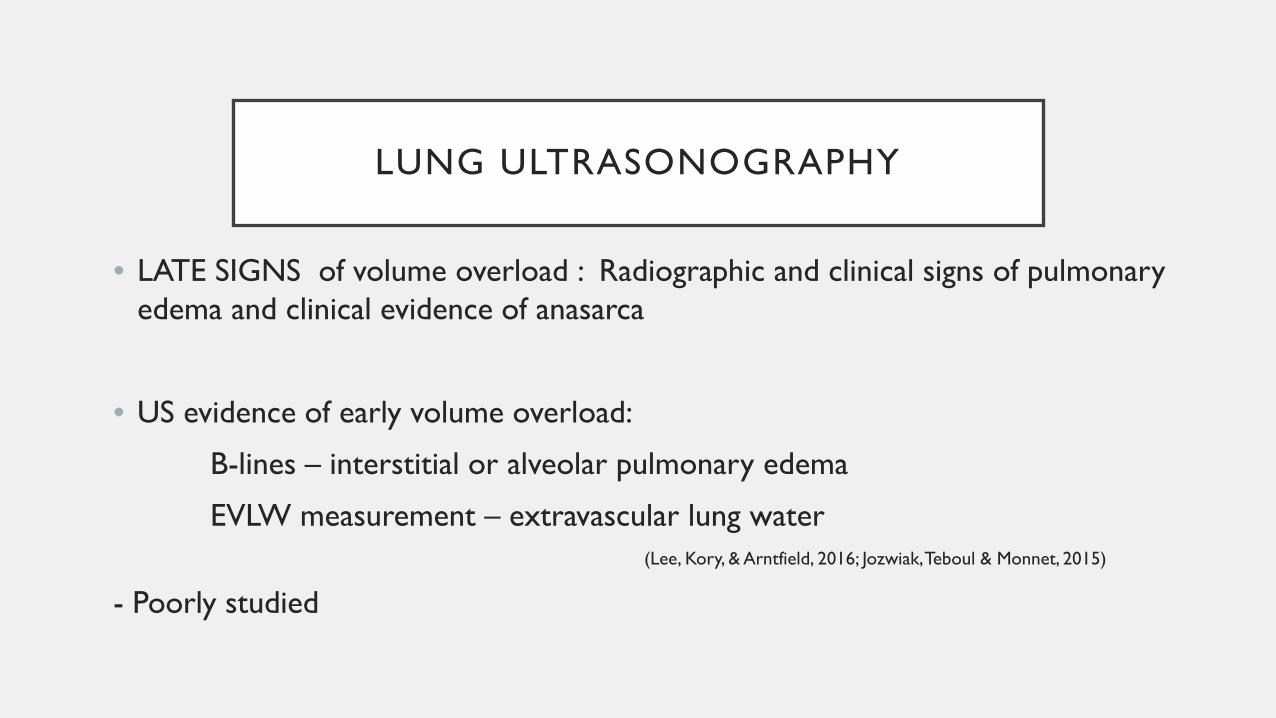
LUNG ULTRASONOGRAPHY
• LATE SIGNS of volume overload : Radiographic and clinical signs of pulmonary edema and clinical evidence of anasarca
• US evidence of early volume overload:
B-lines – interstitial or alveolar pulmonary edema
EVLW measurement – extravascular lung water(Lee, Kory, & Arntfield, 2016; Jozwiak, Teboul & Monnet, 2015)
- Poorly studied
ULTRASOUND EXAM BY NURSES
Feasibility and reliability of pocket-size ultrasound examinations of the pleural cavities and IVC performed by nurses in an outpatient heart failure clinic.
• Dalen, et al., (2015). European Journal of Cardiovascular Nursing
• Done by “specialized” nurses (median time 5 min), relook by cardiologist using a high-end scanner
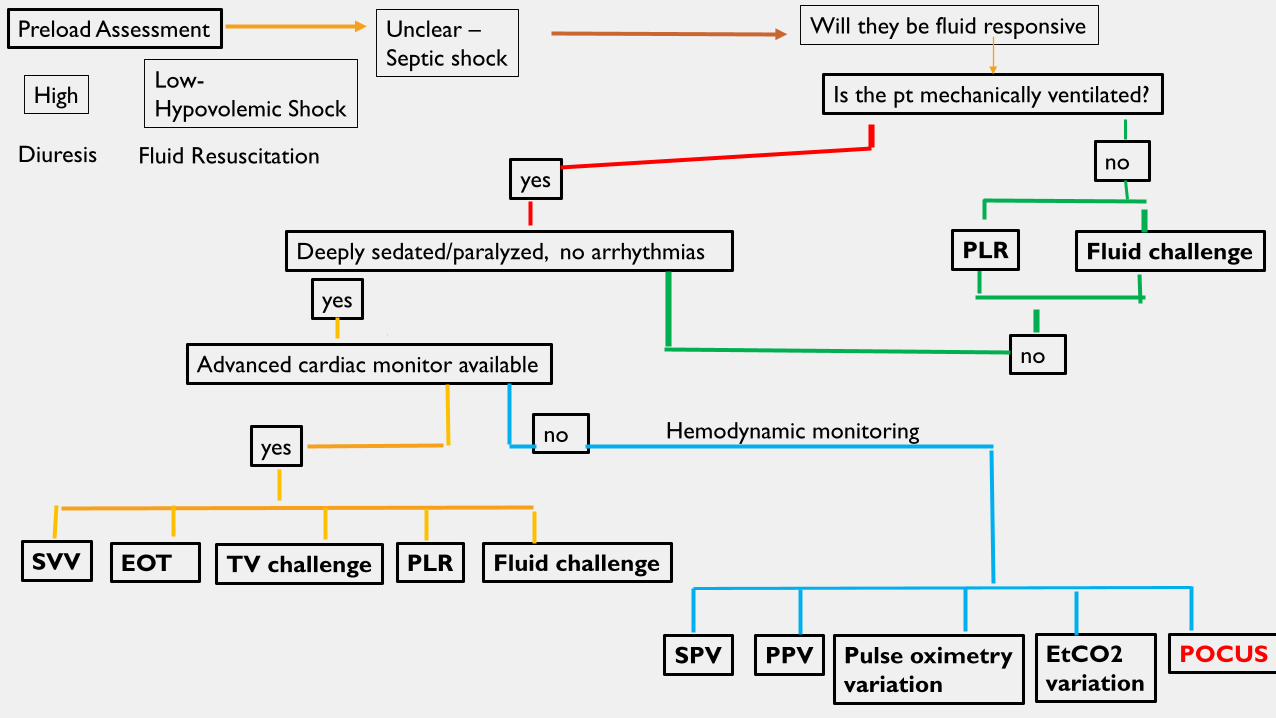
Is the pt mechanically ventilated?
yesno
Fluid challengeDeeply sedated/paralyzed, no arrhythmias
yes
noAdvanced cardiac monitor available
noyes
Preload Assessment
SVV EOT TV challenge PLR Fluid challenge
POCUSPPV Pulse oximetryvariation
SPV EtCO2variation
Will they be fluid responsive
Hemodynamic monitoring
High
Diuresis
Low-Hypovolemic Shock
Fluid Resuscitation
Unclear –Septic shock
PLR
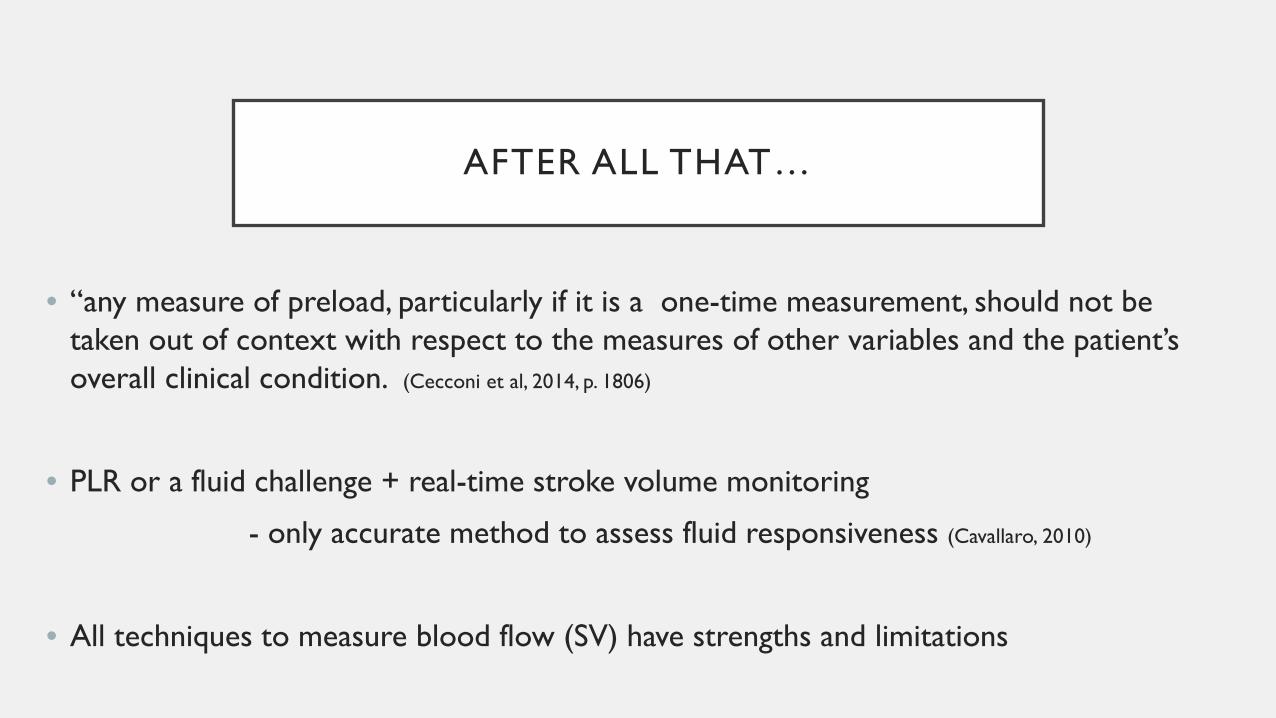
AFTER ALL THAT…
• “any measure of preload, particularly if it is a one-time measurement, should not be taken out of context with respect to the measures of other variables and the patient’s overall clinical condition. (Cecconi et al, 2014, p. 1806)
• PLR or a fluid challenge + real-time stroke volume monitoring
- only accurate method to assess fluid responsiveness (Cavallaro, 2010)
• All techniques to measure blood flow (SV) have strengths and limitations
SUMMARY
• Preload assessment is where you should start
• If further investigation is required – determine if patient is fluid responsive
• Need to remember to use physical assessment first as a key to guide technologically assisted devices
• There is no one answer to determine preload and fluid responsiveness
• Be aware of limitations with TAD to determine preload and fluid responsiveness
REFERENCES
Advanced Hemodynamic Monitoring, (2019). Retrieved from ttps://www.Edwards.com/eu/Products/MinInvasivw/Pages/StrokeVolume VariationWP
Arterial Pressure Variation: Quick Guide. (n.d.). Retrieved from http://clinical view.gehealthcare.com/.
Assadi, F., (2017). Passive leg raising: Simple and reliable technique to prevent fluid overload in critically ill patients. International Journal of
Preventive Medicine, 8:48. Retrieved from https://www.ncb.nlm.nih.gov/pmc/articles/PMC5516436
Carsetti, A., Cecconi, M., & Rhodes, A., (2015). Fluid bolus therapy: monitoring and predicting fluid responsiveness. Current Opinion
Critical Care, 21:388-394.
Cavallaro, F et al. (2010). Diagnostic accuracy of PLR for prediction of fluid responsiveness. Intensive Care Medicine, 36(9), 1475-1483.
Cecconi, M., Hofer, C., Teboul, JL., Pettila, V., Wilkman, E., Molnar, Z., Della Rocca, G., Aldecoa, C., Artigas, A., Jog, S., Sander, M., Spies, C., Lefrant, JY., &
De Backer, D., (2015). Fluid challenges in intensive care: the FENICE study. A global inception cohort study. Intensive Care Medicine, 41:
1529-1537.
Chen, C., (2018). Fluid responsiveness and the six guiding principles of fluid resuscitation. Retrieved from RebeleEM.com
Dalen, H., Gundersen, G., Skjetne, K., Haug, H., Kleinau, J., Norekval, T., & Graven, T., (2015). Feasibility and reliability of pocket-size ultrasound
examinations of the pleural cavities and vena cava inferior performed by nurses in an outpatient heart failure clinic. European Journal of
Cardiovascular Nursing, 14, 286-293.
Elder, A., Japp, A., & Verghese, A., (2016). How valuable is physical examination of the cardiovascular system? British Medical Journal, 354:13309 doi:10.1136/bmj.13309
REFERENCES
Gillespie, M., (2013). NSCC 7120 Module 2: Oxygen supply and demand. Burnaby, B.C: British Columbia Institute of Technology.
Grassi, P., Lo Nigro, L., Battaglia, K., Barone, M., Testa, F., & Berlot, G., (2013). Pulse oressure variation as a predictor of fluid responsiveness in
mechanically ventilated patients with spontaneous breathing activity: a pragmatic observational study. HSR Proceedings in Intensive Care
and Cardiovascular Anesthesia, 5:98-109.
Jozwiak, M., Teboul, J.L., & Monnet, X., (2015). Extravascular lung water in critical care: recent advances and clinical applications. Annals of Intensive
Care, 5: 1-13.
Lakhal, K., Ehrmann, S., Runge, I., Benzekri-Lefevre, D., Legras, A., Dequin, P.F., Mercier, E., Wolff, M., Regnier, B., & Boulain, T., (2010). Central venous
pressure measurements improve the accuracy of leg raising-induced change in pulse pressure to predict fluid responsiveness. Intensive
Care Medicine, 36: 940-948.
Kenny, J.S., (2014). ICU physiology in 1,000 words: Stroke volume variation and the concept of dose-response. PulmCCM (n.d.). Retrieved from
https://pulmccm.org/review-articles/icu-physiology-1000-words-stroke-volume-variation-concept-dose-response/
Maughan, B., Seigel, T., & Napoli, A.(2015). Pleth variability index and fluid responsiveness of hemodynamically stable patients after cardiothoracic
surgery. American Journal of Critical Care, 24, 172- 175.
Metkus, T., (2015). The physical examination and the fifth maneuver. Journal of the American College of Cardiology,
66: 2048 – 2051.
REFERENCES
Mikkelsen, M., Gaieski, D., & Johnson, N., (2019). Novel tools for hemodynamic monitoring in critically ill patients with
shock. Retrieved from www.uptodate.com.ezw.lib.bcit.ca
Monnet, X., & Teboul, JL., (2015). Passive leg raising: five rules, not a drop of fluid. Critical Care. Retrieved from
BioMed Central DOI: 10.1186/s13054-014-0708-5
Morton, P., & Fontaine, D., (2013). Critical Care Nursing, 10th ed. Philadelphia, PA: Lippincott Williams & Wilkins.
Perera, P., Lobo, V., Williams, S., & Gharahbaghian, L., (2014). Cardiac echocardiography. Critical Care Clinics:
Ultrasound: Part 1, 30, 47-92.
Urden, L., Stacy, K, & Lough, M., (2018). Critical Care Nursing 8th ed. Maryland Heights, MO: Elsevier Inc.
Vistisen, S.T., (2017). Using extra systoles to predict fluid responsiveness in cardiothoracic critical care patients.
Journal of Clinical Monitoring & Computing, 31:693-699.