Navigating a Mature Bull Market - Microsoft · 2018-09-28 · Navigating a Mature Bull Market. ......
28
Ned Davis Research Group Generate Alpha. Identify Risk. Choose Ned Davis Research. ED CLISSOLD, CFA Chief U.S. Strategist September 2018 Navigating a Mature Bull Market
Transcript of Navigating a Mature Bull Market - Microsoft · 2018-09-28 · Navigating a Mature Bull Market. ......
Ned DavisResearch
Group
Generate Alpha. Identify Risk.Choose Ned Davis Research.
ED CLISSOLD, CFAChief U.S. Strategist
September 2018
Navigating a Mature Bull Market
Please see important disclosures at the end of this report. NED DAVIS RESEARCH GROUP i
TABLE OF CONTENTSNDR Approach . . . . . . . . . . . . . . . . . . . . . . . . . . . . . . . . . . . . . . . . . . . . 1
Fundamental. . . . . . . . . . . . . . . . . . . . . . . . . . . . . . . . . . . . . . . . . . . . . 2-5
Macro . . . . . . . . . . . . . . . . . . . . . . . . . . . . . . . . . . . . . . . . . . . . . . . . . . .6-12
Sentiment . . . . . . . . . . . . . . . . . . . . . . . . . . . . . . . . . . . . . . . . . . . . . . 13-15
Technical . . . . . . . . . . . . . . . . . . . . . . . . . . . . . . . . . . . . . . . . . . . . . . . 16-20
Bottom Line. . . . . . . . . . . . . . . . . . . . . . . . . . . . . . . . . . . . . . . . . . . . . 21-22
NDR House Views . . . . . . . . . . . . . . . . . . . . . . . . . . . . . . . . . . . . . . . . 23
NED DAVIS RESEARCH GROUP 1Please see important disclosures at the end of this report.
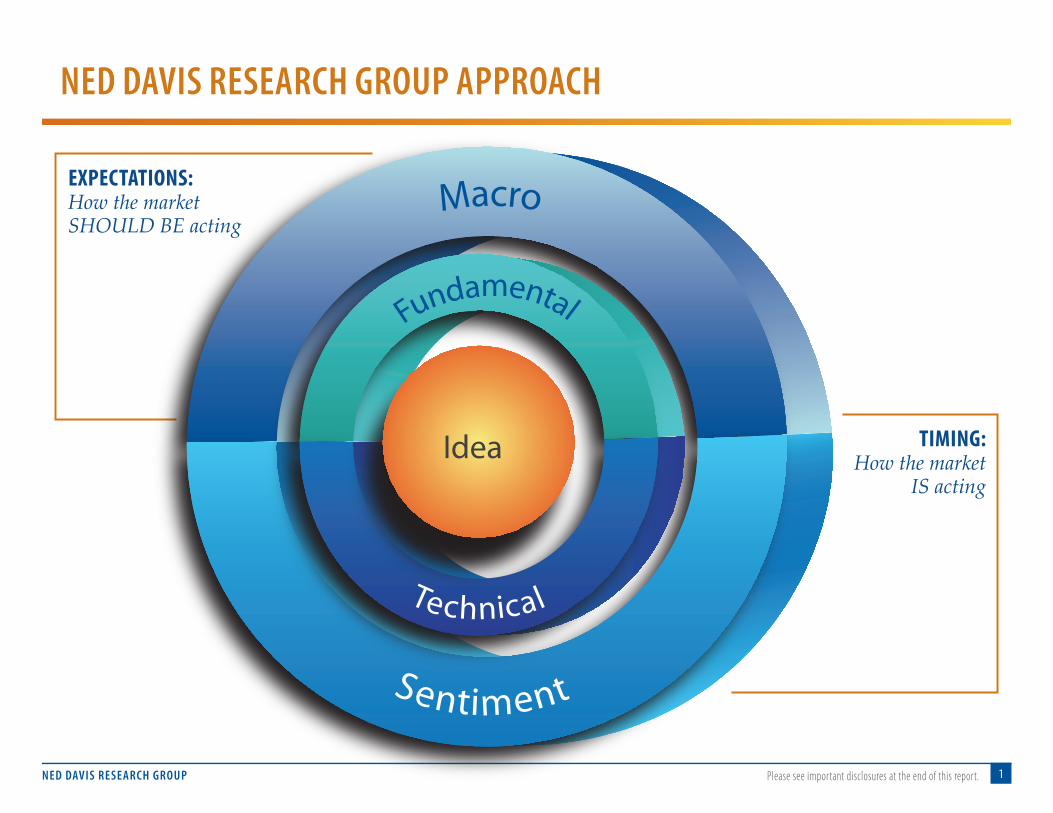
NED DAVIS RESEARCH GROUP APPROACH
EXPECTATIONS:How the market SHOULD BE acting
TIMING:How the market
IS acting
Macro
Sentiment
Fundamental
Technical
Idea
NED DAVIS RESEARCH GROUP 2Please see important disclosures at the end of this report.
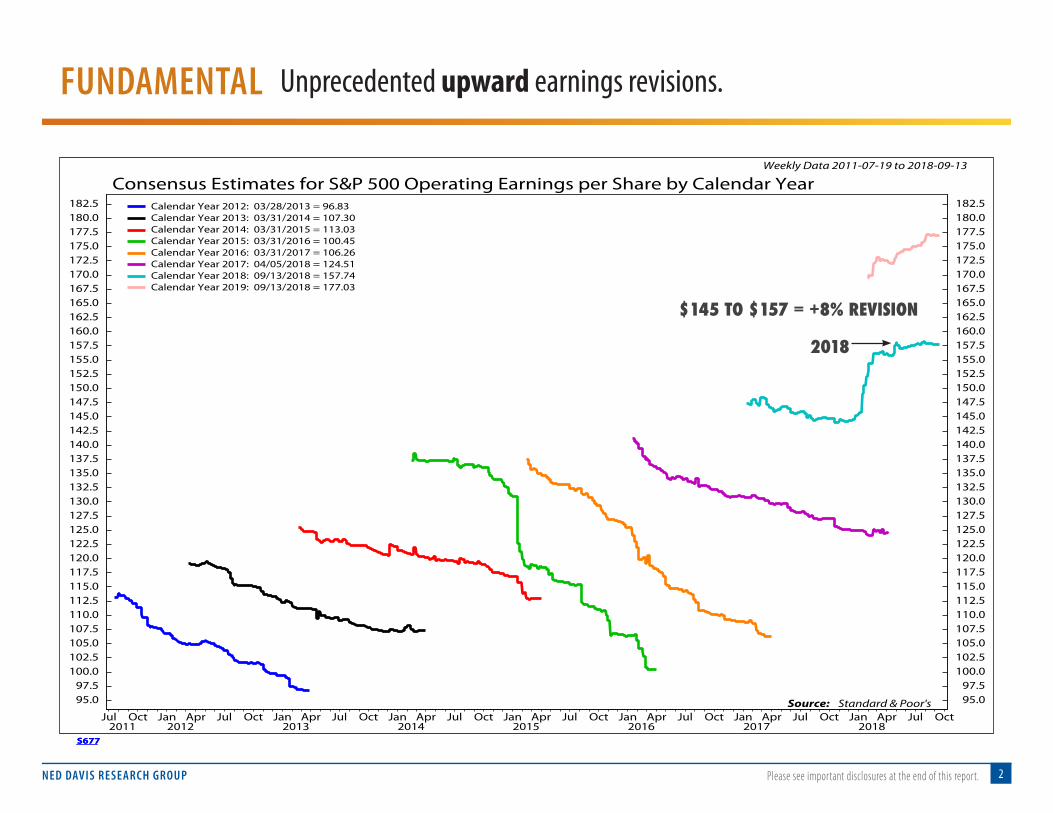
Unprecedented upward earnings revisions.FUNDAMENTAL
© Copyright 2018 Ned Davis Research, Inc. Further distribution prohibited without prior permission. All Rights Reserved.See NDR Disclaimer at www.ndr.com/copyright.html For data vendor disclaimers refer to www.ndr.com/vendorinfo/
S677
Consensus Estimates for S&P 500 Operating Earnings per Share by Calendar YearWeekly Data 2011-07-19 to 2018-09-13
2011Jul Oct
2012Jan Apr Jul Oct
2013Jan Apr Jul Oct
2014Jan Apr Jul Oct
2015Jan Apr Jul Oct
2016Jan Apr Jul Oct
2017Jan Apr Jul Oct
2018Jan Apr Jul Oct
95.097.5
100.0102.5105.0107.5110.0112.5115.0117.5120.0122.5125.0127.5130.0132.5135.0137.5140.0142.5145.0147.5150.0152.5155.0157.5160.0162.5165.0167.5170.0172.5175.0177.5180.0182.5
95.097.5
100.0102.5105.0107.5110.0112.5115.0117.5120.0122.5125.0127.5130.0132.5135.0137.5140.0142.5145.0147.5150.0152.5155.0157.5160.0162.5165.0167.5170.0172.5175.0177.5180.0182.5Calendar Year 2012: 03/28/2013 = 96.83
Calendar Year 2013: 03/31/2014 = 107.30Calendar Year 2014: 03/31/2015 = 113.03Calendar Year 2015: 03/31/2016 = 100.45Calendar Year 2016: 03/31/2017 = 106.26Calendar Year 2017: 04/05/2018 = 124.51Calendar Year 2018: 09/13/2018 = 157.74Calendar Year 2019: 09/13/2018 = 177.03
Source: Standard & Poor's
2018
$145 TO $157 = +8% REVISION
NED DAVIS RESEARCH GROUP 3Please see important disclosures at the end of this report.
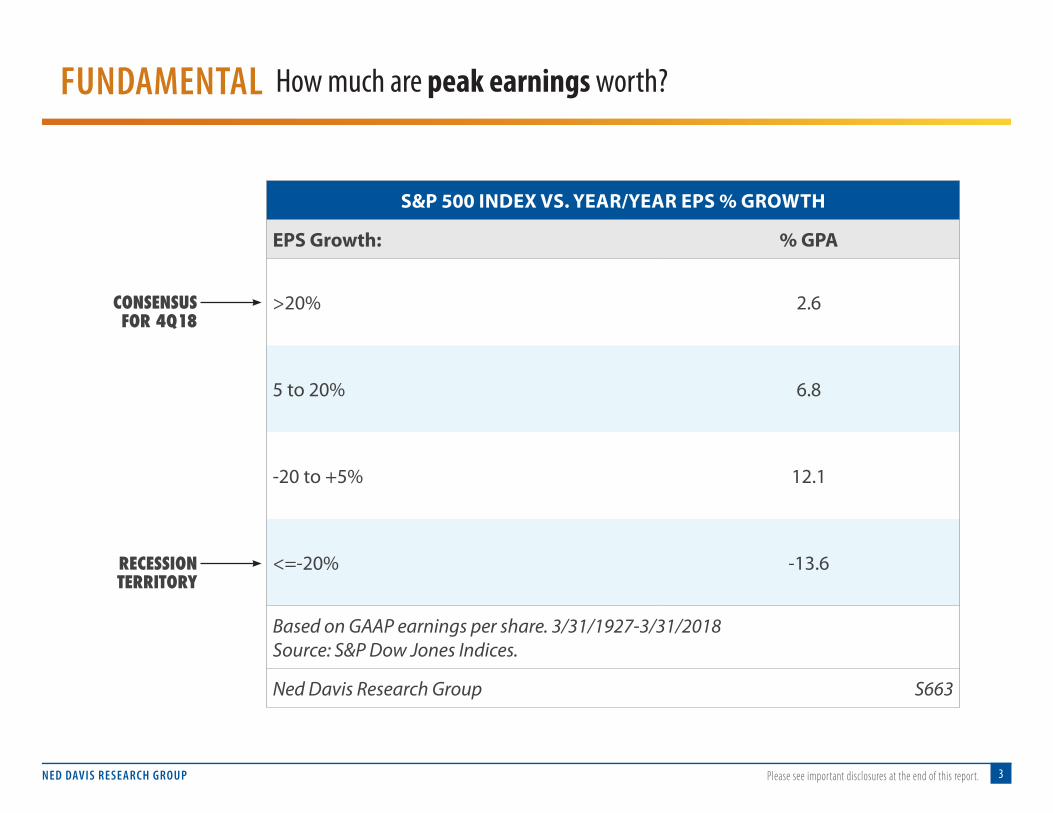
FUNDAMENTAL How much are peak earnings worth?
S&P 500 INDEX VS. YEAR/YEAR EPS % GROWTH
EPS Growth: % GPA
>20% 2.6
5 to 20% 6.8
-20 to +5% 12.1
<=-20% -13.6
Based on GAAP earnings per share. 3/31/1927-3/31/2018Source: S&P Dow Jones Indices.
Ned Davis Research Group S663
CONSENSUS FOR 4Q18
RECESSION TERRITORY
NED DAVIS RESEARCH GROUP 4Please see important disclosures at the end of this report.
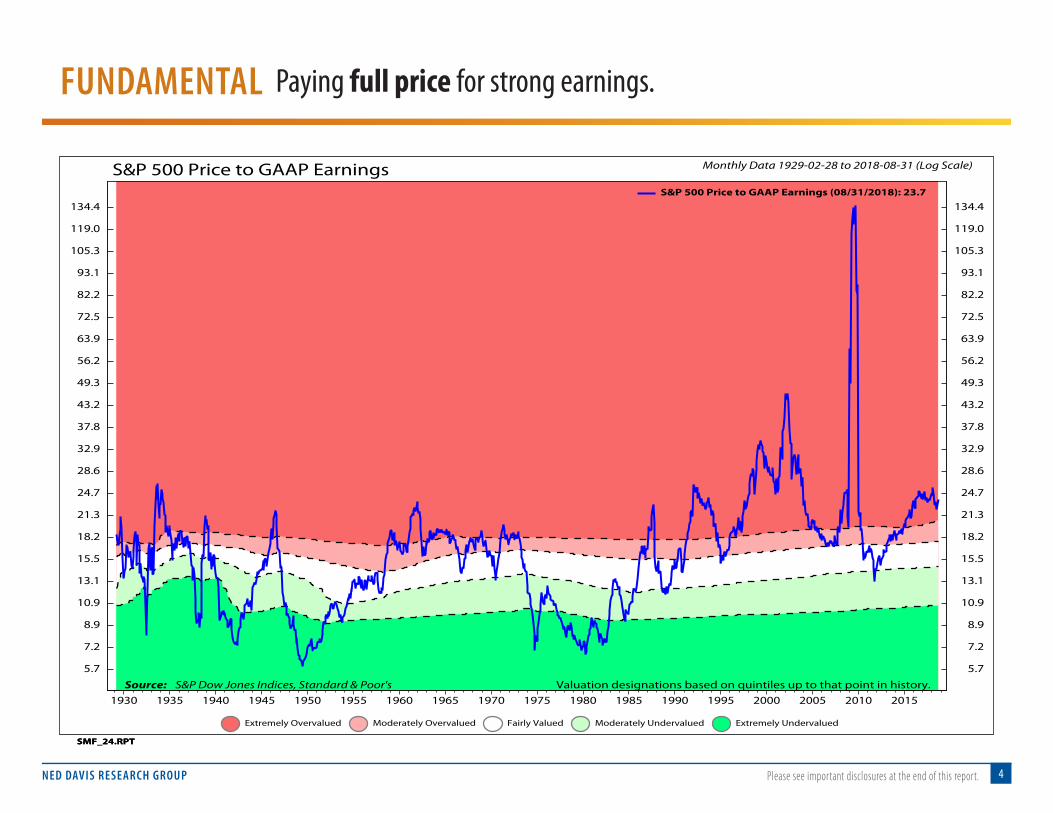
FUNDAMENTAL Paying full price for strong earnings.
© Copyright 2018 Ned Davis Research, Inc. Further distribution prohibited without prior permission. All Rights Reserved.See NDR Disclaimer at www.ndr.com/copyright.html For data vendor disclaimers refer to www.ndr.com/vendorinfo/
SMF_24.RPT
S&P 500 Price to GAAP Earnings Monthly Data 1929-02-28 to 2018-08-31 (Log Scale)
Extremely Overvalued Moderately Overvalued Fairly Valued Moderately Undervalued Extremely Undervalued
1930 1935 1940 1945 1950 1955 1960 1965 1970 1975 1980 1985 1990 1995 2000 2005 2010 2015
5.7
7.2
8.9
10.9
13.1
15.5
18.2
21.3
24.7
28.6
32.9
37.8
43.2
49.3
56.2
63.9
72.5
82.2
93.1
105.3
119.0
134.4
5.7
7.2
8.9
10.9
13.1
15.5
18.2
21.3
24.7
28.6
32.9
37.8
43.2
49.3
56.2
63.9
72.5
82.2
93.1
105.3
119.0
134.4S&P 500 Price to GAAP Earnings (08/31/2018): 23.7
Valuation designations based on quintiles up to that point in history.Source: S&P Dow Jones Indices, Standard & Poor's
NED DAVIS RESEARCH GROUP 5Please see important disclosures at the end of this report.
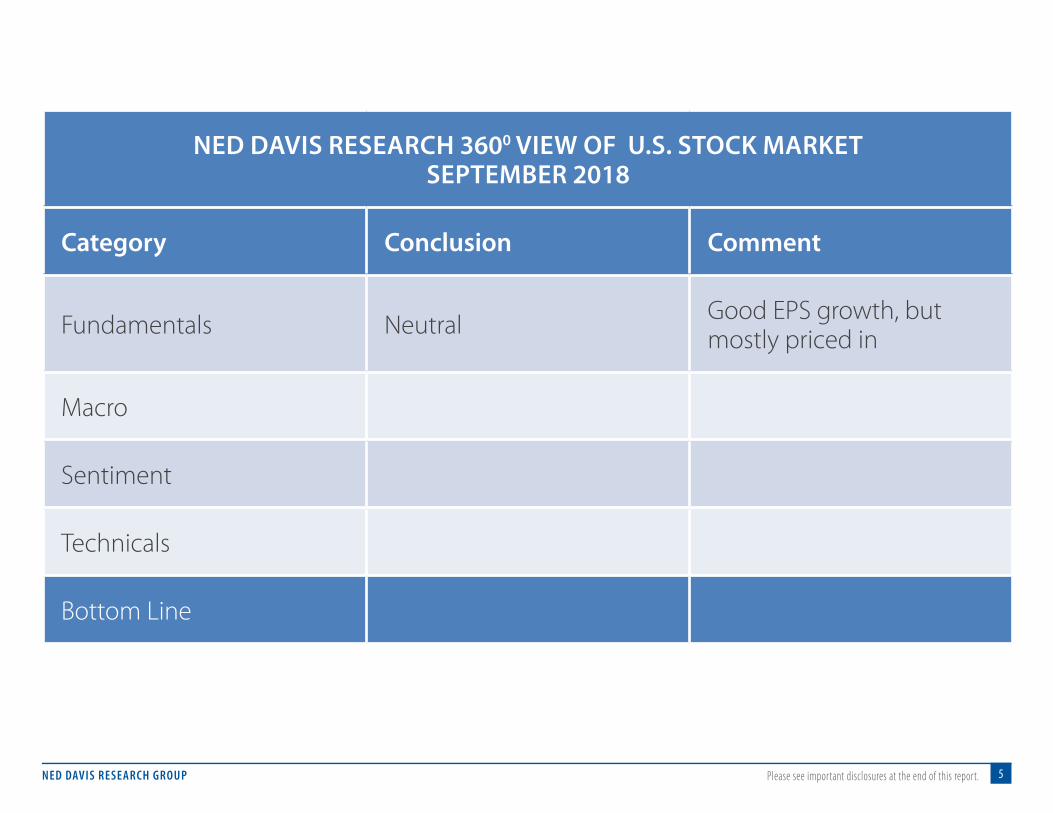
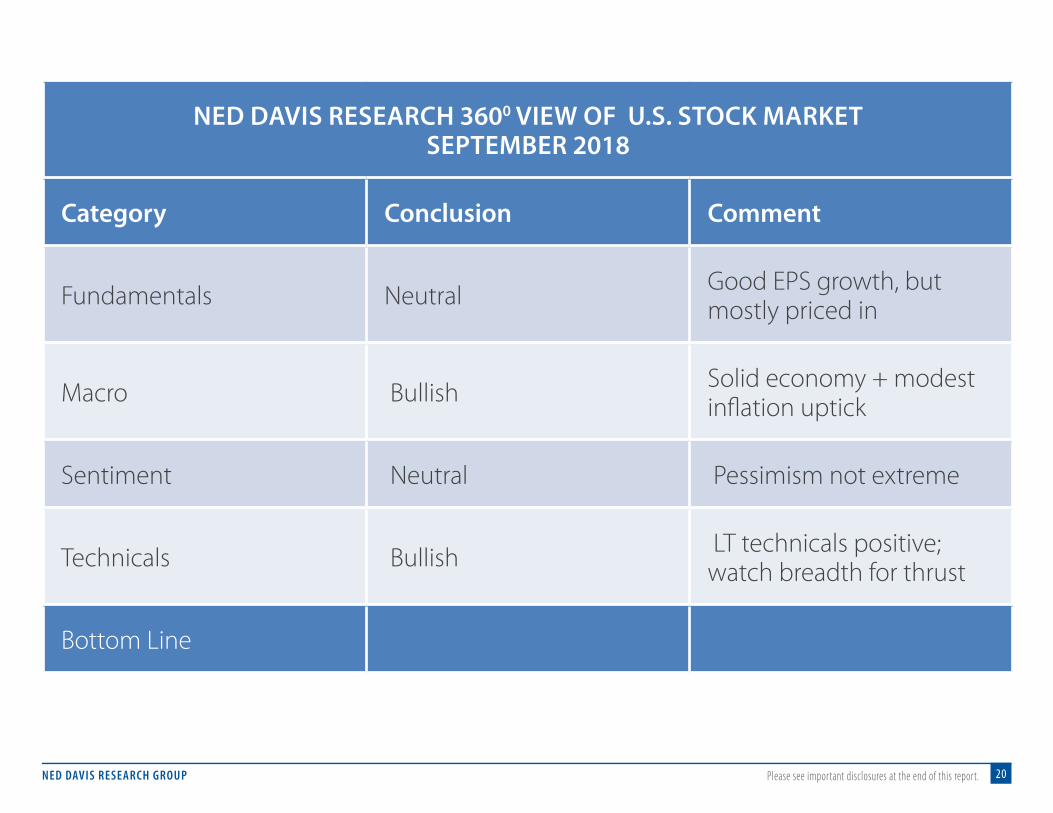
NED DAVIS RESEARCH 3600 VIEW OF U.S. STOCK MARKETSEPTEMBER 2018
Category Conclusion Comment
Fundamentals Neutral Good EPS growth, but mostly priced in
Macro
Sentiment
Technicals
Bottom Line

NED DAVIS RESEARCH GROUP 6Please see important disclosures at the end of this report.
Stocks cheap relative to bonds.MACRO
© Copyright 2018 Ned Davis Research, Inc. Further distribution prohibited without prior permission. All Rights Reserved.See NDR Disclaimer at www.ndr.com/copyright.html For data vendor disclaimers refer to www.ndr.com/vendorinfo/
SMF_24.RPT
S&P 500 GAAP Earnings Yield less 10-Year Treasury Yield Monthly Data 1966-03-31 to 2018-08-31 (Log Scale)
Extremely Overvalued Moderately Overvalued Fairly Valued Moderately Undervalued Extremely Undervalued
1970 1975 1980 1985 1990 1995 2000 2005 2010 2015
-4.8-4.7-4.6-4.5-4.3-4.2-4.0-3.9-3.7-3.5-3.3-3.1-2.9-2.6-2.4-2.1-1.8-1.6-1.2-0.9-0.6-0.20.20.61.11.52.02.53.13.74.34.95.56.26.9
-4.8-4.7-4.6-4.5-4.3-4.2-4.0-3.9-3.7-3.5-3.3-3.1-2.9-2.6-2.4-2.1-1.8-1.6-1.2-0.9-0.6-0.20.20.61.11.52.02.53.13.74.34.95.56.26.9S&P 500 GAAP Earnings Yield less 10-Year Treasury Yield (08/31/2018): 1.4
Valuation designations based on quintiles up to that point in history.Source: S&P Dow Jones Indices, Standard & Poor's
NED DAVIS RESEARCH GROUP 7Please see important disclosures at the end of this report.
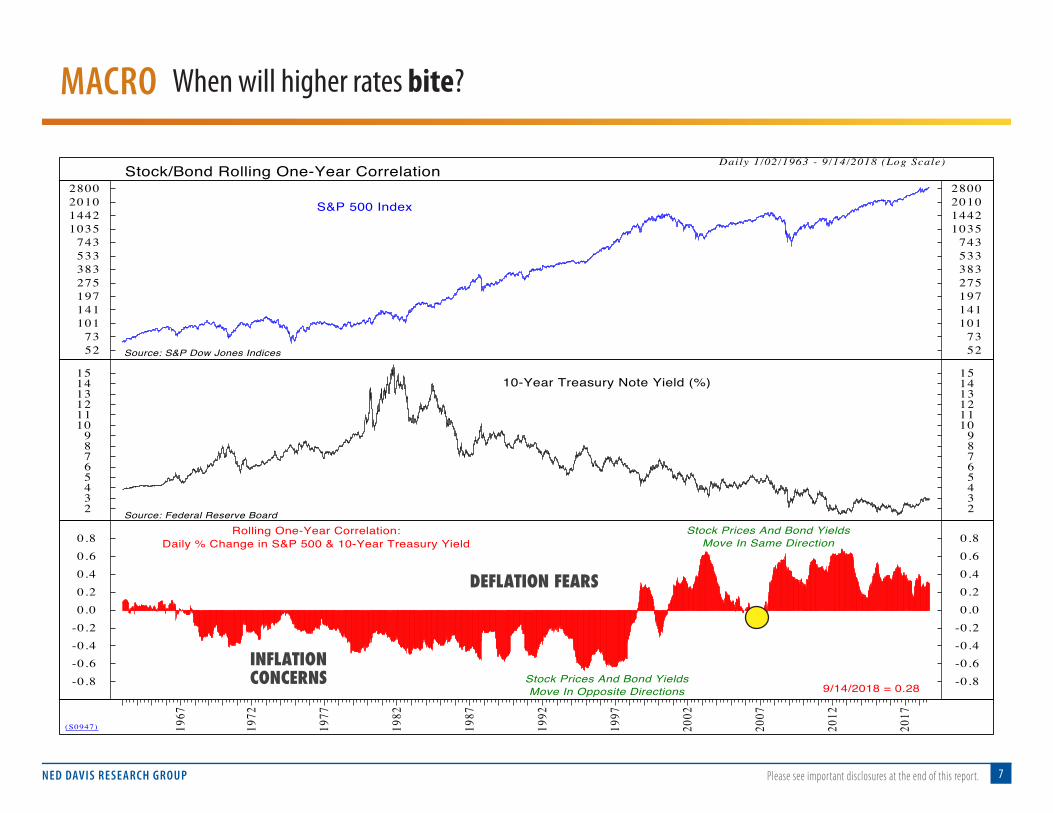
When will higher rates bite?MACRO
(S0947)
Daily 1/02/1963 - 9/14/2018 (Log Scale)
S&P 500 Index
Source: S&P Dow Jones Indices5273
101141197275383533743
1035144220102800
5273
101141197275383533743
1035144220102800
10-Year Treasury Note Yield (%)
Source: Federal Reserve Board23456789
101112131415
23456789
101112131415
9/14/2018 = 0.28
Rolling One-Year Correlation:Daily % Change in S&P 500 & 10-Year Treasury Yield
Stock Prices And Bond YieldsMove In Same Direction
Stock Prices And Bond YieldsMove In Opposite Directions
-0.8-0.6-0.4-0.20.00.20.40.60.8
-0.8-0.6-0.4-0.20.00.20.40.60.8
1967
1972
1977
1982
1987
1992
1997
2002
2007
2012
2017
Stock/Bond Rolling One-Year Correlation
Copyright 2018 Ned Davis Research, Inc. Further distribution prohibited without prior permission. All Rights Reserved..www.ndr.com/vendorinfo/. For data vendor disclaimers refer to www.ndr.com/copyright.htmlSee NDR Disclaimer at
�
DEFLATION FEARS
INFLATION CONCERNS
NED DAVIS RESEARCH GROUP 8Please see important disclosures at the end of this report.
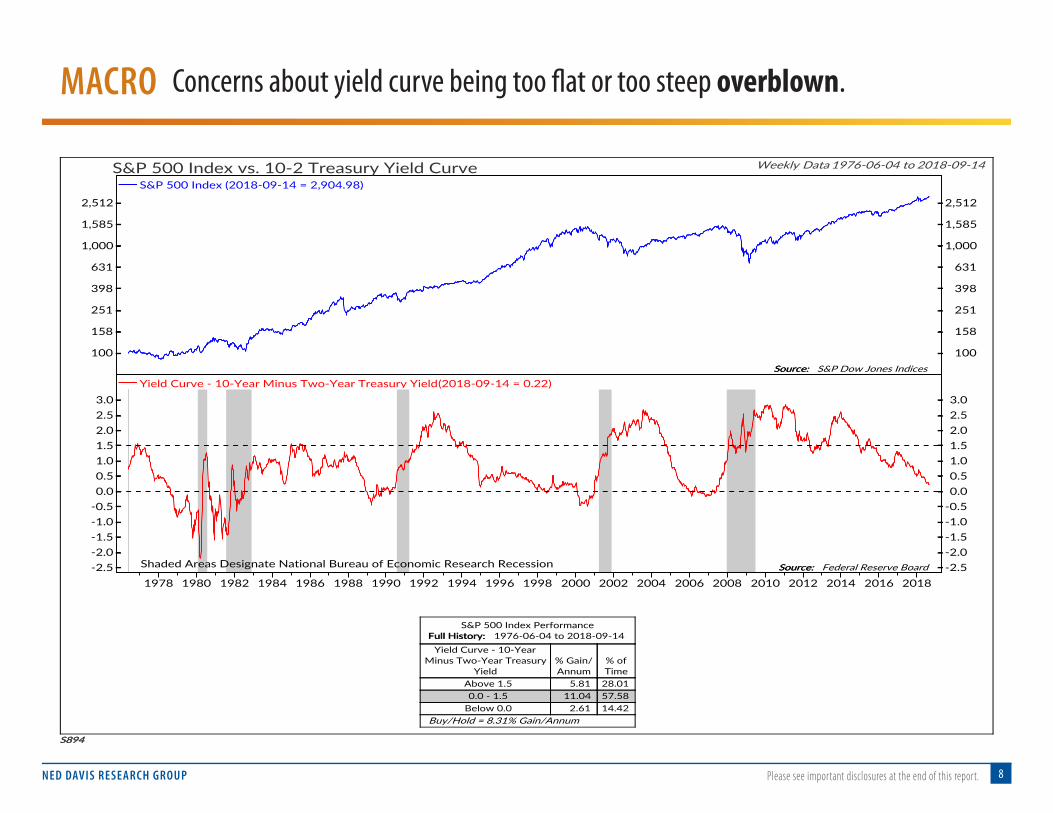
Concerns about yield curve being too flat or too steep overblown.MACRO
S894S894
1978 1980 1982 1984 1986 1988 1990 1992 1994 1996 1998 2000 2002 2004 2006 2008 2010 2012 2014 2016 2018
100
158
251
398
631
1,000
1,585
2,512
100
158
251
398
631
1,000
1,585
2,512
-2.5
-2.0
-1.5
-1.0
-0.5
0.0
0.5
1.0
1.5
2.0
2.5
3.0
-2.5
-2.0
-1.5
-1.0
-0.5
0.0
0.5
1.0
1.5
2.0
2.5
3.0
Source:Source: S&P Dow Jones Indices
Shaded Areas Designate National Bureau of Economic Research Recession Source:Source: Federal Reserve Board
Weekly Data 1976-06-04 to 2018-09-14S&P 500 Index vs. 10-2 Treasury Yield Curve
S&P 500 Index Performance
Full History:Full History: 1976-06-04 to 2018-09-14
Yield Curve - 10-Year
Minus Two-Year Treasury
Yield
% Gain/
Annum
% of
Time
Above 1.5 5.81 28.01
0.0 - 1.5 11.04 57.58
Below 0.0 2.61 14.42
Buy/Hold = 8.31% Gain/Annum
S&P 500 Index (2018-09-14 = 2,904.98)
Yield Curve - 10-Year Minus Two-Year Treasury Yield(2018-09-14 = 0.22)
NED DAVIS RESEARCH GROUP 9Please see important disclosures at the end of this report.
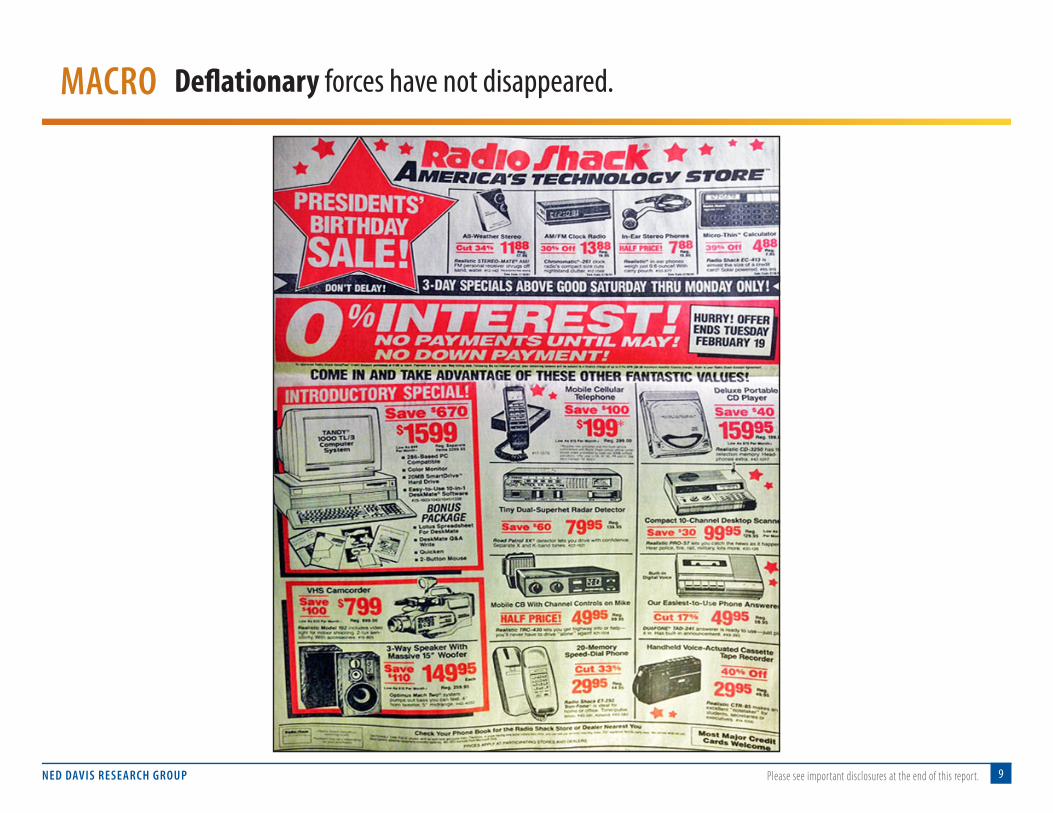
Deflationary forces have not disappeared.MACRO
NED DAVIS RESEARCH GROUP 10Please see important disclosures at the end of this report.
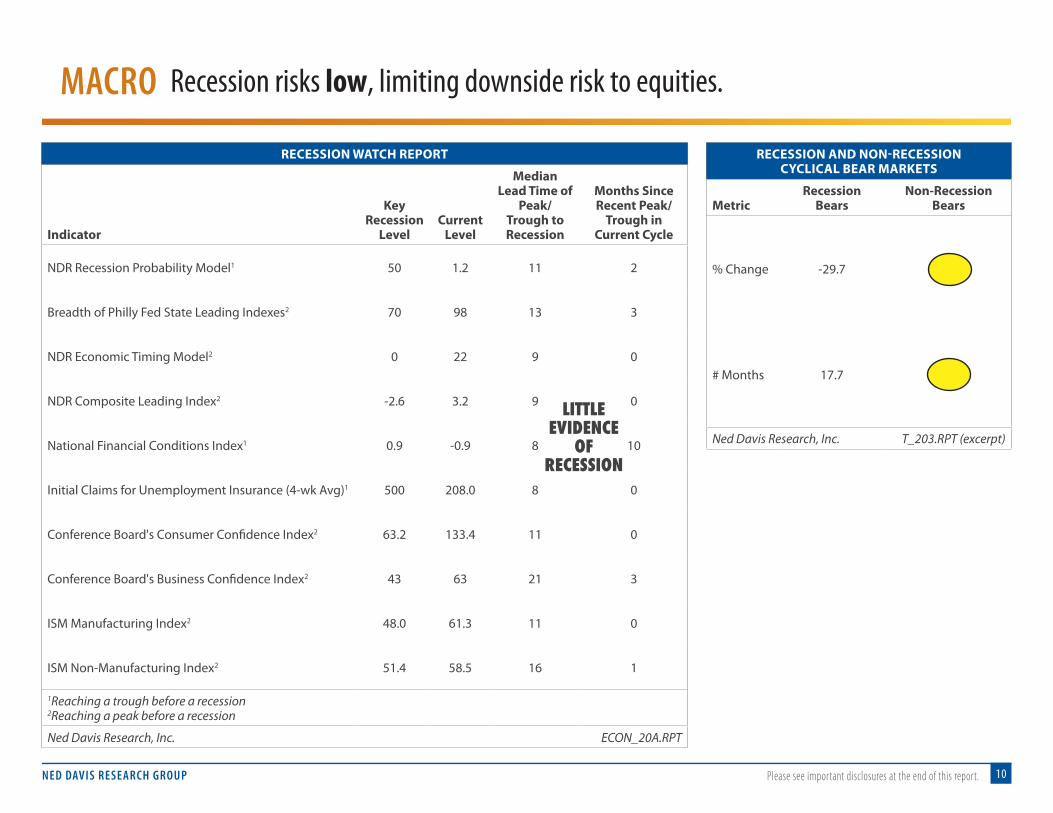
Recession risks low, limiting downside risk to equities.MACRO
RECESSION WATCH REPORT
Indicator
Key Recession
LevelCurrent
Level
Median Lead Time of
Peak/ Trough to Recession
Months Since Recent Peak/
Trough in Current Cycle
NDR Recession Probability Model1 50 1.2 11 2
Breadth of Philly Fed State Leading Indexes2 70 98 13 3
NDR Economic Timing Model2 0 22 9 0
NDR Composite Leading Index2 -2.6 3.2 9 0
National Financial Conditions Index1 0.9 -0.9 8 10
Initial Claims for Unemployment Insurance (4-wk Avg)1 500 208.0 8 0
Conference Board's Consumer Confidence Index2 63.2 133.4 11 0
Conference Board's Business Confidence Index2 43 63 21 3
ISM Manufacturing Index2 48.0 61.3 11 0
ISM Non-Manufacturing Index2 51.4 58.5 16 1
1Reaching a trough before a recession2Reaching a peak before a recession
Ned Davis Research, Inc. ECON_20A.RPT
RECESSION AND NON-RECESSION CYCLICAL BEAR MARKETS
MetricRecession
BearsNon-Recession
Bears
% Change -29.7 -18.0
# Months 17.7 6.8
Ned Davis Research, Inc. T_203.RPT (excerpt)
LITTLE EVIDENCE
OF RECESSION

NED DAVIS RESEARCH GROUP 11Please see important disclosures at the end of this report.
Economy needs more than the consumer.MACRO
Quarterly 3/31/1995 - 6/30/2018
(E65)
PCE 6/30/2018 = 2.55
Source: Bureau of Economic Analysis-2.0-1.00.01.02.03.04.05.0
-2.0-1.00.01.02.03.04.05.0
Gross Private Domestic Investment 6/30/2018 = 0.10
-6
-4
-2
0
2
4
-6
-4
-2
0
2
4
Net Exports 6/30/2018 = 1.17
-1.5-1.0-0.50.00.51.01.52.02.5
-1.5-1.0-0.50.00.51.01.52.02.5
Government 6/30/2018 = 0.41
-0.9-0.6-0.30.00.30.60.91.2
-0.9-0.6-0.30.00.30.60.91.2
1995 2000 2005 2010 2015
Percentage Point Contributions to GDP Growth
Copyright 2018 Ned Davis Research, Inc. Further distribution prohibited without prior permission. All Rights Reserved..www.ndr.com/vendorinfo/. For data vendor disclaimers refer to www.ndr.com/copyright.htmlSee NDR Disclaimer at
�
BIGGEST DRIVER
NEEDED FOR ESCAPE VELOCITY
TRADE WAR RISK
TAX CUTS

NED DAVIS RESEARCH GROUP 12Please see important disclosures at the end of this report.
NED DAVIS RESEARCH 3600 VIEW OF U.S. STOCK MARKETSEPTEMBER 2018
Category Conclusion Comment
Fundamentals Neutral Good EPS growth, but mostly priced in
Macro Bullish Solid economy + modest inflation uptick
Sentiment
Technicals
Bottom Line

NED DAVIS RESEARCH GROUP 13Please see important disclosures at the end of this report.
SENTIMENT Pessimism never fell to wash out levels.
S574AS574A
1996 1997 1998 1999 2000 2001 2002 2003 2004 2005 2006 2007 2008 2009 2010 2011 2012 2013 2014 2015 2016 2017 2018
631
794
1,000
1,259
1,585
1,995
2,512
631
794
1,000
1,259
1,585
1,995
2,512
30
35
40
45
50
55
60
65
70
75
80
30
35
40
45
50
55
60
65
70
75
80
Source:Source: S&P Dow Jones Indices
33.5 33.9
43.8
46.6
49.7
42.5
49.947.6
38.0
30.9
46.8
40.538.4
47.2
55.253.3
45.8
42.8
52.7
69.2
75.773.5
71.970.5
72.2
58.1
70.773.0
70.7 71.673.9 73.3
69.8
78.9Extreme Optimism (Bearish)
Extreme Pessimism (Bullish)Updates weekly on Wednesday mornings. Source:Source: Ned Davis Research, Inc.
Daily Data 1995-12-01 to 2018-09-13S&P 500 Index vs. NDR Crowd Sentiment Poll - Transitional Mode Basis
S&P 500 Index Performance
Full History:Full History: 1995-12-01 to 2018-09-13
NDR Crowd Sentiment Poll
is
% Gain/
Annum
% of
Time
Above 66.0 -3.29 25.03
57.0 - 66.0 From Above 1.97 18.22
57.0 - 66.0 From Below 21.22 19.05
Below 57.0 10.59 37.23
Buy/Hold = 7.11% Gain/Annum
S&P 500 Composite Index (2018-09-13 = 2904.18)
NDR Crowd Sentiment Poll (2018-09-13 = 67.4)
NED DAVIS RESEARCH GROUP 14Please see important disclosures at the end of this report.
© Copyright 2018 Ned Davis Research, Inc. Further distribution prohibited without prior permission. All Rights Reserved.See NDR Disclaimer at www.ndr.com/copyright.html For data vendor disclaimers refer to www.ndr.com/vendorinfo/
S1062
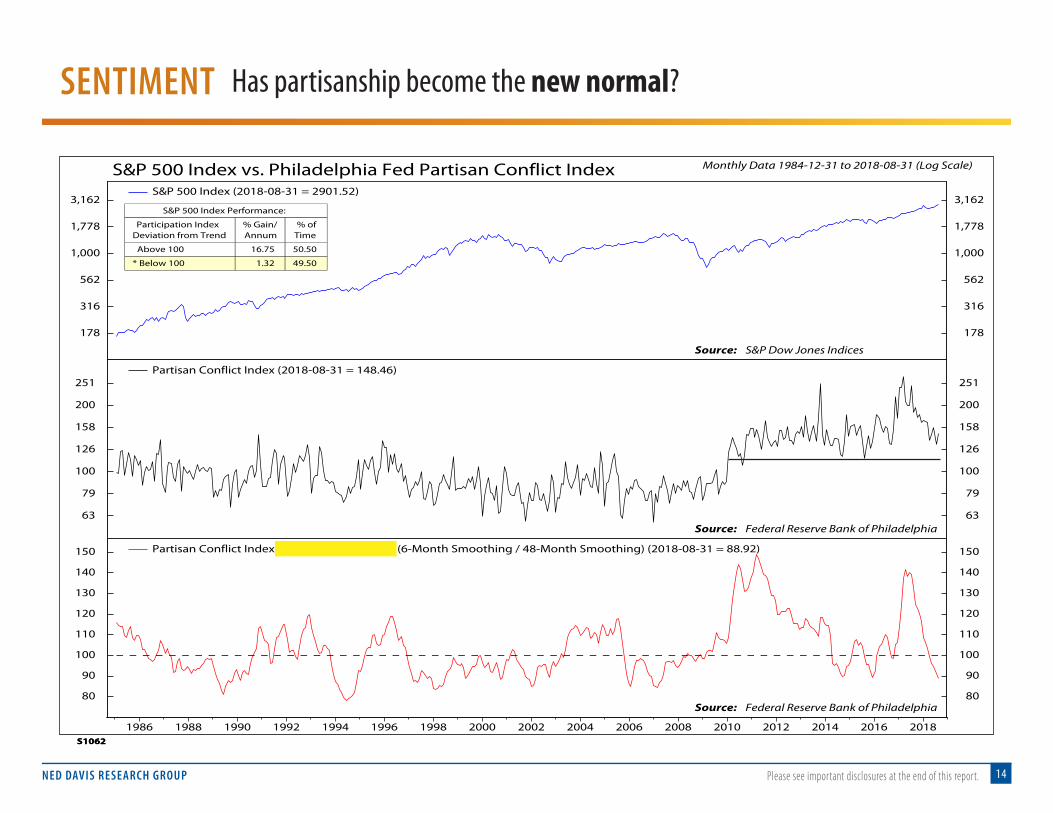
S&P 500 Index vs. Philadelphia Fed Partisan Conflict Index Monthly Data 1984-12-31 to 2018-08-31 (Log Scale)
© Copyright 2018 Ned Davis Research, Inc. Further distribution prohibited without prior permission. All Rights Reserved.See NDR Disclaimer at www.ndr.com/copyright.html For data vendor disclaimers refer to www.ndr.com/vendorinfo/
S1062
S&P 500 Index vs. Philadelphia Fed Partisan Conflict Index Monthly Data 1984-12-31 to 2018-08-31 (Log Scale)
1986 1988 1990 1992 1994 1996 1998 2000 2002 2004 2006 2008 2010 2012 2014 2016 2018
178
316
562
1,000
1,778
3,162
178
316
562
1,000
1,778
3,162S&P 500 Index (2018-08-31 = 2901.52)
S&P 500 Index Performance:
Participation IndexDeviation from Trend
% Gain/Annum
% ofTime
Above 100 16.75 50.50
* Below 100 1.32 49.50
Source: S&P Dow Jones Indices
63
79
100
126
158
200
251
63
79
100
126
158
200
251Partisan Conflict Index (2018-08-31 = 148.46)
Source: Federal Reserve Bank of Philadelphia
80
90
100
110
120
130
140
150
80
90
100
110
120
130
140
150Partisan Conflict Index Deviation from Trend (6-Month Smoothing / 48-Month Smoothing) (2018-08-31 = 88.92)
Source: Federal Reserve Bank of Philadelphia
SENTIMENT Has partisanship become the new normal?
NED DAVIS RESEARCH GROUP 15Please see important disclosures at the end of this report.
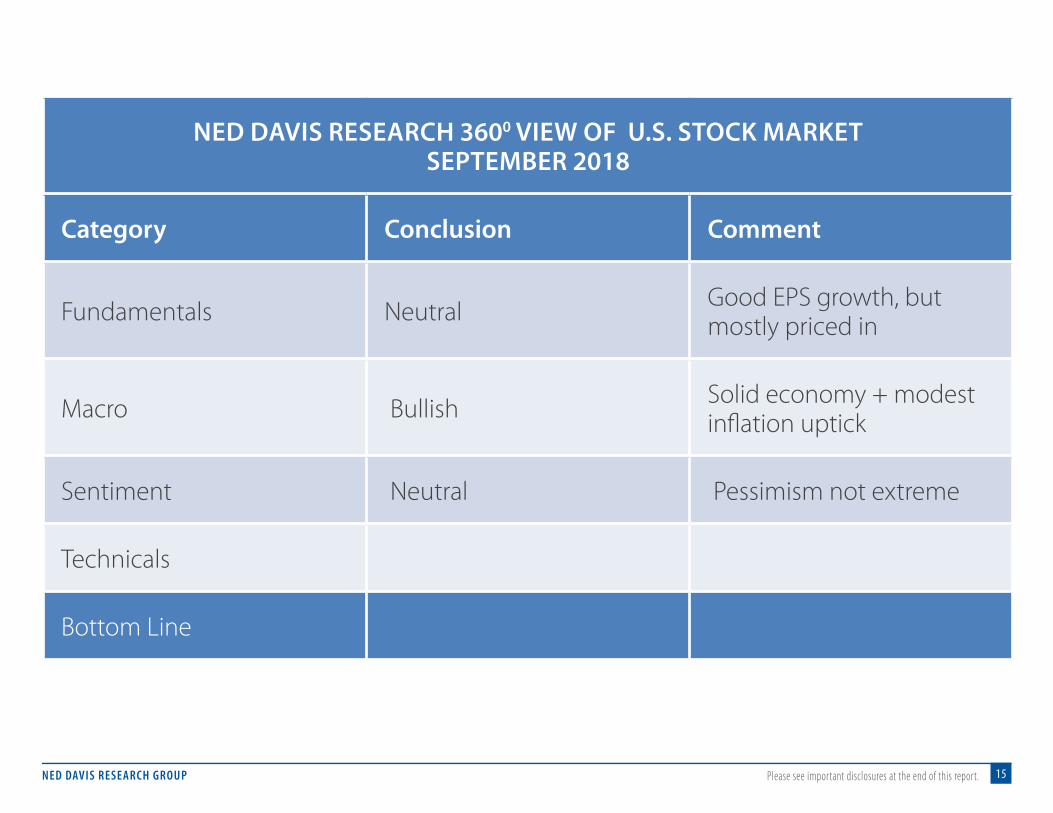
NED DAVIS RESEARCH 3600 VIEW OF U.S. STOCK MARKETSEPTEMBER 2018
Category Conclusion Comment
Fundamentals Neutral Good EPS growth, but mostly priced in
Macro Bullish Solid economy + modest inflation uptick
Sentiment Neutral Pessimism not extreme
Technicals
Bottom Line

NED DAVIS RESEARCH GROUP 16Please see important disclosures at the end of this report.
TECHNICAL Sell in May period even weaker in mid-term years.
© Copyright 2018 Ned Davis Research, Inc. Further distribution prohibited without prior permission. All Rights Reserved.See NDR Disclaimer at www.ndr.com/copyright.html For data vendor disclaimers refer to www.ndr.com/vendorinfo/
S01666
S&P 500 Cycle Composite for 2018 Daily Data 2017-12-29 to 2018-12-31
2018Jan Feb Mar Apr May Jun Jul Aug Sep Oct Nov Dec
2019Jan
-4.0-3.5-3.0-2.5-2.0-1.5-1.0-0.50.00.51.01.52.02.53.03.54.04.55.05.56.06.57.07.58.08.59.09.5
10.010.511.011.512.012.5
-1.00
-0.75
-0.50
-0.25
0.00
0.25
0.50
0.75
1.00
1.25
1.50
1.75
2.00
2.25
2.50
2.75
3.00
3.25
3.50
3.75
4.00
4.25
4.50
4.75
5.00
2018 Cycle CompositePlaces Equal Weight On:One-Year Seasonal CycleFour-Year Presidential Cycle10-Year Decennial Cycle
Trend Is More Important Than LevelBased on Daily Data 1/3/1928 - 12/31/2017
Lines represent cumulative year-to-date percent gains
S&P 500 Cycle Composite for 2018 (Scale Right)Actual S&P 500 Composite Through 2018-09-14 (Scale Left)
Source: S&P Dow Jones Indices
AVERAGE YEAR
2018
NED DAVIS RESEARCH GROUP 17Please see important disclosures at the end of this report.
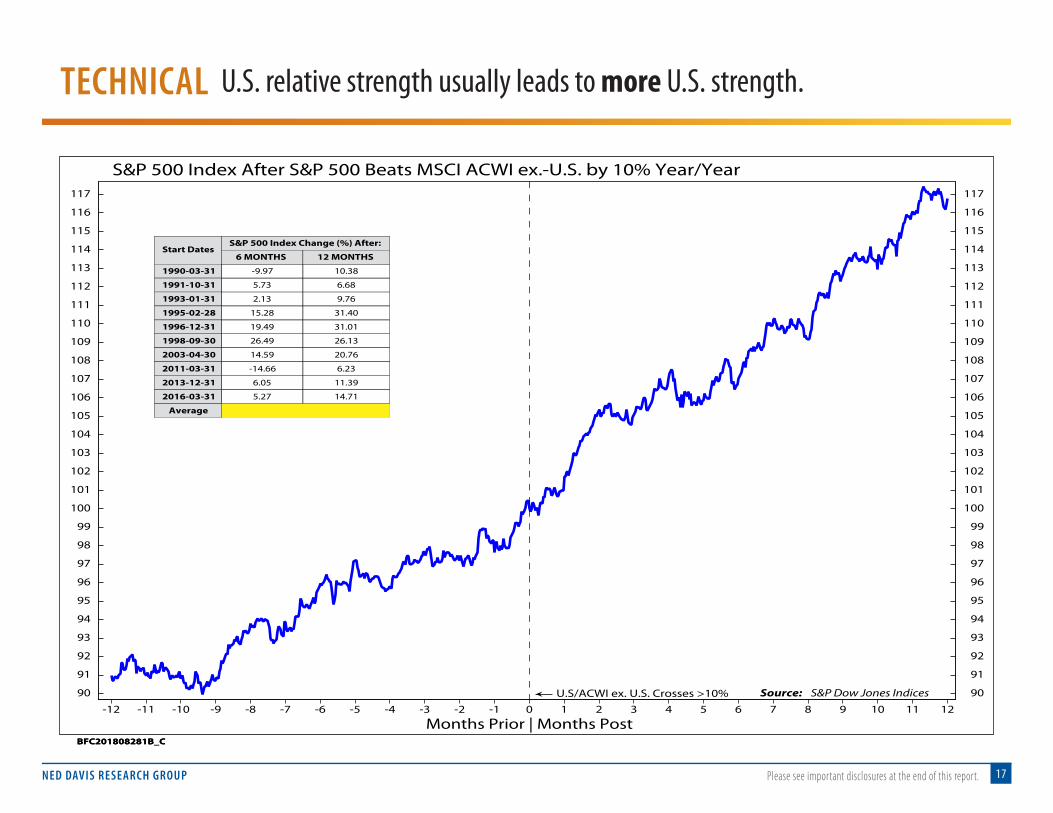
TECHNICAL U.S. relative strength usually leads to more U.S. strength.
© Copyright 2018 Ned Davis Research, Inc. Further distribution prohibited without prior permission. All Rights Reserved.See NDR Disclaimer at www.ndr.com/copyright.html For data vendor disclaimers refer to www.ndr.com/vendorinfo/
BFC201808281B_C
S&P 500 Index After S&P 500 Beats MSCI ACWI ex.-U.S. by 10% Year/Year
-12 -11 -10 -9 -8 -7 -6 -5 -4 -3 -2 -1 0 1 2 3 4 5 6 7 8 9 10 11 12
90
91
92
93
94
95
96
97
98
99
100
101
102
103
104
105
106
107
108
109
110
111
112
113
114
115
116
117
90
91
92
93
94
95
96
97
98
99
100
101
102
103
104
105
106
107
108
109
110
111
112
113
114
115
116
117
U.S/ACWI ex. U.S. Crosses >10%
Months Prior | Months Post
Source: S&P Dow Jones Indices
Start DatesS&P 500 Index Change (%) After:
6 MONTHS 12 MONTHS
1990-03-31 -9.97 10.38
1991-10-31 5.73 6.68
1993-01-31 2.13 9.76
1995-02-28 15.28 31.40
1996-12-31 19.49 31.01
1998-09-30 26.49 26.13
2003-04-30 14.59 20.76
2011-03-31 -14.66 6.23
2013-12-31 6.05 11.39
2016-03-31 5.27 14.71
Average 7.04 16.85
NED DAVIS RESEARCH GROUP 18Please see important disclosures at the end of this report.
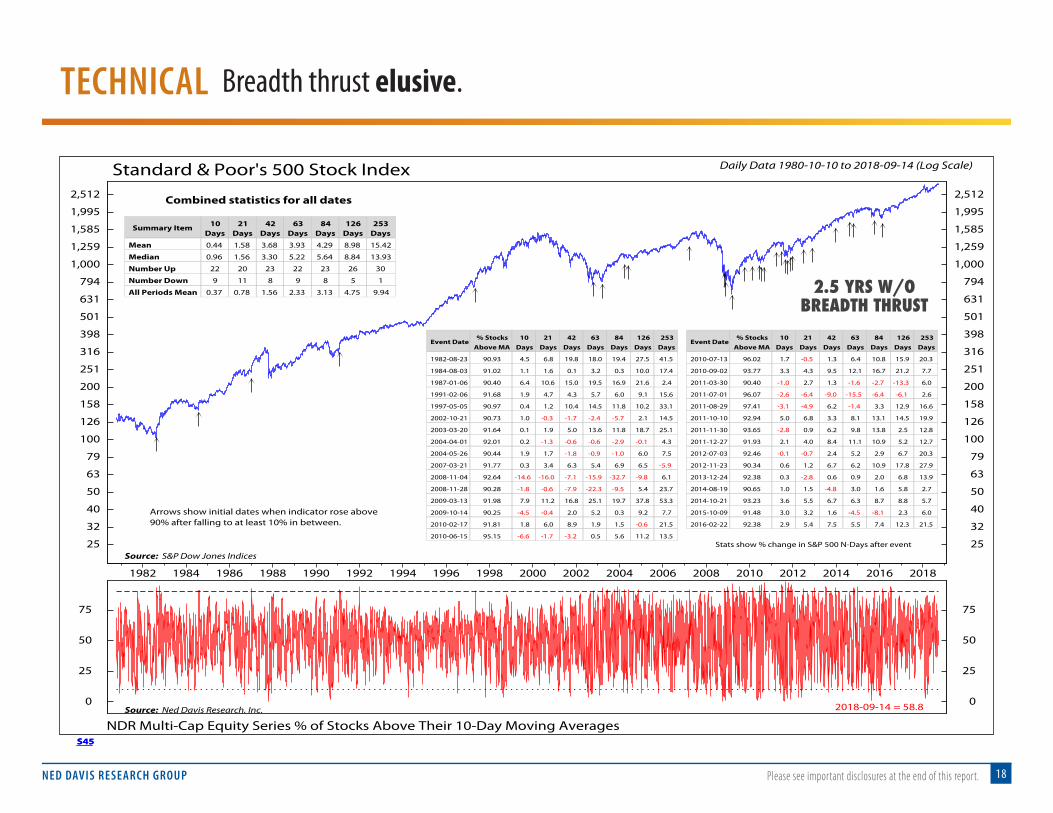
Breadth thrust elusive.TECHNICAL
© Copyright 2018 Ned Davis Research, Inc. Further distribution prohibited without prior permission. All Rights Reserved.See NDR Disclaimer at www.ndr.com/copyright.html For data vendor disclaimers refer to www.ndr.com/vendorinfo/
S45
Standard & Poor's 500 Stock Index Daily Data 1980-10-10 to 2018-09-14 (Log Scale)
NDR Multi-Cap Equity Series % of Stocks Above Their 10-Day Moving Averages
1982 1984 1986 1988 1990 1992 1994 1996 1998 2000 2002 2004 2006 2008 2010 2012 2014 2016 2018
25
32
40
50
63
79
100
126
158
200
251
316
398
501
631
794
1,000
1,259
1,585
1,995
2,512
25
32
40
50
63
79
100
126
158
200
251
316
398
501
631
794
1,000
1,259
1,585
1,995
2,512
Event Date% Stocks
Above MA10
Days21
Days42
Days63
Days84
Days126
Days253
Days
1982-08-23 90.93 4.5 6.8 19.8 18.0 19.4 27.5 41.5
1984-08-03 91.02 1.1 1.6 0.1 3.2 0.3 10.0 17.4
1987-01-06 90.40 6.4 10.6 15.0 19.5 16.9 21.6 2.4
1991-02-06 91.68 1.9 4.7 4.3 5.7 6.0 9.1 15.6
1997-05-05 90.97 0.4 1.2 10.4 14.5 11.8 10.2 33.1
2002-10-21 90.73 1.0 -0.3 -1.7 -2.4 -5.7 2.1 14.5
2003-03-20 91.64 0.1 1.9 5.0 13.6 11.8 18.7 25.1
2004-04-01 92.01 0.2 -1.3 -0.6 -0.6 -2.9 -0.1 4.3
2004-05-26 90.44 1.9 1.7 -1.8 -0.9 -1.0 6.0 7.5
2007-03-21 91.77 0.3 3.4 6.3 5.4 6.9 6.5 -5.9
2008-11-04 92.64 -14.6 -16.0 -7.1 -15.9 -32.7 -9.8 6.1
2008-11-28 90.28 -1.8 -0.6 -7.9 -22.3 -9.5 5.4 23.7
2009-03-13 91.98 7.9 11.2 16.8 25.1 19.7 37.8 53.3
2009-10-14 90.25 -4.5 -0.4 2.0 5.2 0.3 9.2 7.7
2010-02-17 91.81 1.8 6.0 8.9 1.9 1.5 -0.6 21.5
2010-06-15 95.15 -6.6 -1.7 -3.2 0.5 5.6 11.2 13.5
Event Date% Stocks
Above MA10
Days21
Days42
Days63
Days84
Days126
Days253
Days
2010-07-13 96.02 1.7 -0.5 1.3 6.4 10.8 15.9 20.3
2010-09-02 93.77 3.3 4.3 9.5 12.1 16.7 21.2 7.7
2011-03-30 90.40 -1.0 2.7 1.3 -1.6 -2.7 -13.3 6.0
2011-07-01 96.07 -2.6 -6.4 -9.0 -15.5 -6.4 -6.1 2.6
2011-08-29 97.41 -3.1 -4.9 6.2 -1.4 3.3 12.9 16.6
2011-10-10 92.94 5.0 6.8 3.3 8.1 13.1 14.5 19.9
2011-11-30 93.65 -2.8 0.9 6.2 9.8 13.8 2.5 12.8
2011-12-27 91.93 2.1 4.0 8.4 11.1 10.9 5.2 12.7
2012-07-03 92.46 -0.1 -0.7 2.4 5.2 2.9 6.7 20.3
2012-11-23 90.34 0.6 1.2 6.7 6.2 10.9 17.8 27.9
2013-12-24 92.38 0.3 -2.8 0.6 0.9 2.0 6.8 13.9
2014-08-19 90.65 1.0 1.5 -4.8 3.0 1.6 5.8 2.7
2014-10-21 93.23 3.6 5.5 6.7 6.3 8.7 8.8 5.7
2015-10-09 91.48 3.0 3.2 1.6 -4.5 -8.1 2.3 6.0
2016-02-22 92.38 2.9 5.4 7.5 5.5 7.4 12.3 21.5
Stats show % change in S&P 500 N-Days after event
Combined statistics for all dates
Summary Item 10Days
21Days
42Days
63Days
84Days
126Days
253Days
Mean 0.44 1.58 3.68 3.93 4.29 8.98 15.42
Median 0.96 1.56 3.30 5.22 5.64 8.84 13.93
Number Up 22 20 23 22 23 26 30
Number Down 9 11 8 9 8 5 1
All Periods Mean 0.37 0.78 1.56 2.33 3.13 4.75 9.94
Arrows show initial dates when indicator rose above90% after falling to at least 10% in between.
Source: S&P Dow Jones Indices
0
25
50
75
0
25
50
75
Source: Ned Davis Research, Inc. 2018-09-14 = 58.8
2.5 YRS W/O BREADTH THRUST
NED DAVIS RESEARCH GROUP 19Please see important disclosures at the end of this report.
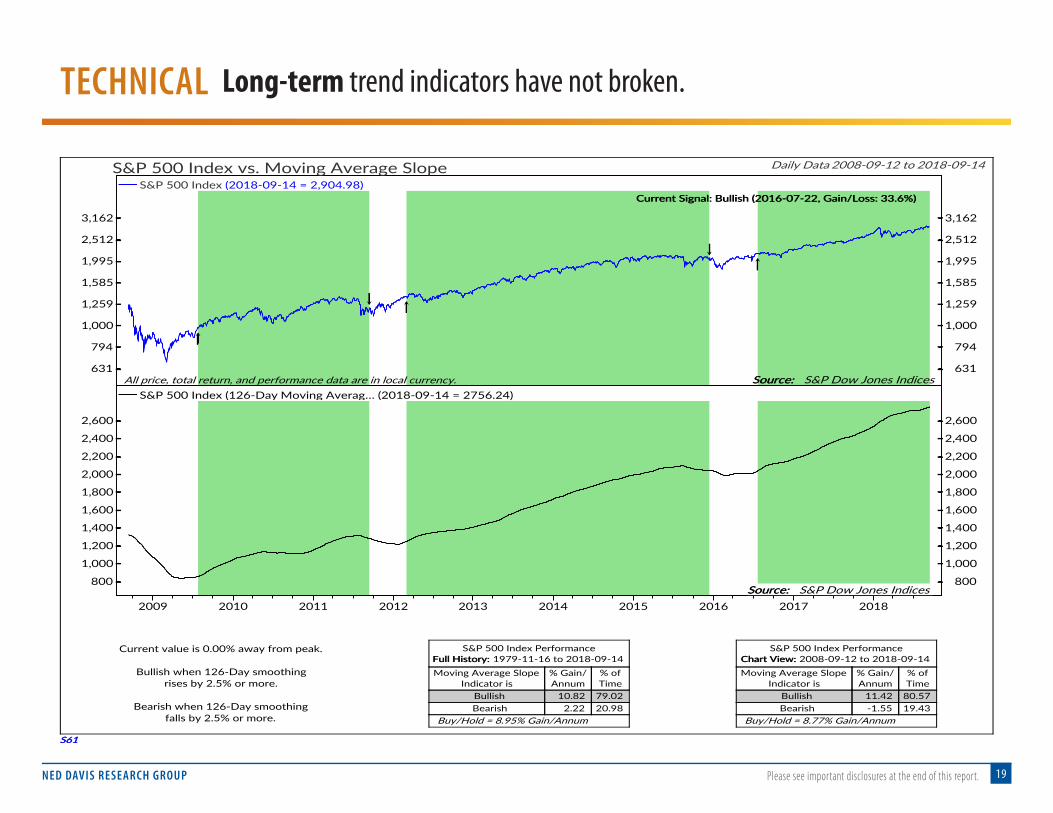
Long-term trend indicators have not broken.TECHNICAL
S61S61
2009 2010 2011 2012 2013 2014 2015 2016 2017 2018
631
794
1,000
1,259
1,585
1,995
2,512
3,162
631
794
1,000
1,259
1,585
1,995
2,512
3,162
800
1,000
1,200
1,400
1,600
1,800
2,000
2,200
2,400
2,600
800
1,000
1,200
1,400
1,600
1,800
2,000
2,200
2,400
2,600
Source:Source: S&P Dow Jones Indices
Current Signal: Bullish (2016-07-22, Gain/Loss: 33.6%)Current Signal: Bullish (2016-07-22, Gain/Loss: 33.6%)
All price, total return, and performance data are in local currency.
Source:Source: S&P Dow Jones Indices
Daily Data 2008-09-12 to 2018-09-14S&P 500 Index vs. Moving Average Slope
Current value is 0.00% away from peak.
Bullish when 126-Day smoothing
rises by 2.5% or more.
Bearish when 126-Day smoothing
falls by 2.5% or more.
S&P 500 Index Performance
Full History:Full History: 1979-11-16 to 2018-09-14
Moving Average Slope
Indicator is
% Gain/
Annum
% of
Time
Bullish 10.82 79.02
Bearish 2.22 20.98
Buy/Hold = 8.95% Gain/Annum
S&P 500 Index Performance
Chart View:Chart View: 2008-09-12 to 2018-09-14
Moving Average Slope
Indicator is
% Gain/
Annum
% of
Time
Bullish 11.42 80.57
Bearish -1.55 19.43
Buy/Hold = 8.77% Gain/Annum
S&P 500 Index (2018-09-14 = 2,904.98)
S&P 500 Index (126-Day Moving Averag… (2018-09-14 = 2756.24)
NED DAVIS RESEARCH GROUP 20Please see important disclosures at the end of this report.
NED DAVIS RESEARCH 3600 VIEW OF U.S. STOCK MARKETSEPTEMBER 2018
Category Conclusion Comment
Fundamentals Neutral Good EPS growth, but mostly priced in
Macro Bullish Solid economy + modest inflation uptick
Sentiment Neutral Pessimism not extreme
Technicals Bullish LT technicals positive; watch breadth for thrust
Bottom Line

NED DAVIS RESEARCH GROUP 21Please see important disclosures at the end of this report.
Watch long-term technicals and interest rates.BOTTOM LINE
NDR U.S. STOCK MARKET MODEL
LONG TERM
SHORT TERM

NED DAVIS RESEARCH GROUP 22Please see important disclosures at the end of this report.
NED DAVIS RESEARCH 3600 VIEW OF U.S. STOCK MARKETSEPTEMBER 2018
Category Conclusion Comment
Fundamentals Neutral Good EPS growth, but mostly priced in
Macro Bullish Solid economy + modest inflation uptick
Sentiment Neutral Pessimism not extreme
Technicals Bullish LT technicals positive; watch breadth for thrust
Bottom Line Bullish Positive technicals deciding factor

NED DAVIS RESEARCH GROUP 23Please see important disclosures at the end of this report.
Q & A
Ned DavisResearch
Group
NED DAVIS RESEARCH GROUP 24Please see important disclosures at the end of this report.
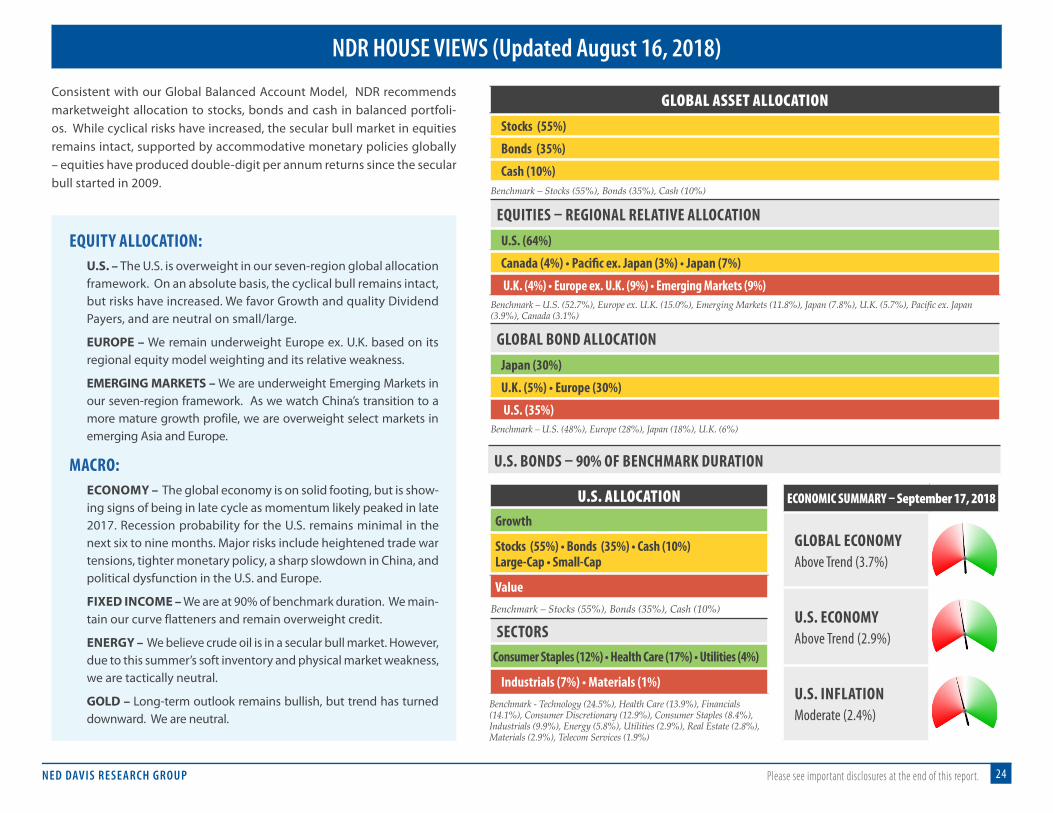
Consistent with our Global Balanced Account Model, NDR recommends marketweight allocation to stocks, bonds and cash in balanced portfoli-os. While cyclical risks have increased, the secular bull market in equities remains intact, supported by accommodative monetary policies globally – equities have produced double-digit per annum returns since the secular bull started in 2009.
EQUITY ALLOCATION: U.S. – The U.S. is overweight in our seven-region global allocation framework. On an absolute basis, the cyclical bull remains intact, but risks have increased. We favor Growth and quality Dividend Payers, and are neutral on small/large.
EUROPE – We remain underweight Europe ex. U.K. based on its regional equity model weighting and its relative weakness.
EMERGING MARKETS – We are underweight Emerging Markets in our seven-region framework. As we watch China’s transition to a more mature growth profile, we are overweight select markets in emerging Asia and Europe.
MACRO: ECONOMY – The global economy is on solid footing, but is show-ing signs of being in late cycle as momentum likely peaked in late 2017. Recession probability for the U.S. remains minimal in the next six to nine months. Major risks include heightened trade war tensions, tighter monetary policy, a sharp slowdown in China, and political dysfunction in the U.S. and Europe.
FIXED INCOME – We are at 90% of benchmark duration. We main-tain our curve flatteners and remain overweight credit.
ENERGY – We believe crude oil is in a secular bull market. However, due to this summer’s soft inventory and physical market weakness, we are tactically neutral.
GOLD – Long-term outlook remains bullish, but trend has turned downward. We are neutral.
ECONOMIC SUMMARY – September 17, 2018
GLOBAL ECONOMYAbove Trend (3.7%)
U.S. ECONOMYAbove Trend (2.9%)
U.S. INFLATIONModerate (2.4%)
U.S. BONDS – 90% OF BENCHMARK DURATION
U.S. ALLOCATIONGrowth
Stocks (55%) • Bonds (35%) • Cash (10%) Large-Cap • Small-Cap
ValueBenchmark – Stocks (55%), Bonds (35%), Cash (10%)
SECTORSConsumer Staples (12%) • Health Care (17%) • Utilities (4%)
Industrials (7%) • Materials (1%)Benchmark - Technology (24.5%), Health Care (13.9%), Financials (14.1%), Consumer Discretionary (12.9%), Consumer Staples (8.4%), Industrials (9.9%), Energy (5.8%), Utilities (2.9%), Real Estate (2.8%), Materials (2.9%), Telecom Services (1.9%)
NDR HOUSE VIEWS (Updated August 16, 2018)
GLOBAL ASSET ALLOCATIONStocks (55%)
Bonds (35%)
Cash (10%)Benchmark – Stocks (55%), Bonds (35%), Cash (10%)
EQUITIES – REGIONAL RELATIVE ALLOCATIONU.S. (64%)
Canada (4%) • Pacifi c ex. Japan (3%) • Japan (7%)
U.K. (4%) • Europe ex. U.K. (9%) • Emerging Markets (9%)Benchmark – U.S. (52.7%), Europe ex. U.K. (15.0%), Emerging Markets (11.8%), Japan (7.8%), U.K. (5.7%), Pacific ex. Japan (3.9%), Canada (3.1%)
GLOBAL BOND ALLOCATIONJapan (30%)
U.K. (5%) • Europe (30%)
U.S. (35%)Benchmark – U.S. (48%), Europe (28%), Japan (18%), U.K. (6%)

Ned DavisResearch
Group
Chief U.S. Strategist
Ed Clissold, CFA, is the Chief U.S. Strategist for Ned Davis Research Group. He and his team are responsible for the firm’s U.S. equity, style, sector and equity theme analysis. They do so via a combination of a top-down analysis of the macroeconomic and fundamental environments and a bottom-up analysis of factors specific to the asset class, market cap, style, sector, or theme. He and his team also provide in-depth macro research on fundamental topics such as earnings, dividends, and cash flow.
Ed writes several U.S. Strategy publications, which provide an intermediate-term outlook on U.S. markets via a combination of top-down and bottom-up analyses. He also writes a quarterly Benchmarks report, which analyzes the attribution of returns across asset classes, sectors, market cap, and styles.
Ed’s market commentary is often quoted in The Wall Street Journal, Barron’s, and other financial publications.
Ed has held a number of other positions since joining the firm in 2002, including Global Equity Strategist, Senior Global Analyst in the Global Asset Allocation group, and Analyst in the Custom Research Services department. Previously, Ed worked at Strong Capital Management and as a Market Strategist at J.C. Bradford & Co.
Ed is a CFA charterholder, a magna cum laude graduate in Economics from Transylvania University, and has earned his Masters in Business Administration in Finance, with distinction, from Indiana University (Kelley).
ED CLISSOLD, CFA
@edclissold
www.linkedin.com/in/edclissold
Important Information and Disclaimers
VENICE600 Bird Bay Drive West Venice, FL 34285(941) 412-2300
NEW YORK1120 Avenue of the Americas6th fl oorNew York, NY 10036(646) 810-7270
BOSTON745 Atlantic AveBoston, MA 02110(617) 279-4860
ATLANTA400 Northridge RoadSuite 515Atlanta, GA 30350(678) 303-0097
SAN FRANCISCO50 California StreetSuite 1500San Francisco, CA 94111(415) 277-5477
LONDON29 Ludgate HillLondonEC4M 7NX+44 (0) 20 7779-8682
HONG KONG38/F Hopewell Centre183 Queen’s Road EastWanchai+852 3416 6676
NED DAVIS RESEARCH GROUPsales @ndr.comwww.ndr.com(800) 241-0621
Ned Davis Research, Inc. (NDR), any NDR affi liates or employees, or any third-party data provider, shall not have any liability for any loss sustained by anyone who has relied on the information contained in any NDR publication. In no event shall NDR, any NDR affi liates or employees, or any third-party data provider, be liable to any party for any direct, indirect, incidental, exemplary, compensatory, punitive, special or consequential damages, costs, expenses, legal fees, or losses (including, without limitation, lost income or lost profi ts and opportunity costs) in connection with any use of the information contained in this document even if advised of the possibility of such damages.
The data and analysis contained in NDR’s publications are provided “as is” and without warranty of any kind, either expressed or implied. The information is based on data believed to be reliable, but it is not guaranteed. NDR DISCLAIMS ANY AND ALL EXPRESS OR IMPLIED WARRANTIES, INCLUDING, BUT NOT LIMITED TO, ANY WARRANTIES OF MERCHANTABILITY, SUITABILITY OR FITNESS FOR A PARTICULAR PURPOSE OR USE.
NDR’s reports refl ect opinions of our analysts as of the date of each report, and they will not necessarily be updated as views or information change. All opinions expressed therein are subject to change without notice, and you should always obtain current information and perform due diligence before trading. NDR or its affi liated companies or their respective shareholders, directors, offi cers and/or employees, may have long or short positions in the securities discussed in NDR’s publications and may purchase or sell such securities without notice.
NDR uses and has historically used various methods to evaluate investments which may, at times, produce contradictory recommendations with respect to the same securities. When evaluating the results of prior NDR recommendations or NDR performance rankings, one should also consider that NDR may modify the methods it uses to evaluate investment opportunities from time to time, that model results do not impute or show the compounded adverse eff ect of transaction costs or management fees or refl ect actual investment results, that other less successful recommendations made by NDR are not included with these model performance reports, that some model results do not refl ect actual historical recommendations, and that investment models are necessarily constructed with the benefi t of hindsight. Unless specifi cally noted on a chart, report, or other device, all performance measures are purely hypothetical, and are the results of back-tested methodologies using data and analysis over time periods that pre-dated the creation of the analysis and do not refl ect tax consequences, execution, commissions, and other trading costs. For these and for many other reasons, the performance of NDR’s past recommendations and model results are not a guarantee of future results.
Using any graph, chart, formula, model, or other device to assist in deciding which securities to trade or when to trade them presents many diffi culties and their eff ectiveness has signifi cant limitations, including that prior patterns may not repeat themselves continuously or on any particular occasion. In addition, market participants using such devices can impact the market in a way that changes the eff ectiveness of such devices. NDR believes no individual graph, chart, formula, model, or other device should be used as the sole basis for any investment decision and suggests that all market participants consider diff ering viewpoints and use a weight of the evidence approach that fi ts their investment needs. Any particular piece of content or commentary may or may not be representative of the NDR House View, and may not align with any of the other content or commentary that is provided in the service. Performance measures on any chart or report are not intended to represent the performance of an investment account or portfolio, as some formulas or models may have superior or inferior results over diff ering time periods based upon macro-economic or investment market regimes. NDR generally provides a full history of a formula or model’s hypothetical performance, which often refl ects an “all in” investment of the represented market or security during “buy”, “bullish”, or similar recommendations. This approach is not indicative of the intended usage of the recommendation in a client’s portfolio, and for this reason NDR does not typically display returns as would be commonly stated when reporting portfolio performance. Clients seeking the usage of any NDR content in a simulated portfolio back-test should contact their account representative to discuss testing that NDR can perform using the client’s specifi c risk tolerances, fees, and other constraints.
NDR’s reports are not intended to be the primary basis for investment decisions and are not designed to meet the particular investment needs of any investor. The reports do not address the suitability of any particular investment for any particular investor. The reports do not address the tax consequences of securities, investments, or strategies, and investors should consult their tax advisors before making investment decisions. Investors should seek professional advice before making investment decisions. The reports are not an off er or the solicitation of an off er to buy or to sell a security.
Further distribution prohibited without prior permission. Full terms of service, including copyrights, terms of use, and disclaimers are available at https://www.ndr.com/web/ndr/terms-of-service. For data vendor disclaimers, refer to www.ndr.com/vendorinfo.
Copyright 2018 (c) Ned Davis Research, Inc. All rights reserved.
Founded in 1980, Ned Davis Research Group is a leading independent research fi rm with clients around the globe. With a
range of products and services utilizing a 360° methodology, we deliver award-winning solutions to the world’s leading
investment management companies. Our clients include professionals from global investment fi rms, banks, insurance
companies, mutual funds, hedge funds, pension and endowment funds, and registered investment advisors.
Generate alpha. Identify risk. Choose Ned Davis Research. Macro
Sentiment
Fundamental
Technical
Idea
360° APPROACH