
Naveen 9911103606 major ppt
16
Image Tampering Detection Naveen Rajgariya 9911103606 Supervisor - Mr. Sandeep Jain 1
-
Upload
naveen-rajgariya -
Category
Education
-
view
46 -
download
4
Transcript of Naveen 9911103606 major ppt

1
Image Tampering Detection
Naveen Rajgariya 9911103606
Supervisor - Mr. Sandeep Jain

Project Goals
• Develop algorithm to detect and classify possible tampering.
• Motivation: Image validation– Security, law enforcement & intelligence
• Possible tampering – Cropping, rotation, blurring, sharpening, insertion etc.

MotivationSeeing is believing … or is it?
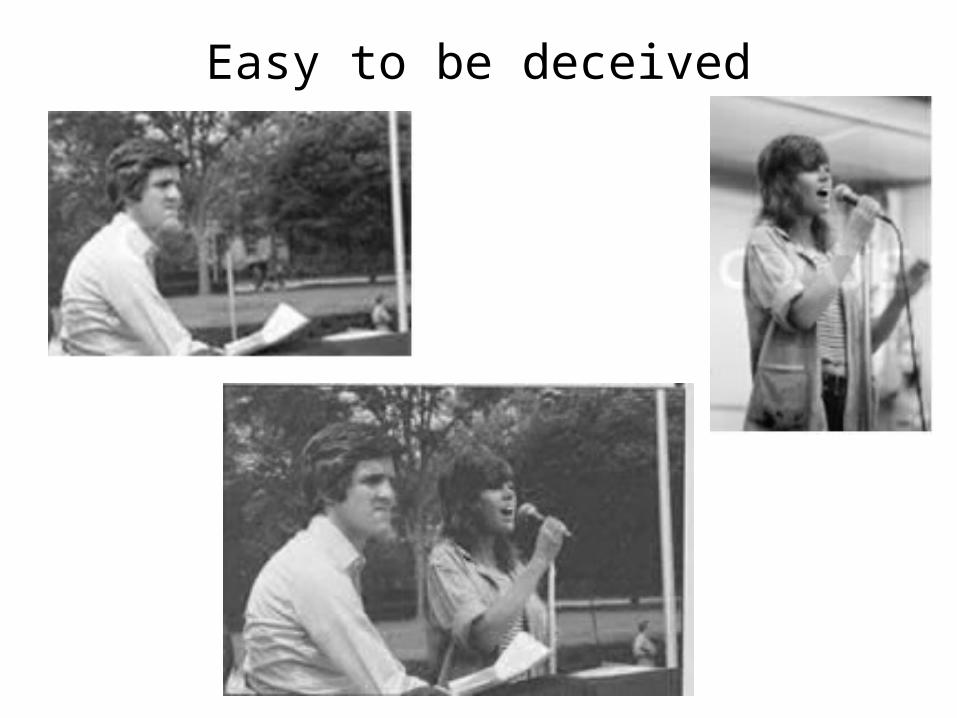
Easy to be deceived

5
Digital Image Forensics
• Forensic analysis of a digital image for knowing its authenticity and origin.
TYPES
ACTIVE PASSIVE

6
Types of Tampering
• Copy – paste: Copying a portion of another image and pasting in our image .
• Copy- move: Copying a portion of our own image and pasting it in the same image.
• Cut – Paste: Cutting a portion of our image and pasting it elsewhere in the same image .
• Cut: Cutting a portion of our image.

Copy-Move
Copying regions of the original image and pasting into other areas.
The yellow area has been copied and moved to conceal the truck.

8
Double JPEG Compression Detection
• At a minimum, any digital manipulation requires that an image be loaded into a photo-editing software program and resaved.
• The manipulated image is compressed twice.• This double compression introduces specific artifacts not
present in singly compressed images.• The presence of these artifacts can, therefore, be used as
evidence of some manipulation.

9
1. Estimation of model parameters.[1]
1. Estimation of Q1 -
X, is unquantised DCT coefficient, Q1 is quantisation step 1 & α is the mixture parameter.

10
Sample Results 1
Estimated Q1 Table:6 2 2 1 1 1 1 12 2 1 1 1 1 1 13 1 1 1 1 1 1 11 1 1 1 1 1 1 11 1 1 1 1 1 1 11 1 1 1 1 1 1 11 1 1 1 1 1 1 11 1 1 1 1 1 1 1
-20 0 20 40 60 80 100 120 140
10
20
30
40
50
60

11
Sample Results 2
Estimated Q1 Table:13 9 8 1 1 1 1 110 10 1 1 1 1 1 111 1 1 1 1 1 1 1 1 1 1 1 1 1 1 1 1 1 1 1 1 1 1 1 1 1 1 1 1 1 1 1 1 1 1 1 1 1 1 1 1 1 1 1 1 1 1 1
-20 0 20 40 60 80 100 120 140
10
20
30
40
50

12
Process
1. Preprocessing– Convert input image to YCbCr.
2. Edge Map Generation– Convolution of Y component with 3x3 Laplacian operator.
3. Frequency Transformation– Calculate DA(DFT+ Averaging) and AD(Averaging + DFT).

13
Continued…
4. Detection
– The horizontal frequency spectra obtained from step 3 are plotted separately against frequencies to form DA and AD curves.
– Peaks appear in curves because of resampling.
– The phenomenon due to which the peaks occur is known as interpolation.
14
Future Work(continued)
• Extend methods to classifying other kinds of forgeries.
• Add more features in Q matrix approach to improve accuracy

15
Conclusions
• Different algorithms work for different types of forgeries.
• By proper observations and knowledge of different types of forgeries a comprehensive program to detect any kind of forgery can be developed.

16
THANK YOU


