Nature versus Nurture in the Origins of Highly Productive ...
36
Draft: Comments are very welcome, but please do not cite without permission. Nature versus Nurture in the Origins of Highly Productive Businesses: An Exploratory Analysis of U.S. Manufacturing Establishments J. David Brown and John S. Earle* January 3, 2011 Abstract This paper investigates the origins of productivity leaders, those that operate close to and help push out the production frontier. Do such businesses emerge as top performers from the very beginning of their lives, for example as the consequence of an outstanding founding idea, technology, or location? Or, at the other extreme, do they appear initially as completely average (or even underperformers) that exhibit gradual improvement as they learn and develop with age? To answer this question we draw upon five decades of U.S. Census of Manufacturing (CM) establishment-level data, tracing the productivity leaders of the most recent CM (2007) back over their observed life spans. We also examine possible industry-level correlates of variation in the extent of nature versus nurture that are suggested by theories of industry dynamics and economic growth. *U.S. Bureau of the Census, and George Mason University and Central European University, respectively. Any opinions and conclusions expressed herein are those of the authors and do not necessarily represent the views of the U.S. Census Bureau. All results have been reviewed to ensure that no confidential information is disclosed.
Transcript of Nature versus Nurture in the Origins of Highly Productive ...

Draft: Comments are very welcome, but please do not cite without permission.
Nature versus Nurture in the Origins of Highly Productive Businesses:
An Exploratory Analysis of U.S. Manufacturing Establishments
J. David Brown and John S. Earle*
January 3, 2011
Abstract
This paper investigates the origins of productivity leaders, those that operate close to and
help push out the production frontier. Do such businesses emerge as top performers from the
very beginning of their lives, for example as the consequence of an outstanding founding idea,
technology, or location? Or, at the other extreme, do they appear initially as completely average
(or even underperformers) that exhibit gradual improvement as they learn and develop with age?
To answer this question we draw upon five decades of U.S. Census of Manufacturing (CM)
establishment-level data, tracing the productivity leaders of the most recent CM (2007) back over
their observed life spans. We also examine possible industry-level correlates of variation in the
extent of nature versus nurture that are suggested by theories of industry dynamics and economic
growth.
*U.S. Bureau of the Census, and George Mason University and Central European University,
respectively. Any opinions and conclusions expressed herein are those of the authors and do not
necessarily represent the views of the U.S. Census Bureau. All results have been reviewed to
ensure that no confidential information is disclosed.

1
1. Introduction This paper provides some early results from an exploratory project on the origins of
industry leaders – the businesses with close to the highest productivity within their sectors. Our
focus on these top performers is motivated by their importance as innovators that push out the
productivity frontiers for other firms to follow, thus playing a crucial role in long-term economic
growth. The policy issues relevant for productivity leaders may be quite different from those of
the average market participants: policies for leaders would focus more on incentives to invest
and innovate and less on corporate governance, market discipline, organizational type, and
human capital.
A basic question we address about the origins of high-productivity businesses concerns
the relative importance of what we refer to as “nature” and “nurture.” Analogously to
conventional usage about human development, “nature” refers to the productivity of a business at
its birth, or very young age, while “nurture” refers to the learning that takes place subsequently.
Are industry leaders born great, or do they become great over time? The extent of nature and
nurture is relevant to assessments of alternative models of industry dynamics, to debates over the
relative value of innovation from start-ups versus mature firms, and to policies affecting entry
versus subsequent investment.
In addition, we address a number of subsidiary questions. To the extent that nurture is
important, does it tend to take place during certain age ranges of the firm or “critical learning
phases” (again borrowing from human development)? How persistent is high productivity
status, once it is achieved? How much variation in the extent of nature and nurture is there within
and across industries? Is the inter-industry variation correlated with industry characteristics
including R&D intensity, financial dependence, capital intensity, industry growth, and market
size? Each of these characteristics can be plausibly motivated by one or another model, but
which are most relevant?
We address these questions by analyzing long panel data covering the universe of U.S.
manufacturing establishments from 1963 to 2007. We trace back businesses to their early years,
measuring their within-industry relative productivity at each point in the observed life cycle.
Defining productivity leaders as those in the top decile (or alternatively, top quintile) of their
industry-specific productivity distributions in 2007, we examine the robustness of the high
productivity classification to alternative measurement approaches and alternative ways of
defining industries and handling industry-switching. We examine the persistence of high
productivity status, and we employ a simple decomposition to measure the relative proportions
of nature and nurture in accounting for it. Exploiting detailed information on establishment age,
we track the evolution of high productivity businesses over their observed life cycles. Finally,
we focus on variation across industries and how the inter-industry differences vary with industry
characteristics connected with some established theoretical models.
Although this paper charts a new area of research, it is also closely related to a number of
fields. Most obviously, the body research on establishment- and firm-level productivity has been
rapidly growing, but this literature mostly focuses on just two moments of the productivity
distribution. Research on the determinants of productivity is concerned almost entirely with
effects at the mean of the distribution, while research on reallocation generally focuses on overall
dispersion (see, e.g., the summary in Syverson, 2010). In this paper, we instead shine a spotlight
on the top end of the distribution. Earlier productivity research made much of the distinction
between productivity at the frontier and distance from the frontier, but most empirical studies,
especially those using the kind of large datasets we analyze here, have taken the frontier as given

2
and investigated determinants of distance at the mean of the distribution.1 Studies of groups of
high performing firms tend to focus on revenue growth (as in the “gazelles” of Birch and Medoff
1994 and Acs and Mueller 2008) rather than productivity, and they do not examine origins
(nature versus nurture).
The research in this paper is also closely related to theoretical models of industry
dynamics. According to the “passive learning” models, originating with Jovanovic (1982),
productivity is determined at birth by a random draw that is unobserved but about which the firm
receives information signals over time. In this case, productivity is fixed, entirely determined by
nature with no role for nurture. In another version of these models, initial productivity is subject
to subsequent random shocks (Hopenhayn 1992). Again, firms cannot affect their own
productivity levels, and position in the productivity distribution is determined primarily by birth,
although productivity and age are positively correlated because of selection (low productivity
leads to exit). Thus, under these models, most productivity dispersion is determined by nature.
By contrast, in “active learning” models (originating with Ericson and Pakes, 1995), producers
can invest to try to improve their productivity levels, thus permitting a role for nurture. Our
analysis sheds light on the relative importance of productivity at birth versus improvements over
time, and thus on the relevance of these alternative (although not mutually exclusive) models.
The models are also helpful for suggesting characteristics of industries and the policy
environment that affect the amount of nature versus nurture. In particular, the sunk cost of entry,
which is influenced by both technological and policy considerations, plays a key role in all the
models. Lower entry cost raises the dispersion of initial productivity, as entrepreneurs
experiment with wild ideas, some of which may become immediate hits. In models of active
learning, the cost of investment (to achieve a better distribution of outcomes from the
productivity draw) also plays an important role. Again, the lower the cost, the more
experimentation takes place and the greater possibility for productivity leaders to emerge.
Whether the source of high productivity emerges as superiority at birth or develops with time
and experimentation is thus related to the size of these costs and how they vary at different stages
of the business life cycle.
Our focus on productivity leaders is also related to research on innovation, but unlike
much of this literature we do not analyze such potential observables as patents or research and
development spending. One reason is that the data we study do not contain such measures,
although our data have the great advantage that we observe the full population of businesses,
which is especially important when the focus is on outliers. Another rationale is that the
observable measures of innovation efforts are necessarily quite incomplete. Finally, our concern
is with trying to understand the sources of systematic success, which we may have a chance at
measuring, rather than the murky, much harder to measure attempts to innovate that fail.
Recent empirical research on business dynamics has adopted some of the vocabulary and
ideas of human demography. The research in this paper expands this approach to include
concepts from the field of cognitive development. Analogously to studies of child development,
we attempt to assess the relative roles of immutable and mutable factors in some aspect of
performance. We investigate the possibility of critical learning periods or “takeoff” periods
when development accelerates, and we consider various factors that may affect the acceleration.
Our focus on productivity leaders is akin to studies of IQ (e.g., Terman’s work on genius, see
1 A partial exception that proves the rule is Bartelsman, Haskel, and Martin (2008), who use data from multiple
countries to estimate domestic and international productivity frontiers: although there are multiple frontiers in the
study, the emphasis is on convergence to the frontier, not on the position of the frontier itself.

3
Seagoe 1975 or Gladwell 2008) or of Nobel prize winners. Are businesses more like
mathematicians, who tend to do their best work very early in life, or more like historians, who
rely on the accumulation of detailed knowledge and judgment over several decades? Our
analysis of productivity development over the firm life cycle is analogous to studies of
“earlybirds” versus “late bloomers” among scientists and scholars, analogies themselves drawn
from horticulture. Although the metaphor is not exact, our premise is that it pushes out a new
frontier in our thinking about the sources of high achievement among organizations.
Finally, our research is related to debates about the “old” versus “new” among both
people and organizations. In the human context, the standard metaphor (interestingly, again
drawn from a different species) is “can a dog learn new tricks?” In studies of businesses, an
important question has been the degree to which experimentation is possible at established
organizations with set ways of doing things, in a word with “inertia.” A second question
concerns the relative productivity of entrants and incumbents in a market, an issue with
implications for alternative theories of growth: higher entrant productivity is consistent with
vintage capital and “leapfrogging” (again an inter-species analogy!) models (Kaldor and Mirrlees
1961, Aghion and Howitt 1992), while lower initial productivity is consistent with models of
industry dynamics in which entrants experiment and selection and learning processes lead to
productivity growth with age. Empirical studies tend to find that initial productivity is lower
(e.g., Foster, Haltiwanger, and Krizan 2001; Disney, Haskel, and Heden 2003), but recent
research on quantity-based productivity measures suggests that it may be higher, at least in some
industries (Foster, Haltiwanger, and Syverson 2008). In the transition economies, where the old
versus new debate has been especially fierce, the firms inherited from central planning have
frequently been considered incapable of reforming and adapting (e.g., Murrell, 1992). In studies
of innovation, the contrast is between Schumpeter’s (1912) view of entrants as the source of new
ideas and creative destruction and Schumpeter (1942) that R&D for innovation requires the rents
of large organizations. Our analysis of the extent to which productivity leaders emerge at birth
or develop slowly into maturity and of the factors that condition this process may help to resolve
or refuel some of these long-standing debates.
2. Data and Methods
We draw upon comprehensive establishment-level data for U.S. manufacturing over five
decades. The data come from 10 Census of Manufactures or CMs ( in 1963, 1967, and every
five years through 2007). Single-establishment firms with fewer than five employees are
excluded from the Census and therefore from the analysis, as their output and capital stock are
imputed. For establishments not observed in the 1963, 1967, or 1972 CMs, we draw
establishment age from the annual Longitudinal Business Database (LBD), which contains birth
year for all establishments born in 1976 or later (Jarmin and Miranda, 2002). Although we
mostly treat age nonparametrically, for some purposes we make the following assignments:
establishments appearing in the 1963 Census of Manufactures are assigned age 44 in 2007; those
appearing for the first time in the 1967 Census of Manufactures are given age 40; those first
appearing in the 1972 Census of Manufactures are assigned age 35; and those not appearing in
the 1963, 1967, or 1972 CMs and not containing a birth year in the LBD (ones born before 1976)
are assigned age 32.
We use four-digit industries according to the 1987 SIC classification. The 2002 and 2007
CMs contain NAICS codes rather than SIC codes, and a crosswalk was used to convert the

4
NAICS codes to SIC codes.2 We then calculate each establishment’s modal SIC code across all
the CMs in which it appears.3
Multifactor productivity is calculated as the residual from a Cobb-Douglas production
function of gross output (total value of shipments plus net change in finished goods inventories
plus net change in work in progress) on employment hours, book value of plant and equipment,4
energy (electricity and fuel), and materials (not including energy). The function is estimated
separately for each four-digit SIC industry in each CM. Employment hours are calculated as
reported production worker hours plus the number of non-production workers multiplied by 2000
(i.e., assuming 40 hours per week for 50 weeks). Because this measure does not distinguish firm-
level quantity and price variation, which are unavailable in the data, it conflates technical
efficiency and firm-specific price variation, thus representing revenue productivity.5 For our
purposes, this is not necessarily a disadvantage if variation in firm-specific prices reflects quality
differences.
The productivity residuals are ranked within each industry-year. For most purposes, we
define 2007 productivity leaders as establishments in the top decile of the industry’s 2007
productivity distribution; in some analyses, we focus instead on the top quintile. For the
employment-weighted results, we select leaders starting from the top of the productivity
distribution and work our way down until the cumulative employment reaches (but does not
exceed) 10 percent (20 percent in case of quintiles) of the industry’s 2007 employment.
Defining Peit as the productivity of establishment e in industry i in year t and Pit as the
productivity of sector i in year t, we measure the magnitudes of nature and nurture by decomposing
the relative productivity of an enterprise within an industry, Peit - Pit, as the sum of the initial (in
the year of entry t-k, where k=age) productivity differential, Peit-k - Pit-k, and the growth in
relative productivity, (Peit - Peit-k) – (Pit - Pit-k ):
Peit - Pit = Peit-k - Pit-k + (Peit - Peit-k) – (Pit - Pit-k ).
In our current implementation, t = 2007, and Pit is defined as the median of the industry
productivity, in which case this equation implies that an establishment’s percentile ranking in the
2007 productivity distribution equals the sum of the percentile in its entry year and the growth in
the percentile from the entry year until 2007. We refer to the latter term in this sum as ”nurture”
in the empirical analysis that follows.
3. Results
We begin our study of the origins of high-productivity establishments by calculating
where they lie in the productivity distributions across CMs. For comparison purposes, we
calculate these numbers for non-leaders as well. Table 1 shows the average percentile rankings
among several leader and non-leader cohorts. Every leader cohort is slightly more productive
2 The 1997 CM contains both SIC and NAICS codes for each establishment. We assign each NAICS code an SIC
code based on the largest share of employment of the NAICS code that has the particular SIC code. We intend to
investigate the sensitivity of results to assumptions about the industry correspondence in the future. 3 We have also calculated results using establishments’ contemporaneous industry codes, and the results are very
similar to those reported here. 4 The 1963 and 1967 CMs do not contain book value of assets. For those years we use total capital expenditures as a
proxy. To explore the sensitivity of the results to the capital stock measure, we compared productivity in 1972 when
calculated using book value of assets and when using capital expenditures, and the productivity rank correlation is
87 percent. 5 See Eslava, Haltiwanger, Kugler, and Kugler (2004) and Foster, Haltiwanger, and Syverson (2008) for analyses of
firm-specific revenue and physical productivity.

5
than the corresponding non-leader cohort in the early years.6 Their productivity ranking increases
by 25-30 percentage points in the year in which they are all leaders, then it falls back to where it
was previously. On average, their rankings rose 25-30 percentage points between 2002 and 2007
alone, suggesting a substantial gain just prior to 2007. The average rankings for future leaders
start from a lower level and rise more smoothly when weighted by their employment in the year
when all are leaders. Non-leaders’ productivity dips slightly in the year when all are non-leaders,
then rises afterwards. The results suggest that productivity leadership is fleeting for many of the
leaders.
Tables 2a-2d break out the productivity rank distributions of 2007 productivity leaders
and non-leaders in earlier years. Tables 2a and 2c account for all the leaders in each year,
including those not yet born or missing, while Tables 2b and 2d focus on those for which
productivity can be estimated. As shown in Table 2a, nearly 14 percent of 2007 leaders are less
than five years old in 2007, while close to 15 percent of 2007 non-leaders are under five. Nature
largely explains the success of these young leaders. A similarly-sized fraction has operated since
1963 or earlier, with the share for 2007 leaders being slightly lower than that of non-leaders. The
last row in each block of Table 2a shows that it is not possible to calculate earlier productivity
for many of the 2007 leaders and non-leaders, although they operated before. The missing
observations are due to multiple factors, including non-inclusions of single-establishment firms
with fewer than five employees, nonresponse, and missing values for particular variables.
Among those leaders that have been operating for more than five years, productivity
tends to be persistently near the top of the distribution. Five and a half times as many 2007
leaders are in the top decile of the 2002 productivity distribution as in the bottom decile, for
example. The distribution is flatter further back in time, though (the ratio of establishments in the
top to bottom decile in 1963 is three). A substantial fraction of 2007 leaders climbed several
deciles in rank over time, implying a substantial role for nurture. The non-leader distribution
changes little over time, other than a slight decline in the top deciles in 2002.
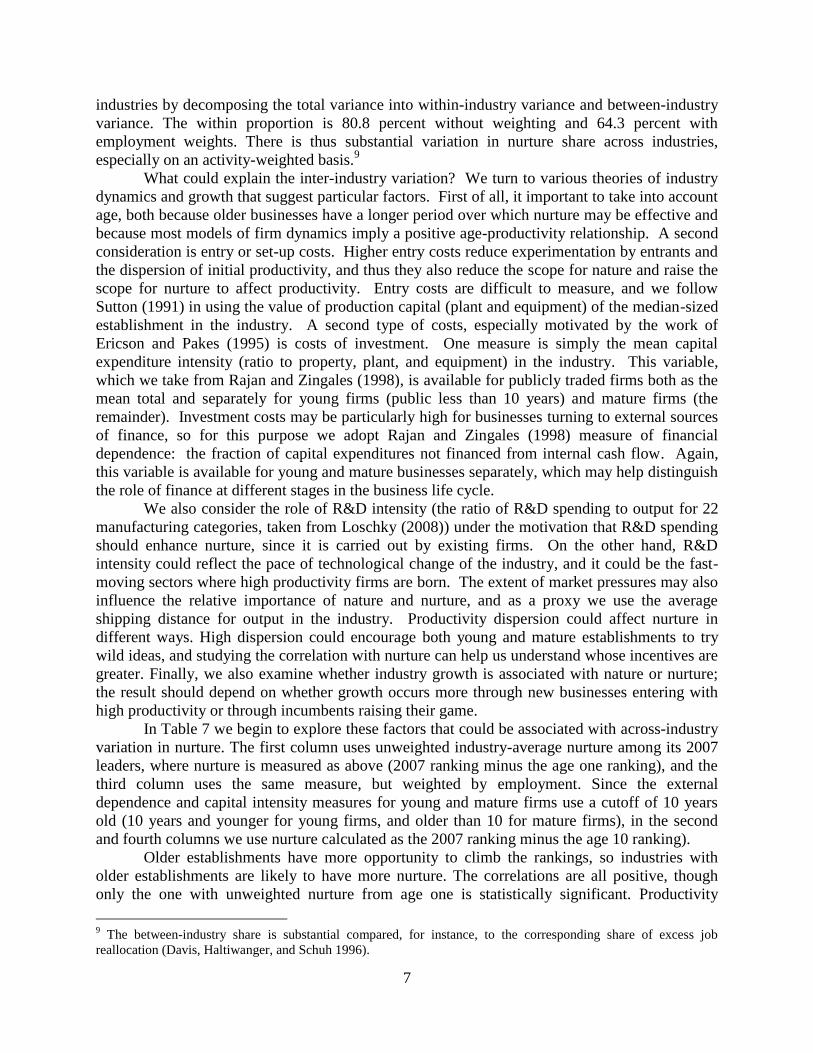
Results weighted by 2007 employment (see Tables 2c and 2d) exhibit much greater
productivity persistence by the 2007 leaders. The share of 2007 leaders in the top decile in earlier
years is roughly twice as high as it is in the unweighted results. And the gap between the top
decile and the ninth decile is much larger. The percentage not yet born in 2002 is about half that
in the unweighted results for both leaders and non-leaders. The smaller establishments are
younger and less likely to report when they do operate, and the smaller leaders have more
volatile productivity.
Tables 3a-3b show the distribution of age-one establishments’ productivity within the
overall productivity distribution. Slightly higher shares are found in the lower deciles, consistent
with previous studies’ (e.g., Foster, et al. 2001 and Disney, et al. 2003) findings that entrants are
somewhat less productive on average, but the distribution is remarkably uniform across deciles.
There is a general tendency for entrants to concentrate more in the top decile than other deciles
in the upper part of the distribution. Figures 1 and 2 compare the 2007 productivity rank
distribution for age one establishments to that of older establishments. A much higher share of
age-one establishments are in the lower half of the productivity distribution, especially in the two
lowest deciles when unweighted and in the third decile when weighted. The gap between the
incumbent and age-one share is smaller in the top decile than it is in other deciles in the upper
6 Non-leader productivity is often slightly higher than the median. Note that these numbers are conditioned on the
establishment having a productivity ranking in the cohort’s leadership or non-leadership year, so these
establishments are survivors. Non-survivors have lower average productivity.

6
part of the distribution without weighting. When weighting by employment, the age-one peak in
the upper part of the distribution is around the 75th
percentile.
Comparing age-one establishments that become leaders in 2007 to other age-one
establishments (see Tables 3c-3e), we find that significantly higher shares of future leaders start
in the top decile. Tables 3d and 3e show that though this tendency is strongest in cohorts closest
to 2007, it is still visible even in the earliest cohorts.
We next track the productivity progression of individual cohorts of 2007 leaders that we
can observe at age one in Tables 4a-4d.7 Establishments in the earlier cohorts begin life in the
middle of the productivity distribution on average and gradually climb the rankings. By far the
biggest improvement comes in the last five years before they are all leaders in 2007. When
weighting by employment, future leaders start with below average productivity and improve
their position more smoothly over time than without weighting, so larger 2007 leaders climbed
further. Since some establishments’ productivity is missing in some CMs, the patterns in Tables
4a-4b could be driven in part by changing samples. To check whether this matters, we have
redone the analysis only for establishments appearing in each CM since birth in Tables 4c-4d.
The results are very similar to the unbalanced panel results, suggesting that the patterns are not
due to changing samples.
Tables 5a-5c compare the productivity rankings of 2007 leaders to those of non-leaders
belonging to the same entrant cohorts. Future leaders start only slightly more productive than
non-leaders on average. The gap between leaders and non-leaders widens slowly at first, then
jumps between 2002-2007. These patterns are similar with and without weighting and
conditioning on survival of non-leaders.
If attainment of productivity leadership is primarily through young establishments
leapfrogging incumbents, then leaders should be younger than non-leaders. In contrast,
leadership obtained by incumbent investment could result in older leaders. In order to shed light
on this, we document the age distribution of 2007 leaders and non-leaders Table 6 and Figures 3
and 4. The difference in average establishment age is very small, with non-leaders being slightly
older on average. Higher shares of non-leaders are very young or very old. Some leapfrogging is
occurring (some leaders are very young), but it does not appear to be the dominant process for
becoming a productivity leader.
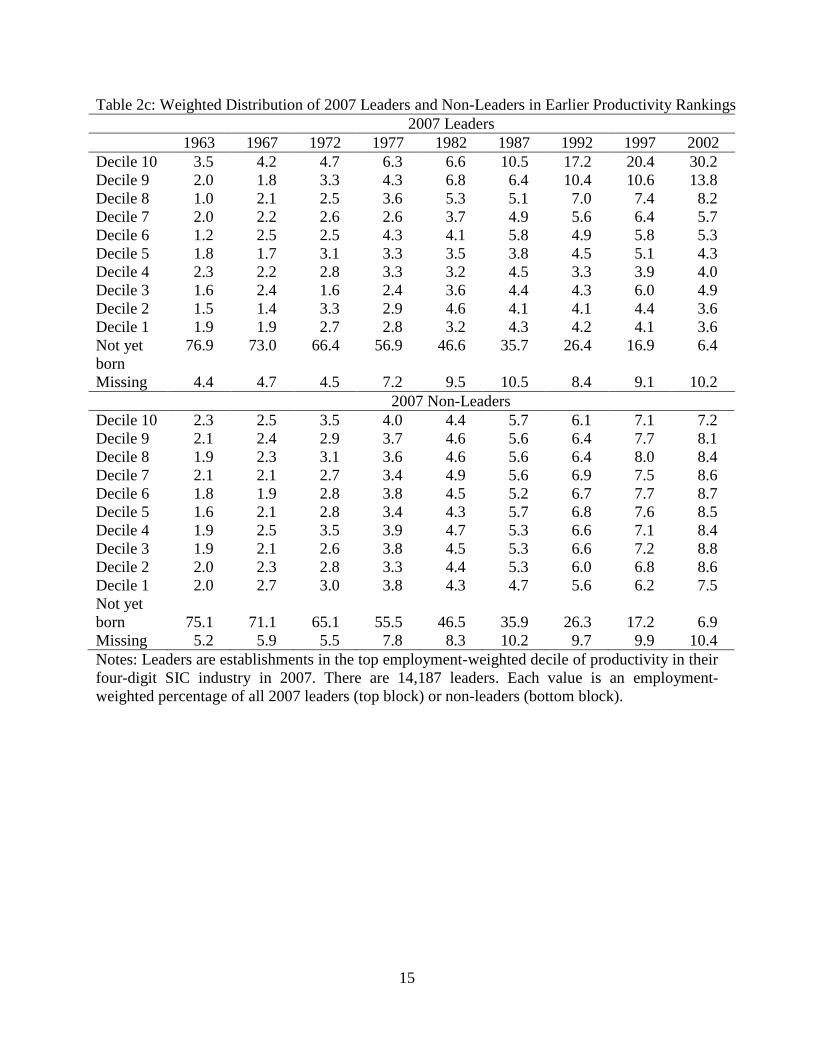
As described in the previous section, we measure the extent to which an establishment
becomes a leader via nurture by calculating the difference between its 2007 productivity
percentile rank and its rank at age one, among those for which we can observe both their 2007
and age one ranks (i.e., those born in 1976, 1981, 1986, 1991, 1996, 2001, and 2006). We call
this variable “nurture.”8 Table 6 shows the mean values for nurture for 2007 leaders and non-
leaders. Leaders climbed 26 percentage points on average on an unweighted basis, and over 35
percentage points when weighting by employment, again reflecting a bigger advance for larger
2007 leader establishments. Figures 5 and 6 display distributions with a significant mass point at
zero (all nature) and a fat tail of establishments with much nurture.
The nurture distributions suggest that the mix of nature and nurture is quite
heterogeneous across establishments. To what extent does this reflect variation between as
opposed to within industries? We investigate the extent to which the mix is systematic within
7 We choose age one rather than the birth year, because the establishment may have operated in only part of the birth
year, resulting in noisy productivity measurement. 8 Note that nurture can be a negative value even for 2007 leaders, as they could start in the top decile at age one and
fall in the rankings in 2007, but still remain in the top decile.
7
industries by decomposing the total variance into within-industry variance and between-industry
variance. The within proportion is 80.8 percent without weighting and 64.3 percent with
employment weights. There is thus substantial variation in nurture share across industries,
especially on an activity-weighted basis.9
What could explain the inter-industry variation? We turn to various theories of industry
dynamics and growth that suggest particular factors. First of all, it important to take into account
age, both because older businesses have a longer period over which nurture may be effective and
because most models of firm dynamics imply a positive age-productivity relationship. A second
consideration is entry or set-up costs. Higher entry costs reduce experimentation by entrants and
the dispersion of initial productivity, and thus they also reduce the scope for nature and raise the
scope for nurture to affect productivity. Entry costs are difficult to measure, and we follow
Sutton (1991) in using the value of production capital (plant and equipment) of the median-sized
establishment in the industry. A second type of costs, especially motivated by the work of
Ericson and Pakes (1995) is costs of investment. One measure is simply the mean capital
expenditure intensity (ratio to property, plant, and equipment) in the industry. This variable,
which we take from Rajan and Zingales (1998), is available for publicly traded firms both as the
mean total and separately for young firms (public less than 10 years) and mature firms (the
remainder). Investment costs may be particularly high for businesses turning to external sources
of finance, so for this purpose we adopt Rajan and Zingales (1998) measure of financial
dependence: the fraction of capital expenditures not financed from internal cash flow. Again,
this variable is available for young and mature businesses separately, which may help distinguish
the role of finance at different stages in the business life cycle.
We also consider the role of R&D intensity (the ratio of R&D spending to output for 22
manufacturing categories, taken from Loschky (2008)) under the motivation that R&D spending
should enhance nurture, since it is carried out by existing firms. On the other hand, R&D
intensity could reflect the pace of technological change of the industry, and it could be the fast-
moving sectors where high productivity firms are born. The extent of market pressures may also
influence the relative importance of nature and nurture, and as a proxy we use the average
shipping distance for output in the industry. Productivity dispersion could affect nurture in
different ways. High dispersion could encourage both young and mature establishments to try
wild ideas, and studying the correlation with nurture can help us understand whose incentives are
greater. Finally, we also examine whether industry growth is associated with nature or nurture;
the result should depend on whether growth occurs more through new businesses entering with
high productivity or through incumbents raising their game.
In Table 7 we begin to explore these factors that could be associated with across-industry
variation in nurture. The first column uses unweighted industry-average nurture among its 2007
leaders, where nurture is measured as above (2007 ranking minus the age one ranking), and the
third column uses the same measure, but weighted by employment. Since the external
dependence and capital intensity measures for young and mature firms use a cutoff of 10 years
old (10 years and younger for young firms, and older than 10 for mature firms), in the second
and fourth columns we use nurture calculated as the 2007 ranking minus the age 10 ranking).
Older establishments have more opportunity to climb the rankings, so industries with
older establishments are likely to have more nurture. The correlations are all positive, though
only the one with unweighted nurture from age one is statistically significant. Productivity
9 The between-industry share is substantial compared, for instance, to the corresponding share of excess job
reallocation (Davis, Haltiwanger, and Schuh 1996).

8
dispersion is negatively correlated with nurture (especially when nurture is measured from age
ten), consistent with greater experimentation in the early years of life. The correlation with R&D
intensity is positive, and it is significant when nurture is calculated from age one. This is
consistent with high-tech industry leadership resulting more from incumbent investment than
new entrants introducing a technology. Dependence on external financing is not significantly
correlated with nurture. Capital expenditure intensity is positively and significantly (at 10
percent) correlated with nurture when nurture is measured from age one. That is consistent with
incumbent establishments climbing the rankings via investment in capital expenditure-intensive
industries. Industry growth is negatively correlated with nurture (significant at 10 percent when
weighted and nurture is measured from age one). Growth industries are likely to have more new
entrants, and such establishments have less time to climb the rankings. Shipping distance is a
proxy for market size, and larger markets can potentially have more competition. This measure is
uncorrelated with nurture. The plant and equipment of the median establishment (a proxy for set-
up costs suggested by Sutton (1991)) is also uncorrelated with nurture.
Table 8 uses the same industry factors in exploratory OLS regressions at the
establishment level for 2007 leaders, clustering standard errors by four-digit SIC industry. A full
set of controls for establishment age are included. Once controlling for establishment age,
productivity dispersion, set-up costs, capital expenditures, and the size of the market are still
negatively associated with nurture in some specifications, while R&D intensity is positively
associated with nurture when measured from age one. We also include an indicator for whether
the establishment is part of a multi-establishment firm from age one (age zero when using
nurture measured from age ten). When measuring nurture from age one, this indicator is
negatively and significantly associated with nurture, so multi-establishment firms may be
transferring the technology and organizational capital that made them successful to their new
establishments.
4. Conclusion
This paper documents our initial results on the roles of nature and nurture in leading to
high productivity performance in U.S. manufacturing establishments. We find some evidence
for nature, in that a significant share of leaders exhibits high performance from birth. The other
leaders start little better than other establishments and rise in the rankings over time. The bulk of
the performance increase occurs in the five years before they become leaders. Puzzlingly, these
establishments lose their leadership nearly as quickly as they gain it.
Given that industry leaders emerge at least partially through later development, there are
a number of issues that bear further examination, and which we have only begun some
preliminary analysis. For example, an important question is at which stage of the life-cycle the
productivity spurt occurs: is it in early life, middle ages, or later? Does it precede or follow
growth in size? What is the role of finance in promoting extraordinary productivity growth to
move firms to the frontier and the sustained productivity growth that keeps them there? These
questions are almost entirely new, but we hope to be able to report progress on them using the
data and approach we have outlined here.
Related questions we would like to address involve the common characteristics (if any)
associated with entrants who become future star performers. One set relates to birth year and
possible cohort effects: for instance, like people, do firms do relatively well when they appear in
small cohorts? Do firms born in adverse times (recessions) do better than those born in good
years, or the opposite? Like people, are firms relatively set in their abilities after early

9
childhood? This would be consistent with common discussions of “organizational inertia” in
transition and non-transition economies alike (e.g., Murrell, 1992), but there is little beyond
anecdotal evidence. Does the availability of finance for new and young firms play a role similar
to those of parents and schooling for young children? Of course, the demographic analogy is not
exact, as the decision to experiment by setting up a firm is different from decisions on children,
but it is a useful way to organize research into the factors underlying high performance among
firms.
Finally, we may hypothesize that the policy and business environment affects the relative
importance of nature and nurture. Nature may be relatively more important under high costs of
entry and investment that discourage experimentation, while nurture is more important when
these costs are low. To study this, we may carry out a cross-country analysis of transition
economies where we use proxies for these costs (such as EBRD transition indicators) in a
regression framework (and possibly with the U.S. industrial pattern as the baseline). This
analysis will provide another perspective on how policies can affect the patterns and
performance of firms at different stages of their life cycles, thus isolating the key periods and
sources of economic growth.

10
References
Acs, Zoltan J., and Pamela Mueller. 2008. “Employment Effects of Business Dynamics: Mice,
Gazelles and Elephants.” Small Business Economics, Vol. 30(1), 85-100.
Aghion, Philippe, and Peter Howitt. 1992. “A Model of Growth Through Creative Destruction.”
Econometrica, Vol. 60(2), 323-351, March.
Bartelsman, Eric, Jonathan, Haskel, and Ralf Martin. 2008. “Distance to Which Frontier?
Evidence on Productivity Convergence from International Firm-Level Data.” CEPR Discussion
Paper 7032.
Birch, David L., and James Medoff. 1994. “Gazelles,” in Lewis C. Solmon and Alec R.
Levenson, (eds.), Labor Markets, Employment Policy and Job Creation, 159-168. Boulder:
Westview Press.
Davis, Steven, John Haltiwanger, and Scott Schuh. 1996. Job Creation and Destruction.
Cambridge, Mass: The MIT Press.
Disney, Richard, Jonathan Haskel, and Ylva Heden. 2003. “Restructuring and Productivity
Growth in UK Manufacturing.” Economic Journal, Vol. 113, 666-694, July.
Ericson, Richard, and Ariel Pakes. 1995. “Markov-Perfect Industry Dynamics: A Framework for
Empirical Work.” Review of Economic Studies, Vol. 62, 53-82.
Eslava, Marcela, John Haltiwanger, Adriana Kugler, and Maurice Kugler. 2004. “The Effects of
Structural Reforms on Productivity and Profitability Enhancing Reallocation: Evidence from
Colombia.” Journal of Development Economics, Vol. 75(2), 333-371.
Foster, Lucia, John Haltiwanger, and C.J. Krizan. 2001. “Aggregate Productivity Growth:
Lessons from Microeconomic Evidence,” in E. Dean, M. Harper, and C. Hulten (eds.), New
Developments in Productivity Analysis, 303-372. Chicago: University of Chicago Press.
Foster, Lucia, John Haltiwanger, and Chad Syverson. 2008. “Reallocation, Firm Turnover, and
Efficiency: Selection on Productivity or Profitability?” American Economic Review, Vol. 98(1),
394-425, March.
Gladwell, Malcolm. 2008. Outliers: The Story of Success. New York: Little, Brown, and
Company.
Hopenhayn, Hugo. 1992. “Entry, Exit, and Firm Dynamics in Long Run Equilibrium.”
Econometrica, Vol. 60(5), 1127-1150, September.
Jarmin, Ron S., and Javier Miranda. 2002. The Longitudinal Business Database. CES Working
Paper 02-17.

11
Jovanovic, Boyan. “Selection and the Evolution of Industry.” 1982. Econometrica, Vol. 50(3),
649-670, May.
Kaldor, Nicholas, and James A. Mirrlees. 1961. “A New Model of Economic Growth.” Review
of Economic Studies, Vol. 29, 174-190.
Loschky, Alexander. 2010. “Reviewing the Nomenclature for High-Technology Trade – The
Sectoral Approach,” OECD STD/SES/WPTGS(2008)9, September 12, 2008. Accessed at
http://www.oecd.org/officialdocuments/publicdisplaydocumentpdf/?cote=STD/SES/WPTGS(20
08)9&docLanguage=En on December 6, 2010.
Murrell, Peter. 1992. “Evolution in Economics and in the Economic Reform of the Centrally
Planned Economies,” in Christopher C. Clague and Gordon Rausser (eds.), Emerging Market
Economies in Eastern Europe. Cambridge: Basil Blackwell.
Rajan, Raghuram G., and Luigi Zingales. 1998. “Financial Dependence and Growth,” The
American Economic Review, Vol. 88(3), 559-586, June.
Schumpeter, Joseph. 1912. The Theory of Economic Development, Leipzig: Duncker and
Humbolt. Translated by R. Opie. Cambridge: Harvard University Press, 1934.
Schumpeter, Joseph. 1942. Capitalism, Socialism and Democracy, New York: Harper and
Brothers.
Seagoe, May. 1975. Terman and the Gifted. Los Altos: Kauffman.
Sutton, John. 1991. Sunk Costs and Market Structure: Price Competition, Advertising, and the
Evolution of Concentration, The MIT Press, Cambridge, MA.
Syverson, Chad. 2010. “What Determines Productivity?” Journal of Economic Literature,
forthcoming.
U.S. Census Bureau and U.S. Department of Transportation. 2010. 2007 Economic Census,
Transportation, 2007 Commodity Flow Survey, April.

12
Table 1: Average Productivity Rankings of Leader Cohorts Across Time
1963 1967 1972 1977 1982 1987 1992 1997 2002 2007
1992 Leaders Unweighted 61.8 60.8 60.1 60.1 61.5 64.1 95.1 66.0 61.0 59.2
Employment-
Weighted
59.5 58.9 62.2 65.5 64.8 71.6 95.6 70.2 63.1 61.4
1992 Non-
Leaders
Unweighted 54.6 52.5 52.3 52.0 51.8 51.3 44.7 50.5 49.8 49.8
Employment-
Weighted
50.4 50.6 51.1 50.8 49.8 49.8 45.4 47.9 47.5 47.4
1997 Leaders Unweighted 59.5 59.9 59.3 59.4 60.6 61.6 65.5 95.1 63.6 61.0
Employment-
Weighted
57.1 58.4 61.1 62.4 61.7 66.4 71.2 95.4 66.0 62.2
1997 Non-
Leaders
Unweighted 54.8 52.4 52.6 52.1 51.9 52.0 50.6 45.1 49.5 49.7
Employment-
Weighted
50.9 49.7 50.4 50.6 49.6 50.4 49.6 45.4 47.4 47.3
2002 Leaders Unweighted 58.9 59.6 58.0 58.4 58.4 60.2 62.0 64.4 95.1 65.4
Employment-
Weighted
55.2 56.5 55.8 58.9 56.1 61.2 65.5 68.4 95.4 69.7
2002 Non-
Leaders
Unweighted 54.6 52.6 53.0 52.6 52.7 53.0 52.1 52.2 45.1 49.6
Employment-
Weighted
50.8 49.5 51.0 50.7 50.2 50.9 50.6 50.5 45.5 47.7
2007 Leaders Unweighted 58.5 59.2 57.5 57.6 58.2 58.9 60.0 62.3 65.6 95.1
Employment-
Weighted
53.6 55.4 54.1 56.6 56.4 57.7 64.5 64.0 70.2 95.4
2007 Non-
Leaders
Unweighted 54.7 52.5 53.0 52.7 52.9 53.4 52.8 53.4 51.2 44.7
Employment-
Weighted
51.0 49.6 51.3 50.9 50.5 51.5 51.1 51.6 50.0 44.9
Notes: Leaders are establishments in the top decile of productivity in their four-digit SIC industry in the year indicated
in the first column. The employment used in the weighting is from the year indicated in the first column.

13
Table 2a: Unweighted Distribution of 2007 Leaders and Non-Leaders
in Earlier Productivity Rankings
2007 Leaders
1963 1967 1972 1977 1982 1987 1992 1997 2002
Decile 10 1.0 1.3 1.7 2.7 3.9 5.5 8.2 10.8 17.7
Decile 9 0.9 1.2 1.7 2.1 3.2 4.2 5.3 8.0 10.2
Decile 8 0.8 0.9 1.5 2.0 2.8 3.5 4.5 5.9 6.9
Decile 7 0.7 0.8 1.2 1.8 2.4 3.0 3.8 4.9 5.8
Decile 6 0.7 0.7 1.1 1.5 2.1 2.8 3.2 4.5 5.1
Decile 5 0.6 0.7 1.1 1.2 1.7 2.4 3.2 3.8 4.6
Decile 4 0.5 0.6 1.0 1.2 1.7 2.3 2.9 3.6 4.2
Decile 3 0.4 0.5 0.9 1.3 1.5 2.1 2.9 3.2 3.8
Decile 2 0.5 0.6 0.9 1.3 1.8 2.3 2.8 3.0 3.4
Decile 1 0.3 0.5 0.8 1.3 1.9 2.2 2.7 3.0 3.2
Not yet
born
87.2 84.8 80.8 72.8 65.0 54.6 43.3 30.1 13.7
Missing 6.4 7.5 7.4 10.6 12.1 15.1 17.3 19.1 22.6
2007 Non-Leaders
Decile 10 0.8 0.9 1.4 1.9 2.7 3.4 4.1 5.2 5.7
Decile 9 0.9 1.0 1.5 2.1 3.0 3.7 4.7 6.0 6.6
Decile 8 0.9 1.0 1.6 2.1 2.9 3.7 4.8 6.1 7.0
Decile 7 0.9 1.0 1.5 2.0 2.8 3.7 4.7 6.0 7.0
Decile 6 0.8 0.9 1.4 1.9 2.6 3.5 4.4 5.7 6.9
Decile 5 0.8 0.9 1.4 1.8 2.4 3.3 4.3 5.4 6.6
Decile 4 0.6 0.9 1.2 1.7 2.2 3.0 4.0 5.0 6.4
Decile 3 0.6 0.8 1.2 1.6 2.1 2.7 3.7 4.5 6.1
Decile 2 0.6 0.8 1.1 1.6 2.2 2.7 3.5 4.1 6.0
Decile 1 0.5 0.7 1.1 1.5 2.3 2.6 3.3 4.1 5.3
Not yet
born
85.8 83.0 78.4 70.3 62.3 52.1 41.2 29.1 14.5
Missing 6.9 8.0 8.2 11.3 12.5 15.6 17.3 18.8 21.9
Notes: Leaders are establishments in the top decile of productivity in their four-digit SIC industry in
2007. There are 18,232 leaders. Each value is a percentage of all 2007 leaders in the first block and
non-leaders in the second block.

14
Table 2b: Unweighted Distribution of 2007 Leaders and Non-Leaders in Earlier Productivity
Rankings, Without Missings and Not Yet Born
2007 Leaders
1963 1967 1972 1977 1982 1987 1992 1997 2002
Decile 10 15.7 16.8 14.4 16.5 17.0 18.2 21.1 21.3 27.3
Decile 9 13.6 14.9 14.3 12.9 14.1 13.9 13.7 15.8 15.7
Decile 8 12.0 12.0 12.9 12.1 12.1 11.4 11.5 11.6 10.6
Decile 7 10.3 10.3 10.2 11.1 10.6 9.9 9.8 9.6 8.9
Decile 6 10.5 9.4 8.9 9.2 8.9 9.3 8.3 8.9 7.9
Decile 5 9.8 8.4 9.3 7.5 7.4 8.1 8.3 7.5 7.1
Decile 4 8.4 8.1 8.3 7.2 7.3 7.5 7.6 7.0 6.5
Decile 3 7.0 6.7 7.3 7.7 6.6 7.0 7.5 6.3 5.9
Decile 2 7.4 7.4 7.4 8.0 7.7 7.5 7.2 5.9 5.2
Decile 1 5.2 5.9 7.1 7.7 8.2 7.2 5.2 6.0 4.9
2007 Non-Leaders
Decile 10 10.8 10.2 10.1 10.2 10.5 10.6 10.0 10.1 8.9
Decile 9 11.8 10.8 11.3 11.4 11.7 11.4 11.3 11.6 10.4
Decile 8 11.7 11.1 11.8 11.5 11.4 11.5 11.5 11.7 11.0
Decile 7 11.9 11.3 11.5 11.1 11.1 11.3 11.3 11.4 11.1
Decile 6 11.3 10.6 10.5 10.5 10.4 10.9 10.7 10.9 10.8
Decile 5 10.7 10.5 10.2 9.8 9.7 10.1 10.3 10.3 10.4
Decile 4 8.8 9.6 9.1 9.5 8.9 9.3 9.7 9.6 10.0
Decile 3 8.5 9.2 8.6 8.9 8.5 8.5 8.9 8.7 9.6
Decile 2 7.8 8.9 8.5 8.8 8.7 8.4 8.5 7.9 9.4
Decile 1 6.6 7.8 8.3 8.4 9.1 7.9 7.9 7.9 8.4
Notes: Leaders are establishments in the top decile of productivity in their four-digit SIC industry in
2007. Each value is a percentage among 2007 leaders (top block) or non-leaders (bottom block) that
have a productivity ranking in the respective year (existing and non-missing).
15
Table 2c: Weighted Distribution of 2007 Leaders and Non-Leaders in Earlier Productivity Rankings
2007 Leaders
1963 1967 1972 1977 1982 1987 1992 1997 2002
Decile 10 3.5 4.2 4.7 6.3 6.6 10.5 17.2 20.4 30.2
Decile 9 2.0 1.8 3.3 4.3 6.8 6.4 10.4 10.6 13.8
Decile 8 1.0 2.1 2.5 3.6 5.3 5.1 7.0 7.4 8.2
Decile 7 2.0 2.2 2.6 2.6 3.7 4.9 5.6 6.4 5.7
Decile 6 1.2 2.5 2.5 4.3 4.1 5.8 4.9 5.8 5.3
Decile 5 1.8 1.7 3.1 3.3 3.5 3.8 4.5 5.1 4.3
Decile 4 2.3 2.2 2.8 3.3 3.2 4.5 3.3 3.9 4.0
Decile 3 1.6 2.4 1.6 2.4 3.6 4.4 4.3 6.0 4.9
Decile 2 1.5 1.4 3.3 2.9 4.6 4.1 4.1 4.4 3.6
Decile 1 1.9 1.9 2.7 2.8 3.2 4.3 4.2 4.1 3.6
Not yet
born
76.9 73.0 66.4 56.9 46.6 35.7 26.4 16.9 6.4
Missing 4.4 4.7 4.5 7.2 9.5 10.5 8.4 9.1 10.2
2007 Non-Leaders
Decile 10 2.3 2.5 3.5 4.0 4.4 5.7 6.1 7.1 7.2
Decile 9 2.1 2.4 2.9 3.7 4.6 5.6 6.4 7.7 8.1
Decile 8 1.9 2.3 3.1 3.6 4.6 5.6 6.4 8.0 8.4
Decile 7 2.1 2.1 2.7 3.4 4.9 5.6 6.9 7.5 8.6
Decile 6 1.8 1.9 2.8 3.8 4.5 5.2 6.7 7.7 8.7
Decile 5 1.6 2.1 2.8 3.4 4.3 5.7 6.8 7.6 8.5
Decile 4 1.9 2.5 3.5 3.9 4.7 5.3 6.6 7.1 8.4
Decile 3 1.9 2.1 2.6 3.8 4.5 5.3 6.6 7.2 8.8
Decile 2 2.0 2.3 2.8 3.3 4.4 5.3 6.0 6.8 8.6
Decile 1 2.0 2.7 3.0 3.8 4.3 4.7 5.6 6.2 7.5
Not yet
born 75.1 71.1 65.1 55.5 46.5 35.9 26.3 17.2 6.9
Missing 5.2 5.9 5.5 7.8 8.3 10.2 9.7 9.9 10.4
Notes: Leaders are establishments in the top employment-weighted decile of productivity in their
four-digit SIC industry in 2007. There are 14,187 leaders. Each value is an employment-
weighted percentage of all 2007 leaders (top block) or non-leaders (bottom block).

16
Table 2d: Weighted Distribution of 2007 Leaders in Earlier Productivity Rankings, Without
Missings and Not Yet Born
2007 Leaders
1963 1967 1972 1977 1982 1987 1992 1997 2002
Decile 10 18.6 18.8 16.1 17.7 14.8 19.7 26.3 27.6 36.1
Decile 9 10.4 8.1 11.5 12.1 15.2 11.8 16.0 14.3 16.5
Decile 8 5.3 9.2 8.6 10.1 11.8 9.5 10.6 9.9 9.8
Decile 7 10.7 9.8 8.9 7.3 8.3 9.2 8.6 8.6 6.8
Decile 6 6.6 11.0 8.6 12.0 9.2 10.8 7.5 7.9 6.3
Decile 5 9.5 7.6 10.5 9.0 7.8 7.1 6.8 6.8 5.2
Decile 4 12.3 9.9 9.7 9.2 7.1 8.3 5.0 5.2 4.8
Decile 3 8.3 10.6 5.6 6.8 8.3 8.1 6.5 8.1 5.9
Decile 2 7.9 6.3 11.2 8.2 10.4 7.6 6.2 5.9 4.4
Decile 1 10.4 8.7 9.2 7.7 7.1 8.0 6.4 5.6 4.3
2007 Non-Leaders
Decile 10 11.7 10.8 11.8 10.8 9.8 10.5 9.5 9.7 8.8
Decile 9 10.6 10.4 9.7 10.1 10.2 10.3 9.9 10.5 9.8
Decile 8 9.6 10.0 10.7 9.9 10.1 10.4 10.0 11.0 10.2
Decile 7 10.5 9.1 9.1 9.4 10.9 10.3 10.7 10.2 10.4
Decile 6 9.4 8.4 9.6 10.4 10.0 9.7 10.5 10.5 10.5
Decile 5 8.3 9.2 9.4 9.2 9.5 10.5 10.6 10.4 10.3
Decile 4 9.7 10.9 11.7 10.6 10.4 9.9 10.3 9.8 10.2
Decile 3 9.9 9.3 8.7 10.3 10.0 9.7 10.3 9.9 10.6
Decile 2 10.3 10.2 9.3 9.1 9.7 9.8 9.4 9.4 10.4
Decile 1 10.1 11.8 10.1 10.3 9.5 8.8 8.7 8.6 9.0
Notes: Leaders are establishments in the top employment-weighted decile of productivity in their
four-digit SIC industry in 2007. Each value is an employment-weighted percentage among 2007
leaders (top block) or non-leaders (bottom block) that have a productivity ranking in the
respective year (existing and non-missing).

17
Table 3a: Distribution of Establishment Productivity Ranks at Age One, By Cohort, Unweighted
1976 1981 1986 1991 1996 2001 2006
Decile 10 9.9 7.7 8.9 9.0 7.9 10.7 10.3
Decile 9 8.1 7.7 6.9 7.8 7.1 9.4 7.1
Decile 8 8.7 7.9 7.3 8.1 7.7 7.9 7.7
Decile 7 9.3 9.1 8.0 8.1 8.7 9.5 8.0
Decile 6 9.5 10.2 9.1 9.5 10.2 8.9 9.4
Decile 5 10.6 11.7 10.8 10.2 11.1 9.3 10.4
Decile 4 10.8 11.5 11.6 10.8 11.7 9.9 10.1
Decile 3 11.2 12.0 11.8 12.0 12.1 11.4 12.2
Decile 2 10.8 11.5 13.2 12.9 12.3 11.4 12.4
Decile 1 11.2 10.7 12.3 11.6 11.1 11.6 12.4
Notes: The years in the columns are the birth years for each cohort. These are percentages of all
entrant establishments in the year with a productivity ranking in the Census of Manufactures in the
following year.
Table 3b: Distribution of Establishment Productivity Ranks at Age One, By Cohort,
Employment-Weighted
1976 1981 1986 1991 1996 2001 2006
Decile 10 11.0 9.2 8.1 11.4 10.7 8.9 10.2
Decile 9 8.9 8.3 5.9 7.0 7.3 8.7 9.5
Decile 8 8.4 9.2 6.8 7.0 7.6 6.6 10.8
Decile 7 8.9 8.4 6.5 7.0 8.2 5.7 6.8
Decile 6 8.3 9.4 8.6 8.2 7.6 36.9 9.2
Decile 5 8.8 10.5 13.1 10.2 10.4 6.2 10.8
Decile 4 10.3 12.0 11.9 9.9 13.7 6.0 11.9
Decile 3 11.1 9.8 12.5 10.4 11.1 6.0 10.5
Decile 2 11.2 11.4 12.9 11.9 10.9 7.7 10.9
Decile 1 13.0 12.0 14.0 16.7 12.6 7.3 9.5
Notes: The years in the columns are the birth years for each cohort. These are employment-
weighted percentages of all entrant establishments in the year with an employment-weighted
productivity ranking in the Census of Manufactures in the following year. The weights are
employment in the CM at age one.

18
Table 3c: Distribution of Establishment Productivity Ranks at Age One, 2007 Leaders vs. Non-Leaders
Unweighted Employment-Weighted
2007 Leaders Non-Leaders, Not
Conditioning on
Survival to 2007
2007 Non-Leaders 2007 Leaders 2007 Non-Leaders
Decile 10 18.2 8.6 10.6 19.0 9.7
Decile 9 12.1 7.7 9.8 9.5 7.2
Decile 8 9.0 7.9 9.2 8.5 8.0
Decile 7 8.4 8.8 9.8 5.8 8.8
Decile 6 8.0 9.7 9.4 8.7 8.7
Decile 5 8.0 10.8 9.5 5.5 8.2
Decile 4 9.5 11.2 10.4 11.5 11.1
Decile 3 8.9 11.8 10.5 6.2 11.1
Decile 2 9.4 12.0 9.9 11.1 11.4
Decile 1 8.5 11.4 11.0 14.2 15.8
Notes: Leaders are establishments in the top decile of productivity in their four-digit SIC industry in 2007 that entered in 1976,
1981, 1986, 1991, 1996, or 2001 with a productivity ranking in the Census of Manufactures in the following year. Non-leaders are
other entering establishments in these years with a productivity ranking at age one (all of them in column 2, and only those with a
productivity ranking in 2007 in columns 3 and 5). The numbers are percentages of the establishments in each column. The weights
in the last two columns are 2007 employment.
Table 3d: Unweighted Distribution of Establishment Productivity Ranks at Age One, 2007 Leaders vs. Non-Leaders, By Cohort
1976 1981 1986 1991 1996 2001
L NL L NL L NL L NL L NL L NL
Quintile 5 23.7 17.9 22.1 15.4 20.9 15.7 33.8 16.4 29.6 14.6 40.4 19.0
Quintile 4 21.4 17.9 23.3 16.9 18.3 15.3 12.9 16.3 15.3 16.5 16.9 17.4
Quintile 3 18.3 20.2 12.2 22.1 15.7 20.0 19.9 19.7 13.9 21.5 16.6 18.3
Quintile 2 19.1 22.0 18.0 23.5 19.0 23.5 17.9 22.9 21.4 23.9 15.6 21.6
Quintile 1 17.6 22.0 24.4 22.2 26.1 25.5 15.4 24.8 19.7 23.5 10.5 23.7
Notes: Leaders (L) are establishments in the top decile of productivity in their four-digit SIC industry in 2007 that entered in 1976, 1981, 1986,
1991, 1996, and 2001 with a productivity ranking in the Census of Manufactures in the following year. Non-leaders (NL) are all other entering
establishments in these years with a productivity ranking at age one. The numbers are percentages of the establishments in each column.

19
Table 3e: Employment-Weighted Distribution of Establishment Productivity Ranks at Age One, 2007 Leaders vs. Non-Leaders, By Cohort
1976 1981 1986 1991 1996 2001
L NL L NL L NL L NL L NL L NL
Quintile 5 23.2 19.9 31.0 17.1 26.4 13.7 36.0 18.0 32.8 17.4 50.6 16.3
Quintile 4 16.3 17.4 26.9 17.4 14.1 13.3 10.4 14.2 12.9 15.9 17.0 12.1
Quintile 3 17.5 17.1 5.9 20.2 24.9 21.6 16.9 18.5 17.3 18.0 8.7 44.5
Quintile 2 19.9 21.5 17.0 21.9 13.3 24.5 15.6 20.5 15.2 25.1 13.3 11.9
Quintile 1 23.2 24.2 19.2 23.5 21.3 26.9 21.2 28.8 21.7 23.6 10.5 15.2
Notes: Leaders (L) are establishments in the top employment-weighted decile of productivity in their four-digit SIC industry in 2007 that
entered in 1976, 1981, 1986, 1991, 1996, and 2001 with a productivity ranking in the Census of Manufactures in the following year.
Non-leaders (NL) are all other entering establishments in these years with a productivity ranking at age one. The numbers are
percentages of the establishments in each column. The weights are employment in the CM at age one.

20
Table 4a: Following 2007 Leaders’ Productivity Rankings from Age 1, Unweighted
Cohort
Birth
Year
Age 1 Age 6 Age 11 Age 16 Age 21 Age 26 Age 31
1976 53.4 55.4 57.1 58.7 63.5 67.0 94.7
1981 50.7 54.4 60.6 61.9 68.6 94.9
1986 48.5 58.2 60.7 62.1 95.1
1991 56.1 64.3 65.7 95.0
1996 53.5 61.7 95.2
2001 62.7 95.1
2006 95.1
Notes: Leaders are establishments in the top decile of productivity in their four-digit SIC
industry in 2007. These are average rankings.
Table 4b: Following 2007 Leaders’ Productivity Rankings from Age 1, Employment-Weighted
Cohort
Birth
Year
Age 1 Age 6 Age 11 Age 16 Age 21 Age 26 Age 31
1976 45.3 49.1 54.7 67.7 75.4 80.5 95.4
1981 46.2 57.9 70.1 68.4 71.1 94.8
1986 40.8 62.5 63.7 67.9 94.9
1991 57.1 58.7 67.6 95.8
1996 55.6 64.7 95.6
2001 67.6 95.9
2006 95.6
Notes: Leaders are establishments in the top employment-weighted decile of productivity in their
four-digit SIC industry in 2007. These are average rankings, weighted by 2007 employment.

21
Table 4c: Following 2007 Leaders’ Productivity Ranks from Age 1, Unweighted Balanced Panel
Cohort
Birth
Year
Age 1 Age 6 Age 11 Age 16 Age 21 Age 26 Age 31
1976 53.8 56.9 59.9 60.1 70.2 71.6 94.3
1981 52.9 59.8 63.2 62.7 71.6 94.5
1986 48.7 60.7 65.0 67.7 94.9
1991 57.7 65.9 68.6 94.8
1996 55.9 63.5 95.1
2001 62.7 94.8
2006 95.1
Notes: Leaders are establishments in the top decile of productivity in their four-digit SIC
industry in 2007. These are average rankings. Only establishments present in each cell in the row
are included.
Table 4d: Following 2007 Leaders’ Productivity Ranks from Age 1, Employment-Weighted
Balanced Panel
Cohort
Birth
Year
Age 1 Age 6 Age 11 Age 16 Age 21 Age 26 Age 31
1976 48.0 47.2 54.0 54.4 69.8 78.7 95.5
1981 46.9 61.7 74.0 69.5 74.5 94.6
1986 40.0 63.4 65.9 71.2 94.8
1991 57.6 59.1 68.7 95.9
1996 56.7 64.3 95.1
2001 67.6 95.8
2006 95.6
Notes: Leaders are establishments in the top employment-weighted decile of productivity in their
four-digit SIC industry in 2007. These are average rankings, weighted by 2007 employment.
Only establishments present in each cell in the row are included.

22
Table 5a: Difference Between 2007 Leaders’ and 2007 Non-Leaders’ Productivity Rankings
from Age 1, Unweighted
Cohort
Birth
Year
Age 1 Age 6 Age 11 Age 16 Age 21 Age 26 Age 31
1976 5.8 5.1 6.4 8.4 13.1 17.7 49.6
1981 4.8 5.0 10.7 10.7 19.3 49.2
1986 4.1 9.3 9.8 12.8 49.8
1991 10.8 15.1 16.5 50.0
1996 8.7 13.2 50.0
2001 15.6 50.8
2006 55.0
Notes: Leaders are establishments in the top decile of productivity in their four-digit SIC
industry in 2007. Non-leaders are manufacturing establishments in the other deciles of the
productivity distribution in 2007. These are differences between the average rankings of leaders
and non-leaders. Some non-leaders exited before 2007.
Table 5b: Difference Between 2007 Leaders’ and 2007 Non-Leaders’ Productivity Rankings
from Age 1, Conditioning on Survival, Unweighted
Cohort
Birth
Year
Age 1 Age 6 Age 11 Age 16 Age 21 Age 26 Age 31
1976 6.5 2.7 3.0 5.9 9.7 15.9 49.6
1981 1.8 1.8 7.2 7.6 18.0 49.2
1986 0.1 5.5 6.7 11.0 49.8
1991 7.2 11.3 14.5 50.0
1996 3.0 9.8 50.0
2001 11.8 50.8
2006 55.0
Notes: Leaders are establishments in the top employment-weighted decile of productivity in their
four-digit SIC industry in 2007. Non-leaders are manufacturing establishments in the other
deciles of the productivity distribution in 2007. These are differences between the average
rankings of leaders and non-leaders. Only establishments that survive through 2007 are included.

23
Table 5c: Difference Between 2007 Leaders’ and 2007 Non-Leaders’ Productivity Rankings
from Age 1, Conditioning on Survival, Employment-Weighted
Cohort
Birth
Year
Age 1 Age 6 Age 11 Age 16 Age 21 Age 26 Age 31
1976 2.9 0.1 4.5 17.3 25.1 32.3 50.0
1981 2.3 6.9 18.2 16.5 19.8 46.5
1986 -0.2 14.1 14.7 19.8 50.5
1991 11.0 10.9 19.0 50.5
1996 7.7 14.1 52.3
2001 21.6 51.3
2006 52.1
Notes: Leaders are establishments in the top employment-weighted decile of productivity in their
four-digit SIC industry in 2007. Non-leaders are manufacturing establishments in the other
deciles of the productivity distribution in 2007. These are differences between the average
rankings of leaders and non-leaders. Only establishments that survive through 2007 are included.

24
Table 6: Means and Standard Deviations for Age and Nurture
Unweighted Employment-Weighted
2007 Leaders 2007 Non-
Leaders
2007 Leaders 2007 Non-
Leaders
Age 18.7 19.2 25.3 25.4
(12.9) (13.4) (13.7) (14.0)
Nurture 26.0 -2.1 35.5 1.0
(31.4) (29.7) (34.3) (34.4)
Notes: Standard deviations are in parentheses. Leaders are establishments in the top decile of
productivity (employment-weighted in the last two columns) in their four-digit SIC industry in
2007. Non-leaders are manufacturing establishments in the other deciles of the productivity
distribution in 2007. Nurture is the difference between an establishment’s 2007 productivity
ranking and its productivity ranking at age 1.

25
Table 7: Correlations with Industry Average Nurture
Unweighted,
Starting at Age 1
Unweighted,
Starting at
Age 10
Weighted,
Starting at Age 1
Weighted,
Starting at
Age 10
Average Age 0.147***
(0.009)
0.027
(0.646)
0.061
(0.302)
0.074
(0.224)
Productivity
Dispersion
-0.097*
(0.086)
-0.143***
(0.015)
-0.050
(0.392)
-0.162***
(0.007)
R&D Intensity 0.100*
(0.077)
0.011
(0.850)
0.132**
(0.024)
0.068
(0.265)
External
Dependence
0.061
(0.281)
-0.053
(0.368)
0.078
(0.185)
0.034
(0.580)
External
Dependence
Young - Mature
-0.019
(0.743)
0.081
(0.186)
Capital
Expenditure
Intensity
0.080*
(0.158)
-0.030
(0.616)
0.104*
(0.077)
-0.001
(0.992)
Capital
Expenditure
Intensity Young
– Mature
-0.095
(0.109)
-0.025
(0.678)
Log difference in
Industry
Employment
1997-2007
-0.082
(0.146)
-0.104*
(0.076)
Log Shipping
Distance
0.018
(0.749)
0.004
(0.948)
-0.003
(0.967)
-0.009
(0.884)
Log Median
Establishment
Plant and
Equipment
0.018
(0.754)
-0.065
(0.268)
-0.024
(0.682)
-0.044
(0.470)
Number of
Industries
314 289 292 272
Notes: These are correlations at the four-digit SIC level. P values are in parentheses. * = significant at 10 percent, ** = significant
at 5 percent, and *** = significant at 1 percent. Nurture is the difference between an establishment’s 2007 productivity ranking and
its productivity ranking at age 1 (columns 1 and 3) or age 10 (columns 2 and 4). Industry average nurture is the average of the
nurture variable among establishments in the top decile of their four-digit SIC industry productivity distribution. In columns 1 and
3, the included establishments in the industry nurture variables are those born in 1976, 1981, 1986, 1991, 1996, or 2001. The
included establishments in the industry nurture variables for columns 2 and 4 are those born in 1977, 1982, 1987, 1992, or 1997.
The weights are 2007 employment. Average age is employment-weighted in the last two columns. Productivity dispersion is the
standard deviation of four-digit SIC industry productivity in the 2007 Census of Manufactures. R&D intensity is direct R&D
expenditures divided by production output for 22 manufacturing categories, taken from Loschky (2008). External dependence and
capital expenditures are from Rajan and Zingales (1998), pp. 566-567. They are median values for 36 manufacturing categories
using Compustat data for U.S. companies in the 1980’s. Capital Expenditures are the ratio of capital expenditures to net property,
plant, and equipment. External dependence is the fraction of capital expenditures not financed with cash flows from operations.
Young companies are firms that have been public less than ten years, and mature ones have been public at least ten years. Shipping
distance is the average shipping distance for 21 manufacturing categories from the U.S. Census Bureau and U.S. Department of
Transportation’s 2007 Commodity Flows Survey. The log median establishment plant and equipment is the book value of plant
and equipment in 2007 for the median establishment by output in the four-digit SIC industry, using the 2007 Census of
Manufactures.

26
Table 8a: Unweighted Nurture Regressions, Starting at Age One
Age 6 32.778***
(1.929)
32.650***
(1.931)
32.683***
(1.947)
32.670***
(1.930)
32.924***
(1.959)
32.981***
(2.001)
32.559***
(1.966)
33.167***
(2.096)
Age 11 41.876***
(2.346)
41.755***
(2.286)
41.807***
(2.299)
41.807***
(2.337)
41.996***
(2.306)
41.890***
(2.314)
41.725***
(2.302)
41.958***
(2.347)
Age 16 39.470***
(2.078)
39.354***
(2.077)
39.472***
(2.069)
39.476***
(2.059)
39.860***
(2.138)
39.806***
(2.082)
39.292***
(2.072)
39.993***
(2.127)
Age 21 46.081***
(2.292)
45.925***
(2.364)
46.017***
(2.365)
45.981***
(2.334)
46.268***
(2.409)
46.247***
(2.319)
45.833***
(2.381)
46.445***
(2.390)
Age 26 44.038***
(2.756)
43.823***
(2.822)
43.977***
(2.825)
43.938***
(2.790)
44.140***
(2.848)
44.369***
(2.781)
43.721***
(2.839)
44.515***
(2.846)
Age 31 42.170***
(2.657)
42.067***
(2.676)
42.151***
(2.696)
42.131***
(2.679)
42.474***
(2.736)
42.309***
(2.728)
42.009***
(2.701)
42.437***
(2.821)
Multi-Establishment
at Birth
-2.725*
(1.521)
-2.587
(1.647)
-2.512
(1.610)
-2.638*
(1.533)
-2.743*
(1.585)
-3.413***
(1.378)
-2.715
(1.705)
-3.644***
(1.368)
Productivity
Dispersion
6.967
(11.698)
3.394
(9.916)
R&D Intensity 0.061
(0.313)
0.346
(0.393)
External
Dependence
-1.499
(2.391)
-3.934
(3.684)
Capital Expenditure
Intensity
-5.157
(11.552)
19.135
(17.734)
Industry Emp.
Growth
2.490
(1.760)
0.967
(1.768)
Log Shipping
Distance
-2.687
(1.457)
-3.484
(1.788)
Log Median
Establishment Plant
and Equipment
0.266
(0.552)
0.186
(0.583)
R2
0.377 0.377 0.377 0.377 0.378 0.379 0.377 0.381
Number of Estabs. 1,848 Notes: Standard errors, cluster-adjusted at the four-digit SIC level, are in parentheses. * = significant at 10 percent, ** = significant at 5 percent, and *** = significant at 1 percent. Only establishments in the top
decile of the 2007 productivity distribution that are born in 1976, 1981, 1986, 1991, 1996, or 2001 are included here. Nurture is the difference between an establishment’s 2007 productivity ranking and its
productivity ranking at age one. R&D intensity is direct R&D expenditures divided by production output for 22 manufacturing categories, taken from Loschky (2008). External dependence and capital
expenditures are from Rajan and Zingales (1998), pp. 566-567. They are median values for 36 manufacturing categories using Compustat data for U.S. companies in the 1980’s. Capital Expenditures are the ratio of capital expenditures to net property, plant, and equipment. External dependence is the fraction of capital expenditures not financed with cash flows from operations. Industry employment growth is calculated
using the 1997 and 2007 Censuses of Manufactures. Log shipping distance is the log of the average shipping distance for 21 manufacturing categories from the U.S. Census Bureau and U.S. Department of
Transportation’s 2007 Commodity Flows Survey. The log median establishment plant and equipment is the log of the book value of plant and equipment in 2007 for the median establishment by output in the four-digit SIC industry, using the 2007 Census of Manufactures.

27
Table 8b: Unweighted Nurture Regressions, Starting at Age Ten
Age 15 29.302***
(1.803)
29.528***
(1.828)
29.633***
(1.820)
29.498***
(1.843)
29.528***
(1.830)
29.278***
(1.854)
28.918***
(1.849)
Age 20 32.080***
(1.813)
32.295***
(1.790)
32.299***
(1.778)
32.251***
(1.783)
32.268***
(1.786)
32.292***
(1.794)
31.955***
(1.822)
Age 25 32.975***
(1.796)
33.292***
(1.751)
33.361***
(1.755)
33.216***
(1.766)
33.261***
(1.753)
33.321***
(1.776)
32.841***
(1.823)
Age 30 34.181***
(2.242)
34.453***
(2.191)
34.532***
(2.173)
34.445***
(2.190)
34.444***
(2.182)
34.441***
(2.152)
34.134***
(2.168)
Multi-Establishment
at Birth
-3.085**
(1.581)
-3.428**
(1.520)
-3.383**
(1.471)
-3.552**
(1.485)
-3.465**
(1.496)
-2.463
(1.584)
-2.320
(1.592)
Productivity
Dispersion
-17.016**
(9.077)
-18.913**
(8.823)
R&D Intensity -0.115
(0.361)
0.373
(0.395)
External
Dependence Young
Minus Old
-2.735*
(1.612)
0.635
(2.309)
Capital Expenditure
Intensity Young
Minus Old
-16.971
(11.529)
-21.646**
(10.937)
Log Shipping
Distance
-0.005
(1.200)
-0.722
(1.499)
Log Median
Establishment Plant
and Equipment
-1.759***
(0.645)
-1.997***
(0.702)
R2
0.292 0.290 0.291 0.292 0.290 0.294 0.298
Number of Estabs. 1,408 Notes: Standard errors, cluster-adjusted at the four-digit SIC level, are in parentheses. * = significant at 10 percent, ** = significant at 5 percent, and *** = significant
at 1 percent. Only establishments in the top decile of the 2007 productivity distribution that are born in 1977, 1982, 1987, 1992, or 1997 are included here. Nurture is
the difference between an establishment’s 2007 productivity ranking and its productivity ranking at age 10. R&D intensity is direct R&D expenditures divided by
production output for 22 manufacturing categories, taken from Loschky (2008). External dependence and capital expenditures are from Rajan and Zingales (1998), pp.
566-567. They are median values separately for young and mature firms in 36 manufacturing categories using Compustat data for U.S. companies in the 1980’s.
Capital Expenditures are the ratio of capital expenditures to net property, plant, and equipment. External dependence is the fraction of capital expenditures not
financed with cash flows from operations. Young companies are firms that have been public less than ten years, and mature ones have been public at least ten years.
Log shipping distance is the log of the average shipping distance for 21 manufacturing categories from the U.S. Census Bureau and U.S. Department of
Transportation’s 2007 Commodity Flows Survey. The log median establishment plant and equipment is the log of the book value of plant and equipment in 2007 for
the median establishment by output in the four-digit SIC industry, using the 2007 Census of Manufactures.

28
Table 8c: Employment-Weighted Nurture Regressions, Starting at Age One
Age 6 31.636***
(4.499)
31.313***
(4.504)
31.646***
(4.485)
31.745***
(4.477)
31.600***
(4.472)
32.273***
(4.462)
32.099***
(4.502)
33.327***
(4.543)
Age 11 39.636***
(3.504)
39.543***
(3.491)
39.670***
(3.530)
39.714***
(3.505)
39.628***
(3.485)
39.457***
(3.550)
40.220***
(3.574)
40.024***
(3.670)
Age 16 41.482***
(5.044)
41.370***
(5.147)
41.423***
(5.121)
41.560***
(5.078)
41.239***
(5.097)
41.461***
(5.064)
41.825***
(5.259)
41.809***
(5.290)
Age 21 54.852***
(5.026)
54.480***
(5.232)
54.814***
(5.082)
54.752***
(4.912)
54.700***
(4.847)
53.544***
(4.420)
55.432***
(5.113)
51.236***
(3.951)
Age 26 41.408***
(4.621)
41.101***
(4.618)
41.274***
(4.586)
41.264***
(4.561)
41.215***
(4.606)
41.334***
(4.465)
41.932***
(4.576)
41.615***
(4.447)
Age 31 52.250***
(6.318)
51.169***
(6.218)
52.134***
(6.287)
52.218***
(6.302)
51.999***
(6.231)
52.424***
(6.437)
52.390***
(6.320)
50.327***
(6.370)
Multi-Establishment
at Birth
-5.594**
(2.770)
-6.308**
(2.814)
-5.471*
(2.894)
-5.441**
(2.786)
-5.447**
(2.798)
-5.996**
(2.680)
-4.778*
(2.838)
-6.969***
(2.731)
Productivity
Dispersion
6.422
(21.213)
-13.450
(20.154)
R&D Intensity 0.900*
(0.522)
2.460***
(0.667)
External
Dependence
-0.281
(4.893)
0.090
(8.167)
Capital Expenditure
Intensity
-7.371
(21.365)
-25.528
(43.757)
Industry Emp.
Growth
-1.496
(5.007)
-6.975
(5.426)
Log Shipping
Distance
-4.084
(2.801)
-9.873***
(3.438)
Log Median
Establishment Plant
and Equipment
-1.276
(1.223)
-2.269*
(1.214)
R2
0.294 0.299 0.293 0.294 0.294 0.298 0.295 0.323
Number of Estabs. 1,396 Notes: Standard errors, cluster-adjusted at the four-digit SIC level, are in parentheses. * = significant at 10 percent, ** = significant at 5 percent, and *** = significant at 1 percent. Only establishments in the top
decile of the 2007 productivity distribution that are born in 1976, 1981, 1986, 1991, 1996, or 2001 are included here. Nurture is the difference between an establishment’s 2007 employment-weighted
productivity ranking and its ranking at age 1. The employment weights are measured in 2007. R&D intensity is direct R&D expenditures divided by production output for 22 manufacturing categories, taken
from Loschky (2008). External dependence and capital expenditures are from Rajan and Zingales (1998), pp. 566-567. They are median values for 36 manufacturing categories using Compustat data for U.S. companies in the 1980’s. Capital Expenditures are the ratio of capital expenditures to net property, plant, and equipment. External dependence is the fraction of capital expenditures not financed with cash flows
from operations. Industry employment growth is calculated using the 1997 and 2007 Censuses of Manufactures. Log shipping distance is the log of the average shipping distance for 21 manufacturing categories
from the U.S. Census Bureau and U.S. Department of Transportation’s 2007 Commodity Flows Survey. The log median establishment plant and equipment is the log of the book value of plant and equipment in 2007 for the median establishment by output in the four-digit SIC industry, using the 2007 Census of Manufactures.

29
Table 8d: Employment-Weighted Nurture Regressions, Starting at Age Ten
Age 15 25.825***
(4.291)
26.887***
(4.749)
27.027***
(3.995)
25.713***
(4.229)
25.345***
(4.435)
24.999***
(4.770)
26.071***
(4.467)
Age 20 33.583***
(3.429)
35.493***
(3.711)
34.659***
(3.576)
34.853***
(3.184)
35.060***
(3.665)
34.844***
(3.652)
34.340***
(3.528)
Age 25 30.304***
(6.318)
34.117***
(6.506)
33.378***
(6.468)
33.169***
(6.659)
32.884***
(6.484)
32.779***
(6.680)
31.181***
(6.707)
Age 30 32.136***
(5.517)
32.728***
(5.133)
32.480***
(5.575)
32.627***
(5.533)
32.621***
(5.526)
32.685***
(5.562)
32.349***
(5.503)
Multi-Establishment
at Birth
1.306
(3.871)
0.396
(4.015)
-0.196
(4.048)
-1.045
(3.934)
-1.168
(3.977)
-1.086
(4.319)
1.140
(4.169)
Productivity
Dispersion
-91.322***
(24.801)
-86.831***
(25.794)
R&D Intensity -1.316*
(0.705)
-0.694
(0.987)
External
Dependence Young
Minus Old
-6.217*
(3.822)
5.201
(6.507)
Capital Expenditure
Intensity Young
Minus Old
-27.153
(24.993)
-29.133
(25.068)
Log Shipping
Distance
-4.842
(4.098)
-2.297
(5.065)
Log Median
Establishment Plant
and Equipment
0.288
(2.032)
-0.170
(1.945)
R2
0.245 0.219 0.209 0.207 0.207 0.201 0.254
Number of Estabs. 1,075 Notes: Standard errors, cluster-adjusted at the four-digit SIC level, are in parentheses. * = significant at 10 percent, ** = significant at 5 percent, and *** = significant
at 1 percent. Only establishments in the top decile of the 2007 productivity distribution that are born in 1977, 1982, 1987, 1992, or 1997 are included here. Nurture is
the difference between an establishment’s 2007 employment-weighted productivity ranking and its ranking at age 10. The employment weights are measured in 2007.
R&D intensity is direct R&D expenditures divided by production output for 22 manufacturing categories, taken from Loschky (2008). External dependence and capital
expenditures are from Rajan and Zingales (1998), pp. 566-567. They are median values separately for young and mature firms in 36 manufacturing categories using
Compustat data for U.S. companies in the 1980’s. Capital Expenditures are the ratio of capital expenditures to net property, plant, and equipment. External dependence
is the fraction of capital expenditures not financed with cash flows from operations. Young companies are firms that have been public less than ten years, and mature
ones have been public at least ten years. Log shipping distance is the log of the average shipping distance for 21 manufacturing categories from the U.S. Census
Bureau and U.S. Department of Transportation’s 2007 Commodity Flows Survey. The log median establishment plant and equipment is the log of the book value of
plant and equipment in 2007 for the median establishment by output in the four-digit SIC industry, using the 2007 Census of Manufactures.

30
Figure 1
Notes: Productivity ranks are measured in 2007. Incumbents are establishments over age 1 in
2007.
.00
2.0
04
.00
6.0
08
.01
.01
2
Ke
rne
l De
nsi
ty
0 20 40 60 80 100Productivity Rank
Incumbents Age 1
Unweighted Productivity Rank Distributionsfor Incumbents vs. Age 1

31
Figure 2
Notes: Productivity ranks are measured in 2007. Incumbents are establishments over age 1 in
2007.
.00
2.0
04
.00
6.0
08
.01
.01
2
Ke
rne
l De
nsi
ty
0 20 40 60 80 100Productivity Rank
Incumbents Age 1
Employment-Weighted Productivity Rank Distributionsfor Incumbents vs. Age 1

32
Figure 3
Notes: Leaders are establishments in the top employment-weighted decile of productivity in
their four-digit SIC industry in 2007. Non-leaders are manufacturing establishments in the
other deciles of the productivity distribution in 2007. Establishment birth can be observed
annually in the Longitudinal Business Database (LBD) starting in 1976. If an establishment
appears in the 1963 Census of Manufactures, we assign it age 44; if it appears for the first
time in the 1967 Census of Manufactures, we assign it age 40; if it appears for the first time
in the 1972 Census of Manufactures, we assign it age 35; and if it does not appear in the
1963, 1967, or 1972 CMs and does not containing a birth year in the LBD (ones born before
1976), we assign it age 32.

33
Figure 4
Notes: These are kernel densities using Epanechnikov weights. Leaders are establishments
in the top employment-weighted decile of productivity in their four-digit SIC industry in
2007. Non-leaders are manufacturing establishments in the other deciles of the productivity
distribution in 2007. Establishment birth can be observed annually in the Longitudinal
Business Database (LBD) starting in 1976. If an establishment appears in the 1963 Census
of Manufactures, we assign it age 44; if it appears for the first time in the 1967 Census of
Manufactures, we assign it age 40; if it appears for the first time in the 1972 Census of
Manufactures, we assign it age 35; and if it does not appear in the 1963, 1967, or 1972 CMs
and does not containing a birth year in the LBD (ones born before 1976), we assign it age
32.
34
Figure 5
Notes: Leaders are establishments in the top decile of productivity in their four-digit SIC
industry in 2007. Nurture is the difference between an establishment’s 2007 productivity ranking
and its productivity ranking at age 1. Only leaders born in 1976, 1981, 1986, 1991, 1996, 2001,
and 2006 are included here.
0
5
10
15
20
25
30
35
40
< 0 0 0.1 -10
10.1 -20
20.1 -30
30.1 -40
40.1 -50
50.1 -60
60.1 -70
70.1 -80
80.1 -90
90.1 -100
Pe
rce
nt
of
Lead
ers
Nurture
Unweighted Nurture Distribution

35
Figure 6
Notes: Leaders are establishments in the top employment-weighted decile of productivity in their
four-digit SIC industry in 2007. Nurture is the difference between an establishment’s 2007
employment-weighted productivity ranking and its ranking at age 1. Only leaders born in 1976,
1981, 1986, 1991, 1996, 2001, and 2006 are included here.
0
5
10
15
20
25
30
35
< 0 0 0.1 -10
10.1 -20
20.1 -30
30.1 -40
40.1 -50
50.1 -60
60.1 -70
70.1 -80
80.1 -90
90.1 -100
Pe
rce
nt
of
Lead
ers
Nurture
Employment-Weighted Nurture Distribution